Article

Effects of Saline Water Irrigation on Soil Respiration and Carbon Balance in the Winter Wheat–Summer Maize Rotation System in the North China Plain


1
Shandong Key Laboratory of Agricultural Water-Saving Technology and Equipment, College of Water Conservancy and Civil Engineering, Shandong Agricultural University, Taian 271018, China
2
Key Laboratory of Crop Drought Resistance Research of Hebei Province, Institute of Dryland Farming, Hebei Academy of Agriculture and Forestry Sciences, Hengshui 053000, China
3
Department of Soil Science, Institute of Soil and Water Resources, Faculty of Agriculture and Environment, The Islamia University of Bahawalpur, Bahawalpur 63100, Pakistan
*
Author to whom correspondence should be addressed.
These authors contributed equally to this work.
Agronomy 2026, 16(17), 1720; https://doi.org/10.3390/agronomy16171720
Submission received: 28 June 2026 / Revised: 7 August 2026 / Accepted: 14 August 2026 / Published: 4 September 2026
(This article belongs to the Section Water Use and Irrigation)

Abstract

Saline water irrigation is a potential strategy to address agricultural water scarcity, but its effects on soil respiration and carbon balance are not well understood. To clarify these effects and promote the safe utilization of saline water resources, this study investigated five irrigation water salinity levels ECiw: 1.3, 3.4, 7.1, 10.6, and 14.1 dS·m−1 (i.e., 1, 2, 4, 6, 8 PSU; 1000, 2000, 4000, 6000, 8000 mg·L−1) in a winter wheat–summer maize rotation during 2024–2025. The results indicated that saline water irrigation caused salt accumulation during the wheat season, whereas salt leaching occurred during the maize season. When ECiw ≤ 3.4 dS·m−1, no notable decreases were observed in dry matter accumulation, water productivity, and carbon emission efficiency for both crops. In contrast, when ECiw > 3.4 dS·m−1, the crop yields and net carbon input of the crop rotation system were suppressed to a considerable extent. Furthermore, under saline water irrigation, the average soil respiration rate decreased by 4.1–25.2% during the wheat growing season, while that for maize decreased by 7.4–30.7%. Soil respiration in wheat was negatively correlated with soil salinity and pH, and positively correlated with soil moisture (p < 0.01). In maize, soil respiration was negatively correlated with salinity (p < 0.01), and positively correlated with soil moisture (p < 0.05) and temperature (p < 0.01). The entropy-weighted TOPSIS model identified 3.4 dS·m−1 as the appropriate irrigation salinity threshold for maintaining yield and carbon sink function in this rotation system.

1. Introduction

Agriculture remains the predominant water-consuming sector globally, with over 70% of the world’s freshwater resources allocated to irrigation [1]. Since 2015, the global food crisis has escalated significantly [2], prompting a substantial increase in agricultural production aimed at alleviating hunger and malnutrition [3]. This expansion has led to a marked rise in agricultural water demand. Nevertheless, data from the World Resources Institute (WRI) reveal that at least 50% of the global population—equivalent to approximately 4 billion people—faces critical water shortages for at least one month annually [4], resulting in pronounced regional disparities in irrigation water allocation. In response, the use of alternative water resources, such as saline water (with salinity levels of 0.7–2.0 dS·m−1 for slightly saline, 2.0–10.0 dS·m−1 for moderately saline, and 10.0–25.0 dS·m−1 for highly saline) [5], offers a promising strategy for the relief of agricultural water stress and maintenance of production stability [6]. As one of China’s major grain-producing regions—responsible for over 70% of the nation’s wheat output and more than 30% of its maize production [7]—the North China Plain (NCP) also faces pronounced challenges due to freshwater scarcity [8]. Notably, the region possesses substantial reserves of shallow saline groundwater (2–5 g·L−1, ~3.4–8.7 dS·m−1), with an estimated total volume of 5.4 × 10⁹ m3 [9], indicating considerable potential for future development. Therefore, the scientifically sound application of saline water resources in irrigation holds great strategic importance for mitigating water resource pressures and ensuring food security.
However, while saline water irrigation can replenish soil moisture, it also introduces salts into the soil profile. This process alters the spatial distribution of soil moisture and salinity, regulates soil physicochemical properties, and consequently affects crop growth and yield formation [10]. Zhang et al. [11] demonstrated that excessive accumulation of soil salts restricts crop growth by reducing soil water availability. Liu and Ge [12] reported that an irrigation water salinity of 3.2 dS·m−1 (salinity type: fresh water mixed with inorganic salts) did not cause significant changes in maize yield or water productivity. Liu et al. [13] observed that as irrigation salinity increased, both soil moisture and salt content rose. For winter wheat cultivation, they determined that 5.82 dS·m−1 (salinity type: deionized water mixed with chloride salts) serves as the electrical conductivity threshold for saline water irrigation. Exceeding this threshold leads to an 8.8% reduction in the relative yield of winter wheat with every 1 dS·m−1 increment in conductivity. Another study demonstrated that the use of mildly saline water for irrigation may enhance winter wheat yield, but this beneficial impact lessens with increasing irrigation salinity. In winter wheat cultivation, 6.3 dS·m−1 (salinity type: deep groundwater mixed with coarse salt) was determined to be the safe-utilization threshold electrical conductivity for irrigation water [14]. Collectively, saline water irrigation modifies the spatial distribution of soil water and salts, and different crops display distinct responses to saline conditions. Nonetheless, most current research on saline water irrigation has focused on single-season crops, with relatively little attention paid to the long-term effects on annual crop rotation systems. Statistical data indicate that wheat–maize rotation is the predominant cropping system in the NCP [15], and these two staple crops differ markedly in their salt tolerance thresholds. Based on the standards set by the Food and Agriculture Organization (FAO) of the United Nations, the salt tolerance threshold for wheat is 6.0 dS·m−1, whereas maize exhibits a much lower threshold of 1.7 dS·m−1 [16]. Furthermore, soil salt accumulation induced by saline water irrigation exhibits hysteresis, as residual salts from wheat-season irrigation persist into the subsequent maize growing period, thereby subjecting the more salt-sensitive maize to additional salt stress [14]. This process may compromise annual grain productivity and destabilize the water–salt balance. Therefore, identifying the appropriate irrigation water salinity threshold for the winter wheat–summer maize rotation system is essential, taking into account the contrasting salt tolerance characteristics of both crops and the specific regional climatic conditions.
Amidst the intensifying challenge of global warming [17], disruptions to the carbon cycle have emerged as a major driver of accelerated climate change [18]. Farmland ecosystems function dually as both sources and sinks of carbon within this cycle [19]. Among the key processes, soil respiration—recognized as the dominant pathway for carbon emissions from farmland—plays a pivotal role in providing feedback and regulatory effects on the global carbon cycle [20,21]. The dynamics of soil respiration are strongly modulated by environmental factors including soil moisture, temperature, pH, and salinity [22,23]. Nevertheless, considerable debate persists regarding the effects of saline water irrigation on farmland carbon emissions. Some research indicates that saline water irrigation suppresses soil microbial enzyme activities and slows the breakdown of soil organic carbon, resulting in a decline in soil CO2 flux as irrigation water salinity increases [24]. In contrast, other studies have reported that, within certain thresholds, saline water irrigation can intensify soil salinity stress, reduce crop yields, and concurrently elevate farmland CO2 emissions by modifying soil moisture regimes [25]. At present, how saline water irrigation affects farmland soil respiration remains poorly understood, and the regulatory mechanisms underlying annual carbon emissions under varying salinity levels in wheat–maize rotation systems are yet to be clarified. Thus, systematically investigating the response patterns of soil respiration and carbon balance under saline water irrigation is of substantial practical significance for informing scientific irrigation strategies aimed at emission reduction, water conservation, and stable crop yields.
Accordingly, this research examined how saline water irrigation with varying salinity concentrations influences grain yield, water productivity, soil respiration rate, and carbon balance within a winter wheat–summer maize rotation system in the NCP, using a field-based experiment. The main aims of this study were: (1) to clarify the response characteristics of grain yield and water productivity in the rotation system under saline water irrigation; (2) to assess the impacts of irrigation water salinity on surface soil temperature, moisture, salinity, and pH, as well as soil respiration rate, carbon emission efficiency, and carbon balance; and (3) to identify the salinity threshold of irrigation water required to maintain annual grain yield stability and preserve the carbon sink capacity of the winter wheat–summer maize rotation system. This research aims to strengthen the scientific foundation for secure and low-carbon use of saline water within the winter wheat–summer maize rotation system of the NCP, providing scientific evidence and technical reference for achieving regional goals in agricultural water conservation, yield stability, and carbon emission reduction.

2. Materials and Methods

2.1. Overview of the Study Site

The field trial took place during 2024 to 2025 at the Dryland Water-Saving Agriculture Experimental Station in Hengshui City, Hebei Province, China (37°44′ N, 115°47′ E). This area exhibits a temperate continental climate, with a yearly average temperature of 12.8 °C and mean precipitation of 500 mm. At the outset of the experiment, the soil organic matter in the 0–0.2 m layer was 12.8 g·kg−1, while alkali-hydrolyzable nitrogen, available phosphorus, and available potassium contents measured were 65.5, 17.6, and 134 mg·kg−1, respectively. In the 0–1 m layer, the soil bulk density, mean soil salinity (the electrical conductivity of the saturated paste extract, ECe), and field capacity were 1.44 g·cm−3, 2.34 dS·m−1, and 28%, respectively. During the 2024–2025 growing season, cumulative precipitation was 102.0 mm for winter wheat and 339.9 mm for summer maize. According to the hydrological year classification criteria of the World Meteorological Organization (WMO) [26] and an analysis of precipitation data from the past 50 years (Figure S1), 2024–2025 can be classified as a normal hydrological year. Figure 1 presents the daily precipitation and average daily temperatures during the growth periods of winter wheat and summer maize in 2024–2025. At the experimental site, the groundwater table is deeper than 5 m, with a mineralization of 2.2 g·L−1 (~3.7 dS·m−1). Due to the flat topography of the experimental field and the absence of an installed drainage system, precipitation and irrigation during the experimental period primarily infiltrated into the soil, with negligible surface runoff or drainage.
The aquifers in the study area exhibit distinct vertical stratification. Group I, formed under fluvial and marsh depression conditions, mainly contains silt and fine sand as its water-bearing media, with the base located at 50–80 m. Group II is dominated by medium-to fine-grained sand, deposited through fluvial, alluvial, and colluvial mud–sand processes, and extends to depths of 150–240 m. Group III features extensive medium-to coarse-grained sand aquifers associated with alluvial and fluvial–alluvial sedimentation, with basal depths of 350–450 m. In Group IV, alternating sand and silt layers, resulting from successive fluvial and lacustrine sedimentation, are present, with fine sand serving as the principal water-bearing component and the lower boundary reaching 450–640 m [27].

2.2. Experimental Design

This study was conducted using a long-term fixed-site field experiment on saline water irrigation that was initiated in 2006. Given that the salinity of shallow saline groundwater in the experimental area primarily ranges from 2 to 10 g·L−1 (~3.4–17.7 dS·m−1) [28,29], five irrigation water salinity levels were established: 1.3, 3.4, 7.1, 10.6, and 14.1 dS·m−1, corresponding to 1, 2, 4, 6, and 8 PSU and 1000, 2000, 4000, 6000, and 8000 mg·L−1. The treatments were designated as CK, T1, T2, T3, and T4, respectively. In this study, irrigation water salinity was consistently expressed in the internationally recognized unit of dS·m−1. Among the treatments, deep groundwater with a salinity of 1.3 dS·m−1 was used as the control. Due to the fact that the shallow saline groundwater in the study area is mainly formed by continental alkalization and seawater intrusion, and is composed primarily of Na+ and Cl [30], in this experiment, except for the control treatment, irrigation water for all other gradients was prepared by mixing deep groundwater with sea salt. The sea salt was purchased from Haixing Xingjian Salt Industry Co., Ltd. (Cangzhou, Hebei, China). Irrigation water with different salinity gradients was delivered to each plot using pumps and pipelines. The ionic compositions for all treatments have been reported previously [31]. The experiment used a randomized block design with three replicates per treatment, resulting in a total of 15 plots, each measuring 57 m2. The cultivars selected for winter wheat and summer maize were ‘Hengmai 4399’ and ‘Zhengdan 958’, respectively. Irrigation was implemented using border irrigation, with an irrigation amount of 60 mm. For winter wheat, irrigation was applied 2–3 times across three key growth stages: pre-sowing, jointing, and flowering. Pre-sowing irrigation was omitted when soil water content in the 0–0.2 m layer exceeded 70% of field capacity. For summer maize, one irrigation event was applied after sowing to ensure seedling emergence; no supplemental irrigation was performed if this layer held soil water above 70% of field capacity at sowing. Since soil moisture was sufficient prior to winter wheat sowing in the 2024–2025 growing season, pre-sowing irrigation was not performed. Irrigation was applied only once during jointing and once during heading and flowering, totaling 120 mm. Summer maize was irrigated once at sowing, with an irrigation amount of 60 mm. The specific irrigation timings are presented in Figure 1. During the sowing of winter wheat, total nitrogen (N), phosphorus (P2O5), and potassium (K2O) were applied as basal fertilizers at rates of 90, 138, and 60 kg·ha−1, respectively. At the jointing stage of winter wheat, nitrogen was applied as topdressing at 172.5 kg·ha−1. For summer maize, basal fertilizers were applied at sowing, with application rates of 150, 48, and 72 kg·ha−1 for N, P2O5, and K2O, respectively. The field cultivation system adopts an annual double-cropping rotation of winter wheat and summer maize. After the summer maize harvest, the field is rotary-tilled, rolled, and leveled before sowing winter wheat. In contrast, following the winter wheat harvest, the field remains untilled, and summer maize is sown using no-till direct seeding. During the crop growing season, weed, disease, and pest control measures were implemented in stages. Specifically, for winter wheat, post-emergence weed control was performed 20 days after emergence, and pest control was conducted before heading and flowering. For summer maize, weed control was carried out 20 days after emergence, and pest control was implemented during the small whorl stage.

2.3. Measurement Indicators and Methods

2.3.1. Soil Moisture and Salinity

During key growth stages (sowing, jointing, grain-filling, and maturity) of winter wheat and summer maize, soil samples were taken from each plot with a soil auger to a depth of 1 m. Samples were transferred in aluminum containers and plastic bags, respectively. The samples in aluminum containers were weighed in the laboratory to determine wet weight, then dried in an oven at 105 °C to a constant mass, after which dry mass was documented for soil moisture content calculation. Samples in plastic bags were air-dried, cleared of debris, ground, and sieved through a 2 mm sieve. A soil–water suspension with a 1:5 ratio was created, and EC1:5 was determined using a DDS-307A conductivity analyzer (Shanghai Precision & Scientific Instrument Co., Ltd., Shanghai, China). For consistency, EC1:5 values were converted to ECe using the established formula [32]:
E C e   =   9.367 E C 1 : 5   0.001 R 2   =   0.990

2.3.2. Dry Matter Accumulation, Yield, Crop Water Consumption, and Water Productivity

(1)
Dry Matter Accumulation
At the winter wheat harvest, ten representative plants were sampled from each experimental plot, whereas at the summer maize harvest, three representative plants were collected from each plot. These samples were used to determine the total dry matter of aboveground and root biomass. The plant samples were initially oven-dried at 105 °C for 30 min, and subsequently dried at 75 °C to a constant mass. The final dry weight was determined with an electronic balance.
(2)
Grain Yield
Before the winter wheat harvest, three sampling points were selected per plot to determine ear density per unit area. A 3 m2 area was harvested in each experimental plot for yield measurement, with results converted to unit area yield.
During the summer maize harvest, ear density per unit area was recorded. Forty maize spikes of each plot were sampled, air-dried under natural conditions, threshed, and weighed to determine total grain weight and thousand-kernel weight, subsequently converted to grain yield.
(3)
Crop Water Consumption
The crop water consumption (CWC, mm) during the growth period of winter wheat and summer maize was estimated using the following formula [33]:
C W C =   P   +   I   +   U Δ S D R
where CWC denotes crop water consumption over the crop growth cycle (mm); P refers to precipitation during the cropping period (mm); I is the irrigation volume applied throughout the cropping period (mm); U represents groundwater recharge (mm); D represents deep percolation from the crop root zone (mm); R indicates surface runoff (mm); and ΔS signifies the variation in soil water storage within the 0–1 m soil layer during the crop growth period (mm). Given that the groundwater table at the study site is deeper than 5 m, and the terrain is flat with field ridges, both groundwater recharge and surface runoff were considered negligible. The deep percolation volume is estimated following the method described by Ertek et al. [34].
(4)
Water Productivity
Water productivity (WP, kg·m−3) is calculated using the following formula [35]:
W P = Y C W C
where Y represents the grain yield (kg·ha−1), and CWC denotes crop water consumption during the crop growth period (m3·ha−1). For reference, 1 mm of water applied over 1 ha is equivalent to 10 m3·ha−1.

2.3.3. Soil Respiration Rate and Carbon Emission

(1)
Determination of Surface Soil Moisture, Temperature, Salinity and pH
During soil respiration rate measurements, the temperature, moisture, salinity, and pH of the 0–0.1 m surface soil layer were also assessed. Surface soil temperature and moisture were determined using an LI-8100A infrared gas analyzer (LI-8100A; Li-Cor, Lincoln, NE, USA) equipped with a 6000–09TC probe and a GS-1 sensor. The electrical conductivity (EC1:5) and pH of surface soil were measured using a DDS-307A conductivity analyzer (Shanghai Precision & Scientific Instrument Co., Ltd., Shanghai, China) and a pH meter (Shanghai Precision & Scientific Instrument Co., Ltd., Shanghai, China).
(2)
Soil Respiration Rate
To track soil respiration rate dynamics throughout the growing seasons of winter wheat and summer maize, PVC soil rings were installed in each plot at sowing for both crops. Each ring measured 0.2 m in internal diameter and 0.1 m in height, with 0.05 m protruding above the soil surface. Soil respiration rate was determined using a portable infrared gas analyzer (LI-8100A; Li-Cor, Lincoln, NE, USA) [36]. Measurements took place weekly between 9:00 and 11:00 a.m., with additional monitoring for 2–3 consecutive days following rainfall or irrigation events.
(3)
Cumulative Carbon Emissions
Cumulative carbon emissions (CE, kg C·ha−1) were calculated by applying the trapezoidal rule to integrate soil respiration rate (Rs) over time:
C E = i = 1 n [ ( R s i + 1 + R s i ) × 1 2 × ( t i + 1 t i ) × 0.1584 ] × 12 44 × 24 × 10
where Rsi represents the soil respiration rate (Rs) at time ti, i indicates the sampling frequency, and t denotes the sampling time. A factor of 0.1584 was used to convert μmol·m−2·s−1 into g CO2·m−2·h−1. The ratio 12/44 was applied to convert g CO2·m−2·h−1 to g C·m−2·h−1. Subsequently, a factor of 10 was employed to convert g C·m−2 into kg C·ha−1 [37,38].

2.3.4. Carbon Emission Efficiency and Carbon Balance

(1)
Net Carbon Input
The net carbon input (NEP, kg C·ha−1) represents the carbon balance of the ecosystem and is determined by subtracting heterotrophic respiration (Rm) from net primary productivity (NPP). An NEP greater than zero signifies a carbon sink (absorbing atmospheric CO2), whereas a negative NEP represents a carbon source (releasing CO2). This is calculated using the following formula:
NEP   =   NPP Rm
In the equation, NPP denotes net primary carbon productivity (kg C·ha−1), which is estimated as 45% of the total aboveground and root biomass for winter wheat and summer maize [39]. Based on earlier research, cumulative carbon emissions from soil respiration during the crop growing season are represented as CE, and carbon released from soil microbial heterotrophic respiration is calculated as Rm = CE × 0.865 [40].
(2)
Carbon Emission Efficiency
Carbon emission efficiency (CEE, kg·kg−1) is defined as the amount of grain yield generated for each kilogram of soil-derived carbon emitted throughout the crop growth period. The calculation formula is shown below [37]:
C E E = Y C E
where Y represents the grain yield (kg·ha−1); CE denotes the cumulative amount of soil carbon emissions (kg C·ha−1).
(3)
Carbon Emissions Per Unit Water Consumption
The calculation formula for carbon emissions per unit water consumption (WPCE, kg·m−3) is [37]:
W P C E = C E C W C
where CE represents the cumulative amount of soil carbon emissions (kg C·ha−1), and CWC represents crop water consumption during the crop growth period (m3·ha−1). For reference, 1 mm of water applied over 1 ha is equivalent to 10 m3·ha−1.

2.3.5. Entropy-Weighted TOPSIS Model

This study employed the entropy-weighted TOPSIS method. By utilizing information entropy theory, this approach objectively determines the weights of each evaluation criterion, thereby minimizing bias that may arise from subjective weighting [41] and enabling systematic evaluation of multidimensional indicators. In practice, the model identifies positive and negative ideal solutions and calculates a relative closeness coefficient (Ci) for each sample, enabling quantitative ranking and classification of treatments. Higher Ci values (approaching 1) indicate superior overall performance and greater proximity to the optimal solution, while lower values (near 0) correspond to poorer overall performance [42]. Notably, this method is adaptable to varying sample sizes and data distributions. The calculated closeness coefficients provide a clear, quantitative basis for assessing the overall effectiveness of different alternatives [43]. However, inherent limitations exist in this evaluation approach. When applied to long-term datasets with limited sample sizes, outlier years may disproportionately influence indicator weights, potentially leading to systematic bias and reducing the reliability of comprehensive results [44].
In this study, the entropy-weighted TOPSIS model was applied to calculate Ci and assess the multi-indicator responses of the winter wheat–summer maize rotation system under irrigation regimes with varying salinity levels. The evaluation system comprised seven indices: soil moisture and salinity in the 0–1 m soil layer, grain yield, water productivity, carbon emission efficiency, carbon emissions per unit water consumption, and net carbon input. Within this framework, a higher Ci value reflects superior overall performance of the corresponding irrigation treatment, indicating that irrigation with saline water at this salinity level can effectively maintain the stability of the soil water–salt environment, production efficiency, and carbon balance in a winter wheat–summer maize rotation system. In contrast, a lower Ci value suggests that the irrigation scheme is less effective at balancing soil and water security, production efficiency, and low-carbon objectives, leading to reduced overall system performance.
Considering the model’s inherent limitations, this study was designed to utilize single-year field observations rather than multi-year time series. This strategy helps to mitigate evaluation bias that could otherwise arise from these methodological constraints. The detailed calculation steps are provided below [45]:
(1)
Construct the original decision matrix Xij:
Where Xij represents the value of the j-th indicator for the i-th sample. In this experiment, i ranges from 1 to 5 (n = 5), and j ranges from 1 to 7 (m = 7).
(2)
Normalize and standardize the data:
For benefit-type criteria (larger values are preferred):
Z ij   =   X ij X m i n ( j ) X m a x ( j )   X m i n ( j )
For cost-type criteria (smaller values are preferred):
Z ij   =   X m a x ( j ) X ij X m a x ( j )   X m i n ( j )
where Xij denotes the original value of the j-th indicator for the i-th treatment in the decision matrix, while Xmax(j) and Xmin(j) correspond to the highest and lowest values of the j-th indicator across all treatments, respectively.
(3)
Calculate the proportion Pij:
P ij = Z ij i = 1 n Z ij
where Zij denotes the standardized and normalized value of the j-th indicator for the i-th treatment in the original matrix.
(4)
Calculate the entropy value Ej:
E j = K i = 1 n ( P ij ln ( P ij ) )
in this equation, K = 1/ln(n) serves as the entropy constant, with n = 5 indicating the total number of treatments.
(5)
The variation coefficient Gj corresponding to the j-th indicator was computed as follows:
G j   = 1 E j
(6)
The weight coefficient Wj for the j-th indicator was calculated as follows:
W j = G j j = 1 m G j
(7)
Determine the positive and negative ideal solutions (R):
R + = max ( R i 1 , R i 2 , , R i m )
R = min ( R i 1 , R i 2 , , R i m )
where R = WiZij. The positive and negative ideal solutions derived for each metric serve as the benchmarks for subsequent evaluation. Metrics with values nearer to the positive ideal solution indicate superior performance, whereas metrics closer to the negative ideal solution reflect poorer performance.
(8)
The Euclidean distance of each evaluation object from the positive ideal solution D i + and the negative ideal solution D i was computed as follows:
D i + = j = 1 m ( R i j R j + ) 2
D i = j = 1 m ( R i j R j ) 2
(9)
The relative closeness coefficient of each evaluation object to the positive ideal solution was determined as follows:
C i = D i D i + + D i

2.4. Statistical Analysis

All statistical analyses were performed with SPSS Statistics 27.0 (IBM Corp., Armonk, NY, USA) and Microsoft Excel 2019 (Microsoft Corporation, Redmond, WA, USA). One-way ANOVA was used to evaluate differences among irrigation water salinity treatments, followed by Duncan’s test (α = 0.05) for post-hoc comparisons. Linear regression fitting and graphical visualizations were implemented in Origin 2024 (Origin Lab., Hamptons, MA, USA).

3. Results

3.1. Effects of Saline Water Irrigation on Soil Moisture and Salinity

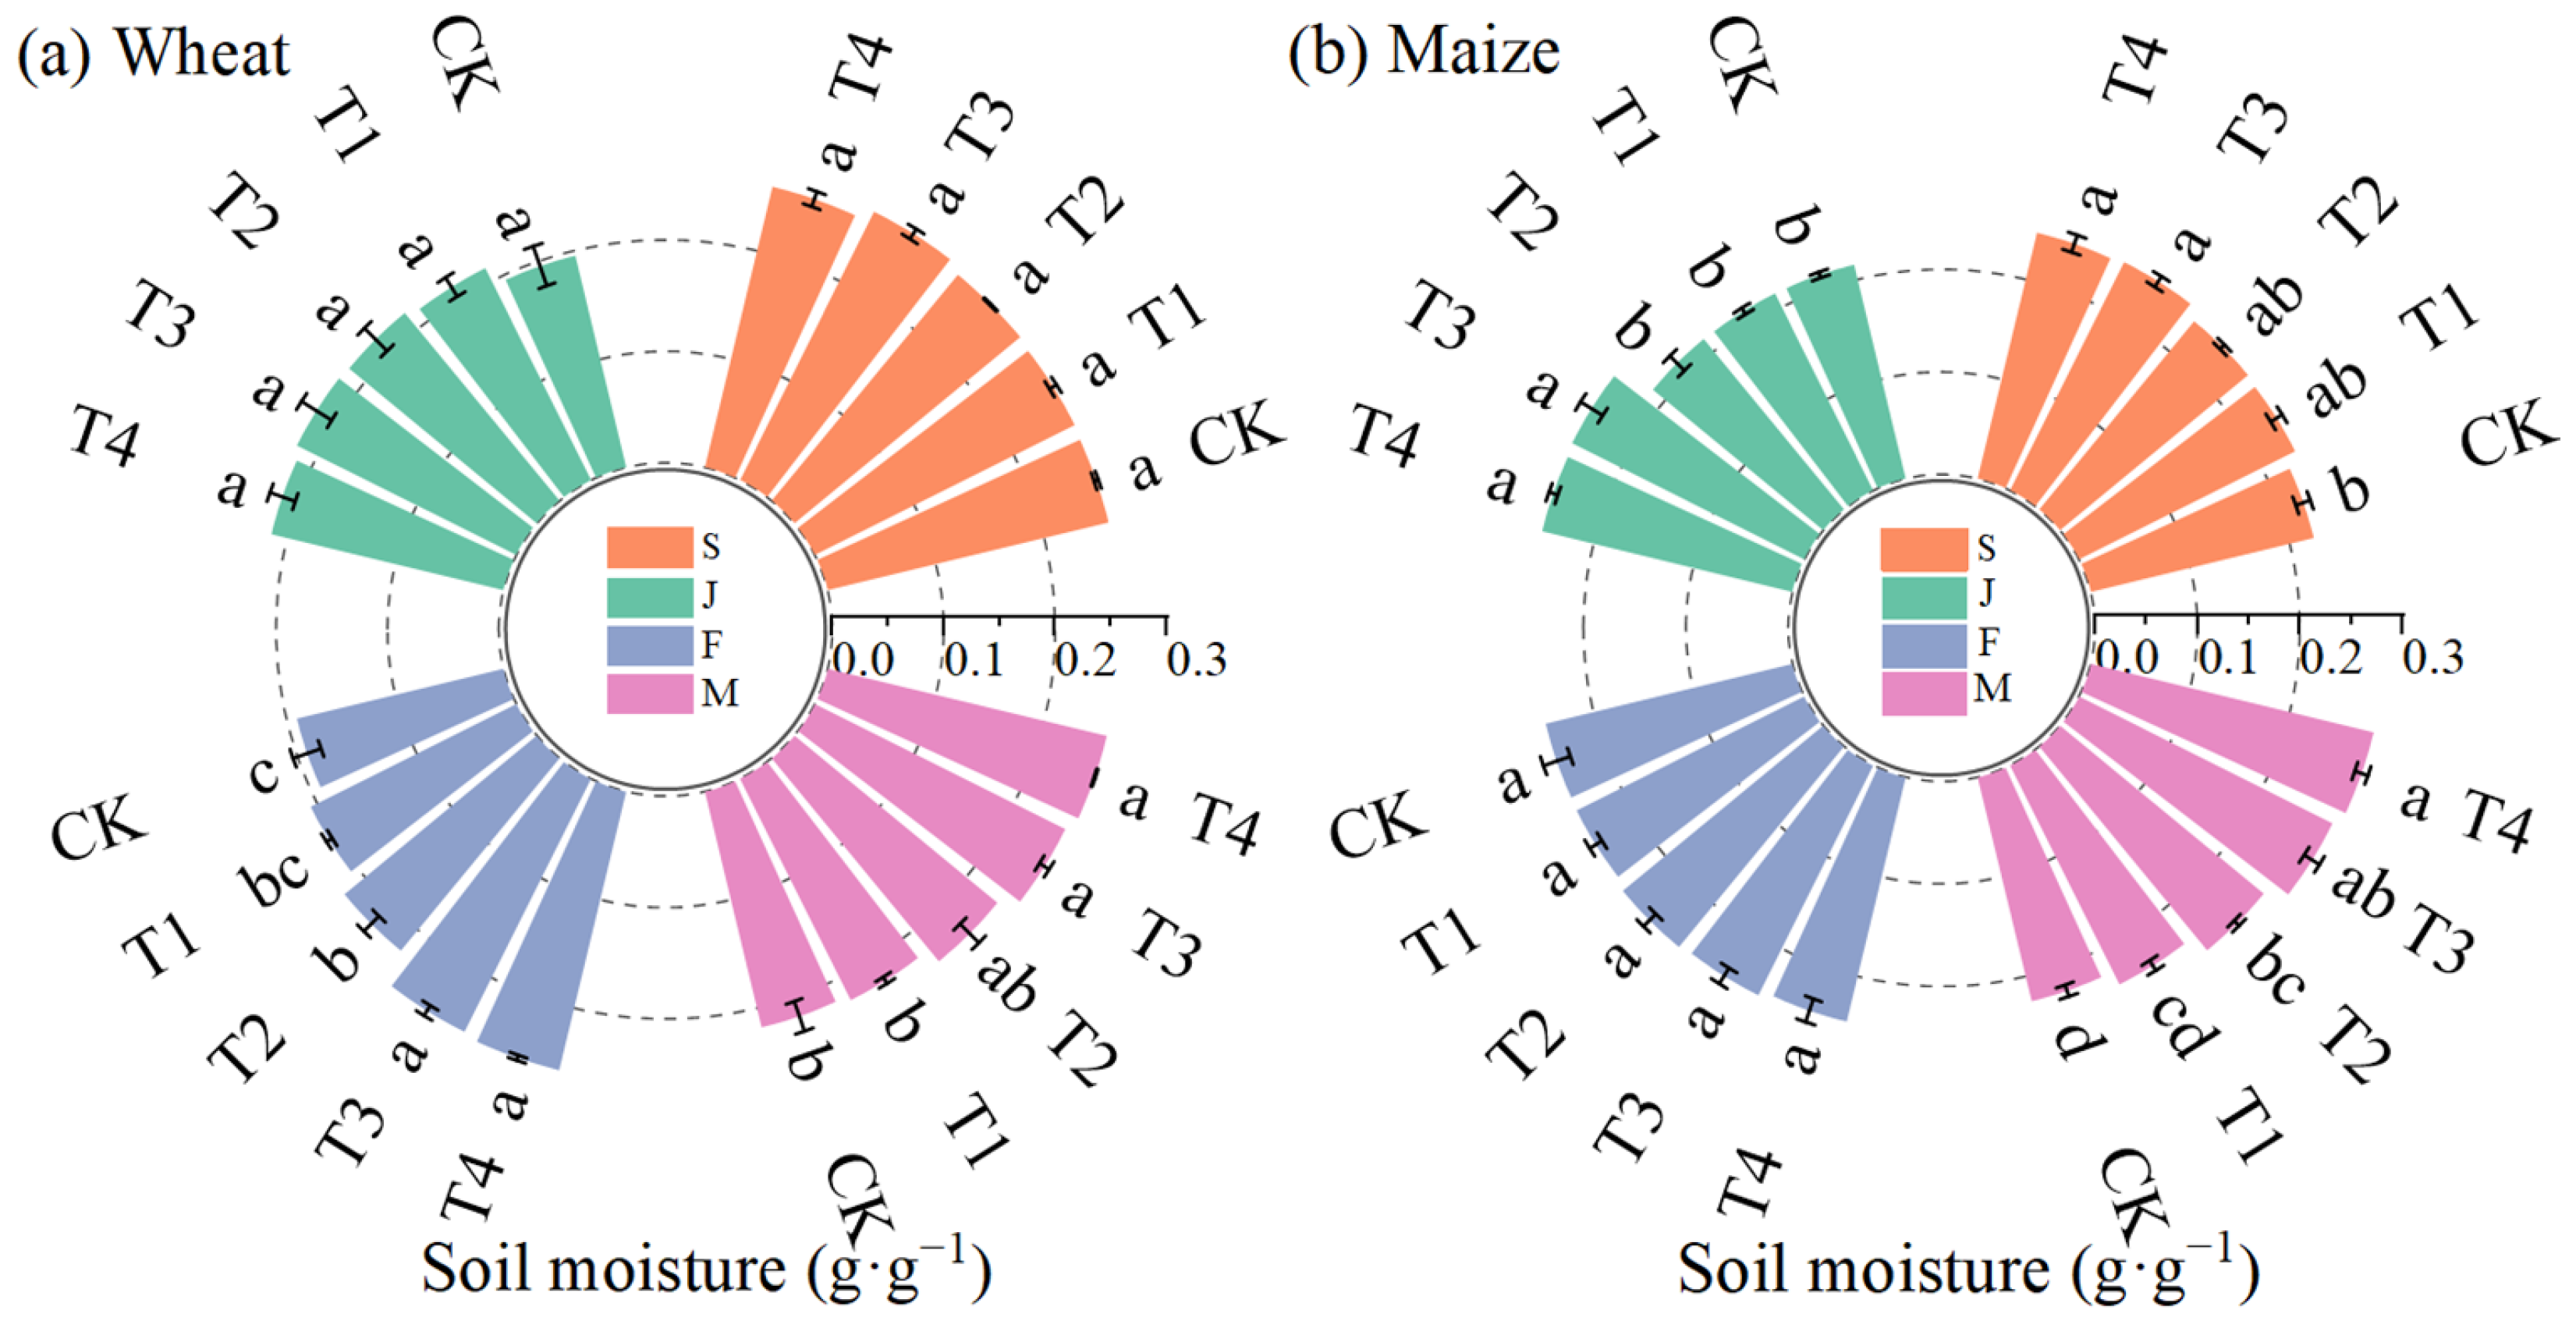
The effects of different irrigation water salinity treatments on average soil moisture (SM) in the 0–1 m layer at key crop growth stages are shown in Figure 2. At the same growth stage, SM tended to increase with higher irrigation water salinity. For instance, during the wheat grain-filling stage, SM in the T1, T2, T3, and T4 treatments increased by 8.2%, 17.3%, 33.1%, and 34.8%, respectively, compared to CK, with significant differences observed for T2–T4. Similarly, at the maize jointing stage, the T1–T4 treatments resulted in SM increases of 0.1%, 0.5%, 17.2%, and 18.2%, respectively, with T3 and T4 showing significant differences relative to CK. Across different growing seasons, SM in all treatments exhibited a declining trend during the wheat season but an upward trend during the maize season. Specifically, compared with the wheat sowing period, SM in CK, T1, T2, T3, and T4 declined by 16.2%, 14.8%, 10.1%, 6.7%, and 0.3%, respectively, at wheat maturity. In contrast, compared with the maize sowing period, SM in the CK–T4 treatments increased by 0.6%, 1.4%, 8.4%, 11.5%, and 15.5%, respectively, at maize harvest.
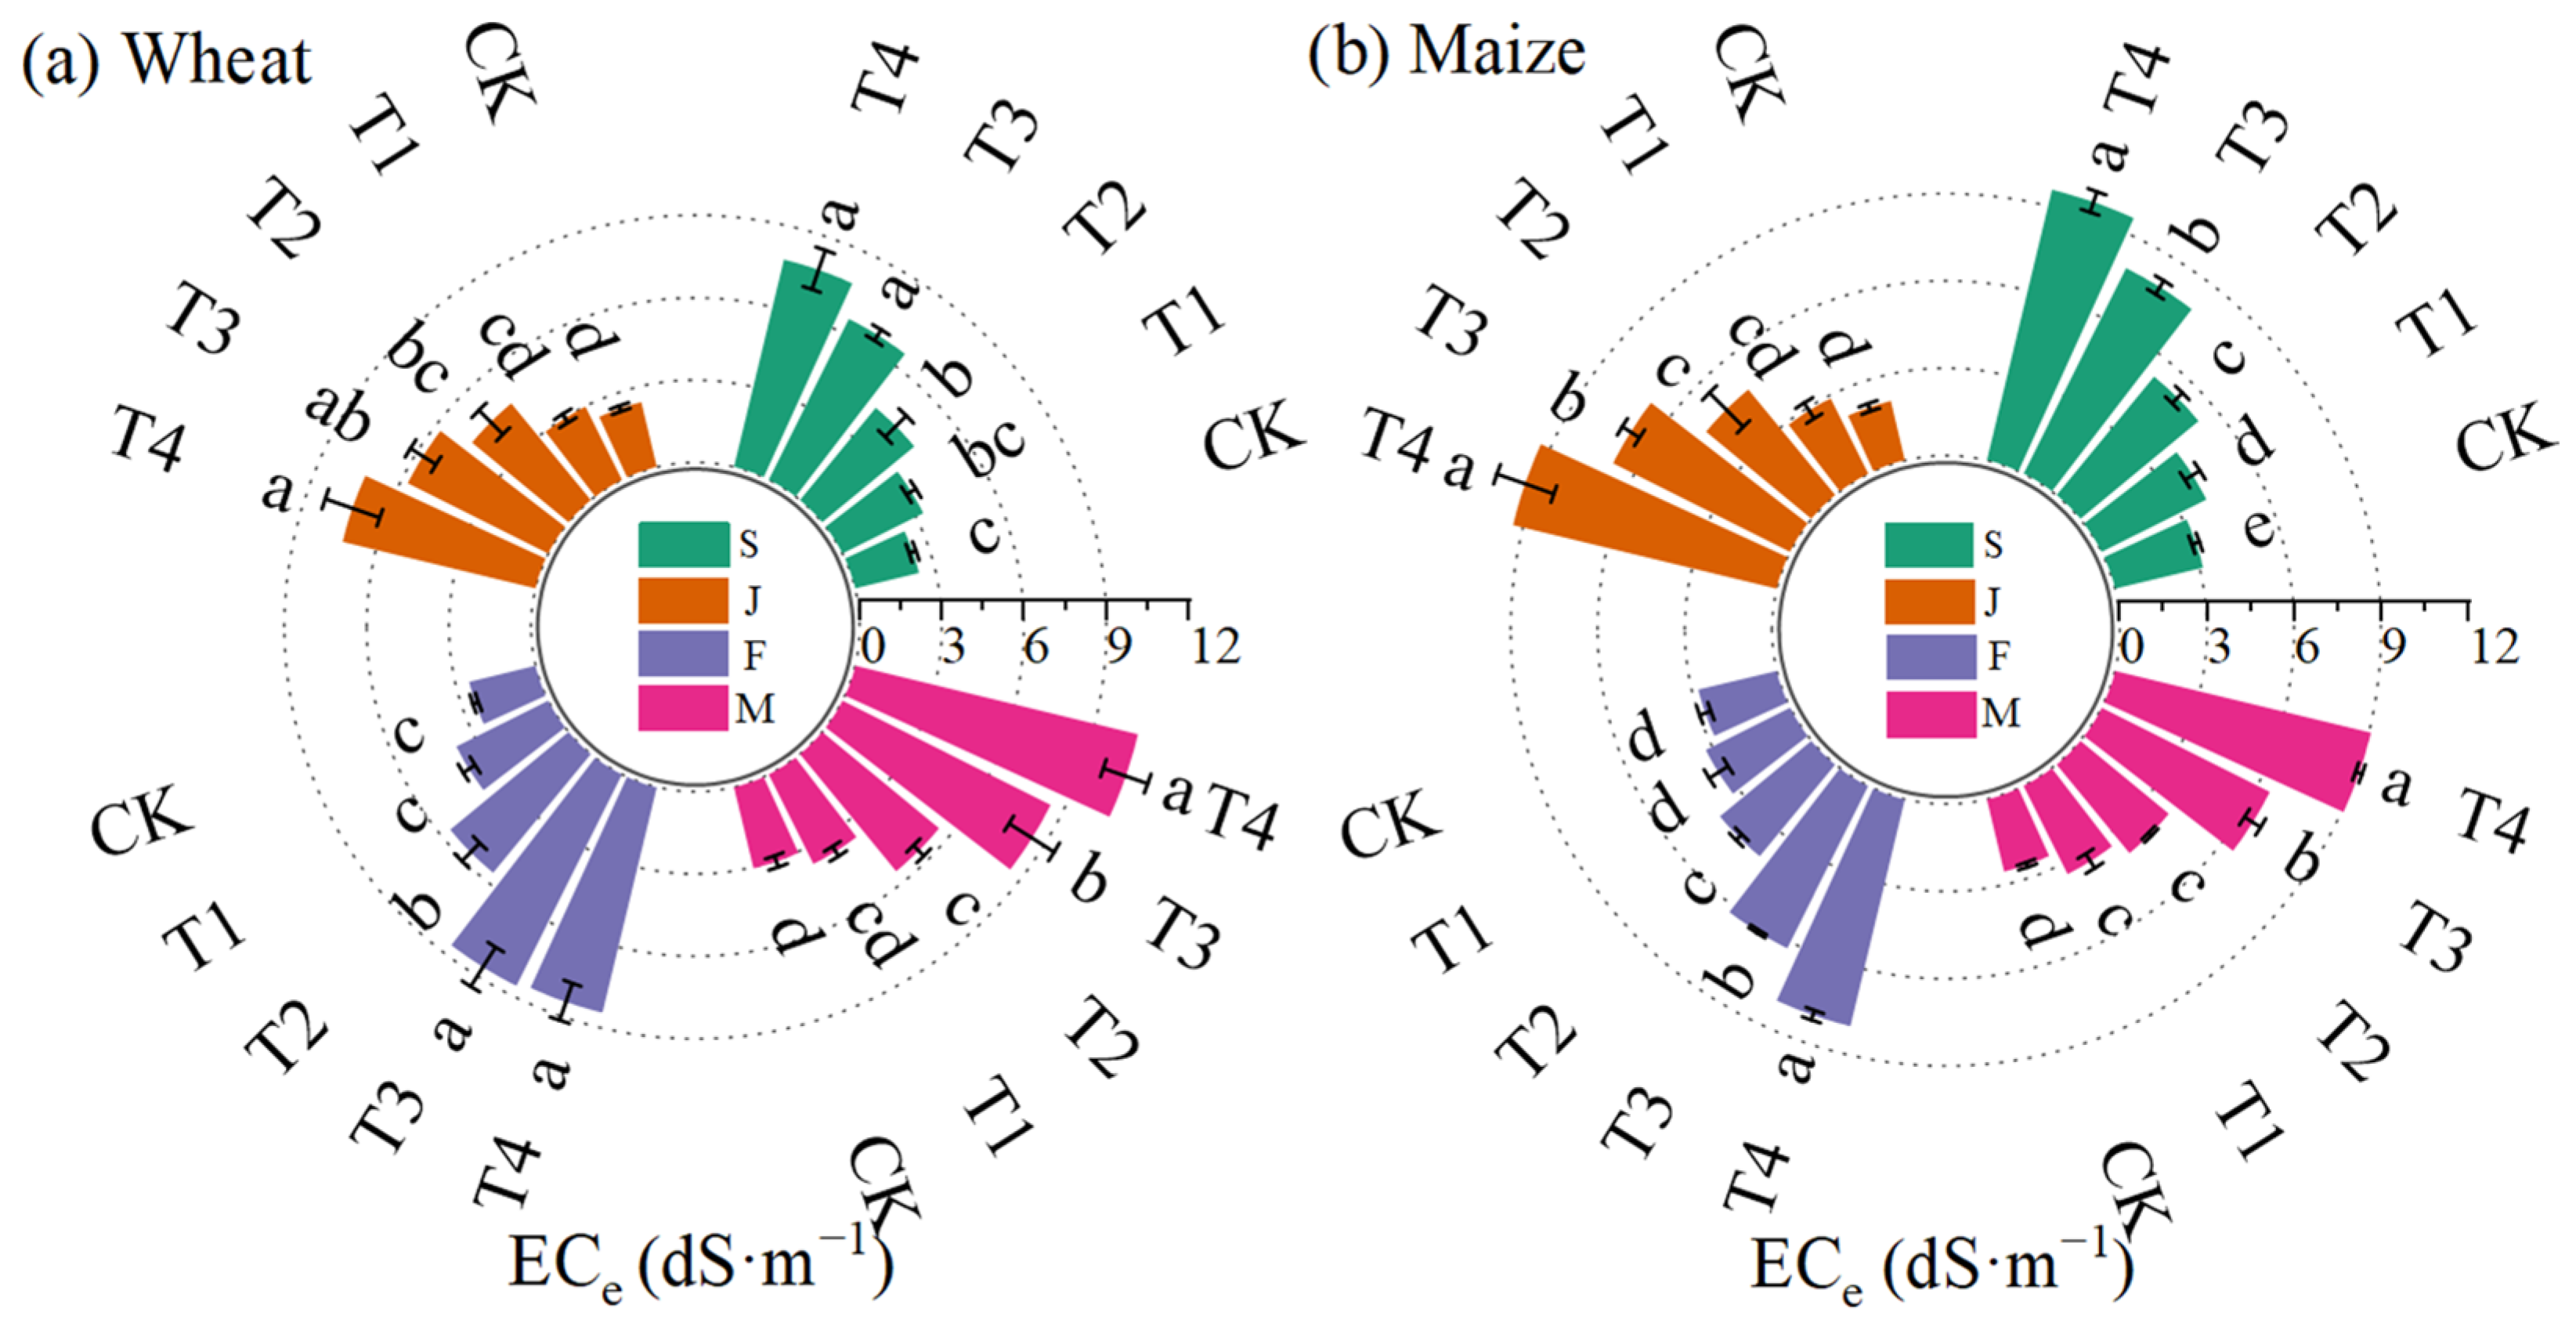
Figure 3 illustrates the significant effects of irrigation water salinity treatments on average soil salinity (ECe, 0–1 m depth). At each growth stage, ECe increased progressively with higher irrigation water salinity. During the wheat grain-filling stage, ECe in the T1–T4 treatments increased by 50.7%, 124.9%, 245.6%, and 239.4%, respectively, compared to CK, with statistically significant differences observed for T2–T4. Similarly, during maize grain-filling, T1–T4 increased ECe by 16.8%, 47.4%, 124.7%, and 189.2%, respectively, with T2–T4 significantly different from CK. Across different growing seasons, the wheat season exhibited a trend of salt accumulation, while the maize season showed a trend of salt leaching. Specifically, compared with the wheat sowing period, soil ECe in the CK, T1, T2, T3, and T4 treatments increased by 27.9%, 10.4%, 32.3%, 30.1%, and 39.1%, respectively, at wheat maturity. In contrast, compared with the maize sowing period, soil ECe in the CK to T4 treatments decreased by 18.0%, 13.9%, 24.9%, 17.7%, and 5.0%, respectively, at maize harvest.
Figure S2 presents vertical soil salinity (ECe) profiles within the 0–6.8 m soil layer under various irrigation treatments during the summer maize harvest. With increasing soil depth, the ECe values for all treatments exhibited an overall trend of initially increasing and then decreasing, with salt leaching observed in the 0–1 m soil layer; the leached salts primarily accumulated in soil layers below 1 m. Furthermore, compared with the ECe (2.34 dS·m−1) in the 0–1 m soil layer at the beginning of 2006, after the maize harvest in this experiment, ECe in the CK and T1 treatments decreased by 4.6% and 0.1%, respectively, whereas ECe in the T2, T3, and T4 treatments increased by 56.8%, 112.0%, and 157.5%, respectively.

3.2. Effects of Saline Water Irrigation on Grain Yield and Water Productivity

3.2.1. Dry Matter Accumulation

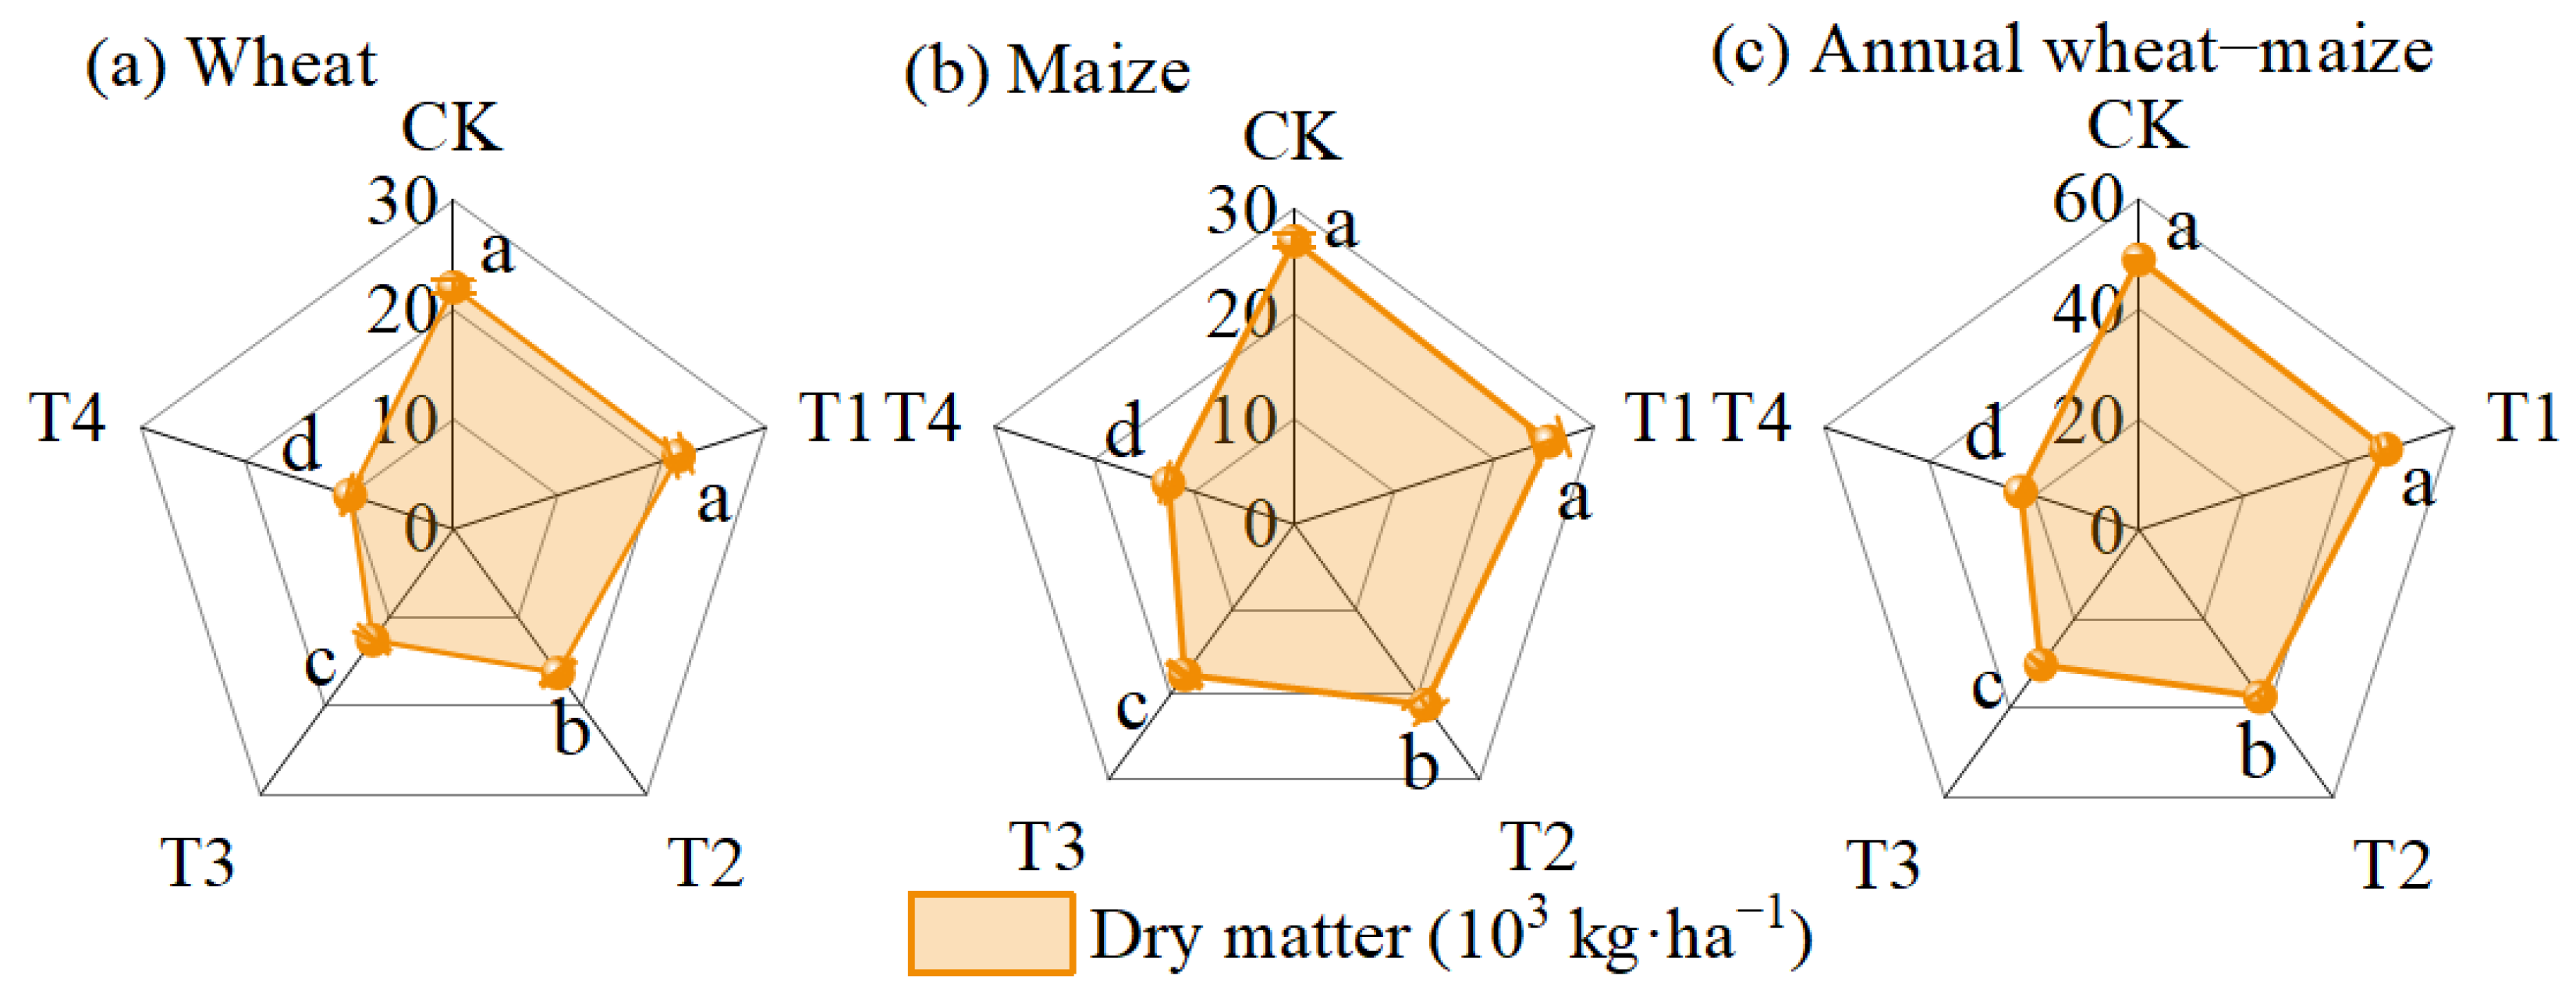
Figure 4 shows the dry matter accumulation of wheat, maize, and the annual wheat–maize rotation system under different irrigation water salinity treatments. Dry matter accumulation decreased progressively at both wheat and maize harvest stages with increasing salinity. Compared with the control (CK), T1–T4 treatments reduced wheat dry matter by 1.9%, 26.3%, 43.2%, and 54.9%; maize dry matter by 5.4%, 21.1%, 34.3%, and 53.3%; and annual system dry matter by 3.8%, 23.5%, 38.3%, and 54.0%, respectively. Significant differences were observed between T2–T4 and CK for wheat, maize, and the wheat–maize rotation system.

3.2.2. Grain Yield

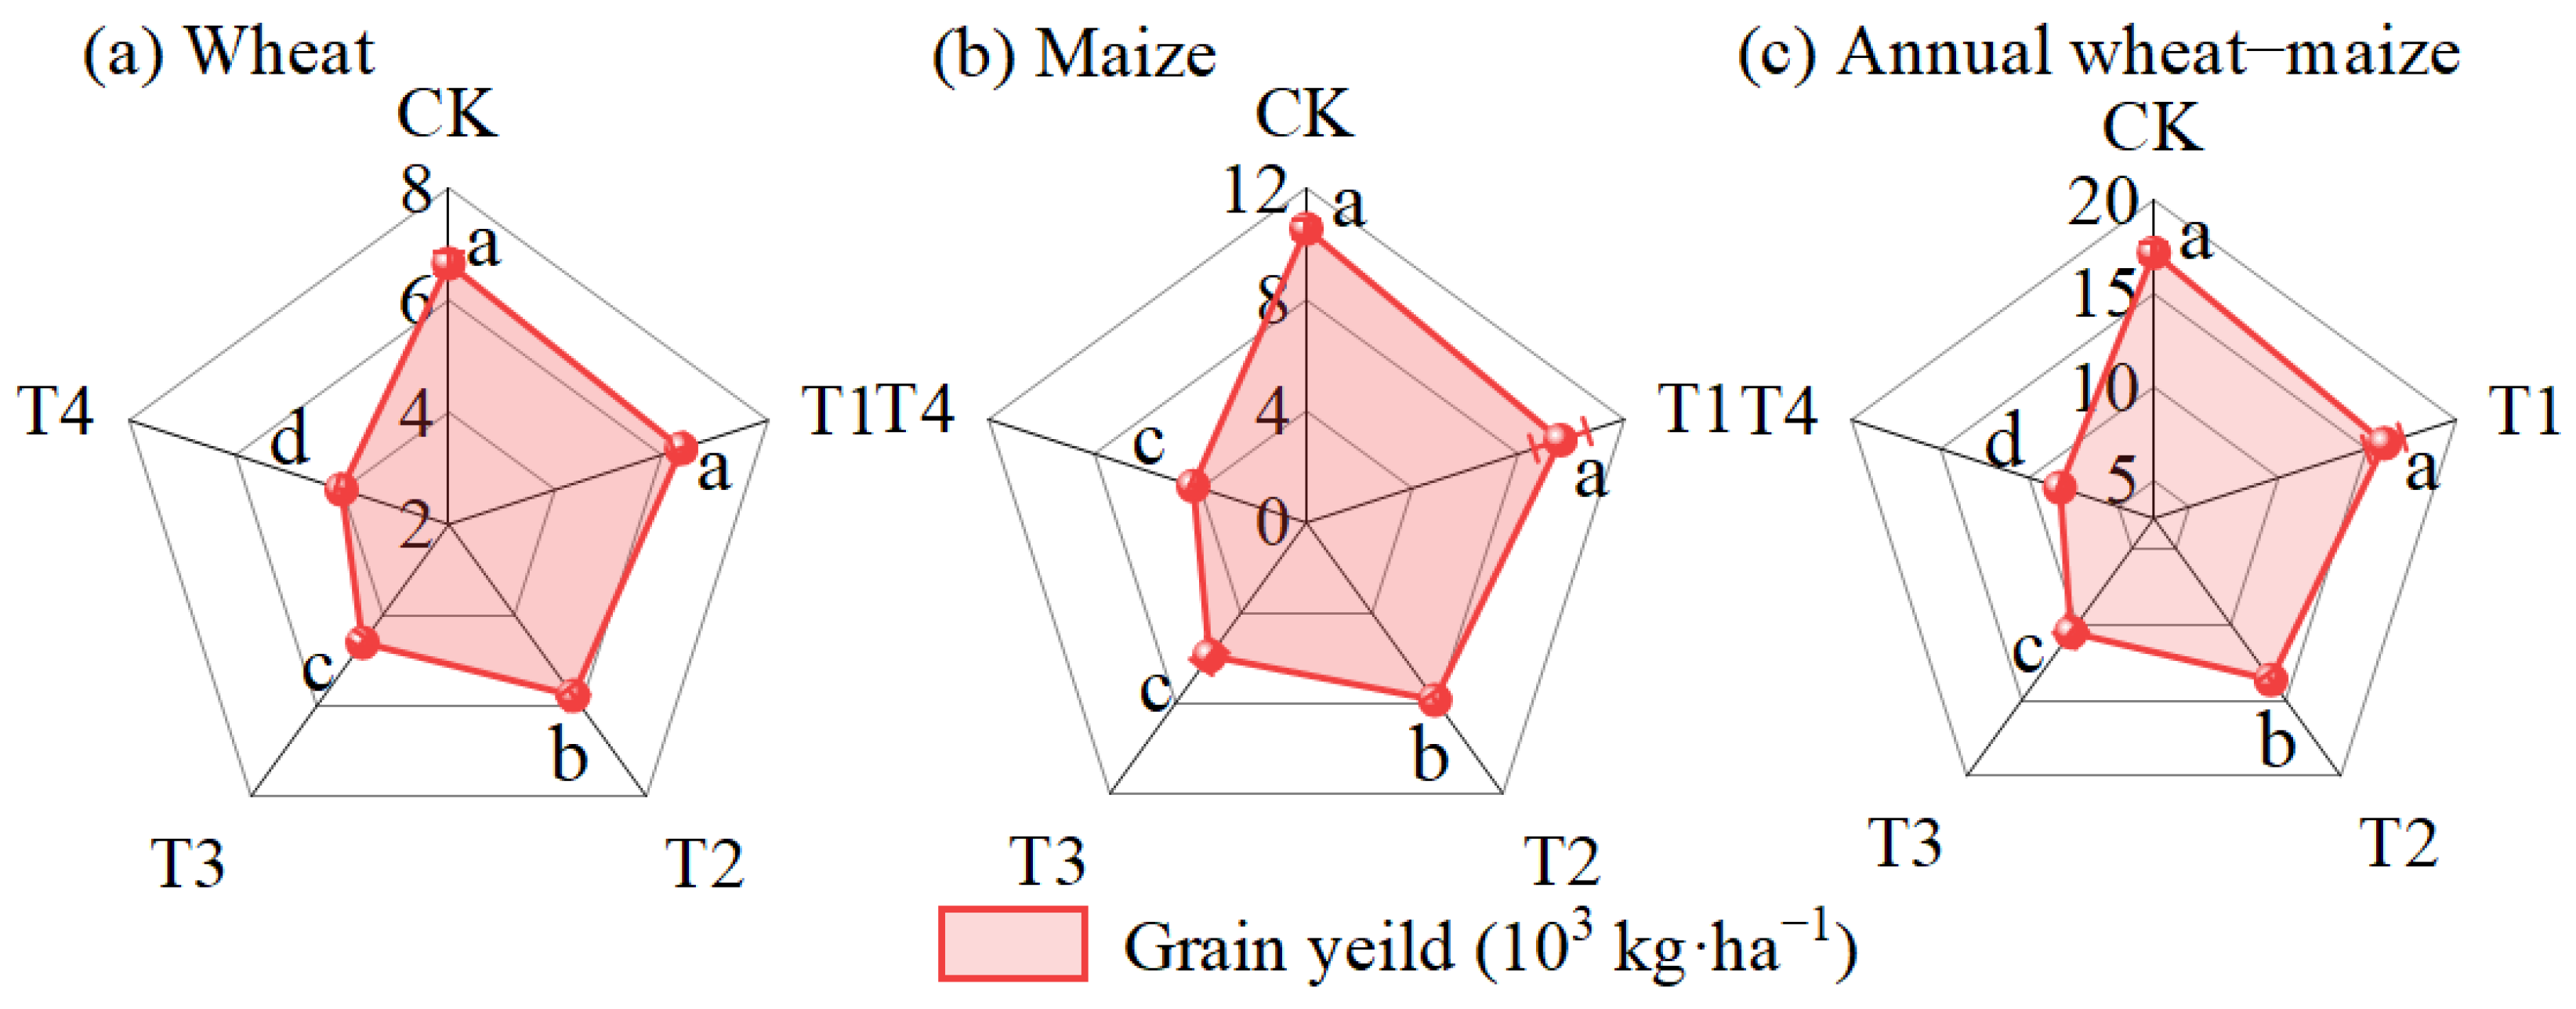
Figure 5 shows that irrigation water salinity treatments affected wheat, maize, and annual yields, with yields progressively decreasing as salinity increased. Compared with the control (CK), wheat yields were reduced by 4.3% (T1), 13.1% (T2), 30.7% (T3), and 39.7% (T4); maize yields by 8.9% (T1), 25.3% (T2), 43.9% (T3), and 59.5% (T4); and annual yields by 7.1% (T1), 20.6% (T2), 38.8% (T3), and 51.8% (T4). Significant differences were observed between T2–T4 treatments and CK for wheat, maize, and the wheat–maize rotation system.

3.2.3. Crop Water Consumption

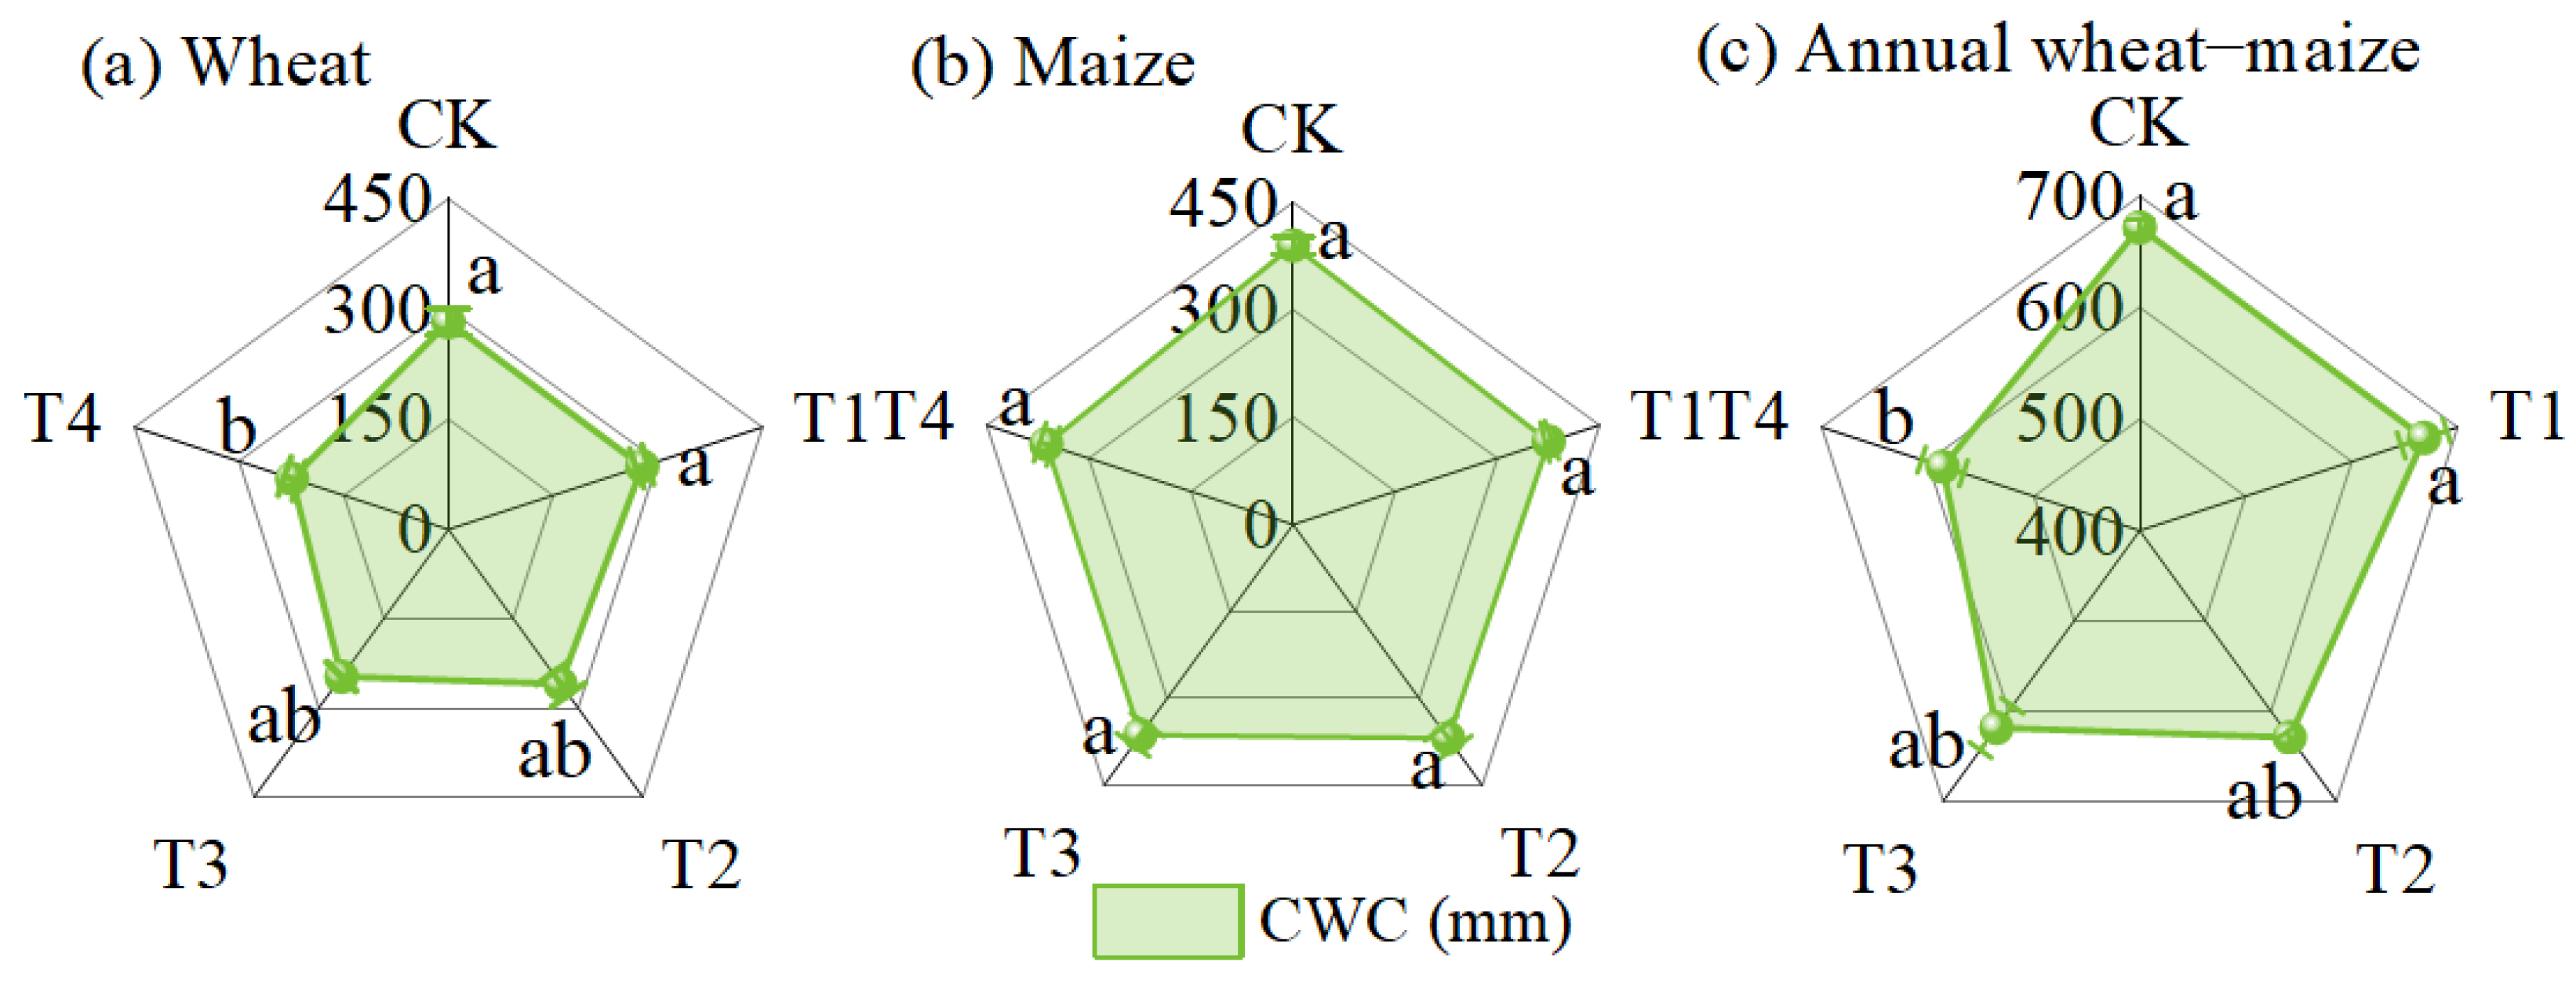
Figure 6 shows that increasing irrigation water salinity progressively reduced crop water consumption (CWC) in wheat, maize, and wheat–maize rotation systems. Compared with CK, CWC during the wheat season decreased by 1.6% (T1), 7.8% (T2), 12.2% (T3), and 20.7% (T4), with only T4 showing a significant difference. During the maize season, CWC decreased by 3.6% (T1), 5.3% (T2), 6.8% (T3), and 7.1% (T4), with no significant differences observed. For the annual rotation, CWC decreased by 0.5% (T1), 6.3% (T2), 7.9% (T3), and 12.8% (T4), with T4 being significantly different from CK.

3.2.4. Water Productivity

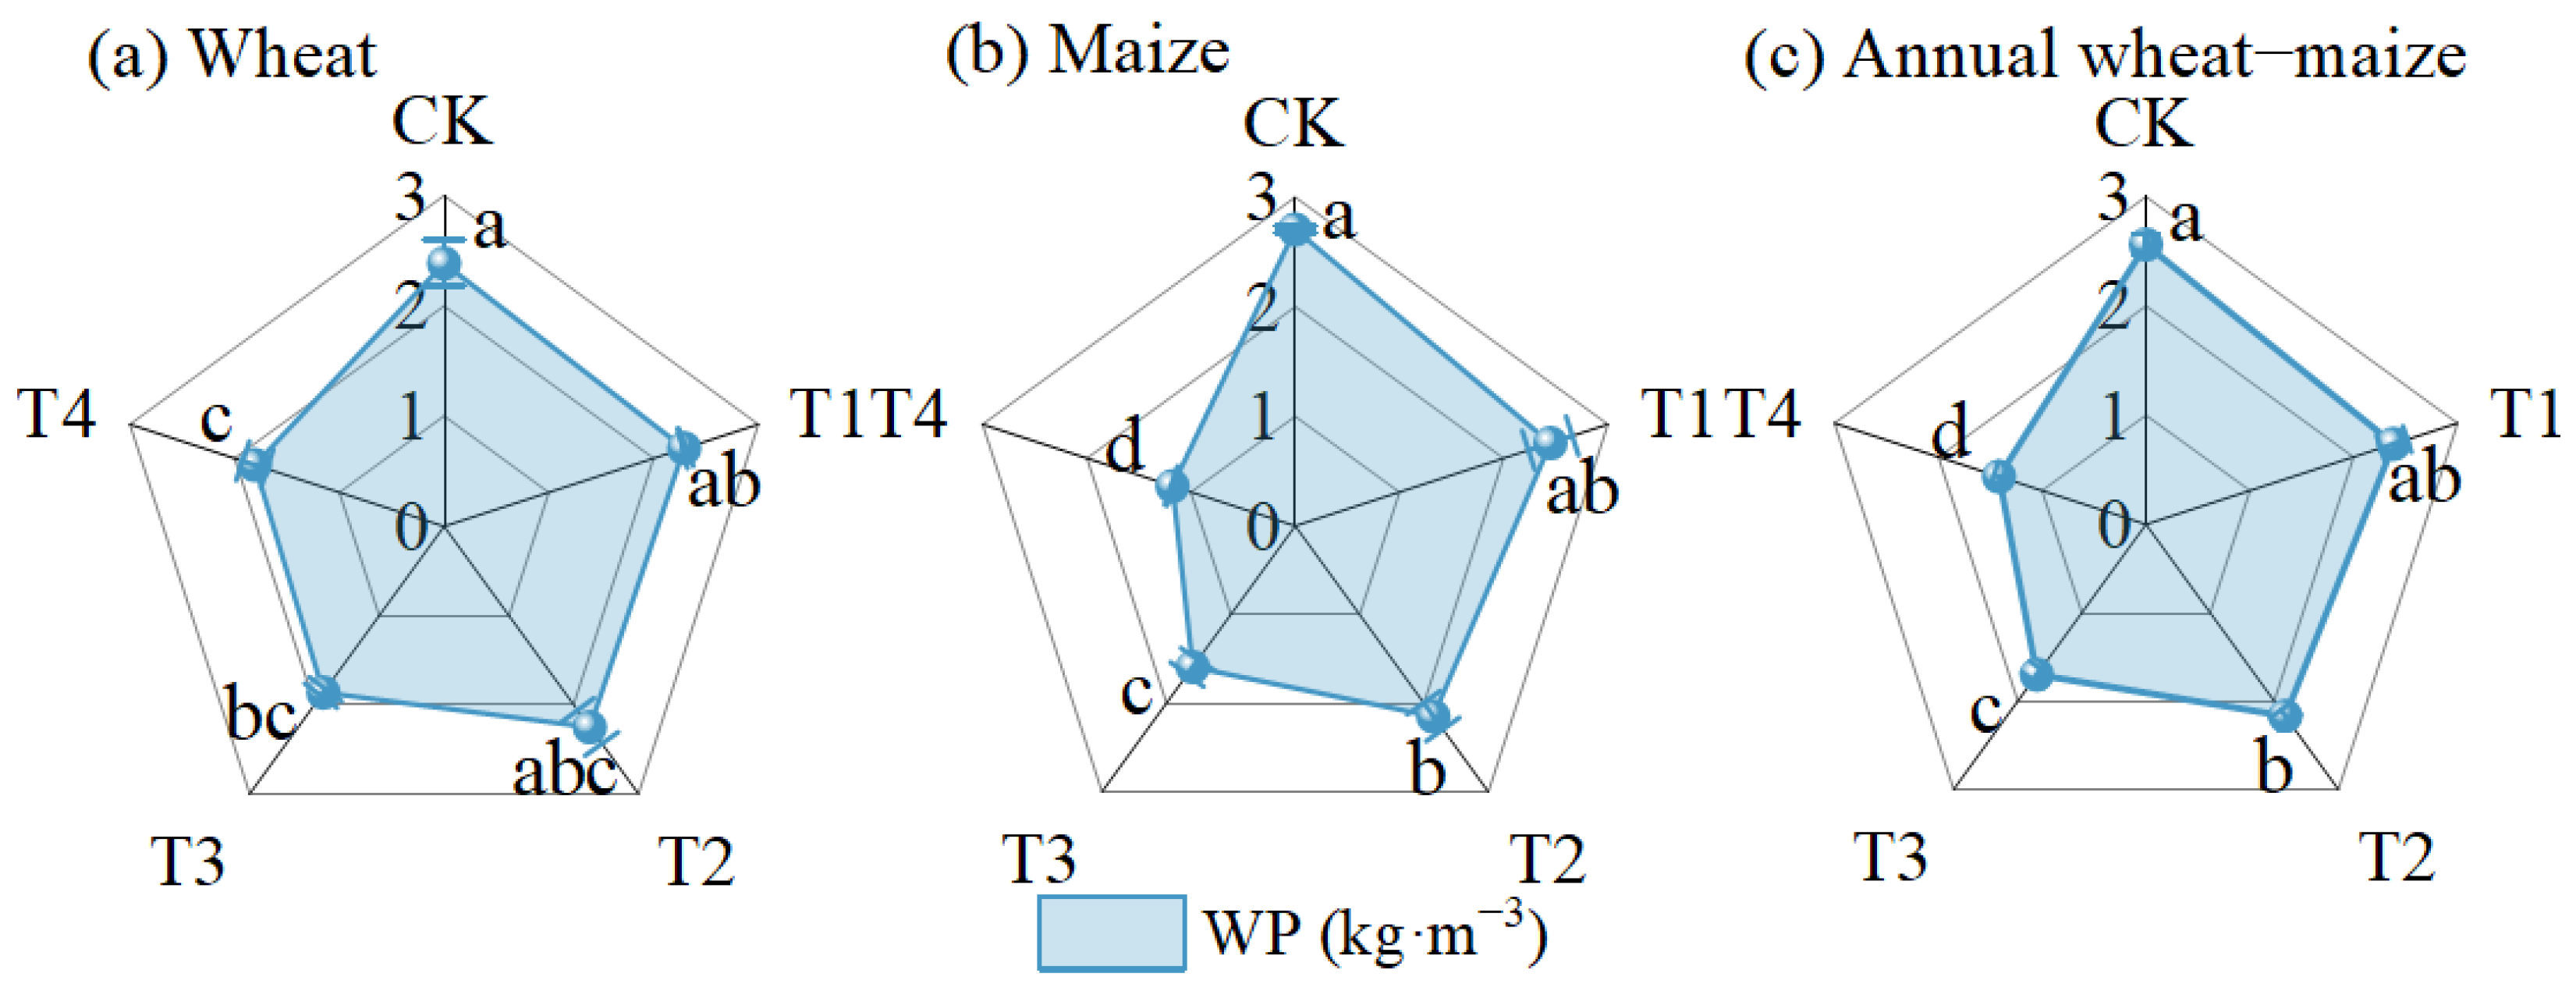
Figure 7 shows that water productivity (WP) declined progressively with increasing irrigation water salinity across both growing seasons. During the wheat season, WP decreased by 3.9% (T1), 5.7% (T2), 21.9% (T3), and 24.4% (T4) compared with CK, with significant differences observed for T3 and T4. In the maize season, WP decreased by 9.4% (T1), 20.6% (T2), 41.1% (T3), and 56.4% (T4), with T2–T4 significantly lower than CK. For the annual rotation, WP decreased by 6.7% (T1), 15.2% (T2), 33.6% (T3), and 44.7% (T4), with T2–T4 showing statistical significance.

3.2.5. Linear Fitting Analysis

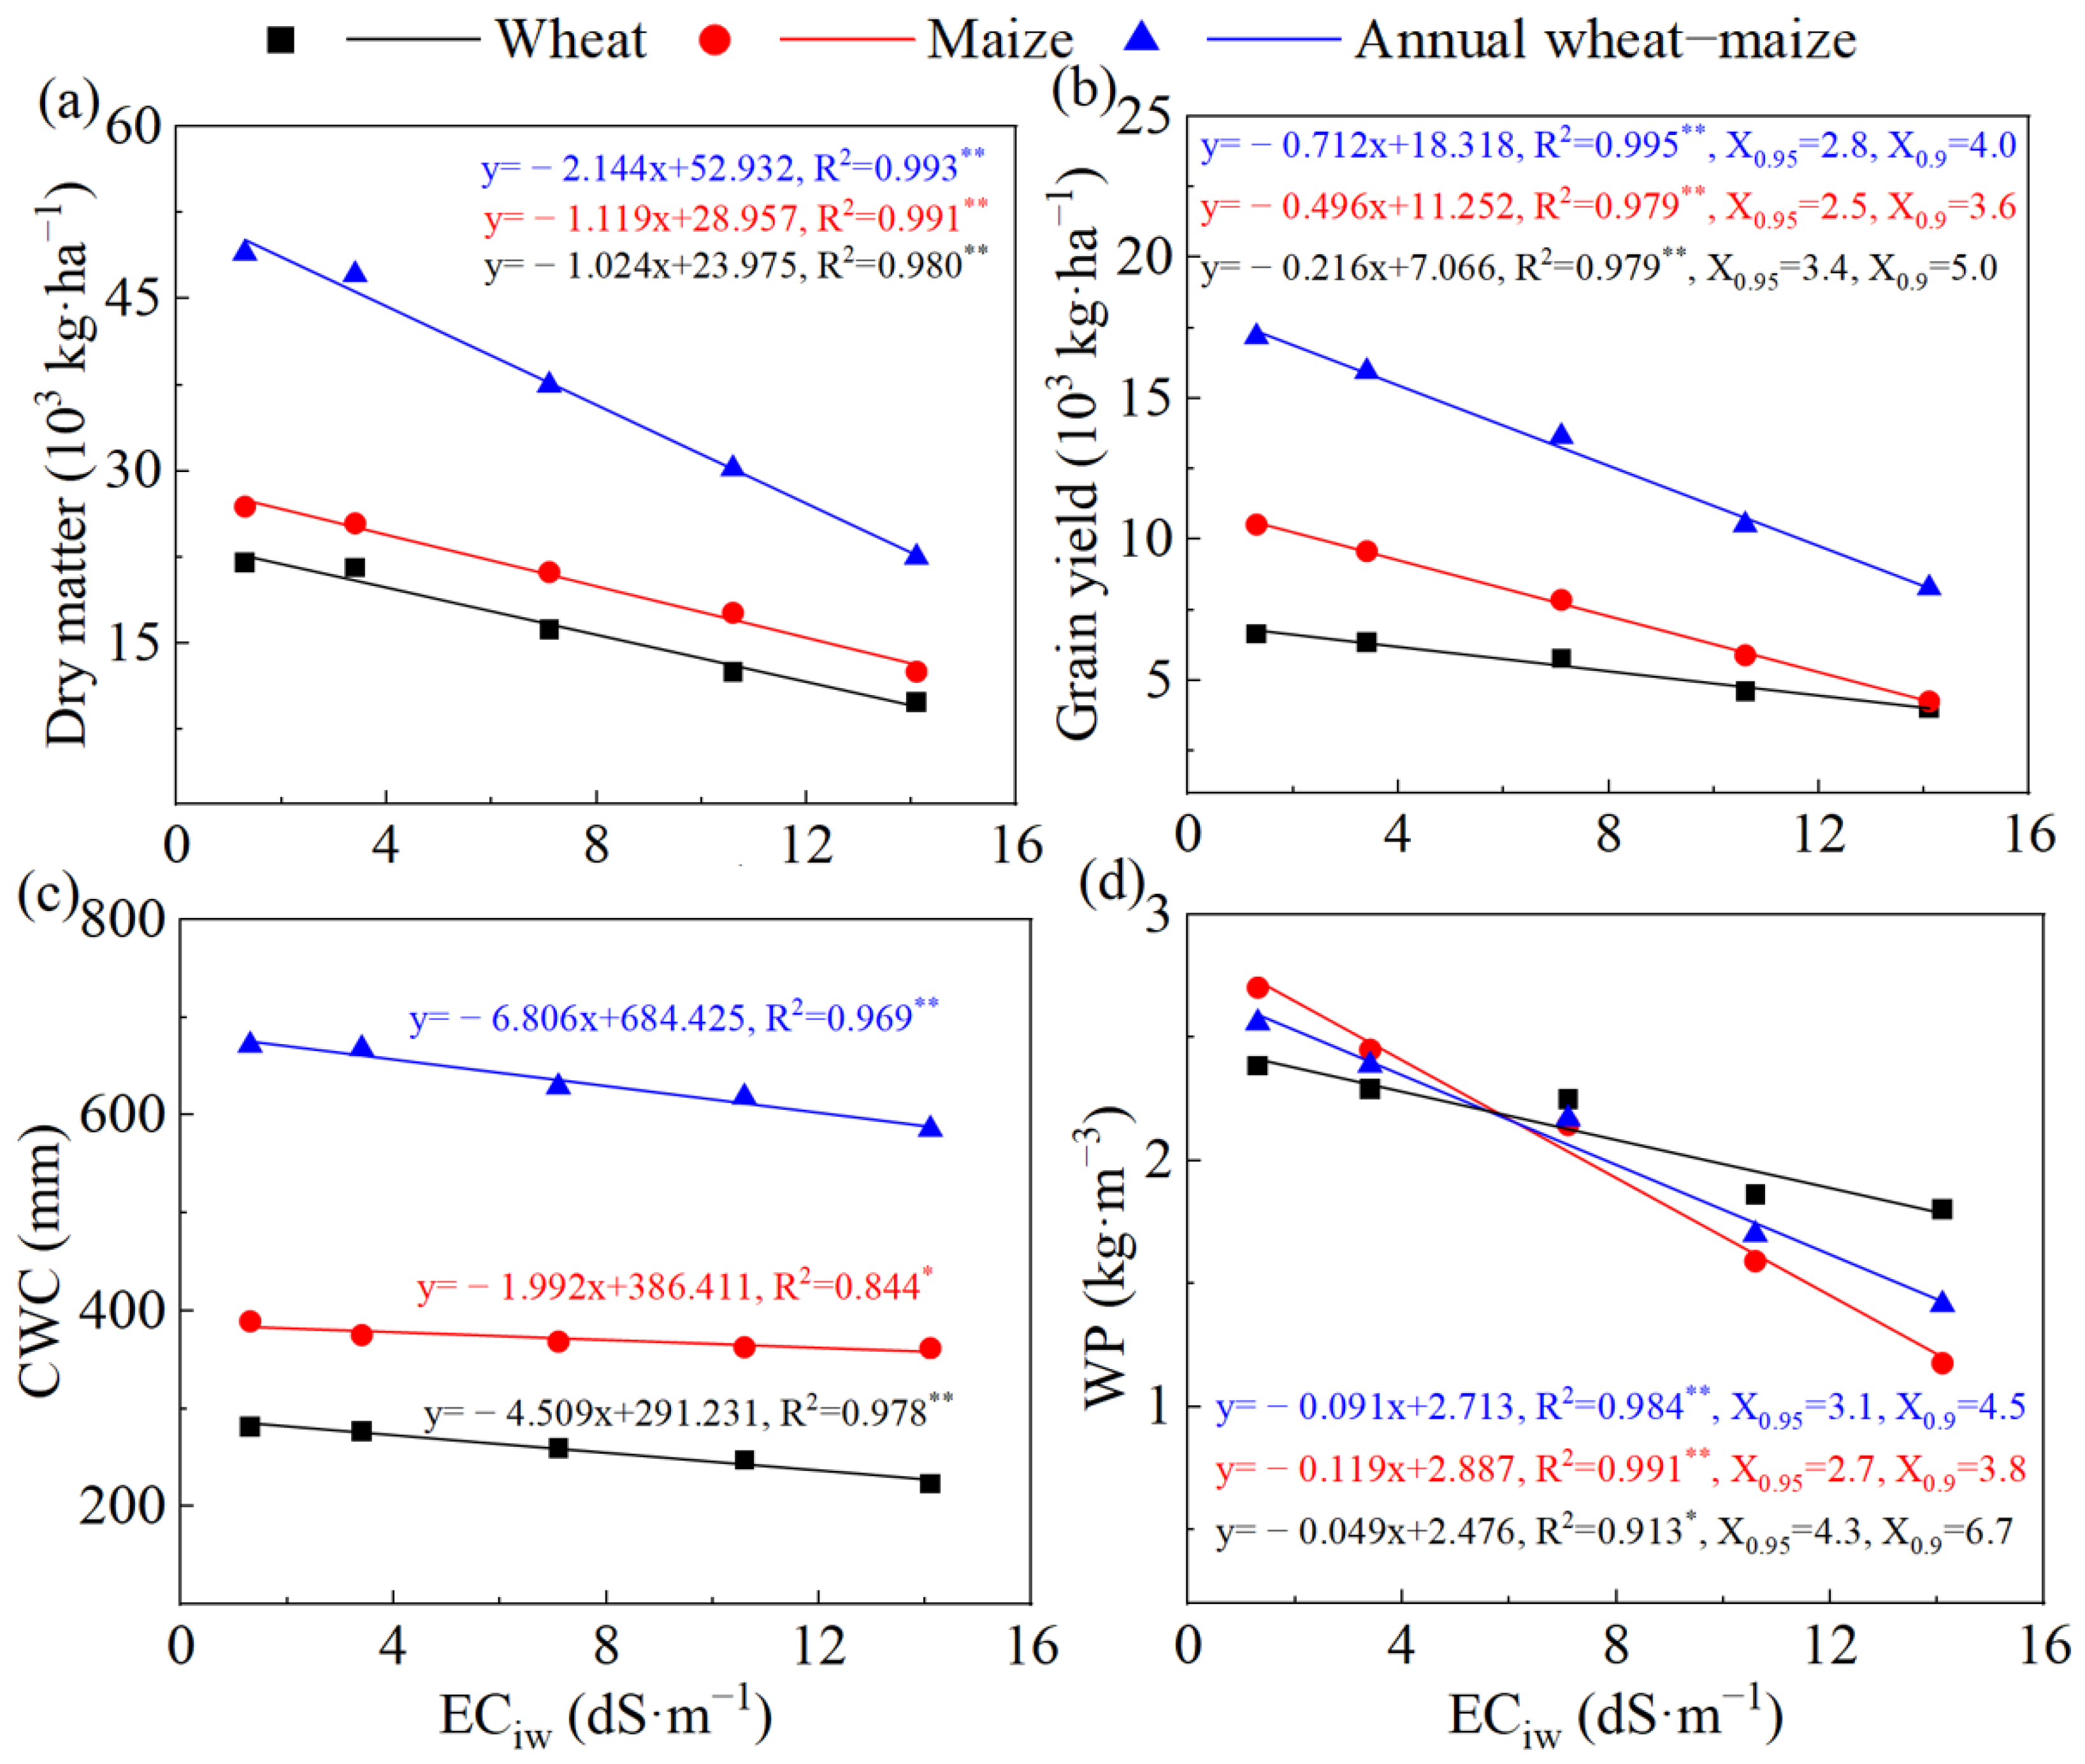
Linear regression analysis was conducted to clarify the effects of irrigation water salinity (ECiw) on dry matter accumulation, yield (Y), crop water consumption (CWC), and water productivity (WP) in wheat, maize, and wheat–maize rotation systems over a one-year cycle (Figure 8). The slope of the fitted regression function was used as an indicator of the sensitivity of these variables to irrigation water salinity. The results indicated that dry matter accumulation, CWC, Y, and WP for both wheat and maize were negatively correlated in a linear manner with irrigation water salinity. Moreover, the absolute values of the slopes for dry matter accumulation, Y, and WP in the winter wheat season were consistently lower than those observed for maize. Critical salinity thresholds were identified. For yield reduction, at a 5% reduction, thresholds were 3.4 dS·m−1 for wheat, 2.5 dS·m−1 for maize, and 2.8 dS·m−1 for the rotation system; at a 10% reduction, the respective values were 5.0, 3.6, and 4.0 dS·m−1 (Figure 8b). For WP reduction, the 5% thresholds were 4.3 dS·m−1 for wheat, 2.7 dS·m−1 for maize, and 3.1 dS·m−1 for rotation; at 10% decrease, the thresholds were 6.7, 3.8, and 4.5 dS·m−1 (Figure 8d).

3.3. Effects of Saline Water Irrigation on Soil Respiration Rate and Surface Soil Moisture, Temperature, Salinity, and pH

3.3.1. Surface Soil Moisture and Temperature

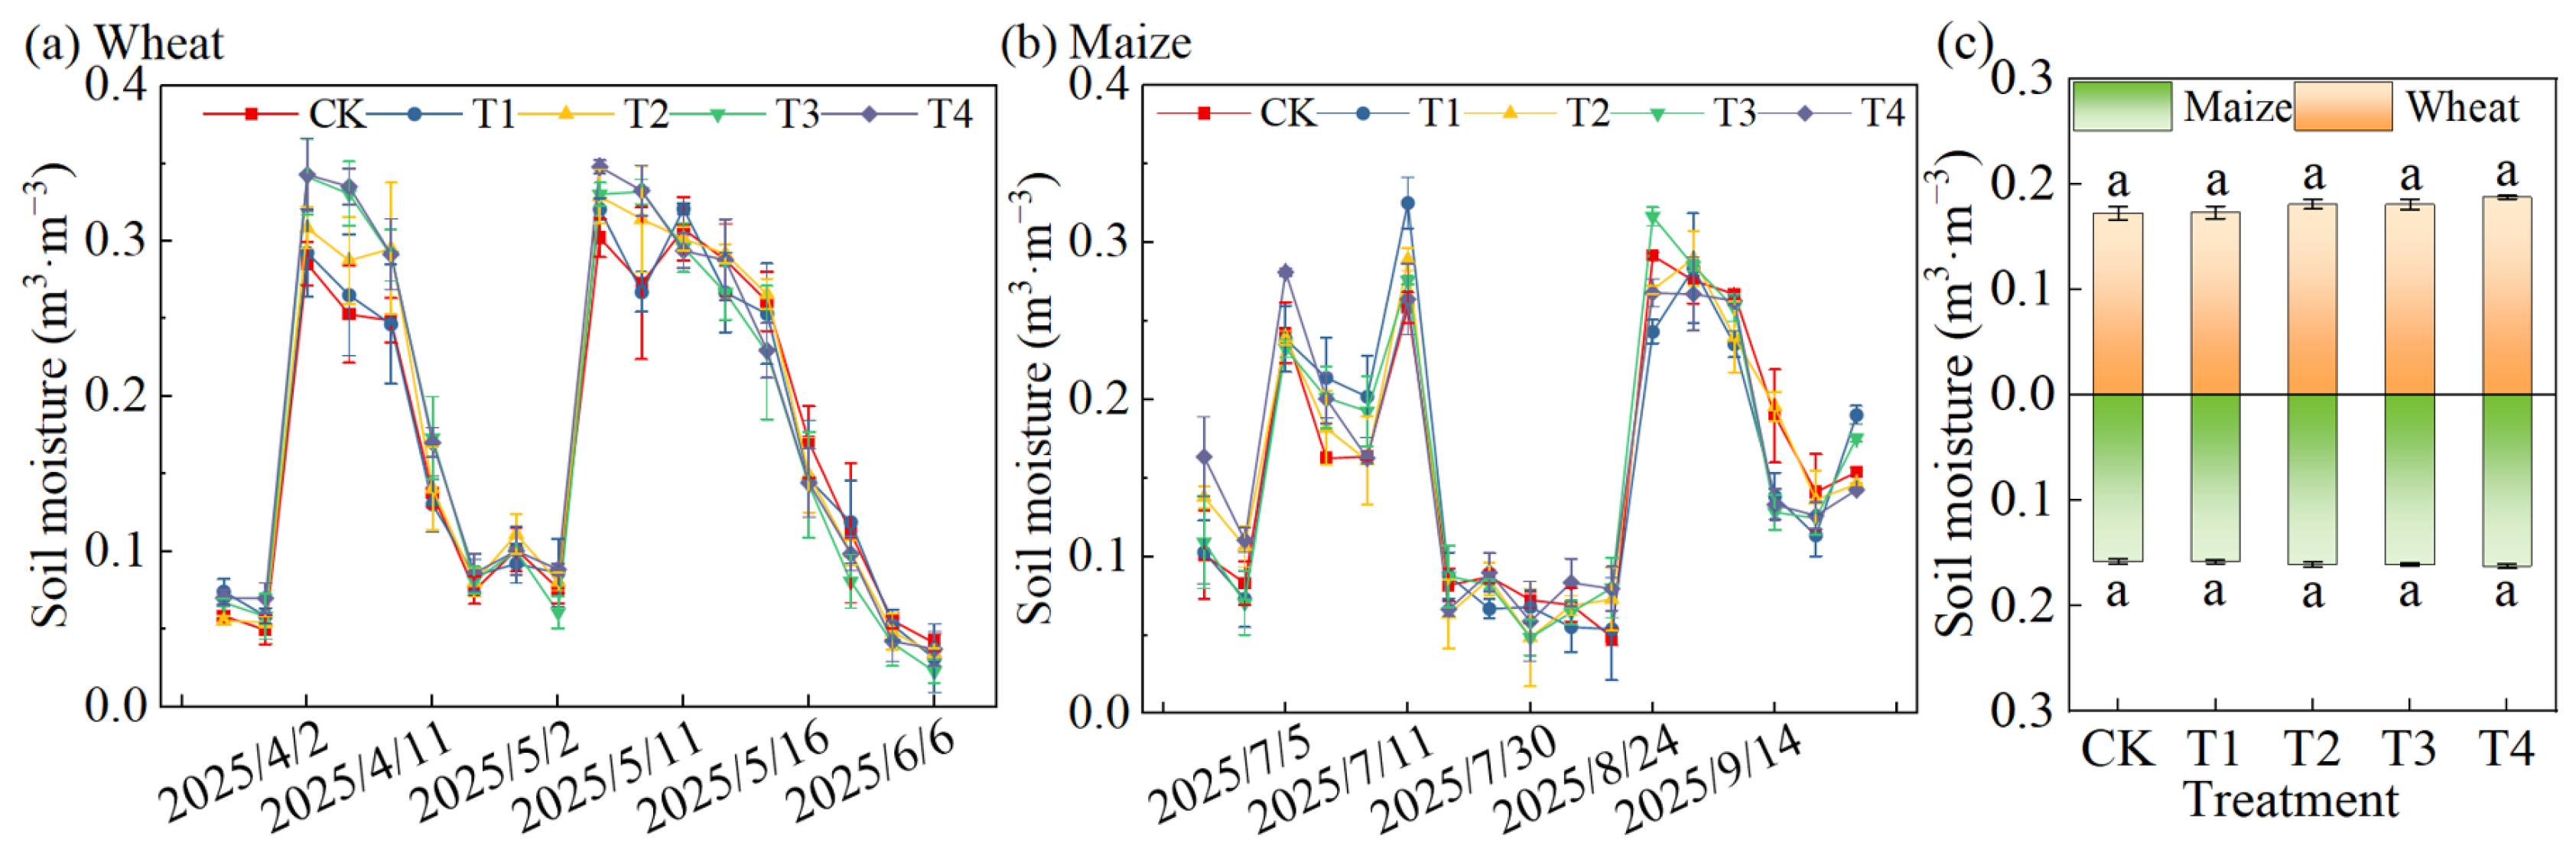
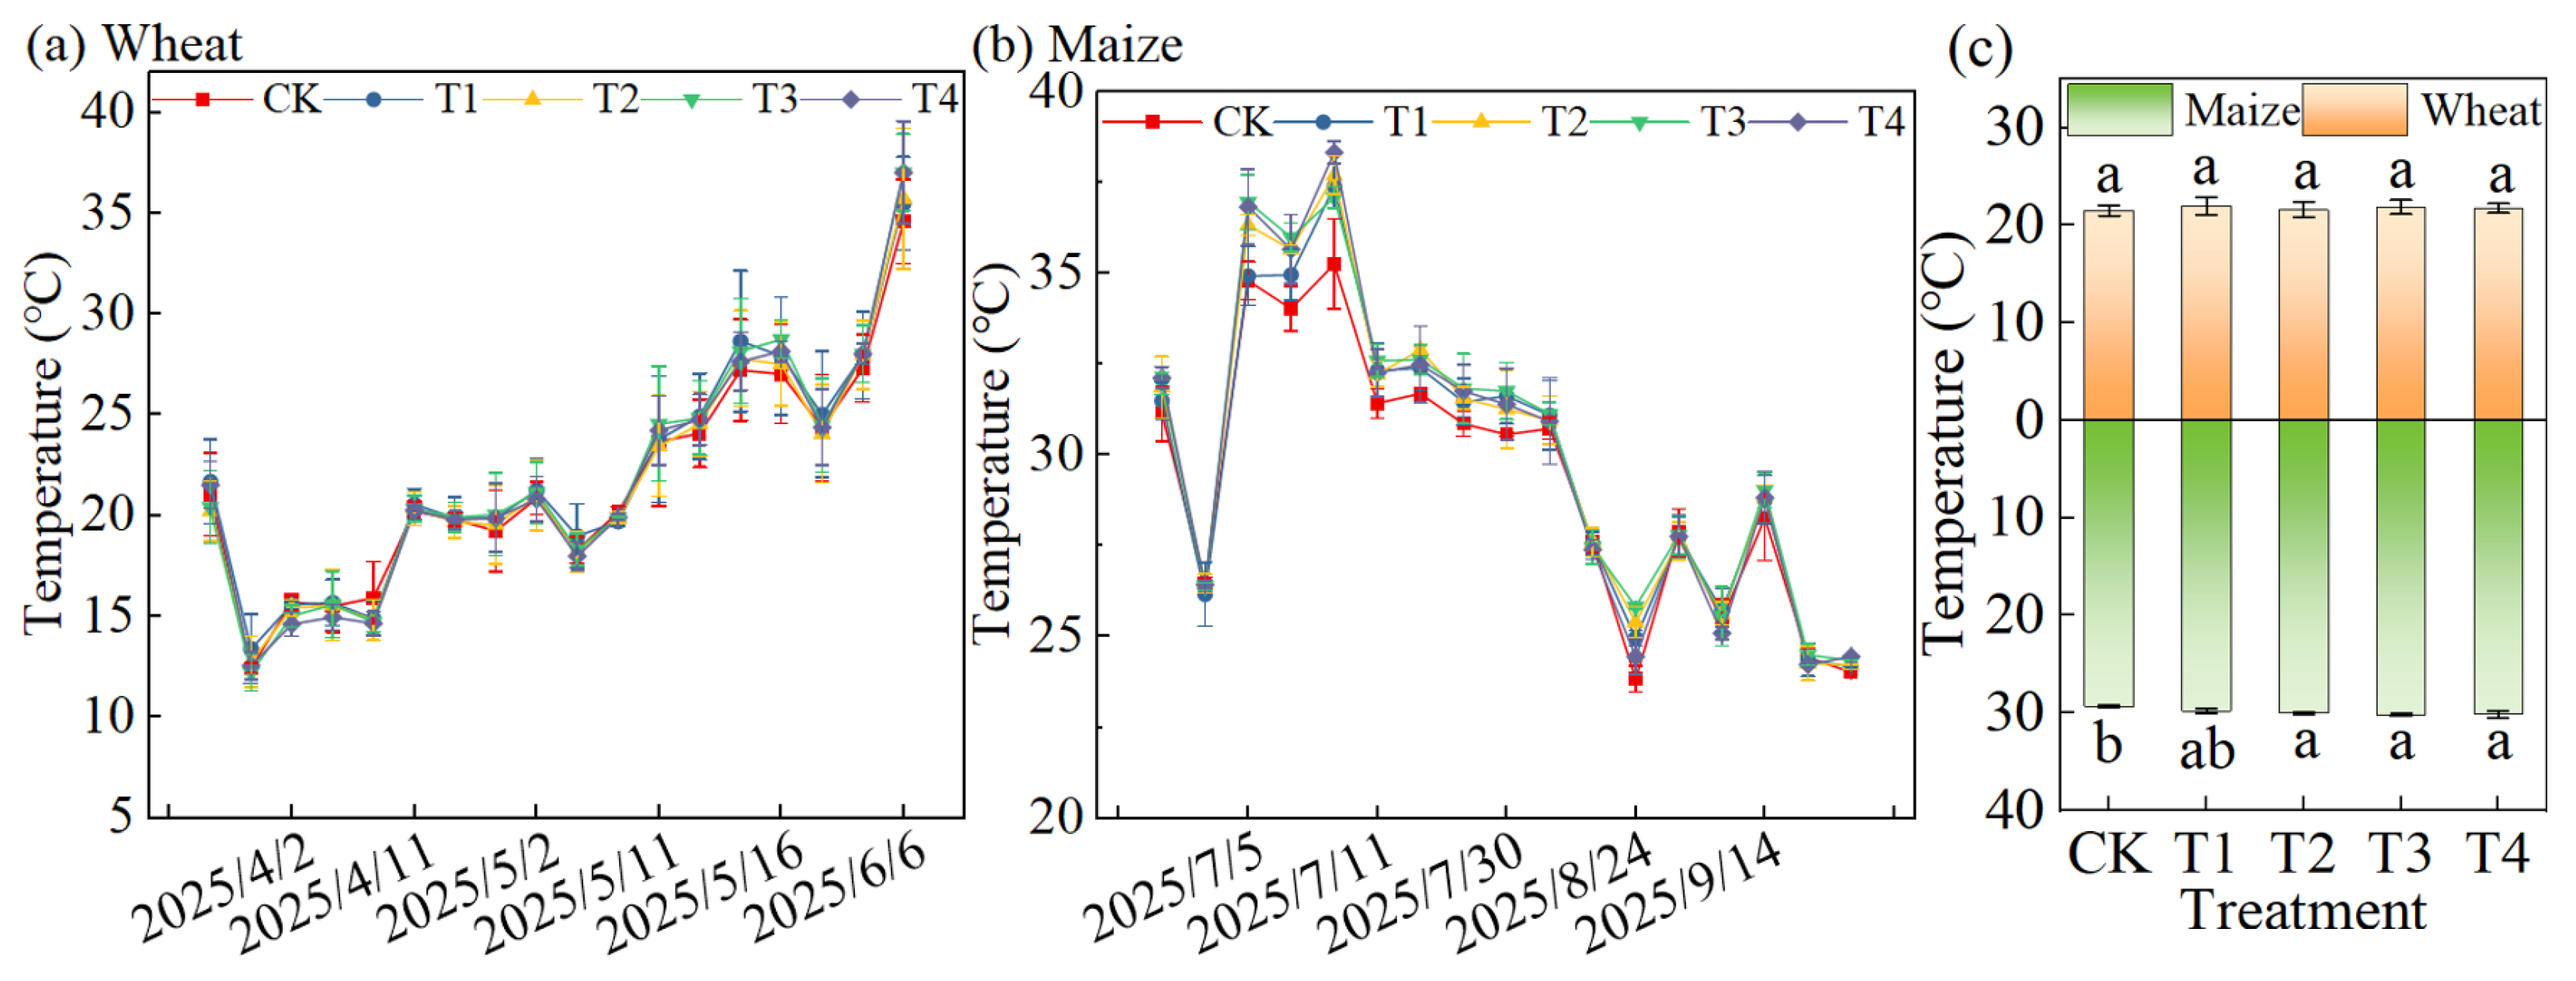
Figure 9 and Figure 10 depict surface soil moisture (SM) and temperature (T) in the 0–0.1 m layer under different irrigation water salinity treatments, respectively. During both crop growing seasons, average surface SM and T increased with rising salinity. Compared to CK, wheat-season average surface SM in T1–T4 treatments increased by 0.4%, 4.8%, 4.9%, and 8.8%, respectively, while maize-season surface SM rose by 0.02%, 1.6%, 1.6%, and 2.6% (Figure 9c). Notably, average surface SM differences between T1–T4 and CK were statistically non-significant for both seasons. Average surface soil T under T1–T4 during the wheat season increased by 2.0%, 0.2%, 1.5%, and 0.9% versus CK, with no significant differences. Conversely, maize-season average surface soil T increased by 1.7%, 2.4%, 2.9%, and 2.8%, where T2–T4 treatments exhibited significant differences relative to CK (Figure 10c).

3.3.2. Surface Soil Salinity and pH

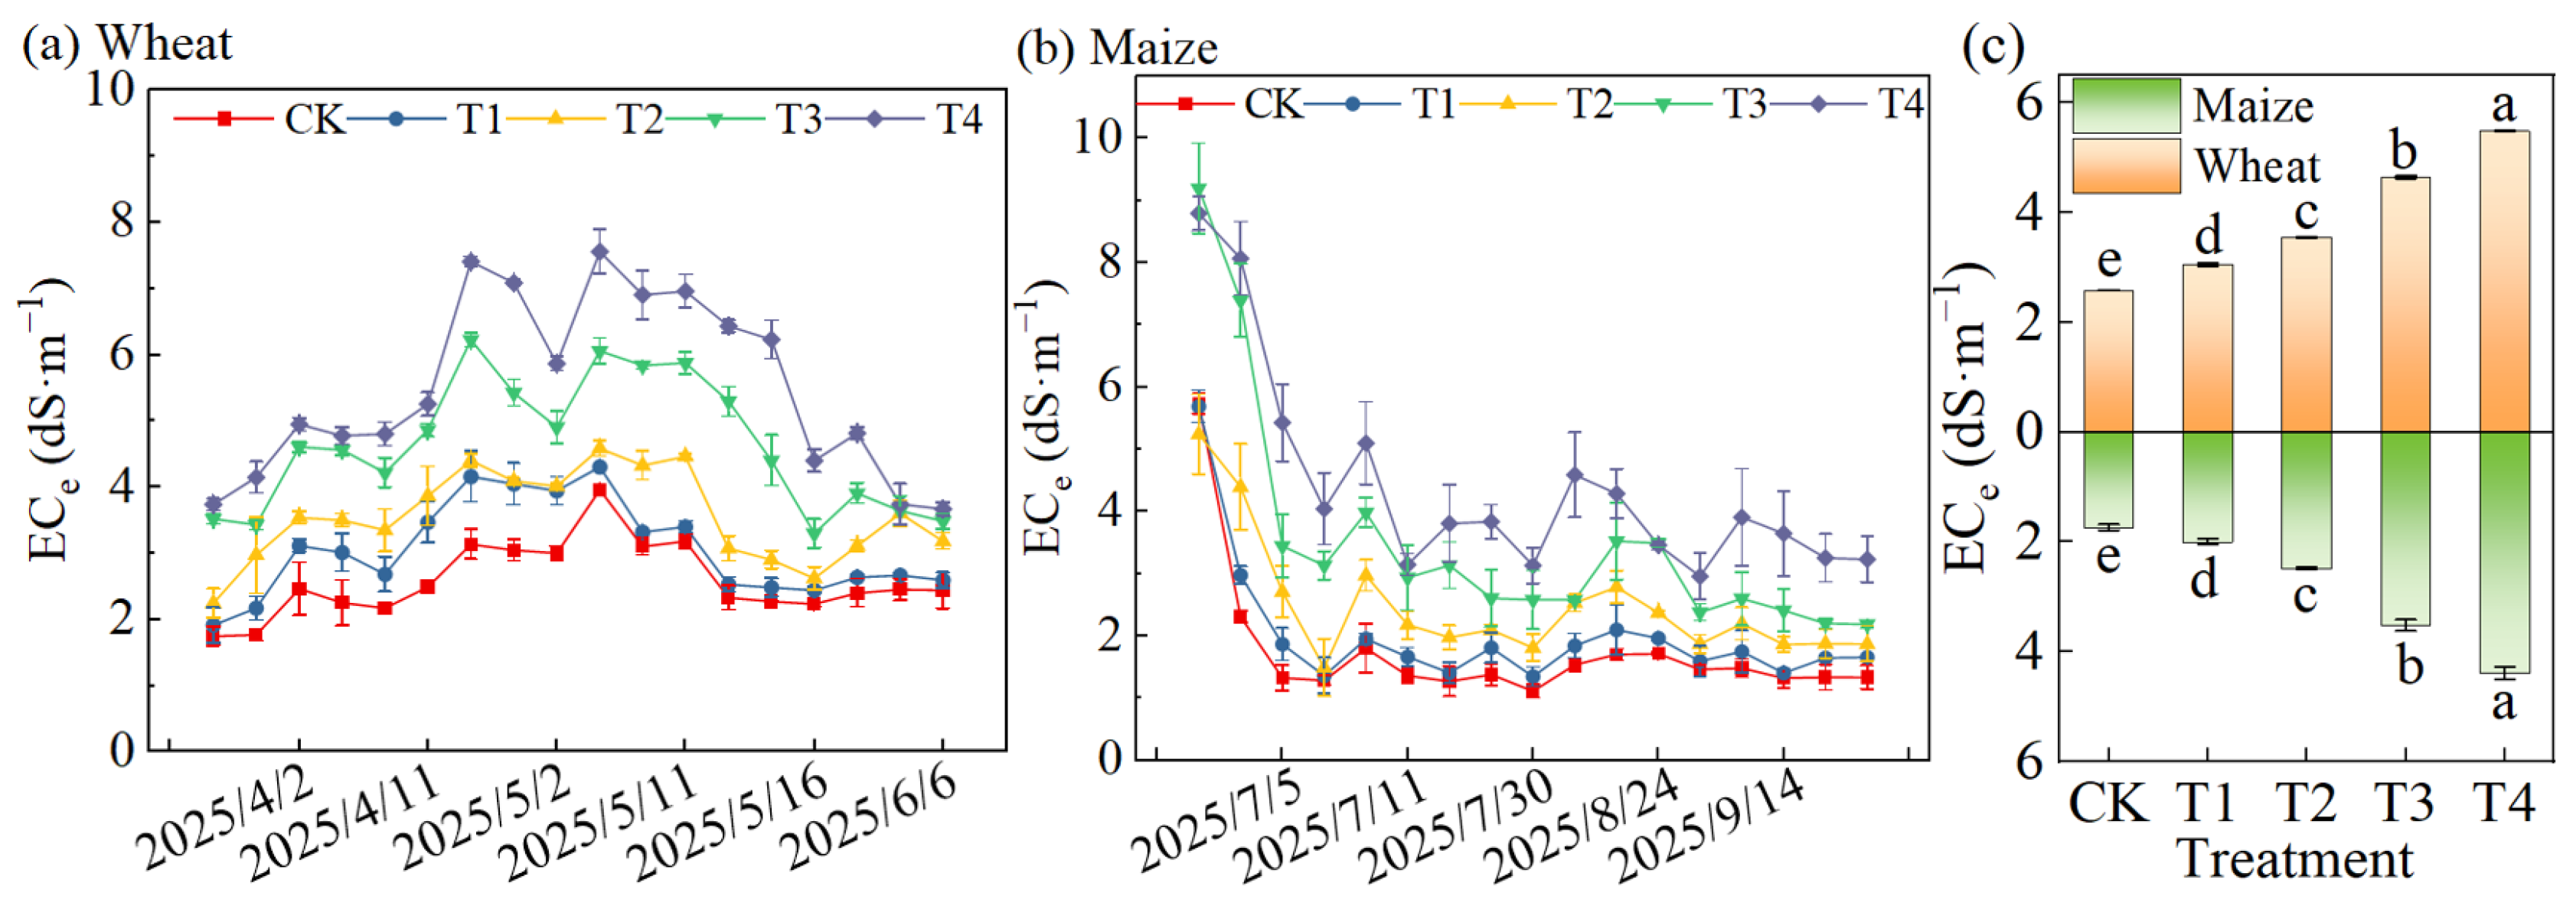
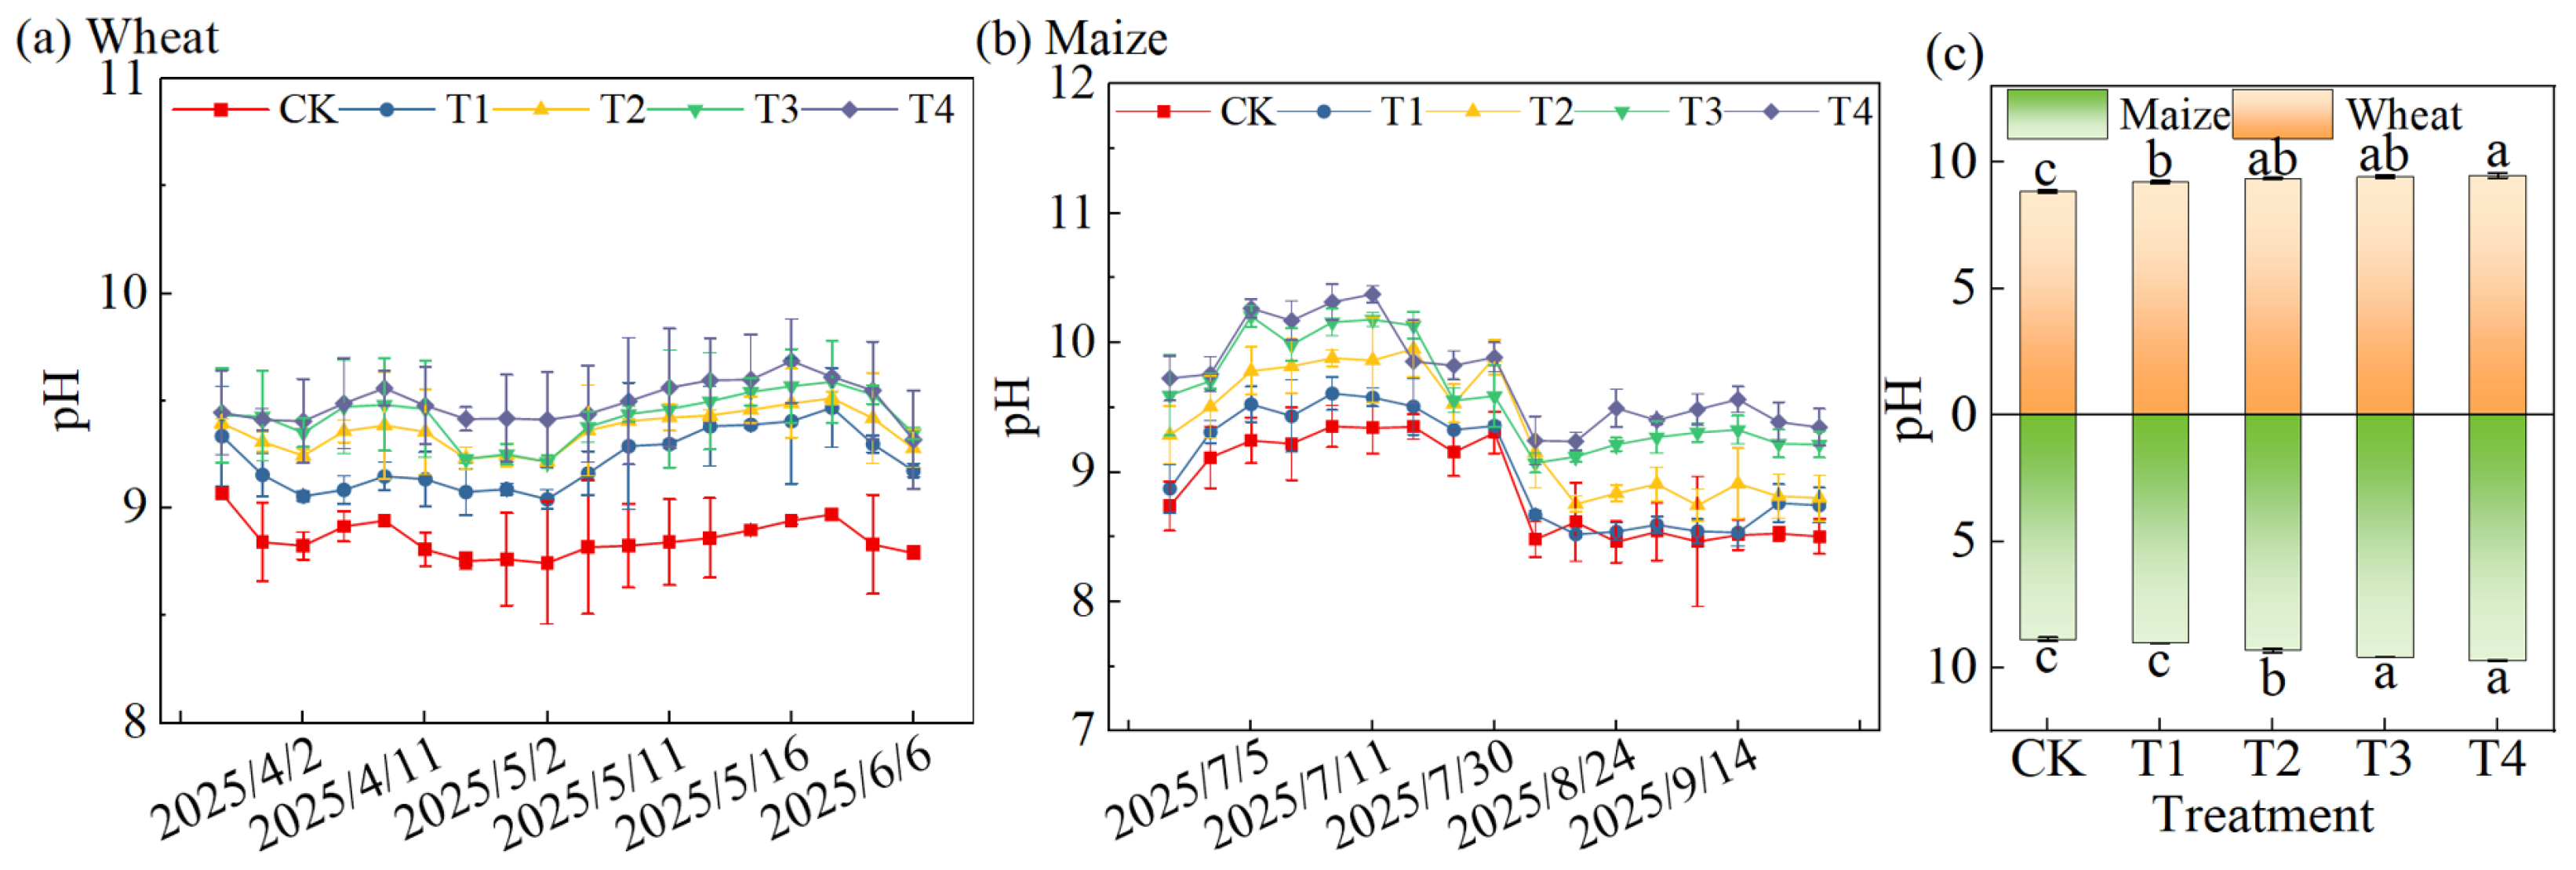
Saline water irrigation significantly elevated surface soil salinity (ECe, 0–0.1 m depth) in both crops (Figure 11c). Compared to the control (CK), surface ECe under T1–T4 increased by 18.1%, 37.4%, 79.7%, and 112.3% in wheat, and by 15.5%, 43.4%, 102.9%, and 153.5% in maize, with all treatments showing significant differences versus CK. Surface soil pH also rose under saline water irrigation (Figure 12c): relative to CK, surface soil pH in wheat increased by 4.1%, 5.7%, 6.4%, and 7.2% under T1–T4, while maize increased by 1.7%, 5.0%, 7.9%, and 9.5%. Significant surface soil pH differences were observed for all treatments except T1 in maize versus CK.

3.3.3. Soil Respiration Rate

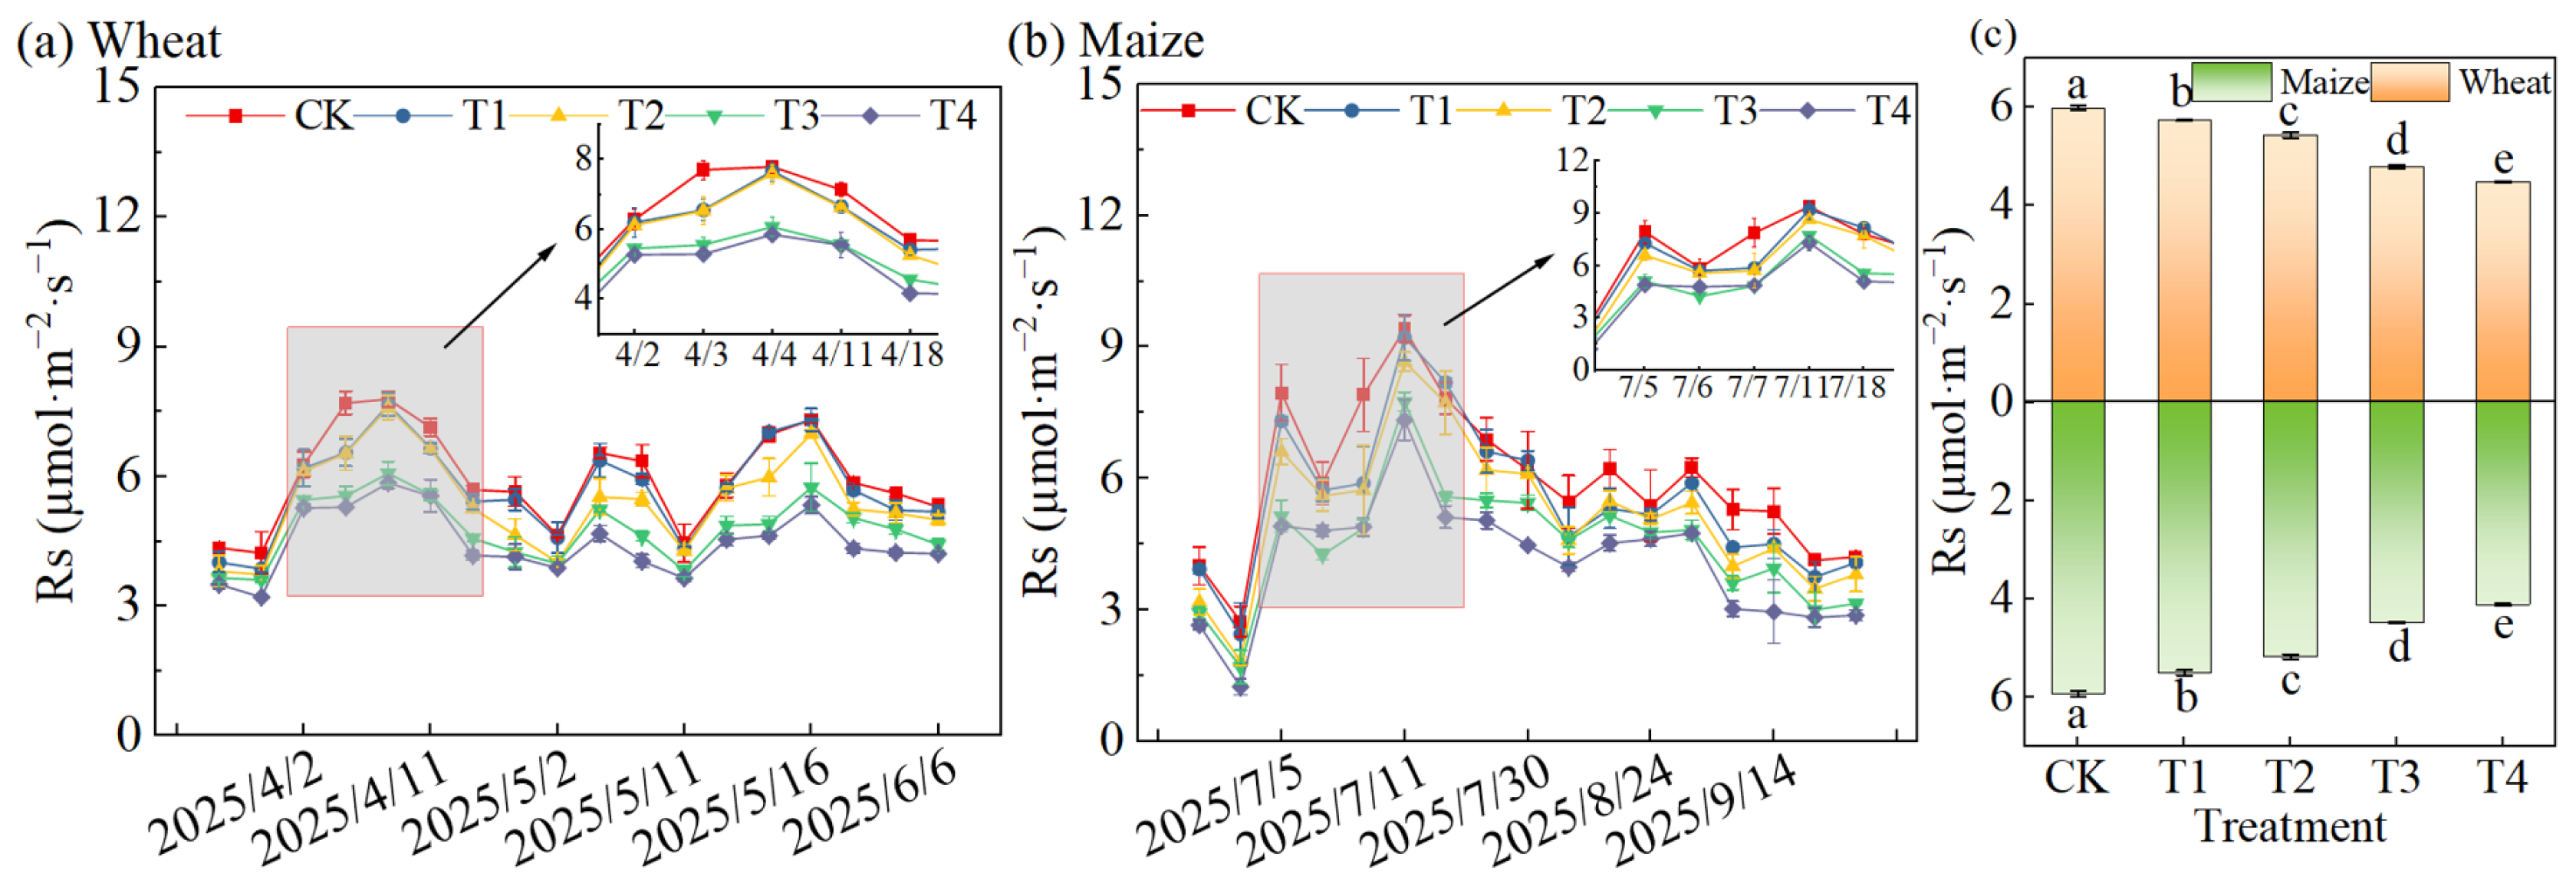
Figure 13 illustrates soil respiration rate (Rs) under treatments with varying irrigation water salinity. In both crop seasons, Rs peaked following irrigation and rainfall events. Meanwhile, the mean Rs declined as irrigation water salinity increased (Figure 13a,b). Relative to the CK treatment, the average Rs during the wheat season reduced significantly by 4.1%, 9.2%, 20.0%, and 25.2% under the T1, T2, T3, and T4 treatments, respectively. In maize season, the T1–T4 treatments resulted in significant reductions of 7.4%, 12.9%, 24.5%, and 30.7%, respectively (Figure 13c).

3.3.4. Correlation Analysis

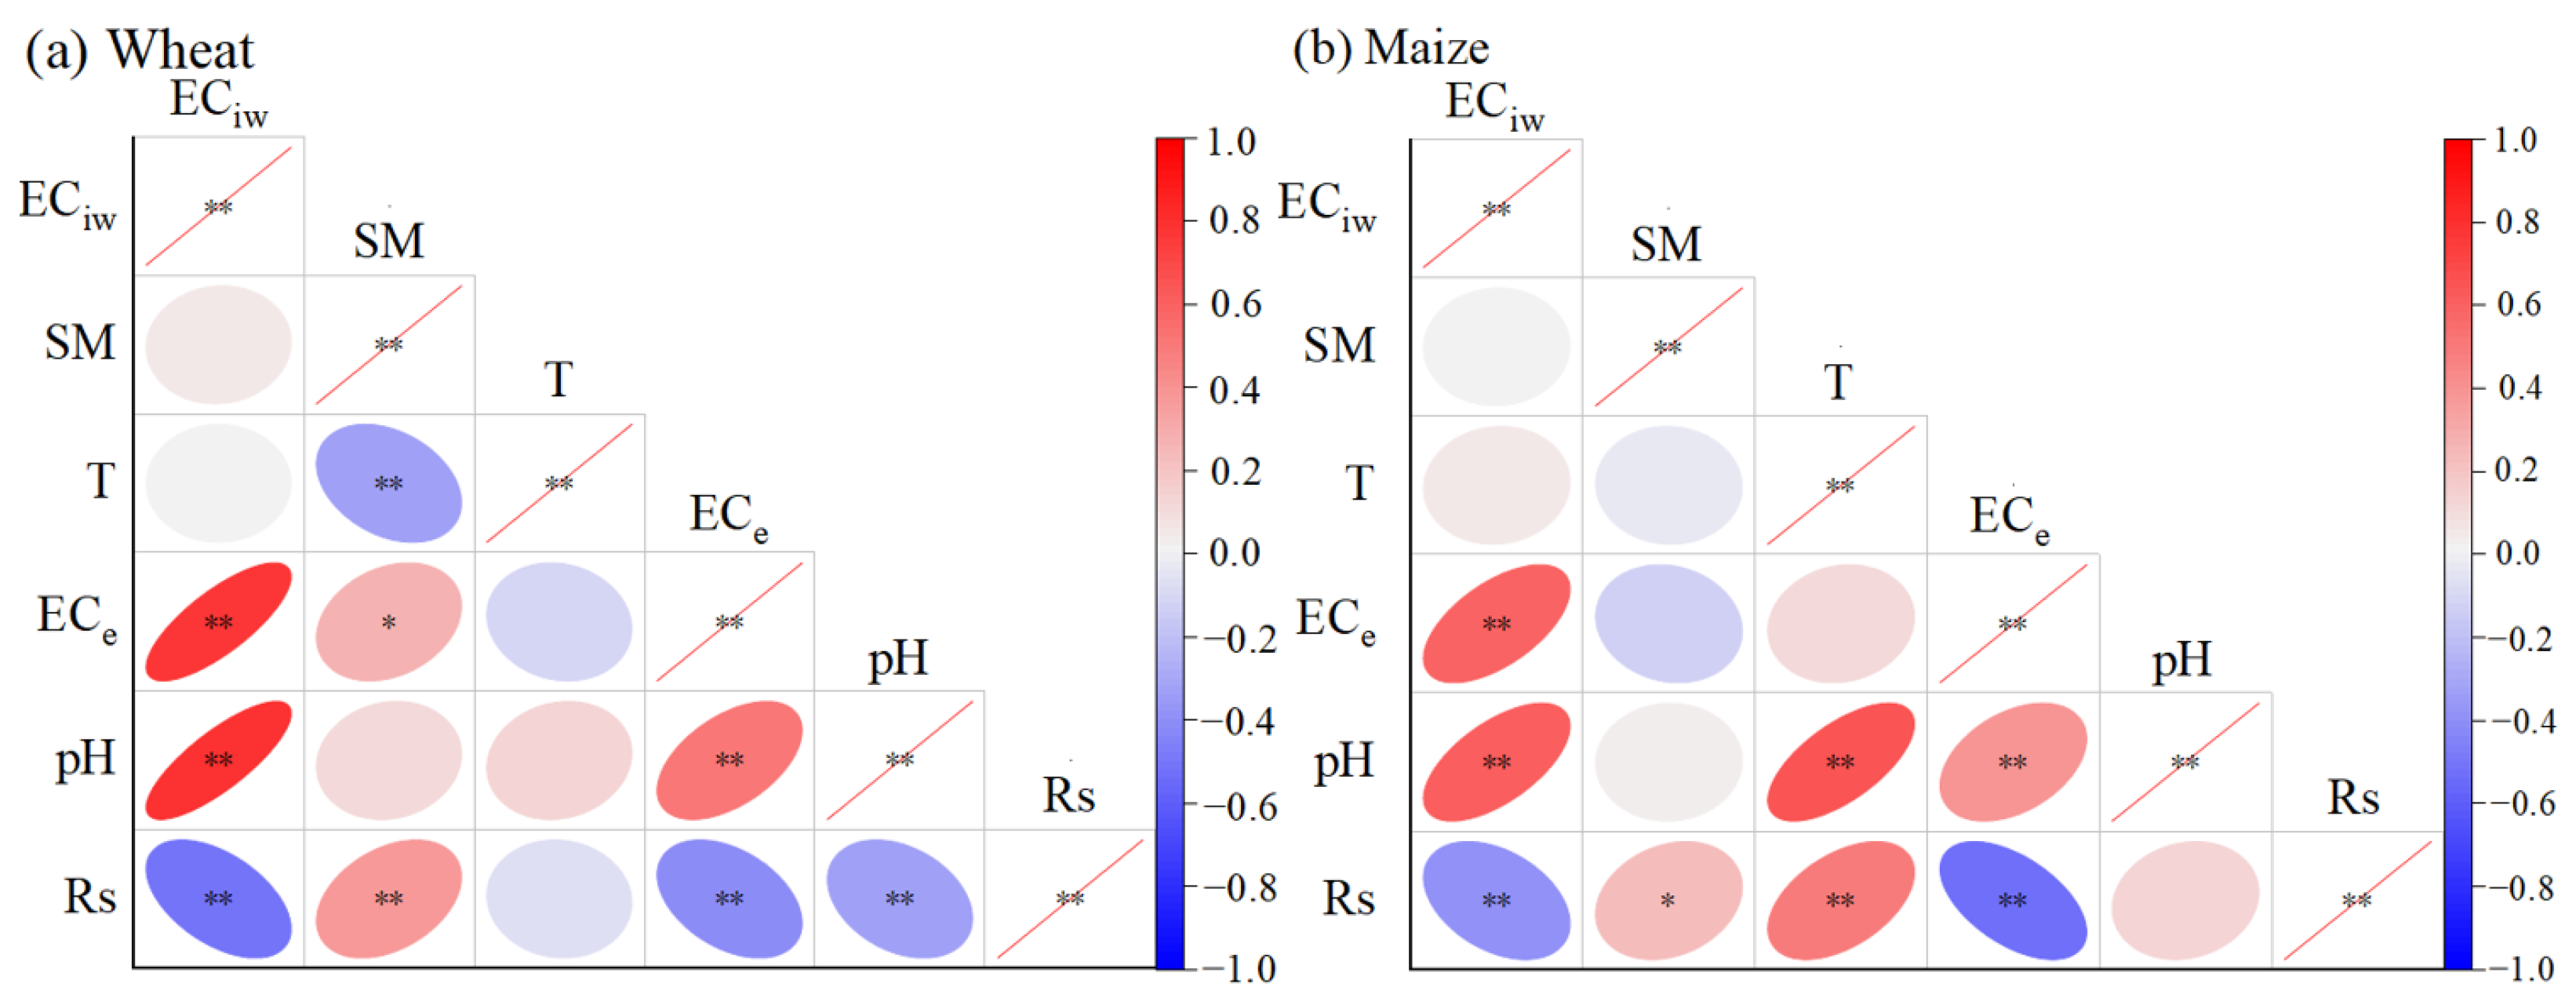
As illustrated in Figure 14, under saline water irrigation, surface SM, soil T, ECe, and pH within the 0–0.1 m soil layer displayed divergent correlations with Rs across the two crop-growing seasons. During the wheat growing season, Rs was highly positively correlated with surface SM (p < 0.01), while exhibiting highly significant negative correlations with surface soil ECe and pH (p < 0.01). In the maize season, Rs demonstrated a significant positive correlation with surface SM (p < 0.05), an extremely significant positive correlation with surface soil T (p < 0.01), and a highly significant negative correlation with surface ECe (p < 0.01).

3.4. Effects of Saline Water Irrigation on Carbon Emission Efficiency and Carbon Balance

3.4.1. Cumulative Soil Carbon Emissions

The cumulative carbon emissions (CE) differed across growth stages and irrigation water salinity levels (Figure 15). For both winter wheat and summer maize, CE initially increased and then decreased across growth stages, while within each stage, CE declined progressively with rising irrigation salinity. At the jointing-to-grain-filling stage: winter wheat CE in T1–T4 decreased by 3.8%, 10.1%, 20.9%, and 24.6% versus CK, with all treatments showing significant differences; summer maize CE decreased by 4.5% (T1), 8.7% (T2), 20.3% (T3), and 28.4% (T4), where T2–T4 differed significantly from CK.

3.4.2. Carbon Emission Efficiency and Carbon Emissions per Unit Water Consumption

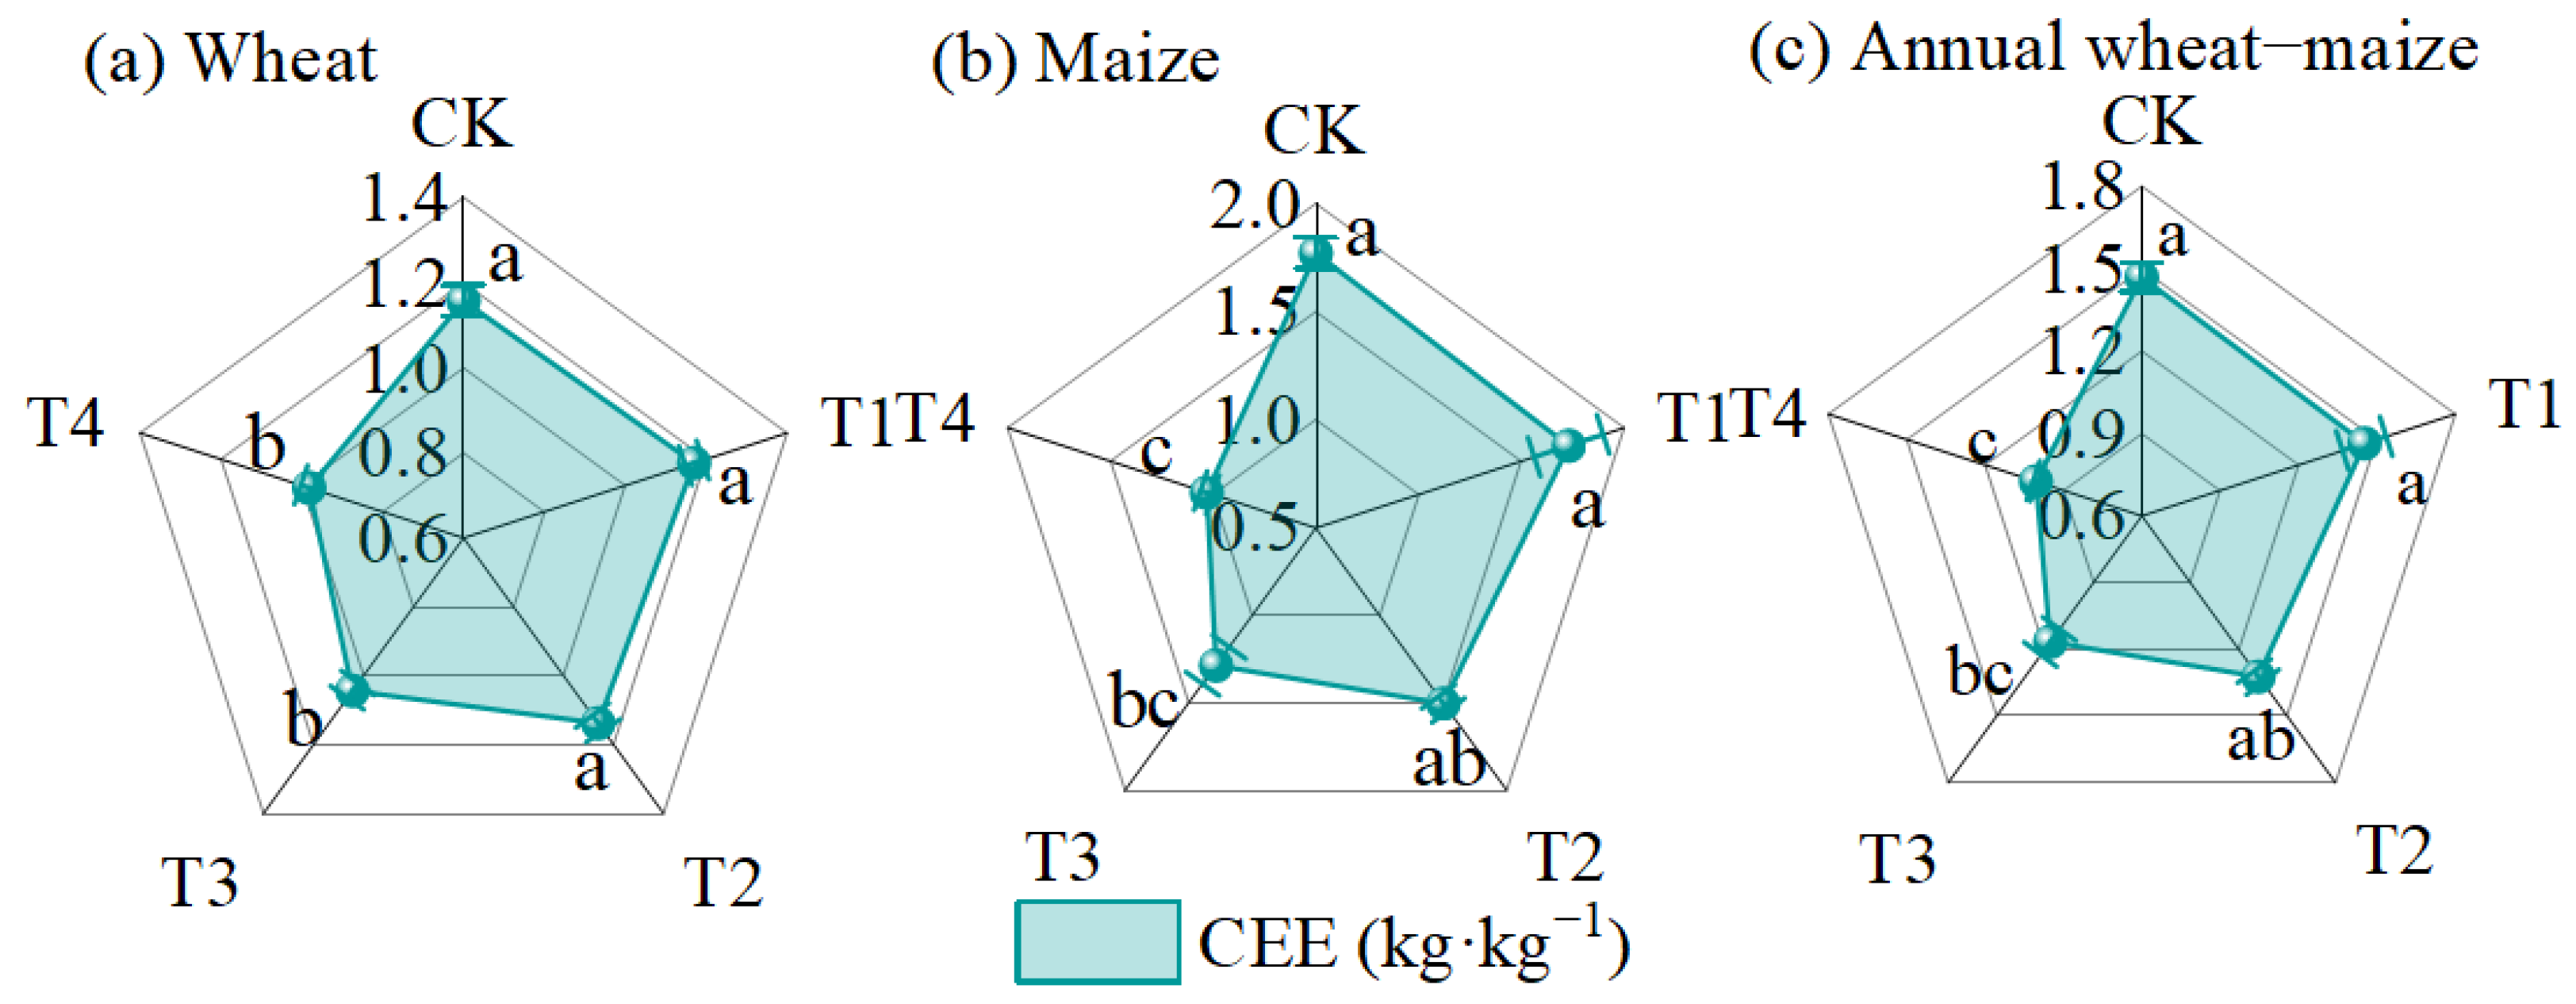
The carbon emission efficiency (CEE) shows a decreasing trend with increasing irrigation water salinity (Figure 16). Compared to CK: wheat-season CEE increased by 1.1% under T1 but decreased by 1.6%, 9.8%, and 15.2% under T2–T4; maize-season CEE decreased by 2.2%, 15.0%, 27.3%, and 41.8% under T1–T4; and annual rotation CEE decreased by 1.1%, 9.9%, 20.6%, and 31.5% under T1–T4. Significant reductions were observed for T3–T4 versus CK in wheat, maize, and wheat–maize rotation systems.
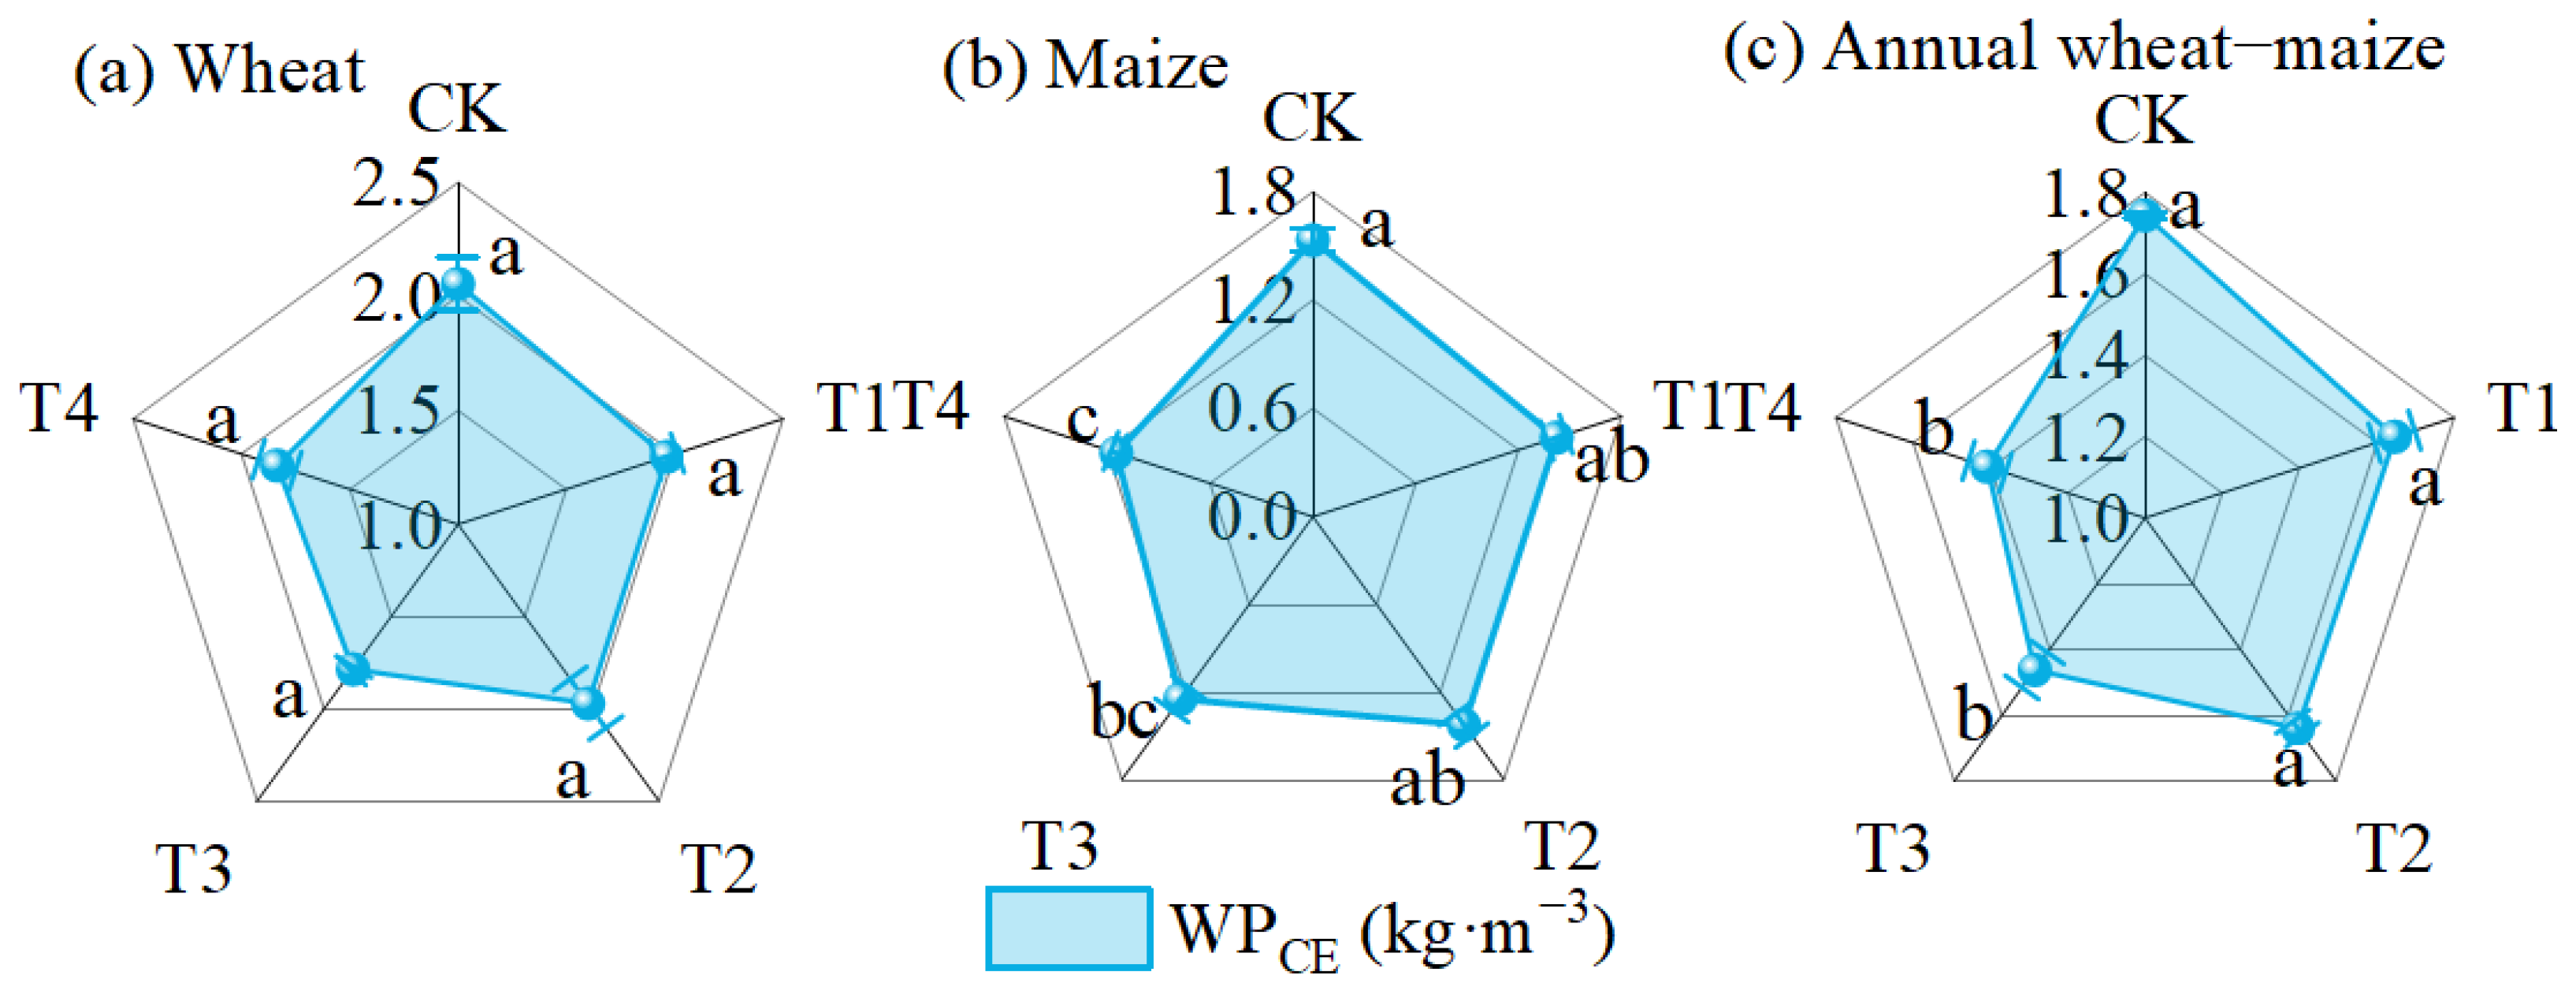
The carbon emissions per unit of water consumption (WPCE) decreased with rising irrigation water salinity in winter wheat, summer maize, and the wheat–maize rotation system (Figure 17). Compared to CK, wheat-season WPCE under T1–T4 decreased by 4.4%, 4.0%, 13.1%, and 10.7%; maize-season WPCE decreased by 7.3%, 7.1%, 18.5%, and 25.3%; and annual rotation WPCE decreased by 5.6%, 6.0%, 16.2%, and 19.2%, with no significant differences observed among wheat-season treatments, but T3–T4 showed significant reductions versus CK in the maize-season and the annual rotation.

3.4.3. Carbon Balance

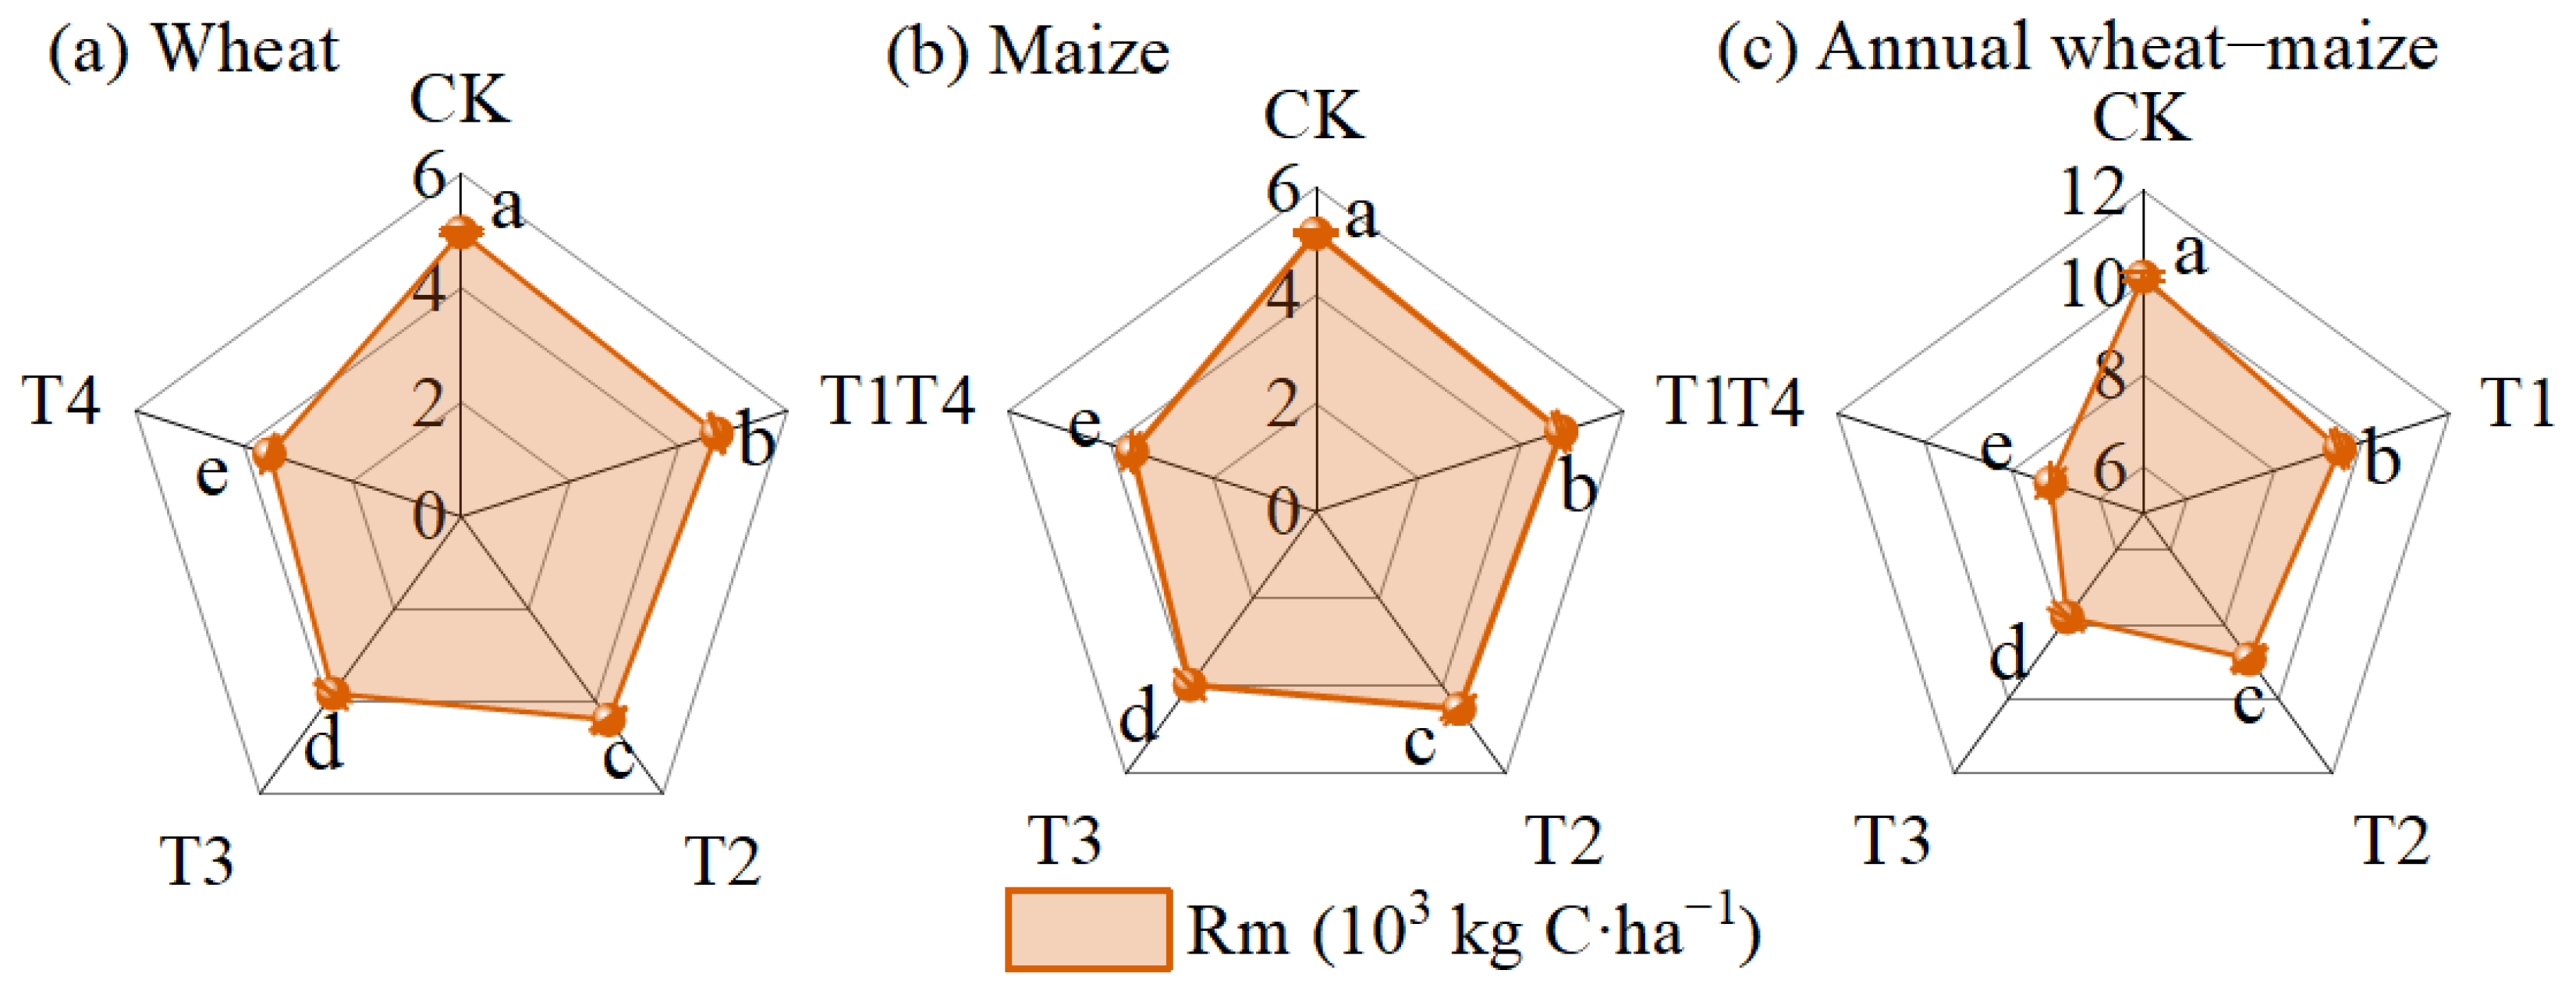
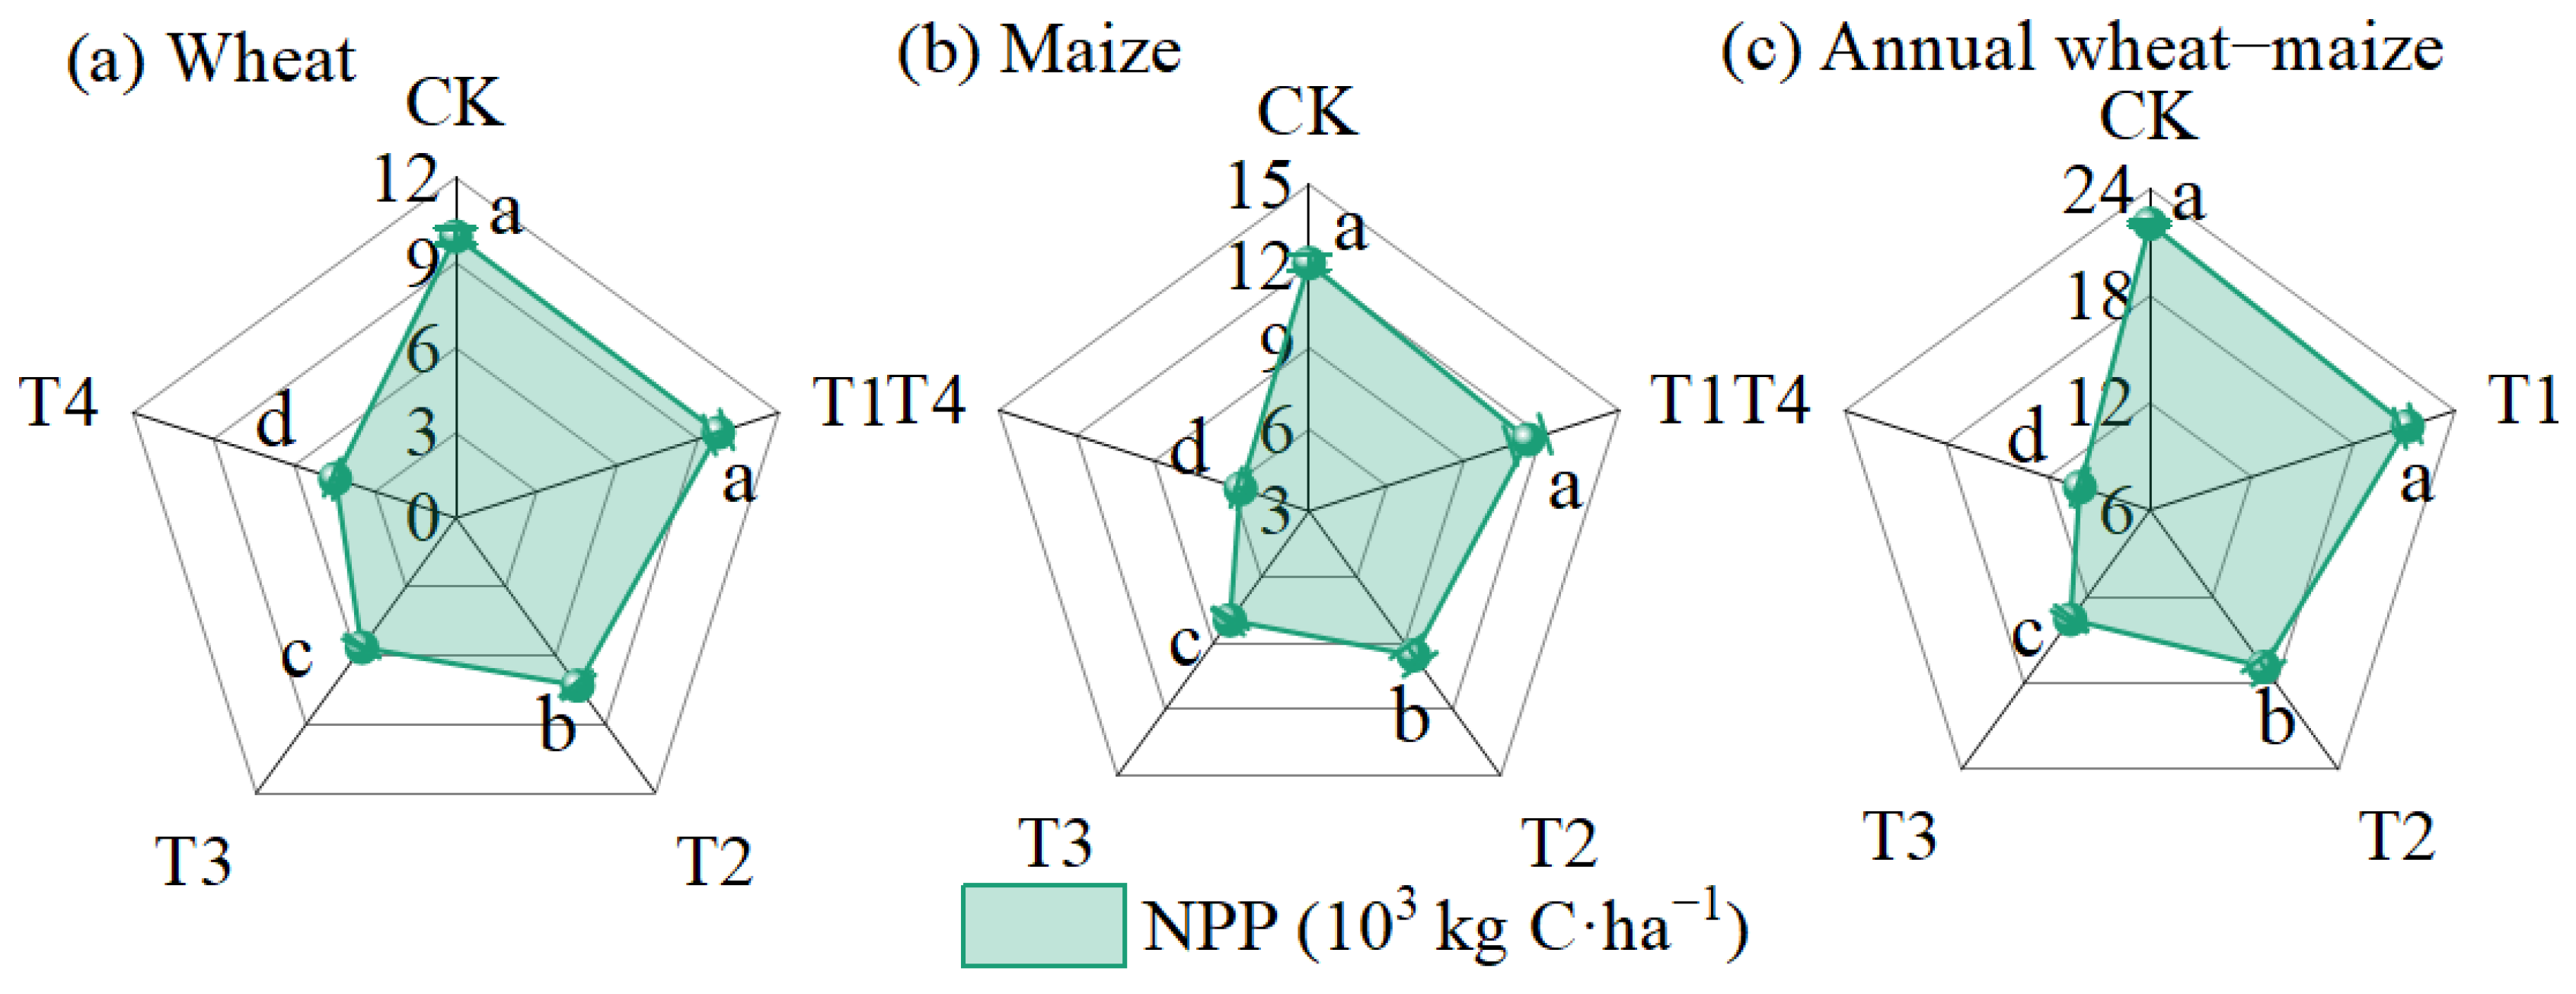
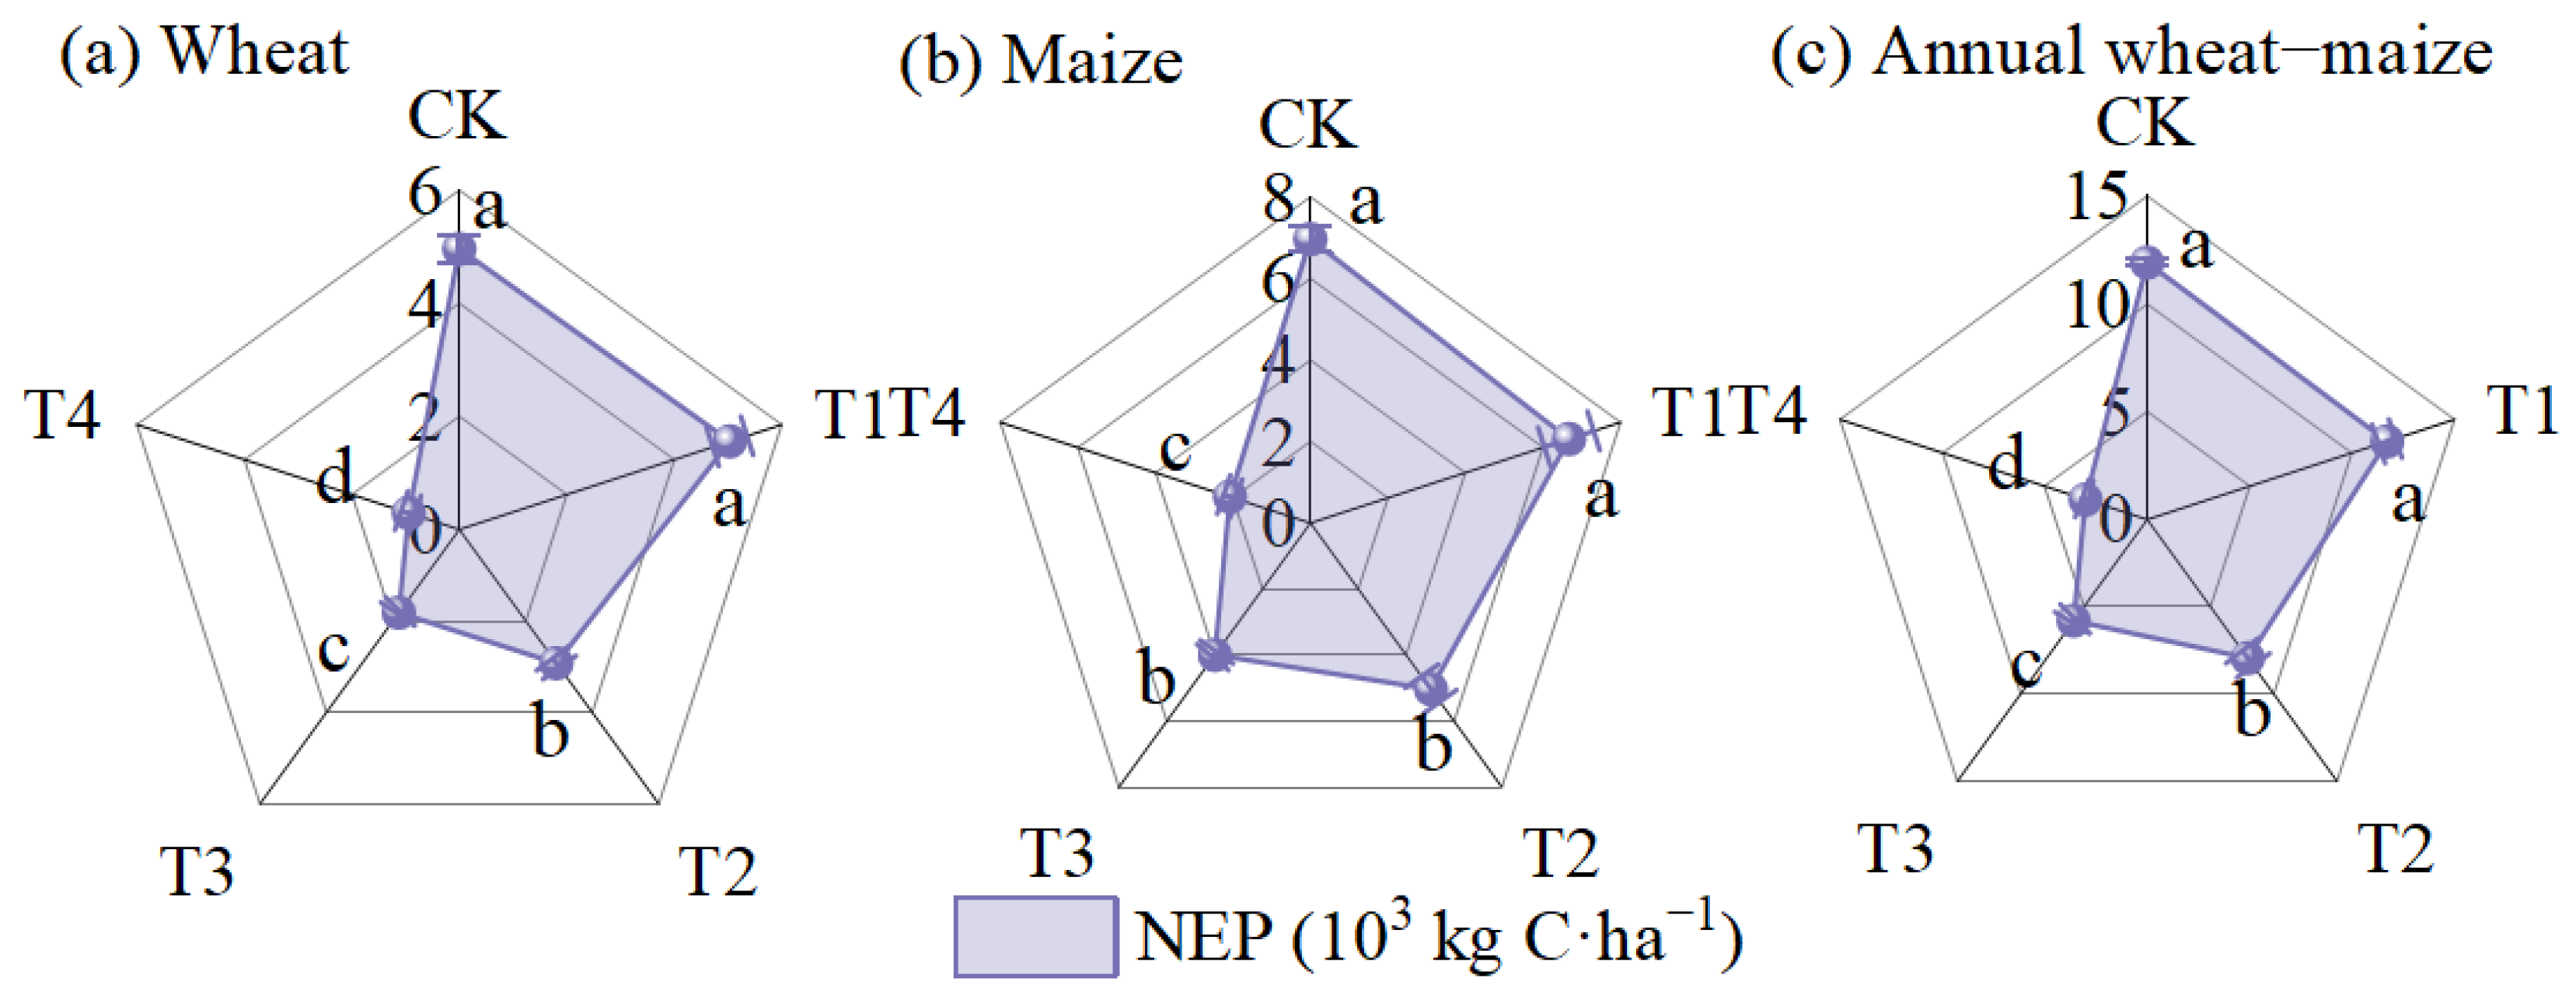
Across wheat, maize, and winter wheat–summer maize rotation systems, Rm, NPP, and NEP progressively declined under saline water irrigation treatments (Figure 18, Figure 19 and Figure 20). Using the winter wheat–summer maize rotation system as an example, Rm decreased by 6.3% (T1), 11.9% (T2), 23.0% (T3), and 29.7% (T4) versus CK, with all treatments showing statistical significance (Figure 18c); for NPP, reductions of 3.8% (T1), 23.5% (T2), 38.3% (T3), and 54.0% (T4) were observed, where T2–T4 differed significantly from CK (Figure 19c), while NEP values remained positive (>0) across treatments, confirming the system’s carbon sink function despite decreasing by 1.7% (T1), 33.2% (T2), 51.3% (T3), and 74.7% (T4), with T2–T4 exhibiting significant reductions (Figure 20c).

3.5. Entropy-Weighted TOPSIS Comprehensive Evaluation Analysis of Optimal Irrigation Schemes

The entropy-weighted TOPSIS model identified optimal irrigation water salinity using seven wheat–maize rotation indicators (Y, WP, CEE, WPCE, NEP, 0–1 m SM, 0–1 m ECe). This matrix was normalized and standardized using Equations (8) and (9). Weights for the standardized matrix were determined with Equations (10)–(13) to construct a weighted matrix; finally, Equations (14)–(18) were applied to calculate the positive and negative ideal solutions for each treatment, the distances to the positive and negative ideal solutions, and the proximity indices. The calculation results are presented in Table 1. Analysis of Table 1 shows that the relative closeness coefficient Ci of each treatment followed the order T1 > CK > T2 > T3 > T4. T1 exhibited the highest Ci, followed by CK, whereas T4 had the lowest Ci. This indicates that treatment T1 performed optimally. As the irrigation water salinity for treatment T1 was 3.4 dS·m−1, this value was identified as the appropriate irrigation water salinity threshold for the winter wheat–summer maize rotation system.

4. Discussion

4.1. Effects of Saline Water Irrigation on Soil Moisture, Salinity, Yields and Water Productivity

The findings of this study demonstrate that higher irrigation water salinity increases soil moisture (SM) and salinity (ECe) in the 0–1 m layer across various growth stages of both crops. Notably, SM decreased and soil ECe increased from sowing to winter wheat harvest, whereas during the maize season, SM increased and soil ECe decreased (Figure 2 and Figure 3). These results indicate salt accumulation during the wheat season and salt leaching during the maize season. This trend may be due to two saline water irrigation events during the winter wheat season, which introduced considerable soluble salts into the soil profile. Sparse precipitation and limited leaching during that period maintained relatively high soil salinity at harvest. In contrast, during the subsequent summer maize growing season, only one saline water irrigation was applied, and relatively abundant rainfall facilitated the leaching of soil salts from the crop root zone. As shown in Figure S2, the leached salts predominantly migrated into soil layers below 1 m. This result aligns with findings from previous studies conducted in the same experimental area [31]. The above results indicate that in agricultural practice, when local shallow saline groundwater is used for irrigation, the salts introduced are mainly accumulated in soil layers below 1 m over the short term as a result of rainfall-induced leaching. In addition, compared with the ECe (2.34 dS·m−1) in the 0–1 m soil layer at the beginning of the experiment (2006), ECe in this layer decreased by 4.6% and 0.1% under the CK and T1 treatments, respectively (Figure S2). This indicates that, under the climatic and irrigation management conditions of this experiment, long-term irrigation with shallow saline groundwater at an appropriate salinity level (≤3.4 dS·m−1) can achieve a balance between salt input and leaching in the crop root zone, thereby preventing salt accumulation and maintaining soil salinity at a relatively stable level.
Irrigation using low-salinity saline water (≤3.4 dS·m−1) exerted no significant impacts on Y and dry matter accumulation of winter wheat and summer maize. By contrast, irrigation with high-salinity saline water imposed adverse influences on Y and WP. Specifically in this experiment, winter wheat and summer maize yields under the T2, T3, and T4 were significantly lower relative to the CK (Figure 5a,b). Likewise, the WP for winter wheat (T3 and T4) (Figure 7a), and summer maize (T2, T3, and T4) declined significantly compared with CK (Figure 7b). These reductions may be attributed to high-salinity irrigation, where the continuous input of salts decreases the proportion of both large and small soil pores [46], which progressively degrades soil structure and reduces permeability [47]. As a result, the availability of soil water and nutrients declines, restricting the downward growth of crop roots [48,49]. This series of changes inhibits crop growth, reduces water productivity, and ultimately leads to yield loss. Linear fitting analysis showed that when Y and WP decreased by 5% and 10%, the corresponding irrigation water salinity thresholds were higher for winter wheat than for summer maize (Figure 8b,d). This difference is mainly due to the inherently greater salt tolerance of winter wheat compared to summer maize [16,50]. Moreover, the relatively limited rainfall throughout the winter wheat growing season limits leaching, resulting in the accumulation of salts introduced through saline water irrigation. This accumulation exacerbates salt stress during the subsequent summer maize growth stage.

4.2. Effects of Saline Water Irrigation on Soil Respiration Rate

Soil salinity, moisture, and temperature are widely recognized as key environmental factors regulating carbon cycling in terrestrial ecosystems [51,52,53]. In this study, elevated salinity of irrigation water causes gradual rises in surface soil ECe and pH throughout the winter wheat and summer maize growing seasons (Figure 11c and Figure 12c). Meanwhile, Rs for both crops showed an extremely significant negative correlation with surface soil ECe (Figure 14). As a consequence, CE during the growing periods of both crops declined progressively as irrigation water salinity increased (Figure 15), consistent with previous studies [24]. This decrease is likely due to salt stress occurring when irrigation water salinity exceeds a certain threshold, which limits the availability of substrates for microbial activity [54]. Such substrate limitation inhibits microbial biomass carbon accumulation [55], ultimately reducing soil respiration. Under high-temperature conditions, the adverse effects are further exacerbated by osmotic imbalance and temperature-related decreases in enzyme activity induced by combined salt-heat stress [56]. The combined impact of these stresses disrupts metabolic balance and enzymatic stability within the soil microbial community [22], thus diminishing the regulatory role of soil pH in soil respiration processes. As a result, no significant correlation was detected between Rs and surface soil pH in the warmer maize growing season (Figure 14). Additionally, peak Rs for both crops predominantly occurred after irrigation and rainfall events (Figure 13a,b). This is likely due to the redistribution of salts and increased soil moisture following irrigation and precipitation, which stimulate microbial activity and consequently enhance soil respiration [57]. As irrigation water salinity rose, both average surface SM and soil T showed an upward trend throughout the winter wheat and summer maize growth periods (Figure 9c and Figure 10c). However, the relationships between Rs and surface SM or soil T varied markedly by season. During the winter wheat season, Rs displayed an extremely significant positive correlation with surface SM (p < 0.01), whereas no significant correlation was observed with surface soil T (Figure 14). This may be because the commonly observed positive correlation between soil respiration and temperature is influenced by soil moisture content, resulting in fluctuations [58]. Throughout the experiment, limited rainfall during the wheat growing season led to low soil moisture; under these conditions, microbial activity was suppressed, and the temperature sensitivity of soil respiration declined [59]. Therefore, soil moisture was the primary regulatory factor throughout the growing wheat season. In contrast, Rs exhibited an extremely significant positive correlation with surface soil T (p < 0.01) and a significant positive correlation with surface SM (p < 0.05) during the summer maize season (Figure 14), which aligns with the results reported by Zhang et al. [36]. This can be explained by higher soil temperatures enhancing the availability of the soil carbon pool, thereby stimulating microbial activity and increasing soil CO2 emissions [60]. Furthermore, as the maize growing season is relatively wet, soil microbial communities display higher sensitivity to changes in soil temperature under moist conditions [36]. Therefore, soil temperature plays a more prominent role than soil moisture in regulating soil respiration during the maize growth period.

4.3. Effects of Saline Irrigation on Water and Carbon Use Efficiency, Carbon Balance, and Comprehensive Assessment via the Entropy-Weighted TOPSIS Method

As irrigation water salinity rose, the CEE of the winter wheat–summer maize rotation system showed a gradual decline (Figure 16c). This trend is primarily due to asynchronous reductions in grain yield and system carbon emissions. Relative to the CK, yields and CE under T1–T4 treatments decreased by 7.1–51.8% and 6.3–29.7%, respectively (Figure 5c and Figure 18c). This phenomenon can be attributed to osmotic stress and ion toxicity caused by salinity stress, which restrict crop photosynthesis [61], resulting in a marked yield reduction. Concurrently, the accumulation of soil salinity inhibits soil microbial activity, thus decreasing carbon emissions [62]. However, under the experimental conditions of this study, the decrease in yield under saline water irrigation consistently exceeded the reduction in carbon emissions, ultimately leading to a downward trend in CEE. Additionally, for the winter wheat–summer maize rotation system, WPCE of the T1 treatment declined by 5.6% relative to the CK treatment (Figure 17c). These results demonstrate that saline water irrigation at a suitable salinity level (3.4 dS·m−1) is able to lower carbon emissions of the cropping system and moderately modulate water consumption. Meanwhile, no significant difference in WP was observed between the T1 treatment and CK (Figure 7c). This indicates that saline water irrigation at a suitable salinity level can, to some extent, maintain the efficiency of converting water consumption into crop yield while reducing the conversion of water use into carbon emissions [37].
Achieving carbon sequestration and emission reduction in farmland requires both increasing carbon sequestration capacity and decreasing carbon emission intensity [63]. The results showed that NPP in the winter wheat–summer maize rotation system declined progressively with higher irrigation water salinity increased; however, the difference between the T1 and CK was not statistically significant (Figure 19c). This phenomenon may result from irrigation with saline water at an appropriate salinity, which supplies essential mineral nutrients for crop growth, thereby maintaining or even enhancing crop physiological activity [64]. As a result, dry matter accumulation remains relatively stable [65], ultimately ensuring the stability of system NPP. Additionally, saline water irrigation significantly reduced Rm in the winter wheat–summer maize rotation system (Figure 18c), possibly because salt input decreased the relative abundance of soil carbon-degrading genes [66], thus weakening the intensity of microbial heterotrophic respiration. Due to the distinct responses of NPP and Rm to saline water irrigation, the NEP of all treatments remained positive, indicating a sustained carbon sink. Moreover, system NEP gradually declined with increasing irrigation water salinity, but only the difference between the T1 and CK treatments was not statistically significant (Figure 20c). This may be because saline water irrigation at an appropriate salinity level maintains the system’s carbon fixation rate, thus ensuring the stability of its carbon sink function [67]. In contrast, high-salinity saline water irrigation significantly inhibits crop growth [68], thereby reducing the system’s carbon sequestration capacity and ultimately impeding efforts to mitigate global warming.
The relative closeness coefficient (Ci) calculated using the entropy-weighted TOPSIS model was used to rank the irrigation treatments in order of superiority, yielding the sequence: T1 > CK > T2 > T3 > T4 (Table 1). This outcome indicates that, within the winter wheat–summer maize rotation system, treatment T1 (irrigated with saline water at 3.4 dS·m−1) achieved the best overall performance and was better suited to meet the system’s requirements for stable yield and water and carbon use efficiency. Based on the FAO crop salt tolerance classification standards [16], this salinity level is below the critical threshold for wheat (6.0 dS·m−1) but exceeds the tolerance limit for maize (1.7 dS·m−1). Results from this study indicate that saline water irrigation at 3.4 dS·m−1 did not significantly reduce summer maize yield or net carbon input, indicating that, under the geographical and climatic conditions of this experiment, this salinity threshold can maintain overall stability in crop growth and carbon sink function. From the perspective of groundwater environmental safety, in actual agricultural production, the salts introduced into the soil through irrigation with local shallow saline groundwater originate from the regional shallow saline groundwater itself. Driven by leaching processes associated with abundant rainfall and irrigation, these salts can gradually return to the regional shallow saline groundwater system [69], thereby maintaining a dynamic equilibrium in groundwater salinity and exerting no significant negative impact on the regional groundwater environment. Overall, under the winter wheat–summer maize rotation system on the North China Plain, irrigation with saline water at a salinity of 3.4 dS·m−1 enables a dynamic equilibrium between salt leaching and accumulation in the root zone. This approach supports stable crop production and maintains the carbon sink capacity of farmland ecosystems. These findings offer valuable guidance for regions in China and neighboring coastal areas where freshwater resources are limited and saline water is abundant. Given that the leaching and migration of soil salts are jointly regulated by water supply conditions such as rainfall and irrigation [70], it is recommended to supplement with freshwater irrigation during dry periods, combined with agronomic measures such as straw mulching and optimized planting density [71], to further promote the long-term sustainable use of shallow saline groundwater resources.

5. Conclusions

The findings indicate that saline water irrigation leads to salt build-up during the wheat season, whereas salt leaching predominantly occurs in the subsequent maize season. Irrigation with water of high salinity hindered the growth of crops and negatively impacted water productivity in winter wheat and summer maize. Rising irrigation water salinity led to a gradual decrease in soil respiration rates and cumulative carbon emissions throughout both crop seasons. In the wheat season, soil respiration showed a positive association with soil moisture, but was inhibited by elevated soil salinity and pH levels. During the maize season, soil respiration was primarily influenced by soil temperature and moisture (both positively), while higher soil salinity exerted a negative effect. Under saline water irrigation with a salinity not exceeding 3.4 dS·m−1, the two-crop rotation system exhibited stable carbon emission efficiency and crop yield, with no notable reductions observed. In contrast, when salinity exceeded 3.4 dS·m−1, net carbon input in the winter wheat–summer maize rotation system declined significantly. Taking into account soil moisture and salinity conditions, water and carbon use efficiency, yield performance, and the stability of the system’s carbon sink function, an irrigation water salinity threshold of 3.4 dS·m−1 is advisable.
Owing to experimental limitations, deep percolation in this study was estimated based on empirical formulas. To further refine parameter calibration and improve the precision of water-balance evaluation, future studies should incorporate long-term, site-specific monitoring of this variable.

Supplementary Materials

The following supporting information can be downloaded at: https://www.mdpi.com/article/10.3390/agronomy16171720/s1, Figure S1: Precipitation during the winter wheat–summer maize growing seasons from 1976 to 2025; Figure S2: Soil salinity (ECe, dS·m−1) profile distribution within the 0–6.8 m soil layer following the summer maize harvest in 2024–2025.

Author Contributions

X.J.: Conceptualization, investigation, validation, data curation, writing—original draft. C.C.: Conceptualization, data curation, writing—review and editing. Y.Z.: Supervision, investigation. C.Z.: Investigation, formal analysis, supervision. H.D.: Formal analysis, project administration, resources. Z.M.: Writing—review and editing. A.Z.: Data curation, writing—review and editing. J.Z.: Conceptualization, data curation, funding acquisition. All authors have read and agreed to the published version of the manuscript.

Funding

This research was supported by the National Key Research and Development Program of China (Grant No. 2023YFD1902605), the Natural Science Foundation of Shandong Province (Grant No. ZR2023ME017), and the Open Research Fund of Hebei Province Key Laboratory of Crop Drought Resistance Research (Grant No. 2025HZSKFKT02).

Data Availability Statement

Individuals interested in the data used in this manuscript may obtain access by contacting the corresponding author. The reason for this restriction is that the data are not publicly available for privacy reasons.

Acknowledgments

We express our gratitude to the reviewers and editors for their valuable feedback on the manuscript.

Conflicts of Interest

The authors declare no conflicts of interest.

References

  1. Thevs, N.; Strenge, E.; Aliev, K.; Eraaliev, M.; Lang, P.; Baibagysov, A.; Xu, J. Tree Shelterbelts as an Element to Improve Water Resource Management in Central Asia. Water 2017, 9, 842. [Google Scholar] [CrossRef] [Scilit]
  2. Amico, A.L.; Koloffon, R. Challenges and opportunities for building resilient agrifood systems in food crisis contexts. Glob. Food Secur. 2025, 45, 100849. [Google Scholar] [CrossRef] [Scilit]
  3. Touch, V.; Utomo, A.; Harrigan, N.; Finlayson, C.; McGregor, A.; McKinnon, K.; Tran, T.A.; Bannan, L.A.; Tan, D.K.Y.; Sophanara, P.; et al. Reshaping agricultural production systems: Trade-offs and implications for sustainable intensification and environment management. Agric. Syst. 2025, 230, 104484. [Google Scholar] [CrossRef] [Scilit]
  4. World Resources Institute. 25 Countries, Housing One-Quarter of the Population, Face Extremely High Water Stress. Available online: https://www.wri.org/insights/highest-water-stressed-countries (accessed on 5 August 2026).
  5. FAO. Saline Waters as Resources. Available online: https://openknowledge.fao.org/server/api/core/bitstreams/77ceb977-74cf-4367-9491-3ccd2396fb10/content/t0667e05.htm (accessed on 5 August 2026).
  6. Wang, Q.; Huo, Z.; Zhang, L.; Wang, J.; Zhao, Y. Impact of saline water irrigation on water use efficiency and soil salt accumulation for spring maize in arid regions of China. Agric. Water Manag. 2016, 163, 125–138. [Google Scholar] [CrossRef] [Scilit]
  7. Hao, Z.; Ye, S.; Cai, D.; Feng, X.; Sun, T.; Zhang, L.; Mi, G. Strip planting strategy enhances annual crop productivity in winter wheat–summer maize rotation system. Field Crops Res. 2026, 345, 110571. [Google Scholar] [CrossRef] [Scilit]
  8. Zhao, J.; Yang, Y.; Meki, M.N.; Worqlul, A.W.; Jeong, J.; Zang, H.; Zeng, Z. Alleviating water scarcity by alternative cropping systems in the North China Plain. npj Sustain. Agric. 2026, 4, 33. [Google Scholar] [CrossRef] [Scilit]
  9. Ma, Y.; Dang, H.; Li, K.; Zheng, C.; Cao, C.; Zhang, J.; Li, Q. Effects of brackish water irrigation on grain quality characteristics and yield of winter wheat. Chin. J. Appl. Ecol. 2022, 33, 1063–1068. (In Chinese) [Google Scholar] [CrossRef] [Scilit] [PubMed]
  10. Wei, C.; Li, F.; Yang, P.; Ren, S.; Wang, S.; Wang, Y.; Xu, Z.; Xu, Y.; Wei, R.; Zhang, Y. Effects of Irrigation Water Salinity on Soil Properties, N2O Emission and Yield of Spring Maize under Mulched Drip Irrigation. Water 2019, 11, 1548. [Google Scholar] [CrossRef] [Scilit]
  11. Zhang, M.; Yang, P.; Ren, S.; Xu, Z.; Wei, C.; He, X. Effects of Irrigation Water Salinity and Irrigation Amount on Soil Water and Salt Distribution and Spring Maize Growth. J. Soil Water Conserv. 2022, 36, 290–298. (In Chinese) [Google Scholar] [CrossRef]
  12. Liu, K.; Ge, P. Effects of irrigation amount and salinity on yield and water use efficiency of maize. Hydro Sci. Cold Zone Eng. 2020, 3, 13–16. (In Chinese) [Google Scholar]
  13. Liu, Z.; Zhang, T.; Liang, Q.; Hu, X.; Cheng, Y.; Yan, S.; Feng, H. Effects of Saline Water Irrigation with Different Concentrations on Soil Water and Salt Distribution and Growth of Winter Wheat. J. Soil Water Conserv. 2024, 38, 378–386. (In Chinese) [Google Scholar] [CrossRef]
  14. Liu, Z.; Gao, C.; Yan, Z.; Shao, L.; Chen, S.; Niu, J.; Zhang, X. Effects of long-term saline water irrigation on soil salinity and crop production of winter wheat-maize cropping system in the North China Plain: A case study. Agric. Water Manag. 2024, 303, 109060. [Google Scholar] [CrossRef] [Scilit]
  15. Zhang, W.; Zhang, Z.; Zhang, X.; Wei, Y.; Xiong, S.; Wang, X.; Ma, X. Effects of Different Nitrogen Application Rates on Nitrogen Use in Wheat-Maize Rotation System. J. Henan Agric. Univ. 2024, 58, 562–572. Available online: https://qikan.cqvip.com/Qikan/Article/Detail?id=7112664390 (accessed on 5 August 2026).
  16. Maas, E.V.; Grattan, S.R. Crop Salt Tolerance (Annex 1). In FAO Irrigation and Drainage Paper 44; Food and Agriculture Organization of the United Nations: Rome, Italy, 1999; Available online: https://www.fao.org/3/y4263e/y4263e0e.htm (accessed on 5 August 2026).
  17. IPCC. Climate Change 2021: The Physical Science Basis; Cambridge University Press: Cambridge, UK, 2021. [Google Scholar] [CrossRef] [Scilit]
  18. Masson-Delmotte, V.; Zhai, P.; Pirani, A.; Connors, S.L.; Péan, C.; Berger, S.; Caud, N.; Chen, Y.; Goldfarb, L.; Gomis, M.I.; et al. Global Carbon and Other Biogeochemical Cycles and Feedbacks. In Climate Change 2021: The Physical Science Basis; Contribution of Working Group I to the Sixth Assessment Report of the Intergovernmental Panel on Climate Change; Cambridge University Press: Cambridge, UK; New York, NY, USA, 2023; pp. 673–816. [Google Scholar] [CrossRef] [Scilit]
  19. Zhang, Y.; Osborne, B.; Dang, S.; Zou, J. The effects of straw return and tillage depth on soil respiration and soil organic carbon: Implications for improving the sustainability of agro-ecosystems in China. Eur. J. Agron. 2025, 168, 127630. [Google Scholar] [CrossRef] [Scilit]
  20. Lei, J.; Guo, X.; Zeng, Y.; Zhou, J.; Gao, Q.; Yang, Y. Temporal changes in global soil respiration since 1987. Nat. Commun. 2021, 12, 403. [Google Scholar] [CrossRef] [Scilit] [PubMed]
  21. Yang, Y.; Li, T.; Pokharel, P.; Liu, L.; Qiao, J.; Wang, Y.; An, S.; Chang, S.X. Global effects on soil respiration and its temperature sensitivity depend on nitrogen addition rate. Soil Biol. Biochem. 2022, 174, 108814. [Google Scholar] [CrossRef] [Scilit]
  22. Zhao, J.; Kou, X.; Liu, H.; Wu, T.; Li, J.; Wang, Y.; Xie, H.; Wang, M.; Wu, L.; Wen, L.; et al. Microbial Community Responses and Functional Shifts in Carbon Degradation Driven by Water-salt Gradients in Lakeshore Wetlands of Semi-arid Lakes. J. Environ. Manag. 2025, 393, 126893. [Google Scholar] [CrossRef] [Scilit] [PubMed]
  23. Franco-Luesma, S.; Cavero, J.; Plaza-Bonilla, D.; Cantero-Martínez, C.; Arrúe, J.L.; Álvaro-Fuentes, J. Tillage and irrigation system effects on soil carbon dioxide (CO2) and methane (CH4) emissions in a maize monoculture under Mediterranean conditions. Soil Tillage Res. 2020, 196, 104488. [Google Scholar] [CrossRef] [Scilit]
  24. Zhou, S.; Gao, Y.; Zhang, J.; Pang, J.; Hamani, A.K.M.; Xu, C.; Dang, H.; Cao, C.; Wang, G.; Sun, J. Impacts of Saline Water Irrigation on Soil Respiration from Cotton Fields in the North China Plain. Agronomy 2023, 13, 1197. [Google Scholar] [CrossRef] [Scilit]
  25. Wei, C.; Ren, S.; Yang, P.; Wang, Y.; He, X.; Xu, Z.; Wei, R.; Wang, S.; Chi, Y.; Zhang, M. Effects of irrigation methods and salinity on CO2 emissions from farmland soil during growth and fallow periods. Sci. Total Environ. 2021, 752, 141639. [Google Scholar] [CrossRef] [Scilit] [PubMed]
  26. World Meteorological Organization (WMO). Guide to Hydrological Practices, Volume II: Management of Water Resources and Applications of Hydrological Practices; World Meteorological Organization: Geneva, Switzerland, 2009; WMO-No. 168. [Google Scholar]
  27. Cheng, W.; Li, K.; Fu, Y.; Liu, P.; Li, M.; Feng, X.; Zeng, Y. Evolution characteristics and driving mechanisms of deep groundwater depth in the North China Plain: A case study of Hengshui City. South-To-North Water Transf. Water Sci. Technol. 2026, 24, 323–333. (In Chinese) [Google Scholar] [CrossRef]
  28. Wang, J.; Zhang, G.; Yan, M.; Li, Y.; Zhou, Z. Analysis of soil salinity distribution and influencing factors in area around Bohai sea. J. Arid Land Resour. Environ. 2012, 26, 104–109. (In Chinese) [Google Scholar] [CrossRef]
  29. Sun, H.; Liu, X.; Zhang, X. Regulations of salt and water of saline-alkali soil: A review. Chin. J. Eco-Agric. 2018, 26, 1528–1536. (In Chinese) [Google Scholar] [CrossRef]
  30. Zhou, X.; Liu, S.; Wang, Z.; Zhou, Z. The chemical characteristics and available analysis of shallow groundwater in the typical area of plain of North China—Take Hengshui in example. Water Sci. Eng. Technol. 2008, 56–59. (In Chinese) [Google Scholar] [CrossRef]
  31. Zhang, J.; Wang, H.; Feng, D.; Cao, C.; Zheng, C.; Dang, H.; Li, K.; Gao, Y.; Sun, C. Evaluating the impacts of long-term saline water irrigation on soil salinity and cotton yield under plastic film mulching: A 15-year field study. Agric. Water Manag. 2024, 293, 108703. [Google Scholar] [CrossRef] [Scilit]
  32. Zhang, J.; Li, K.; Zheng, C.; Cao, C.; Sun, C.; Dang, H.; Feng, D.; Sun, J. Cotton Responses to Saline Water Irrigation in the Low Plain around the Bohai Sea in China. J. Irrig. Drain. Eng. 2018, 144, 04018027. [Google Scholar] [CrossRef] [Scilit]
  33. Oweis, T.Y.; Farahani, H.J.; Hachum, A.Y. Evapotranspiration and water use of full and deficit irrigated cotton in the Mediterranean environment in northern Syria. Agric. Water Manag. 2011, 98, 1239–1248. [Google Scholar] [CrossRef] [Scilit]
  34. Ertek, A.; Şensoy, S.; Gedik, İ.; Küçükyumuk, C. Irrigation scheduling based on pan evaporation values for cucumber (Cucumis sativus L.) grown under field conditions. Agric. Water Manag. 2005, 81, 159–172. [Google Scholar] [CrossRef] [Scilit]
  35. Zhang, J.; Sun, J.; Duan, A.; Wang, J.; Shen, X.; Liu, X. Effects of different planting patterns on water use and yield performance of winter wheat in the Huang-Huai-Hai plain of China. Agric. Water Manag. 2007, 92, 41–47. [Google Scholar] [CrossRef] [Scilit]
  36. Zhang, J.; Li, P.; Li, L.; Zhao, M.; Yan, P.; Liu, Y.; Li, W.; Ding, S.; Zhao, Q. Soil respiration and carbon sequestration response to short-term fertilization in wheat-maize cropping system in the North China Plain. Soil Tillage Res. 2025, 251, 106536. [Google Scholar] [CrossRef] [Scilit]
  37. Hu, F.; Chai, Q.; Gan, Y.; Yin, W.; Zhao, C.; Feng, F. Characteristics of Soil Carbon Emission and Water Utilization in Wheat/Maize Intercropping with Minimal/Zero Tillage and Straw Retention. Sci. Agric. Sin. 2016, 49, 120–131. (In Chinese) [Google Scholar] [CrossRef]
  38. Ren, L.; Zhao, W.; Li, J.; Chen, J.; Li, Y.; Zou, H.; Zhang, Y. Characteristics of Soil CO2 Emission and Carbon Balance in Greenhouse Soil under Different Fertilization Patterns. Chin. J. Soil Sci. 2022, 53, 874–881. (In Chinese) [Google Scholar] [CrossRef]
  39. Zhang, Y.; Zhang, H.; Chen, J.; Chen, F. Tillage Effects on Soil Respiration and Contributions of Its Components in Winter Wheat Field. Sci. Agric. Sin. 2009, 42, 3354–3360. (In Chinese) [Google Scholar] [CrossRef]
  40. Huang, B.; Wang, J.; Gong, Y.; Stahr, K.; Yang, Q. Soil Respiration and Carbon Balance in Winter Wheat and Summer Maize Fields. J. Agro-Environ. Sci. 2006, 25, 156–160. (In Chinese) [Google Scholar] [CrossRef]
  41. Lei, X.; Qiu, R.; Liu, Y. Evaluation of Regional Land Use Performance Based on Entropy TOPSIS Model and Diagnosis of its Obstacle Factor. Trans. Chin. Soc. Agric. Eng. 2016, 32, 243. (In Chinese) [Google Scholar] [CrossRef]
  42. Zou, X.; Xie, M.; Xiao, Z.; Wu, T.; Yin, Y. Evaluation of Rural Development and Diagnosis of Obstacle Factors Based on Entropy Weight Topsis Method. Chin. J. Agric. Resour. Reg. Plan. 2021, 42, 197–206. (In Chinese) [Google Scholar] [CrossRef]
  43. Xia, X.; Gong, X. Measurement and evaluation of high-quality development level of beer manufacturing enterprises based on entropy weight-TOPSIS method: A case study of Tsingtao Brewery. Commer. Account. 2026, 76–80. (In Chinese) [Google Scholar]
  44. Zhang, J.; Qiu, H. Financial Risk Evaluation of ST Huaying Based on Entropy Weighted—TOPSIS Method. J. Hunan Univ. Financ. Econ. 2026, 42, 41–51. (In Chinese) [Google Scholar] [CrossRef]
  45. Song, L.; Liu, J.; Tian, J. Comprehensive Evaluation of Multi-Water Source Joint Irrigation for Alfalfa in Saline-Alkali Land Based on Entropy Weight—TOPSIS Model. China Rural Water Hydropower 2026, 211–220. (In Chinese) [Google Scholar] [CrossRef]
  46. Hu, X.; Zhang, T.; Zhang, T.; Liu, Z.; Cheng, Y.; Liang, Q.; Feng, H. Effects of brackish water cation compositions on soil pore structure under submembrane drip irrigation. Agric. Res. Arid Areas 2024, 42, 173–181. (In Chinese) [Google Scholar] [CrossRef]
  47. Rahimi, L.; Amanipoor, H.; Looie, S.B. Effect of salinity of irrigation water on soil properties (abadan plain, SW Iran). Geocarto Int. 2019, 36, 1884–1903. [Google Scholar] [CrossRef] [Scilit]
  48. Min, W.; Guo, H.; Zhou, G.; Zhang, W.; Ma, L.; Ye, J.; Hou, Z. Root distribution and growth of cotton as affected by drip irrigation with saline water. Field Crops Res. 2014, 169, 1–10. [Google Scholar] [CrossRef] [Scilit]
  49. Chen, W.; Jin, M.; Ferré, T.P.A.; Liu, Y.; Xian, Y.; Shan, T.; Ping, X. Spatial distribution of soil moisture, soil salinity, and root density beneath a cotton field under mulched drip irrigation with brackish and fresh water. Field Crops Res. 2018, 215, 207–221. [Google Scholar] [CrossRef] [Scilit]
  50. Isla, R.; Aragüés, R. Yield and Plantion Concentrations in Maize (Zea mays L.) Subject to Diurnal and Nocturnal Saline Sprinkler Irrigations. Field Crops Res. 2009, 116, 175–183. [Google Scholar] [CrossRef] [Scilit]
  51. Rath, K.M.; Rousk, J. Salt effects on the soil microbial decomposer community and their role in organic carbon cycling: A review. Soil Biol. Biochem. 2015, 81, 108–123. [Google Scholar] [CrossRef] [Scilit]
  52. Singh, S.; Mayes, M.A.; Shekoofa, A.; Kivlin, S.N.; Bansal, S.; Jagadamma, S. Soil organic carbon cycling in response to simulated soil moisture variation under field conditions. Sci. Rep. 2021, 11, 10841. [Google Scholar] [CrossRef] [Scilit] [PubMed]
  53. Ren, S.; Zhong, J.; Wang, K.; Liu, R.; Feng, H.; Dong, Q.G.; Yang, Y. Application of biochar in saline soils enhances soil resilience and reduces greenhouse gas emissions in arid irrigation areas. Soil Tillage Res. 2025, 250, 106500. [Google Scholar] [CrossRef] [Scilit]
  54. Qu, W.; Li, J.; Han, G.; Wu, H.; Song, W.; Zhang, X. Effect of salinity on the decomposition of soil organic carbon in a tidal wetland. J. Soils Sediments 2019, 19, 609–617. [Google Scholar] [CrossRef] [Scilit]
  55. Chen, R.; Zhang, J.; Wang, J.; Zhang, J.; Li, W.; Wang, Z. Carbon mineralization and microbial responses to saline-water irrigation in a drip-irrigated oasis cotton field: Variations across soil aggregate fractions. Agric. Water Manag. 2025, 320, 109852. [Google Scholar] [CrossRef] [Scilit]
  56. Fanin, N.; Mooshammer, M.; Sauvadet, M.; Meng, C.; Alvarez, G.; Bernard, L.; Bertrand, I.; Blagodatskaya, E.; Bon, L.; Fontaine, S.; et al. Soil Enzymes in Response to Climate Warming: Mechanisms and Feedbacks. Funct. Ecol. 2022, 36, 1378–1395. [Google Scholar] [CrossRef] [Scilit]
  57. Ren, C.; Zhao, F.; Shi, Z.; Chen, J.; Han, X.; Yang, G.; Feng, Y.; Ren, G. Differential Responses of Soil Microbial Biomass and Carbon-degrading Enzyme Activities to Altered Precipitation. Soil Biol. Biochem. 2017, 115, 1–10. [Google Scholar] [CrossRef] [Scilit]
  58. Wood, T.E.; Detto, M.; Silver, W.L. Sensitivity of Soil Respiration to Variability in Soil Moisture and Temperature in a Humid Tropical Forest. PLoS ONE 2017, 8, e80965. [Google Scholar] [CrossRef] [Scilit] [PubMed]
  59. Yu, X.; Zha, T.; Pang, Z.; Wu, B.; Wang, X.; Chen, G.; Li, C.; Cao, J.; Jia, G.; Li, X.; et al. Response of Soil Respiration to Soil Temperature and Moisture in a 50-year-old Oriental Arborvitae Plantation in China. PLoS ONE 2017, 6, e28397. [Google Scholar] [CrossRef] [Scilit] [PubMed]
  60. García-Palacios, P.; Crowther, T.W.; Dacal, M.; Hartley, I.P.; Reinsch, S.; Rinnan, R.; Rousk, J.; Hoogen, J.; Ye, J.S.; Bradford, M.A. Evidence for large microbial-mediated losses of soil carbon under anthropogenic warming. Nat. Rev. Earth Environ. 2021, 2, 507–517. [Google Scholar] [CrossRef] [Scilit]
  61. Zhang, Y.; Kaiser, E.; Li, T.; Marcelis, L.F.M. NaCl Affects Photosynthetic and Stomatal Dynamics by Osmotic Effects, and Reduces Photosynthetic Capacity by Ionic Effects in Tomato (Solanum lycopersicum). J. Exp. Bot. 2022, 73, 3637–3650. [Google Scholar] [CrossRef] [Scilit] [PubMed]
  62. Han, G. Effect of Tidal Action and Drying-wetting Cycles on Carbon Exchange in a Salt Marsh: Progress and Prospects. Acta Ecol. Sin. 2017, 37, 8170–8178. (In Chinese) [Google Scholar] [CrossRef] [Scilit]
  63. Yang, M.; Zhang, S.; Huang, J.; Li, S.; Wang, Y.; Zheng, D.; Yang, S.; Lü, F.; Chen, J.; Ma, S. Effects of Different Irrigation Methods on Soil Respiration and Carbon Balance in Wheat Field. J. Triticeae Crops 2026, 46, 374–383. (In Chinese) [Google Scholar] [CrossRef]
  64. Ors, S.; Suarez, D.L. Spinach Biomass Yield and Physiological Response to Interactive Salinity and Water Stress. Agric. Water Manag. 2017, 190, 31–41. [Google Scholar] [CrossRef] [Scilit]
  65. Bai, G.; He, F.; Shan, G.; Wang, Y.; Tong, Z.; Cao, Y.; Yuan, Q. Effect of Saline Irrigation Water on Alfalfa Growth and Development in Saline–Alkali Soils. Agronomy 2024, 14, 2790. [Google Scholar] [CrossRef] [Scilit]
  66. Zhou, S.; Wang, G.; Han, Q.; Zhang, J.; Dang, H.; Ning, H.; Gao, Y.; Sun, J. Long-term Saline Water Irrigation Affected Soil Carbon and Nitrogen Cycling Functional Profiles in the Cotton Field. Front. Microbiol. 2024, 15, 1310387. [Google Scholar] [CrossRef] [Scilit] [PubMed]
  67. Ma, Z.; Zhu, Y.; Liu, J.; Li, Y.; Zhang, J.; Wen, Y.; Song, L.; Liang, Y.; Wang, Z. Multi-objective Optimization of Saline Water Irrigation in Arid Oasis Regions: Integrating Water-saving, Salinity Control, Yield Enhancement, and CO2 Emission Reduction for Sustainable Cotton Production. Sci. Total Environ. 2024, 912, 169672. [Google Scholar] [CrossRef] [Scilit] [PubMed]
  68. Lu, J.; Gao, Y.; Tian, L.; Ding, J.; Shao, G.; Zeng, Z.; Wang, J.; Su, D. Saline water irrigation induced differences in sodium ion distribution and tomato yield following drought hardening pre-treatment. Sci. Hortic. 2025, 350, 114285. [Google Scholar] [CrossRef] [Scilit]
  69. Ma, W.; Cheng, Q.; Li, L.; Yu, Z.; Niu, L.A. Effect of slight saline water irrigation on soil salinity and yield of crop. Trans. CSAE 2010, 26, 73–80. (In Chinese) [Google Scholar] [CrossRef]
  70. Liu, X.; Feike, T.; Cheng, S.; Shao, L.; Sun, H.; Zhang, X. Effects of saline irrigation on soil salt accumulation and grain yield in the winter wheat-summer maize double cropping system in the low plain of North China. J. Integr. Agric. 2016, 15, 2886−2898. [Google Scholar] [CrossRef] [Scilit]
  71. Ma, W.; Cheng, Q.; Yu, Z. Irrigating strategy and leaching discipline of slightly saline water in North China Plain. J. Arid Land Resour. Environ. 2011, 25, 184–188. (In Chinese) [Google Scholar] [CrossRef]
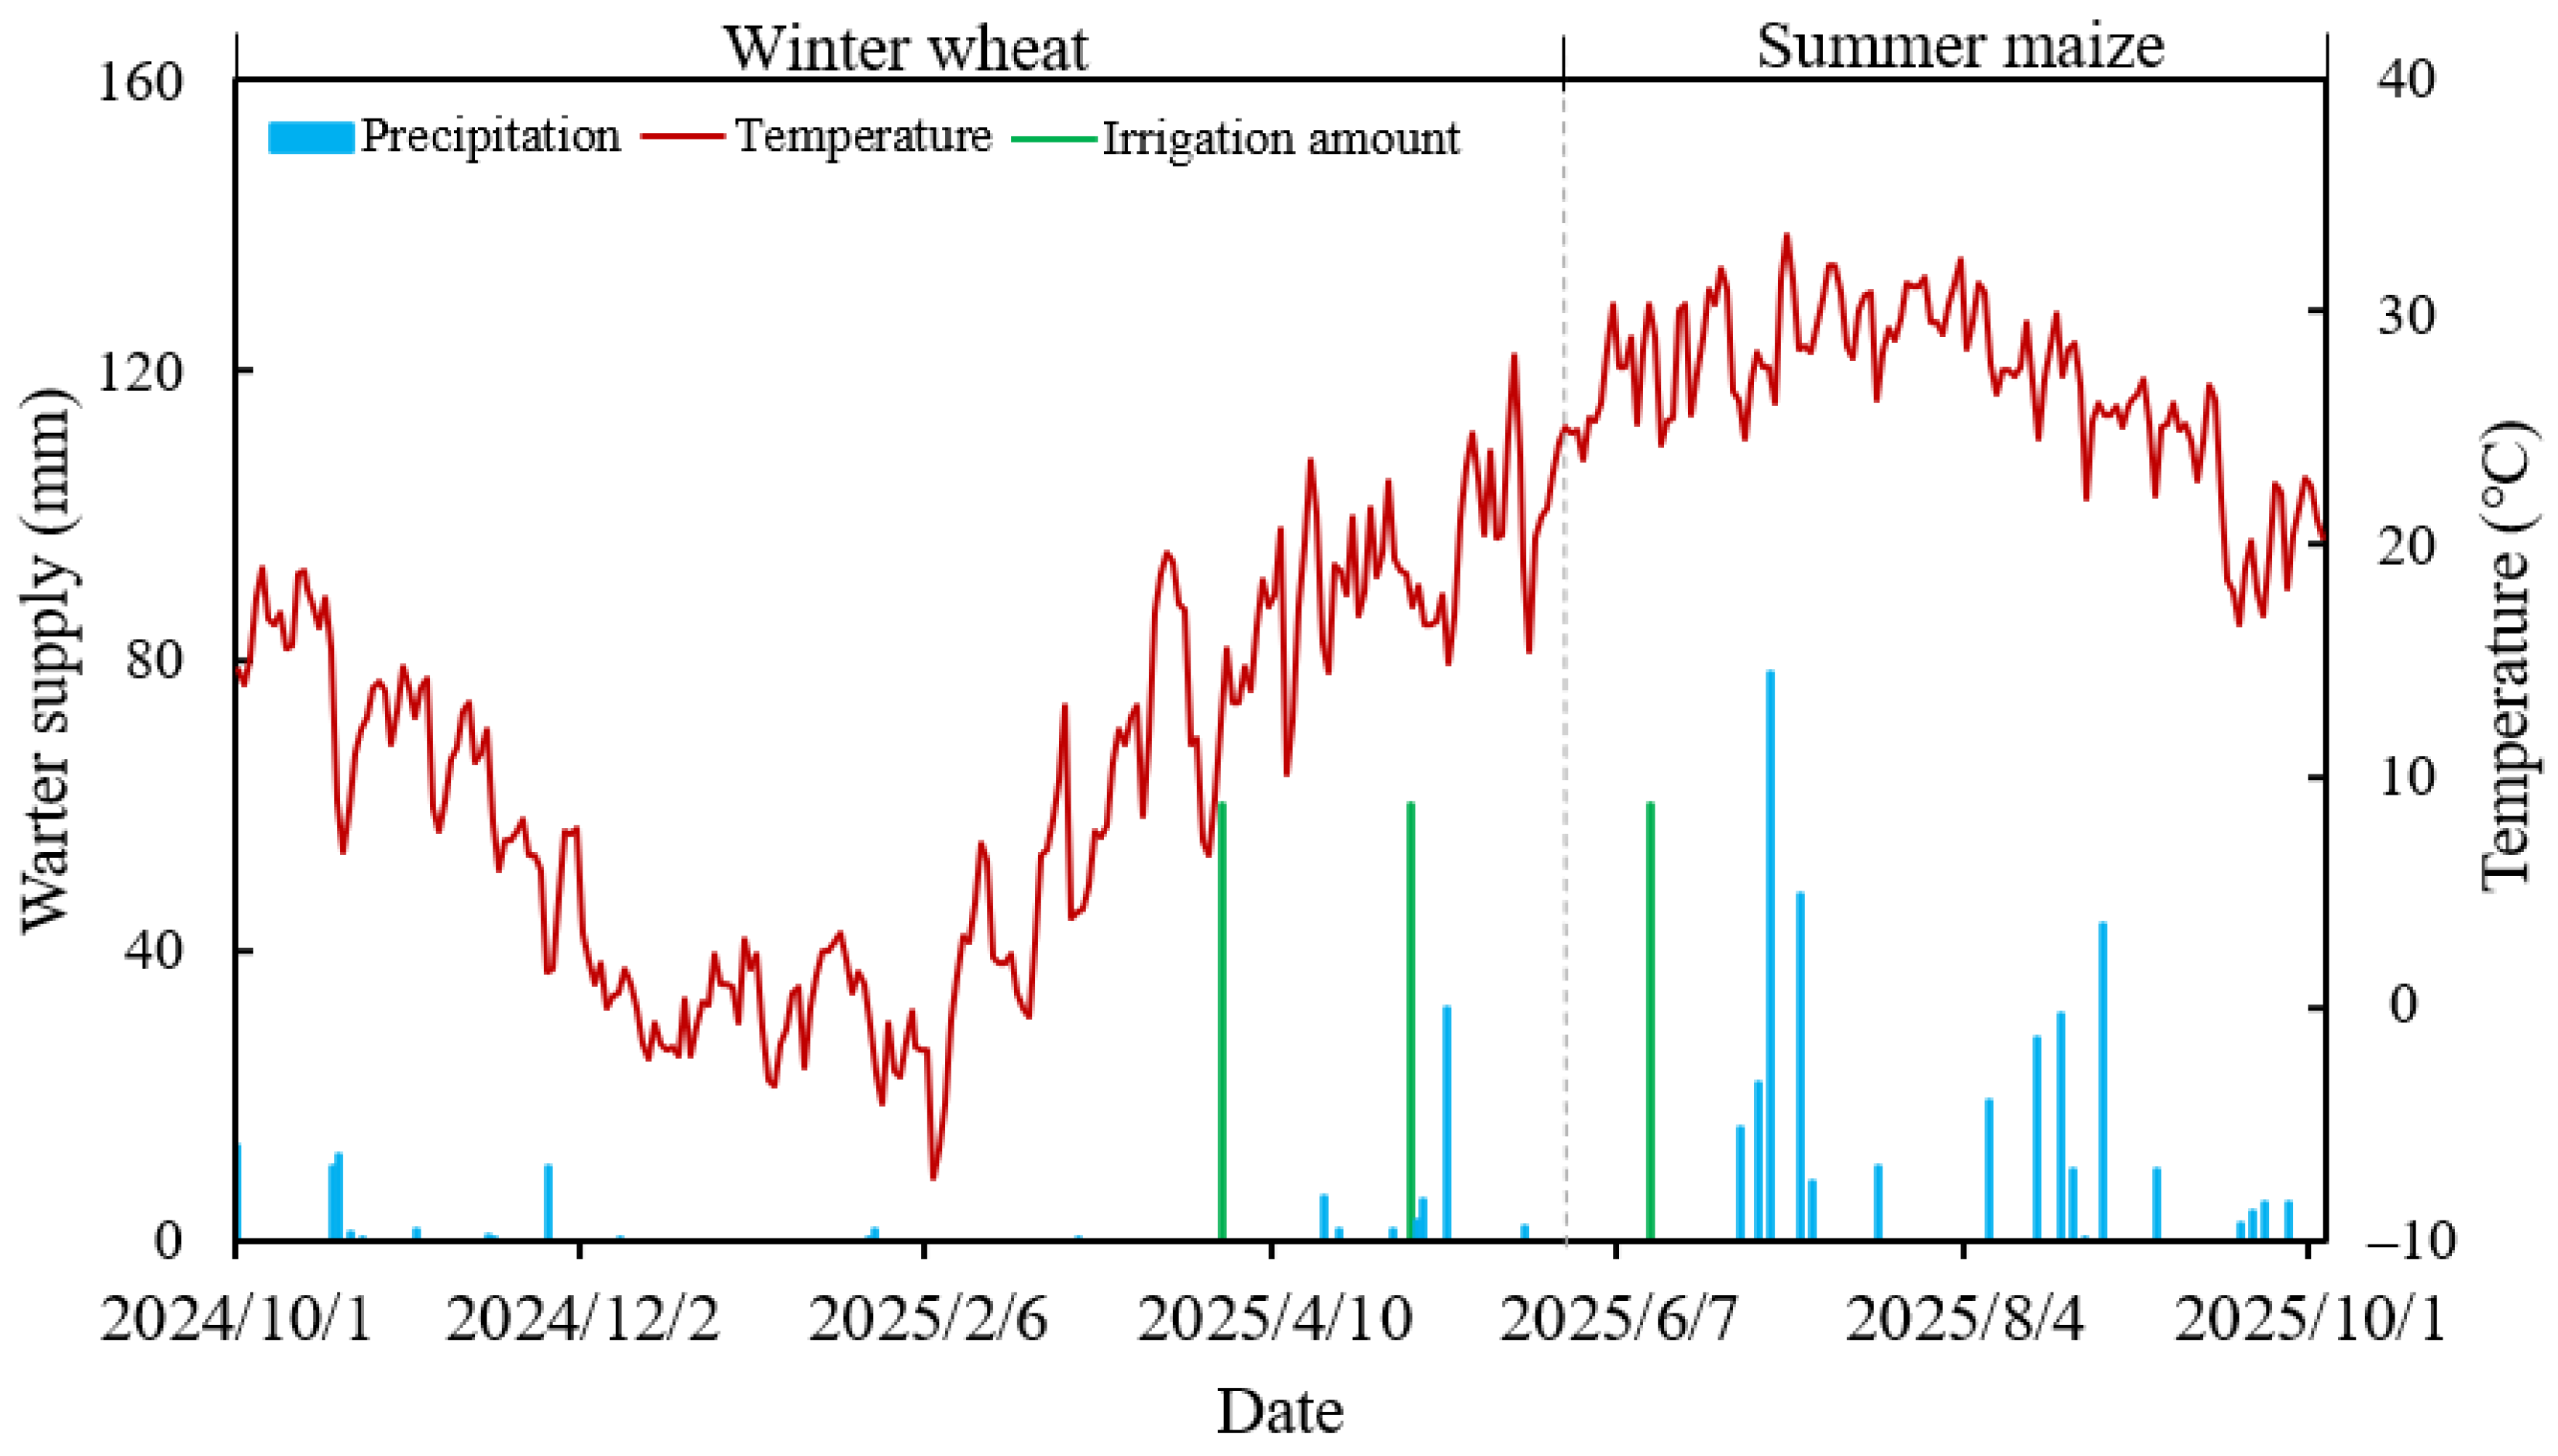
Figure 1. Daily average precipitation and temperature for the period 2024–2025.
Agronomy 16 01720 g001
Figure 2. Average soil moisture (SM, g·g−1) in the 0–1 m soil layer at various growth stages during the 2024–2025 winter wheat (a) and summer maize (b) seasons. Different lowercase letters denote significant differences among treatments at p < 0.05. S, J, F, and M represent sowing, jointing, grain-filling, and maturity stages, respectively.
Agronomy 16 01720 g002
Figure 3. Average soil salinity (ECe, dS·m−1) in the 0–1 m soil layer at various growth stages during the 2024–2025 winter wheat (a) and summer maize (b) seasons. Different lowercase letters denote significant differences among treatments at p < 0.05. S, J, F, and M represent sowing, jointing, grain-filling, and maturity stages, respectively.
Agronomy 16 01720 g003
Figure 4. Dry matter accumulation (103 kg·ha−1) of winter wheat (a), summer maize (b), and their rotation system (c) during 2024–2025. Different lowercase letters denote significant differences among treatments at p < 0.05.
Agronomy 16 01720 g004
Figure 5. Grain yields (Y, 103 kg·ha−1) of winter wheat (a), summer maize (b), and their rotation system (c) during 2024–2025. Different lowercase letters denote significant differences among treatments at p < 0.05.
Agronomy 16 01720 g005
Figure 6. Crop water consumption (CWC, mm) for winter wheat (a), summer maize (b), and their rotation system (c) during 2024–2025. Different lowercase letters denote significant differences among treatments at p < 0.05.
Agronomy 16 01720 g006
Figure 7. Water productivity (WP, kg·m−3) of winter wheat (a), summer maize (b), and their rotation system (c) during 2024–2025. Different lowercase letters denote significant differences among treatments at p < 0.05.
Agronomy 16 01720 g007
Figure 8. Linear regression analyses of dry matter accumulation (a), grain yield (Y) (b), crop water consumption (CWC) (c), and water productivity (WP) (d) for winter wheat, summer maize, and their rotation during 2024–2025 as functions of irrigation water salinity (ECiw). ** and * indicate significance at p < 0.01 and p < 0.05, respectively. X0.95 and X0.9 denote the ECiw values corresponding to a 5% and 10% reduction in yield and water productivity, respectively.
Agronomy 16 01720 g008
Figure 9. Dynamic changes in surface soil moisture (SM, m3·m−3) in the 0–0.1 m soil layer during the 2024–2025 winter wheat (a) and summer maize (b) season, and average surface SM for both crops during their respective growth periods (c). Same lowercase letters denote no significant differences among treatments at p < 0.05.
Agronomy 16 01720 g009
Figure 10. Dynamic changes in surface soil temperature (T, °C) in the 0–0.1 m soil layer during the 2024–2025 winter wheat (a) and summer maize (b) season, and average surface soil temperature for both crops during their respective growth periods (c). Different lowercase letters denote significant differences among treatments at p < 0.05.
Agronomy 16 01720 g010
Figure 11. Dynamic changes in surface soil salinity (ECe, dS·m−1) in the 0–0.1 m soil layer during the 2024–2025 winter wheat (a) and summer maize (b) season, and average surface ECe for both crops during their respective growth periods (c). Different lowercase letters denote significant differences among treatments at p < 0.05.
Agronomy 16 01720 g011
Figure 12. Dynamic changes in surface soil pH in the 0–0.1 m soil layer during the 2024–2025 winter wheat (a) and summer maize (b) season, and average surface soil pH for both crops during their respective growth periods (c). Different lowercase letters denote significant differences among treatments at p < 0.05.
Agronomy 16 01720 g012
Figure 13. Dynamic changes in soil respiration rate (Rs, μmol·m−2·s−1) during the 2024–2025 winter wheat (a) and summer maize (b) season, and average Rs for both crops during their respective growth periods (c). Different lowercase letters denote significant differences among treatments at p < 0.05.
Agronomy 16 01720 g013
Figure 14. Correlation analysis between irrigation water salinity (ECiw) and soil respiration rate (Rs), surface soil moisture (SM), soil temperature (T), soil salinity (ECe), and soil pH in the 0–0.1 m soil layer during the 2024–2025 winter wheat (a) and summer maize (b) seasons. * and ** indicate significance at p < 0.05 and p < 0.01, respectively.
Agronomy 16 01720 g014
Figure 15. Cumulative carbon emissions (CE, kg C·ha−1) at various growth stages during the 2024–2025 winter wheat (a) and summer maize (b) season. Distinct lowercase letters denote significant differences among treatments at p < 0.05.
Agronomy 16 01720 g015
Figure 16. Carbon emission efficiency (CEE, kg·kg−1) for winter wheat (a), summer maize (b), and their rotation (c) during the 2024–2025. Distinct lowercase letters denote significant differences among treatments at p < 0.05.
Agronomy 16 01720 g016
Figure 17. Carbon emissions per unit of water consumption (WPCE, kg·m−3) for winter wheat (a), summer maize (b), and their rotation (c) during 2024–2025. Distinct lowercase letters denote significant differences among treatments at p < 0.05.
Agronomy 16 01720 g017
Figure 18. Heterotrophic microbial respiratory carbon emissions (Rm, 103 kg C·ha−1) of winter wheat (a), summer maize (b), and their rotation (c) during 2024–2025. Distinct lowercase letters denote significant differences among treatments at p < 0.05.
Agronomy 16 01720 g018
Figure 19. Net primary productivity (NPP, 103 kg C·ha−1) for carbon sequestration of winter wheat (a), summer maize (b), and their rotation (c) during 2024–2025. Distinct lowercase letters denote significant differences among treatments at p < 0.05.
Agronomy 16 01720 g019
Figure 20. Net carbon input (NEP, 103 kg C·ha−1) of winter wheat (a), summer maize (b), and their rotation (c) during 2024–2025. Distinct lowercase letters denote significant differences among treatments at p < 0.05.
Agronomy 16 01720 g020
Table 1. Comprehensive evaluation of a winter wheat–summer maize rotation system based on the entropy-weighted TOPSIS model.
TreatmentWinter Wheat–Summer Maize Rotation System
D i + D i C i Rank
CK (1.3 dS·m−1)0.2200.2950.5722
T1 (3.4 dS·m−1)0.1850.2720.5961
T2 (7.1 dS·m−1)0.1930.2060.5173
T3 (10.6 dS·m−1)0.2310.2170.4854
T4 (14.1 dS·m−1)0.3080.2150.4115
Disclaimer/Publisher’s Note: The statements, opinions and data contained in all publications are solely those of the individual author(s) and contributor(s) and not of MDPI and/or the editor(s). MDPI and/or the editor(s) disclaim responsibility for any injury to people or property resulting from any ideas, methods, instructions or products referred to in the content.