Article

Research on Fermentation Characteristics and Microbial Community of Mixed Sorghum-Sudangrass and Sesbania Silage

1
College of Animal Science and Technology, Tarim University, Alar 843300, China
2
Key Laboratory of Livestock and Forage Resources Utilization around Tarim, Ministry of Agriculture and Rural Affairs, Tarim University, Alar 843300, China
*
Author to whom correspondence should be addressed.
Agronomy 2026, 16(1), 44; https://doi.org/10.3390/agronomy16010044

Submission received: 31 October 2025 / Revised: 11 December 2025 / Accepted: 19 December 2025 / Published: 23 December 2025

Abstract

To explore the optimal mixing ratio and fermentation mechanism of sorghum-sudangrass and sesbania mixed silage, this study prepared silages at ratios of 10:0, 9:1, 8:2, 7:3, and 6:4 and analyzed their chemical composition, fermentation quality, and microbial characteristics on days 3, 30, and 60 of fermentation. The results showed that dry matter (DM) content gradually decreased with prolonged fermentation, with the 7:3 and 6:4 groups maintaining relatively higher mean DM content. The 6:4 and 7:3 groups have more crude protein (CP) content at D60. Water-soluble carbohydrates (WSC) decreased gradually during fermentation. In terms of fermentation quality, pH values decreased progressively and eventually stabilized. Lactic acid (LA) content accumulated over time, with the 10:0 group displaying higher NH3-N/TN content. Butyric acid was not detected in any treatment. Microbiologically, the counts of lactic acid bacteria (LAB) and yeasts gradually decreased with fermentation time, while Escherichia coli and mold were effectively suppressed. Bacterial diversity declined during fermentation, with Firmicutes being the dominant phylum. Weissella predominated in the early stage, while Pediococcus became dominant later. In conclusion, sorghum-sudangrass and sesbania mixed silage promote nutrient preservation and fermentation stability.

1. Introduction

Silage production has become a critical strategy to mitigate feed shortages and ensure a steady supply of animal products in China, thereby supporting the high quality and sustainable development of the livestock industry [1]. However, in regions such as the Tarim Basin, environmental constraints—including soil salinization, desertification, and limited freshwater availability—have severely impeded the yield and quality of conventional forage crops like silage corn. To overcome these challenges, salt-tolerant and water-efficient forage species, such as sorghum-sudangrass (Sorghum bicolor × S. sudanense) and sesbania (Sesbania cannabina), have been introduced into local agricultural systems.
Sorghum-sudangrass provides multiple agronomic benefits, including high biomass yield, strong abiotic stress tolerance, high water-use efficiency, and an abundant water-soluble carbohydrate (WSC) content. It sustains high productivity under arid or water-limited conditions while reducing irrigation demand by approximately 30% and nitrogen fertilizer use by 10% compared with silage corn, demonstrating considerable economic and ecological value [2,3]. Sesbania is an annual legume and exhibits high salinity tolerance, waterlogging resistance, adaptation to nutrient-poor soils, and general stress resilience [4]. It is also rich in proteins, bioactive compounds, and trace minerals, meeting the nutritional needs of most livestock species [5]. Furthermore, dietary inclusion of Sesbania has been shown to enhance digestibility, feed intake, and production performance in animals [6,7]. Despite these advantages, both forages present specific limitations when ensiled alone. Monoculture silage of sorghum-sudangrass can lead to nutritional imbalance, while Sesbania has low WSC content, and the high buffering capacity of Sesbania often impedes efficient fermentation [1,8,9].
Studies have shown that mixed ensiling of grass and legume forages can address issues such as nutritional imbalance, poor fermentation quality, and low palatability associated with monospecific silage [10]. Examples include mixtures of oat and alfalfa [11], sweet sorghum and alfalfa [12], forage sorghum/corn and lablab bean [13], ryegrass and red clover [14], and corn and climbing bean [15], as well as sesbania and sweet sorghum [16]. Combined ensiling improves the nutritional balance of the resulting forage, elevating crude protein (CP) by 32.8%, while significantly reducing neutral detergent fiber (NDF) and acid detergent fiber (ADF) by 8.1% and 8.6%, respectively [12]. Fermentation quality is also enhanced, with pH maintained between 3.5 and 4.2. Compared with legume-only silage, mixed silage shows significantly higher lactic acid (LA) content and a reduction in ammonia nitrogen (NH3-N) by about 50% [9], in addition to improved palatability. The high WSC content of sorghum-sudangrass supplies ample substrate for lactic acid bacteria (LAB), whereas the elevated crude protein level in sesbania helps correct nutritional limitations in sorghum-sudangrass monoculture silage. Therefore, theoretically, mixed ensiling of these two species should improve overall silage quality. Nevertheless, research on the co-ensiling of sorghum-sudangrass and sesbania remains limited.
Based on our team’s previous research into intercropping sorghum-sudangrass and sesbania, this study investigates the mixed ensiling of these two forages at different ratios. Forage intercropping—a green, efficient, and sustainable cropping system—involves sowing forages together, harvesting them simultaneously, and directly ensiling the mixture. This approach not only significantly reduces production and processing costs but also enhances the overall quality of the resulting silage. We hypothesized that an optimal mixing ratio would create synergistic effects between the two forages, with sorghum-sudangrass providing fermentable carbohydrates and sesbania contributing proteins and buffering capacity, thereby collectively improving fermentation efficiency, nutrient preservation, and microbial community stability. To test this, sorghum-sudangrass and sesbania were systematically ensiled at varying blending ratios to identify the optimal mixing proportion for silage production and to evaluate their nutritional quality, fermentation characteristics, microbial abundance, and microbial diversity, thereby revealing dynamic fermentation patterns. The findings are expected to provide a theoretical foundation for the future utilization and processing of salt-tolerant forages through ensiling.

2. Materials and Methods

2.1. Silage Preparation

The field experiment with sorghum-sudangrass and sesbania was conducted at the 11th Company, 12th Regiment, Alar City, Xinjiang (40°22′–40°57′ N, 80°30′–81°58′ E). The same condition was used in the cultivation of sorghum-sudangrass and sesbania, and the two were planted and harvested at the same time. Both forages were harvested in July 2024, with sorghum-sudangrass at the heading stage and sesbania at the early flowering stage. A completely randomized design was applied, and a total of 45 silage bags were prepared, representing 5 mixing ratios × 3 storage periods × 3 replicates. In mixed storage of beans and forage, the optimal proportion of leguminous forage is generally less than 40% [9,17]. Thus, the mixing ratios of sorghum-sudangrass to sesbania were set at 10:0, 9:1, 8:2, 7:3, and 6:4 (fresh weight basis). Both materials were chopped into 1–2 cm segments, thoroughly blended according to the designated proportions, and packed into polyethylene silage bags (1000 g per bag). The bags were vacuum-sealed and stored in darkness at room temperature (27.5 ± 2.5 °C) for 3 (D3), 30 (D30), and 60 (D60) days. After each storage period, bags from each treatment were opened for sampling, followed by analyses of nutritional composition, fermentation quality, microbial counts, and community diversity.

2.2. Chemical Components, Fermentation Characteristics, and Microbial Count

On D3, D30, and D60 of fermentation, 200 to 300 g of silage samples were collected after opening the bags. The samples were dried in a forced-air oven at 65 °C until constant weight to determine dry matter (DM) content. The dried material was then ground using a mill and passed through a 40-mesh sieve. Crude protein (CP), neutral detergent fiber (NDF), and acid detergent fiber (ADF) contents were determined according to the standard methods of the Association of Official Analytical Chemists (AOAC) [18]. Water-soluble carbohydrate (WSC) content was measured using the anthrone–sulfuric acid method [19].
For fermentation analysis, 20 g of silage from each time point was mixed with 180 mL of distilled water and extracted at 4 °C for 24 h. The mixture was filtered through four layers of cheesecloth, and the filtrate was used for subsequent analyses. The pH was measured with a calibrated pH meter (FE22, Mettler Toledo, Shanghai, China). Lactic acid (LA) and acetic acid (AA) concentrations were determined by high-performance liquid chromatography (HPLC, Alliance e2695, Waters, Milford, MA, USA) equipped with a C18 column (4.6 mm × 250 mm, 4 μm), maintained at 35 °C, with a mobile phase flow rate of 0.8 mL min−1. Propionic acid (PA), butyric acid (BA), and valeric acid (VA) were analyzed by gas chromatography (GC, TRACE 1310, Thermo Scientific, Milan, Italy) using an HP-INNOWAX capillary column (30 m × 0.250 mm × 0.25 μm). The GC conditions were as follows: injector temperature 250 °C; column temperature programmed from 60 °C (hold 2 min) to 220 °C at 10 °C min−1 (hold 1 min); split ratio 5:1; and injection volume 1 μL. Ammonia nitrogen content (NH3-N/TN) was determined by the phenol–hypochlorite method [19].
For microbial analysis, 10 g of fresh silage from each treatment and time point was aseptically transferred into a conical flask containing 90 mL of sterile 0.9% NaCl solution and homogenized. Serial dilutions (10−5 to 10−7) were prepared, and microbial counts were obtained by the spread plate method [20]. Lactic acid bacteria (LAB) were enumerated on De Man, Rogosa, and Sharpe (MRS) agar (Hope Bio-Technology Co., Ltd., Qingdao, China), yeasts and molds on potato dextrose agar (PDA), and Escherichia coli on eosin methylene blue (EMB) agar (Hope Bio-Technology Co., Ltd., Qingdao, China). All media and supplies were autoclaved at 120 °C for 20 min prior to use. After solidification, plates were incubated at 30 °C for 48 h before counting.

2.3. Bacterial Community Analyses

Bacterial DNA was extracted from silage samples using the CTAB method. The concentration and purity of the extracted DNA were detected on a 1% agarose gel, and the DNA was diluted to 1 ng μL−1 with sterile water based on differences in concentration. For bacteria, the V3-V4 variable region of the 16 S rRNA gene was amplified by PCR using specific primers F (5′-ACTCCTACGGGAGGCAGCA-3′) and R (5′-GGACTACHVGGGT-WTCTAAT-3′). After PCR amplification, electrophoresis detection was performed on a 2% agarose gel. The mixed PCR products were purified using a Qiagen Gel Extraction Kit (Qiagen, Hilden, Germany). Raw data were quality-filtered using Trimmomatic [21] (version 0.33), followed by identification and removal of primer sequences using Cutadapt [22] (version 1.9.1). Subsequently, paired-end reads were assembled and chimeras were removed using USEARCH [23] (version 10) with UCHIME [24] (version 8.1). The internal reference sequence database was aligned using BLASTN [25] (v2.9.0+), and internal reference sequences were filtered out. Finally, high-quality sequences were obtained for subsequent analysis.

2.4. Statistical Analyses

SPSS 27.0 software was used to perform two-way analysis of variance (two-way ANOVA) for analyzing fermentation parameters, chemical composition, and microbial counts. Bacterial alpha diversity (Chao1, Shannon, OTUs, and Simpson index) was calculated with QIIME 2. The Duncan method was used for multiple comparison tests, with a significance level set at p < 0.05 (significant difference) and p < 0.001 (highly significant difference). Origin 2021 and R 4.3.2 software were employed for graphing. Data analysis and processing related to microorganisms were conducted on the BMKCloud platform https://www.biocloud.net (accessed on 25 October 2025). Spearman’s rank correlation analysis was performed to assess the relationships between the bacterial community and physicochemical properties as well as pathways.

3. Results

3.1. Characteristics of Sorghum-Sudangrass and Sesbania Before Ensiling

The data on nutrient composition and attached microbial counts were of fresh Sorghum-sudangrass and sesbania (Table 1). Nutritionally, sorghum-sudangrass contained 30.07% DM, with CP, NDF, ADF, and WSC contents of 102.09, 493.25, 385.86, and 165.29 g kg−1 DM, respectively. In contrast, sesbania had a higher DM content of 35.71%, together with CP, NDF, ADF, and WSC values of 202.09, 523.91, 415.86, and 86.44 g kg−1 DM, respectively. With regard to microbial populations, sorghum-sudangrass exhibited yeast, lactic acid bacteria, Escherichia coli, and mold counts of 8.49, 9.52, 4.44, and 5.67 log10 cfu g−1 FM, respectively. Meanwhile, the corresponding counts for sesbania were 6.08, 8.31, 2.77, and 5.07 log10 cfu g−1 FM.

3.2. Chemical Composition of Mixed Sorghum-Sudangrass and Sesbania Silage

The chemical composition of mixed silages shows that ensiling days (D), mixing ratio (M), and the interaction of days and ratio had significant effects on CP, NDF, and WSC content (Table 2). Ensiling days and mixing ratio had a significant effect on DM. Ensiling days had a significant effect on ADF. On average across fermentation times, the 7:3 (32.48%) and 6:4 (32.40%) mixing ratios had the highest DM content (p < 0.05). Independently, DM content decreased significantly with ensiling days (p < 0.05). The 6:4 mixing ratio maintained a significantly higher CP content throughout fermentation than other groups at D30 (184.37 g kg−1 DM) and D60 (181.40 g kg−1 DM). The ADF content significantly decreased with fermentation days (p < 0.05). The NDF content decreased significantly with the increase in ensiling days (p < 0.05), and the 6:4 ratio had a higher NDF content than the 9:1, 8:2, and 7:3 mixing ratios at D60. The WSC content decreased significantly with the increase in fermentation days (p < 0.05), and the WSC content of each group decreased gradually with the increase in the proportion of sesbania added at D60.

3.3. Fermentation Characteristics of Mixed Sorghum-Sudangrass and Sesbania Silage

The fermentation characteristics of mixed silages show that ensiling days (D), mixing ratio (M), and the interaction of days and ratio had significant effects on NH3-N/TN content (Table 3). The ensiling days and mixing ratio had a significant effect on pH and LA content. Independently, the pH decreased significantly with ensiling days (p < 0.05). The LA content accumulated continuously alongside fermentation days. In contrast, the AA and PA showed no significant differences across either mixing ratios or fermentation days. The NH3-N/TN content increased continuously with fermentation days. And the 10:0 group’s NH3-N/TN content was significantly higher than those of other mixing ratios at D3, D30, and D60 (p < 0.05). Butyric acid was not detected during the fermentation process.

3.4. Microbial Count of Mixed Sorghum-Sudangrass and Sesbania Silage

Significant interactions between ensiling days and mixing ratio were detected for LAB, yeasts, and Escherichia coli populations (p < 0.05) (Table 4). All groups exhibited a general decline in LAB numbers as fermentation progressed. The LAB count in the 9:1 group was the highest at D3 but decreased significantly to 6.24 and 5.75 log10 cfu g−1 FM at D30 and D60, respectively (p < 0.05). The 6:4 group had the lowest LAB count at D3, which continued to decline, reaching 5.17 log10 cfu g−1 FM at D60. The overall mean LAB count in the 10:0 group was significantly higher than in the other groups (p < 0.05). The LAB count in group 7:3 showed a slight increase at D60. The yeast population decreased significantly over fermentation days in all groups (p < 0.05). The mean yeast counts in the 8:2 and 7:3 groups were significantly higher than those in the other groups (p < 0.05). The Escherichia coli population decreased significantly with fermentation days in all groups (p < 0.05). The count of Escherichia coli in the 9:1 group was significantly higher (4.93 Log10 cfu g−1 FM) than in other groups at D3 (p < 0.05). No Escherichia coli was detected at D60. Regarding molds, the 10:0 and 6:4 groups had significantly higher counts at D3 than the other groups (p < 0.05). No molds were detected at D30 or D60.

3.5. Bacterial Community Diversity of Mixed Sorghum-Sudangrass and Sesbania Silage

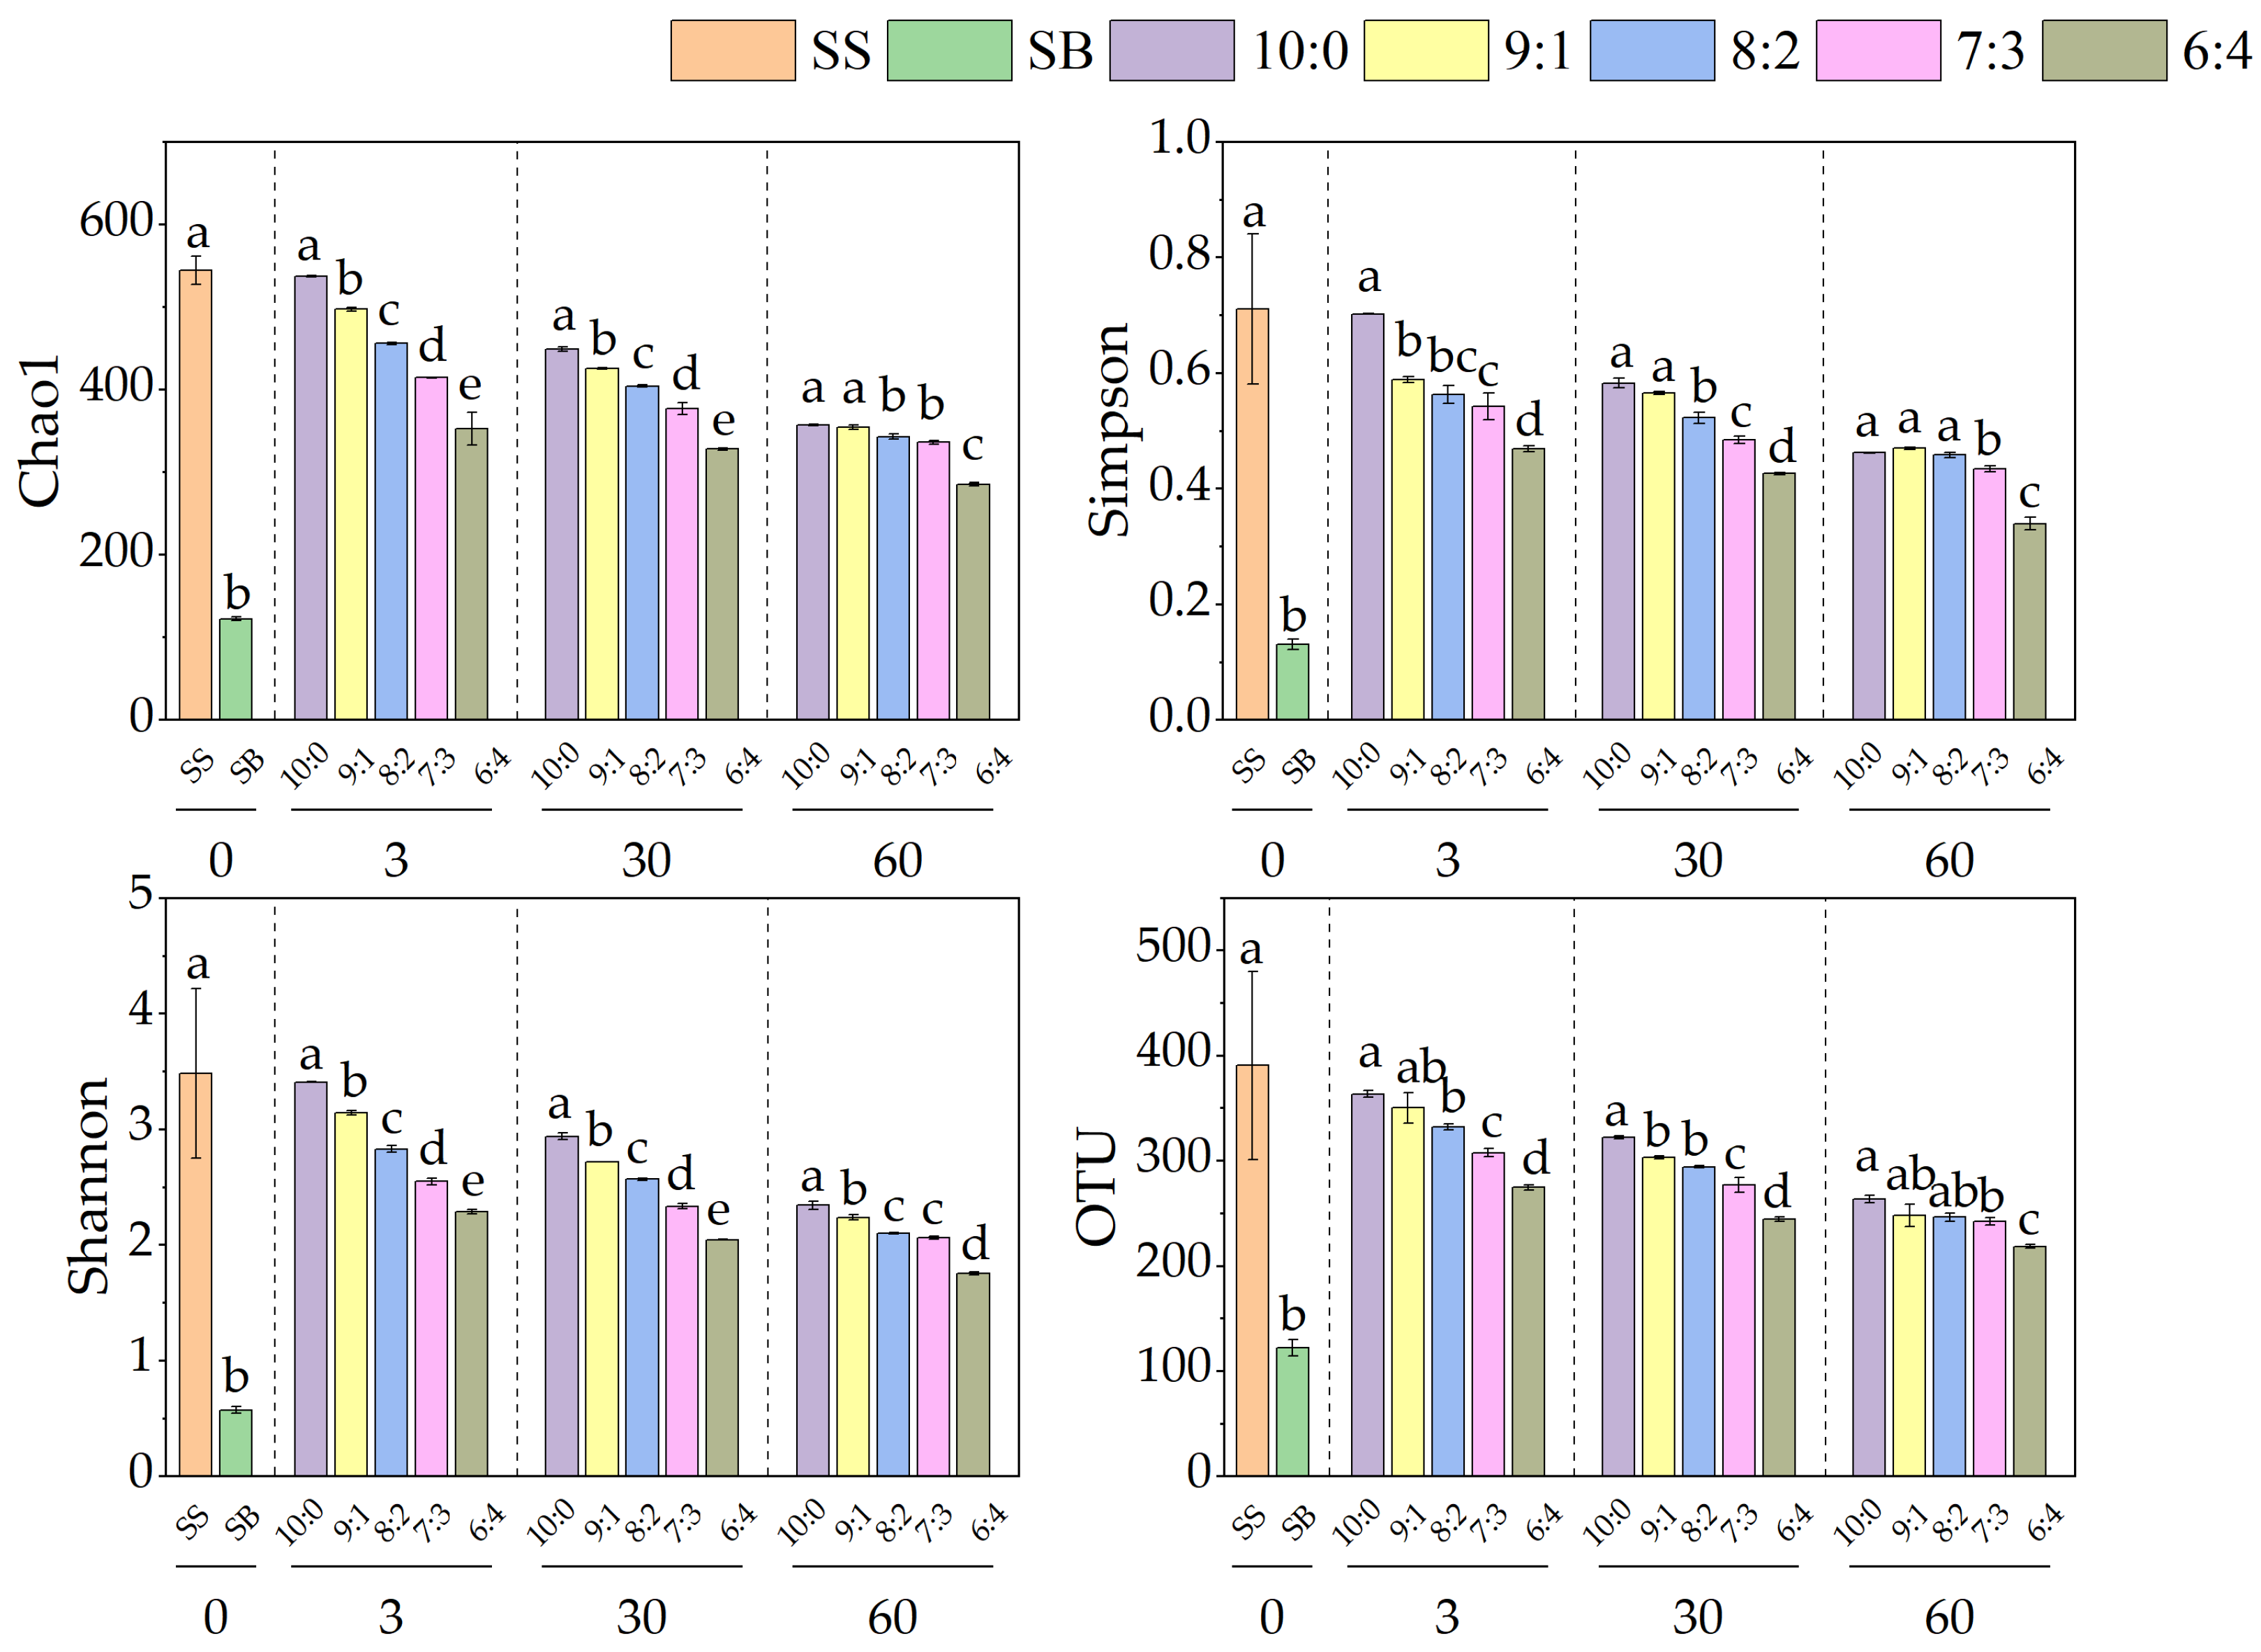
The bacterial diversity in the mixed silage of sorghum-sudangrass and sesbania was analyzed (Figure 1). The bacterial Chao1 index, Simpson index, Shannon index, and OTU index of fresh sorghum-sudangrass were significantly higher than those of fresh sesbania (p < 0.05). With the extension of fermentation days, the above-mentioned indices of each treatment showed a decreasing trend. On D3 and D30 of fermentation, the Chao1 and Shannon indices decreased significantly with the increase in the added amount of sesbania (p < 0.05). The differences in the Simpson index and OTU number among various treatments also corresponded to the variation trends of the Chao1 and Shannon indices.

3.6. Composition and Changes in Bacterial Communities of Mixed Sorghum-Sudangrass and Sesbania Silage

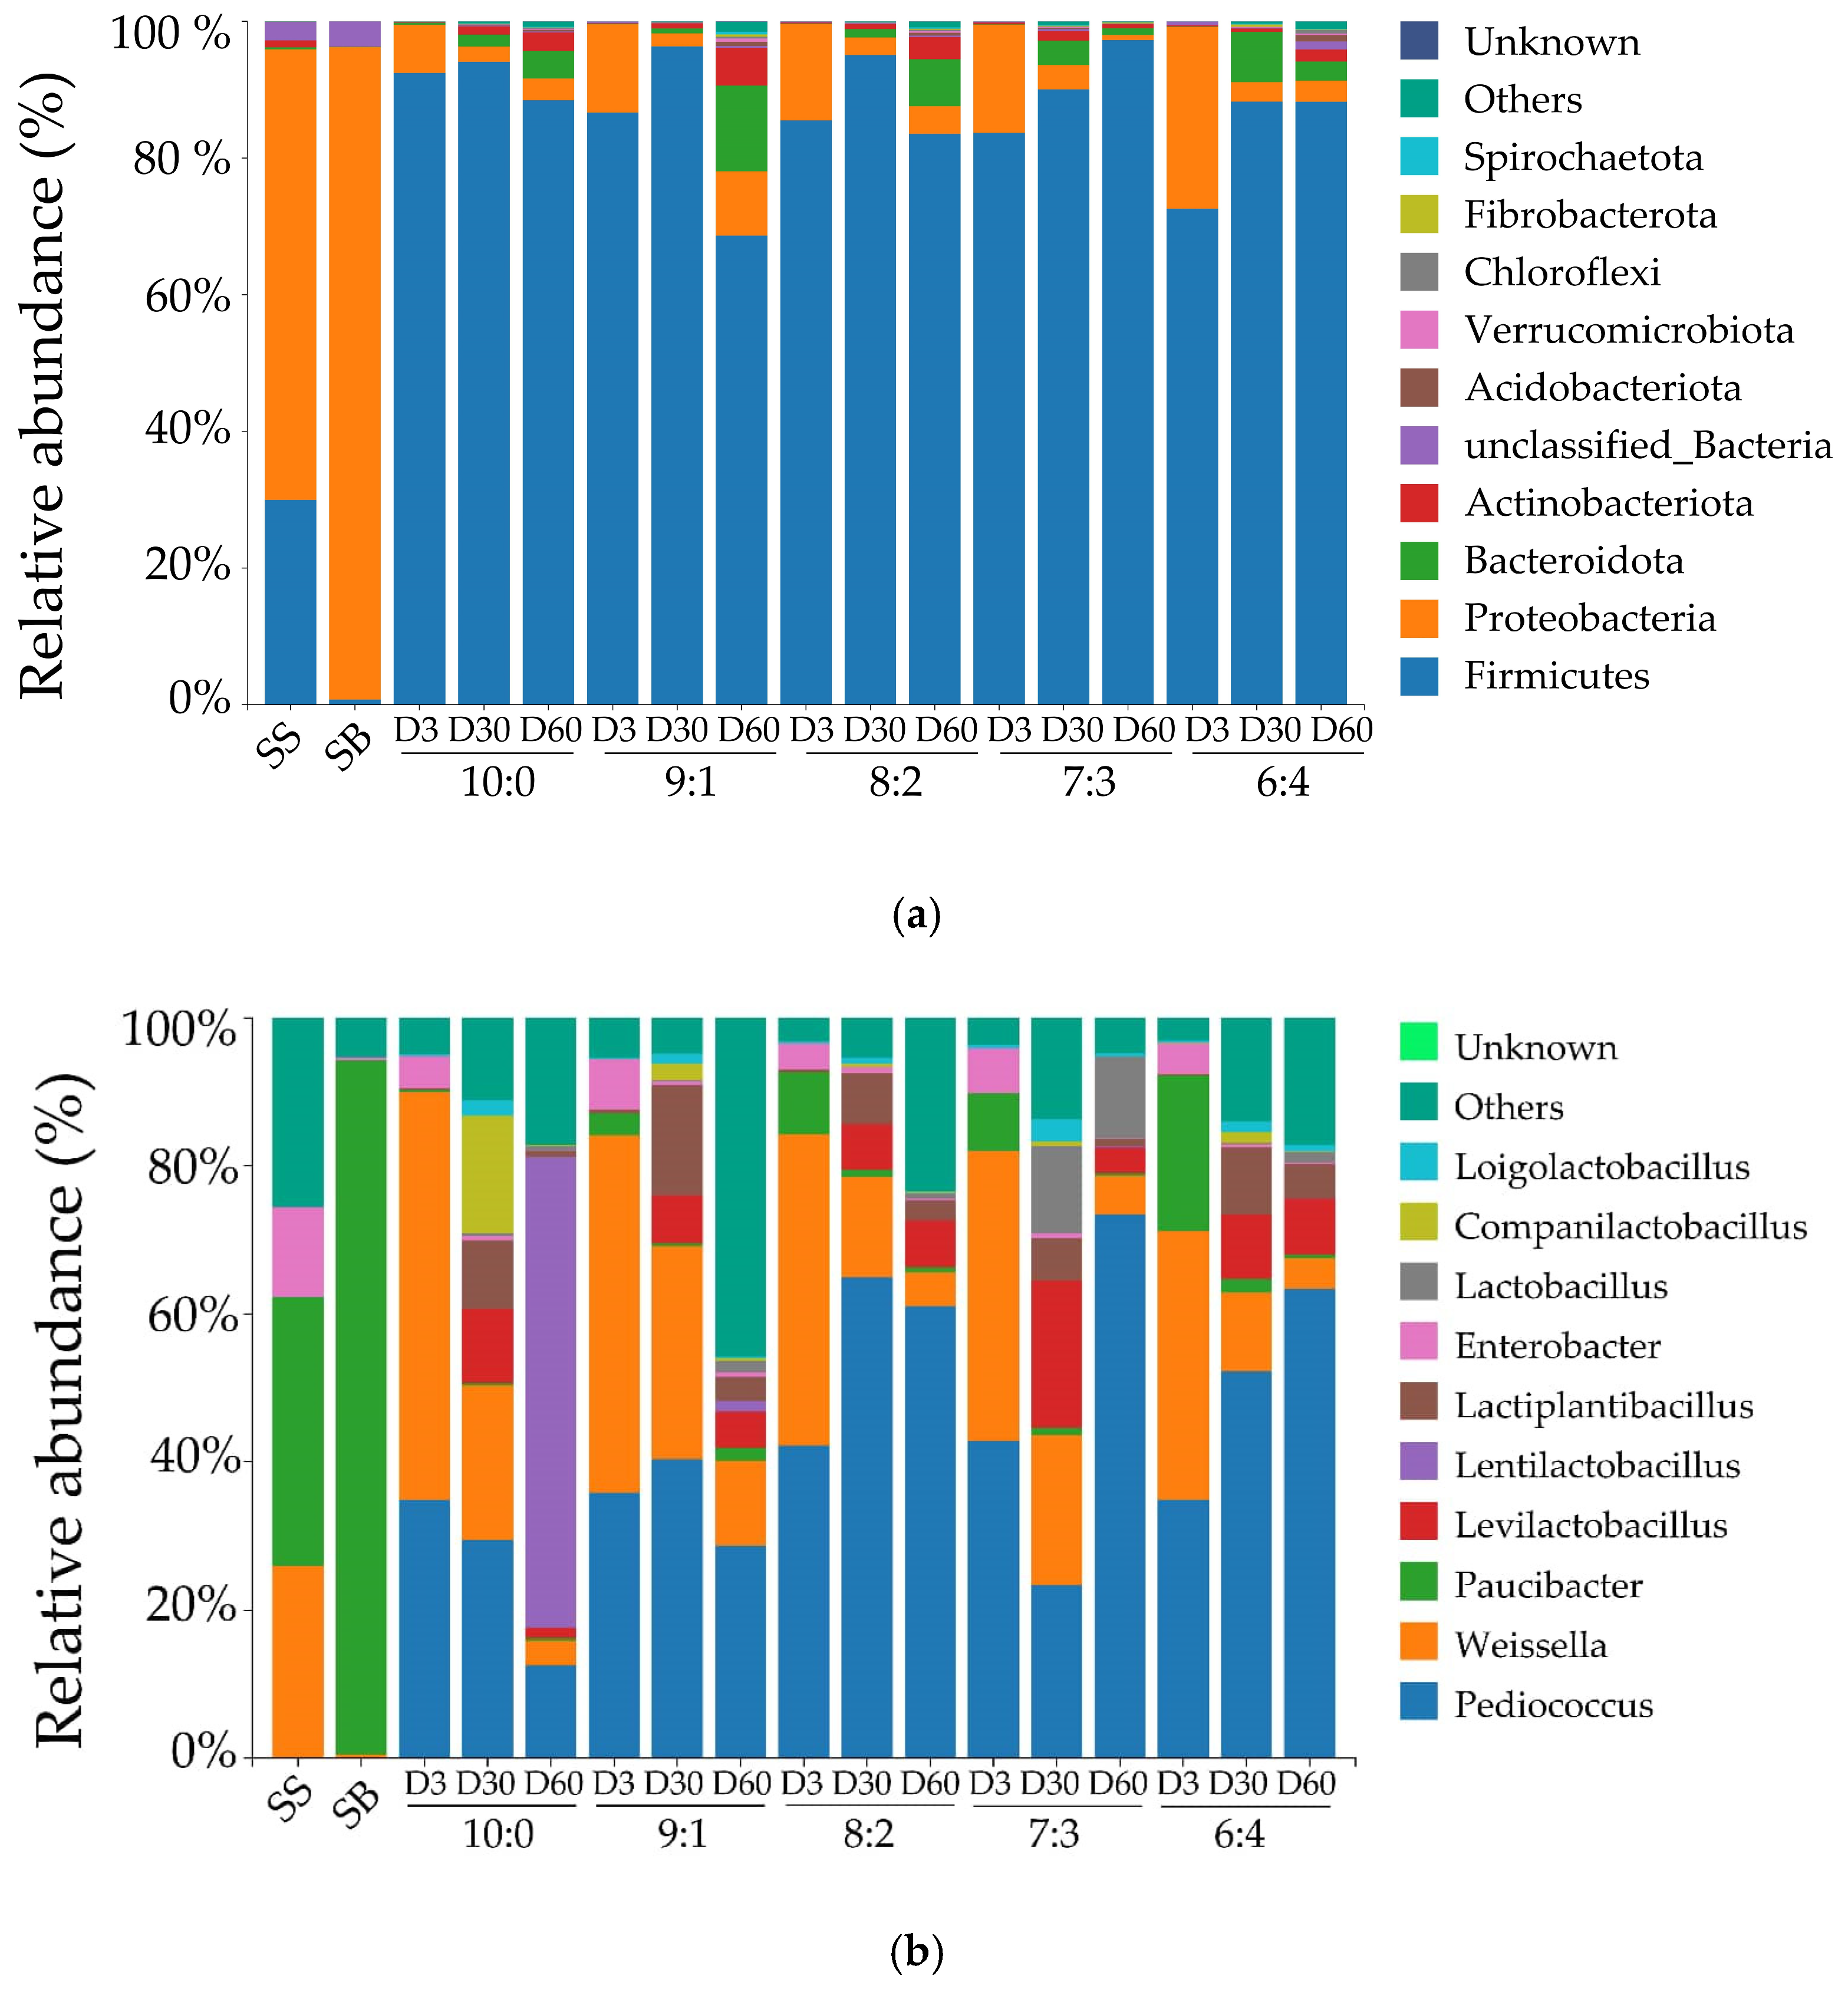
In terms of the bacterial community at the phylum level in fresh sorghum-sudangrass and sesbania, Proteobacteria had the highest relative abundance. Among all silage treatment groups, Firmicutes had the highest relative abundance (Figure 2a). At the genus level of the bacterial community, the relative abundance of Paucibacter reached 93.72% in the SB treatment and 36.34% in the SS treatment, while the relative abundance of Weissella accounted for 25.92% in SS (Figure 2b). In the 10:0 silage treatment group, the relative abundances of Pediococcus and Weissella gradually decreased as the fermentation days extended, and Lentilactobacillus gradually became dominant during fermentation, reaching 63.55% on D60. In the 9:1 mixed silage group of sorghum-sudangrass and sesbania, the relative abundance of Pediococcus peaked at 40.35% on D30. The relative abundance of Lactiplantibacillus increased to 14.84% on D30 and then decreased to 3.29%. In the 8:2 mixed silage group, the relative abundance of Pediococcus peaked at 64.90% on D30. Levilactobacillus and Lactiplantibacillus appeared in the middle and late stages of fermentation. In the 7:3 mixed silage group, the relative abundance of Pediococcus increased to 73.42% on D60, gradually becoming dominant. The relative abundance of Levilactobacillus peaked at 19.97% on D30, and the relative abundance of Lactobacillus reached 11.77% on D30 and remained at 11.05% on D60. In the 6:4 mixed silage group, the relative abundance of Pediococcus gradually increased from 34.91% to 63.40% as fermentation days extended, gradually taking the dominant position. The relative abundances of Weissella and Enterobacter in all treatments showed a gradually decreasing trend as fermentation time increased.

3.7. Co-Occurrence Network in Bacterial Community of Mixed Sorghum-Sudangrass and Sesbania Silage

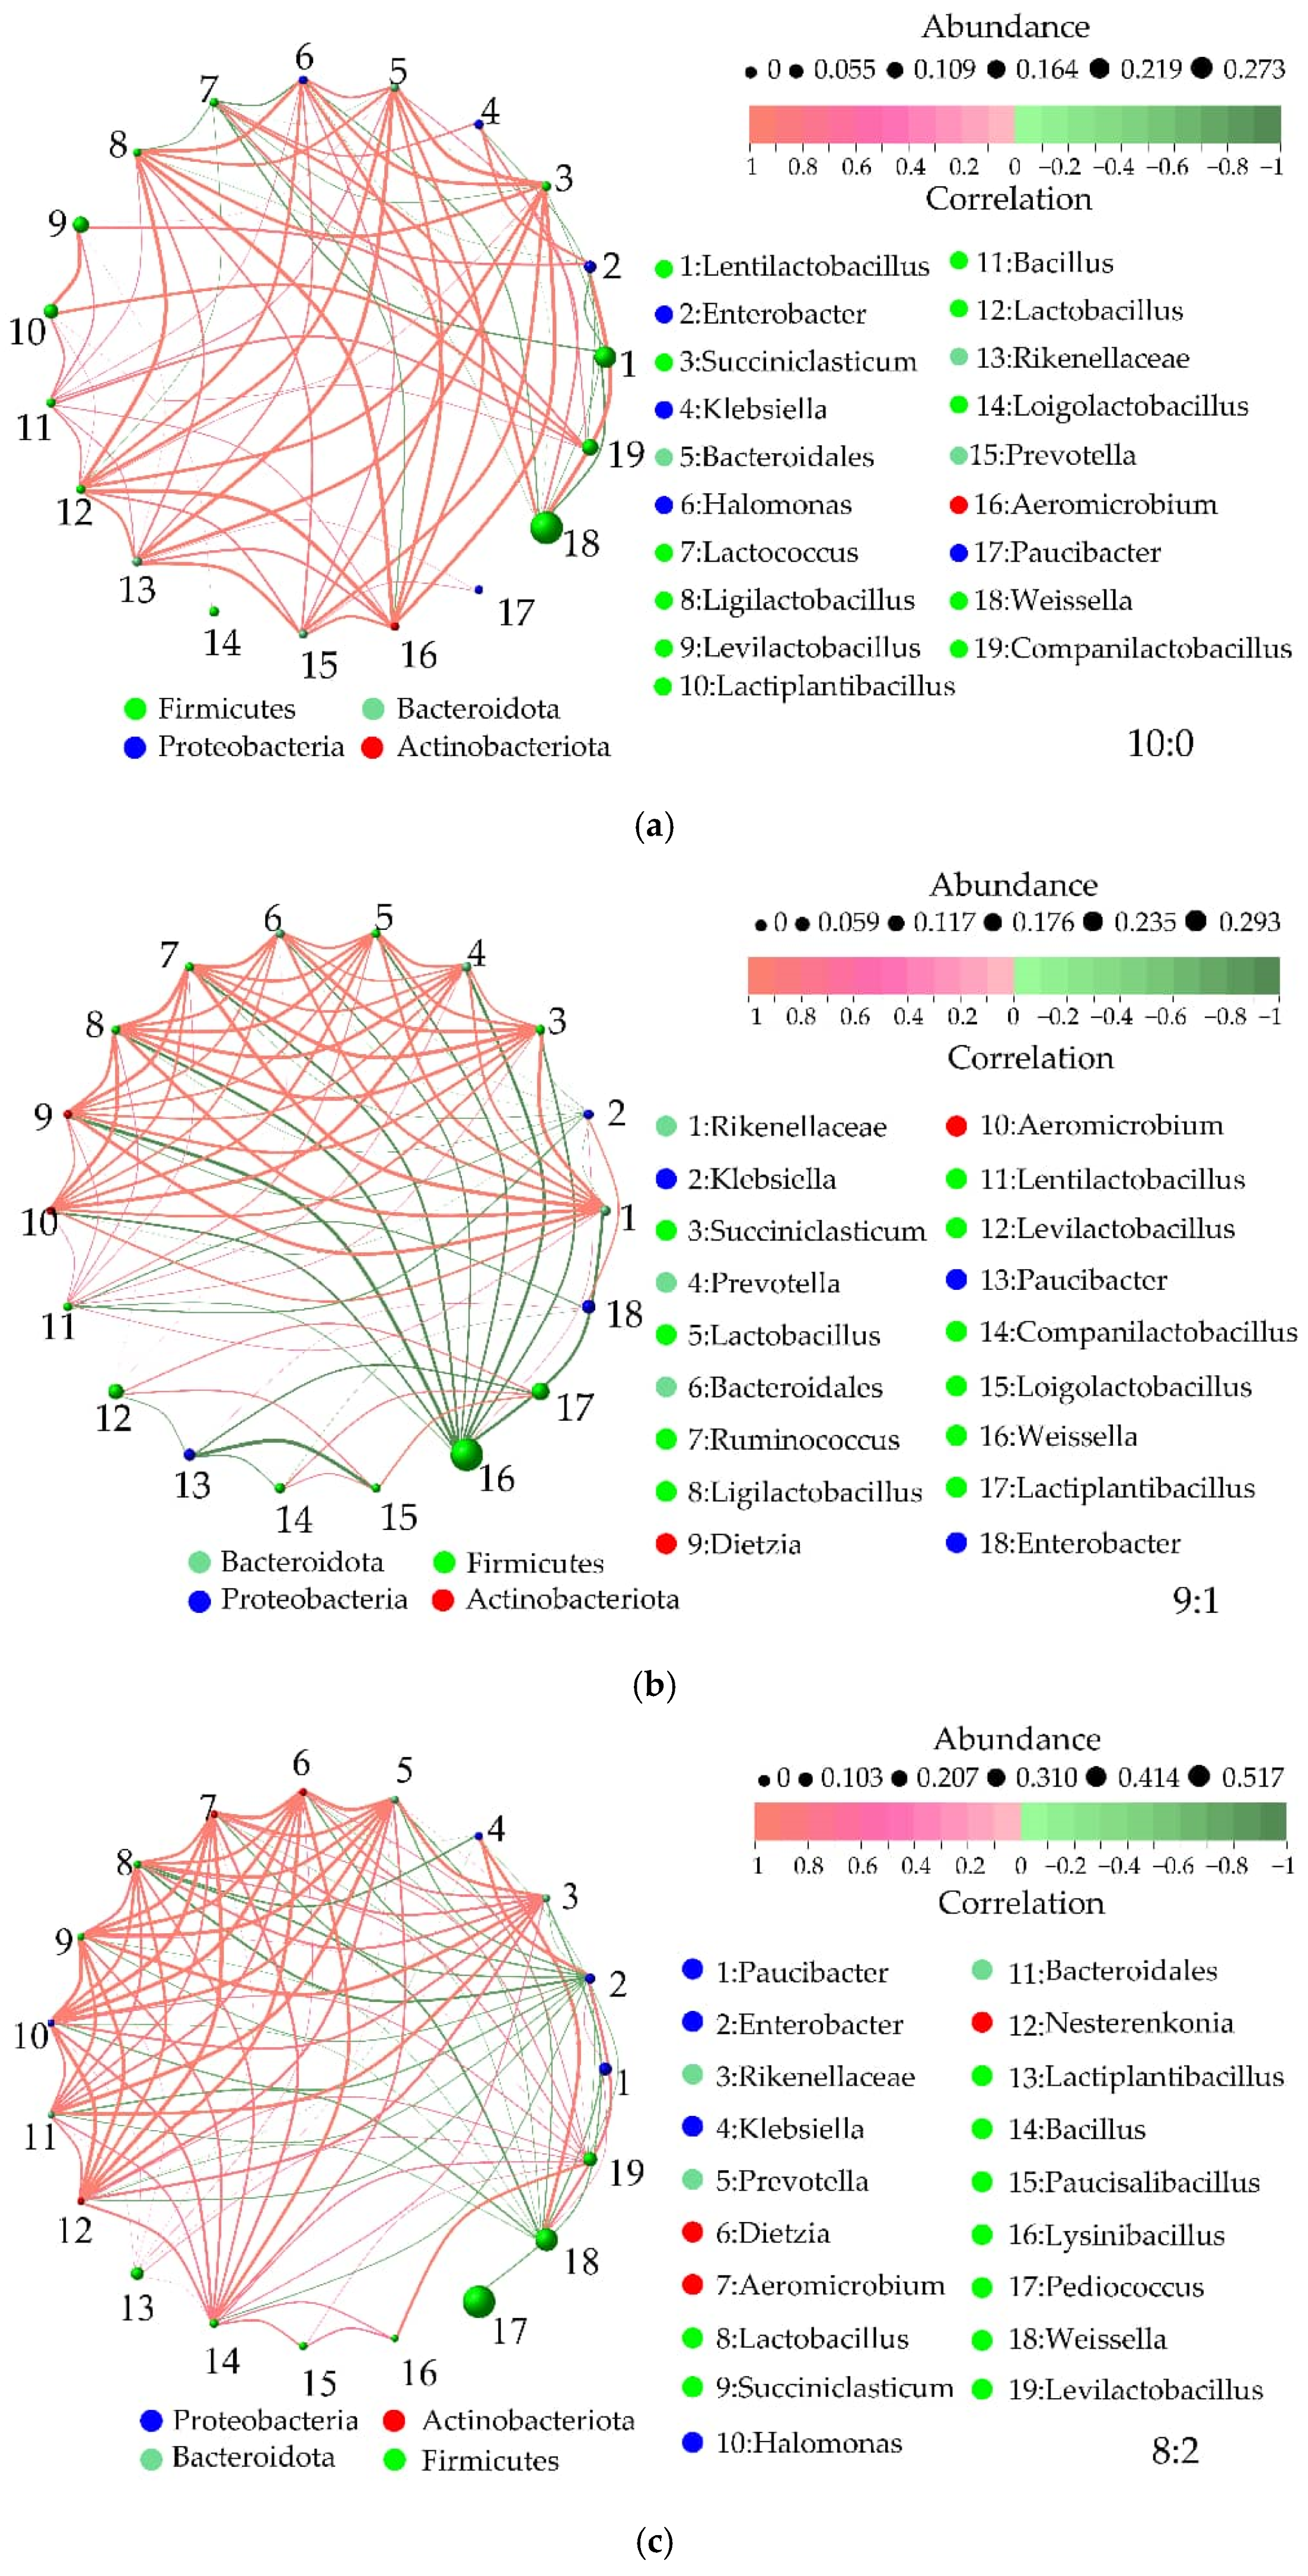
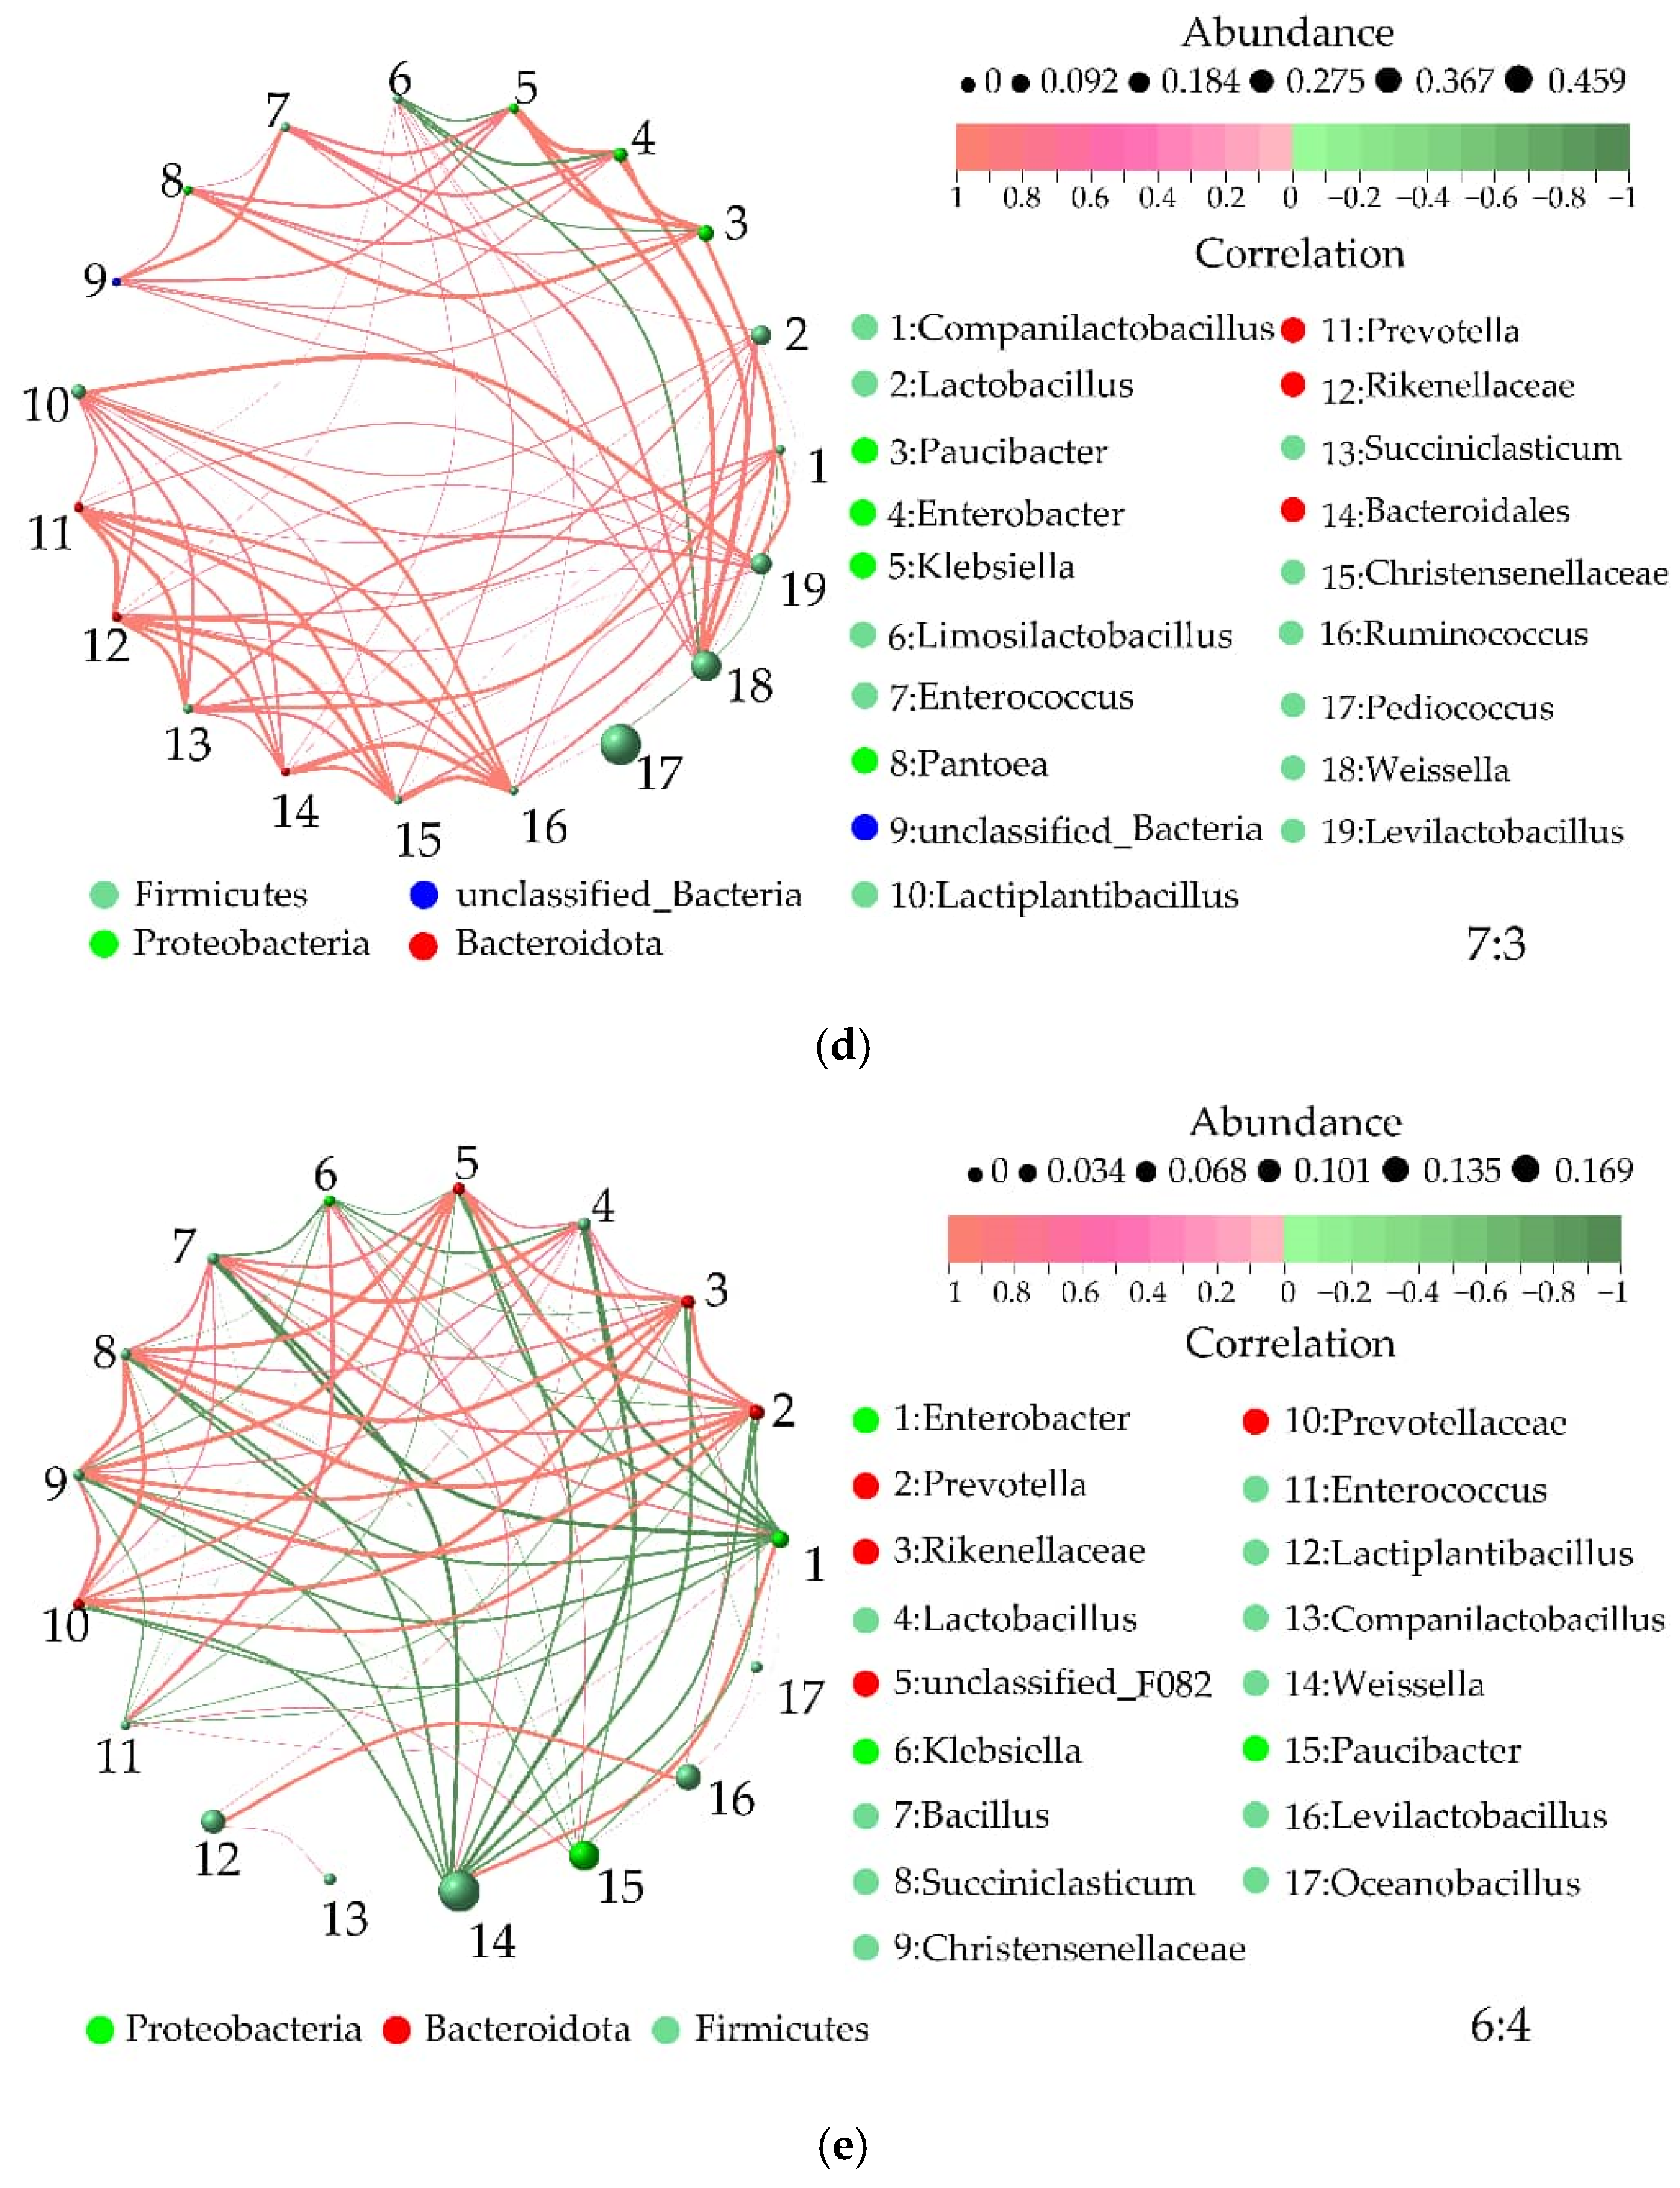
The silage bacterial community network exhibited different occurrence patterns across different treatments (Figure 3). In the 10:0, 9:1, and 6:4 groups, Weissella was the dominant bacterial community with a relatively high abundance, and it could inhibit the proliferation of bacterial communities such as Ruminococcus (9:1), Ligilactobacillus (9:1), Dietazia (9:1), Bacillus (6:4), and Succiniclasticum (6:4). In the 8:2 and 7:3 groups, Pediococcus was the dominant bacterial community, followed by Weissella, and there was mutual inhibition between Pediococcus and Weissella; in the 8:2 group, bacterial communities such as Halomonas proliferated; in the 7:3 group, Weissella inhibited the proliferation of Limosilactobacillus.

3.8. Bacterial Pathways of Mixed Sorghum-Sudangrass and Sesbania Silage

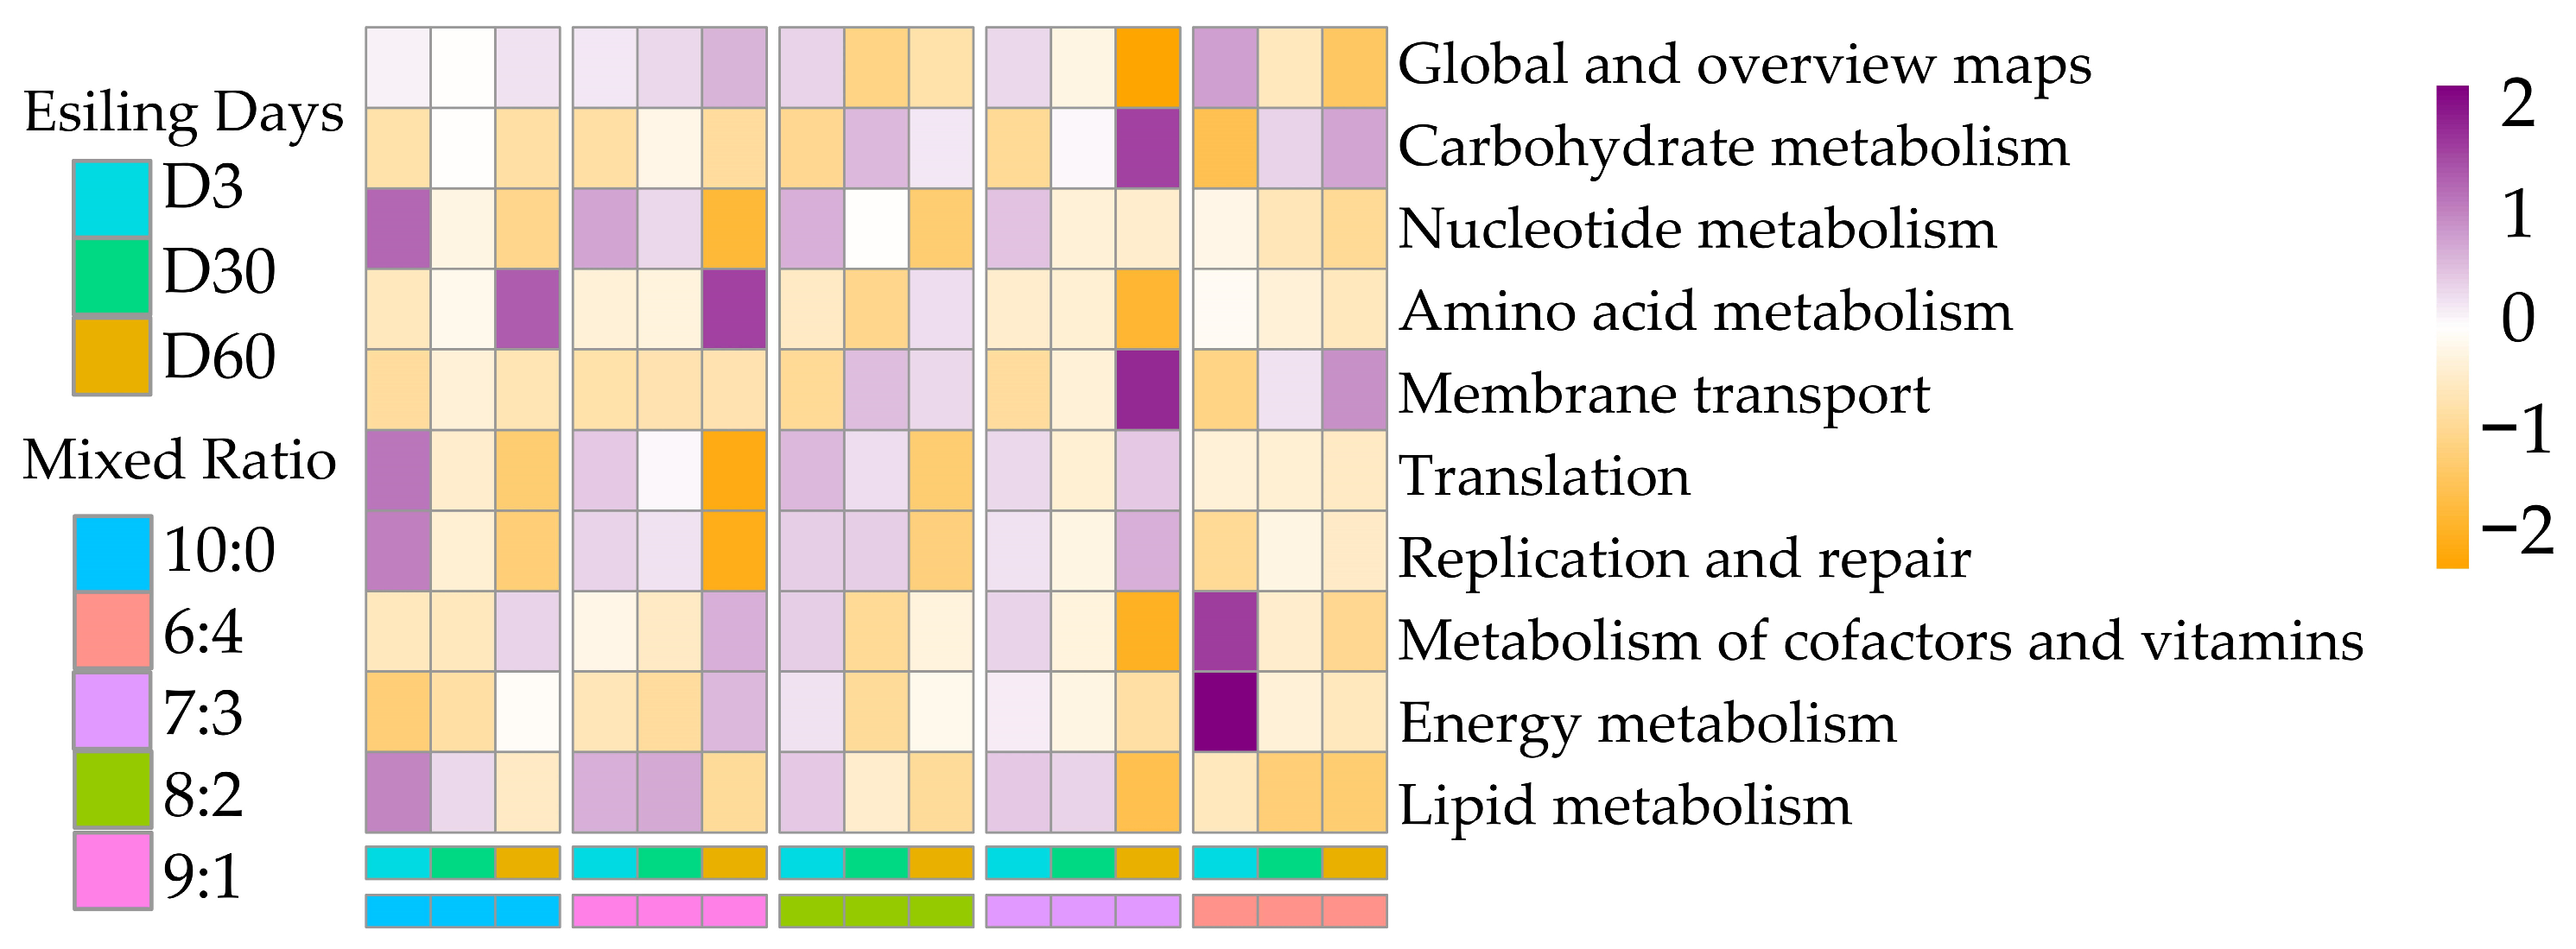
The level 2 functional pathways of mixed sorghum-sudangrass and sesbania silages were analyzed based on Picrust2 predictions (Figure 4). In the 10:0 sorghum-sudangrass and sesbania silage treatment group, on D3 of fermentation, the main metabolic pathways were nucleotide metabolism, translation, replication and repair, and lipid metabolism; by D60 of fermentation, the dominant pathway shifted to amino acid metabolism. In the 9:1 silage treatment group, amino acid metabolism became the dominant pathway on D60 of fermentation. In the 8:2 treatment group, amino acid metabolism and membrane transport were the main metabolic pathways on D60 of fermentation. In the 7:3 treatment group, carbohydrate metabolism and membrane transport served as the main metabolic pathways on the 60th day of fermentation. In the 6:4 treatment group, on D3 of fermentation, the main metabolic pathways were metabolism of cofactors and vitamins and energy metabolism; on the 60th day of fermentation, the main pathways changed to carbohydrate metabolism and membrane transport.

3.9. Correlation Analysis in Bacterial Community with Metabolic Pathways and Physicochemical Properties of Mixed Sorghum-Sudangrass and Sesbania Silage

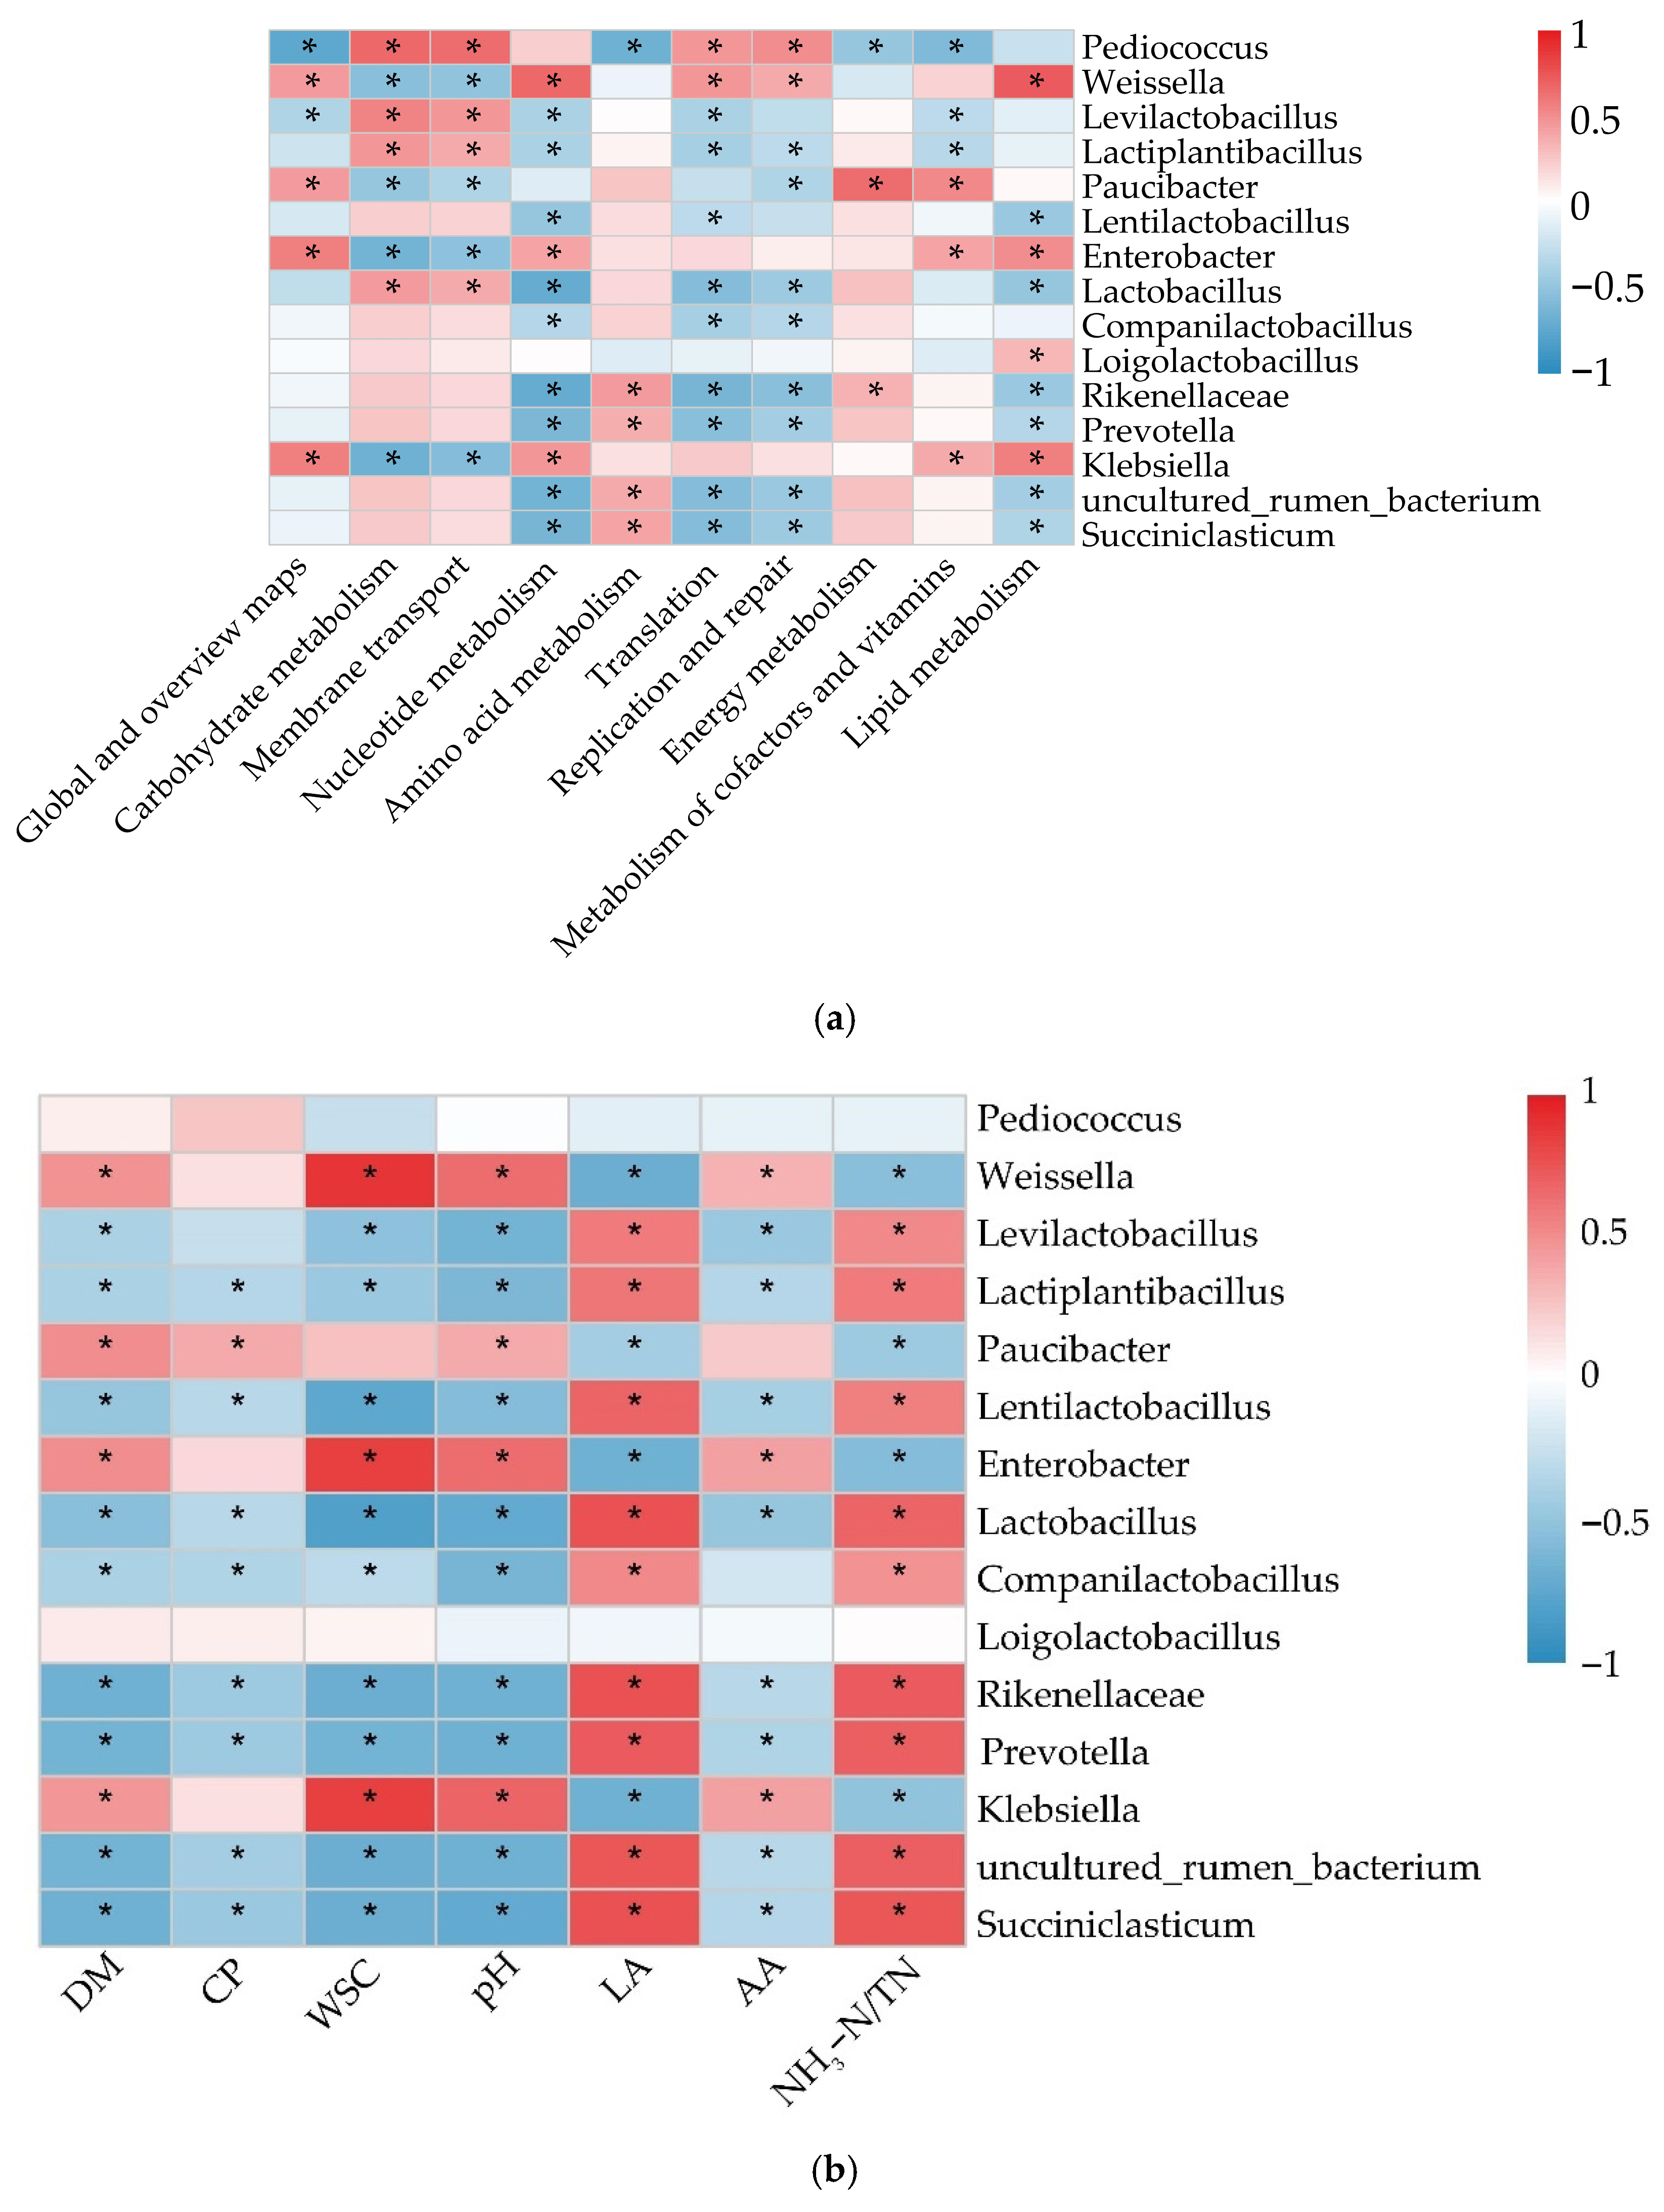
A Spearman correlation heatmap was used to analyze the relationships between the composition of fermentative bacterial communities (top 15 in relative abundance) and metabolic pathways (Level 2) in sorghum-sudangrass and sesbania silages (Figure 5a). The carbohydrate metabolism pathway was significant negatively correlated with Weissella, Paucibacter, Enterobacter, and Klebsiella (p < 0.05), and significant positively correlated with Pediococcus, Levilactobacillus, Lactiplantibacillus, and Lactobacillus. Membrane transport was significantly positively correlated with Pediococcus, Levilactobacillus, Lactiplantibacillus, and Lactobacillus (p < 0.05). Nucleotide metabolism exhibited significant positive correlations with Weissella, Enterobacter, and Klebsiella (p < 0.05). In contrast, amino acid metabolism was significantly negatively correlated with Pediococcus (p < 0.05), but significantly positively correlated with Rikenellaceae, Prevotella, uncultured_rumen_bacterium, and Succiniclasticum (p < 0.05). Both translation and replication and repair pathways showed significant positive correlations with Pediococcus and Weissella (p < 0.05). Energy metabolism was significantly positively correlated with Paucibacter and Rikenellaceae (p < 0.05). Metabolism of cofactors and vitamins demonstrated significant positive correlations with Paucibacter, Enterobacter, and Klebsiella (p < 0.05), while lipid metabolism was significantly positively correlated with Weissella, Enterobacter, and Klebsiella (p < 0.05).
In addition, a Spearman correlation heatmap was employed to evaluate the relationships between fermentative bacterial communities (top 15) and fermentation characteristics as well as chemical components of the silages (Figure 5b). The DM content showed significant positive correlations with Weissella, Paucibacter, Enterobacter, and Klebsiella (p < 0.05). The CP content was significantly positively correlated with Paucibacter (p < 0.05). The WSC content and pH value exhibited significant positive correlations with Weissella, Enterobacter, and Klebsiella (p < 0.05). LA and NH3-N/TN contents were significantly positively correlated with Levilactobacillus, Lactiplantibacillus Lentilactobacillus, Lactobacillus, Companilactobacillus, Rikenellaceae, Prevotella, uncultured_ rumen_bacterium, and Succiniclasticum (p < 0.05), but significantly negatively correlated with bacterial communities including Weissella (p < 0.05). The AA content was significantly positively correlated with Weissella, Enterobacter, and Klebsiella (p < 0.05).

4. Discussion

4.1. Chemical Composition and Fermentation Characteristics of Mixed Sorghum-Sudangrass and Sesbania Silage

Changes in chemical composition during ensiling result from the combined effects of microbial metabolism and raw material characteristics, directly reflecting the nutrient preservation capacity of the silage [9]. In this study, the decrease in DM content with fermentation days may be related to the decomposition of organic matter caused by microbial respiratory consumption and enzymatic hydrolysis [26]. On average across fermentation times, the 6:4 and 7:3 mixing ratios had significantly higher DM content than other ratios (p < 0.05), indicating that they better preserved dry matter in mixed silage. The WSC provided by sorghum-sudangrass and the CP provided by sesbania created a more balanced substrate environment. They not only met the demand for rapid proliferation and acid production by lactic acid bacteria, thereby inhibiting spoilage microbial activity, but also avoided the substrate depletion caused by excessive WSC consumption when using a single raw material (such as sorghum-sudangrass alone), thus reducing unnecessary organic matter decomposition. The CP content generally decreased with fermentation time. But CP retention in all mixed-silage groups was significantly higher than that in the single sorghum-sudangrass silage (10:0) at D60, benefiting from the high-protein characteristics of sesbania. It is worth noting that the CP content in the 9:1 and 8:2 groups were significantly lower than that in the 7:3 and 6:4 groups at D60 (p < 0.05). This is because a higher proportion of sorghum-sudangrass leads to increased production of organic acids by lactic acid bacteria. The acidic environment promotes the activity of plant proteases, thereby intensifying protein degradation [20]. NDF contents decreased with fermentation time. The 6:4 group had the highest NDF content, which may be related to the fiber characteristics of sesbania [27]. As the main substrate for lactic acid bacteria fermentation, changes in WSC content directly affect the fermentation process [28]. The WSC content decreased significantly with fermentation days because the lactic acid bacteria showed a pattern of multiplying in large numbers and rapidly utilizing WSC to produce acid during the initial fermentation stage [16]. The WSC content in the 7:3 and 6:4 groups were lower. This is because of the lower WSC content provided by sesbania [29]; most soluble sugars are provided by sorghum-sudangrass, and there was a lower proportion of sorghum-sudangrass added in these two mixing ratios.
The pH level, volatile fatty acid (VFA) content, and ammonium nitrogen (NH3-N) level are key indicators for evaluating silage fermentation quality [30]. It is generally accepted that a pH below 4.2 can effectively inhibit the proliferation of undesirable microorganisms during fermentation [9]. In this study, the pH decreased significantly during the fermentation days, which is closely related to the production of lactic acid and other organic acids via lactic acid bacteria fermentation. The 10:0 group had the lowest mean pH value of 3.91, while the 6:4 mixed group had the highest mean pH of 4.02. This indicates that the pH gradually decreases with an increasing proportion of gramineous crops [13]. The LA content accumulated gradually during fermentation. However, the mean LA content in the 6:4 mixed group was significantly lower than that in other mixing ratios, which may be attributed to the inherently low WSC content and high buffering capacity of sesbania [31]. The NH3-N/TN ratio increased gradually during fermentation. The mean NH3-N/TN ratio in the 10:0 group was significantly higher than that in other treatments. The primary reason is that, in single sorghum-sudangrass silage, the intense proliferation of lactic acid bacteria in the early fermentation stage, combined with its low buffering capacity, created an overly acidic environment. This promoted sustained high activity of plant proteases, leading to extensive protein degradation [32]. In contrast, the 7:3 and 6:4 groups exhibited lower mean NH3-N/TN ratios. This suggests that the addition of sesbania resulted in a milder and more stable acidic environment, which effectively suppressed plant protease activity and reduced protein degradation [33].

4.2. Dynamic Changes in Microbial Count of Mixed Sorghum-Sudangrass and Sesbania Silage

Microorganisms serve as the core drivers of silage fermentation, with dynamic changes in their populations both shaping and being influenced by the fermentation environment, including factors such as pH and substrate availability [34]. In terms of microbial counts, lactic acid bacteria (LAB), as the dominant functional microbes in silage, exhibit population changes that directly reflect fermentation activity [35]. In this study, the 9:1 mixed ratio showed the highest LAB count (9.47 log10 cfu g−1 FM) at D3. This can be attributed to its moderate WSC content and sufficient protein level to support LAB growth, providing suitable conditions for rapid initial proliferation. A slight increase in the lactic acid bacteria (LAB) count was observed in the 7:3 group at D60. This may be attributed to the fact that, when the pH dropped below 4.0, the fermentation environment became relatively extreme, promoting an increase in the relative abundance of more acid-tolerant LAB species (such as Lactobacillus). Consequently, a minor rise in LAB numbers occurred, contributing to the enhancement of the aerobic stability of the silage [36]. The yeast counts in all treatments began to decrease in the early fermentation stage and remained at low levels by D60, with no signs of recovery. This is because yeasts, as facultative anaerobes, become inhibited as an acidic and anaerobic environment develops during ensiling [37,38] leading to a gradual population decline [39,40]. The count of Escherichia coli gradually decreased over the fermentation period, and molds were undetectable after D30. These results indicate that the ensiling process progressively suppressed the growth of undesirable microorganisms.

4.3. Bacterial Community of Mixed Sorghum-Sudangrass and Sesbania Silage

The structural changes in microbial communities reflect their adaptation to environmental changes and substrate utilization, directly determining the achievement of fermentation functions [41]. The decrease in community diversity over fermentation time is a typical characteristic of silage fermentation. Although a wide variety of microorganisms initially inhabit the surface of raw materials, the rapid proliferation of dominant bacteria such as lactic acid bacteria (LAB) during fermentation occupies ecological niches and inhibits other microorganisms, leading to reduced diversity [42]. In this study, the bacterial diversity in all treatments showed a decreasing trend as fermentation progressed. At the phylum level, Proteobacteria were dominant in fresh forage, while Firmicutes showed a highest relative abundance and became the dominant phylum after ensiling. This shift is associated with anaerobic and acidic environmental conditions [43,44]. LAB within Firmicutes are better adapted to such conditions, which is consistent with most silage studies [45,46]. At the genus level, Weissella exhibited high relative abundance in the early fermentation stage (accounting for 55.08% in the 10:0 treatment at D3) due to its ability to rapidly utilize WSC for acid production and adapt to the relatively high initial pH. As the pH gradually decreased, Pediococcus became dominant (comprising 73.42% in the 7:3 treatment at D60), owing to its stronger tolerance to low pH and its capacity to utilize residual complex carbohydrates [47,48]. The high relative abundance and dominance of Lentilactobacillus in the later stages of the 10:0 group (63.55%) is associated with prolonged acidic conditions in sole sorghum-sudangrass silage, under which more acid-tolerant LAB species were found to prevail.
The inhibitory or promotive relationships among dominant bacterial genera within microbial co-occurrence networks represent a core mechanism regulating the process and quality of silage fermentation. By shaping specific microbial niches, these interactions directly influence substrate metabolism, environmental stability, and spoilage risk [49]. In the mixed silage of sorghum-sudangrass and sesbania at a 7:3 ratio, Pediococcus emerged as the dominant genus (reaching a relative abundance of 73.42% at D60) and exhibited a mutually inhibitory relationship with Weissella. This effectively prevented excessive proliferation of Weissella and the consequent wasteful substrate consumption [50]. By continuously metabolizing carbohydrates to produce lactic acid, Pediococcus maintained a stable silage environment at pH 3.88. This low-pH environment directly suppressed the proliferation of butyric acid-producing bacteria [51], which aligns well with the high fermentation quality observed in this treatment—characterized by the absence of detectable butyric acid and a high lactic acid content. Furthermore, the inhibition of potential spoilage-related genera such as Limosilactobacillus by Pediococcus reduced the ammonia-nitrogen content, indirectly improving nutrient preservation efficiency [52]. Additionally, the microbial network dominated by Pediococcus exhibited a higher proportion of negative correlations, indicating stronger network stability and reducing the risk of fermentation fluctuations caused by microbial dysbiosis. This is also a key reason why the 7:3 mixed group maintained relatively high LAB counts and lower dry matter loss in the later stages. In the 10:0 group, the early dominance of Weissella inhibited the proliferation of fiber-degrading bacteria like Ruminococcus [53]. While this promoted rapid acid production initially in early, Lentilactobacillus later became the predominant genus. This change in the dominant genus led to a transition in network structure, causing pH fluctuations during the mid-stage. Although this did not induce spoilage, the efficiency of lactic acid production was slightly lower than in the 7:3 mixed group.
Functional pathway analysis revealed differences in the dominant metabolic pathways among treatments. In the later stages, the 7:3 mixed group was predominantly characterized by carbohydrate metabolism, consistent with its high LAB activity and efficient WSC utilization [27]. In contrast, the 10:0 group primarily exhibited amino acid metabolism in the later stages, which corresponds to its higher NH3-N/TN ratio. In the overly acidic environment, plant protease activity was enhanced, leading to increased protein degradation [32]. This functional adaptability ensures that, across different mixing ratios, microorganisms can maintain fermentation stability by adjusting their metabolic strategies.

4.4. Correlation Analysis of Bacterial Communities with Metabolic Pathways and Chemical Indicators of Mixed Sorghum-Sudangrass and Sesbania Silage

The bacterial community serves as the core driver of silage fermentation, with its composition and metabolic functions directly determining the chemical characteristics and fermentation quality of the silage [54]. In this study, Spearman correlation analysis revealed strong associations between dominant bacterial genera and metabolic pathways, fermentation parameters, and chemical components. Carbohydrate metabolism, as the central pathway for acid production by lactic acid bacteria, showed a significant positive correlation with genera such as Pediococcus, Levilactobacillus, and Lactiplantibacillus (p < 0.05), while it correlated negatively with Weissella. This result reflects the coordinated microbial utilization of carbohydrates at different fermentation stages [55]. Although Weissella, as a pioneer bacterium, initiates acid production during early fermentation, more acid-tolerant LAB including Pediococcus and Levilactobacillus become dominant in the mid-to-late stages and sustain the activity of the carbohydrate metabolism pathway [56,57]. This indicates their ability to efficiently utilize complex carbohydrates, such as fiber degradation products, to maintain lactic acid production. These findings are consistent with the dominance of carbohydrate metabolism and the high relative abundance of Pediococcus in the later stage of the 7:3 treatment.
Amino acid metabolism was significantly negatively correlated with Pediococcus but positively correlated with genera such as Rikenellaceae and Prevotella. This suggests that the Pediococcus may help suppress excessive protein degradation [58]. The greater reduction in CP content observed in the 9:1 mixed group may be related to the lower abundance of Pediococcus and higher activity of amino acid metabolism-related bacteria in this treatment.
Membrane transport showed a positive correlation with Pediococcus and Levilactobacillus, reflecting the ability of these genera to enhance metabolic efficiency through efficient substrate transport, such as sugars and amino acids [59]. In contrast, nucleotide metabolism was positively correlated with Weissella and Enterobacter, indicating high demand for nucleic acid synthesis during the rapid microbial proliferation in the early fermentation stage [60].
Changes in bacterial community composition directly affect silage fermentation parameters and nutritional components, revealing the regulatory role of microorganisms in silage quality [61]. The LA content was significantly positively correlated with lactic acid bacterial genera such as Levilactobacillus and Lactiplantibacillus (p < 0.05), and significantly negatively correlated with Weissella (p < 0.05), explaining the differences in acidity among different bacterial communities. In the 10:0 group, the dominance of Lentilactobacillus in the later stage (63.55%) promoted LA accumulation. pH was positively correlated with Weissella and Paucibacter, and negatively correlated with Levilactobacillus, further validating the pH-reducing effect of lactic acid production by LAB [60]. Dry matter (DM) was positively correlated with Weissella and Paucibacter, suggesting that these genera may help reduce excessive DM loss in the initial stage. For example, the higher DM retention in the 7:3 mixed group may be related to the balance between Weissella and Pediococcus. The WSC was positively correlated with Weissella, reflecting the dependence of these bacteria on WSC and indicating that Weissella rapidly proliferates by utilizing WSC in the early stage. The NH3-N/TN ratio, an indicator of protein degradation, was positively correlated with Levilactobacillus and Lentilactobacillus and negatively correlated with Weissella. This suggests that some lactic acid bacteria may be involved in protein breakdown, especially when substrates are limited in the later stages [62]. This is consistent with the observation that the 10:0 group exhibited both a high relative abundance of Lentilactobacillus and a high NH3-N/TN ratio in the later fermentation phase.

5. Conclusions

This study investigated the dynamic changes in mixed ratios in sorghum-sudangrass and sesbania in chemical composition, fermentation quality, and bacterial community. The results showed that ensiling until D60 at appropriate mixing ratios helped improve the preservation rates of dry matter (DM) and crude protein (CP). The structure of the bacterial community changed dynamically during the fermentation process, with the composition at the later stage (D60) being distinctly different from that at the initial phase. Specifically, the sorghum-sudangrass monoculture group (10:0) was dominated by Lentilactobacillus at D60, whereas the mixed ratio groups were generally dominated by Pediococcus. These findings systematically reveal the interrelated changes in nutrient preservation, fermentation characteristics, and microbial communities during mixed ensiling, providing useful supporting data and theoretical references for the practice of mixed ensiling of sorghum-sudangrass and sesbania.

Author Contributions

Conceptualization and investigation, Q.H. and L.X.; methodology and software, Q.H. and Y.S.; validation, formal analysis, Q.H. and Y.S.; resources and data curation, Q.H. and Y.Z.; writing—original draft preparation, Q.H.; writing—review and editing, Q.H., supervision, L.X. and Y.Z.; funding acquisition, L.X. and Y.Z. All authors have read and agreed to the published version of the manuscript.

Funding

This work was financially supported by the High-Quality Forage Industry Technology System of the Autonomous Region in Xinjiang Province of China (grant number XJARS-13-02) and the Xinjiang Production and Construction Corps Talent Project in China (grant number 2024 DB003).

Data Availability Statement

The data presented in this study are available within the article. Further inquiries can be directed to the corresponding author, L.X.

Acknowledgments

We extend our sincere gratitude to all external reviewers for their invaluable guidance and constructive feedback during the revision process.

Conflicts of Interest

The authors declare no conflicts of interest.

References

  1. Muck, R.E.; Nadeau, E.M.G.; McAllister, T.A.; Contreras-Govea, F.E.; Santos, M.C.; Kung, L., Jr. Silage review: Recent advances and future uses of silage additives. J. Dairy Sci. 2018, 101, 3980–4000. [Google Scholar] [CrossRef] [PubMed]
  2. Kaplan, M.; Kara, K.; Unlukara, A.; Kale, H.; Buyukkilic, S.; Varol, I.S.; Kizilsimsek, M.; Kamalak, A. Water deficit and nitrogen affects yield and feed value of sorghum sudangrass silage. Agric. Water Manag. 2019, 218, 30–36. [Google Scholar] [CrossRef]
  3. Bhattarai, B.; Singh, S.; West, C.P.; Saini, R. Forage Potential of Millet and Forage Sorghum Alternatives to Corn under the Water-Limiting Conditions of the Texas High Plains: A Review. Crop Forage Turfgrass Manag. 2019, 5, 1–12. [Google Scholar] [CrossRef]
  4. He, T.; Sun, G.; He, S.; Zhang, Z.; Dong, J.; Zhu, X.; Dai, J.; Wang, K.; Xing, J. Full-Length Transcriptome Analysis of Sesbania cannabina Stem Response to Waterlogging Stress. Agronomy 2025, 15, 1197. [Google Scholar] [CrossRef]
  5. Farruggia, F.T.; Lavin, M.; Martin, F. Phylogenetic Systematics and Biogeography of the Pantropical Genus Sesbania (Leguminosae). Syst. Bot. 2018, 43, 414–429. [Google Scholar] [CrossRef]
  6. Khalili, H.; Varvikko, T. Effect of replacement of concentrate mix by wilted Sesbania (Sesbania sesban) forage on diet digestibility, rumen fermentation and milk production in Friesian × Zebu (Boran) crossbred cows fed low quality native hay. Anim. Feed Sci. Technol. 1992, 36, 275–286. [Google Scholar] [CrossRef]
  7. Desta, T. Effect of Supplementation Dried Sesbania Sesban (L.) Leaf on Performance of Abergelle Rams. J. Biol. Agric. Healthc. 2016, 6, 125–129. [Google Scholar]
  8. Wilkinson, J.M.; Davies, D.R. The aerobic stability of silage: Key findings and recent developments. Grass Forage Sci. 2013, 68, 1–19. [Google Scholar] [CrossRef]
  9. Wang, T.W.; Zhang, J.Q.; Shi, W.X.; Sun, J.H.; Xia, T.Q.; Huang, F.Q.; Liu, Y.Y.; Li, H.K.Y.; Teng, K.L.; Zhong, J. Dynamic Changes in Fermentation Quality and Structure and Function of the Microbiome during Mixed Silage of Sesbania cannabina and Sweet Sorghum Grown on Saline-Alkaline Land. Microbiol. Spectr. 2022, 10, e02483-22. [Google Scholar] [CrossRef]
  10. Ni, K.K.; Zhao, J.Y.; Zhu, B.G.; Su, R.; Pan, Y.; Ma, J.K.; Zhou, G.A.; Tao, Y.; Liu, X.R.; Zhong, J. Assessing the fermentation quality and microbial community of the mixed silage of forage soybean with crop corn or sorghum. Bioresour. Technol. 2018, 265, 563–567. [Google Scholar] [CrossRef]
  11. Wana, D. Effect of Intercropping Oats with Alfalfa on Dry Matter Yield, Nutritive Value, In Vitro Ruminal Fermentation Kinetics and Silage Quality. Master’s Thesis, Jimma University, Jimma, Ethiopia, 2024. [Google Scholar]
  12. Chen, L.; Dong, Z.H.; Li, J.F.; Shao, T. Ensiling characteristics, in vitro rumen fermentation, microbial communities and aerobic stability of low-dry matter silages produced with sweet sorghum and alfalfa mixtures. J. Sci. Food Agric. 2019, 99, 2140–2151. [Google Scholar] [CrossRef] [PubMed]
  13. Contreras-Govea, F.; Marsalis, M.; Angadi, S.; Smith, G.R.; Lauriault, L.M.; VanLeeuwen, D. Fermentability and nutritive value of corn and forage sorghum silage when in mixture with lablab bean. Crop Sci. 2011, 51, 1307–1313. [Google Scholar] [CrossRef]
  14. Bertilsson, J.; Akerlind, M.; Eriksson, T. The effects of high-sugar ryegrass/red clover silage diets on intake, production, digestibility, and N utilization in dairy cows, as measured in vivo and predicted by the NorFor model. J. Dairy Sci. 2017, 100, 7990–8003. [Google Scholar] [CrossRef] [PubMed]
  15. Contreras-Govea, F.E.; Muck, R.E.; Armstrong, K.L.; Albrecht, K.A. Nutritive value of corn silage in mixture with climbing beans. Anim. Feed Sci. Technol. 2009, 150, 1–8. [Google Scholar] [CrossRef]
  16. Xia, T.Q.; Wang, T.W.; Sun, J.H.; Shi, W.X.; Liu, Y.Y.; Huang, F.Q.; Zhang, J.Q.; Zhong, J. Modulation of fermentation quality and metabolome in co-ensiling of Sesbania cannabina and sweet sorghum by lactic acid bacterial inoculants. Front. Microbiol. 2022, 13, 851271. [Google Scholar] [CrossRef]
  17. Guo, H. Analysis of fermentation quality and nutritional components of mixed silage of alfalfa and sorghum hybrid sudangrass in different proportions. J. Henan Agric. Sci. 2021, 50, 149. [Google Scholar]
  18. Helrich, K. Official Methods of Analysis, 15th ed.; Association of Official Analytical Chemists (AOAC): Rockville, MD, USA, 1990; pp. 72–74. [Google Scholar]
  19. Dong, Z.H.; Li, J.F.; Chen, L.; Wang, S.R.; Liu, Q.H.; Shao, T. Using proteomics to decipher the effect of tissue damage on the fate of red clover proteins during ensiling. Anim. Feed Sci. Technol. 2019, 257, 114271. [Google Scholar] [CrossRef]
  20. Dong, Z.H.; Li, J.F.; Chen, L.; Wang, S.R.; Dong, D.; Shao, T. Time of day for harvest affects the fermentation parameters, bacterial community, and metabolic characteristics of sorghum-sudangrass hybrid silage. mSphere 2022, 7, e00168-22. [Google Scholar] [CrossRef]
  21. Bolger, A.M.; Lohse, M.; Usadel, B. Trimmomatic: A flexible trimmer for Illumina sequence data. Bioinformatics 2014, 30, 2114–2120. [Google Scholar] [CrossRef]
  22. Martin, M. Cutadapt removes adapter sequences from high-throughput sequencing reads. EMBnet J. 2011, 17, 10–12. [Google Scholar] [CrossRef]
  23. Edgar, R.C.; Haas, B.J.; Clemente, J.C.; Quince, C.; Knight, R. UCHIME improves sensitivity and speed of chimera detection. Bioinformatics 2011, 27, 2194–2200. [Google Scholar] [CrossRef]
  24. Edgar, R.C. UPARSE: Highly accurate OTU sequences from microbial amplicon reads. Nat. Methods 2013, 10, 996–998. [Google Scholar] [CrossRef] [PubMed]
  25. Altschul, S.F.; Gish, W.; Miller, W.; Myers, E.W.; Lipman, D.J. Basic local alignment search tool. J. Mol. Biol. 1990, 215, 403–410. [Google Scholar] [CrossRef] [PubMed]
  26. Naeini, S.Z.; Emami, N.K.; Rowghani, E.; Bayat, A. Influence of ensiling time on chemical composition, fermentation characteristics, gas production and protein fractions of sweet sorghum silage. Res. Options Anim. Vet. Sci. 2014, 4, 286–293. [Google Scholar]
  27. Xia, T.Q.; Tagir, M.; Wang, T.W.; Wang, Y.D.; Zhang, X.M.; Liu, S.J.; Teng, K.L.; Fu, Z.H.; Yun, F.F.; Wang, S.Y.; et al. Lactobacillus cocktail and cellulase synergistically improve the fiber transformation rate in Sesbania cannabina and sweet sorghum mixed silage. Chem. Biol. Technol. Agric. 2024, 11, 81. [Google Scholar] [CrossRef]
  28. Du, Z.M.; Risu, N.; Gentu, G.; Jia, Y.S.; Cai, Y.M. Dynamic changes and characterization of the protein and carbohydrate fractions of native grass grown in Inner Mongolia during ensiling and the aerobic stage. Asian Australas. J. Anim. Sci. 2019, 33, 556. [Google Scholar] [CrossRef]
  29. Tahir, M.; Wang, T.; Zhang, J.; Zhang, J.Q.; Xia, T.W.; Deng, X.; Cao, X.F.; Zhong, J. Compound lactic acid bacteria enhance the aerobic stability of Sesbania cannabina and corn mixed silage. BMC Microbiol. 2025, 25, 68. [Google Scholar] [CrossRef]
  30. Ni, K.K.; Wang, F.F.; Zhu, J.X.; Yang, G.A.; Pan, Y.; Tao, Y.; Zhong, J. Effects of lactic acid bacteria and molasses additives on the microbial community and fermentation quality of soybean silage. Bioresour. Technol. 2017, 238, 706–715. [Google Scholar] [CrossRef]
  31. McDonald, P.; Henderson, A.R.; Heron, S. The Biochemistry of Silage, 2nd ed.; Chalcombe Publications: Southampton, UK, 1991. [Google Scholar]
  32. Xia, T.Q.; Wang, T.W.; Zhang, J.Q.; Li, H.K.Y.; Sun, J.H.; Liu, S.J.; Yun, F.F.; Teng, K.L.; Jin, S.J.; Wang, S.Y.; et al. In-depth proteomic analysis of alfalfa silage inoculated with Lactiplantibacillus plantarum reveals protein transformation mechanisms and optimizes dietary nitrogen utilization. Int. J. Biol. Macromol. 2025, 309, 142638. [Google Scholar] [CrossRef]
  33. Mokhtar, F.A.; Ahmed, M.; Al Dhanhani, A.S.; Elbehairi, S.E.I.; Alfaif, M.Y.; Shati, A.A.; Fakhry, A.M. Distribution, Phytochemical insights, and cytotoxic potential of the sesbania genus: A comprehensive review of Sesbania grandiflora, Sesbania sesban, and Sesbania cannabina. Pharmaceuticals 2025, 18, 64. [Google Scholar] [CrossRef]
  34. Pahlow, G.; Honig, H. The role of microbial additives in the aerobic stability of silage. In Proceedings of the 15th General Meeting of the European Grassland Federation, Wageningen, The Netherlands, 6–9 June 1994; Wageningen Pers: Wageningen, The Netherlands, 1994; pp. 49–51. [Google Scholar]
  35. Zeng, T.; Li, X.L.; Guan, H.; Yang, W.Y.; Liu, W.G.; Liu, J.; Du, Z.C.; Li, X.M.; Xiao, Q.Y.; Wang, X.C.; et al. Dynamic microbial diversity and fermentation quality of the mixed silage of corn and soybean grown in strip intercropping system. Bioresour. Technol. 2020, 313, 123655. [Google Scholar] [CrossRef] [PubMed]
  36. Nishino, N.; Yoshida, M.; Shiota, H.; Sakaguchi, E. Accumulation of 1,2-propanediol and enhancement of aerobic stability in whole crop maize silage inoculated with Lactobacillus buchneri. J. Appl. Microbiol. 2003, 94, 800–807. [Google Scholar] [CrossRef] [PubMed]
  37. Duniere, L.; Jin, L.; Smiley, B.; Qi, M.; Rutherford, W.; Wang, Y.; Mcallister, T. Impact of adding Saccharomyces strains on fermentation, aerobic stability, nutritive value, and select lactobacilli populations in corn silage. J. Anim. Sci. 2015, 93, 2322–2335. [Google Scholar] [CrossRef] [PubMed]
  38. Selwet, M. Effect of organic acids on numbers of yeasts and mould fungi and aerobic stability in the silage of corn. Pol. J. Vet. Sci. 2008, 11, 119. [Google Scholar]
  39. Wang, X.L.; Song, J.M.; Liu, Z.H.; Zhang, G.N.; Zhang, Y.G. Fermentation quality and microbial community of corn stover or rice straw silage mixed with soybean curd residue. Animals 2022, 12, 919. [Google Scholar] [CrossRef]
  40. Zhao, M.R.; Zhang, H.Y.; Pan, G.; Yin, H.; Sun, J.J.; Yu, Z.; Bai, C.S.; Xue, Y.L. Effect of exogenous microorganisms on the fermentation quality, nitrate degradation and bacterial community of sorghum-sudangrass silage. Front. Microbiol. 2022, 13, 1052837. [Google Scholar] [CrossRef]
  41. Xiao, Y.; Sun, L.; Xin, X.P.; Xu, L.J.; Du, S. Physicochemical characteristics and microbial community succession during oat silage prepared without or with Lactiplantibacillus plantarum or Lentilactobacillus buchneri. Microbiol. Spectr. 2023, 11, e02228-23. [Google Scholar] [CrossRef]
  42. Zhang, L.; Zeng, Y.; Fu, L.; Zhou, Y.; Chen, J.C.; Wang, G.F.; Ran, W.F.; Hu, L.; Hu, R.; Zhou, J.; et al. Dynamic Changes in Microorganisms and Metabolites During Silage Fermentation of Whole Winter Wheat. Vet. Sci. 2025, 12, 708. [Google Scholar] [CrossRef]
  43. Keshri, J.; Chen, Y.R.; Pinto, R.; Kroupitski, Y.; Weinberg, Z.G.; Sela, S. Microbiome dynamics during ensiling of corn with and without Lactobacillus plantarum inoculant. Appl. Microbiol. Biotechnol. 2018, 102, 4025–4037. [Google Scholar] [CrossRef]
  44. Ali, N.; Wang, S.R.; Zhao, J.; Dong, Z.H.; Li, J.F.; Nazar, M.; Shao, T. Microbial diversity and fermentation profile of red clover silage inoculated with reconstituted indigenous and exogenous epiphytic microbiota. Bioresour. Technol. 2020, 314, 123606. [Google Scholar] [CrossRef]
  45. Zhao, Y.Y.; Liu, D.P.; Chen, Y.L.; Lei, Y.; Li, M.Y.; Wang, J.; He, X.J.; Yang, Y.; Zhang, X.Y.; Liu, S.; et al. Enhancing alfalfa and sorghum silage quality using agricultural wastes: Fermentation dynamics, microbial communities, and functional insights. BMC Plant Biol. 2025, 25, 728. [Google Scholar] [CrossRef]
  46. Puntillo, M.; Peralta, G.H.; Bürgi, M.D.M.; Huber, P.; Gaggiotti, M.; Binetti, A.G.; Vinderola, G. Metaprofiling of the bacterial community in sorghum silages inoculated with lactic acid bacteria. J. Appl. Microbiol. 2022, 133, 2375–2389. [Google Scholar] [CrossRef] [PubMed]
  47. Fitzsimons, A.; Duffner, F.; Curtin, D.; Brophy, G.; O’Kiely, P.; O’Connell, M. Assessment of Pediococcus acidilactici as a potential silage inoculant. Appl. Environ. Microbiol. 1992, 58, 3047–3052. [Google Scholar] [CrossRef] [PubMed]
  48. Romero, J.J.; Park, J.; Joo, Y.; Zhao, Y.; Killerby, M.; Reyes, D.C.; Tiezzi, F.; GutierrezRodriguez, E.; Castillo, M.S. A combination of Lactobacillus buchneri and Pediococcus pentosaceus extended the aerobic stability of conventional and brown midrib mutants-corn hybrids ensiled at low dry matter concentrations by causing a major shift in their bacterial and fungal community. J. Anim. Sci. 2021, 99, skab141. [Google Scholar] [PubMed]
  49. Du, Z.M.; Lin, Y.L.; Sun, L.; Yang, F.Y.; Cai, Y.M. Microbial community structure, co-occurrence network and fermentation characteristics of woody plant silage. J. Sci. Food Agric. 2022, 102, 1193–1204. [Google Scholar] [CrossRef]
  50. Wróbel, B.; Nowak, J.; Fabiszewska, A.; Paszkiewicz-Jasińska, A.; Przystupa, W. Dry matter losses in silages resulting from epiphytic microbiota activity—A comprehensive study. Agronomy 2023, 13, 450. [Google Scholar] [CrossRef]
  51. Xiong, Y.; Xu, J.; Guo, L.; Chen, F.; Jiang, D.; Lin, Y.; Guo, C.; Li, X.; Chen, Y.; Ni, K.; et al. Exploring the effects of different bacteria additives on fermentation quality, microbial community and in vitro gas production of forage oat silage. Animals 2022, 12, 1122. [Google Scholar] [CrossRef]
  52. Chen, Y.; Li, S.; Sun, Y.; Chai, Y.; Jia, S.; Ma, C.; Zhang, F. The Effects of Lactococcus garvieae and Pediococcus pentosaceus on the characteristics and microbial community of urtica cannabina silage. Microorganisms 2025, 13, 1453. [Google Scholar] [CrossRef]
  53. Chassard, C.; Delmas, E.; Robert, C.; Lawson, P.A.; Bernalier-Donadille, A. Ruminococcus champanellensis sp. nov., a cellulose-degrading bacterium from human gut microbiota. Int. J. Syst. Evol. Microbiol. 2012, 62, 138–143. [Google Scholar] [CrossRef]
  54. Hong, Y.; Bing, W.; Qing, Z.; Hui, C.; Zhu, Y. Improvement of fermentation quality in the fermented total mixed ration with oat silage. Microorganisms 2021, 9, 420. [Google Scholar] [CrossRef]
  55. Lijun, Y.; Weichen, B.; Caiqing, Y.; Feiyan, Z.; Hao, J.; Weiqiang, H.; Bohai, L.; Laiyu, K.; Wenjun, L. Changes in chemical composition, structural and functional microbiome during alfalfa (Medicago sativa) ensilage with Lactobacillus plantarum PS-8. Anim. Nutr. 2022, 9, 100–109. [Google Scholar] [CrossRef]
  56. Drouin, P.; Tremblay, J.; Chaucheyras-Durand, F. Dynamic succession of microbiota during ensiling of whole plant corn following inoculation with Lactobacillus buchneri and Lactobacillus hilgardii alone or in combination. Microorganisms 2019, 7, 595. [Google Scholar] [CrossRef] [PubMed]
  57. Dongmei, X.; Nian, W.; Marketta, R.; Wencan, K.; Zwika, G.W.; Mi, D.; Jie, B.; Yixin, Z.; Fuhou, L.; Xusheng, G. The bacterial community and metabolome dynamics and their interactions modulate fermentation process of whole crop corn silage prepared with or without inoculants. Microb. Biotechnol. 2021, 14, 561–576. [Google Scholar]
  58. Wang, S.; Dong, Z.; Li, J.; Chen, L.; Shao, T. Pediococcus acidilactici strains as silage inoculants for improving the fermentation quality, nutritive value and in vitro ruminal digestibility in different forages. J. Appl. Microbiol. 2019, 126, 424–434. [Google Scholar] [CrossRef] [PubMed]
  59. Zhou, H.Z.; Jia, S.G.; Gao, Y.; Li, X.M.; Lin, Y.L.; Yang, F.Y.; Ni, K.K. Characterization of phyllosphere endophytic lactic acid bacteria reveals a potential novel route to enhance silage fermentation quality. Commun. Biol. 2024, 7, 117. [Google Scholar] [CrossRef]
  60. Liang, X.Y.; Shao, T.; Li, J.F.; Dong, Z.H.; Zhao, J. Fermentation Dynamics, Microbial Succession, and Metabolic Shifts in High-Moisture Giant Juncao Silage. Agronomy 2025, 15, 1028. [Google Scholar] [CrossRef]
  61. Guo, L.; Wang, Y.; Wang, X.K.; Li, X.M.; Xiong, Y.; Lin, Y.L.; Ni, K.K.; Yang, F.Y. Dynamic fermentation quality and bacterial community structure of paper mulberry silage from three regions of China. Chem. Biol. Technol. Agric. 2023, 10, 51. [Google Scholar] [CrossRef]
  62. Lei, Y.; Li, M.; Liu, Y.; Wang, J.; He, X.; Zhao, Y.; Chen, Y.; Cheng, Q.; Chen, C. Lactic acid bacteria and formic acid improve fermentation quality and beneficial predicted functional characteristics in mixed silage consisting of alfalfa and perennial ryegrass. Fermentation 2024, 10, 43. [Google Scholar] [CrossRef]
Figure 1. Bacterial community diversity of mixed sorghum-sudangrass and sesbania silage fermentation. In the figure, SS and SB refer to fresh sorghum-sudangrass and sesbania, respectively. The lowercase letters in the figure indicate significant differences between treatments (p < 0.05). The error bars represent the standard error of the means.
Agronomy 16 00044 g001
Figure 2. Relative abundance of microbial communities at the phylum and genus levels of mixed Sorghum-sudangrass and sesbania silage. (a) Relative abundance diagram of bacterial communities at the phylum level; (b) relative abundance diagram of bacterial communities at the genus level.
Agronomy 16 00044 g002
Figure 3. Co-occurrence network in bacterial community of mixed sorghum-sudangrass and sesbania silage. (a) Bacterial communities during the fermentation process of the 10:0 group. (b) Bacterial communities during the fermentation process of the 9:1 group. (c) Bacterial communities during the fermentation process of the 8:2 group. (d) Bacterial communities during the fermentation process of the 7:3 group. (e) Bacterial communities during the fermentation process of the 6:4 group. The red lines in the figure represent positive correlations, and the green lines represent negative correlations.
Agronomy 16 00044 g003aAgronomy 16 00044 g003b
Figure 4. Functional pathways in bacterial communities of mixed sorghum-sudangrass and sesbania silage.
Agronomy 16 00044 g004
Figure 5. Fermentation characterization and genus-level microbial community correlation analysis of mixed sorghum-sudangrass and sesbania silage. (a) Spearman correlation analysis between bacterial community and metabolic pathways. (b) Spearman correlation analysis between bacterial community and physicochemical properties. The “*” in the figure indicates statistically significant correlation (p < 0.05).
Agronomy 16 00044 g005
Table 1. Nutrient composition and attached microbial counts of sorghum-sudangrass and sesbania in fresh samples.
ItemSorghum-SudangrassSesbania
Dry matter, DM (%)30.0735.71
Crude protein, CP (g kg−1 DM)102.09202.09
Neutral detergent fiber, NDF (g kg−1 DM)493.25523.91
Acid detergent fiber, ADF (g kg−1 DM)385.86415.86
Water soluble carbohydrates, WSC (g kg−1 DM)165.2986.44
Yeasts (log10 cfu g−1 FM)8.496.08
Lactic acid bacteria (log10 cfu g−1 FM)9.528.31
Escherichia coli (log10 cfu g−1 FM)4.442.77
Molds (log10 cfu g−1 FM)5.675.07
cfu, colony unit; FM, fresh matter, same below.
Table 2. Dynamics of nutrient composition in the fermentation of mixed sorghum-sudangrass and sesbania silage.
CompositionMixing Ratio (M)Ensiling Day (D)Meansp Value
D3D30D60MDM × D
DM10:029.75 ± 0.08 Ad27.97 ± 0.44 Bb26.27 ± 0.11 Cd28.00 ± 0.52 c<0.001<0.0010.347
(%)9:132.78 ± 0.06 Ac31.74 ± 0.05 Ba29.71 ± 0.05 Cc31.41 ± 0.45 b
8:233.14 ± 0.24 Abc31.77 ± 0.29 Ba30.08 ± 0.23 Cbc31.66 ± 0.46 b
7:333.40 ± 0.10 Aab32.69 ± 0.37 Ba31.36 ± 0.58 Ba32.48 ± 0.36 a
6:433.78 ± 0.32 Aa32.38 ± 0.03 Ba31.03 ± 0.36 Cab32.40 ± 0.42 a
Means32.57 ± 0.39 A31.31 ± 0.47 B29.69 ± 0.50 C
CP10:0101.93 ± 0.69 Ad99.27 ± 1.10 Ae95.47 ± 0.37 Be98.89 ± 1.02 e<0.001<0.0010.023
(g kg−1 DM)9:1167.50 ± 2.21 Ac154.50 ± 2.55 Bd141.70 ± 0.93 Cd154.57 ± 3.86 d
8:2174.29 ± 1.35 Ab163.80 ± 2.41 Bc154.63 ± 2.80 Cc164.24 ± 3.06 c
7:3189.20 ± 2.91 Aa172.73 ± 3.19 Bb171.37 ± 1.11 Bb177.77 ± 3.14 b
6:4195.47 ± 2.12 Aa184.37 ± 2.58 ABa181.40 ± 5.62 Ba187.08 ± 2.85 a
Means165.68 ± 8.96 A154.93 ± 7.95 B148.91 ± 8.09 C
ADF10:0385.03 ± 1.20 Aa365.03 ± 1.20 Ba346.57 ± 1.14 Cab365.54 ± 5.58 a0.678<0.0010.845
(g kg−1 DM)9:1385.70 ± 0.55 Aa355.20 ± 2.48 Ba346.80 ± 0.31 Cab362.57 ± 5.96 a
8:2385.13 ± 0.38 Aa353.83 ± 14.94 Ba347.83 ± 0.35 Bab362.27 ± 7.21 a
7:3385.33 ± 0.30 Aa348.80 ± 8.01 Ba344.63 ± 2.41 Bb359.59 ± 6.90 a
6:4386.80 ± 1.80 Aa354.63 ± 7.16 Ba348.98 ± 0.24 Ba363.47 ± 6.26 a
Means385.60 ± 0.42 A355.50 ± 3.45 B346.96 ± 0.60 C
NDF10:0491.44 ± 0.33 Ac471.44 ± 0.33 Ba447.77 ± 0.52 Cab470.22 ± 6.31 c<0.001<0.0010.010
(g kg−1 DM)9:1501.69 ± 0.11 Ab473.27 ± 6.70 Ba447.29 ± 0.19 Cbc474.08 ± 8.09 b
8:2504.10 ± 2.00 Aab477.43 ± 1.49 Ba447.32 ± 0.15 Cbc476.28 ± 8.23 ab
7:3502.93 ± 0.58 Aab471.07 ± 1.54 Ba446.69 ± 0.20 Cc473.56 ± 8.16 bc
6:4505.00 ± 0.46 Aa481.70 ± 0.35 Ba448.30 ± 0.21 Ca478.33 ± 8.23 a
Means501.03 ± 1.37 A474.98 ± 1.61 B447.47 ± 0.18 C
WSC10:0158.01 ± 4.37 Aa69.12 ± 0.63 Ba45.20 ± 0.96 Ca90.78 ± 17.21 a<0.001<0.0010.003
(g kg−1 DM)9:1148.38 ± 8.85 Aa67.26 ± 6.74 Ba40.91 ± 2.50 Cb85.51 ± 16.50 b
8:2145.09 ± 6.07 Aa61.70 ± 0.43 Bab36.36 ± 0.68 Cc81.05 ± 16.52 ab
7:3120.10 ± 1.18 Ab61.04 ± 0.68 Bab35.56 ± 0.24 Ccd72.23 ± 12.53 c
6:4120.50 ± 3.53 Ab53.12 ± 1.14 Bb31.82 ± 0.52 Cd68.48 ± 13.41 c
Means138.42 ± 4.60 A62.45 ± 1.90 B37.97 ± 1.33 C
Note: Different uppercase letters within a row indicate significant differences among ensiling day for the same mixing ratio (p < 0.05), and different lowercase letters within a column indicate significant differences among different mixing ratios for the same ensiling day (p < 0.05); M, mixing ratio; D, ensiling day; M × D, interaction between the mixing ratio and ensiling day.
Table 3. Fermentation characteristics of mixed sorghum-sudangrass and sesbania silage.
ComponentMixing Ratio (M)Ensiling Day (D)Meansp Value
D3D30D60MDM × D
pH10:04.11 ± 0.04 Aa3.82 ± 0.02 Bb3.81 ± 0.00 Bc3.91 ± 0.05 c<0.001<0.0010.335
9:14.08 ± 0.01 Aa3.89 ± 0.04 Bab3.83 ± 0.04 Bbc3.93 ± 0.04 bc
8:24.07 ± 0.02 Aa3.89 ± 0.04 Bab3.85 ± 0.03 Bbc3.94 ± 0.04 bc
7:34.12 ± 0.03 Aa3.91 ± 0.02 Bab3.88 ± 0.01 Bb3.97 ± 0.04 ab
6:44.13 ± 0.03 Aa3.97 ± 0.03 Ba3.95 ± 0.02 Ba4.02 ± 0.03 a
Means4.10 ± 0.01 A3.90 ± 0.02 B3.86 ± 0.02 C
LA10:045.77 ± 0.28 Ba81.36 ± 3.23 Aa84.85 ± 2.93 Aa70.66 ± 6.37 a<0.001<0.0010.186
(g kg−1 DM)9:143.57 ± 0.87 Cab78.73 ± 0.54 Ba83.12 ± 0.34 Aa68.47 ± 6.27 ab
8:242.18 ± 1.15 Cb75.90 ± 1.88 Ba81.08 ± 0.48 Aa66.39 ± 6.13 bc
7:336.45 ± 1.39 Bc76.12 ± 3.00 Aa81.29 ± 1.68 Aa64.62 ± 7.16 c
6:434.32 ± 1.06 Cc63.52 ± 0.94 Bb70.96 ± 0.60 Ab56.26 ± 5.61 d
Means40.46 ± 1.22 C75.13 ± 1.84 B80.26 ± 1.42 A
AA10:00.16 ± 0.05 Aa0.16 ± 0.01 Aa0.14 ± 0.01 Aa0.15 ± 0.02 a0.4770.2050.401
(g kg−1 DM)9:10.18 ± 0.03 Aa0.12 ± 0.01 Ba0.12 ± 0.00 Bab0.14 ± 0.01 a
8:20.20 ± 0.02 Aa0.13 ± 0.01 Ba0.12 ± 0.00 Bab0.15 ± 0.01 a
7:30.15 ± 0.00 Aa0.11 ± 0.01 Ba0.11 ± 0.00 Bb0.12 ± 0.01 a
6:40.15 ± 0.01 Aa0.28 ± 0.15 Aa0.12 ± 0.01 Aab0.18 ± 0.05 a
Means0.17 ± 0.01 A0.16 ± 0.03 A0.12 ± 0.00 A
PA10:00.11 ± 0.00 Ba0.12 ± 0.00 Ba0.13 ± 0.01 Aa0.12 ± 0.00 a0.0860.7140.589
(g kg−1 DM)9:10.10 ± 0.00 Aab0.11 ± 0.00 Aab0.11 ± 0.00 Aa0.11 ± 0.00 ab
8:20.10 ± 0.00 Aab0.10 ± 0.00 Ab0.11 ± 0.00 Aa0.11 ± 0.00 ab
7:30.10 ± 0.00 Aab0.11 ± 0.00 Aab0.11 ± 0.00 Aa0.11 ± 0.00 ab
6:40.10 ± 0.00 Ab0.11 ± 0.00 Aab0.08 ± 0.04 Aa0.09 ± 0.01 b
Means0.10 ± 0.00 A0.11 ± 0.00 A0.11 ± 0.01 A
NH3-N/TN10:07.33 ± 0.56 Ba11.80 ± 0.44 Aa13.25 ± 0.26 Aa10.79 ± 0.92 a<0.001<0.0010.008
(%)9:14.10 ± 0.06 Cb7.89 ± 0.08 Bb9.30 ± 0.07 Ab7.09 ± 0.78 b
8:23.88 ± 0.13 Bb7.70 ± 0.18 Ab8.13 ± 0.27 Ac6.57 ± 0.68 bc
7:33.61 ± 0.06 Bb7.38 ± 0.28 Abc7.72 ± 0.18 Ac6.24 ± 0.67 c
6:43.80 ± 0.30 Bb6.65 ± 0.24 Ac7.48 ± 0.34 Ac5.98 ± 0.58 c
Means4.54 ± 0.39 C8.28 ± 0.49 B9.17 ± 0.58 A
Note: Different uppercase letters within a row indicate significant differences among ensiling day for the same mixing ratio (p < 0.05), and different lowercase letters within a column indicate significant differences among different mixing ratios for the same ensiling day (p < 0.05); M, mixing ratio; D, ensiling day; M × D, interaction between the mixing ratio and ensiling day.
Table 4. The changes in microbial count in mixed sorghum-sudangrass and sesbania silage.
ComponentMixing Ratio (M)Ensiling Day (D)Meansp Value
D3D30D60MDM × D
LAB
(log10 cfu g−1 FM)
10:09.24 ± 0.05 Ac6.79 ± 0.03 Ba6.74 ± 0.07 Ba7.59 ± 0.41 a<0.001<0.001<0.001
9:19.47 ± 0.00 Aa6.24 ± 0.06 Bc5.75 ± 0.03 Cc7.15 ± 0.58 b
8:29.38 ± 0.01 Ab6.18 ± 0.02 Cc6.52 ± 0.04 Bb7.36 ± 0.51 c
7:39.35 ± 0.01 Ab6.47 ± 0.01 Cb6.67 ± 0.01 Ba7.50 ± 0.46 d
6:48.54 ± 0.02 Ad5.64 ± 0.11 Bd5.17 ± 0.01 Cd6.45 ± 0.53 e
Means9.20 ± 0.09 A6.26 ± 0.10 B6.17 ± 0.16 C
Yeasts
(log10 cfu g−1 FM)
10:08.21 ± 0.04 Aab5.62 ± 0.16 Bb4.12 ± 0.03 Cd5.98 ± 0.60 c<0.001<0.001<0.001
9:18.22 ± 0.00 Aa6.05 ± 0.03 Ba3.26 ± 0.14 Ce5.84 ± 0.72 c
8:28.14 ± 0.02 Ab5.78 ± 0.09 Bab5.08 ± 0.02 Cb6.33 ± 0.46 a
7:38.18 ± 0.01 Aab5.69 ± 0.05 Bb5.56 ± 0.02 Ba6.48 ± 0.43 a
6:48.15 ± 0.01 Ab5.49 ± 0.12 Bb4.84 ± 0.02 Cc6.16 ± 0.51 b
Means8.18 ± 0.01 A5.73 ± 0.06 B4.57 ± 0.22 C
Escherichia coli
(log10 cfu g−1 FM)
10:04.03 ± 0.02 Ab2.40 ± 0.19 Ba 2.14 ± 0.59 a<0.001<0.001<0.001
9:14.93 ± 0.03 Aa1.05 ± 0.03 Bb 1.99 ± 0.75 b
8:23.77 ± 0.06 Ac1.13 ± 0.02 Bb 1.63 ± 0.56 c
7:34.02 ± 0.02 Ab1.06 ± 0.01 Bb 1.69 ± 0.60 c
6:42.75 ± 0.06 Ad1.32 ± 0.02 Bb 1.36 ± 0.40 d
Means3.90 ± 0.19 A1.39 ± 0.14 B
Molds
(log10 cfu g−1 FM)
10:02.87 ± 0.12 a <0.001
9:12.10 ± 0.06 b
8:22.14 ± 0.04 b
7:32.06 ± 0.02 b
6:42.75 ± 0.15 a
Means2.38 ± 0.10
Note: Different uppercase letters within a row indicate significant differences among ensiling day for the same mixing ratio (p < 0.05), and different lowercase letters within a column indicate significant differences among different mixing ratios for the same ensiling day (p < 0.05); M, mixing ratio; D, ensiling day; M × D, interaction between the mixing ratio and ensiling day.
Disclaimer/Publisher’s Note: The statements, opinions and data contained in all publications are solely those of the individual author(s) and contributor(s) and not of MDPI and/or the editor(s). MDPI and/or the editor(s) disclaim responsibility for any injury to people or property resulting from any ideas, methods, instructions or products referred to in the content.