Article

Reducing the Sodium Adsorption Ratio Promotes Cotton Growth and Development by Enhancing Antioxidant Enzyme Activities and the Plant’s Potassium–Sodium Ratio Under Brackish-Water Irrigation

1
School of Agricultural Sciences, Zhengzhou University, Zhengzhou 450001, China
2
Key Laboratory of Crop Water Use and Regulation, Ministry of Agriculture and Rural Affairs, Farmland Irrigation Research Institute, Chinese Academy of Agricultural Sciences, Xinxiang 453002, China
3
College of Water Conservancy and Architectural Engineering, Tarim University, Alaer 843300, China
4
Shangqiu Agro-Ecological System National Observation and Research Station, Shangqiu 476000, China
*
Author to whom correspondence should be addressed.
Agronomy 2025, 15(9), 2092; https://doi.org/10.3390/agronomy15092092 (registering DOI)
Submission received: 10 August 2025 / Revised: 27 August 2025 / Accepted: 29 August 2025 / Published: 30 August 2025
(This article belongs to the Section Water Use and Irrigation)

Abstract

Reasonable development and utilization of brackish-water resources can alleviate the pressure of freshwater scarcity in dryland areas and safeguard crop growth, but there are significant differences in brackish-water ions in different regions. Thus, exploring the mechanism of brackish-water irrigation considering brackish-water ionic differences on the growth and development of saline and alkaline dryland crops has an important production guidance value. In this study, the ionic differences in irrigated brackish water were characterized by sodium adsorption ratio using under-membrane drip-irrigated cotton as the research object, and three levels of mineralized irrigation water were designed, which were 3 g·L−1 (T3), 5 g·L−1 (T5), and 7 g·L−1 (T7), respectively. Three different levels of sodium adsorption ratio (SAR) were set under each level of mineralization, which were 10 (mmol·L−1)1/2 (S10), 15 (mmol·L−1)1/2 (S15), and 20 (mmol·L−1)1/2 (S20). The local freshwater irrigation was used as a control treatment. The results showed that brackish-water irrigation increased soil salt accumulation and soil water content, induced oxidative damage and disruption of ionic homeostasis in the cells, and decreased leaf photosynthetic rate. Brackish-water irrigation also significantly reduced dry matter mass by 11.04–50.12%. Reduced irrigation water SAR (S10 and S15) enhanced antioxidant enzyme activities such as superoxide dismutase (SOD), peroxidase (POD), and catalase (CAT), and reduced malondialdehyde (MDA) content by 14.29% and 9.09%, respectively, compared with high irrigation water SAR (S20). Leaf K+ uptake was increased by 5.29% and 1.57% in S10 and S15, respectively, compared with S20, while Na+ uptake was significantly suppressed. The K+/Na+ ratio increased by 45.07%, which resulted in improved leaf photosynthetic efficiency by 25.25% and 11.91%, and significantly enhanced dry matter accumulation by 24.81% and 11.20%, respectively. In addition, compared with T3S20, the T5S10 treatment reduced the irrigation water SAR. It contributed to a significant increase in SOD, POD, and CAT activities by 30.42%, 60.70%, and 99.20%, respectively, and in plant K+ content and K+/Na+ by 2.48% and 38.85%, respectively, although the irrigation water mineralization increased by 66.67%. Reducing SAR could enhance photosynthesis and dry matter accumulation through the dual regulation of “antioxidant damage + ion homeostasis” in salt-stressed cotton, laying a foundation for the realization of stable and high yields of cotton under brackish-water irrigation, and providing a new perspective for the management of brackish-water resources and the sustainable development of agriculture in Xinjiang and other arid regions.

1. Introduction

Xinjiang is located in the northwestern inland basin and is one of the most important cotton-producing areas in China [1]. However, the arid climate and scarce rainfall have led to severe shortages of freshwater resources, significantly impacting the development of the cotton industry, while Xinjiang has abundant saline water resources with great potential for utilization [2]. The continued use of saline water for irrigation each year leads to the accumulation of soil salts, which negatively affects the physiological and growth aspects of the crop [3,4]. In this context, the scientific and rational utilization of brackish water is of great significance for alleviating the shortage of freshwater resources and promoting sustainable agricultural development [5,6].
Long-term saline water irrigation can bring salts into the soil, increasing the salinity of the root zone and affecting the growth and physiological characteristics of the crop [7]. Numerous studies have found that unreasonable saline water irrigation negatively affects the formation of crops by reducing the rate of emergence, weakening the intensity of net photosynthesis, decreasing the activity of enzymes in the plant [8,9], and weakening the ability of the root system to absorb nutrients [10]. Liu and Dong et al. [11] showed that the stress induced by NaCl inhibits the growth of cotton seedlings, destroys the chlorophyll, increases the accumulation of H2O2, MDA, and other adversities, as well as the antioxidant enzyme activities. Anjum and Ashraf et al. [12] showed that high-salinity irrigation lowers the tolerance threshold of the crop, inhibits photosynthesis of the crop and chlorophyll synthesis, accelerates leaf senescence and abscission, which ultimately hinders plant growth and development. The salinity threshold of brackish-water irrigation has significant regional variability, which is closely related to the ionic composition of brackish water and environmental factors. Existing studies indicated that in the plain area of Hebei, the normal growth of plants can be maintained by using brackish-water irrigation with salinity ≤ 6 g·L−1 during the reproductive period of cotton [13], while Jiao and Pan et al. [14] suggested that irrigation with 2 g·L−1 mixed water is safe for cotton growth. Experiments in the arid region of Xinjiang showed that when irrigation water salinity exceeds 4.28 g·L−1, cotton seedling emergence rates significantly decrease [15]. Similarly, research in the Manas irrigation district of Xinjiang found that 3.3–3.5 g·L−1 is the critical threshold for stable cotton yields [16], while the Shihezi region of Xinjiang recommended that the salinity threshold for cotton irrigated with brackish water should be controlled within 6 g·L−1 [17]. Research in the Bohai region found that water with salinity ≤ 5.6 g·L−1 should be used under drip irrigation conditions for cotton [18]. This spatial variation is mainly due to differences in dominant ions in underground salty water across regions: sulfate-dominated in the Hebei Plain, chloride-dominated in Xinjiang, and high sodium adsorption ratios in coastal areas. Additionally, factors such as the aridity index, soil matrix potential, and mulched drip irrigation parameters collectively influence the salt accumulation process in the root zone.
The salinity of irrigation water is not the single factor that has a significant impact on the “soil–crop” system. The salinity ion composition of irrigation water also has an important influence on soil (physical, chemical, and biological properties) and crop (plant growth, yield, and quality) [19]. On the one hand, the infiltration of soil water during irrigation expels the soil air, which may lead to periodic water stagnation in the soil. During this process, certain ions in soil colloids may react with ions in the irrigation water, causing disintegration of soil structure. On the other hand, selective absorption of soil water and ions by plant roots often leads to osmotic stress [20], ion toxicity [21] (Na+, SO42−, Cl), and nutrient imbalances due to the inability of plants to take up key nutrients such as potassium, calcium, and nitrate [22,23], affecting plant-related physiological activities. The study of Guo et al. [24] on the effects of different salt solutions (NaCl, NaCl + MgCl2, NaCl + CaCl2, NaCl + KCl) on soil water diffusivity and ion migration under a salinity of 3 g·L−1 demonstrated that adding calcium to brackish water can inhibit water diffusion and reduce soil salinity, but there is a lack of research on the mechanisms by which differences in ionic composition of saline water affect crop physiological growth. Therefore, this study characterizes the differences in ionic composition of irrigation water by SAR and investigates the differences in the response of soil water and salt changes and cotton physiological growth by carrying out different salinity and SAR of cotton field trials under mulched drip irrigation. The aim is to clarify the mechanism of the brackish water influencing cotton physiological growth during the flowering and boll stages, and to provide theoretical evidence for the sustainable development of the cotton industry in arid regions.

2. Materials and Methods

2.1. Overview of Experimental Area

The experiment was conducted from April to October 2024 at the Alaer Modern Agricultural Academician Expert Workstation in Xinjiang (81°17′56.52″ E, 40°32′36.90″ N, altitude 1014 m). The station is located in a plain desert oasis near the Tarim River Basin. The annual surface evaporation is around 2000 mm, with relative humidity ranging from 47% to 60%. The average annual temperature is 11.5 °C, with an average annual precipitation of 36.5 mm and 2761.9 h of sunshine. The experimental soil is sandy loam with good permeability, and the groundwater depth is greater than 3 m. The soil dry bulk density is 1.6 g/cm3, with a field water-holding capacity of 0.26 cm3·cm−3. The average organic matter content in the 0–40 cm soil layer is 5.73 g·kg−1, total nitrogen is 0.34 mg·g−1, available phosphorus is 14.48 mg·kg−1, available potassium is 127.42 mg·kg−1, and alkaline nitrogen is 35.99 mg·kg−1.

2.2. Experimental Design

The cotton variety used in the experiment was “Tahe 2,” sown on 30 April 2024, using a “one film, six rows” planting pattern (Figure 1). The experiment adopted a split-plot design, with irrigation water salinity as the main plot factor, including three levels: 3 g·L−1 (T3), 5 g·L−1 (T5), and 7 g·L−1 (T7). The subplot factor was irrigation water SAR, with three levels: 10 (mmol·L−1)1/2 (S10), 15 (mmol·L−1)1/2 (S15), and 20 (mmol·L−1)1/2 (S20). Local freshwater irrigation was used as the control, resulting in 10 treatments with three replicates each, totaling 30 plots (7 m × 14 m). Different irrigation water salinity and SAR levels were achieved by adding NaCl and CaCl2 to local well water. The treatment codes and ion contents of the irrigation water are detailed in Table 1. To precisely control the irrigation volume for each treatment, a drip irrigation system consisting of a mixing tank, pressure gauge, water meter, valve, and small self-priming pump was used for each treatment (Figure 1b). During irrigation, local well water was first connected to the mixing tank via a ground pipe and valve. When the water meter indicated sufficient volume, the valve was closed, and NaCl and CaCl2 were added to the mixing tank and stirred evenly. The valve for field irrigation was then opened, and the small self-priming pump was connected to a power source with a working pressure of 0.1 MPa and a dripper flow rate of 3 L·h−1. The irrigation water was delivered to each plot through PVC pipes connected to drip tapes until all the water in the tank was used.
The irrigation quota for each treatment was consistent, determined by the difference between crop evapotranspiration (Kc*ET0) and rainfall (P). The reference crop evapotranspiration (ET0) was calculated using the FAO-56 single crop coefficient method, and the cotton crop coefficient was derived from previous experimental data by the research group [25]. The average ETa/ET0 (ETa: crop actual evapotranspiration) during the bud and flowering stages was 0.77 and 1.14, respectively. The irrigation cycle was 7 days [26], and irrigation was stopped after the cotton entered the boll-opening stage, with a total of 11 irrigations during the growing season (Table 2). Fertilization followed local conventional practices, with 84 kg·hm−2 of pure N applied as base fertilizer before tillage. N, P, and K fertilizers were applied with each irrigation, and the fertilization amounts were consistent across all treatments.

2.3. Observation Indicators and Methods

2.3.1. Relative Water Content and Electrical Conductivity of Soil

Relative water content (RWC) was determined by soil drying method during cotton bolling stage. One section of each plot was selected as the sampling point, and five augers were taken from each section: the two side rows of cotton, the middle rows, the inter-film on the side of the cloth with two drip irrigation belts, and the bare ground (Figure 1). In the vertical direction, soil augers were used to take soil 0–10 cm, 10–20 cm, 20–30 cm, 30–40 cm, 40–60 cm, 60–80 cm, and 80–100 cm from the surface.
R W C = m 1 m 2 m 2 m 0 × 100
where m 0 is weight of drying empty aluminum box (g), m 1 is weight of aluminum box and soil sample before drying (g), and m 2 is weight of aluminum box and soil sample after drying (g).
Crush the dried soil samples with measured moisture content, then take 20 g of soil sample passing through a 1 mm sieve and place it in an Erlenmeyer flask. Add 100 mL of distilled water, shake for 5 min, let stand for 15 min, then filter with filter paper to prepare a soil water extract solution with a 5:1 water-to-soil mass ratio. Measure the conductivity of the extract using a DDSJ-308A portable conductivity meter (Shanghai Yidian, China).

2.3.2. Photosynthetic Indexes

(1)
Net photosynthetic rate: A portable photosynthesizer (LI-6400, LICOR, Lincoln, NE, USA) was used to measure the net photosynthetic rate at 13:00–14:00 a.m. during the bolling stage, and the fully expanded leaf at the top of the plant was selected for each treatment.
(2)
Chlorophyll SPAD value: After each measurement of photosynthetic parameters, the SPAD value was determined on the same leaf using a SPAD meter (Konica Minolta SPAD-502 chlorophyll meter, Chiyoda, Tokyo, Japan).

2.3.3. Antioxidant Enzyme Activities of Leaf

On the 2nd day after irrigation treatment during the bolling stage, the fully expanded leaves of cotton were taken at 8:00–10:00 a.m., cleaned with deionized water to dry the impurities on the leaves, quickly wrapped in tin foil and quick-frozen in liquid nitrogen, brought back to the laboratory, and placed in an ultra-low-temperature refrigerator at −80 °C for storage. CAT activity was determined by potassium permanganate titration; POD activity was determined by the guaiacol method [25,27]. SOD activity was determined by the nitrogen blue tetrakisovanes (NBT) photoreduction assay [28], and MDA content was determined by the colorimetric method of thiobarbituric acid (TBA) [29].

2.3.4. Measurement of Cotton Dry Matter Quality

At the bolling stage, three representative cotton plants with normal growth were randomly selected from the border rows and middle rows of each treatment. After cutting off the roots, the plants were placed in an oven set at 105 °C for enzyme inactivation for 30 min, then dried at 80 °C until constant weight was achieved. The dry matter mass of each component of the cotton was then weighed.

2.3.5. Determination of Nutrient Ions in Cotton Plants

The dried cotton leaves were ground using a pulverizer and sieved through a 40 mesh sieve, and the samples were decocted using a combination of concentrated sulfuric acid–hydrogen peroxide, and K+ and Na+ were determined using an atomic absorption spectrophotometer model TAS-986 [30].

2.4. Statistical Analysis

The experimental data were analyzed by SPSS, 20.0 (SPSS, Chicago, IL, USA) and expressed as mean ± standard deviation. Multiple comparisons and significance of difference tests (p < 0.05) were applied to multiple indices such as Na+ content, K+ content, and leaf area index of each treatment using Duncan’s new complex polarity method. Origin 2021 was used for plotting, with p < 0.05 for significant differences and p < 0.01 for highly significant differences.

3. Results

3.1. Effects of Irrigation Water Salinity and SAR on Soil Water Content and Electrical Conductivity

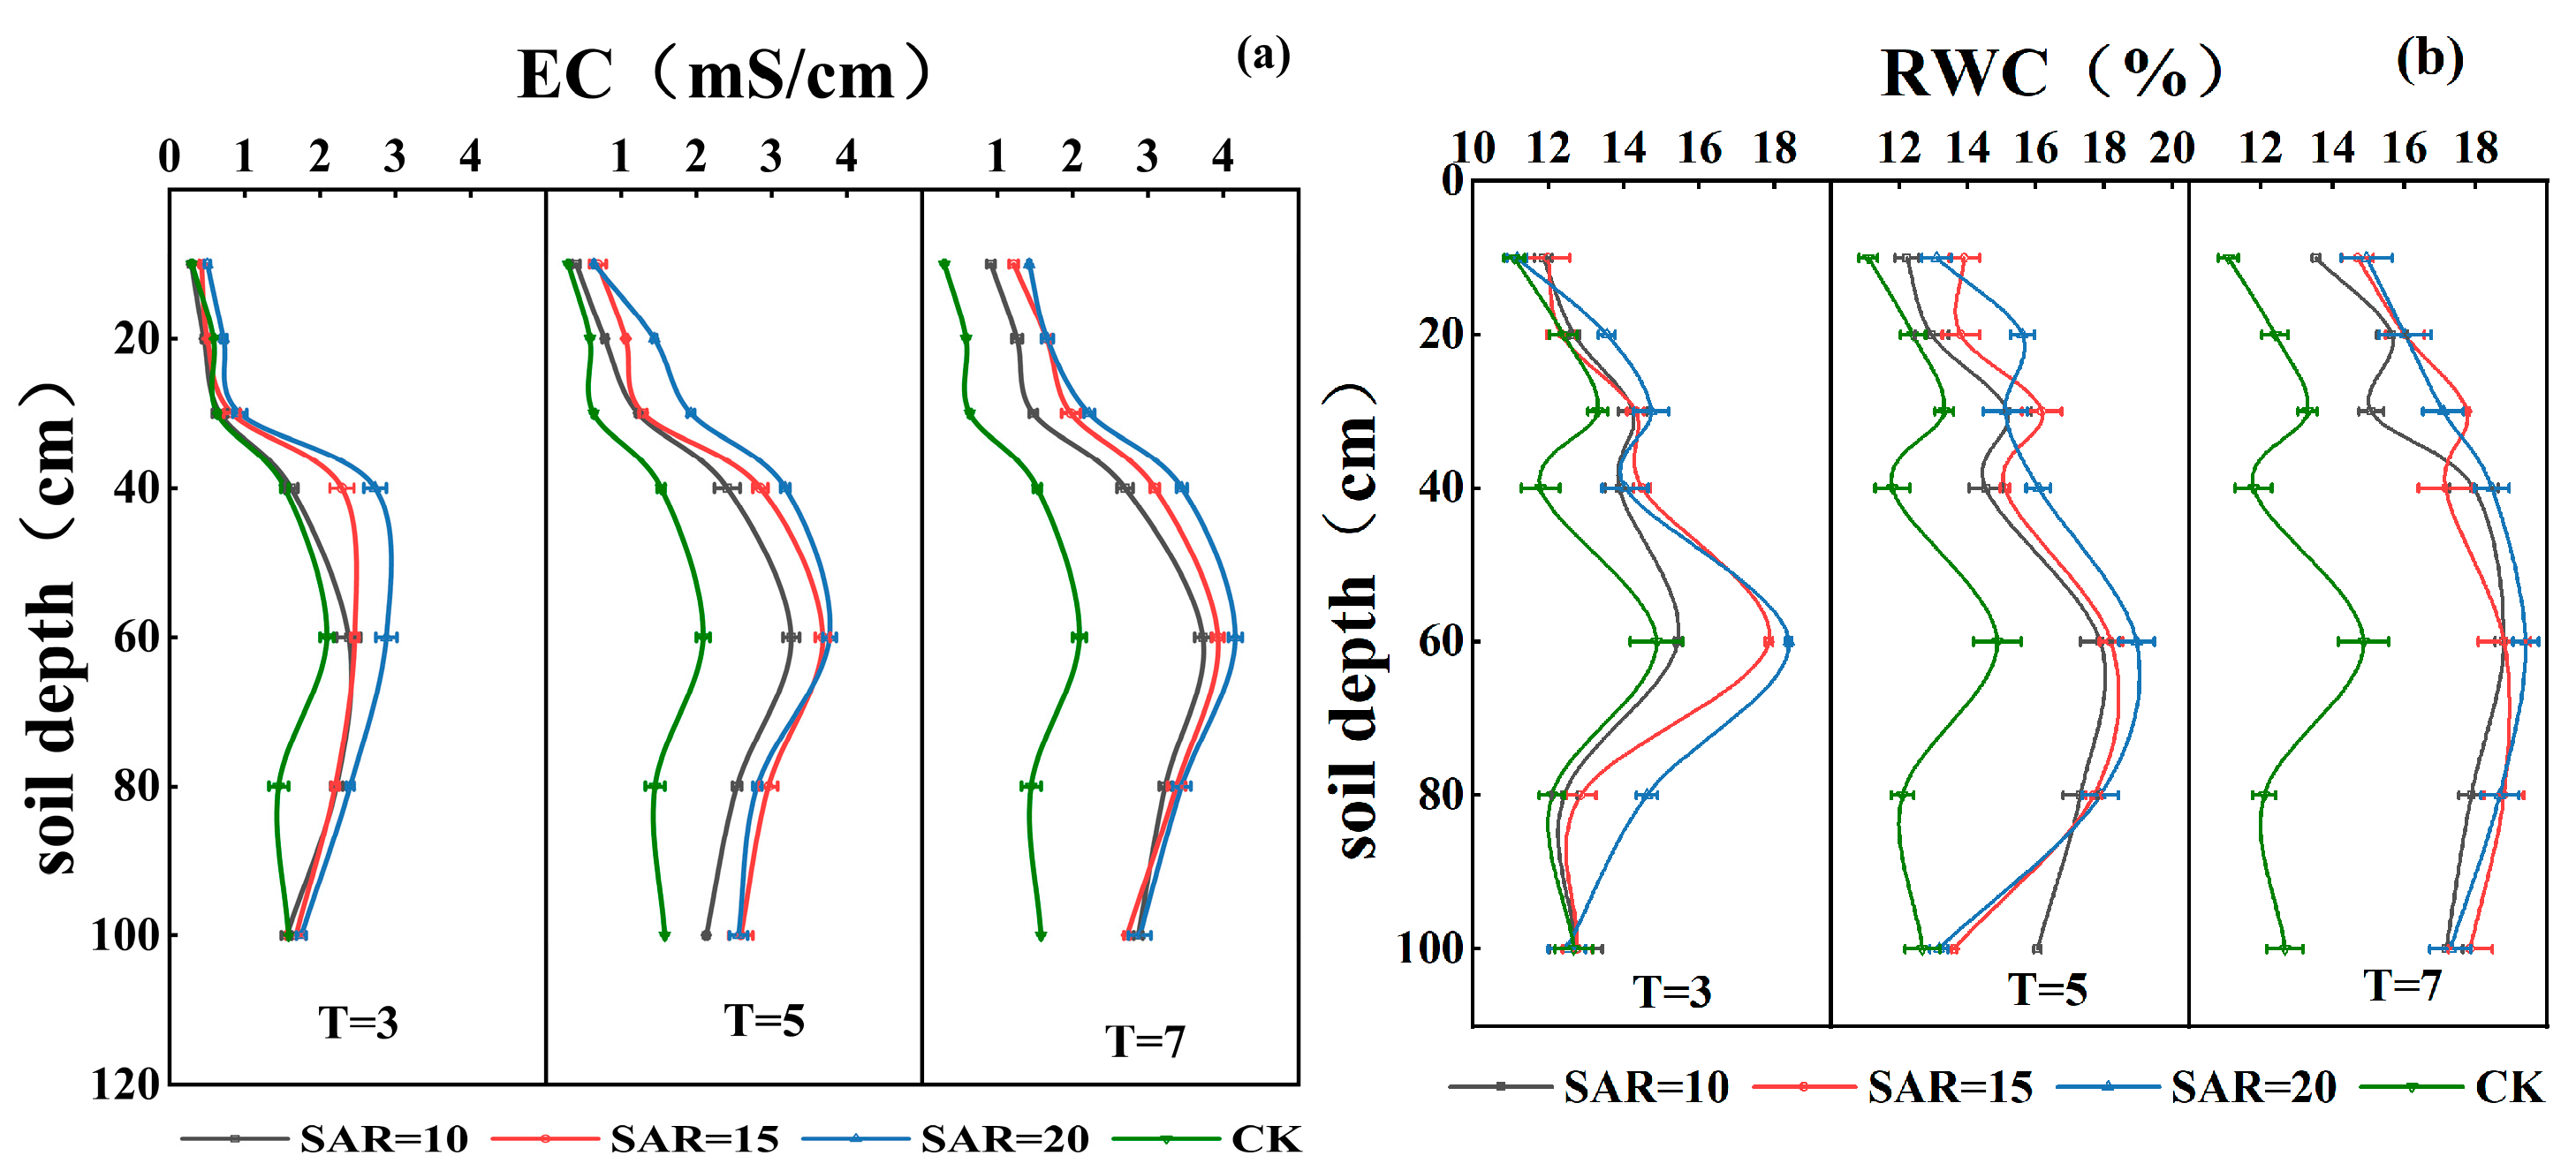
The interaction between irrigation water salinity and SAR significantly affected soil electrical conductivity (EC) and relative water content (RWC) in different soil layers during the bolling stage of cotton (Figure 2). Both RWC and EC increased with increasing irrigation water salinity or SAR and showed an overall trend of increasing and then decreasing with soil depth, reaching a maximum at 60 cm. Compared to the CK treatment, the average soil water content in the 0–100 cm layer increased by 5.71%, 9.52%, and 12.14% for T3S10, T3S15, and T3S20, respectively. Under the same salinity level, soil salt accumulation decreased with decreasing SAR. Compared to the CK treatment, the average soil EC increased significantly by 58.77%, 75.70%, and 92.55% for S10, S15, and S20, respectively. The T3S10 treatment showed the smallest increase in average soil EC of 12.52% compared to CK. This indicates that increasing irrigation water salinity exacerbates soil salt accumulation, but reducing SAR can effectively mitigate salt accumulation.

3.2. Effects of Irrigation Water Salinity and SAR on MDA Content and Antioxidant Activity in Cotton Leaves

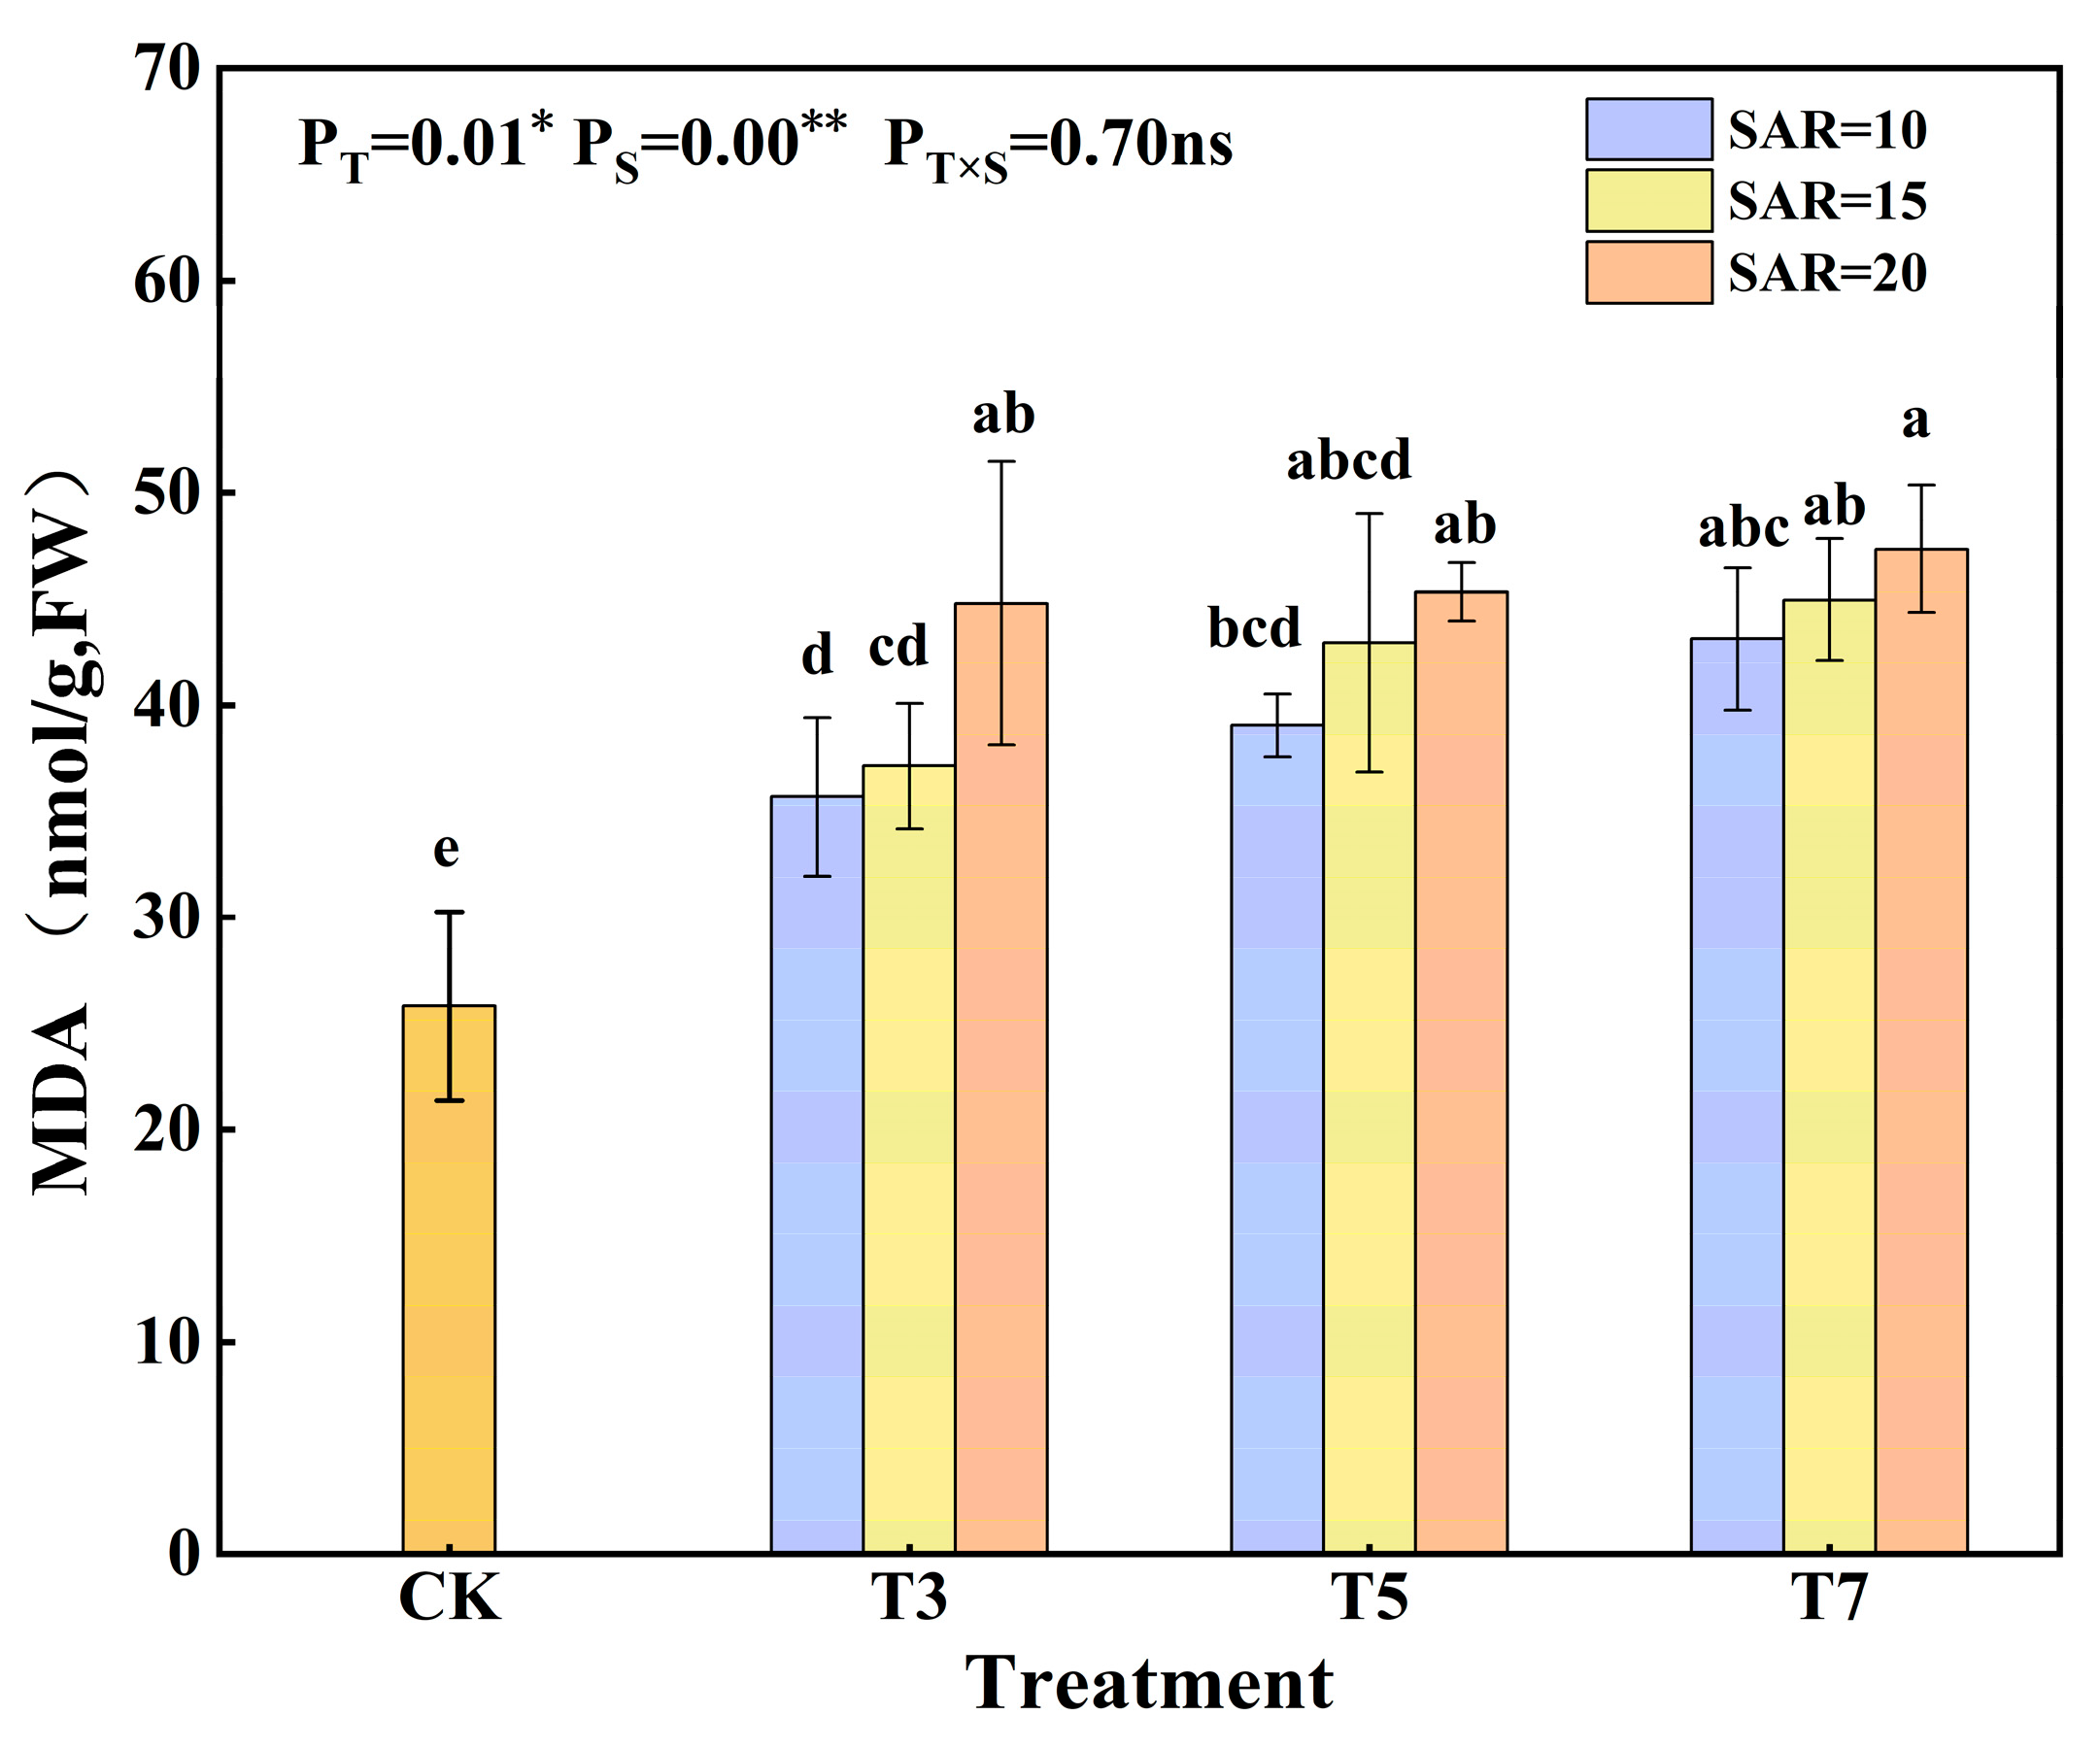
The irrigation of water salinity and SAR significantly influenced MDA content in cotton leaves (Figure 3). Under the same SAR level, MDA content increased with increasing salinity, with T3, T5, and T7 treatments showing increases of 51.78%, 64.30% and 74.79%, respectively, compared to CK. Under the same salinity level, MDA content decreased with decreasing SAR, with S10 and S15 treatments exhibiting reductions of 14.29% and 9.09%, respectively, relative to S20. The T5S10 treatment reduced MDA content by 12.85% compared to T3S20.
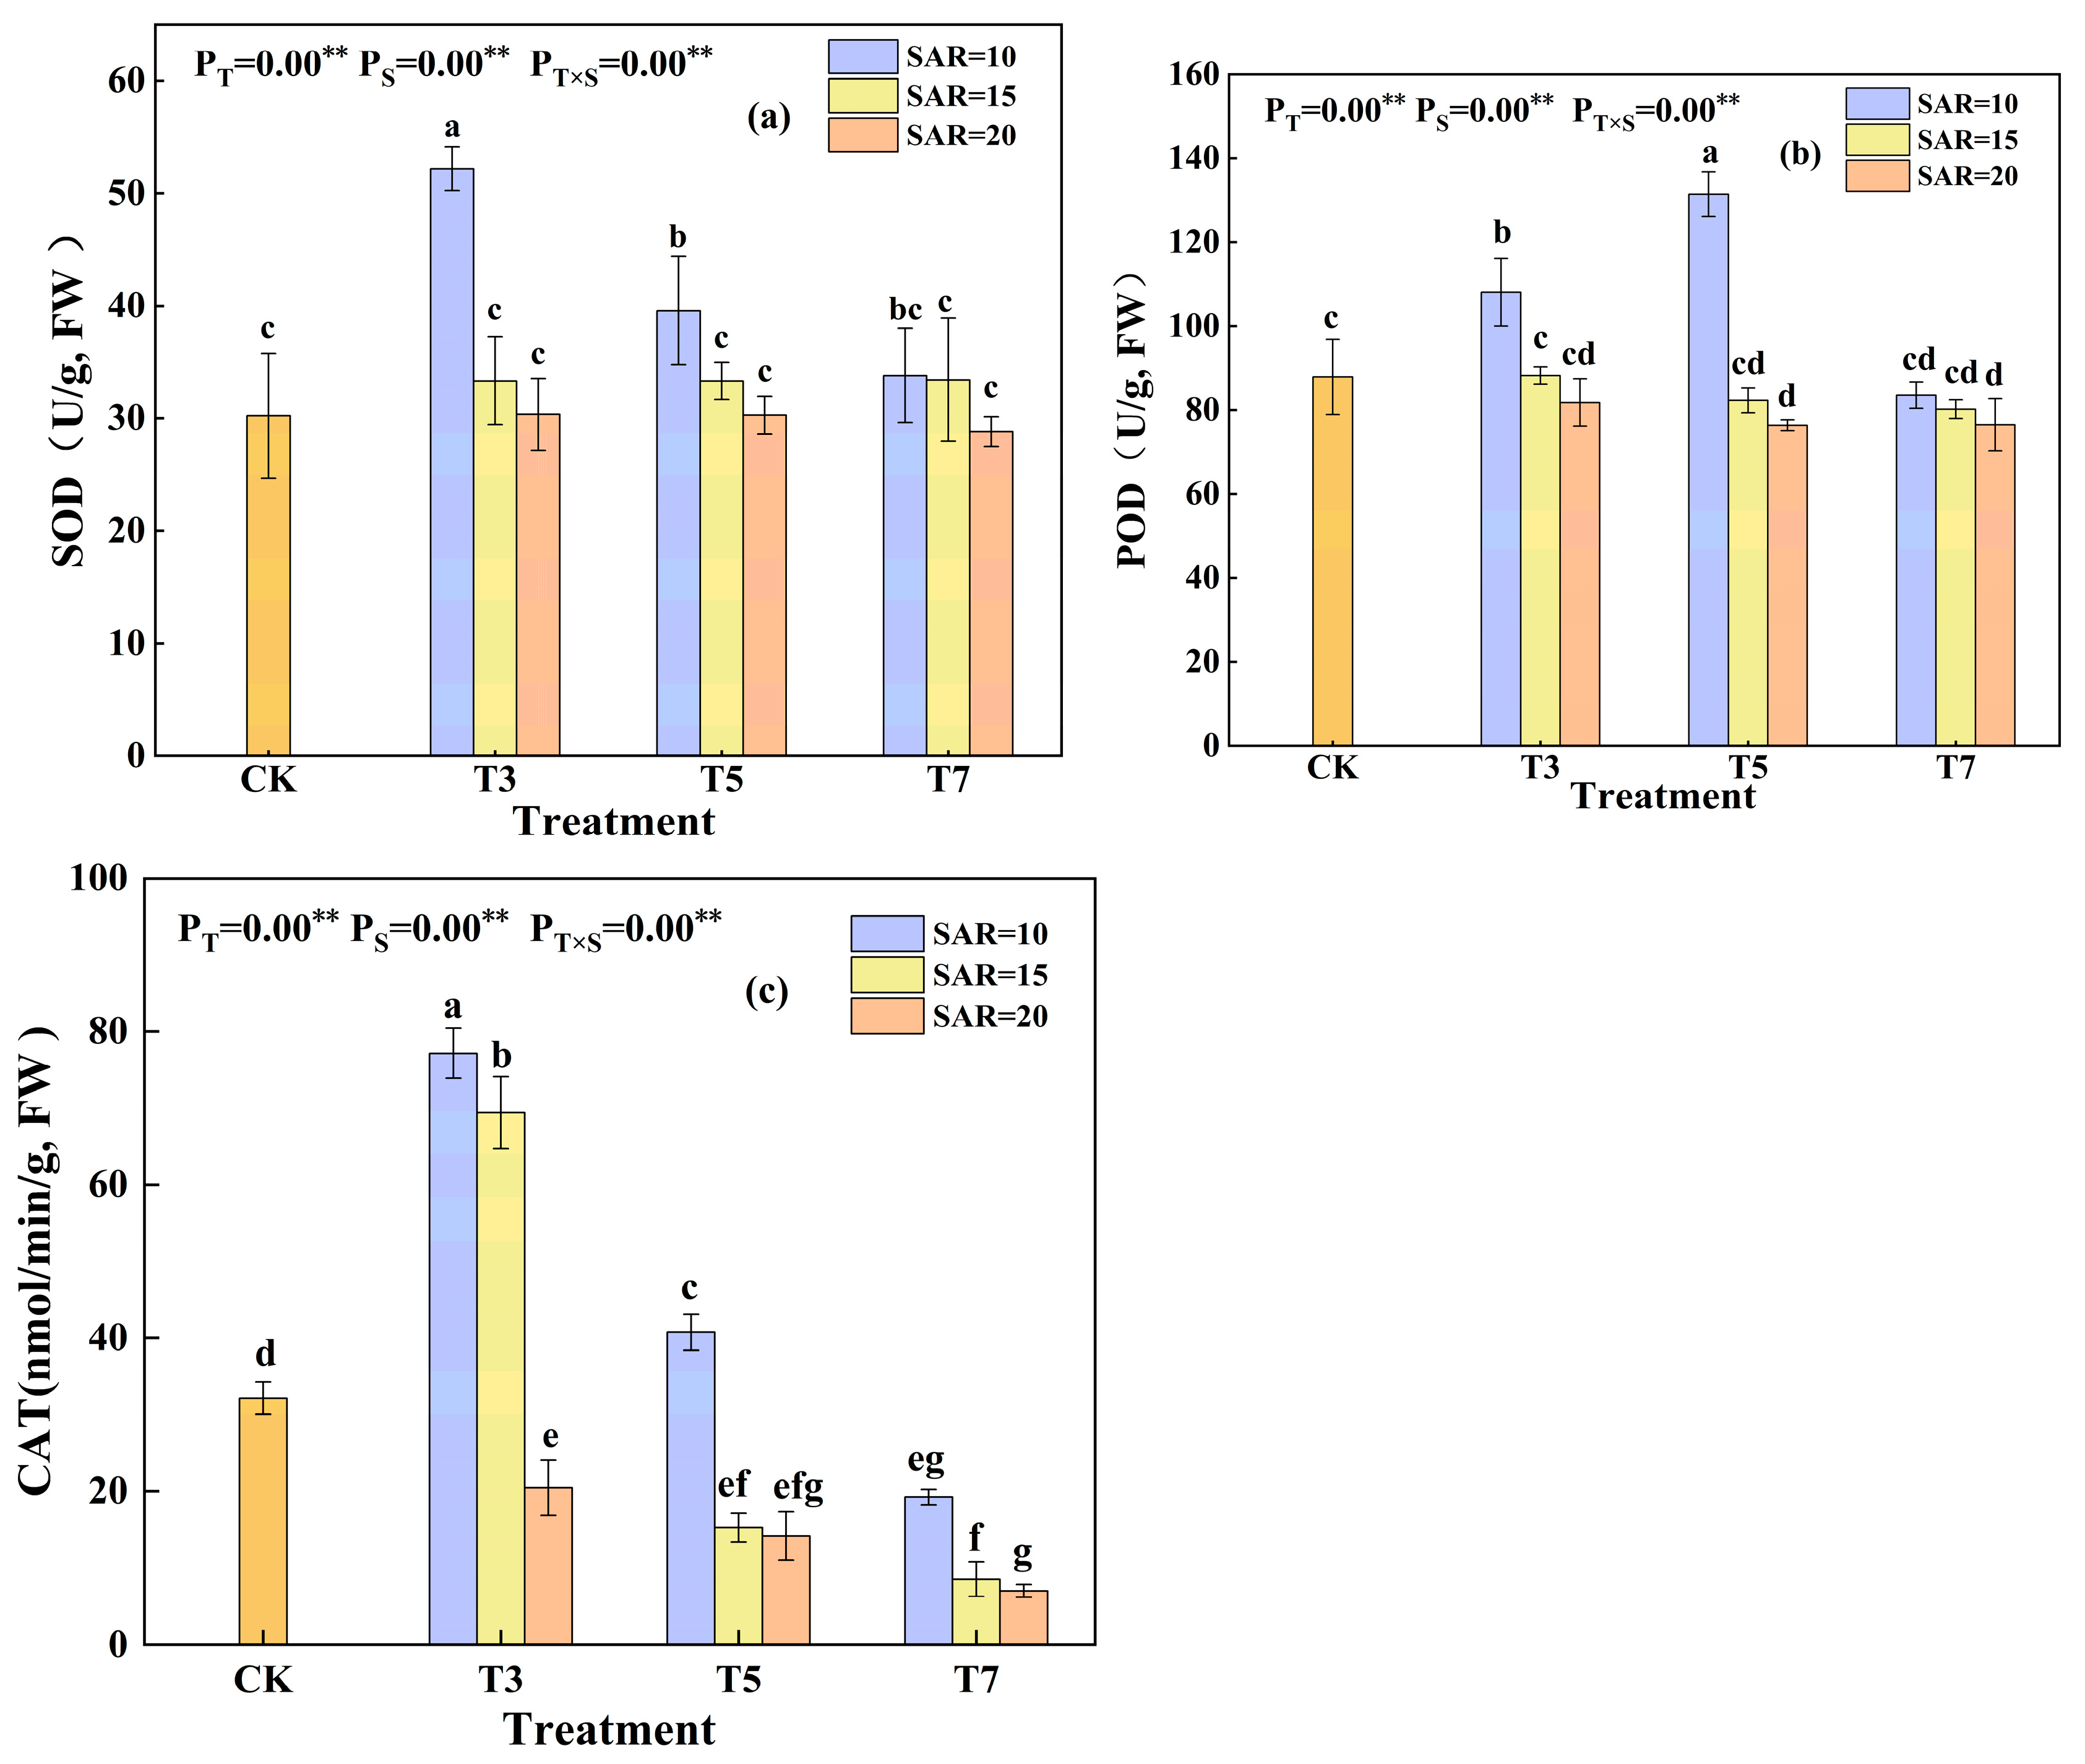
SAR had highly significant effects on the activities of superoxide dismutase (SOD), peroxidase (POD) and catalase (CAT) (Figure 4). Under the same salinity level, SOD, POD, and CAT activities increased with decreasing SAR. Compared to S20, the S10 treatment increased average SOD, POD, and CAT activities by 40.39%, 37.67% and 2.3-fold, respectively, while the S15 treatment increased them by 11.91%, 6.85%, and 1.2-fold, respectively. The interaction between salinity and SAR significantly affected SOD, POD, and CAT activities. Under high SAR (S20), SOD activity showed no significant difference across salinity levels compared to CK, while POD and CAT activities decreased with increasing salinity. Under low SAR (S10), SOD and CAT activities initially increased and then decreased with increasing salinity, peaking in the T3S10 treatment, whereas POD activity peaked in T5S10. Compared to T3S20, the T5S10 treatment, despite higher salinity, increased SOD, POD, and CAT activities by 30.42%, 60.70%, and 99.20%, respectively, by reducing SAR. This demonstrates that lowering SAR in brackish-water irrigation enhances antioxidant enzyme activity, improves cotton’s antioxidant capacity, and reduces MDA content.

3.3. Effects of Irrigation Water Salinity and SAR on K+ and Na+ Uptake in Cotton Leaves

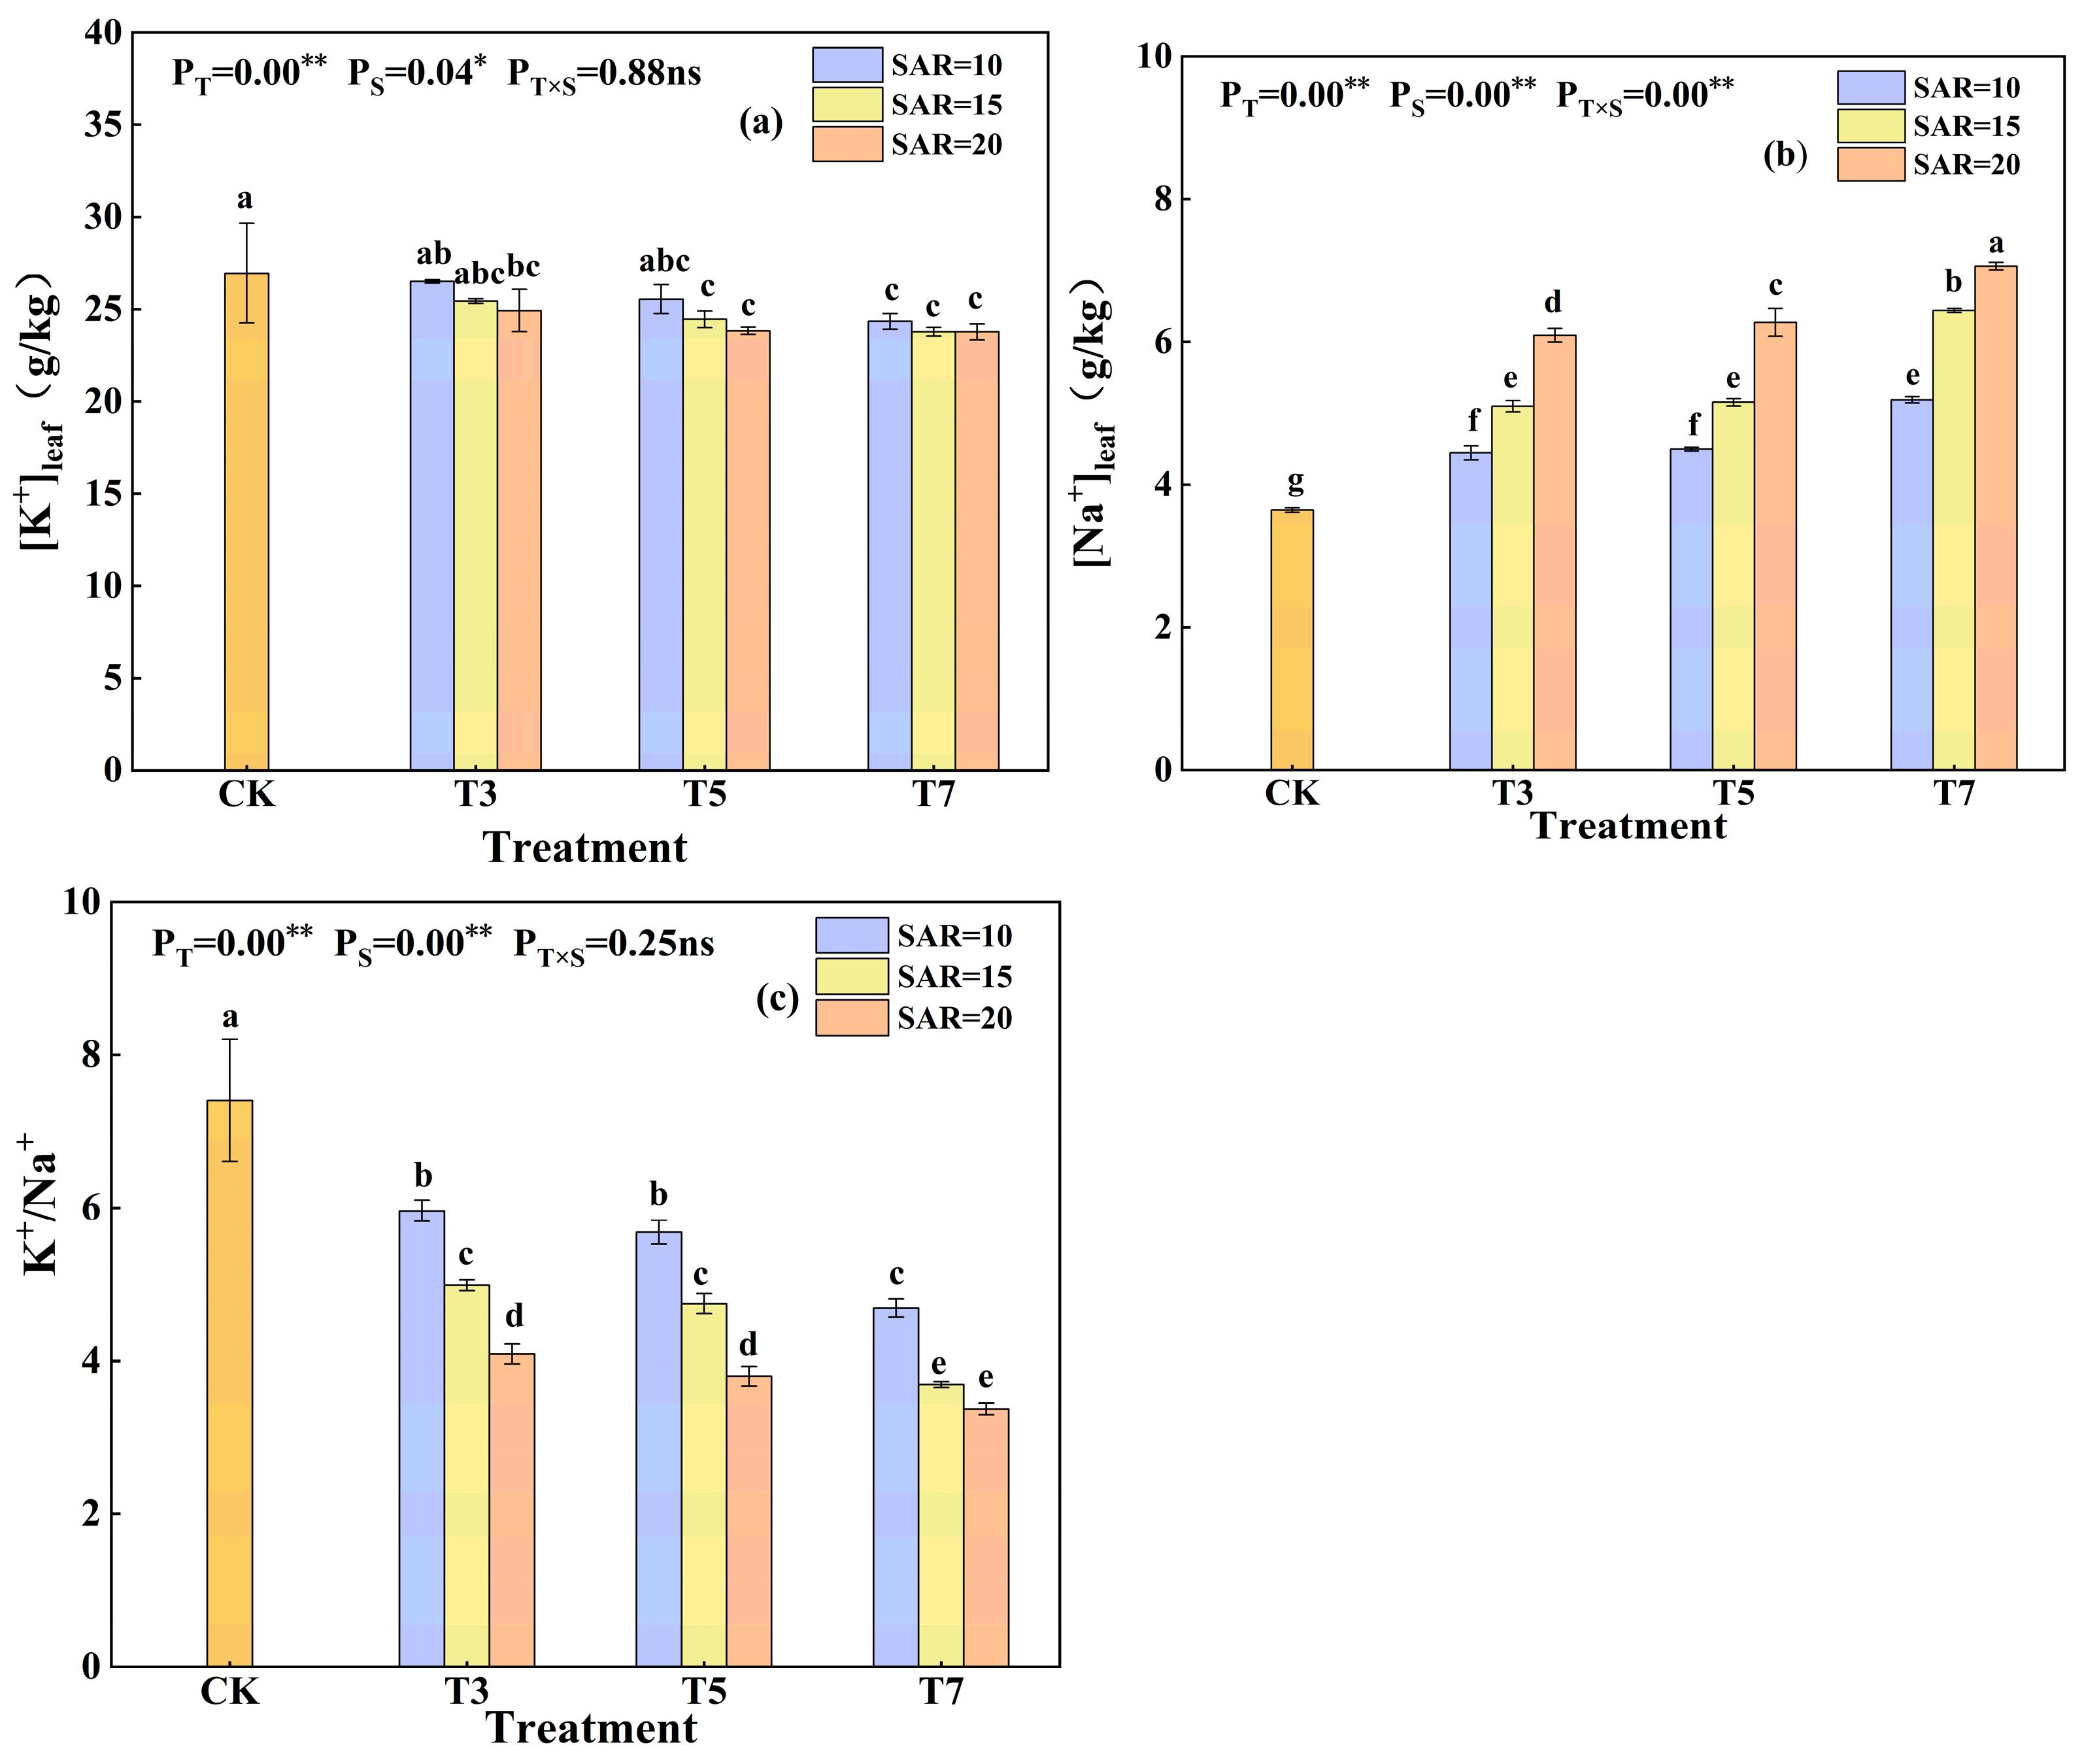
The results revealed that both irrigation water salinity and SAR had highly significant effects on Na+ and K+ content in cotton leaves (Figure 5). Under the same SAR level, Na+ content increased with increasing salinity, with T3, T5, and T7 treatments showing increases of 43.08%, 45.72%, and 71.02%, respectively, compared to CK. Under the same salinity level, plant Na+ content increased with increasing SAR. Compared to CK, the average Na+ content in S10, S15, and S20 treatments increased significantly by 29.31%, 52.74%, and 77.77%, respectively. The T5S10 treatment exhibited a 26.20% reduction in Na+ content compared to T3S20, suggesting that reducing SAR at a salinity level of 5 g·L−1 decreases Na+ accumulation in plants.
Under the same SAR level, K+ content decreased with increasing salinity, with T3, T5, and T7 treatments exhibiting reductions of 4.97%, 8.71%, and 11.10%, respectively, compared to CK. Under the same salinity level, plant K+ content decreased with increasing SAR. Compared to CK, the average K+ content in S10, S15, and S20 treatments decreased significantly by 5.56%, 8.90%, and 10.31%, respectively. The T5S10 treatment showed a 2.48% increase in K+ content compared to T3S20, indicating that reducing SAR at 5 g·L−1 salinity enhances K+ uptake.
The interaction between irrigation water salinity and SAR had a highly significant effect on the K+/Na+ ratio. Under the same SAR level, the K+/Na+ ratio decreased with increasing salinity, with T3, T5, and T7 treatments demonstrating reductions of 32.26%, 35.93%, and 47.07%, respectively, compared to CK. Under the same salinity level, the K+/Na+ ratio decreased with an increasing SAR, with S10, S15, and S20 treatments showing reductions of 26.44%, 39.52%, and 49.30%, respectively, compared to CK. The T5S10 treatment exhibited a 38.85% increase in the K+/Na+ ratio compared to T3S20.

3.4. Effects of Irrigation Water Salinity and SAR on Net Photosynthetic Rate and SPAD Value in Cotton

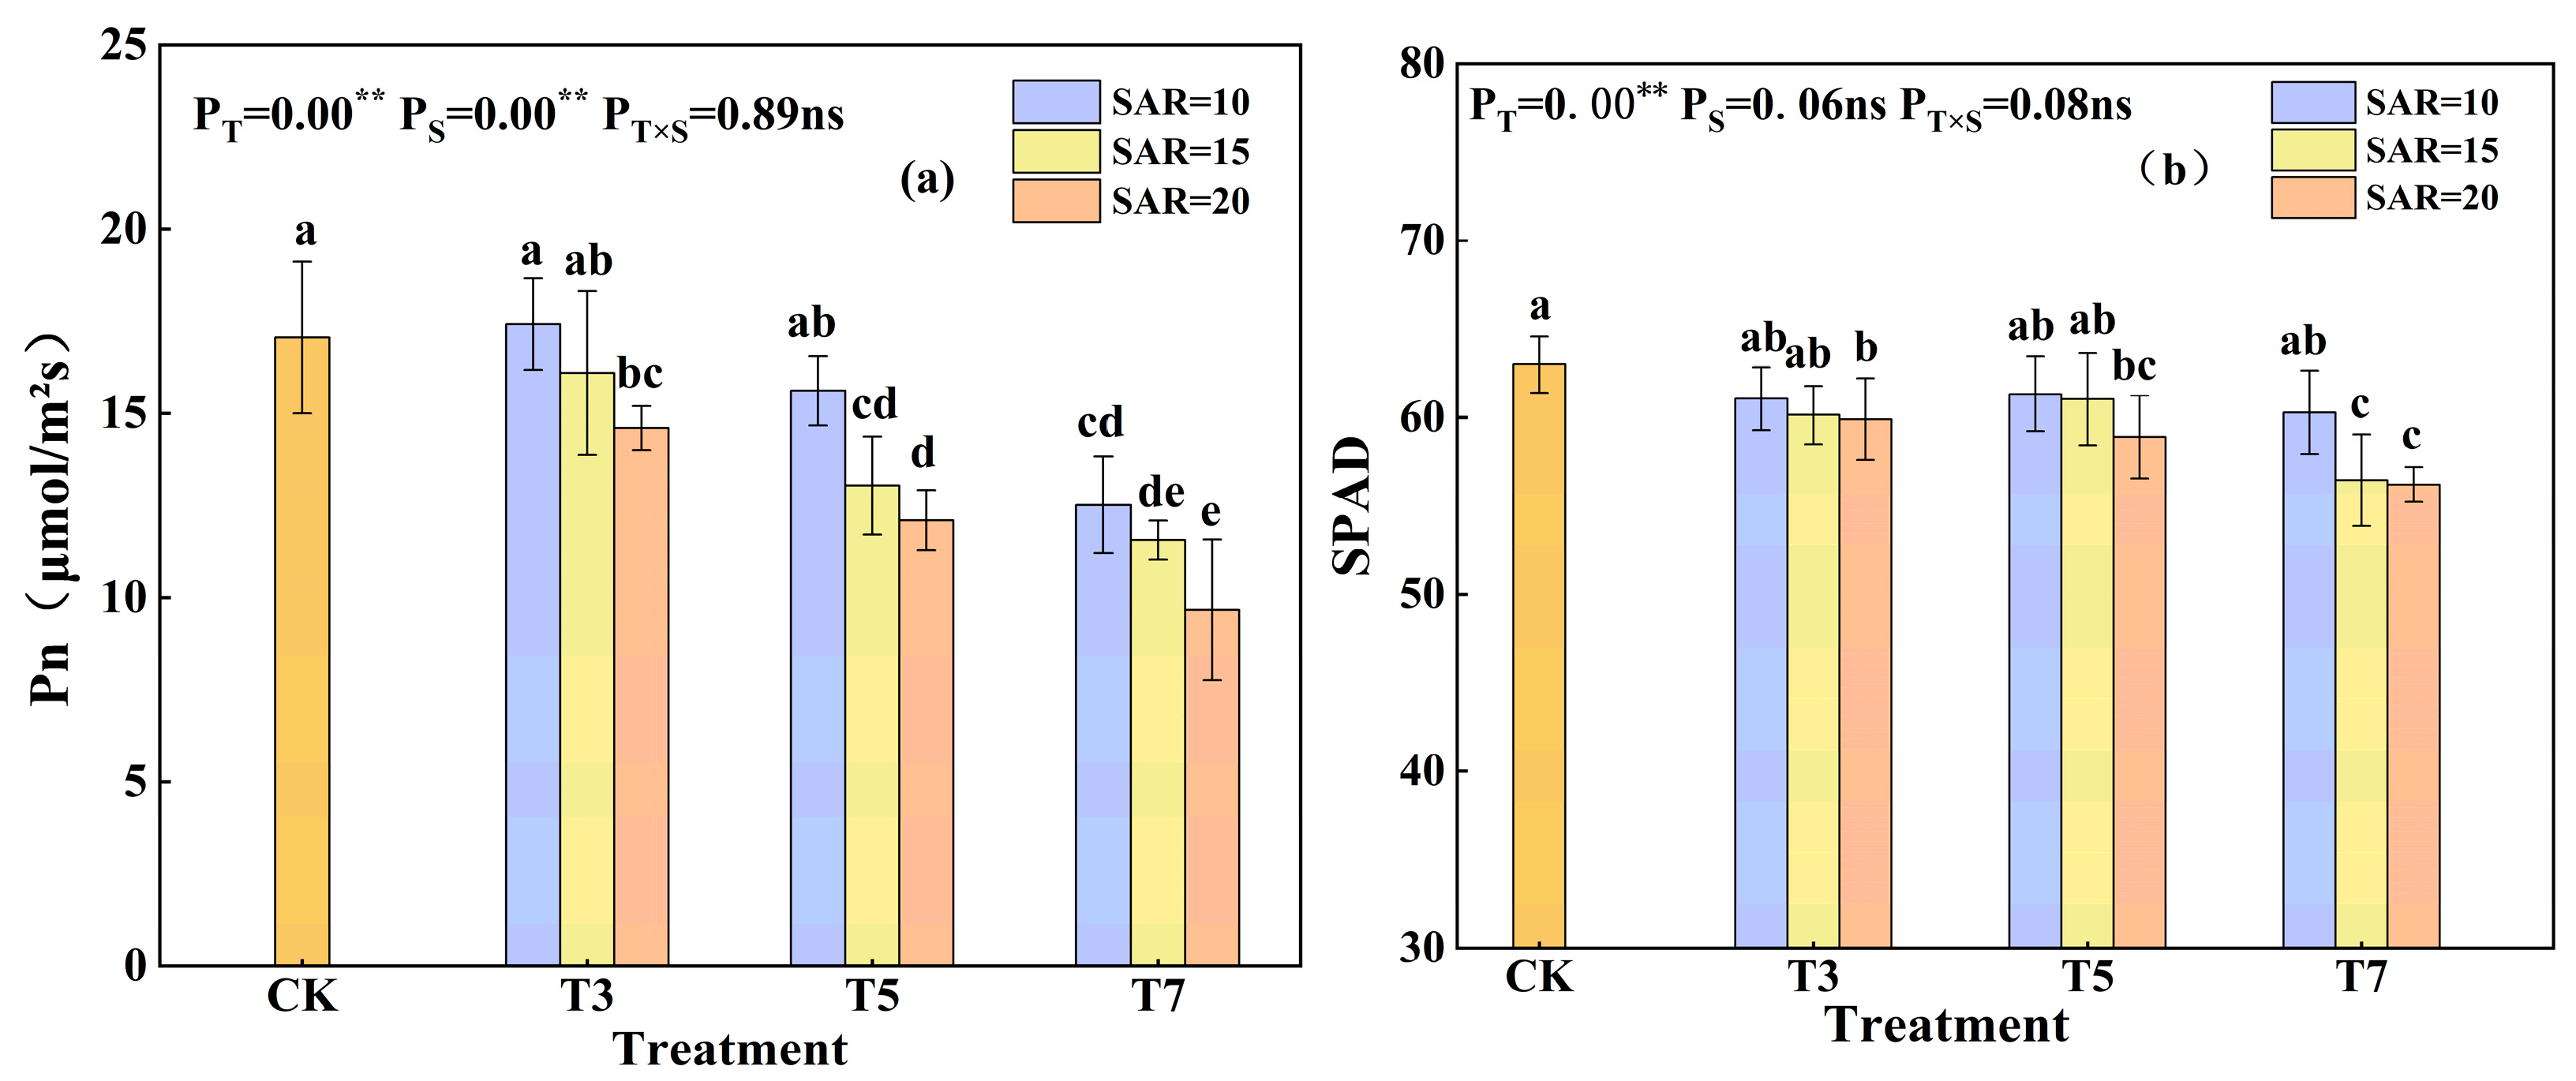
The effects of irrigation water salinity and SAR on net photosynthetic rate (Pn) and SPAD values in cotton leaves were investigated (Figure 6). Analysis of variance indicated that both salinity and SAR had highly significant effects on Pn. Under the same SAR level, Pn decreased with increasing salinity, with T3, T5, and T7 treatments exhibiting reductions of 5.98%, 20.37% and 34.07%, respectively, relative to CK. Under the same salinity level, Pn decreased with an increasing SAR, with S10, S15, and S20 treatments showing reductions of 11.00%, 20.48% and 28.94%, respectively, compared to CK. Notably, the T5S10 treatment increased Pn by 7.21% compared to T3S20. Salinity also had a highly significant effect on SPAD values. Under the same SAR level, SPAD values decreased with increasing salinity, with T3, T5, and T7 treatments showing reductions of 3.42%, 4.85%, and 8.50%, respectively, compared to CK. The T5S10 treatment increased SPAD values by 2.40% relative to T3S20.

3.5. Effects of Irrigation Water Salinity and SAR on Cotton Growth

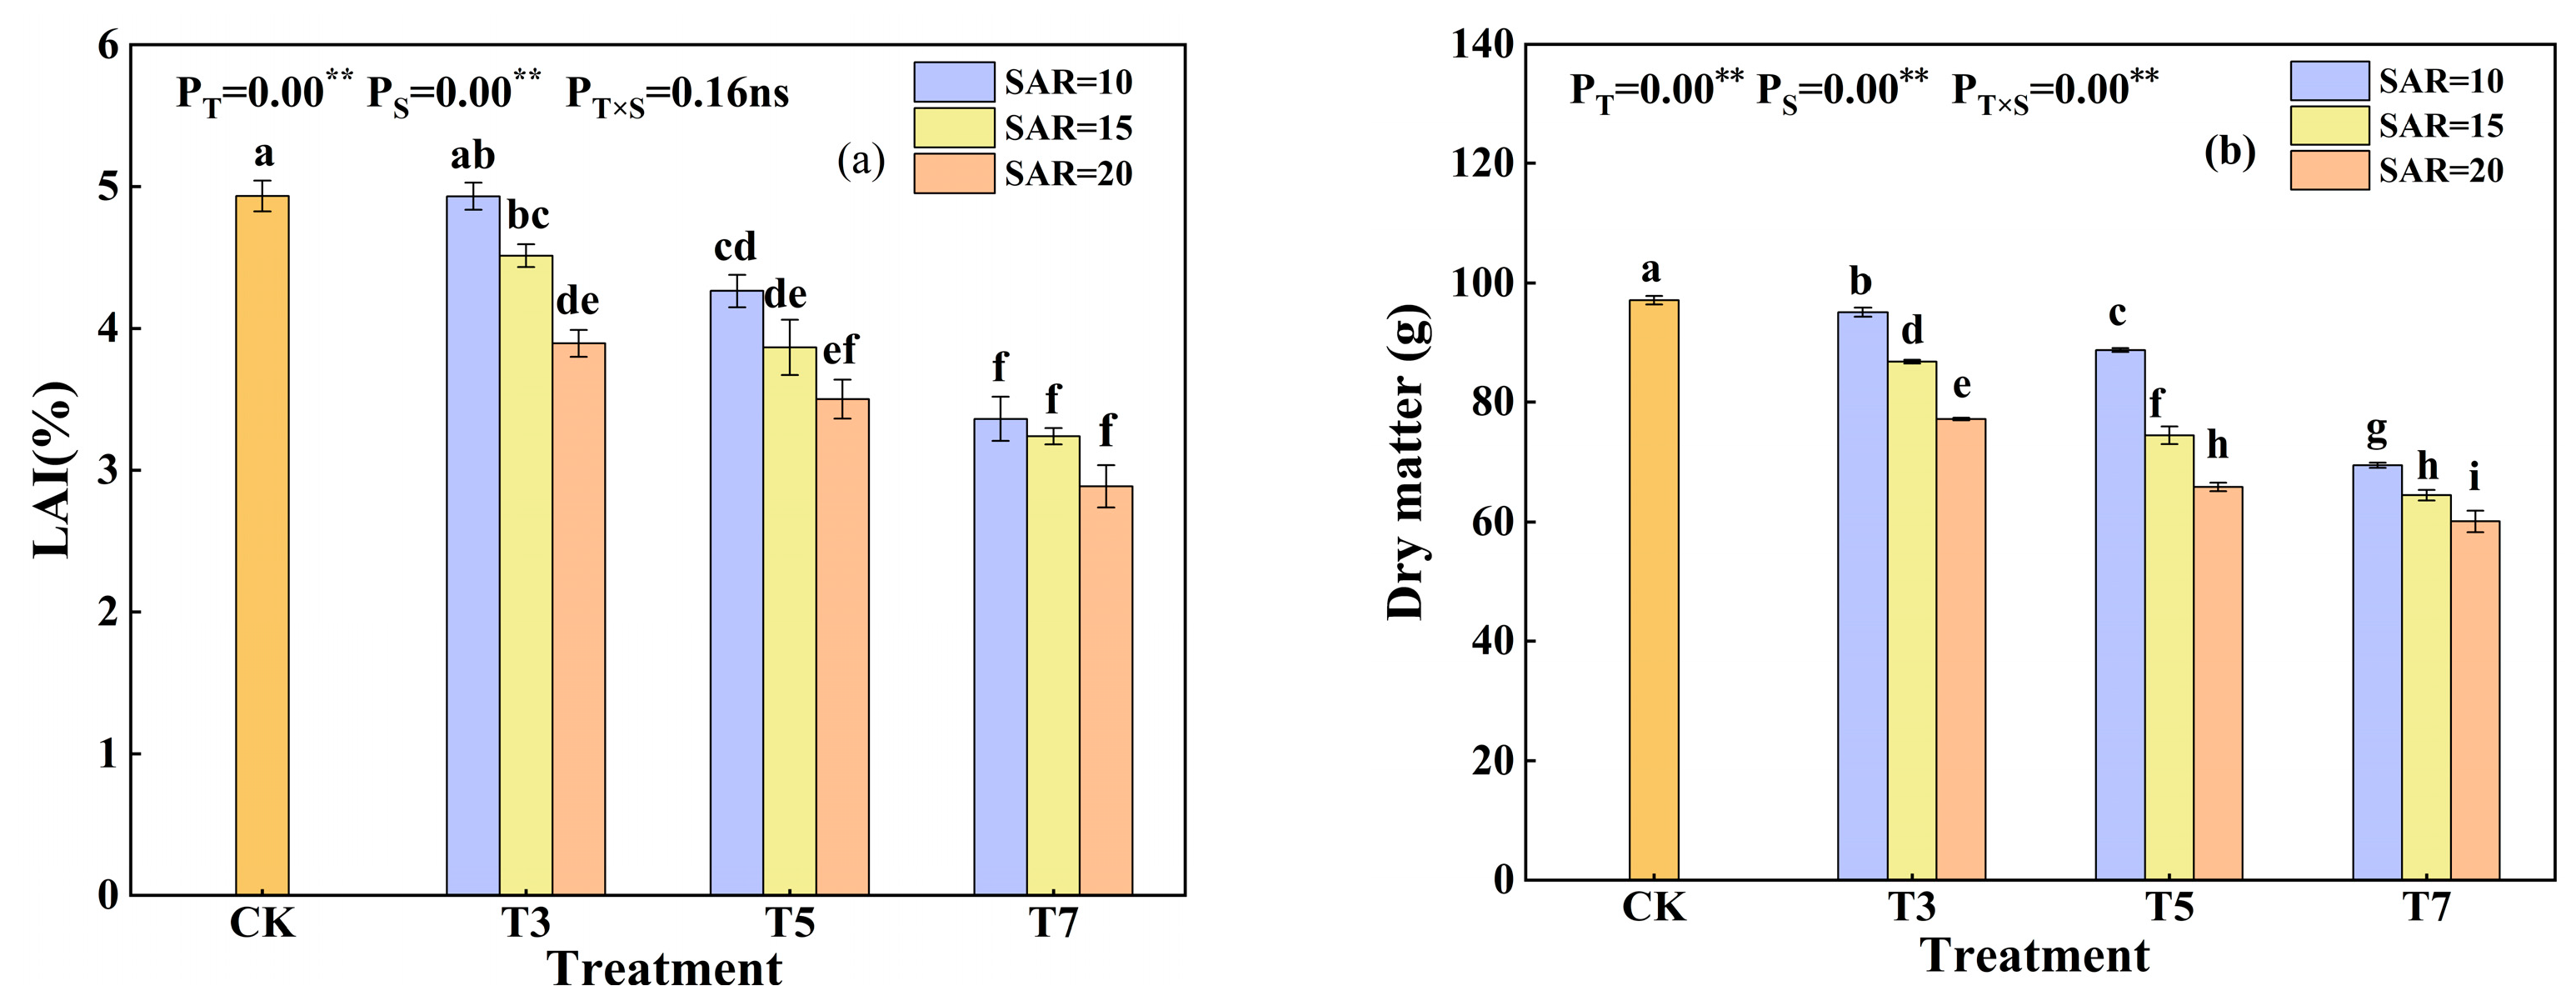
Analysis of variance indicated that both irrigation water salinity and SAR had highly significant effects on cotton leaf area index (LAI) and aboveground dry matter accumulation (Figure 7). Under the same SAR level, LAI and dry matter accumulation increased with decreasing salinity. Compared to the control (CK), the T3 treatment resulted in reductions of 15.15% and 11.04% in average LAI and dry matter accumulation, respectively, whereas the T5 treatment showed significant increases of 21.50% and 21.36%, and the T7 treatment demonstrated increases of 30.53% and 50.12%, respectively. Under the same salinity level, both LAI and total dry matter accumulation increased with decreasing SAR. Compared to the S20 treatment, the S10 treatment showed significant increases of 22.14% and 24.81% in average LAI and dry matter accumulation, respectively, while the S15 treatment exhibited increases of 13.00% and 11.20%, respectively. Although the T5S10 treatment had higher irrigation water salinity than T3S20, reducing SAR led to increases of 9.48% and 15.16% in average LAI and dry matter accumulation, respectively. These results indicate that lowering SAR in brackish-water irrigation can enhance LAI and dry matter accumulation.

4. Discussion

Salt has specific effects on cotton growth. Although cotton is relatively salt-tolerant, high soil salinity can still affect its growth and development [31]. This study found that saline water irrigation introduces salt ions (Table 1) into the soil, leading to increased soil EC with higher salinity levels (Figure 2a). Increased salt content of the soil causes plants to synthesize reactive oxygen species that impair DNA, proteins, chlorophyll, and membrane function and inhibit photosynthesis [32]. Plants show resistance due to the enzyme defense system. This study found that SOD, POD, and CAT activities initially increased and then decreased with increasing salinity (Figure 3), while MDA content increased significantly with increasing irrigation water salinity (Figure 4). This is because the tolerance to salinity in plant tissue decreased with advancing age. The capacity to scavenge reactive oxygen species (ROS) also declined with age [33]. The present investigation showed that both up- and downregulation of the activities of antioxidant enzymes occurred due to salinity with the progression of stress [34].
The increase in soil salinity reduces soil water potential, limiting the absorption and utilization of soil water and nutrients (potassium) by cotton roots [1,35]. Previous studies have shown that regulating ion balance is key to plant adaptation in saline environments, and the K+/Na+ ratio is a reliable indicator of crop salt tolerance [36]. This study found that plant Na+ content increased with increasing salinity (Figure 5b), while K+ content was negatively correlated with salinity (Figure 5a). Compared to CK, the average K+/Na+ ratio in T3, T5, and T7 treatments decreased significantly by 32.26%, 35.93%, and 47.07%, respectively (Figure 5c). This is consistent with previous findings [37,38]. This is because ROS induced by salt stress attack unsaturated fatty acids on the cell membrane, triggering elevated malondialdehyde (MDA) levels and impairing membrane structure and function (Figure 3). This disrupts the activity of potassium channels and transporters on the membrane (such as AKT1, HAK, etc.), not only hindering K+ uptake but also potentially causing intracellular K+ leakage. Simultaneously, compromised membrane integrity facilitates increased Na+ influx into cells, directly reducing the intracellular K+/Na+ ratio [39,40], and soil salinity increases during brackish-water irrigation (Figure 2). Salt stress-induced nutrient deficiencies often cause photoinhibition, reducing light energy conversion efficiency and electron transport efficiency, leading to decreased photosynthetic efficiency, and a linear correlation between the decrease in photosynthetic rate and K+ loss [41]. In this study, SPAD values and Pn decreased with increasing salinity (Figure 6). This is due to the fact that potassium is involved in carbohydrate synthesis, transport, and distribution, as well as regulating stomatal opening and closing [42], Na+ excess disrupts cell membrane structure and enzyme activity (Figure 4), K+ deficiency triggers a decrease in the K+/Na+ ratio, which degrades chlorophyll and reduces the photosynthetic rate. In addition, the expression levels of PBGD, a salt-stress differentially expressed protein involved in chlorophyll metabolism, were all significantly decreased under salt-stress conditions [43,44], providing a theoretical basis for understanding chlorophyll responses to salt stress. Ultimately, antioxidant system disruption, nutrient deficiencies, and reduced photosynthetic efficiency inhibit plant vegetative growth, leading to decreased leaf area index and dry matter accumulation (Figure 7). The inhibition of vegetative growth inevitably reduces crop transpiration and root water uptake, resulting in increased soil water content with increasing irrigation water salinity under the same irrigation volume (Figure 2b). This indicates that while high salinity maintains higher soil water, root water uptake capacity is still inhibited by salt stress.
In this study, it was found that soil salt accumulation under the same mineralization level decreased with the decrease in SAR of irrigation water, which shows that the decrease in SAR of irrigation water can reduce the accumulation of soil salts under high mineralization irrigation. The present study showed that the average activities of SOD, POD, and CAT all tended to increase with decreasing SAR under the same irrigation water mineralization, resulting in a significant decrease in MDA content with decreasing SAR. Compared with T3S20, T5S10 treatment increased mineralization but reduced irrigation water SAR, which resulted in a significant increase in SOD, POD, and CAT activities by 30.42%, 60.70%, and 99.20%, respectively, and a decrease in MDA content by 12.85%. Previous studies have suggested that the local cotton utilizes irrigation water with a mineralization greater than 5 g·L−1 and a SAR than 15 (mmol·L−1)1/2 is unfavorable for cotton growth [45], so reducing SAR can enhance cotton antioxidant enzyme activity against salt toxicity. Lowering the irrigation water, SAR also attenuated the inhibition of water nutrient uptake and utilization by the root system triggered by salinity stress, while reducing plant Na+ uptake and increasing K+ and K+/Na+ ratios, which reduced the toxic effects on the crop. Compared with the T3S20 treatment, although the mineralization of irrigation water in the T5S10 treatment increased by 66.7%, the Na+ and K+ contents of the irrigation water were comparable, and the Cl- content was 79.3% higher than that of the T3S20 treatment, but the Ca2+ content was 6.48 times higher than that of the T3S20 treatment (Table 1). When the brackish water entered the soil, sufficient Ca2+ in the soil solution of T5S10 treatment formed an obvious antagonistic effect with Na+ [26], so the Na+ content of T5S10 plants was significantly reduced by 26.20% (Figure 5b), and the K+ content and the K+/Na+ ratio increased by 2.48% and 38.85%, respectively (Figure 5a, 5c). Under the same irrigation water salinity, leaf net photosynthetic rate increased with decreasing SAR, with the T5S10 treatment showing a 7.21% and 2.40% increase in net photosynthetic rate and chlorophyll content compared to T3S20. This study also found that under the same irrigation water salinity, leaf area index and total dry matter increased with decreasing SAR, indicating that reducing SAR enhances cotton’s antioxidant capacity and photosynthesis, thereby increasing dry matter yield under salt stress.
Although this study explored the effects of SAR on cotton physiological growth under salt stress, it did not comprehensively monitor dynamic changes in plant indicators. Future research should delve deeper into the physiological mechanisms by which SAR alleviates salt stress from genomic and metabolomic perspectives.

5. Conclusions

This study investigated soil salinity changes and cotton physiological growth under different salinity levels and SAR in saline water irrigation. The research results indicate that soil electrical conductivity values and water content decreased with decreasing irrigation water salinity or SAR. Higher irrigation water salinity and SAR significantly inhibited cotton growth and development. Under the same salinity level, setting SAR = 10 (mmol·L−1)1/2 enhanced cotton leaf antioxidant enzyme activity, reduced MDA content, increased K+ uptake, and improved photosynthetic rate, effectively alleviating the inhibitory effects of salt stress on cotton growth and ultimately increasing total dry matter accumulation. Irrigation water salinity of 3 g·L−1 and SAR of 10 (mmol·L−1)1/2 was optimal for cotton growth among all irrigation brackish water treatments.

Author Contributions

H.L. planned and designed the experiments. Y.S., Y.X., and C.Z. performed the experiments. Y.S. analyzed the data and wrote the draft manuscript. H.N., X.Z., and G.Y. contributed reagents/materials tools. H.L. revised the manuscript. All authors have read and agreed to the published version of the manuscript.

Funding

This work was supported by the National Key R&D Program of China (no. 2022YFD1900502), the Central Public-interest Scientific Institution Basal Research Fund (Farmland Irrigation Research Institute, CAAS, FIRI2022-06), the Agricultural Science and Technology Innovation Program, and the “Tianchi Yingcai” Introduction Plan.

Data Availability Statement

The data presented in this study are available on request from the corresponding author; due to policy and legal reasons, data are classified and not disclosed.

Acknowledgments

Thanks to the guidance and assistance of Researcher Guomin Zhou, a specially appointed expert under the “Tianchi Yingcai” Introduction Plan. Thanks to the support of the Henan Field Observation and Research Station of High-Efficient Agricultural Water Use platform. Thanks to the Alar Modern Agricultural Experts Experiment Station for providing the experimental site.

Conflicts of Interest

The authors declare no conflicts of interest.

References

  1. Chen, W.; Hou, Z.; Wu, L.; Liang, Y.; Wei, C. Evaluating salinity distribution in soil irrigated with saline water in arid regions of northwest China. Agric. Water Manag. 2010, 97, 2001–2008. [Google Scholar] [CrossRef]
  2. Kang, S.; Hao, X.; Du, T.; Tong, L.; Su, X.; Lu, H.; Li, X.; Huo, Z.; Li, S.; Ding, R. Improving agricultural water productivity to ensure food security in China under changing environment: From research to practice. Agric. Water Manag. 2017, 179, 5–17. [Google Scholar] [CrossRef]
  3. Chen, W.; Jin, M.; Ferré, T.P.A.; Liu, Y.; Xian, Y.; Shan, T.; Ping, X. Spatial distribution of soil moisture, soil salinity, and root density beneath a cotton field under mulched drip irrigation with brackish and fresh water. Field Crops Res. 2018, 215, 207–221. [Google Scholar] [CrossRef]
  4. Guo, H.; Hu, Z.; Zhang, H.; Hou, Z.; Min, W. Soil Microbial Metabolic Activity and Community Structure in Drip-Irrigated Calcareous Soil as Affected by Irrigation Water Salinity. Water Air Soil Pollut. 2019, 230, 44. [Google Scholar] [CrossRef]
  5. Li, J.; Gao, Y.; Zhang, X.; Tian, P.; Li, J.; Tian, Y. Comprehensive comparison of different saline water irrigation strategies for tomato production: Soil properties, plant growth, fruit yield and fruit quality. Agric. Water Manag. 2019, 213, 521–533. [Google Scholar] [CrossRef]
  6. Ma, Z.; Liu, J.; Wen, Y.; Zhang, J.; Yin, F.; Guo, L.; Li, W.; He, J.; Ma, J.; Liang, Y.; et al. Optimizing cotton yield through appropriate irrigation water salinity: Coordinating above- and below-ground growth and enhancing photosynthetic capacity. Eur. J. Agron. 2024, 154, 127095. [Google Scholar] [CrossRef]
  7. Chen, W.; Jin, M.; Ferré, T.P.A.; Liu, Y.; Huang, J.; Xian, Y. Soil conditions affect cotton root distribution and cotton yield under mulched drip irrigation. Field Crops Res. 2020, 249, 107743. [Google Scholar] [CrossRef]
  8. Baath, G.S.; Shukla, M.K.; Bosland, P.W.; Steiner, R.L.; Walker, S.J. Irrigation water salinity influences at various growth stages of Capsicum annuum. Agric. Water Manag. 2017, 179, 246–253. [Google Scholar] [CrossRef]
  9. Alharby, H.F.; Colmer, T.D.; Barrett-Lennard, E.G. Salinization of the soil solution decreases the further accumulation of salt in the root zone of the halophyte Atriplex nummularia Lindl. growing above shallow saline groundwater. Plant Cell Environ. 2017, 41, 99–110. [Google Scholar] [CrossRef]
  10. Li, W.; Gao, Y.; Tian, Y.; Li, J. Double-root-grafting enhances irrigation water efficiency and reduces the adverse effects of saline water on tomato yields under alternate partial root-zone irrigation. Agric. Water Manag. 2022, 264, 107488. [Google Scholar] [CrossRef]
  11. Liu, S.; Dong, Y.; Xu, L.; Kong, J. Effects of foliar applications of nitric oxide and salicylic acid on salt-induced changes in photosynthesis and antioxidative metabolism of cotton seedlings. Plant Growth Regul. 2013, 73, 67–78. [Google Scholar] [CrossRef]
  12. Anjum, S.A.; Ashraf, U.; Zohaib, A.; Tanveer, M.; Naeem, M.; Ali, I.; Tabassum, T.; Nazir, U. Growth and developmental responses of crop plants under drought stress: A review. Zemdirb.-Agric. 2017, 104, 267–276. [Google Scholar] [CrossRef]
  13. Li KeJiang, L.K.; Ma JunYong, M.J.; Cao CaiYun, C.C.; Zheng ChunLian, Z.C.; Zhang CangGen, Z.C.; Niu YingJie, N.Y. Effect of irrigation water salt content on cotton growth and yield. Zhongguo Shengtai Nongye Xuebao/Chin. J. Eco-Agric. 2011, 19, 312–317. [Google Scholar] [CrossRef]
  14. Jiao, Y.; Pan, Z.; Zhang, Y.; Niu, L.; Zheng, C. Effect of Saline Water Irrigation on Soil Salt and Cotton in Hebei Low Plain. J. Irrig. Drain. 2012, 31, 31–34, 39. [Google Scholar]
  15. Wang, C.X.; Wang, Q.J.; Liu, J.J.; Su, L.J.; Shan, Y.Y.; Zhuang, L. Effects of mineralization of irrigation water and soil salinity on cotton emergence rate in Southern Xinjiang Uygur Autonomous Region of China. Trans. Chin. Soc. Agric. Eng. 2010, 26, 28–33. [Google Scholar]
  16. Ma, Z.; Zhu, Y.; Liu, J.; Li, Y.; Zhang, J.; Wen, Y.; Song, L.; Liang, Y.; Wang, Z. Multi-objective optimization of saline water irrigation in arid oasis regions: Integrating water-saving, salinity control, yield enhancement, and CO2 emission reduction for sustainable cotton production. Sci. Total Environ. 2023, 912, 169672. [Google Scholar] [CrossRef]
  17. Yang, G.; Li, F.; Tian, L.; He, X.; Gao, Y.; Wang, Z.; Ren, F. Soil physicochemical properties and cotton (Gossypium hirsutum L.) yield under brackish water mulched drip irrigation. Soil Tillage Res. 2020, 199, 104592. [Google Scholar] [CrossRef]
  18. Zhang, A.; Zheng, C.; Li, K.; Dang, H.; Cao, C.; Rahma, A.E.; Zhang, J.; Feng, D. Responses of soil water-salt variation and cotton growth to drip irrigation with saline water in the low plain near the bohai sea. Irrig. Drain. 2020, 69, 448–459. [Google Scholar] [CrossRef]
  19. Li, J.; Chen, J.; He, P.; Chen, D.; Dai, X.; Jin, Q.; Su, X. The optimal irrigation water salinity and salt component for high-yield and good-quality of tomato in Ningxia. Agric. Water Manag. 2022, 274, 107940. [Google Scholar] [CrossRef]
  20. Sevik, H.; Cetin, M. Effects of Water Stress on Seed Germination for Select Landscape Plants. Pol. J. Environ. Stud. 2015, 24, 689–693. [Google Scholar] [CrossRef]
  21. Shabala, S. Ionic and osmotic components of salt stress specifically modulate net ion fluxes from bean leaf mesophyll. Plant Cell Environ. 2000, 23, 825–837. [Google Scholar] [CrossRef]
  22. Read, J.J.; Reddy, K.R.; Jenkins, J.N. Yield and fiber quality of Upland cotton as influenced by nitrogen and potassium nutrition. Eur. J. Agron. 2006, 24, 282–290. [Google Scholar] [CrossRef]
  23. Flores, P.; Hernández, V.; Hellín, P.; Fenoll, J.; Cava, J.; Mestre, T.; Martínez, V. Metabolite profile of the tomato dwarf cultivar Micro-Tom and comparative response to saline and nutritional stresses with regard to a commercial cultivar. J. Sci. Food Agric. 2015, 96, 1562–1570. [Google Scholar] [CrossRef] [PubMed]
  24. Quanen, G.; Lili, N.; Baoguo, L.; Shiyu, C. Effect of salt ion composition of irrigation water on parameters of soil water and salt movement. J. Agric. Eng. 2017, 33, 123–128. [Google Scholar]
  25. Gao, F.; Wang, L.; Xie, Y.; Sun, J.; Ning, H.; Han, Q.; Kanneh, J.E.; Liu, H. Optimizing canopy structure through equal row spacing and appropriate irrigation enhances machine-harvested seed cotton yield and quality. Ind. Crops Prod. 2024, 216, 118799. [Google Scholar] [CrossRef]
  26. Yucai, X.; Huifeng, N.; Xianbo, Z.; Wang, Z.; Peiwen, X.; Yinping, S.; Nanfang, L.; Xingpeng, W.; Hao, L. Reducing the Sodium Adsorption Ratio Improves the Soil Aggregates and Organic Matter in Brackish-Water-Irrigated Cotton Fields. Agronomy 2024, 14, 2169. [Google Scholar] [CrossRef]
  27. Song, J.; Xin, L.; Gao, F.; Liu, H.; Wang, X. Effects of Foliar Selenium Application on Oxidative Damage and Photosynthetic Properties of Greenhouse Tomato under Drought Stress. Plants 2024, 13, 302. [Google Scholar] [CrossRef]
  28. Zahedi, S.M.; Moharrami, F.; Sarikhani, S.; Padervand, M. Selenium and silica nanostructure-based recovery of strawberry plants subjected to drought stress. Sci. Rep. 2020, 10, 17672. [Google Scholar] [CrossRef]
  29. Rady, M.M.; Belal, H.E.E.; Gadallah, F.M.; Semida, W.M. Selenium application in two methods promotes drought tolerance in Solanum lycopersicum plant by inducing the antioxidant defense system. Sci. Hortic. 2020, 266, 109290. [Google Scholar] [CrossRef]
  30. Heitkemper, D.T.; Vela, N.P.; Stewart, K.R.; Westphal, C.S. Determination of total and speciated arsenic in rice by ion chromatography and inductively coupled plasma mass spectrometry. J. Anal. At. Spectrom. 2001, 16, 299–306. [Google Scholar] [CrossRef]
  31. Ben Ahmed, C.; Magdich, S.; Ben Rouina, B.; Boukhris, M.; Ben Abdullah, F. Saline water irrigation effects on soil salinity distribution and some physiological responses of field grown Chemlali olive. J. Environ. Manag. 2012, 113, 538–544. [Google Scholar] [CrossRef] [PubMed]
  32. Hong, C.-Y.; Chao, Y.-Y.; Yang, M.-Y.; Cho, S.-C.; Huei Kao, C. Na+ but not Cl or osmotic stress is involved in NaCl-induced expression of Glutathione reductase in roots of rice seedlings. J. Plant Physiol. 2009, 166, 1598–1606. [Google Scholar] [CrossRef] [PubMed]
  33. Yamane, K.; Mitsuya, S.; Kawasaki, M.; Taniguchi, M.; Miyake, H. Antioxidant Capacity and Damages Caused by Salinity Stress in Apical and Basal Regions of Rice Leaf. Plant Prod. Sci. 2009, 12, 319–326. [Google Scholar] [CrossRef]
  34. Sarkar, R.K.; Mahata, K.R.; Singh, D.P. Differential responses of antioxidant system and photosynthetic characteristics in four rice cultivars differing in sensitivity to sodium chloride stress. Acta Physiol. Plant. 2013, 35, 2915–2926. [Google Scholar] [CrossRef]
  35. Li, J.; Chen, J.; Qu, Z.; Wang, S.; He, P.; Zhang, N. Effects of Alternating Irrigation with Fresh and Saline Water on the Soil Salt, Soil Nutrients, and Yield of Tomatoes. Water 2019, 11, 1693. [Google Scholar] [CrossRef]
  36. Chunthaburee, S.; Dongsansuk, A.; Sanitchon, J.; Pattanagul, W.; Theerakulpisut, P. Physiological and biochemical parameters for evaluation and clustering of rice cultivars differing in salt tolerance at seedling stage. Saudi J. Biol. Sci. 2015, 23, 467–477. [Google Scholar] [CrossRef]
  37. Kenji, U. Accumulation of some nitrogen compounds in response to salt stress and their relationships with salt tolerance in rice (Oryza sativa L.) seedlings. Plant Growth Regul. 2003, 41, 159–164. [Google Scholar] [CrossRef]
  38. Ali, R.; Gul, H.; Hamayun, M.; Rauf, M.; Iqbal, A.; Shah, M.; Hussain, A.; Bibi, H.; Lee, I.-J. Aspergillus awamori ameliorates the physicochemical characteristics and mineral profile of mung bean under salt stress. Chem. Biol. Technol. Agric. 2021, 8, 9. [Google Scholar] [CrossRef]
  39. Sun, J.; Chen, S.-L.; Dai, S.-X.; Wang, R.-G.; Li, N.-Y.; Shen, X.; Zhou, X.-Y.; Lu, C.-F.; Zheng, X.-J.; Hu, Z.-M.; et al. Ion flux profiles and plant ion homeostasis control under salt stress. Plant Signal. Behav. 2009, 4, 261–264. [Google Scholar] [CrossRef]
  40. Li, L. Screening of Kidney Bean Cultivars forSaline–alkaline Tolerance and Study ofPhysiological and Biochemical ResponseMechanism. Master’s Thesis, Heilongjiang Bayi Agricultural University, Daqing, China, June 2016. [Google Scholar]
  41. Sun, J. Effects of nitrogen on the growth and photosynthesis of industrial hemp(Cannabis sativa L.) under salt stress. Master’s Thesis, Yunnan University, Kunming, China, 15 January 2022. [Google Scholar]
  42. Ashraf, M.; Ahmad, A.; McNeilly, T. Growth and Photosynthetic Characteristics in Pearl Millet under Water Stress and Different Potassium Supply. Photosynthetica 2001, 39, 389–394. [Google Scholar] [CrossRef]
  43. Turan, S.; Tripathy, B.C. Salt-stress induced modulation of chlorophyll biosynthesis during de-etiolation of rice seedlings. Physiol. Plant. 2014, 153, 477–491. [Google Scholar] [CrossRef] [PubMed]
  44. Hu, L.; Xiang, L.; Li, S.; Zou, Z.; Hu, X.H. Beneficial role of spermidine in chlorophyll metabolism and D1 protein content in tomato seedlings under salinity-alkalinity stress. Physiol. Plant. 2015, 156, 468–477. [Google Scholar] [CrossRef] [PubMed]
  45. Xie, Y.; Liu, H.; Zhao, F.; Zhang, L.; Zhao, X.; Shi, Z.; Wang, X. Effects of irrigation water mineralization and sodium adsorption ratio on the growth and yield of drip-irrigated cotton under film. Arid. Zone Res. 2024, 41, 2071–2082. [Google Scholar] [CrossRef]
Figure 1. Experimental Field (a) and Irrigation system (b).
Agronomy 15 02092 g001
Figure 2. Soil electrical conductivity values (a) and water content (b) in cotton fields under different treatments.
Agronomy 15 02092 g002
Figure 3. MDA content in cotton leaves under different treatments. Different lowercase letters indicate significant differences among treatments at p < 0.05. T, S, and T × S denote irrigation water salinity, SAR, and their interaction, respectively. * denotes significant difference (p < 0.05); ** denotes highly significant difference (p < 0.01); ns denotes non-significant difference (p > 0.05).
Agronomy 15 02092 g003
Figure 4. Antioxidant activity in cotton leaves under different treatments ((a): SOD activity; (b): POD activity; (c): CAT activity). Different lowercase letters indicate significant differences among treatments at p < 0.05. T, S, and T × S denote irrigation water salinity, SAR, and their interaction, respectively. * denotes significant difference (p < 0.05); ** denotes highly significant difference (p < 0.01); ns denotes non-significant difference (p > 0.05).
Agronomy 15 02092 g004
Figure 5. K+ and Na+ content and K+/Na+ ratio in cotton leaves under different treatments ((a): K+ content; (b): Na+ content; (c): K+/Na+ ratio). Different lowercase letters indicate significant differences among treatments at p < 0.05. T, S, and T × S denote irrigation water salinity, SAR, and their interaction, respectively. * denotes significant difference (p < 0.05); ** denotes highly significant difference (p < 0.01); ns denotes non-significant difference (p > 0.05).
Agronomy 15 02092 g005
Figure 6. Net photosynthetic rate and SPAD values of cotton leaves under different treatments ((a): Net photosynthetic rate; (b): SPAD values). Different lowercase letters indicate significant differences among treatments at p < 0.05. T, S, and T × S denote irrigation water salinity, SAR, and their interaction, respectively. * denotes significant difference (p < 0.05); ** denotes highly significant difference (p < 0.01); ns denotes non-significant difference (p > 0.05).
Agronomy 15 02092 g006
Figure 7. Leaf area index and aboveground dry matter weight of cotton under different treatments ((a): Leaf area index; (b): Aboveground dry matter weight). Different lowercase letters indicate significant differences among treatments at p < 0.05. T, S, and T × S denote irrigation water salinity, SAR, and their interaction, respectively. * denotes significant difference (p < 0.05); ** denotes highly significant difference (p < 0.01); ns denotes non-significant difference (p > 0.05).
Agronomy 15 02092 g007
Table 1. Salinity, SAR, and major ion content of irrigation water by treatment.
TreatmentsSAR
(mmol/L)1/2
Salinity (g/L)Major Ion Content (mg/L)
Ca2+Mg2+Na+K+ClSO42−
CK8.741.44103.6042.07419.096.45648.1087.54
T3S1010.103.00356.6942.07759.086.451616.0287.54
T3S1515.103.00209.4042.07918.276.451604.1087.54
T3S2020.113.00121.7842.071013.006.451597.0187.54
T5S1010.115.00789.4242.071077.466.452864.9187.54
T5S1515.085.00536.0042.071350.006.452844.4787.54
T5S2020.115.00368.6942.071532.236.452830.8787.54
T7S1010.107.001269.4242.071344.746.454117.6387.54
T7S1515.147.00914.8742.071727.976.454088.9587.54
T7S2020.117.00671.2442.071991.326.454069.2487.54
Table 2. Irrigation and fertilization regime for cotton fertility in 2024.
Irrigation and
Fertilizer Rates
Irrigation
Quota/mm
Fertilizing Amount (kg·hm−2)
NP2O5K2O
10 June 202437.504500
18 June 202434.87303015
25 June 202432.26454530
2 July 202443.21757530
9 July 202441.68606030
16 July 202442.49604575
22 July 202440.77453075
29 July 202447.41303060
5 August 202436.93303045
12 August 202439.58303015
20 August 202442.57000
Disclaimer/Publisher’s Note: The statements, opinions and data contained in all publications are solely those of the individual author(s) and contributor(s) and not of MDPI and/or the editor(s). MDPI and/or the editor(s) disclaim responsibility for any injury to people or property resulting from any ideas, methods, instructions or products referred to in the content.