Article

Exploring the Effects of Biochar and Compost on Ameliorating Coastal Saline Soil

1
Institute of Ecological Protection and Restoration, Chinese Academy, Beijing 100091, China
2
The Key Laboratory for Silviculture and Conservation of Ministry of Education, College of Forestry, Beijing Forestry University, Beijing 100083, China
3
Tianjin LVYIN Landscape & Ecology Construction Co., Ltd., Tianjin 300384, China
4
Comprehensive Experimental Center in Yellow River Delta, Chinese Academy of Forestry, Dongying 257000, China
5
Shandong Dongying Institute of Geographic Sciences, Dongying 257000, China
*
Author to whom correspondence should be addressed.
Agronomy 2025, 15(9), 2093; https://doi.org/10.3390/agronomy15092093
Submission received: 30 June 2025 / Revised: 4 August 2025 / Accepted: 28 August 2025 / Published: 30 August 2025

Abstract

In this study, the effects of biochar and compost on the amelioration of coastal saline soil were investigated through indoor leaching experiments and soil culture experiments. The results revealed that the multivoid structure of biochar and compost, when applied to soil, effectively improved soil hydraulic conductivity, promoted the leaching of salt ions, and reduced soil electrical conductivity. Owing to the high pH value of biochar and the lower pH value of compost, the combined application of the two has a complementary effect on improving the pH value of coastal saline soils. The calcium (Ca2+) and magnesium (Mg2+) contained in biochar and compost are exchanged with Na+ adsorbed by soil colloids, which reduces the sodium (Na+) adsorption ratio (SAR) value of the soil. Biochar and compost improve the physical properties of the soil, and the organic matter they contain helps soil particles aggregate with each other and form stable clusters, thus promoting the formation of soil agglomerates, which are conducive to the formation of clusters with a diameter of ≤0.25 mm. Biochar and compost are rich in nutrients, and their application significantly increased the contents of available nutrients and organic matter as well as the activities of urease, phosphatase, and dehydrogenase in saline soils. However, too high of an application rate of biochar increases the soil pH value, and excessive application of compost can lead to greater soil conductivity, which inhibits the activities of soil urease, phosphatase and dehydrogenase. Therefore, rational control of application rates is essential for improving coastal saline soils. Future research should further explore the synergistic effects of biochar and compost in improving soil structure, nutrient effectiveness, and microbial activity to promote their effective application in coastal saline–alkaline soil improvement.

1. Introduction

A coastal saltmarsh is a buffer zone between land and sea, formed by sediment deposition from sea–land interactions. Many coastal saline soils are distributed along the long coastline of China, with an area of approximately 2270 km2 in the northern region [1]. Coastal saline soils have high pH values, poor permeability, surface sloughing, and low nutrient contents [2,3,4]. This results in poor soil quality, low productivity, and inefficient land use, leading to significant waste of land resources and worsening land scarcity in coastal areas.
Biochar is a carbon-rich product obtained by the thermal cracking of biomass under anoxic or oxygen-limited conditions [5]. Owing to its large specific surface area and porous structure, biochar has been gradually applied for soil improvement as a soil conditioner that can reduce the soil bulk weight, improve the soil structure and porosity, and increase the soil permeability [6,7]. Biochar is usually alkaline, and its application to acidic soils significantly increases the soil pH [8]; however, its application to alkaline soils does not significantly increase the soil pH and even leads to a decrease in the soil pH [9]. Biochar adsorbs and immobilizes alkaline cations (e.g., sodium (Na+)) in the soil through its high cation exchange capacity, reducing soil alkalinity, while protonation of functional groups on its surface enhances the buffering capacity of the soil; its porous structure and high specific surface area promote agglomeration of the soil particles, improve the physical structure of the soil, and further enhance the buffering capacity [10,11]. In addition, cations such as calcium and magnesium in biochar can exchange with Na+ in the soil, reducing the soluble Na+ content and salt accumulation [12]. Amini et al. [13] reported that the application of biochar greatly improved the hydraulic conductivity and soil aggregate stability of saline soils and improved their infiltration capacity. Dong et al. [14] reported that the application of biochar improved the soil aggregate stability and content of soil water-stable aggregates and improved the permeability of soils. Similar results were also reported in the study of Duan et al. [15], in which the application of biochar improved not only the porosity of the soil layer but also the calcium (Ca2+) and magnesium (Mg2+) contained in the biochar exchanged with the Na+ in the soil and reduced the soluble Na+ content in the soil. In terms of the application rate, the effect of biochar on soil improvement is not always proportional to its application rate [16]. Xiao et al. [17] reported that biochar application at a rate of 30 t·hm−2 significantly increased the water holding capacity of the soil. However, Xu et al. [18] reported that biochar improved the physical and water holding properties of the soil when it was applied at a rate of 130 t·hm−2 but negatively affected the physical and hydraulic properties of the soil when it was applied at a rate of 390 t·hm−2. Zheng et al. [19] reported that biochar is alkaline and contains a large number of mineral salts, which exacerbates soil salinization and has a negative effect on soil physical properties. Therefore, the role of the application of biochar in ameliorating saline soils still needs further research.
Compost tends to be carbon-rich and loose-textured and can be used as a fertilizer and soil amendment, which can promote the formation of a soil granular structure, reduce the pH of the soil, improve soil fertility and microbial activity [20], and improve soil permeability and nutrient effectiveness [21,22,23]. The application of compost can promote the formation of organic–inorganic complexes via soil colloid compounding, which can reduce the soil bulk weight, increase porosity, improve water retention, reduce transpiration, promote leaching of soil surface salts, reduce the upward transport of water from deeper soil layers, and reduce the accumulation of saline and alkali materials in the surface layer of the soil. In addition, compost is rich in organic acids, which have a high cation exchange capacity and buffering capacity, can exchange with metal ions in saline and alkaline soils to reduce soil alkalinity, and can also chelate, adsorb and exchange saline and alkaline ions and adsorb free Na+, thus improving the physicochemical properties of saline and alkaline soils. Compost contains oxygen-containing acidic functional groups, including carboxyl and phenolic hydroxyl groups on aromatic and aliphatic structures, which can form complexes or chelate with metal ions in the form of ionic and covalent bonds, increasing the ion exchange capacity. In the process of improving saline soils, organic acid also adsorbs 20% of free Na+, reducing the negative effects of high Na+ and improving soil quality. Therefore, we investigated the effects of adding biochar and compost to improve coastal saline soils through indoor simulated leaching desalination tests and soil culture experiments using typical saline soils in the coastal area of Dongying city, China. The objectives of this study are as follows: (1) to investigate the characteristics of salinity changes in leachate during leaching and changes in soil salinity and pH after leaching in coastal saline soils with the addition of biochar and compost; and (2) to investigate the appropriate amount of biochar and compost to improve the quality of coastal saline soils and to provide a theoretical basis for improving coastal saline soils.

2. Materials and Methods

2.1. Test Materials

The soil used for testing was taken from the topsoil layer (0–20 cm) of a field experiment station at the Yellow River Delta Comprehensive Experimental Center of the Chinese Academy of Forestry (Dongying city, China) in June 2021 (3 days after light rain, sunny to cloudy, 22–34 °C). The soil was taken from a nearly square test area (approximately 55 ha), which was divided into four rectangular zones, and within each zone, five sampling points, which were arranged in an “S” shape, were sampled with an earth auger (approximately 100 kg). All the samples were homogeneously mixed and redistributed for testing.
The biochar used was fruitwood biochar (pyrolyzed at 500 °C for 5 h under high-temperature anaerobic conditions) provided by Shaanxi Yixin Bioenergy Co., Ltd. of China, which contains the main components of organic carbon and mineral nutrients. The biochar and compost were crushed and pressed into 3 mm granules to facilitate transportation and application and to retain the homogeneity of the modified material.
The compost products required for the test were mainly pruning residues or withered material of plants such as Fraxinus chinensis Roxb, Populus, Salix babylonica, and weeds, which were produced via the secondary composting method [21] (see Table S1 and Table 1 for the basic evaluation of the materials used for the test).

2.2. Experimental Design

Test 1: The leaching device used in the experiment was a container (12 cm in diameter and 10 cm in height) with a hole on the bottom to simulate a soil column (Figure S1). The bottom of the container was lined with 2 layers of gauze to prevent soil leakage, and a 500 mL beaker was placed under the basin to receive the leachate. The experiment was divided into the following four treatments: CK treatment group: no amendment materials were applied to the soil; B treatment group: biochar was applied to the soil at a rate of 20 g·kg−1; W treatment group: compost was applied to the soil at a rate of 40 g·kg−1; BW treatment group: biochar and compost were applied to the soil at a rate of 20 g·kg−1 for biochar and 40 g·kg−1 for compost. Each treatment was replicated three times. The 2 mm sieved, air-dried soil was mixed well with the amendments, and 500 g of the mixed soil samples were added in layers to a container for natural compaction. Initially, 150 mL of water was added to the soil to reach the maximum water-holding capacity in the field, and the initial mass was weighed. Deionized water was used as the source of water for intermittent leaching. Leachate was collected after adding 100 mL of water (approximately 10 mm of precipitation), and again after watering with 100 mL following a 24 h interval. A total of six watering events were performed, and six leachates were collected. The salinity indices of the leachate and the soil after leaching were analyzed.
Test 2: Soil culture tests were conducted in a greenhouse with the temperature controlled at 20–25 °C and the air humidity at 40–60%. The biochar was set at four application levels, 0, 10, 20, and 40 g·kg−1, represented by B0, B1, B2, and B3, respectively. The compost was set up with four application levels, 0, 20, 40, and 80 g·kg−1, represented by W0, W1, W2, and W3, respectively; the experiment consisted of a total of 16 treatments, and three replications were set up for each treatment (see Table S2 for the treatment combinations used). In each soil culture container in the experiment (15 cm high and kept airy at the bottom), the materials were mixed well and then filled with 2 kg of soil-amended material mixture, naturally compacted, and left to incubate for one week. During the incubation period, the water content of the soil was adjusted according to the weight changes. The water content of the samples was controlled to be approximately 50–70% of the water holding capacity of the field (replenishing water every 5 days), and the incubation period was 9 months.

2.3. Analyses of Experimental Samples

The leaching solution used in the experiment was collected with a container at the lower end of the leaching device after each irrigation (Figure S1). At the end of the incubation, saturated hydraulic conductivity ring knives (6 cm in diameter and 4 cm in height) were used to collect soil samples for saturated hydraulic conductivity measurements. After all the remaining soil samples from each pot were mixed, approximately 1/4 of the remaining soil samples were taken back to the laboratory via the tetrad method and divided into two portions: one fresh soil for soil enzyme determination and the other air-dried and treated for soil chemistry and aggregation indices.
Soil pH and salinity indices: An aqueous soil mixture was prepared at a water-to-soil ratio of 5:1 for the determination of the relevant indices. The soil pH was determined via a general-purpose pH meter (Starter 3C, OHAUS, NJ USA); soil electrical conductivity (EC) was determined via an MP521 (Qingdao Mingbo Environmental Protection Technology Co., Ltd., Qingdao, China) conductivity meter; Ca2+ and Mg2+ were determined via EDTA complex titration; Na+ and K+ were determined via flame photometry (FP6410, Shanghai Yidian Analysis, China); Cl was determined via silver nitrate titration (Moore’s method); and EDTA complex titration SO42− determination was performed [24]. HCO3 and CO32− determination was performed via dual indicator neutralization titration [24]. The organic matter content was determined via high-temperature and thermal oxidation-volumetric methods. The organic matter content was determined via the high-temperature plus thermal oxidation-volumetric method; the available nitrogen content was determined via the alkaline hydrolysis method; the available phosphorus content was determined via 0.5 mol·L−1 NHCO3 leaching and the molybdenum blue colorimetric method (Shimadzu UV-120-02, Japan; Shimadzu Instruments (China Suzhou) Co., Ltd.); and the available potassium content was determined via the ammonium acetate-flame photometer method (FP6410, Shanghai Yidian Analysis, China) [24].
The sodium adsorption ratio (SAR) was calculated via the following formula [24]:
SAR = C     N a + ( C   ( C a 2 + + M g 2 + ) ) / 2 .
Determination of the soil water-stable aggregate content: The wet sieve method was used to determine the soil water-stable aggregate content. After the soil samples were fully moistened (approximately 20 min), they were poured into the sieve set, with apertures of 2, 1, 0.5, 0.25, and 0.053 mm, and the cluster analyzer was turned on and adjusted to 20 r·min−1 for 15 min (the sieve set could not be exposed to the water surface when sieving up and down). Then, the aggregates left on the sieves at all levels were rinsed with deionized water through a funnel into an aluminum box, dried and weighed, and the proportion of the weight of the aggregates at all levels was calculated. The contents of water-stabilized aggregates ≥2 mm and ≥0.25 mm (WR2, WR0.25) were also calculated.
The stability of the aggregates was characterized via the mean mass diameter (MWD) and geometric mean diameter (GMD) of the water-stable aggregates via the wet sieving method. These values were calculated according to the following equations:
M W D = i = 1 n x i ¯ w i ,
G M D = E x p i = 1 n m i ln x i ¯ i = 1 n m i ,
where x i ¯ is the average diameter of i aggregates, w i is the proportion of the weight of i aggregates, and m i is the weight of different aggregates in the soil. The fractal dimension was calculated via the formula derived by Yang Peiling et al. [25]:
M r < x i ¯ M T = x i ¯ x max ¯ 3 D .
Taking logarithms on both sides of the above equation yields
lg M r < x i ¯ M T = ( 3 D ) lg x i ¯ x max ¯ .
By utilizing the above formula and fitting it to the data, D can be obtained. Here, x i ¯ is the same as above, M r < x i ¯ is the weight of the aggregates with a particle size smaller than x i ¯ , and x max ¯ is the maximum particle size of the aggregates.
Determination of soil urease activity: In total, 5.00 g of fresh soil (sieved through 2 mm) was weighed in a 50 mL centrifuge tube, 1 mL of 10% urea solution and 4 mL of citrate buffer (pH 6.7) were added, and the mixture was mixed well. Two control groups were set up at the same time (no soil control) with 5 g of quartz sand instead of soil (to detect the contamination of reagents), and the tubes were capped tightly and placed in the incubator at 37 °C for 24 h under the protection of light. At the end of incubation, 10 mL of 2.5 M KCl solution was added, and the mixture was shaken for 30 min (extraction of NH4+) and centrifuged (4000 rpm, 10 min). The supernatant was taken as a reserve, and 1 mL of the supernatant was placed in a colorimetric tube. Then, 1 mL of C6H5ONa solution and 1 mL of 1% NaClO solution were added sequentially. The samples were immediately mixed at room temperature in the dark for 30 min, and a spectrophotometer was used at a wavelength of 625 nm to determine the concentration of NH3-N, which was expressed as the production of NH3-N in 1 g of soil after 1 h, μmol NH3-N/(g·h) [24].
Determination of soil phosphatase activity: In total, 1.00 g of fresh soil (sieved through 2 mm) was weighed in a 50 mL centrifuge tube, 4 mL of buffer (pH 9) and 1 mL of 0.05 M disodium p-nitrophenylphosphate (pNP) solution were added, and the mixture was mixed well. The control consisted of no soil, 1 g of quartz sand instead of soil, and the mixture was incubated at 37 °C for 1 h in the dark. At the end of incubation, the reaction was terminated immediately by adding 4 mL of 0.5 M NaOH and then centrifuged (4000 rpm, 10 min) for 10 min. The absorbance was measured at 400–420 nm, and the concentration of pNP was calculated according to the pNP standard curve and expressed as the production of p-nitrophenol (pNP) in 1 g of soil after 1 h, μmol pNP/(g·h) [24].
Determination of soil dehydrogenase activity: In total, 5.00 g of fresh soil (2 mm sieve) was weighed in a lightproof centrifuge tube, 1 mL of 1% TTC solution and 2 mL of Tris-HCl buffer (pH 7.5) were added, and the mixture was mixed well. One milliliter of 1% TTC solution and two mL of Tris-HCl buffer (pH 7.5) were added, and the mixture was mixed well. For the control, 5 g of quartz sand was used instead of soil, the mixture was incubated at 30 °C for 24 h in the dark. After incubation, 10 mL of methanol (or acetone) was added, the mixture was shaken vigorously for 10 min, and the mixture was centrifuged (4000 rpm, 10 min). The supernatant was collected, and the absorbance at 485–490 nm was measured, which was expressed as the production of triphenylmethyl fouling (TPF) produced in 1 g of soil after 1 h, μmol TPF/(g·h) [24].

2.4. Statistical Analysis

The data were analyzed and processed via SPSS 24.0 (IBM Corporation, Armonk, NY, USA). One-way ANOVA with Duncan’s method was used to test the significance of the differences among the four treatments in the leaching experiment, and the significance level was set at 0.05. In the two-way ANOVA, biochar was identified as the main factor affecting the variability of the effects of different application levels on soil properties, and compost was analyzed as the main factor. Finally, the interaction between these two factors was analyzed. The test statistic (F value) was calculated during the analysis, then the significance was determined on the basis of the P value, and finally, the variability was labeled by post hoc test effects. Moreover, Microsoft Office Excel and Origin 2024 (OriginLab, Northampton, MA, USA) were used for plotting and data compilation to analyze the effects of compost and biochar application and their interactions on the physicochemical properties of coastal saline soils.

3. Results

3.1. Effects of Biochar and Compost on Salt Leaching from Coastal Saline Soils

3.1.1. Properties of the Leaching Solution

The pH of the leaching solution changed significantly during the leaching test (Figure 1). The pH of the leaching solution in the CK treatment first increased but then stabilized as the leaching proceeded. The pH of the leaching solution in the B treatment decreased significantly from 8.82 to 8.37. There was no significant change in the pH of the leach solution in the W treatment group, suggesting that it inhibited the increase in the pH of the leach solution during the leaching process. During the early stages of the B and BW treatments, the pH was greater, resulting in a higher starting pH for the leaching solution. In each treatment, the EC of the leaching solution decreased rapidly in the early stages but slowed in the later stages. Compared with that of the CK treatment, the conductivity of the leaching solution of the treatments with the addition of amendment materials tended to decrease faster, indicating that the salt elution rate of the treatments with the addition of biochar and compost was faster. Among all the treatments, the BW treatment had the best rate of salt leaching, followed by the B treatment and, finally, the W treatment.
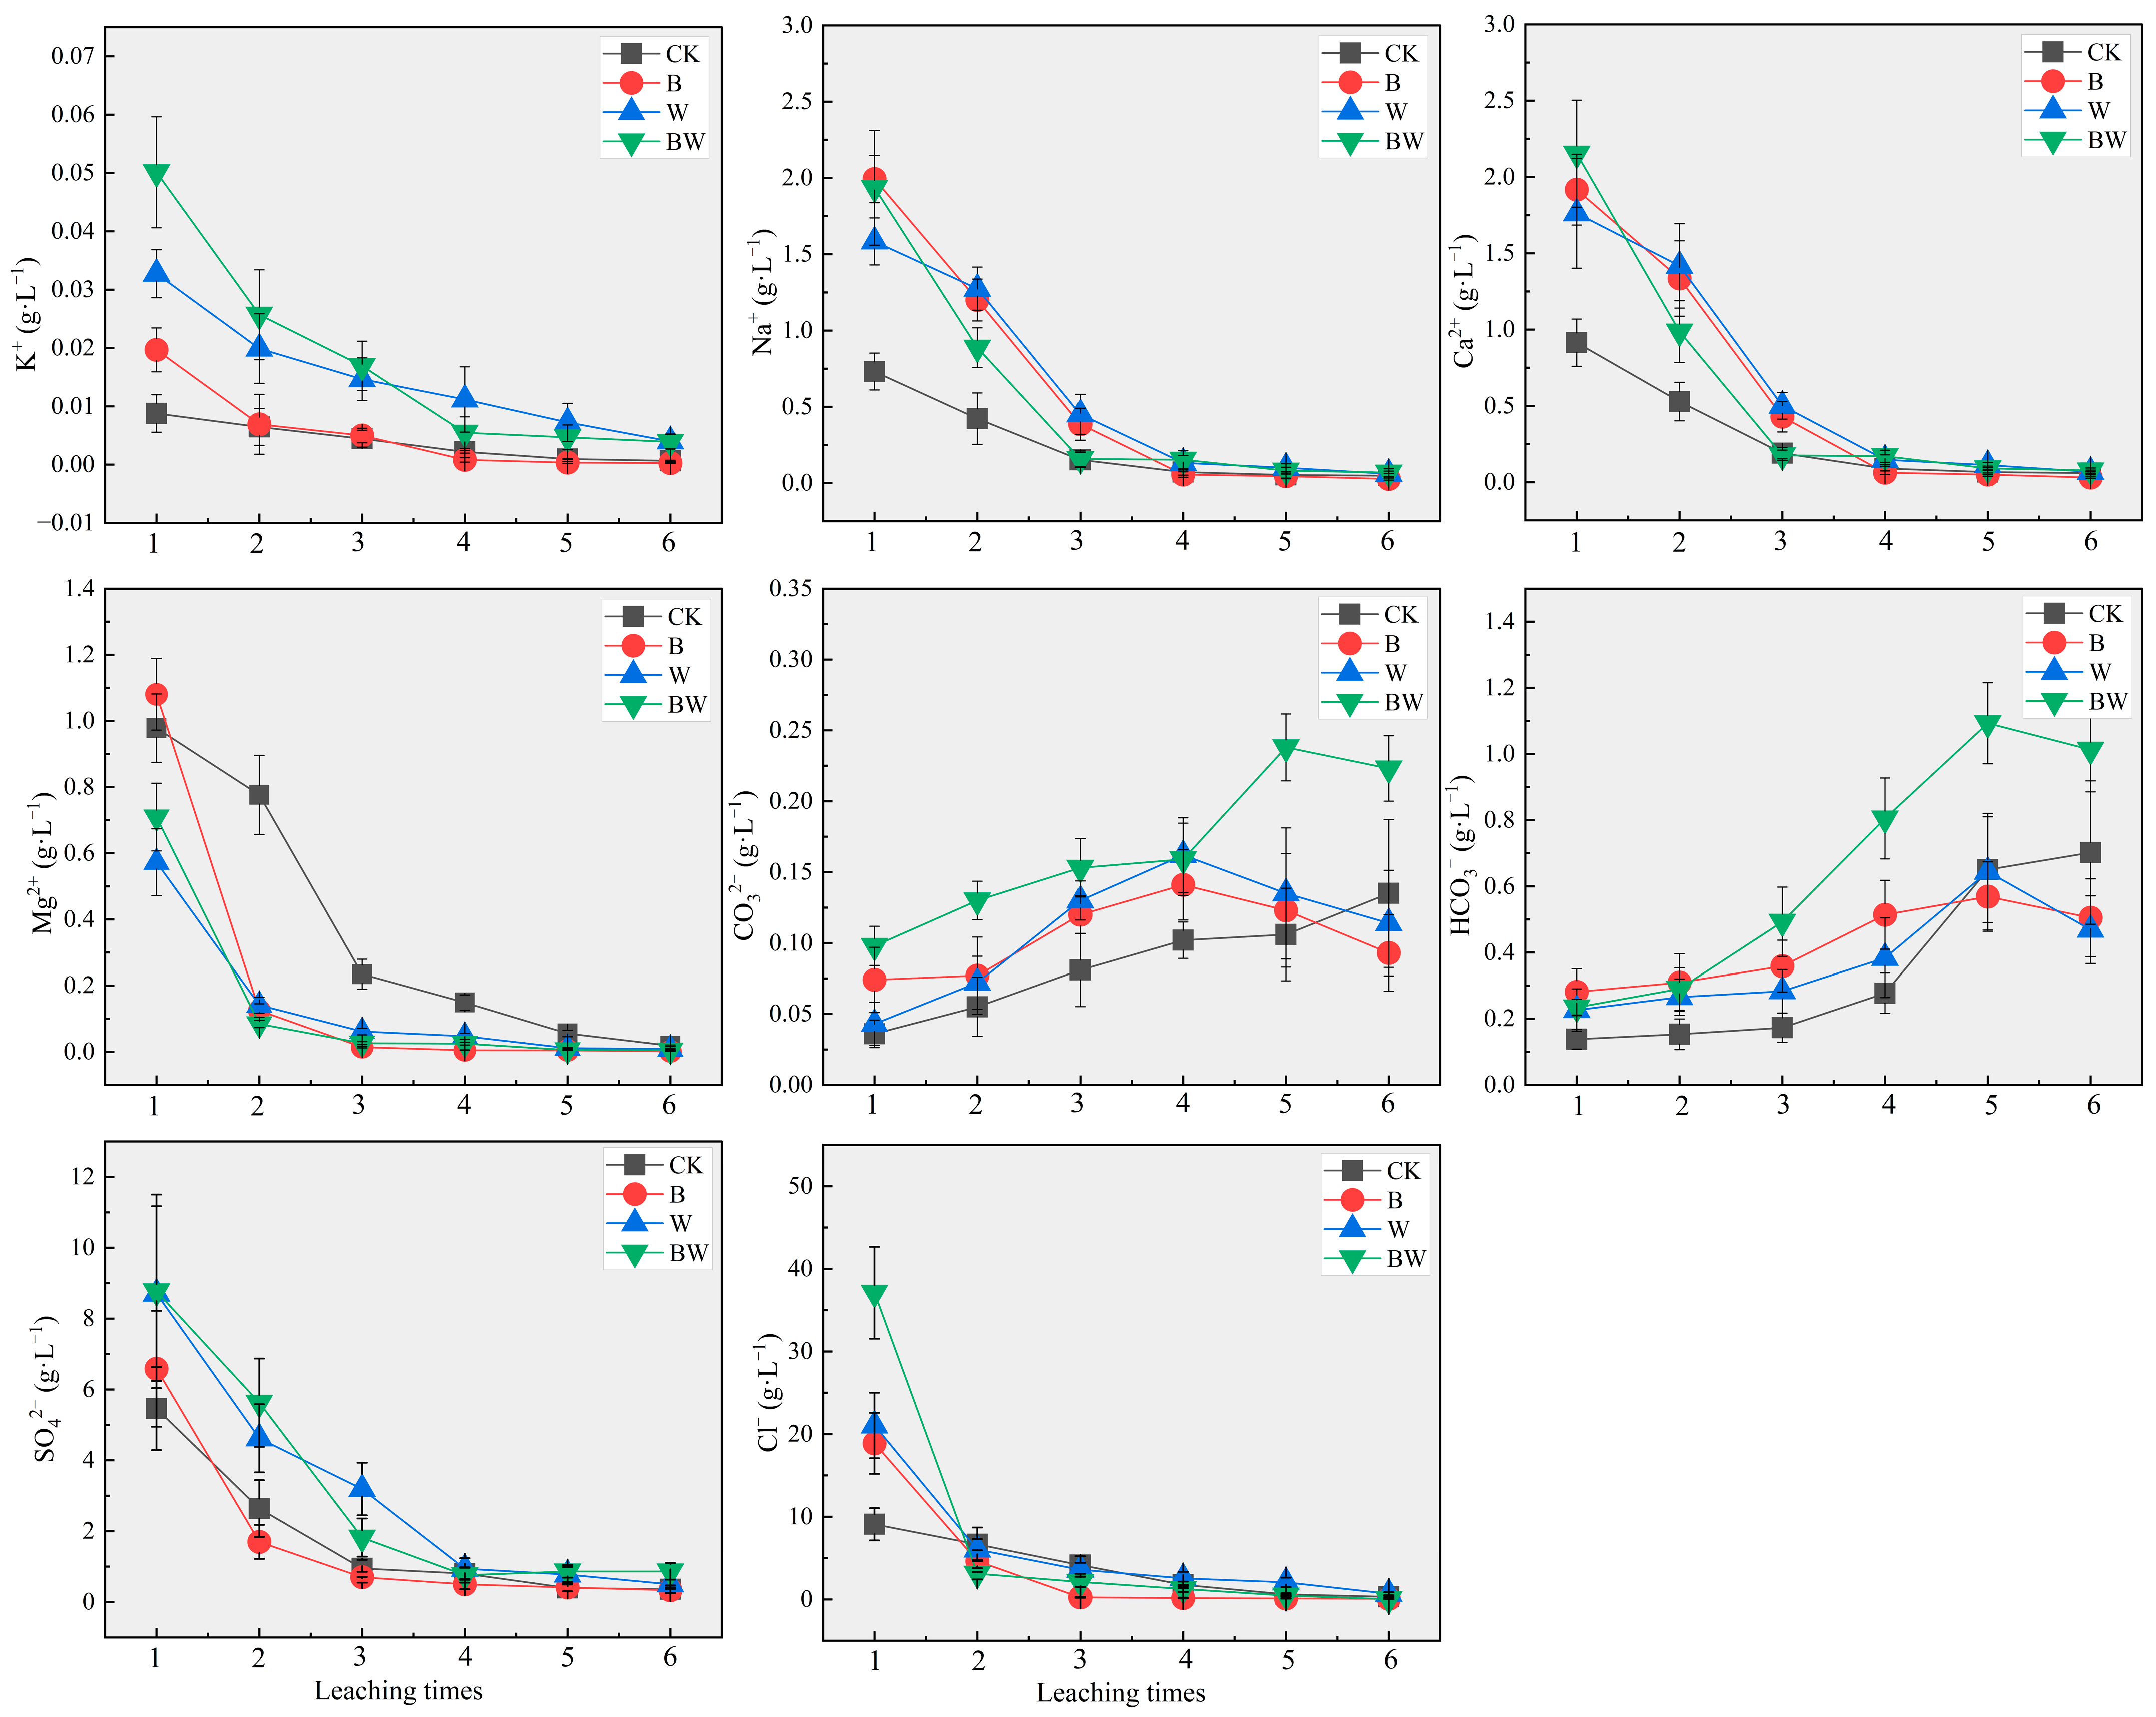
The main cations in the leaching solution were Na+ and Ca2+, and the anions were mainly Cl and SO42− (Figure 2). After three leachations, the ion content in the solution decreased significantly, but the contents of HCO3 and CO32− increased gradually with increasing number of leaching. The rate of decrease in the cation concentration in the leaching solution was accelerated in the treatment group in which the amendment materials were applied. This reflected differences in the ability of cations to move with water, with Na+ and Ca2+ moving with water at a greater rate than Mg2+ and K+. The Cl content in the leaching solution decreased the fastest, and its content stabilized after the second leaching, whereas the SO42− content stabilized after four leaching cycles, which indicated that the rate of Cl transport with water was significantly greater than that of SO42−. In addition, the application of modified materials increased the content of salt ions in the starting leaching solution, and the BW treatment significantly increased the contents of HCO3 and CO32−.

3.1.2. Soil Properties After Leaching

There were significant differences in the pH values of the soil after leaching among the treatments (Table 2), and the order of pH values was B > CK > BW > W. Compared with that in the CK treatment, the pH in the W treatment was significantly lower, indicating that the addition of compost alone effectively reduced the pH value of the coastal saline soil. Compared with the CK treatment, the B, W, and BW treatments significantly reduced the EC value of the soil by 43.90%, 34.15%, and 51.22%, respectively. The results of the present study revealed that, compared with the CK treatment, amendments B, W, and BW significantly reduced the SAR by 51.93%, 39.13%, and 63.82%, respectively. Compared with the soil properties before leaching (pH 8.41, EC 3.56 mS·cm−1, and SAR 3.59, in Table 1), the EC and SAR of the soils were significantly lower after leaching.

3.2. Effects of Biochar and Compost on Coastal Saline Soil Properties

3.2.1. Changes in Soil Physical Properties

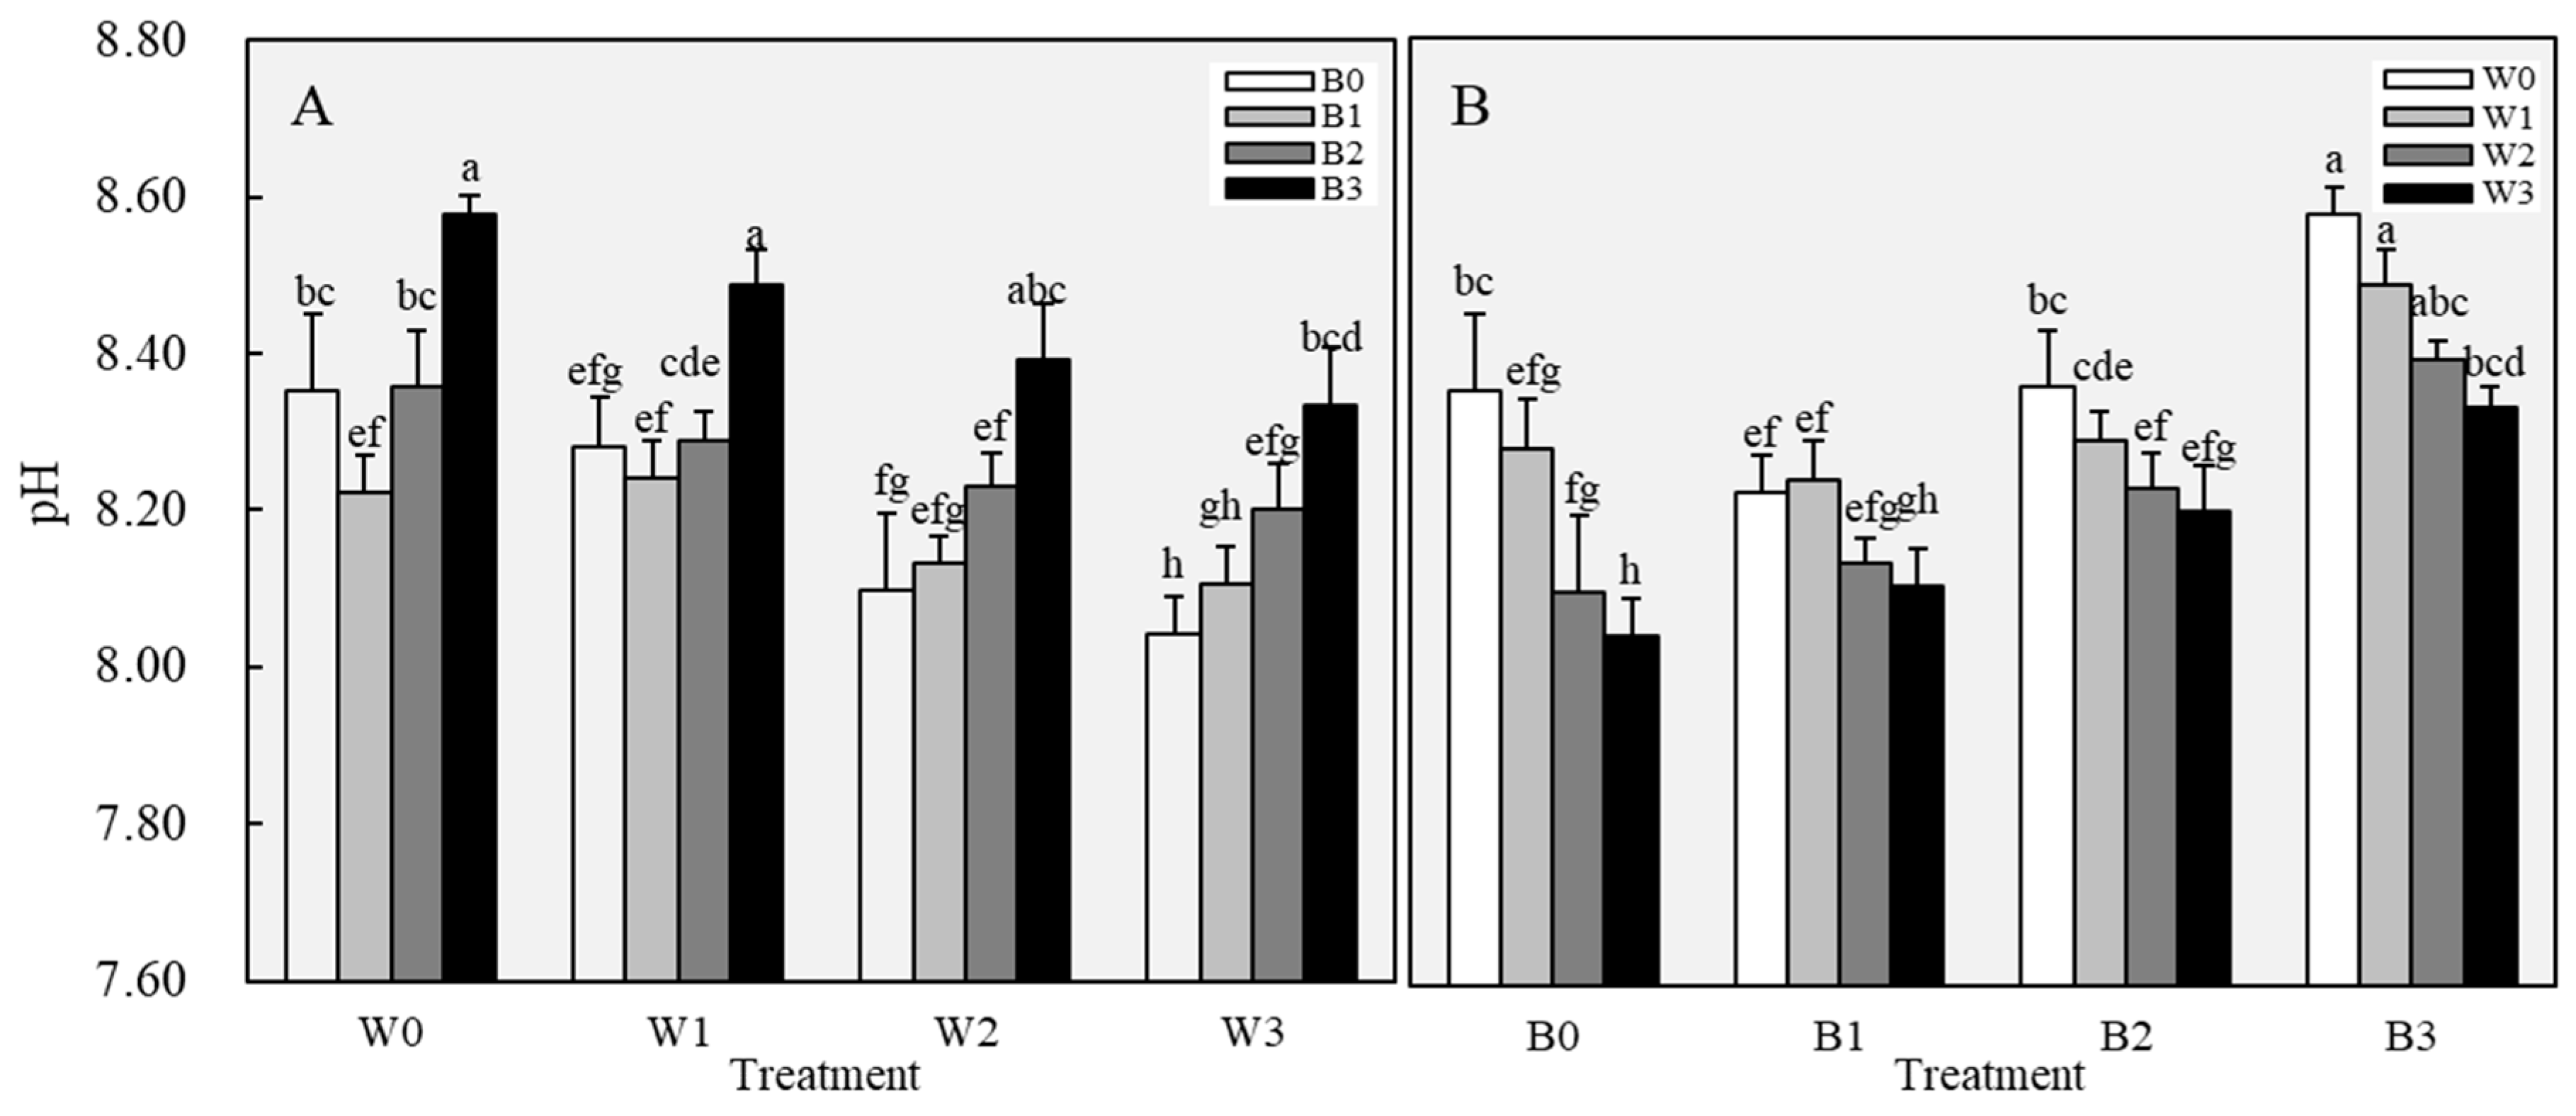
The application of different rates of biochar and compost affected the pH of the coastal saline soil (Figure 3). At the end of the incubation test, the pH of the treatments ranged from 8.04 to 8.58. Among them, B0W3 had the lowest value, and B3W0 had the highest value. When no compost was applied or the application level was low (W0, W1), the pH first decreased but then increased with increasing biochar application; when the compost application level was high (W2, W3), the pH tended to increase with increasing biochar application. This may be due to the fact that the soluble acidic components released by biochar dominate the soil pH reduction at low application rates, but its own alkalinity dominates at high rates, resulting in an increase in soil pH. The results of the experiment revealed that the pH of the soil decreased to different degrees when the biochar application rate was constant and when the compost application rate was greater than 20 g·kg−1, and only at higher application rates (W2 and W3) was the soil pH significantly lower than that of the W0 treatment group.
As shown in Figure 4, the EC values of all the treatments were lower than those of the B0W0 treatment. Among them, B1W2 had the lowest value of 1.93 mS·cm−1, which was significantly lower by 32.28% than that of B0W0. The experimental results revealed that the application of biochar and compost reduced the EC value of the soil, and the EC value of the soil decreased but then increased with increasing application of biochar and compost. The EC value of the soil was the lowest when the biochar was applied at 10 g·kg−1 and the compost was applied at 40 g·kg−1. The high application rates of biochar (40 g·kg−1) and compost (80 g·kg−1) did not significantly reduce the soil EC.
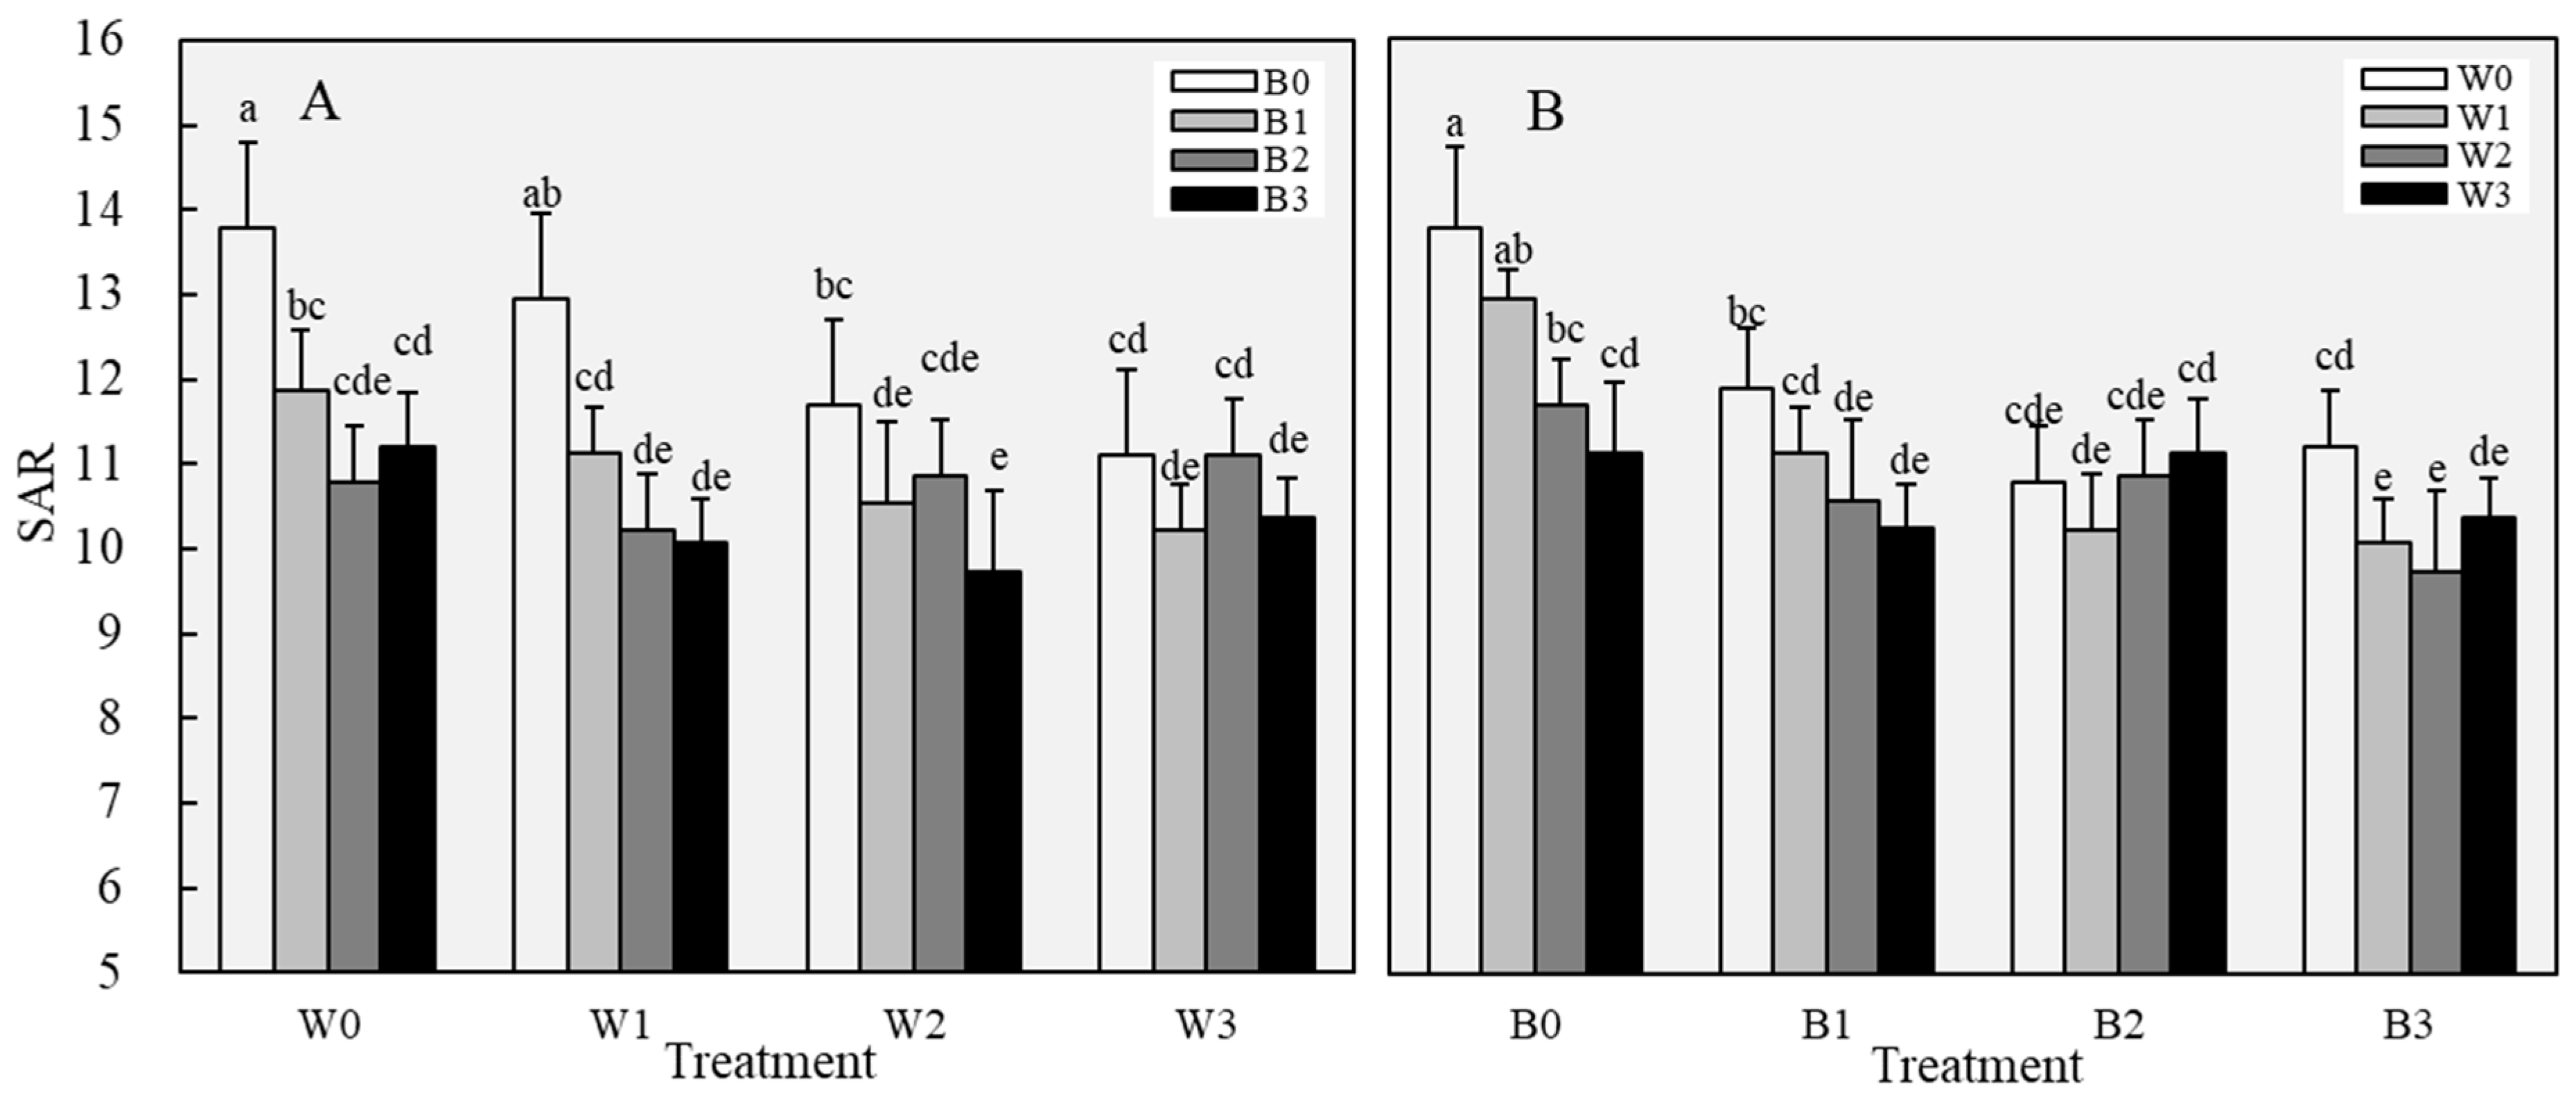
The SAR is an important indicator for evaluating the degree of soil salinization [10], and the higher its value, the greater the adverse effect on the soil. The dosing of biochar and compost significantly affected the SAR of coastal saline soils (Figure 5). The treatment without any amendment material (B0W0) had a high SAR of 13.78, and the W2B3 treatment had the lowest SAR, 9.73, which was 29.36% lower than that of the B0W0 treatment. The experimental results revealed that the SAR value of the soil as a whole tended to decrease with increasing biochar application rate at compost application rates ranging from 0 to 40 g·kg−1. When no biochar was applied or the application level was low (B0, B1), the compost was able to reduce the soil SAR to a certain extent, and only when the compost application was high (W2, W3) could the SAR significantly decrease, and there was no significant difference between W2 and W3. When the amount of biochar applied was relatively high (B2, B3), the SAR decreased but then increased with increasing compost application, and there was no significant difference between the treatments.
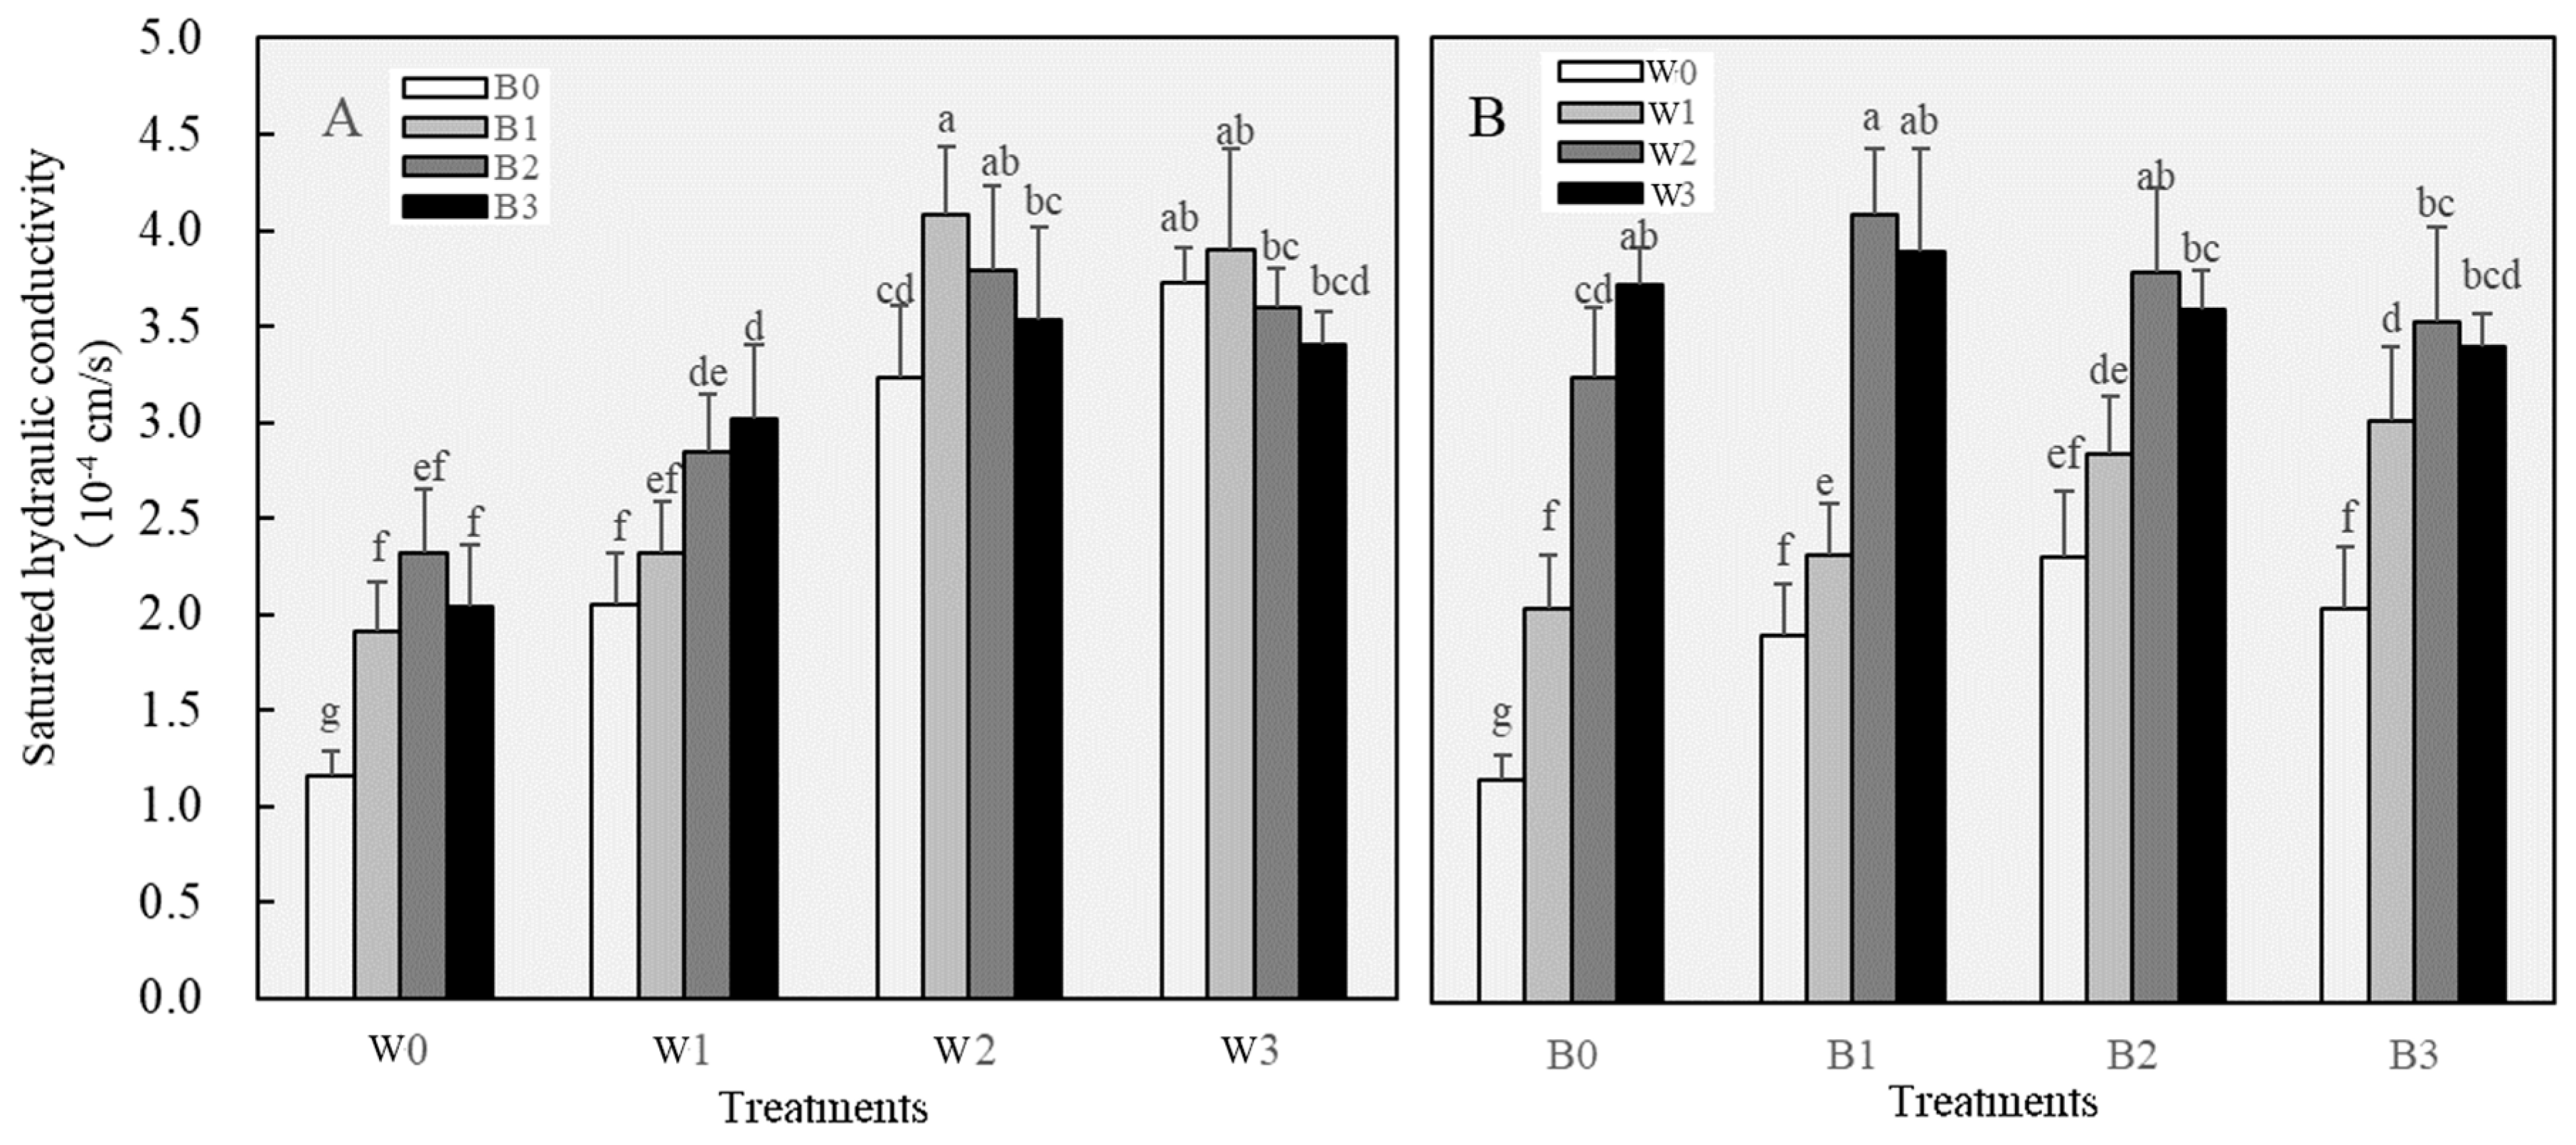
The saturated hydraulic conductivity of coastal saline soil was significantly affected by the ratio of biochar to compost (Figure 6). The saturated hydraulic conductivity of B0W0 was 1.16 × 10⁻⁴ cm·s−1, and that of all the other treatments was significantly greater than that of B0W0. The saturated hydraulic conductivity of B1W2 was the highest, at 4.08 × 10⁻⁴ cm·s−1, and it was increased by 351.7% compared with that of B0W0. When the application level of compost was maintained, the saturated hydraulic conductivity tended to increase but then decreased with increasing biochar application. When biochar application was held constant, the saturated hydraulic conductivity gradually increased with increasing compost application (W0–W2) and was generally greater in all the treatment groups than in the W0 treatment group, but there was no significant difference between W2 and W3.
The greater the content of water-stable aggregates ≥0.25 mm in size, the more stable the soil structure was. Table 3 shows that the application of biochar and compost increased the soil WR0.25 and WR2. The soil WR0.25 and WR2 increased with increasing biochar application at 0–40 g·kg−1 and 0–20 g·kg−1 compost, respectively. The WR0.25 and WR2 of the soil were more directly affected by compost, which increased significantly with increasing compost application. However, the difference in the WR2 content between the W2 and W3 experimental groups was not significant.
Compared with B0W0, B1W3 and B2W3 presented the highest MWD value of 0.43 mm, which was significantly greater by 86.71%. The application of biochar alone (W0) did not significantly affect the MWD of the soil; when compost was applied, the application of biochar increased the MWD to a certain extent. The soil MWD gradually increased with increasing amount of compost applied. The application of biochar alone (W0) did not significantly affect the GMD; however, the application of biochar increased the GMD to some extent, but the effect was not significant. GMD basically tended to increase with increasing amount of compost applied, and there was no significant difference between W2 and W3 (Table 4).

3.2.2. Changes in Soil Nutrients and Enzyme Activities

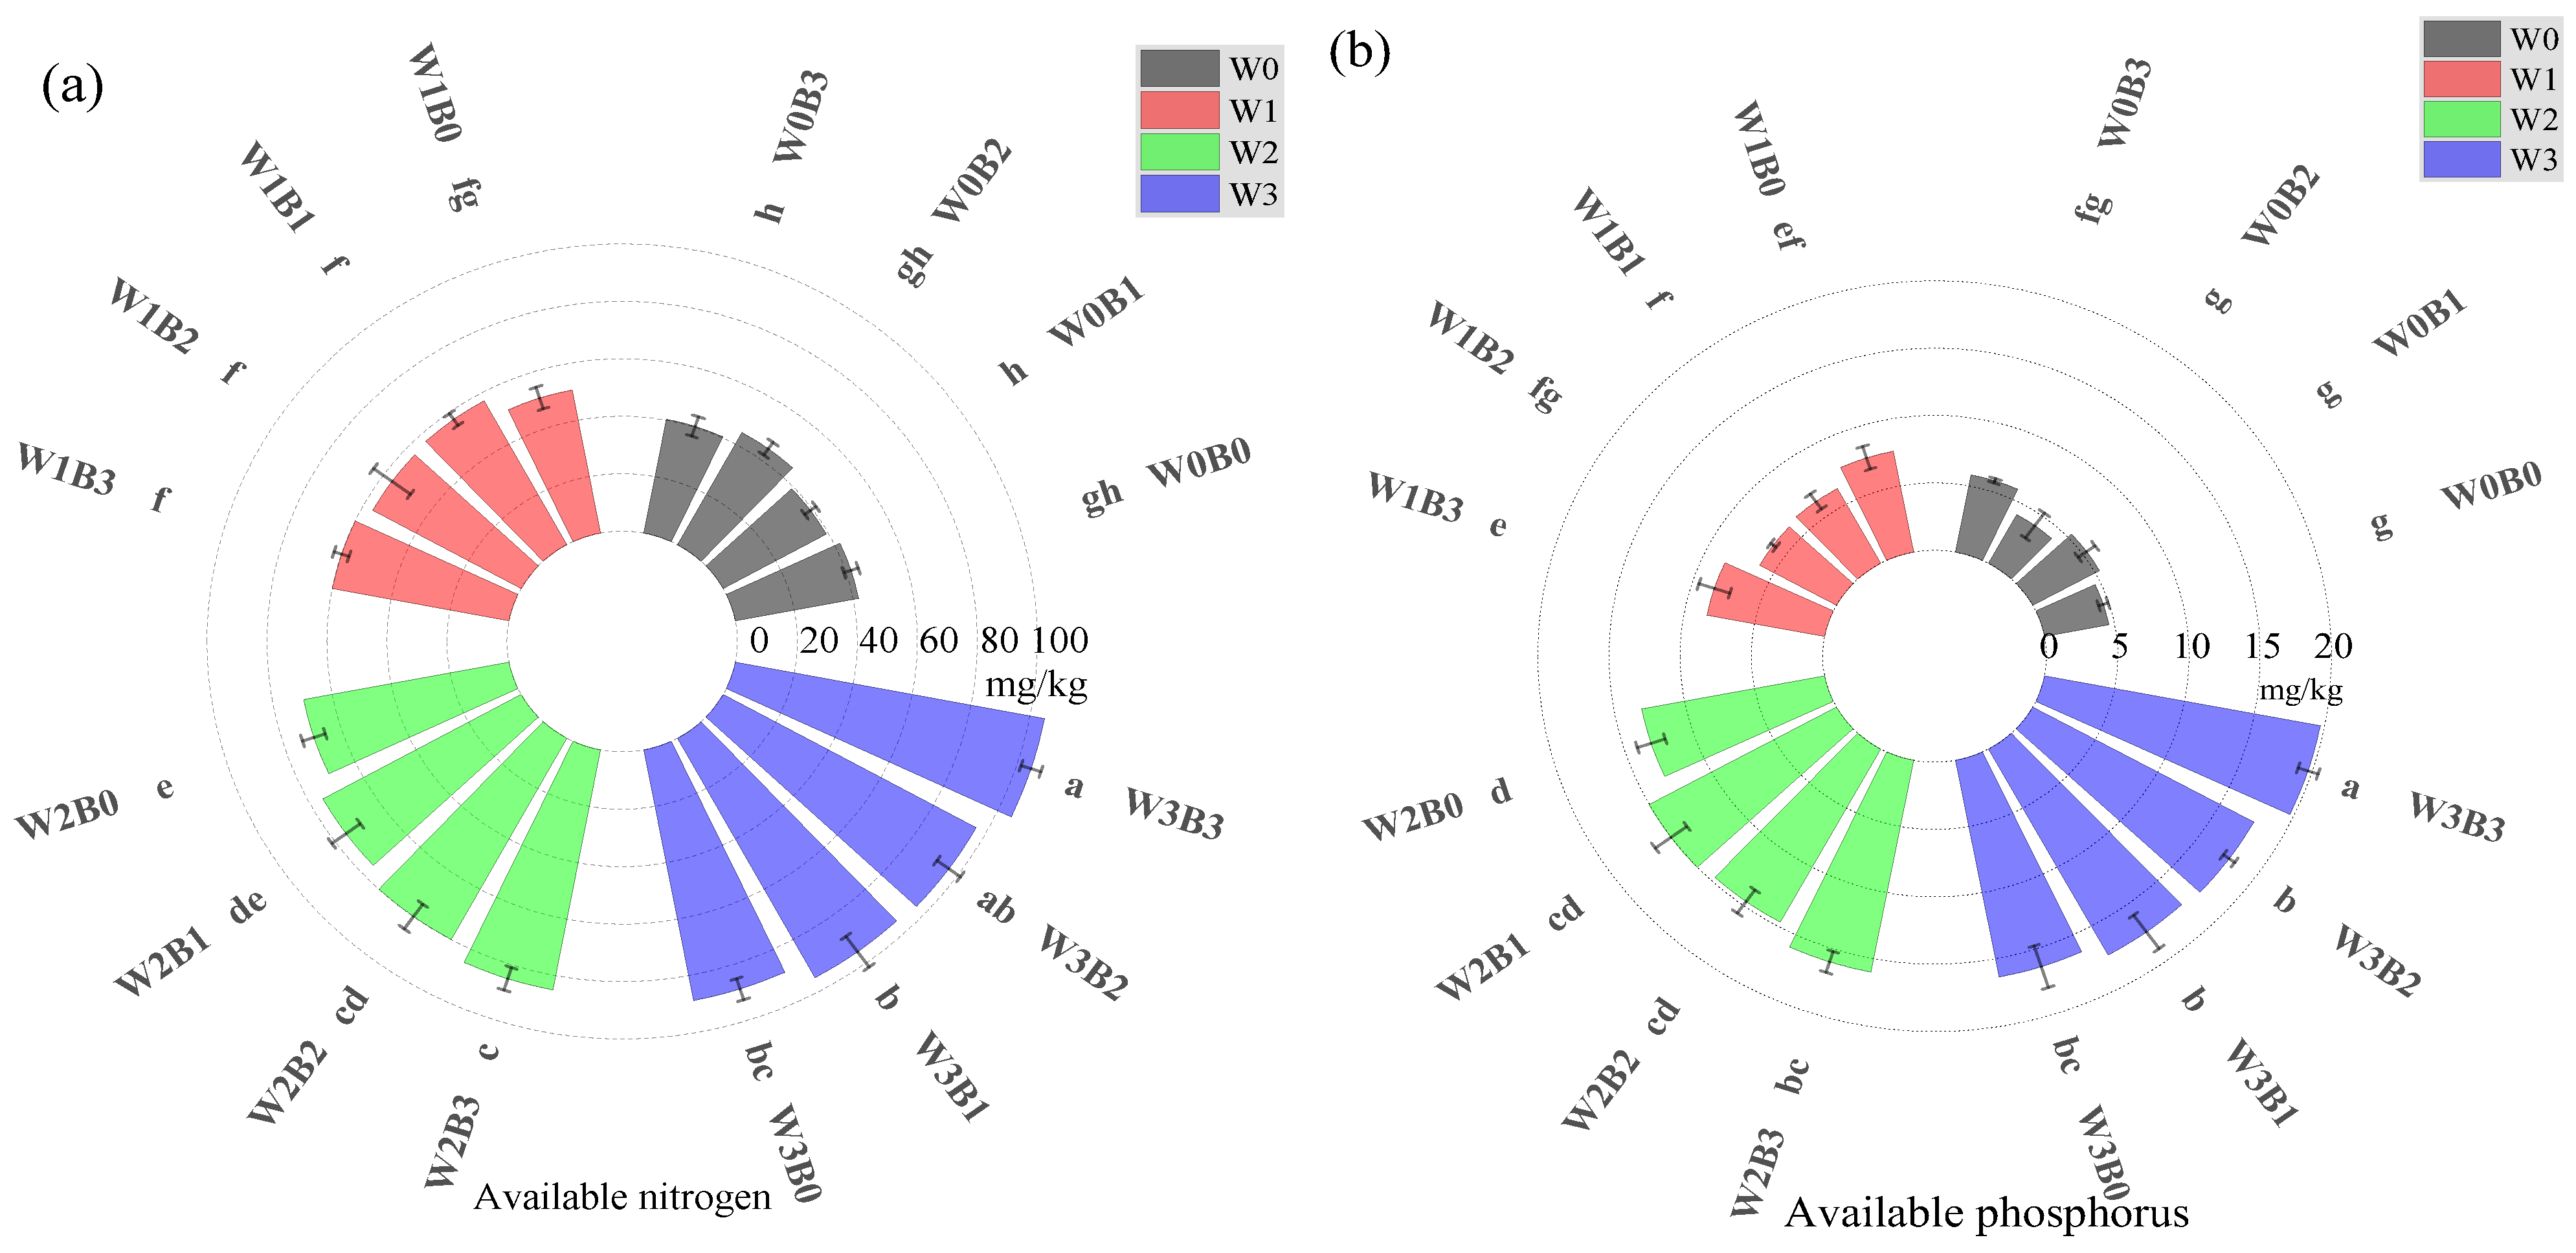
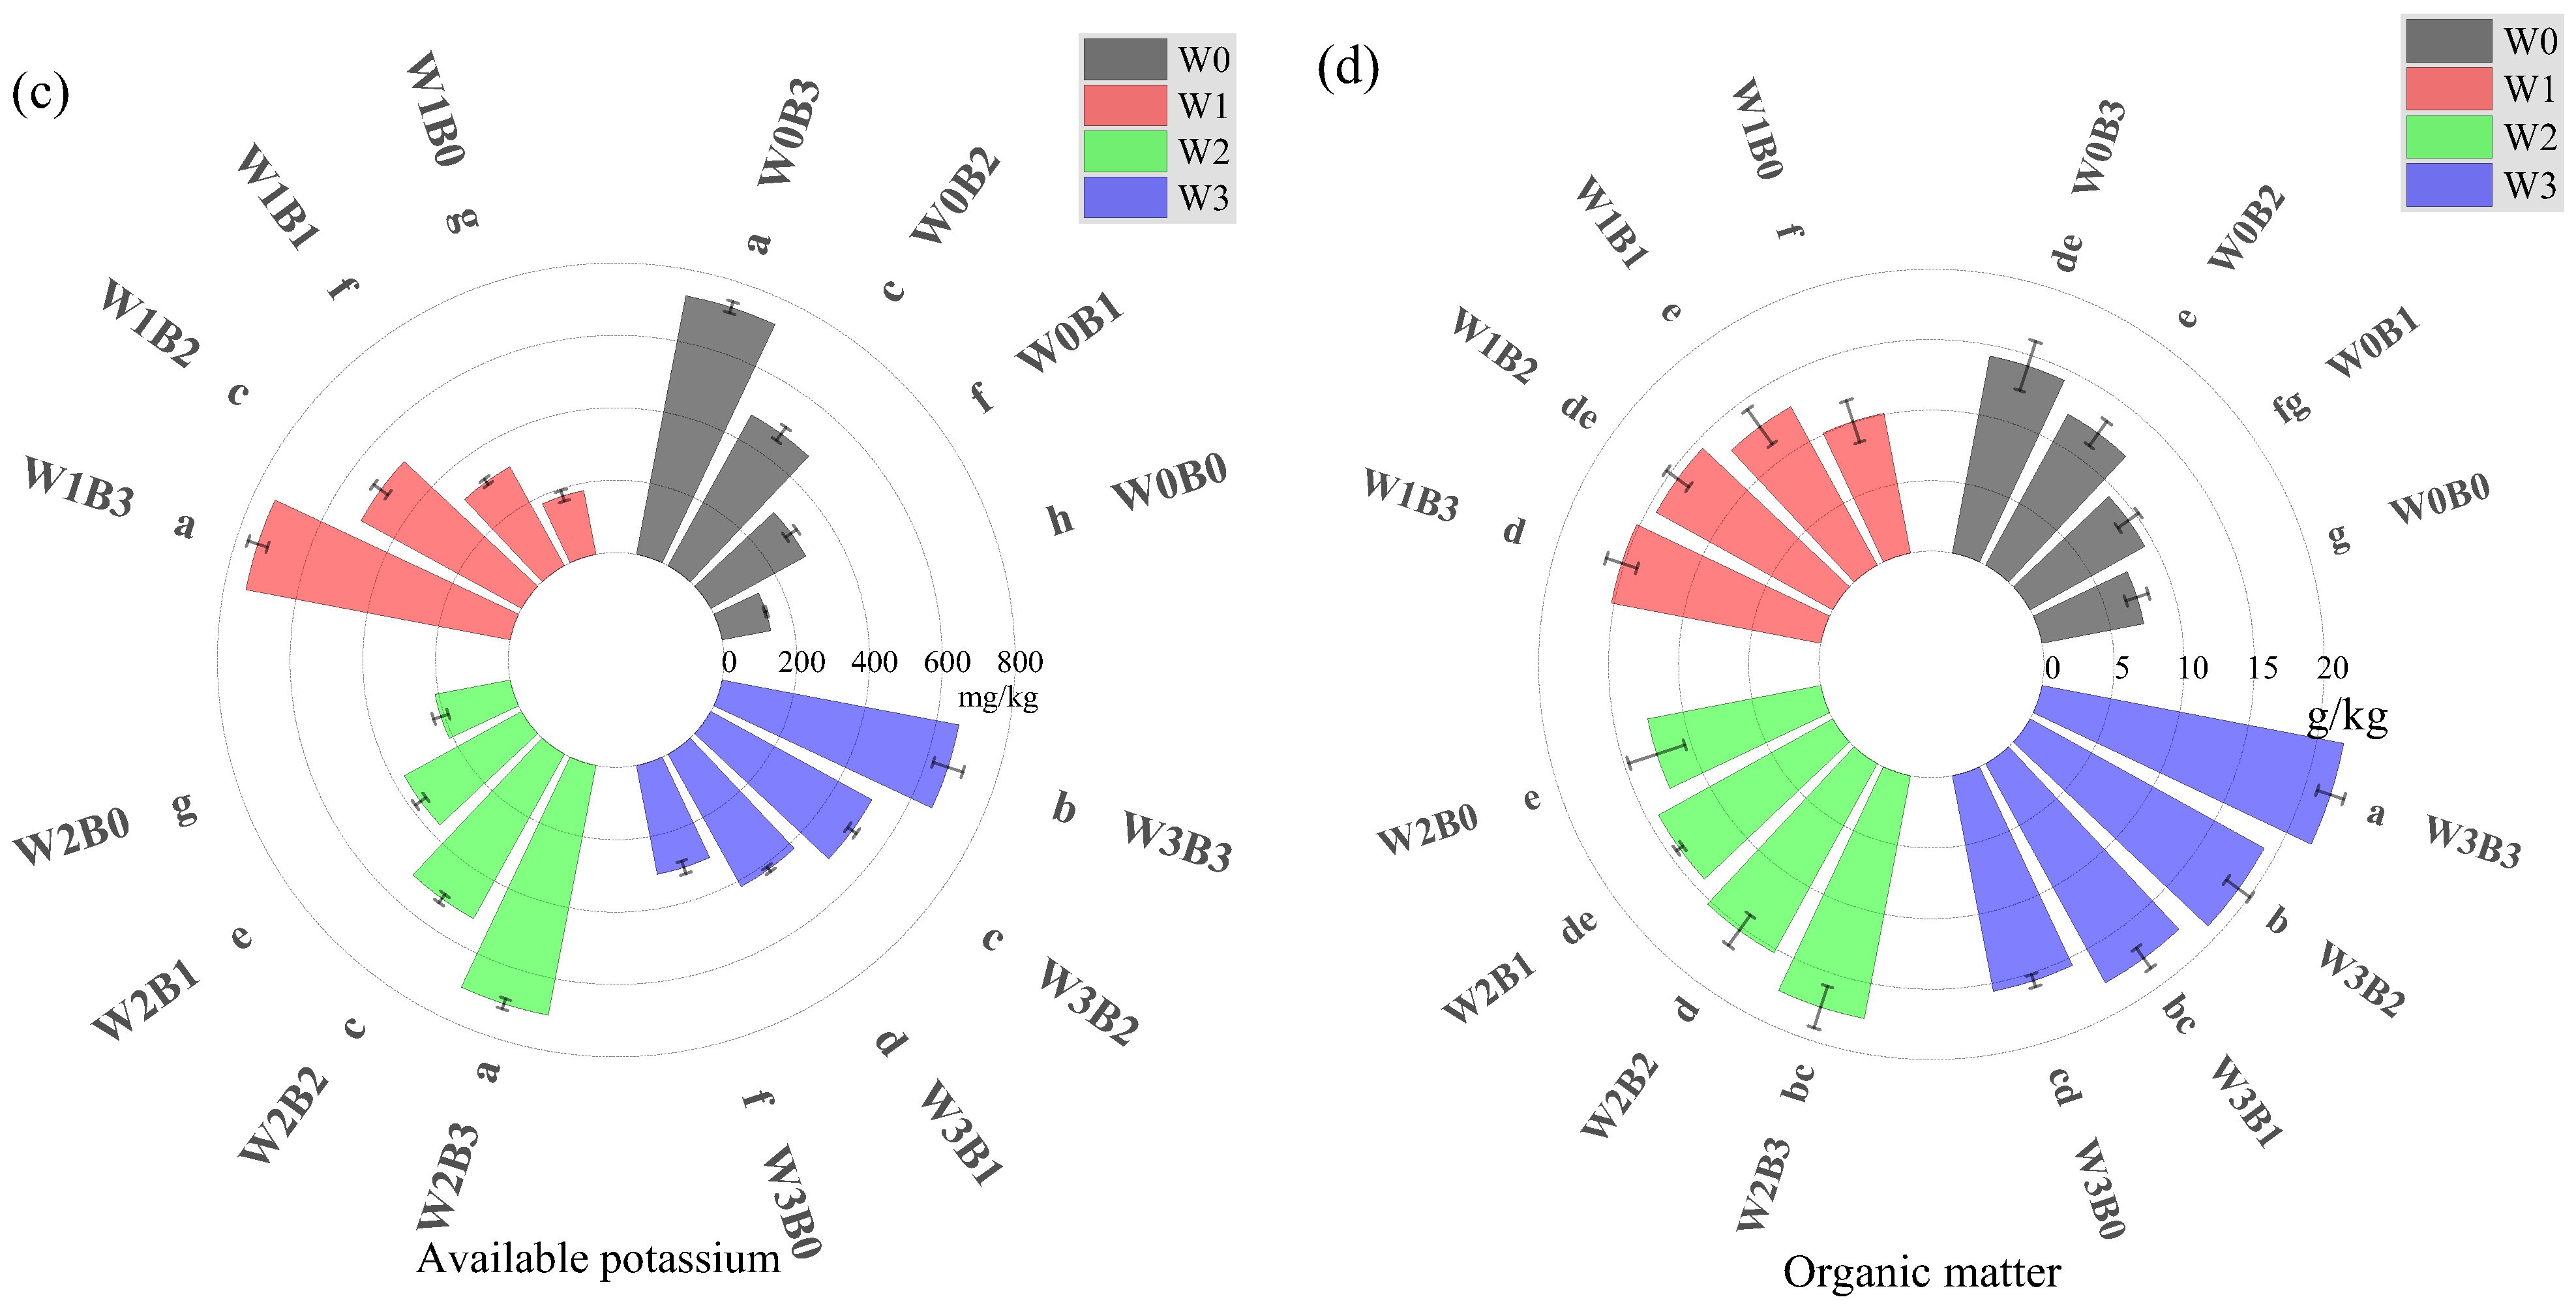
The available nitrogen content of the treatments ranged from 39.14 to 104.93 mg·kg−1 (Figure 7). At lower levels of compost application, the available nitrogen content did not differ significantly among the different levels of biochar; when the application level of compost was greater, the available nitrogen content tended to increase with increasing biochar application, and that of B3 was significantly greater than that of B0. The available nitrogen content tended to increase significantly with increasing compost application. The available phosphorus content of coastal saline soil gradually increased with increasing compost application, but the available phosphorus content tended to increase slightly with increasing biochar application. The B2W0 treatment had the lowest available phosphorus content (4.11 mg·kg−1), and the B3W3 treatment had the highest available phosphorus content (19.71 mg·kg−1). The content of available potassium in the soil gradually increased with increasing compost application, and when the application level of biochar was high, the content of available potassium in the soil tended to decrease with increasing compost application, and there was no significant difference among the treatments. The content of available potassium increased significantly with increasing biochar application, and there were significant differences among the treatments. All the treatments significantly increased the content of available potassium in coastal saline soils, with B3W1 showing the greatest increase of 604.28 mg·kg−1. The organic matter content gradually increased with increasing biochar and compost application. In comparison, compost contributed more to the increase in organic matter content. The organic matter content of all the treatments was significantly greater than that of B0W0, except that the difference between B1W0 and B0W0 was not significant. The organic matter content of all the treatments was the highest in B3W3 and the lowest in B0W0, with values of 21.92 and 7.39 g·kg−1, respectively.
The application of biochar and compost significantly increased the activities of urease, phosphatase, and dehydrogenase in the saline soils (Table 5). The activities of urease and phosphatase increased significantly with the application of biochar and compost, but the activities of dehydrogenase were inhibited when the mixed application of biochar and compost was too high, e.g., the dehydrogenase activities decreased significantly when 40 g·kg−1 of biochar and 80 g·kg−1 of compost were applied.
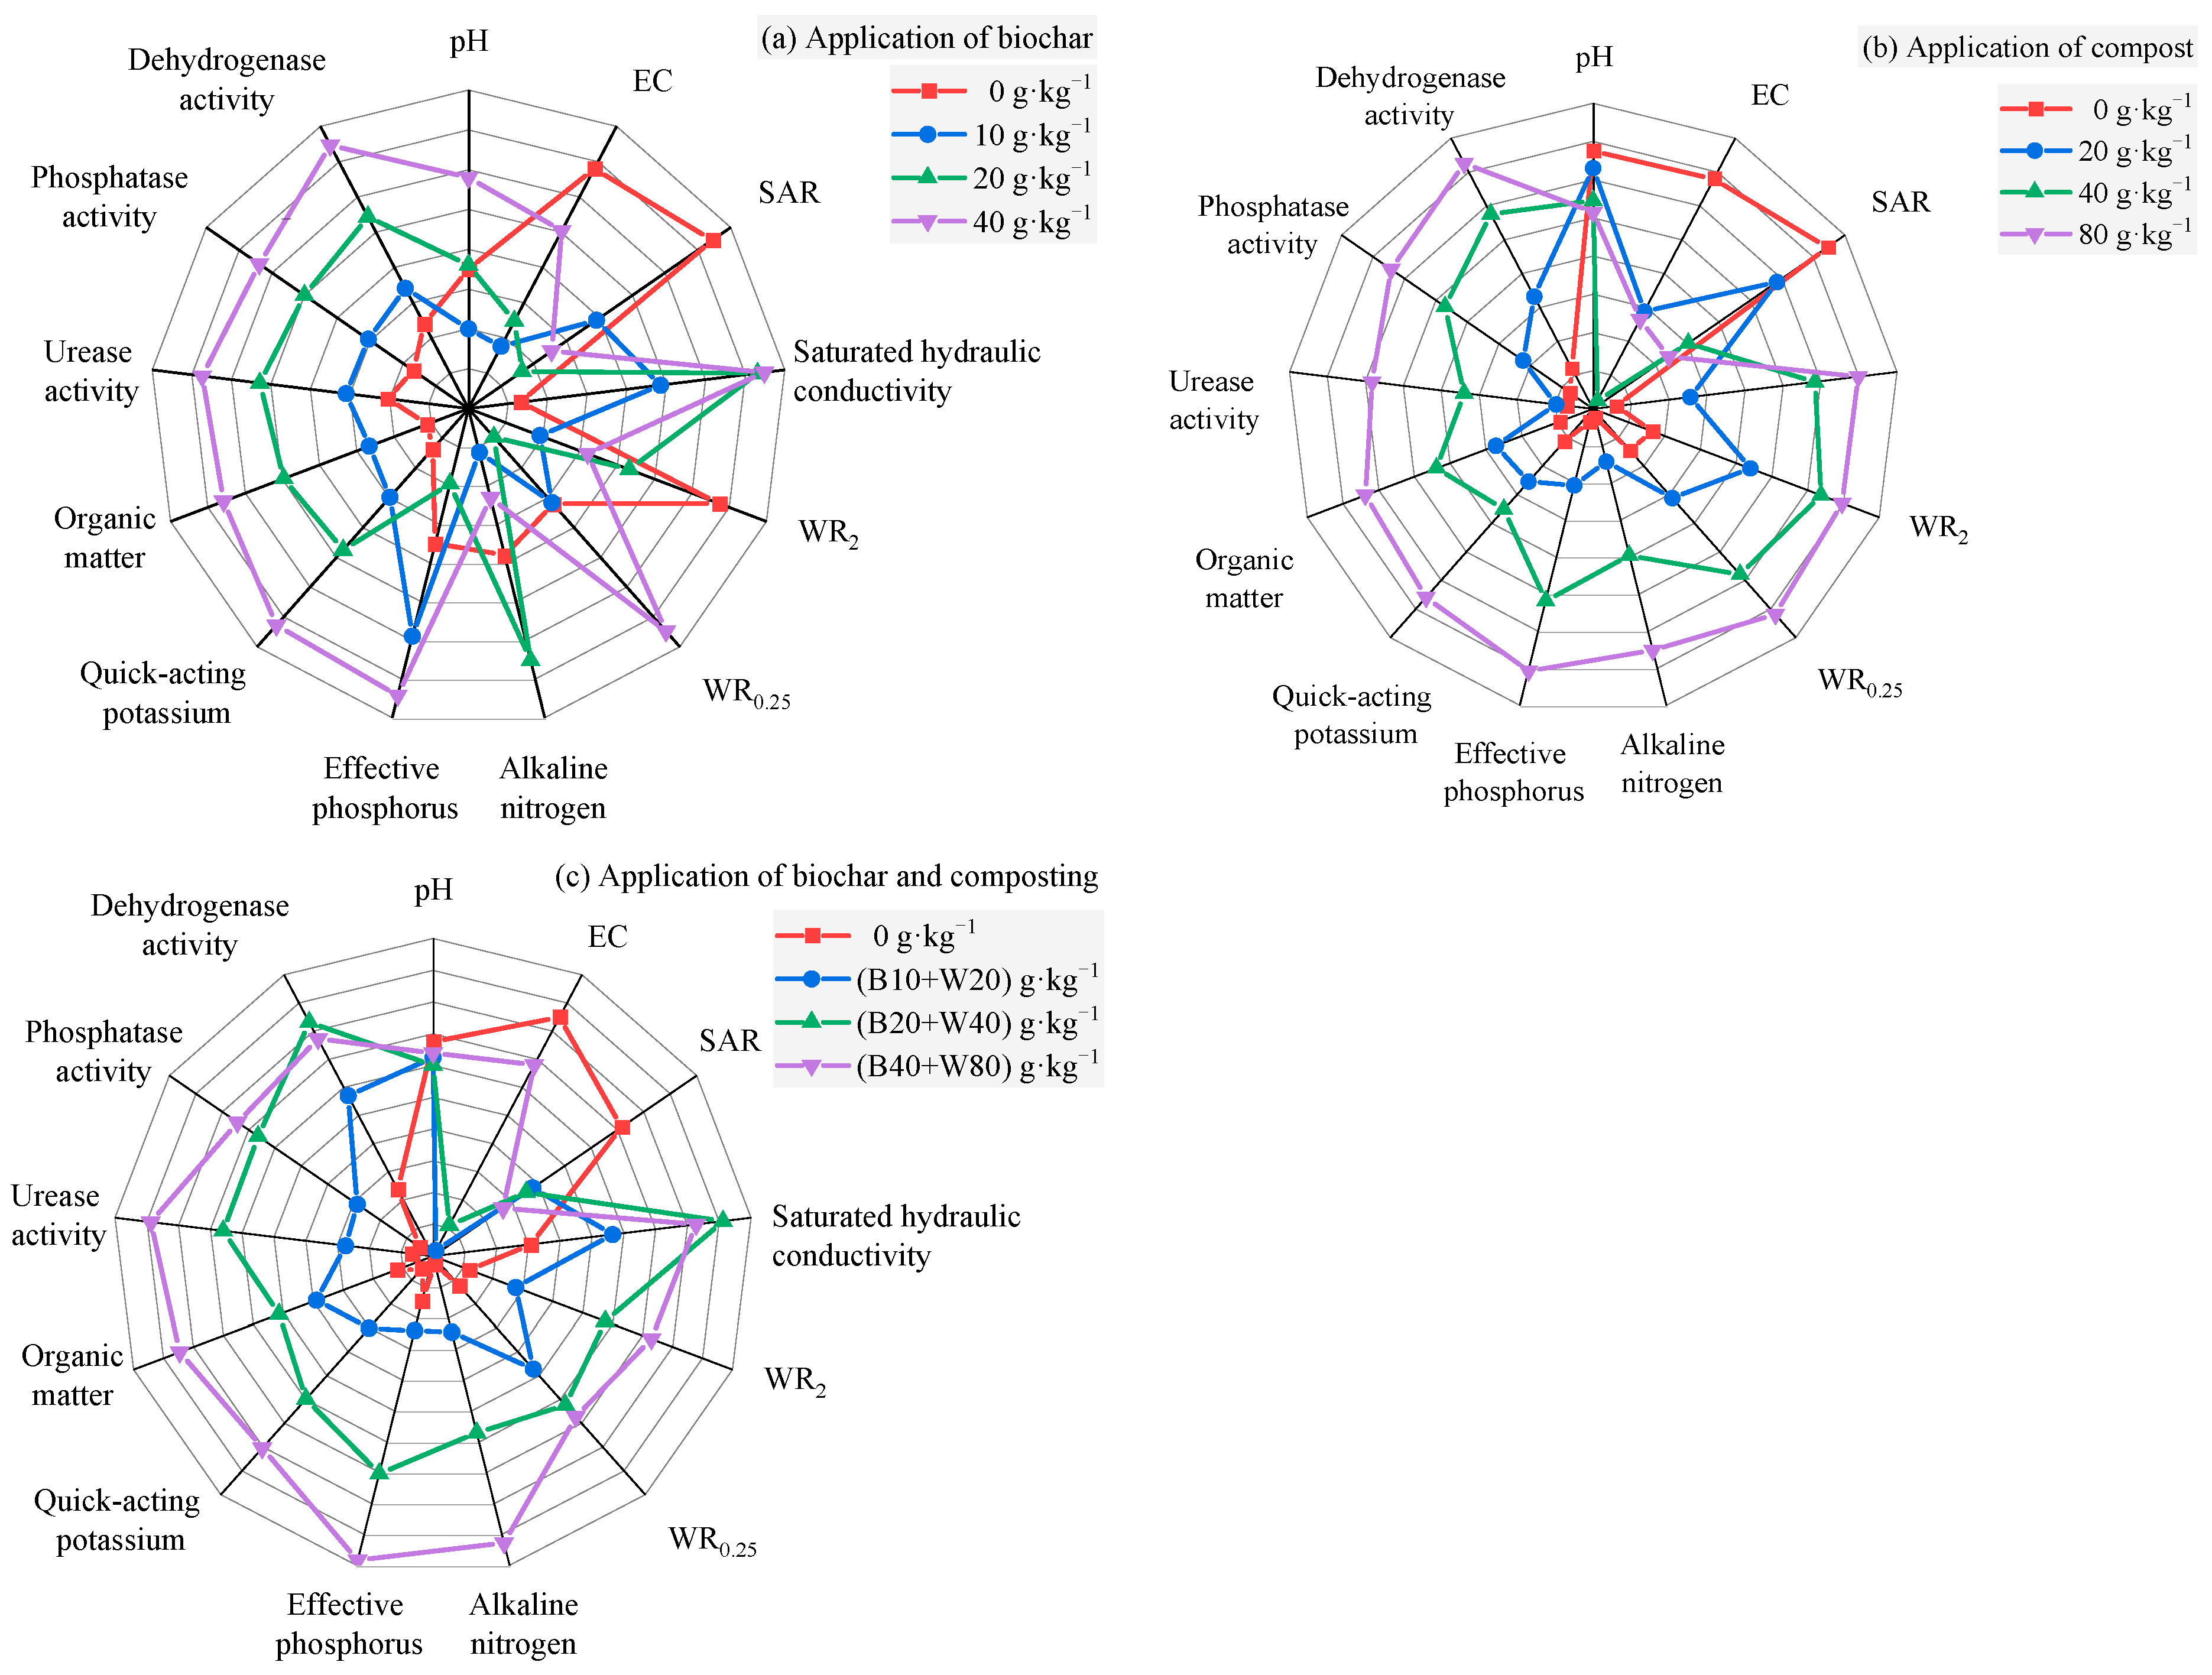
A comparative analysis of the effects of biochar and compost application on saline soils via radar charts (Figure 8) revealed that their application not only increased the nutrient content in the soil but also significantly increased the enzyme activities in the soil. In addition, it also reduced the salinity and pH of the soil. However, the application of biochar and compost should be properly controlled to avoid excessive application.

4. Discussion

The application of biochar to coastal saline soils had the unfavorable effect of increasing the pH of the initial leachate, but as the number of leachants increased, the pH of the leachate gradually decreased. This was due to the greater pH of the biochar itself (Table 1), which increased the pH of the leaching solution, whereas the reduced hydrolysis of HCO3 and increased ionization in alkaline environments decreased the pH of the leaching solution, which was supported by the increase in the HCO3 content during leaching (Figure 2). The application of biochar was not effective at reducing the pH of coastal saline soils through leaching (Table 2). Biochar is mostly alkaline, as it contains carbonates, organic anions and inorganic bases [26], such as CaCO3, MgCO3, Mg(OH)2, and MgO [27]. This is an important reason for its use as a soil amendment material to increase the soil pH. After biochar enters the soil, alkaline substances are released, and alkali cations occupy the soil exchange sites, reducing the content of soil exchangeable acid ions and thus increasing the soil pH [28,29]. After the application of compost, the pH value of the leachate of the coastal saline–alkaline soil was lower than that of the CK, and the pH value of the soil was also significantly lower after the leaching was finished. Compost contains large amounts of organic matter, the decomposition of which releases organic acids. In addition, compost has a high cation exchange capacity (CEC), which enhances the adsorption of alkaline cations (e.g., Na+, K+, Ca2+, Mg2+) by the soil and increases the relative H+ concentration in the soil solution, thereby lowering the pH of the soil [30,31]. The application of biochar and compost can significantly accelerate the rate of salt leaching from coastal saline soils. The porous structure of biochar can improve soil aeration and water-holding capacity by storing oxygen and water [32,33], and the application of biochar can significantly increase the soil water content, field water-holding capacity and capillary porosity [34,35]. This occurred because the improvement in pore conditions in coastal saline soils improved the soil structure and promoted the leaching of salts, which reduced the EC value of the soil (Figure 6). The compost contains humic acid substances that react cohesively with Ca2+ in the soil, which can promote the formation of soil aggregates, effectively improve the soil pore conditions, improve the soil structure, promote the leaching of salts, and reduce the EC value of the soil [36,37,38]. In addition, the porous structure and large specific surface area of biochar can not only improve soil aeration and water permeability, providing a favorable physical environment for the formation of soil aggregates but also adsorb and immobilize inorganic ions and organic compounds in the soil to form organic–inorganic complexes, which can further promote the formation of aggregates [39]. The SAR is an important indicator for assessing the degree of soil salinization; the greater the SAR value, the greater the relative hazard to the soil [40]. The use of biochar and compost can significantly reduce the SAR value of coastal saline soils. Biochar and compost contain Ca2+ and Mg2+, which can replace Na+ in the soil colloid so that the adsorption of Ca2+ in the soil colloid is greater than that of Na+, which reduces the SAR value of the soil [41,42,43,44], especially when the compost is rich in Ca2+ (Table 1). Numerous negative charges distributed on the surface of biochar can attract positively charged ions (e.g., Na+, etc.) from the soil through electrostatic interactions [45], and combined with the porous structure of biochar, salt ions can be adsorbed on the surface of biochar or physically retained in the remaining pore space, which reduces the salt content of the soil [41,46]. In addition, biochar promotes the leaching of Na+ from the soil and reduces the SAR [42,47,48].
Biochar significantly increased the amount of 2–5 mm and 0.25–0.5 mm aggregates in the soil, decreased the amount of microaggregates ≤0.25 mm, and significantly increased the MWD and GMD [49]. The incubation test in this study revealed that biochar application alone did not significantly affect the WR0.25, MWD or GMD. This is similar to the findings of Hou et al. [50], who reported that coastal saline soils have poor soil properties and weak microbial activity, which are not favorable for biochar degradation to produce organic matter that promotes the formation of soil aggregates. Therefore, it is difficult for biochar to have a greater impact on the formation of soil aggregates during the test period. The application of organic materials such as compost, stable manure and crop residues can increase the content of soil colloids, which can promote the formation of soil aggregates and increase the stability of the aggregate structure [51,52]. Compost application effectively increased the content of water-stable aggregates >2 mm and 0.25–2 mm, and the MWD and GMD also increased with increasing compost application, which is consistent with the findings of previous studies. Hou [50] reported that the addition of biochar with organic fertilizer was beneficial for the formation of large aggregates and improved their stability. On the basis of compost application, biochar combined with compost improved the soil MWD, GMD, and WR0.25, but the effects were limited. The application of compost alone or biochar with compost can effectively improve the stability of aggregates in coastal saline soils.
Biochar and compost are rich in nitrogen, phosphorus, potassium, and other nutrients, which can directly provide available nutrients to the soil through microbial decomposition and transformation after application to the soil. In addition, biochar can reduce the soil pH and conductivity, reduce the fixation of phosphorus by Ca2+, and increase the soluble phosphorus content [53,54,55]. Moreover, compost decomposition results in the production of organic acids and other substances, nutrient immobilization, and improved nutrient effectiveness [56]. Biochar also promotes bacterial abundance and phosphatase activity, mineralizes organic phosphorus, and increases the soil available phosphorus content. Compost addition can increase urease activity and promote the conversion of organic nitrogen into available nitrogen, such as ammonium nitrogen, thus increasing the soil available nutrient content [55,57]. In addition, the application of biochar directly increased the organic carbon content of the soil [53]. Compost contains a large amount of organic matter, which accumulates in the soil after application to saline soils, increasing the soil organic matter content [54]. The surface of biochar can catalyze the synthesis of humic acid and promote humus formation, which is conducive to the accumulation of organic matter in the soil [58]. Biochar and compost, on the other hand, can promote microbial activities by improving the structure of soil microbial communities so that microbial decomposition of organic matter produces more intermediates and humus, which in turn increases the soil organic matter content [59]. The organic matter in compost can be used as an enzyme reaction substrate to activate the activities of various enzymes, such as alkaline phosphatase, catalase and urease, in soil [59,60]. Biochar has a porous structure that provides protection for enzymes, reduces the contact between enzymes and harmful substances in the soil, and maintains the active configuration of enzymes. Compost can improve the soil structure and physical and chemical properties, reduce the soil pH and salinity, and create a more suitable environment for enzymes to survive, thus increasing enzyme activity. In addition, compost itself contains many active enzymes, and its application to the soil helps increase the activity of soil enzymes [61]. In summary, although biochar and compost have better effects on improving saline soils, biochar is not effective at reducing the soil pH, so higher pH soils are less suitable for biochar. The application of compost effectively increased the nutrient content of the soil, but the application rate of more than 40 g·kg−1 increased the soil salinity.

5. Conclusions

The application of biochar enhances soil aeration and water conductivity, facilitating the leaching of salts and reducing the soil EC value. The Ca2+ and Mg2+ contained in biochar can exchange with Na+ adsorbed on soil colloids, promoting the formation of soil aggregates. Moreover, compost improves soil pore conditions, facilitating salt leaching, and its abundant Ca2+ and Mg2+ can lower the soil SAR. The use of these two amendments has a complementary effect on reducing the pH value of coastal saline–alkali soils. Compost can mitigate the pH increase caused by biochar, and the soil pH decreases with increasing compost application rates. When 10 g·kg−1 of biochar and 40 g·kg−1 of compost are applied, the soil electrical conductivity reaches its minimum value, whereas the SAR tends to decrease with increasing application rates. Additionally, the activities of soil urease, phosphatase, and dehydrogenase are significantly increased.

Supplementary Materials

The following supporting information can be downloaded at https://www.mdpi.com/article/10.3390/agronomy15092093/s1: Table S1: Basic properties of test materials; Table S2: Treatment design for soil incubation tests; Figure S1: sketch map of leaching experiment; Figure S2: SEM picture of the compost used in the research; Figure S3: SEM picture of the biochar used in the research.

Author Contributions

Conceptualization, W.Z.; data curation, W.Z., S.X., S.L. and X.S.; formal analysis, Y.W. and H.Z.; funding acquisition, R.Z.: investigation, S.X.; methodology, W.Z., R.Z., S.L., Y.W. and X.S.; project administration, R.Z. and Y.W.; resources, R.Z., S.L., X.S. and H.Z.; software, W.Z.; supervision, Y.W. and X.S.; validation, S.X.; writing—original draft, W.Z.; writing—review and editing, R.Z. All authors have read and agreed to the published version of the manuscript.

Funding

This study was funded by the Fundamental Research Funds of CAF (project No. CAFYBB2021MB005) and the Shandong Provincial Key R&D Program [2023CXPT026].

Data Availability Statement

The raw data supporting the conclusions of this article will be made available by the authors on request.

Conflicts of Interest

Author Wenzhi Zhou was employed by the company Tianjin LVYIN Landscape & Ecology Construction Co., Ltd. The remaining authors declare that the research was conducted in the absence of any commercial or financial relationships that could be construed as a potential conflict of interest.

References

  1. Sun, J.; Kang, Y.; Wan, S.; Hu, W.; Jiang, S.; Zhang, T. Soil salinity management with drip irrigation and its effects on soil hydraulic properties in north China coastal saline soils. Agric. Water Manag. 2012, 115, 10–19. [Google Scholar] [CrossRef]
  2. Shrivastava, P.; Kumar, R. Soil salinity: A serious environmental issue and plant growth promoting bacteria as one of the tools for its alleviation. Saudi J. Biol. Sci. 2014, 22, 123–131. [Google Scholar] [CrossRef]
  3. Ivushkin, K.; Bartholomeus, H.; Bregt, A.K.; Pulatov, A.; Kempen, B.; de Sousa, L. Global mapping of soil salinity change. Remote Sens. Environ. 2019, 231, 111260. [Google Scholar] [CrossRef]
  4. Xie, X.; Pu, L.; Wang, Q.; Zhu, M.; Xu, Y.; Zhang, M. Response of soil physicochemical properties and enzyme activities to long-term reclamation of coastal saline soil, Eastern China. Sci. Total Environ. 2017, 607–608, 1419–1427. [Google Scholar] [CrossRef] [PubMed]
  5. Zimmerman, A.R. Abiotic and Microbial Oxidation of Laboratory-Produced Black Carbon (Biochar). Environ. Sci. Technol. 2010, 44, 1295–1301. [Google Scholar] [CrossRef] [PubMed]
  6. Qayyum, M.F.; Ashraf, I.; Abid, M.; Steffens, D. Effect of biochar, lime, and compost application on phosphorus adsorption in a Ferralsol. J. Plant Nutr. Soil Sci. 2015, 178, 576–581. [Google Scholar] [CrossRef]
  7. Wang, Z.; Zong, H.; Zheng, H.; Liu, G.; Chen, L.; Xing, B. Reduced nitrification and abundance of ammonia-oxidizing bacteria in acidic soil amended with biochar. Chemosphere 2015, 138, 576–583. [Google Scholar] [CrossRef]
  8. Fernández-Ugalde, O.; Gartzia-Bengoetxea, N.; Arostegi, J.; Moragues, L.; Arias-González, A. Storage and stability of biochar-derived carbon and total organic carbon in relation to minerals in an acid forest soil of the Spanish Atlantic area. Sci. Total Environ. 2017, 587–588, 204–213. [Google Scholar] [CrossRef]
  9. Chaganti, V.N.; Crohn, D.M. Evaluating the relative contribution of physiochemical and biological factors in ameliorating a saline–sodic soil amended with composts and biochar and leached with reclaimed water. Geoderma 2015, 259–260, 45–55. [Google Scholar] [CrossRef]
  10. Hailegnaw, N.S.; Mercl, F.; Pračke, K.; Száková, J.; Tlustoš, P. Mutual relationships of biochar and soil pH, CEC, and exchangeable base cations in a model laboratory experiment. J. Soils Sediments 2019, 19, 2405–2416. [Google Scholar] [CrossRef]
  11. Wang, G.; Xu, Z. The effects of biochar on germination and growth of wheat in different saline-alkali soil. Asian Agric. Res. 2013, 5, 116–119. [Google Scholar] [CrossRef]
  12. Wang, X.; Ding, J.; Han, L.; Tan, J.; Ge, X.; Nan, Q. Biochar addition reduces salinity in salt-affected soils with no impact on soil pH: A meta-analysis. Geoderma 2024, 443, 116845. [Google Scholar] [CrossRef]
  13. Amini, S.; Ghadiri, H.; Chen, C.; Marschner, P. Salt-affected soils, reclamation, carbon dynamics, and biochar: A review. J. Soils Sediments 2016, 16, 939–953. [Google Scholar] [CrossRef]
  14. Dong, X.; Guan, T.; Li, G.; Lin, Q.; Zhao, X. Long-term effects of biochar amount on the content and composition of organic matter in soil aggregates under field conditions. J. Soils Sediments 2016, 16, 1481–1497. [Google Scholar] [CrossRef]
  15. Duan, M.; Liu, G.; Zhou, B.; Chen, X.; Wang, Q.; Zhu, H.; Li, Z. Effects of modified biochar on water and salt distribution and water-stable macro-aggregates in saline-alkaline soil. J. Soils Sediments 2021, 21, 2192–2202. [Google Scholar] [CrossRef]
  16. Liang, J.; Li, Y.; Si, B.; Wang, Y.; Chen, X.; Wang, X.; Chen, H.; Wang, H.; Zhang, F.; Bai, Y.; et al. Optimizing biochar application to improve soil physical and hydraulic properties in saline-alkali soils. Sci. Total Environ. 2021, 771, 144802. [Google Scholar] [CrossRef]
  17. Xiao, Q.; Zhu, L.-X.; Shen, Y.-F.; Li, S.-Q. Sensitivity of soil water retention and availability to biochar addition in rainfed semi-arid farmland during a three-year field experiment. Field Crops Res. 2016, 196, 284–293. [Google Scholar] [CrossRef]
  18. Xu, J.; Niu, W.Q.; Zhang, M.Z.; Li, Y.; Lyu, W.; Li, K.Y.; Zou, X.; Liang, B.H. Effect of biochar addition on soil evaporation. J. Appl. Ecol. 2016, 27, 3505–3513. [Google Scholar] [CrossRef]
  19. Zheng, H.; Wang, X.; Chen, L.; Wang, Z.; Xia, Y.; Zhang, Y.; Wang, H.; Luo, X.; Xing, B. Enhanced growth of halophyte plants in biochar-amended coastal soil: Roles of nutrient availability and rhizosphere microbial modulation. Plant Cell Environ. 2017, 41, 517–532. [Google Scholar] [CrossRef] [PubMed]
  20. Wang, D.; Li, S.; Sun, X.; Hao, D.; Li, Y.; Wang, H. Effects of Compost Application of Green Waste on Soil Properties: A Meta-Analysis. Sustainability 2024, 16, 8877. [Google Scholar] [CrossRef]
  21. Zhang, L.; Sun, X.; Tian, Y.; Gong, X. Effects of brown sugar and calcium superphosphate on the secondary fermentation of green waste. Bioresour. Technol. 2013, 131, 68–75. [Google Scholar] [CrossRef]
  22. Zhang, L.; Xu, P.P.; Li, S.Y.; Sun, X.Y.; Zhang, T.; Liu, Z.H.; Yao, L.Y. Amelioration effects of organic-inorganic compound amendment on coastal saline-alkali soil. Sci. Soil Water Conserv. 2017, 15, 92–99. [Google Scholar]
  23. Yue, Y.; Guo, W.N.; Lin, Q.; Li, G.; Zhao, X.; Wu, G. Salt leaching in the saline soil relative to rate of biochar applied. Acta Pedol. Sin. 2014, 51, 914–919. (In Chinese) [Google Scholar]
  24. Bao, S. Soil and Agricultural Chemistry Analysis; China Agriculture Press: Beijing, China, 2000. [Google Scholar]
  25. Yang, P.; Luo, Y.; Shi, Y. Soil fractal characteristics characterized by weight distribution of particle size. Sci. Bull. 1993, 38, 1896–1899. [Google Scholar]
  26. Qian, L.; Chen, B. Dual Role of Biochars as Adsorbents for Aluminum: The Effects of Oxygen-Containing Organic Components and the Scattering of Silicate Particles. Environ. Sci. Technol. 2013, 47, 8759–8768. [Google Scholar] [CrossRef]
  27. Bolan, N.; Sarmah, A.K.; Bordoloi, S.; Bolan, S.; Padhye, L.P.; Van Zwieten, L.; Sooriyakumar, P.; Khan, B.A.; Ahmad, M.; Solaiman, Z.M.; et al. Soil acidification and the liming potential of biochar. Environ. Pollut. 2023, 317, 120632. [Google Scholar] [CrossRef]
  28. Xu, R.-K.; Zhao, A.-Z.; Yuan, J.-H.; Jiang, J. pH buffering capacity of acid soils from tropical and subtropical regions of China as influenced by incorporation of crop straw biochars. J. Soils Sediments 2012, 12, 494–502. [Google Scholar] [CrossRef]
  29. Yuan, J.-H.; Xu, R.-K.; Wang, N.; Li, J.-Y. Amendment of acid soils with crop residues and biochars. Pedosphere 2011, 21, 302–308. [Google Scholar] [CrossRef]
  30. Li, R.; Wang, Q.; Zhang, Z.; Zhang, G.; Li, Z.; Wang, L.; Zheng, J. Nutrient transformation during aerobic composting of pig manure with biochar prepared at different temperatures. Environ. Technol. 2014, 36, 815–826. [Google Scholar] [CrossRef]
  31. Wang, Q.; Li, R.; Cai, H.; Awasthi, M.K.; Zhang, Z.; Wang, J.J.; Ali, A.; Amanullah, M. Improving pig manure composting efficiency employing Ca-bentonite. Ecol. Eng. 2016, 87, 157–161. [Google Scholar] [CrossRef]
  32. Lashari, M.S.; Liu, Y.; Li, L.; Pan, W.; Fu, J.; Pan, G.; Zheng, J.; Zheng, J.; Zhang, X.; Yu, X. Effects of amendment of biochar-manure compost in conjunction with pyroligneous solution on soil quality and wheat yield of a salt-stressed cropland from Central China Great Plain. Field Crops Res. 2013, 144, 113–118. [Google Scholar] [CrossRef]
  33. Esmaeelnejad, L.; Shorafa, M.; Gorji, M.; Hosseini, S.M. Impacts of Woody Biochar Particle Size on Porosity and Hydraulic Conductivity of Biochar-Soil Mixtures: An Incubation Study. Commun. Soil Sci. Plant Anal. 2017, 48, 1710–1718. [Google Scholar] [CrossRef]
  34. Gaskin, J.W.; Steiner, C.; Harris, K.; Das, K.C.; Bibens, B. Effect of Low-Temperature Pyrolysis Conditions on Biochar for Agricultural Use. Trans. ASABE 2008, 51, 2061–2069. [Google Scholar] [CrossRef]
  35. Marshall, J.; Muhlack, R.; Morton, B.J.; Dunnigan, L.; Chittleborough, D.; Kwong, C.W. Pyrolysis Temperature Effects on Biochar–Water Interactions and Application for Improved Water Holding Capacity in Vineyard Soils. Soil Syst. 2019, 3, 27. [Google Scholar] [CrossRef]
  36. Xie, H.; Li, J.; Zhang, B.; Wang, L.; Wang, J.; He, H.; Zhang, X. Long-term manure amendments reduced soil aggregate stability via redistribution of the glomalin-related soil protein in macroaggregates. Sci. Rep. 2015, 5, 14687. [Google Scholar] [CrossRef] [PubMed]
  37. Veum, K.S.; Goyne, K.W.; Kremer, R.; Motavalli, P.P. Relationships Among Water Stable Aggregates and Organic Matter Fractions Under Conservation Management. Soil Sci. Soc. Am. J. 2012, 76, 2143–2153. [Google Scholar] [CrossRef]
  38. Zou, C.; Li, Y.; Huang, W.; Zhao, G.; Pu, G.; Su, J.; Coyne, M.S.; Chen, Y.; Wang, L.; Hu, X.; et al. Rotation and manure amendment increase soil macro-aggregates and associated carbon and nitrogen stocks in flue-cured tobacco production. Geoderma 2018, 325, 49–58. [Google Scholar] [CrossRef]
  39. Howell, C.R.; Jenkins, S.N.; Abbott, L.K.; Mickan, B.S. Amelioration of a saline-alkaline soil using biochar and compost: Impacts on plant growth, soil biological and chemical characteristics. Land Degrad. Dev. 2024, 35, 142–155. [Google Scholar] [CrossRef]
  40. Murtaza, G.; Murtaza, B.; Kahlon, U.Z.; Yaseen, M. A Comparative Study of Different Amendments on Amelioration of Saline-Sodic Soils Irrigated with Water Having Different EC: SAR Ratios. Commun. Soil Sci. Plant Anal. 2017, 48, 2630–2641. [Google Scholar] [CrossRef]
  41. Zheng, H.; Wang, X.; Luo, X.; Wang, Z.; Xing, B. Biochar-induced negative carbon mineralization priming effects in a coastal wetland soil: Roles of soil aggregation and microbial modulation. Sci. Total Environ. 2018, 610–611, 951–960. [Google Scholar] [CrossRef]
  42. Lashari, M.S.; Ye, Y.; Ji, H.; Li, L.; Kibue, G.W.; Lu, H.; Zheng, J.; Pan, G. Biochar-manure compost in conjunction with pyroligneous solution alleviated salt stress and improved leaf bioactivity of maize in a saline soil from central China: A 2-year field experiment. J. Sci. Food Agric. 2014, 95, 1321–1327. [Google Scholar] [CrossRef] [PubMed]
  43. Kim, H.-S.; Kim, K.-R.; Yang, J.E.; Ok, Y.S.; Owens, G.; Nehls, T.; Wessolek, G.; Kim, K.-H. Effect of biochar on reclaimed tidal land soil properties and maize (Zea mays L.) response. Chemosphere 2016, 142, 153–159. [Google Scholar] [CrossRef] [PubMed]
  44. Drake, J.A.; Cavagnaro, T.R.; Cunningham, S.C.; Jackson, W.R.; Patti, A.F. Does Biochar Improve Establishment of Tree Seedlings in Saline Sodic Soils? Land. Degrad. Dev. 2015, 27, 52–59. [Google Scholar] [CrossRef]
  45. Zheng, W.; Guo, M.; Chow, T.; Bennett, D.N.; Rajagopalan, N. Sorption properties of greenwaste biochar for two triazine pesticides. J. Hazard. Mater. 2010, 181, 121–126. [Google Scholar] [CrossRef]
  46. Yuan, Y.; Chen, H.; Yuan, W.; Williams, D.; Walker, J.T.; Shi, W. Is biochar-manure co-compost a better solution for soil health improvement and N2O emissions mitigation? Soil Biol. Biochem. 2017, 113, 14–25. [Google Scholar] [CrossRef]
  47. Chaganti, V.N.; Crohn, D.M.; Šimůnek, J. Leaching and reclamation of a biochar and compost amended saline–sodic soil with moderate SAR reclaimed water. Agric. Water Manag. 2015, 158, 255–265. [Google Scholar] [CrossRef]
  48. Wu, Y.; Xu, G.; Shao, H.B. Furfural and its biochar improve the general properties of a saline soil. Solid Earth 2014, 5, 665–671. [Google Scholar] [CrossRef]
  49. Lu, S.-G.; Sun, F.-F.; Zong, Y.-T. Effect of rice husk biochar and coal fly ash on some physical properties of expansive clayey soil (Vertisol). CATENA 2014, 114, 37–44. [Google Scholar] [CrossRef]
  50. Hou, X.; Li, H.; Zhu, L.; Han, Y.; Tang, Z.; Li, Z.; Tan, J.; Zhang, S. Effects of biochar and straw addition on agglomerate composition and organic carbon distri-bution in sandy ginger black soil. China Agric. Sci. 2015, 705–712. (In Chinese) [Google Scholar]
  51. Aggelides, S.M.; Londra, P.A. Effects of compost produced from town wastes and sewage sludge on the physical properties of a loamy and a clay soil. Bioresour. Technol. 2000, 71, 253–259. [Google Scholar] [CrossRef]
  52. Piccolo, A.; Pietramellara, G.; Mbagwu, J. Effects of coal derived humic substances on water retention and structural stability of Mediterranean soils. Soil Use Manag. 1996, 12, 209–213. [Google Scholar] [CrossRef]
  53. Jabborova, D.; Abdrakhmanov, T.; Jabbarov, Z.; Abdullaev, S.; Azimov, A.; Mohamed, I.; AlHarbi, M.; Abu-Elsaoud, A.; Elkelish, A. Biochar improves the growth and physiological traits of alfalfa, amaranth and maize grown under salt stress. PeerJ 2023, 11, e15684. [Google Scholar] [CrossRef]
  54. Dotaniya, M.L.; Choudhary, R.L.; Meena, M.K.; Meena, V.D.; Singh, H.; Lakaria, B.L.; Jat, R.S.; Rai, P.K.; Kumar, K.; Doutaniya, R.K.; et al. Dynamics of major plant nutrients and enzymatic activities in soil influenced by application of biochar and organic waste. PLoS ONE 2024, 19, e0307487. [Google Scholar] [CrossRef]
  55. Chang, L.; Ju, T.; Liang, K.; Li, Y. Biochar-influenced solubilization and mineralization mechanisms of phosphorus in sa-line-sodic soils. Soil Biol. Biochem. 2025, 109890. [Google Scholar] [CrossRef]
  56. Michael, P.S. Role of organic fertilizers in the management of nutrient deficiency, acidity, and toxicity in acid soils—A review. J. Glob. Agric. Ecol. 2021, 12, 19–30. [Google Scholar]
  57. Zhou, C.; Heal, K.; Tigabu, M.; Xia, L.; Hu, H.; Yin, D.; Ma, X. Biochar addition to forest plantation soil enhances phosphorus availability and soil bacterial community diversity. For. Ecol. Manag. 2020, 455, 117635. [Google Scholar] [CrossRef]
  58. Liu, Q.; He, X.; Wang, K.; Li, D. Biochar drives humus formation during composting by regulating the specialized metabolic features of microbiome. Chem. Eng. J. 2023, 458, 141380. [Google Scholar] [CrossRef]
  59. Aguilar-Paredes, A.; Valdés, G.; Araneda, N.; Valdebenito, E.; Hansen, F.; Nuti, M. Microbial Community in the Composting Process and Its Positive Impact on the Soil Biota in Sustainable Agriculture. Agronomy 2023, 13, 542. [Google Scholar] [CrossRef]
  60. Zhang, L.; Jing, Y.; Xiang, Y.; Zhang, R.; Lu, H. Responses of soil microbial community structure changes and activities to biochar addition: A meta-analysis. Sci. Total Environ. 2018, 643, 926–935. [Google Scholar] [CrossRef] [PubMed]
  61. Qian, S.; Zhou, X.; Fu, Y.; Song, B.; Yan, H.; Chen, Z.; Sun, Q.; Ye, H.; Qin, L.; Lai, C. Biochar-compost as a new option for soil improvement: Application in various problem soils. Sci. Total Environ. 2023, 870, 162024. [Google Scholar] [CrossRef]
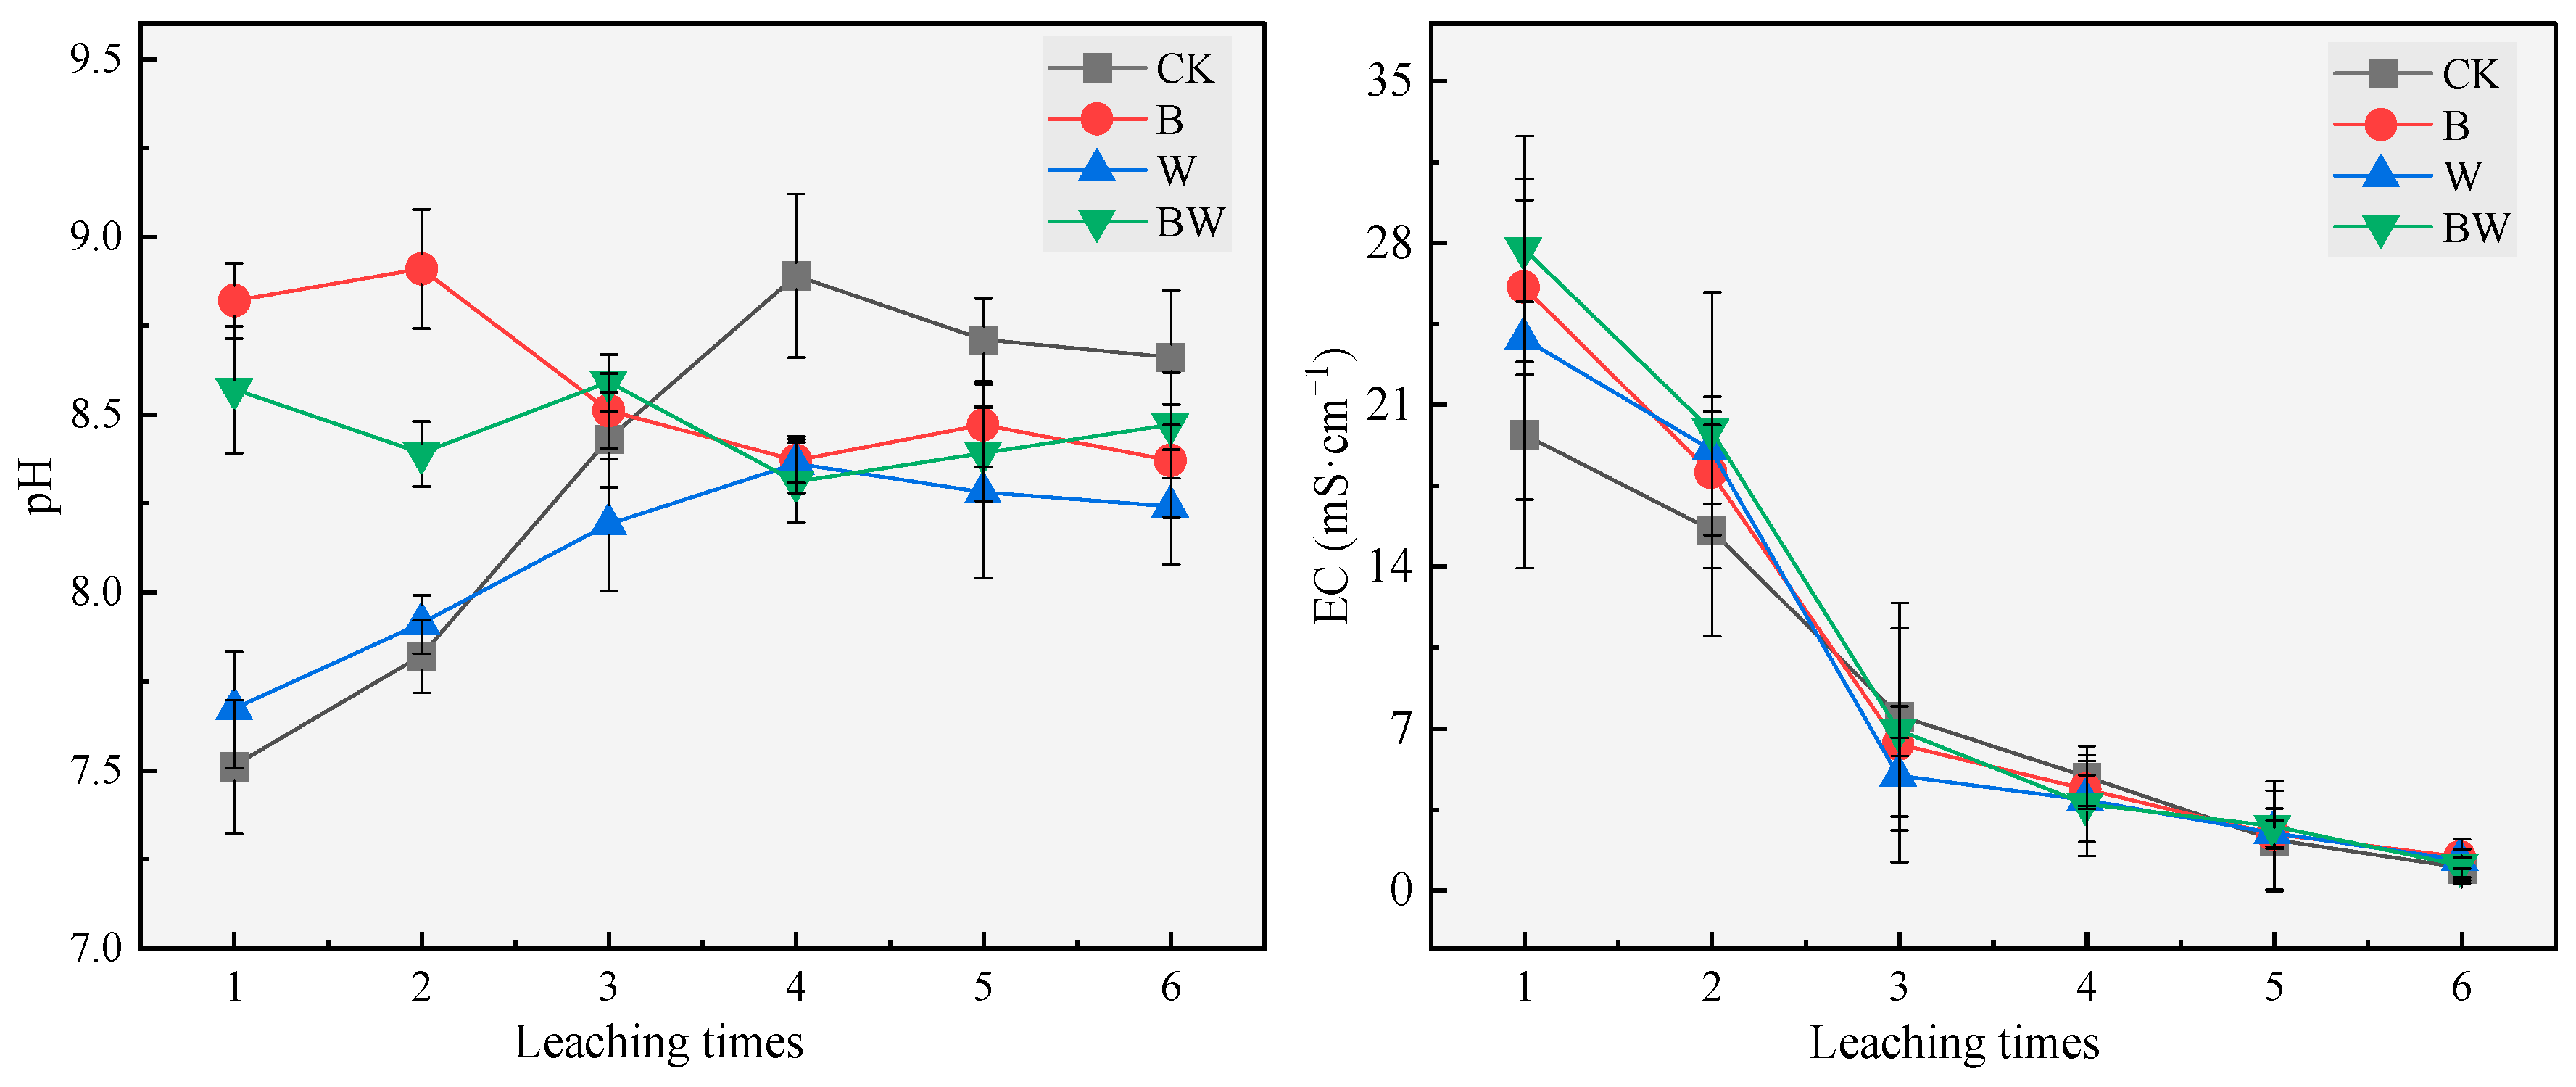
Figure 1. Trends in the pH and EC of the leachate solution. CK treatment group: no amendment materials were applied to the soil; B treatment group: biochar was applied to the soil at a rate of 20 g·kg−1; W treatment group: compost was applied to the soil at a rate of 40 g·kg−1; BW treatment group: biochar and compost were applied to the soil at a rate of 20 g·kg−1 for biochar and 40 g·kg−1 for compost.
Agronomy 15 02093 g001
Figure 2. Trend of the ion content in the leaching solutions after the different treatments. CK treatment group: no amendment materials were applied to the soil; B treatment group: biochar was applied to the soil at a rate of 20 g·kg−1; W treatment group: compost was applied to the soil at a rate of 40 g·kg−1; BW treatment group: biochar and compost were applied to the soil at a rate of 20 g·kg−1 for biochar and 40 g·kg−1 for compost.
Agronomy 15 02093 g002
Figure 3. Effects of biochar and compost on the pH of coastal saline soil. Note a: Four levels of biochar: 0, 10, 20, and 40 g·kg−1, denoted as B0, B1, B2, and B3, respectively; four levels of compost: 0, 20, 40, and 80 g·kg−1, denoted as W0, W1, W2, and W3, respectively. (A) shows the change in soil pH with increasing biochar application at a fixed amount of compost; (B) shows the change in soil pH with increasing compost application at a fixed amount of biochar. The values in the figure are the means ± standard deviations, and different letters indicate significant differences between treatments at the 0.05 level.
Agronomy 15 02093 g003
Figure 4. Effects of biochar and compost on the EC of coastal saline soils. (A) shows the changes in soil EC with increasing biochar application at a fixed amount of compost; (B) shows the changes in soil EC with increasing compost application at a fixed amount of biochar application. Note a: Four levels of biochar: 0, 10, 20, and 40 g·kg−1, denoted as B0, B1, B2, and B3, respectively; four levels of compost: 0, 20, 40, and 80 g·kg−1, denoted as W0, W1, W2, and W3, respectively. The values in the figure are the means ± standard deviations, and different letters indicate significant differences between treatments at the 0.05 level.
Agronomy 15 02093 g004
Figure 5. Effects of biochar and compost on the SAR of coastal saline soil. (A) shows the change in soil SAR with increasing biochar application at a fixed amount of compost; (B) shows the change in soil SAR with increasing compost application at a fixed amount of biochar application. Note a: Four levels of biochar: 0, 10, 20, and 40 g·kg−1, denoted as B0, B1, B2, and B3, respectively; four levels of compost: 0, 20, 40, and 80 g·kg−1, denoted as W0, W1, W2, and W3, respectively. The values in the figure are the means ± standard deviations, and different letters indicate significant differences between treatments at the 0.05 level.
Agronomy 15 02093 g005
Figure 6. Effects of biochar and compost on the saturated hydraulic conductivity of coastal saline soils. (A) shows the change in soil hydraulic conductivity with increasing biocarbon application at a fixed amount of compost; (B) shows the change in soil hydraulic conductivity with increasing compost application at a fixed amount of biochar. Note a: Four levels of biochar: 0, 10, 20, and 40 g·kg−1, denoted as B0, B1, B2, and B3, respectively; four levels of compost: 0, 20, 40, and 80 g·kg−1, denoted as W0, W1, W2, and W3, respectively. The values in the figure are the means ± standard deviations, and different letters indicate significant differences between treatments at the 0.05 level.
Agronomy 15 02093 g006
Figure 7. Effects of biochar and compost on soil nutrients in coastal saline soils. Note: Lowercase letters indicate differences between groups where p < 0.05. Panels (ad) show the contents of available nitrogen, available phosphorus, available potassium, and organic matter in the soil, respectively.
Agronomy 15 02093 g007aAgronomy 15 02093 g007b
Figure 8. Combined effects of biochar and compost on the physicochemical properties of saline soil. (ac) represents the application of biochar, compost, and mixed biochar and compost, respectively.
Agronomy 15 02093 g008
Table 1. Basic properties of the test materials.
Test
Materials
pHEC
(mS·cm−1)
CEC
(cmol·kg−1)
Organic Matter
(g·kg−1)
Na+K+Ca2+Mg2+ClSO42−ANAPAK
(mg·kg−1)(mg·kg−1)
Coastal saline soil8.413.5617.287.29570028901801205020112043.385.63146.15
Biochar9.1212.7332.25-2.7511.2614.211.26-----
Waste compost7.916.7668.34-173010.4511002260196013,900---
Note: EC and CEC represent the electrical conductivity and cation exchange of the soil, respectively. EC can be used as a measure of the soluble salt concentration in the soil. AN, AP, and AK denote effective nitrogen, effective phosphorus, and effective potassium, respectively. The table indicates the water-soluble ion content.
Table 2. Characteristics of the basic properties of the soil in each treatment group at the end of leaching.
TreatmentpHEC (mS·cm−1)SAR
CK8.66 ± 0.09 ab0.41 ± 0.05 a3.28 ± 0.71 a
B8.71 ± 0.14 a0.23 ± 0.07 b1.58 ± 0.38 bc
W8.45 ± 0.11 c0.27 ± 0.05 b2.03 ± 0.31 b
BW8.58 ± 0.07 bc0.20 ± 0.06 b1.19 ± 0.47 c
Notes: The values in the table are the means ± standard deviations, and the different letters indicate significant differences at the 0.05 level.
Table 3. Effects of biochar and compost on soil WR0.25 and WR2 (%).
IndexTreatmentW0W1W2W3
WR0.25B018.90 ± 1.33 hi22.24 ± 1.66 fg27.59 ± 1.08 de30.38 ± 1.27 c
B118.88 ± 1.55 hi22.63 ± 1.58 fg29.79 ± 1.75 cd32.95 ± 1.49 ab
B217.92 ± 0.62 i23.96 ± 0.87 f29.81 ± 1.92 cd35.13 ± 1.84 a
B320.77 ± 1.24 gh26.63 ± 0.99 e31.53 ± 0.72 bc33.51 ± 1.68 ab
WR2B00.62 ± 0.18 f1.65 ± 0.24 e2.39 ± 0.31 cd2.61 ± 0.16 bcd
B10.32 ± 0.14 f2.36 ± 0.41 cd3.06 ± 0.47 ab3.24 ± 0.21 a
B20.47 ± 0.20 f2.18 ± 0.55 de3.12 ± 0.53 ab3.52 ± 0.30 a
B30.40 ± 0.19 f2.45 ± 0.53 cd3.07 ± 0.27 ab3.36 ± 0.25 a
Note: WR2 and WR0.25 represent the contents of ≥2 mm and ≥0.25 mm water-stable aggregates, respectively. Considering that the particle size of the amendment materials used in the experimental design was <2 mm, calculating the content of ≥2 mm water-stable aggregates can avoid the influence of the single particles of the amendment materials, and better reflect the effect of soil water-stable aggregates affected by the application of amendment materials. Different lowercase letters indicate significant differences between treatments (at the 0.05 significance level).
Table 4. Effects of biochar and compost on the soil MWD and GMD.
IndexTreatmentW0W1W2W3
MWDB00.23 ± 0.01 h0.30 ± 0.04 f0.36 ± 0.03 bcd0.37 ± 0.02 bc
B10.22 ± 0.03 h0.33 ± 0.07 def0.39 ± 0.03 b0.43 ± 0.06 a
B20.22 ± 0.02 h0.32 ± 0.06 ef0.37 ± 0.03 bc0.43 ± 0.03 a
B30.24 ± 0.02 h0.34 ± 0.08 cde0.38 ± 0.07 b0.42 ± 0.07 a
GMDB00.14 ± 0.02 f0.16 ± 0.02 ef0.20 ± 0.02 cd0.23 ± 0.03 ab
B10.15 ± 0.02 ef0.16 ± 0.01 ef0.21 ± 0.02 bc0.24 ± 0.03 a
B20.14 ± 0.01 f0.17 ± 0.01 def0.21 ± 0.02 bc0.25 ± 0.03 a
B30.14 ± 0.02 f0.18 ± 0.02 de0.21 ± 0.02 bc0.24 ± 0.03 a
Note: The unit is mm. Different lowercase letters indicate significant differences between treatments (at the 0.05 significance level).
Table 5. Effects of biochar and compost on soil enzyme activities.
IndexTreatmentW0W1W2W3
Urease activityB010.10 ± 0.33 h10.92 ± 0.39 g18.2 ± 0.70 f25.48 ± 0.84 e
B112.74 ± 0.59 g16.8 ± 0.69 f25.48 ± 1.13 e28.82 ± 1.23 c
B218.20 ± 0.72 f24.48 ± 0.93 e29.12 ± 1.07 c32.76 ± 1.28 b
B321.84 ± 0.96 d28.12 ± 1.33 c32.76 ± 1.61 b36.4 ± 1.66 a
Phosphatase activityB019.20 ± 0.81 h27.52 ± 1.24 f41.48 ± 2.03 d51.13 ± 2.97 b
B122.64 ± 1.20 g34.40 ± 1.75 e48.16 ± 2.70 c60.37 ± 2.60 a
B227.52 ± 1.32 f42.28 ± 2.54 d54.48 ± 2.75 b61.92 ± 3.65 a
B330.96 ± 1.76 e44.72 ± 2.42 c55.04 ± 2.86 b63.47 ± 2.92 a
Dehydrogenase activityB01.90 ± 0.06 i3.49 ± 0.13 f5.32 ± 0.23 d6.44 ± 0.27 b
B12.28 ± 0.09 h4.56 ± 0.19 e6.08 ± 0.30 c6.74 ± 0.23 b
B23.04 ± 0.11 g4.94 ± 0.23 d6.65 ± 0.25 b7.60 ± 0.36 a
B33.80 ± 0.18 f5.32 ± 0.21 d6.84 ± 0.31 b6.18 ± 0.22 c
Note: Lowercase letters indicate differences between groups, p < 0.05. The activity intensities of urease, phosphatase, and dehydrogenase are in units of μmol NH3-N/(g·h), μmol pNP/(g·h), and μmol TPF/(g·h), respectively. Different lowercase letters indicate significant differences between treatments (at the 0.05 significance level).
Disclaimer/Publisher’s Note: The statements, opinions and data contained in all publications are solely those of the individual author(s) and contributor(s) and not of MDPI and/or the editor(s). MDPI and/or the editor(s) disclaim responsibility for any injury to people or property resulting from any ideas, methods, instructions or products referred to in the content.