Article

Structural Heterogeneity of Biochar Modulates’ Soil Hydraulic Properties and Nutrient Migration

1
State Key Laboratory of Water Engineering Ecology and Environment in Arid Area, Xi’an University of Technology, Xi’an 710048, China
2
School of Water Resources and Hydro-Electric Engineering, Xi’an University of Technology, Xi’an 710048, China
*
Authors to whom correspondence should be addressed.
Agronomy 2025, 15(8), 1830; https://doi.org/10.3390/agronomy15081830
Submission received: 5 June 2025 / Revised: 14 July 2025 / Accepted: 15 July 2025 / Published: 28 July 2025
(This article belongs to the Section Soil and Plant Nutrition)

Abstract

Biochar application is a well-recognized strategy to enhance agricultural soil fertility, but its structural heterogeneity leads to inconsistent outcomes in soil improvement, particularly in water and nutrient transport dynamics. In order to ensure the beneficial effects of biochar-amended agricultural soils in terms of water retention and fertilizer fixation, in this paper, we aim to elucidate the effect of the structural heterogeneity of biochar on the hydraulic properties and nutrient transport of agricultural soils. This study compares biochars at millimeter (BMP), micrometer (BUP), and nanometer (BNP) scales using CT scanning, and investigates the effects of different application rates (0.0–2.0%) on soil’s hydraulic properties and nutrient transport using soil column experiments and CDE analyses. The results show that biochar generally decreased soil saturated hydraulic conductivity (SSHC), except for the application of 2.0% BMP, which increased it. Biochar enhanced soil saturated water content (SSWC) and water holding capacity (WHC), with the 2.0% BMP treatment achieving the highest values (SSHC: 49.34 cm/d; SSWC: 0.40 g/g; WHC: 0.25 g/g). BUPs and BNPs inhibited water infiltration due to pore-blocking, while 2.0% BMP promoted infiltration. Convective dispersion equation analysis (CDE) indicated that BUPs and BNPs reduced water and nutrient transport, with 2.0% BMP showing optimal performance. Statistical analyses revealed that biochar’s structural heterogeneity significantly affected soil water repellency, its hydraulic properties, and solute transport (p < 0.05). Smaller particles enhanced water retention and nutrient fixation, while larger particles improved WHC at appropriate rates. These findings provide valuable insights for optimizing biochar application to improve soil functions and support sustainable agriculture.

1. Introduction

Soil water and nutrient conservation and migration play a crucial role in enhancing farmland resilience and productivity. This has become a key task in farmland water management, as soil hydraulic properties serve as the foundation for studying these aspects [1]. Since Wim Sombroek [2], a Dutch soil scientist, discovered biochar in the Brazilian Amazon basin in 2001, an increasing number of scholars have applied biochar to improve agricultural soils, and its advantages in enhancing soil hydraulic properties have been well-demonstrated. The high porosity and large surface area of biochar can reduce soil permeability, increase water holding capacity (WHC), modify water residence time, and extend flow paths within the soil [3]. According to Verheijen et al. [4], biochar treatments led to a decrease in soil bulk density and a significant increase in WHC. Yang et al. [5] found that, after conducting three-year field experiments, biochar treatment significantly improved WHC at substrate potentials of −0.033 and −1.5 MPa and increased the effective WHC. Additionally, the ameliorative effect of biochar was more pronounced in sandy soils compared to clay or loamy soils. Razzaghi et al. [6] found that, for coarse-textured soils, field water holding capacity (WHC) and wilting water content increased significantly by 51% and 47%, respectively. For medium-textured soils, the increases were more moderate, being 13% and 9%. In contrast, for fine-textured soils, field WHC remained essentially unchanged (less than 1%). In general, biochar enhances WHC by altering the shape and size of soil pores, increasing overall soil porosity, and promoting the formation and stability of soil aggregates. The particle size of biochar is pivotal in regulating soil WHC. It influences the internal pores within biochar particles, the pore spaces between biochar particles, and the interactions with soil particles [7]. The internal pores of biochar particles can retain additional water, thereby contributing to an increase in WHC. As a rigid granular material, biochar treatments can also modify the soil’s pore size distribution [8], which in turn impacts water movement and storage within the soil. These findings indicate that the influence of biochar on soil’s moisture properties is intricately linked to both the type of biochar applied and the soil type. However, further research is warranted to fully elucidate the underlying mechanisms of this.
Some studies have reported paradoxical results, showing no significant difference in water holding capacity (WHC) among biochar treatments [9]. Additionally, Rabbi et al. [10] indicated that there is currently no conclusive evidence to support the claim that biochar application can uniformly improve the WHC of diverse soil types. Comparisons of biochar used in various studies suggest that the discrepancies in results are predominantly attributed to variations in biochar properties and soil types [11]. Edeh et al. [12] employed a meta-analysis to demonstrate that the specific surface area, particle size, and porosity of biochar are critical factors in altering soil’s hydraulic properties. Larger biochar particles, characterized by their extensive internal surface and porous structure, can fill the minute pores in soil, thereby increasing the soil’s water storage capacity and enhancing both its field capacity and effective water content [13]. In contrast, studies focusing on smaller biochar particles, such as the one by Esmaeelnejad et al. [14], revealed that the addition of fine biochar can fill the spaces between soil particles, increase the curvature of pore channels, and reduce pore throat sizes. These changes ultimately lead to a decrease in the hydraulic conductivity of the biochar–soil mixture. Lim et al. [15] also verified that biochar particles of different sizes can alter soil’s curvature, thereby influencing the soil’s hydraulic conductivity. The internal structural pores of biochar (pores within biochar particles) primarily affect soil’s hydraulic conductivity, while the interstitial spaces (pores between biochar and soil particles) govern soil’s water holding capacity (WHC) properties. Another crucial property of biochar that impacts water’s movement through soil is its hydrophilic/hydrophobic nature [16]. Biochar exhibits a certain degree of hydrophobicity due to the presence of organic compounds on its structural surface or within its pores [17]. Studies have shown that biochar treatment can transform soil from hydrophilic to hydrophobic. Additionally, in hydrophilic soils with low total organic carbon, biochar treatments have been found to increase WHC [18]. Fahmi et al. [19] demonstrated that, by grinding and sieving biochar from the same raw material, biochar particles of different sizes can possess distinct surface functional groups and varying degrees of hydrophobicity. Edeh et al. [7] concluded that the hydrophobicity of biochar increases as the particle size decreases. Chen et al. [20] applied nano-sized biochar with particle sizes ranging from 40 to 200 nm to the soil, which significantly enhanced the soil’s hydrophobicity. This, in turn, altered the distribution of water within the soil’s pore structure, leading to a reduction in WHC. Currently, research on the relationship between biochar particle size and soil’s hydraulic properties has predominantly focused on the millimeter and micrometer scales [13,21]. However, finer nanoscale biochar contributes significantly to the structural heterogeneity of biochar [22]. The way nanoparticle biochar modifies soil’s pore structure differs from that of large-particle biochar with a rich pore structure, resulting in distinct effects on soil’s hydraulic properties. Furthermore, soil’s nutrient migration primarily occurs via water movement as a carrier. The leaching of soil’s nutrient elements is one of the main pathways of the soil’s nutrient loss. Therefore, reducing the leaching of nutrient ions is crucial for maintaining soil stability and enhancing the soil’s nutrient pool. Some researchers have found that biochar has remarkable advantages in improving the soil’s nutrients and their utilization efficiency [23]. Biochar application can enhance the soil’s nutrient and organic carbon content, which is beneficial for the development of sustainable agriculture and the achievement of high nutrient-use efficiency [24]. It serves as an effective approach to ensure food security. Wu Baolin et al. [25] discovered that, in northwestern China, where land productivity is constrained by soil salinity, biochar application can significantly modify soil properties and effectively boost crop productivity in saline soils. Quantitatively evaluating the impacts of biochar on crop productivity and soil salinity in salt-affected soils is essential for restoring the soils’ nutrients and promoting the remediation of salt-affected soils. It has also been reported that well-irrigated maize grown on sandy loam soils amended with biochar of less than 2 mm or 2–4 mm in size shows improved uptake of soil nitrogen and phosphorus [26]. It has also been shown that nano-biochar indirectly affects the stability of soil aggregates by regulating the ratio of soil pores to soil particles, influences the physical, chemical, and biological properties of soil, and remediates the soil’s metal contamination by adjusting the structure of the microbial community, which solves the environmental and health problems caused by human development [27]. Therefore, when systematically analyzing the influence of biochar heterogeneity on soil’s hydraulic properties, it is essential to comprehensively consider the effect of the biochar’s heterogeneous structure on soil’s nutrient transport. This integrated approach enables a more accurate assessment of the effectiveness of biochar in improving soil’s nutrient utilization, maximizes the soil’s water and nutrient holding capacity, and ultimately achieves the goal of “promoting nutrient availability through water management and regulating water dynamics with nutrient management”.
This paper conducts indoor experiments on agricultural soils, including vertical infiltration tests of soil columns, solute penetration tests, CT scanning, ESEM scanning electron microscopy, and SEM transmission electron microscopy. The objectives are threefold: first, to explore the structural heterogeneity of biochar itself and its water holding capacity (WHC) and the water holding effect on farmland soil under different amendment conditions; second, to analyze its influence on soil’s hydraulic properties and the solute penetration process; and third, to reveal how different levels of structural heterogeneity can modify soil’s moisture properties, water absorption and retention capabilities, as well as the clogging effect caused by biochar particles. These investigations aim to provide a scientific basis for the rational application of biochar, clarify the mechanisms by which biochar’s structural heterogeneity affects soil’s moisture dynamics and particle-induced clogging, and explore its differential impacts on soil’s water and nutrient transport. Ultimately, the findings will offer technical support for using biochar to mitigate agricultural soil pollution and enhance soil productivity.

2. Materials and Methods

2.1. Materials for Biochar Preparation

Shanghai Hainuo Charcoal Co., Ltd. (Shanghai, China) supplied the biochar used in this study, with coconut shells being used as the raw material for the biochar. The coconut shells were calcined in a low-temperature charcoal kiln, with a carbonization temperature of 500–800 °C and a carbonization time of 24 h, to produce lumpy carbons. After physically crushing the carbons, three biochar particles were separated by sieving according to the requirements (a. experimental millimeter-scale biochar particles, abbreviated as BMPs; b. experimental micrometer-scale biochar particles, abbreviated as BUPs; and c. experimental nanometer-scale biochar particles, abbreviated as BNPs) and the physicochemical properties of the three structures of biochar are shown in Table 1.

2.2. Experimental Design

Soil samples (Soil texture is chalky loam according to the International System (USDA) classification criteria). Capacity: 1.25 g/cm3; Ph: 6.9; TOC: 15.51 g/kg; TN: 0.80 g/kg; nitrate nitrogen: 41.50 mg/kg; effective phosphorus: 29.87 mg/kg; quick potassium: 144.00 mg/kg. These were collected from the daily cultivated farmland in Peng Town, Yijun County, Tongchuan City, Shaanxi Province, from 10 to 25 cm below the field’s surface. Biochars were divided into three groups according to their different particle sizes, and were mixed with sieved soil at mass imposed ratios of 0.0%, 0.3%, 0.6%, 1.0%, and 2.0%, for a total of 13 treatments. The well-mixed biochar-containing soil was filled into a PVC pipe of 20 cm diameter according to a bulk density of 1.25 g/cm3, respectively, and buried into the farmland for more than 5 months, with no human disturbing factors during the process to make its soil structure stable. They were removed from the agricultural soil and air-dried in a ventilated environment before analog analysis tests were carried out. Prior to the analysis and determination, the field water holding capacity of the mixed soil was determined using the ring knife method; the particle composition distribution of the test samples was analyzed using a Malvern laser particle sizer (Malvern Mastersizer 2000, Shanghai Zhiyan Scientific Instrument Co., Shanghai, China); the pH was determined using a Magnet PHS-25 pH meter (Shanghai Right One Instrument Co., Ltd., Shanghai, China); and the intermittent chemical analysis was performed using spectrophotometric method (SmartChem200 automatic intermittent chemical analyser, Shenzhen Yizheng Technology Co., Shenzhen, China) was used to determine the content of nitrate nitrogen (2 mol/L potassium chloride solution leaching), ammonium nitrogen (2 mol/L potassium chloride solution leaching), fast-acting phosphorus (0.5 mol/L sodium bicarbonate solution leaching), and fast-acting potassium (1 mol/L ammonium acetate solution leaching) in the soil, and a spectrophotometer (Shanghai Aoanalytical Ltd., Shanghai, China) was used for the determination of TOC (potassium dichromate oxidation-spectrophotometry); the room temperature was 25 degrees Celsius, and the room humidity was 53% during the determination.

2.3. Measurement Indicators and Methods

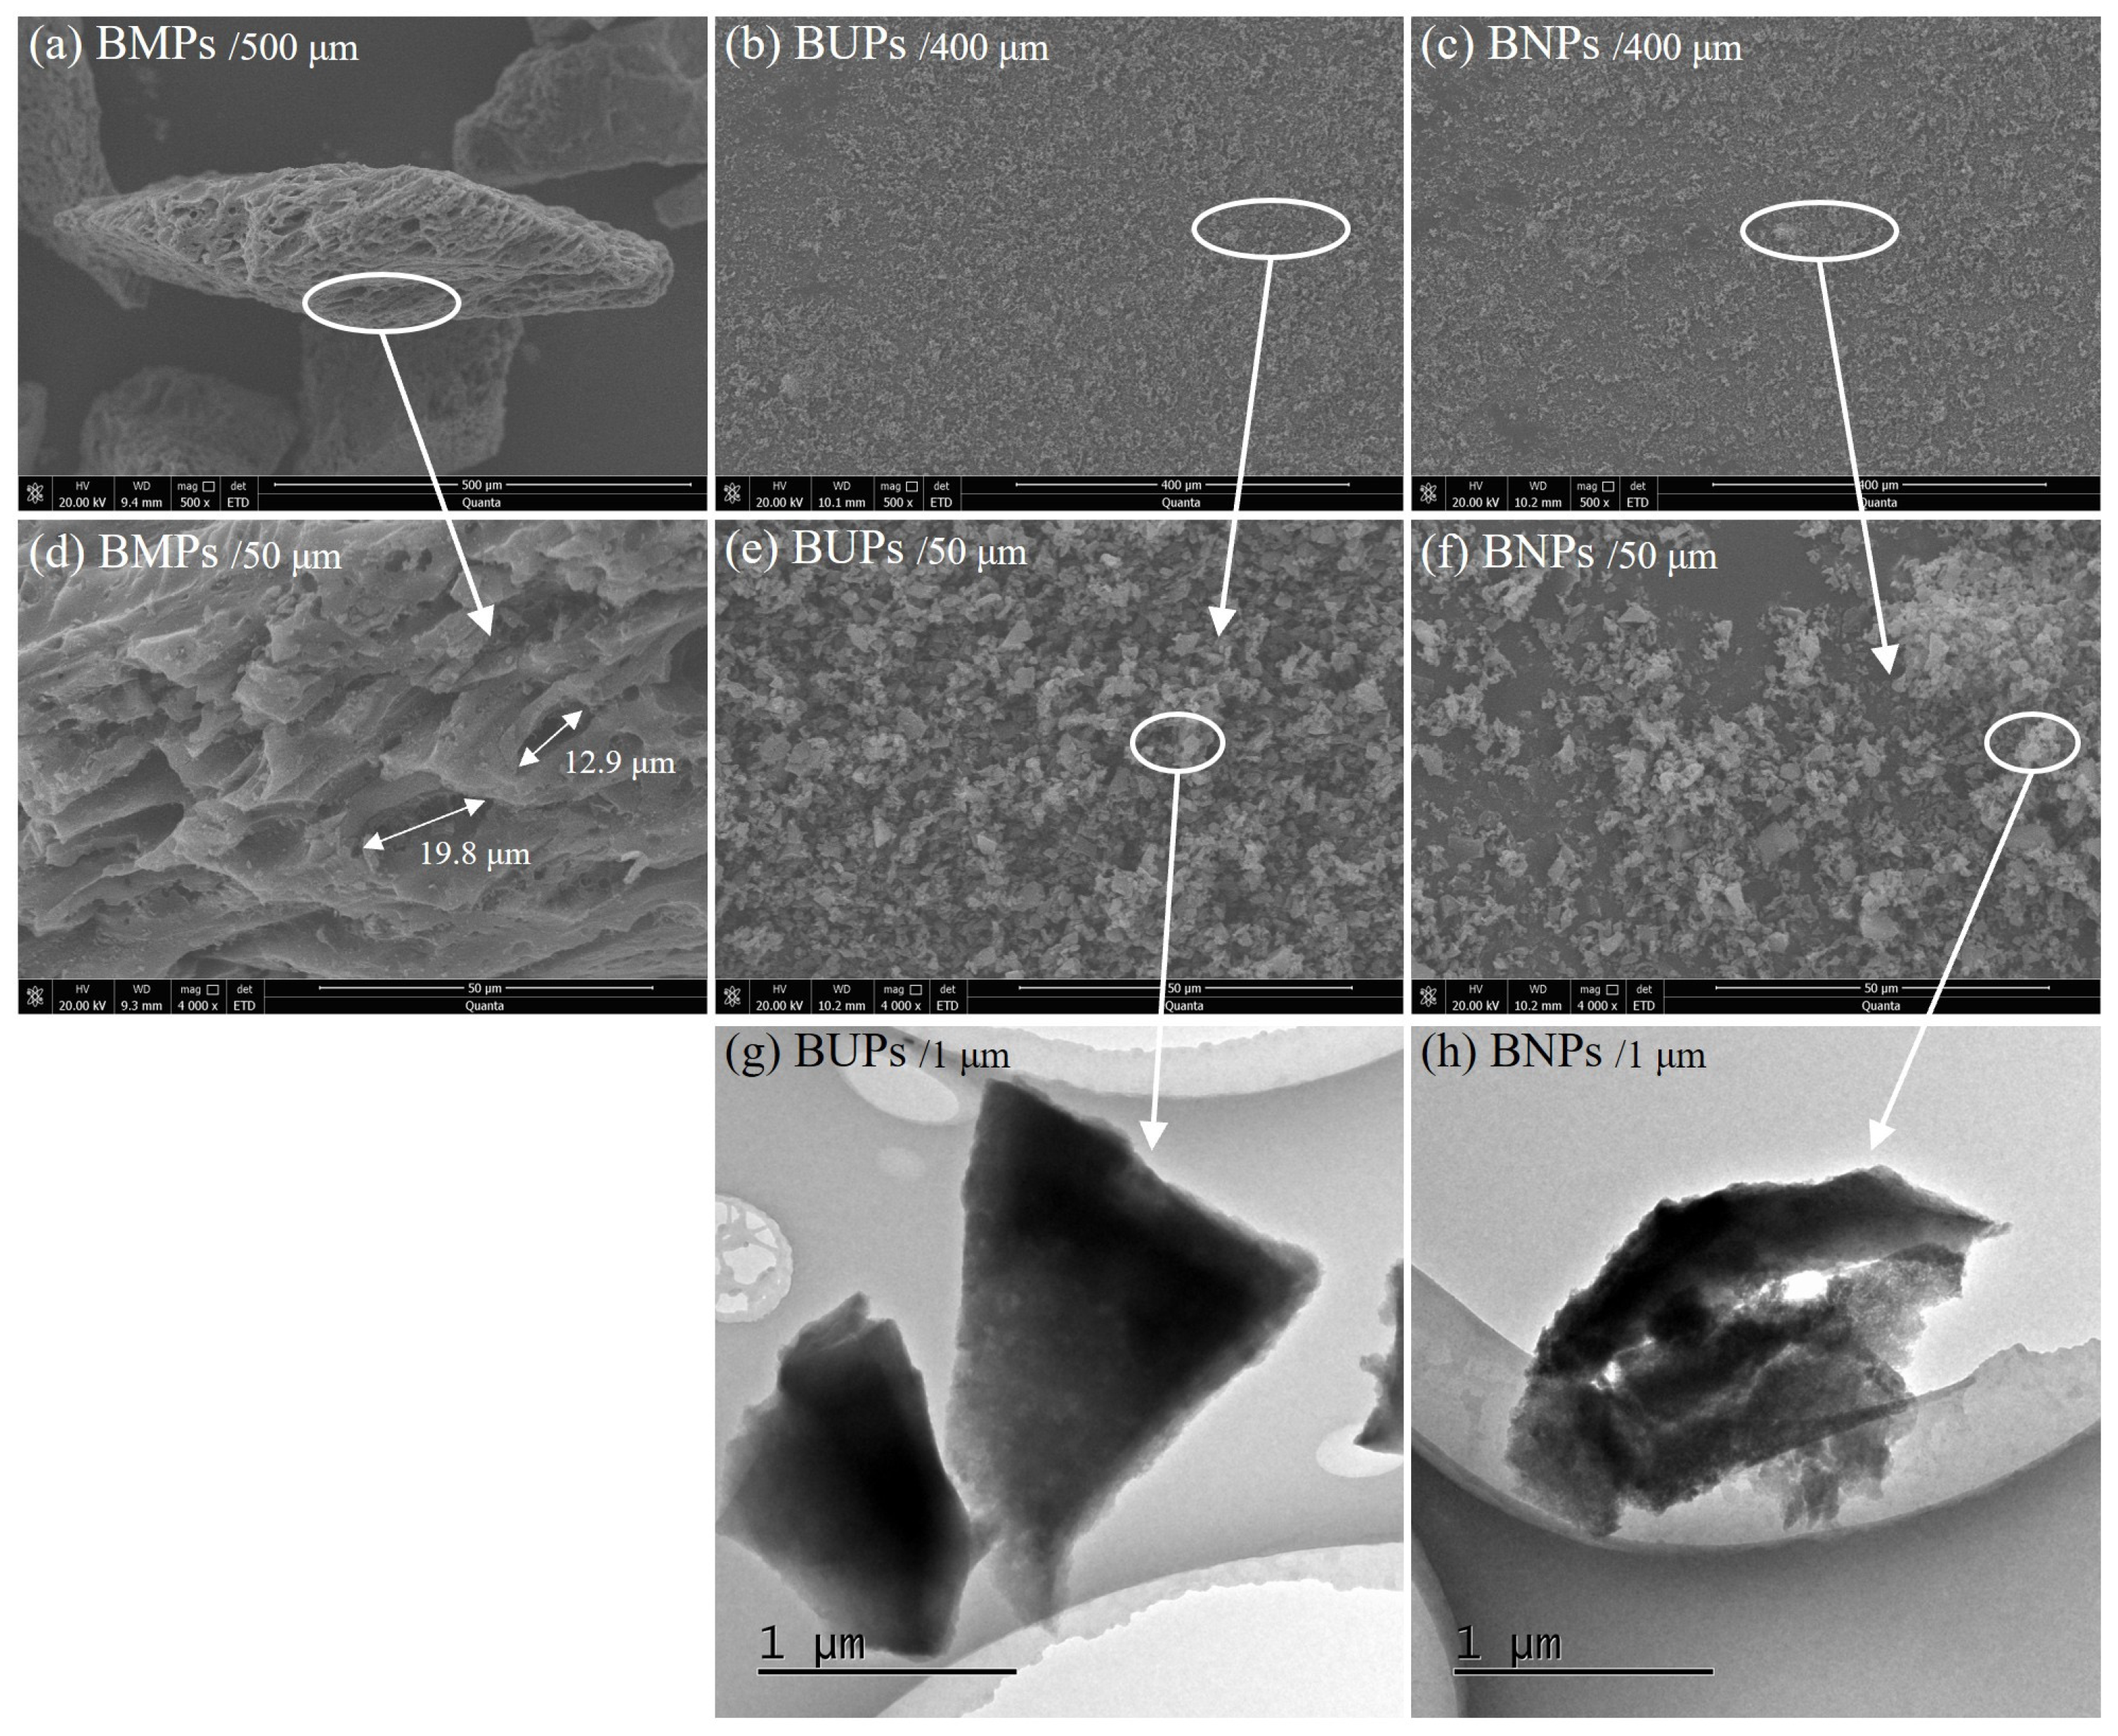
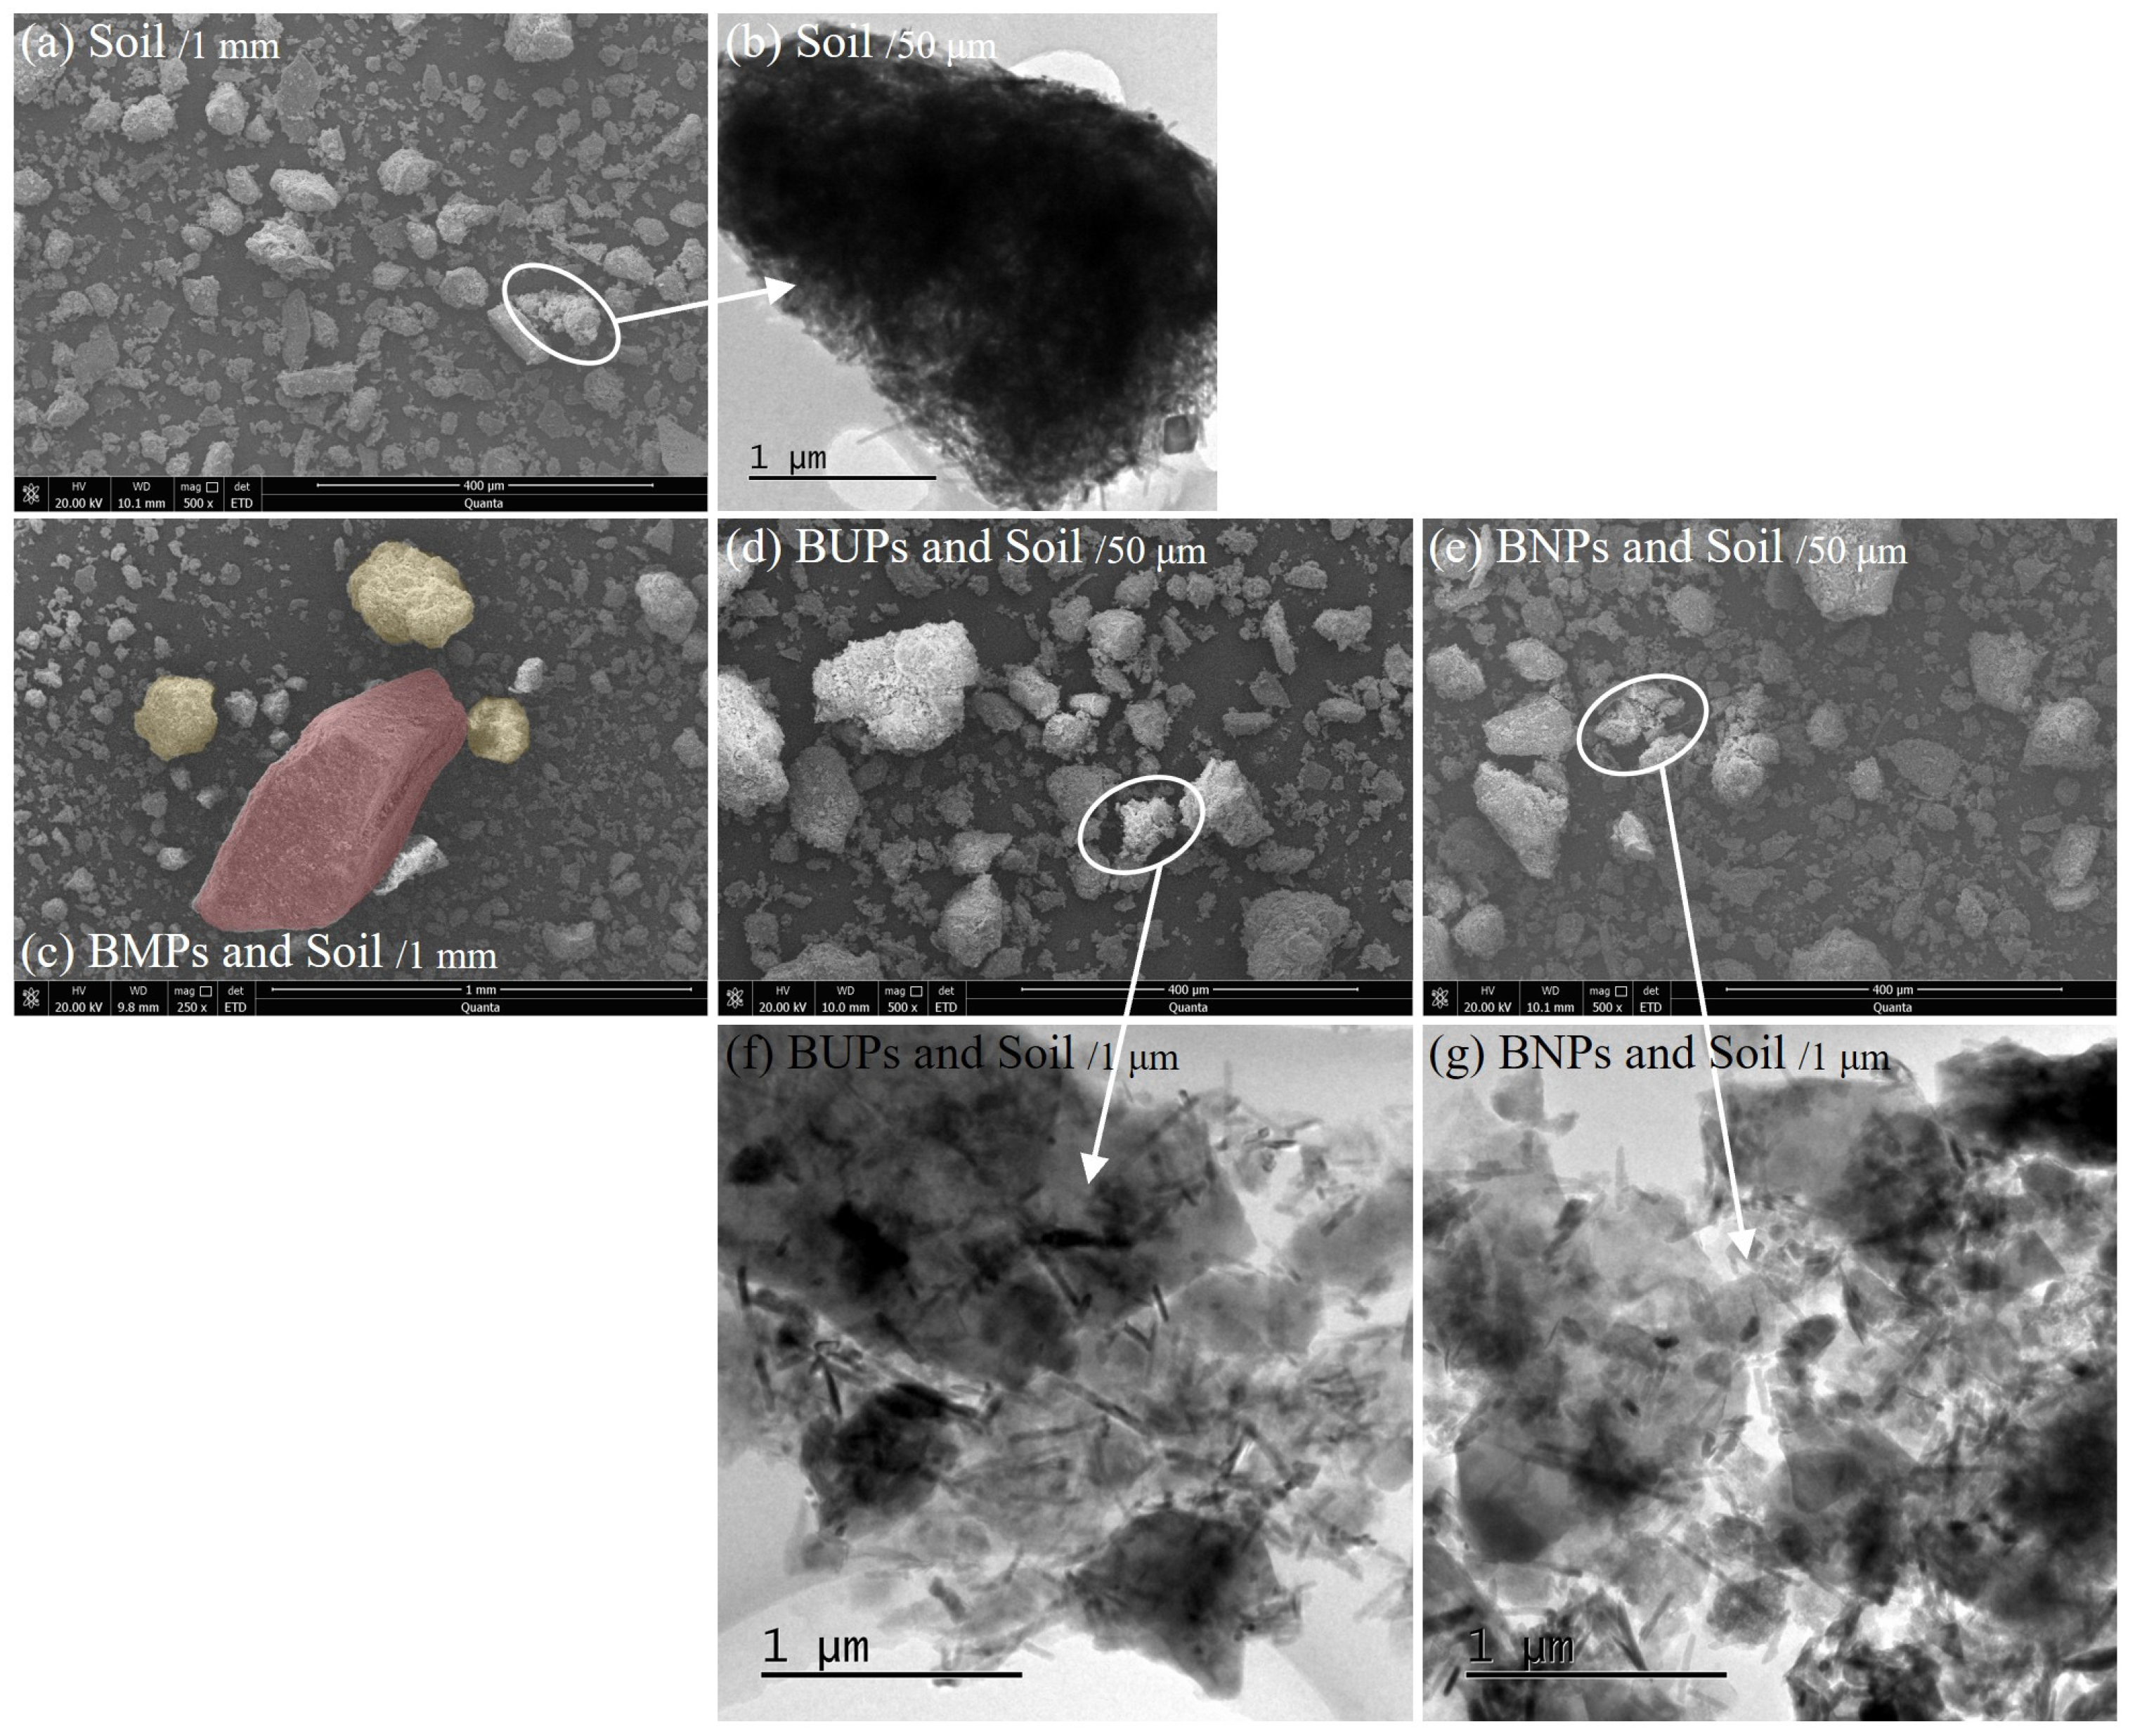
2.3.1. Apparent Morphological Analysis of Biochar and Soil Mixed Matrix Particles

An environmental scanning electron microscope (FEI Scanning Electron Microscope Q45, Shanghai Baiga Together Technology Co., Shanghai, China) was used to observe and analyze the apparent morphology of the test samples. The environmental scanning electron microscope (ESEM) is no longer sufficient for observing the apparent morphology of the micron or nano-sized biochar and soil mixed-matrix particles. A transmission electron microscope (TEM) (Analytical Transmission Electron Microscope JEOLJEM-3010, JEOL Ltd. Tokyo, Japan) was used to observe and analyze the biochar microparticle samples. Anhydrous ethanol was used as a dispersant, the biochar microparticles were uniformly dissolved in anhydrous ethanol, and the charcoal particles were uniformly dispersed in a suspension using a vortex. Copper mesh with the organic film was dipped into the ethanol solution with tweezers to retrieve the droplets, and then the mesh was clamped until dry. The carrier copper mesh was placed on an electron microscope stage and charged and pressurized to observe the sample morphology (shown in Figure 1 and Figure 2).

2.3.2. Characterization of Soil Pore Structure

The original soil samples from the field were manually cut into 3.5 d × 2.0 h cm cylindrical soil bodies with the biochar–soil hybrid substrate and placed in a ventilated environment without direct sunlight for air-drying. After the soil samples were completely air-dried, the periphery was tightly wrapped in cling film for CT scanning imaging of the soil pore characteristics (Phoenix Nanotom S nano-focus industrial CT). The prepared soil samples were fixed in the sample stage, which was rotated from 0 to 360° in the horizontal direction, and the data obtained from scanning were reconstructed using VG Studio software MAX. A total of 2200 projection images were collected from each group of soil samples at a resolution of 1270 × 1270 dpi, which were reconstructed using Datos|×2.0 software (Wunstorf, Germany), and the Filtered Back Projection (FBP) reconstruction algorithm was used to rebuild the sectional images. Pre-processing, 3D image reconstruction, and quantitative analysis of TIFF images were performed using ImageJ 1.53f51 software (National Institute of Health, Bethesda, MD, USA). The subsequent quantitative analysis and visualization were performed in three steps. To conduct a quantitative analysis of the soil pore characteristics, we first determined the analysis area based on the image cut. The Adjust Threshold command was employed to establish an optimal threshold range. This range was determined using manual segmentation of the image to ensure accuracy, and a uniform threshold value was applied across different processes to minimize errors arising from image processing. This step resulted in a binarized image of the soil, which served as the basis for the quantitative analysis of pore spaces. For the quantitative analysis of the soil pore characteristics, we utilized the 3D Objects Counter command to statistically analyze the pore volume and surface area. The total porosity of the soil was then calculated using Equation (1). Additionally, the Dimension command was employed to calculate the fractal dimension of the soil pores, the Volume Fraction command to determine the volume fraction of the soil pores, and the Thickness command to analyze the pore throat size distribution. The connectivity of soil pores was calculated using the connectivity command in the BoneJ module, the anisotropy command calculated the anisotropy of the soil pores, the Fractal Dimension command calculated the fractal dimension of the soil pores, the Volume Fraction command calculated the volume fraction of the soil pores, and the Thickness command calculated the pore throat size distribution of the soil pores. Finally, based on the processed binarized image, the 3D Viewer command was used to reconstruct the soil pores in three dimensions and visualize their structures (as shown in Figure 3).
P O = V P / V × 100 %
where P O is soil porosity; V P is soil pore volume, mm3; and V is total soil volume, mm3.

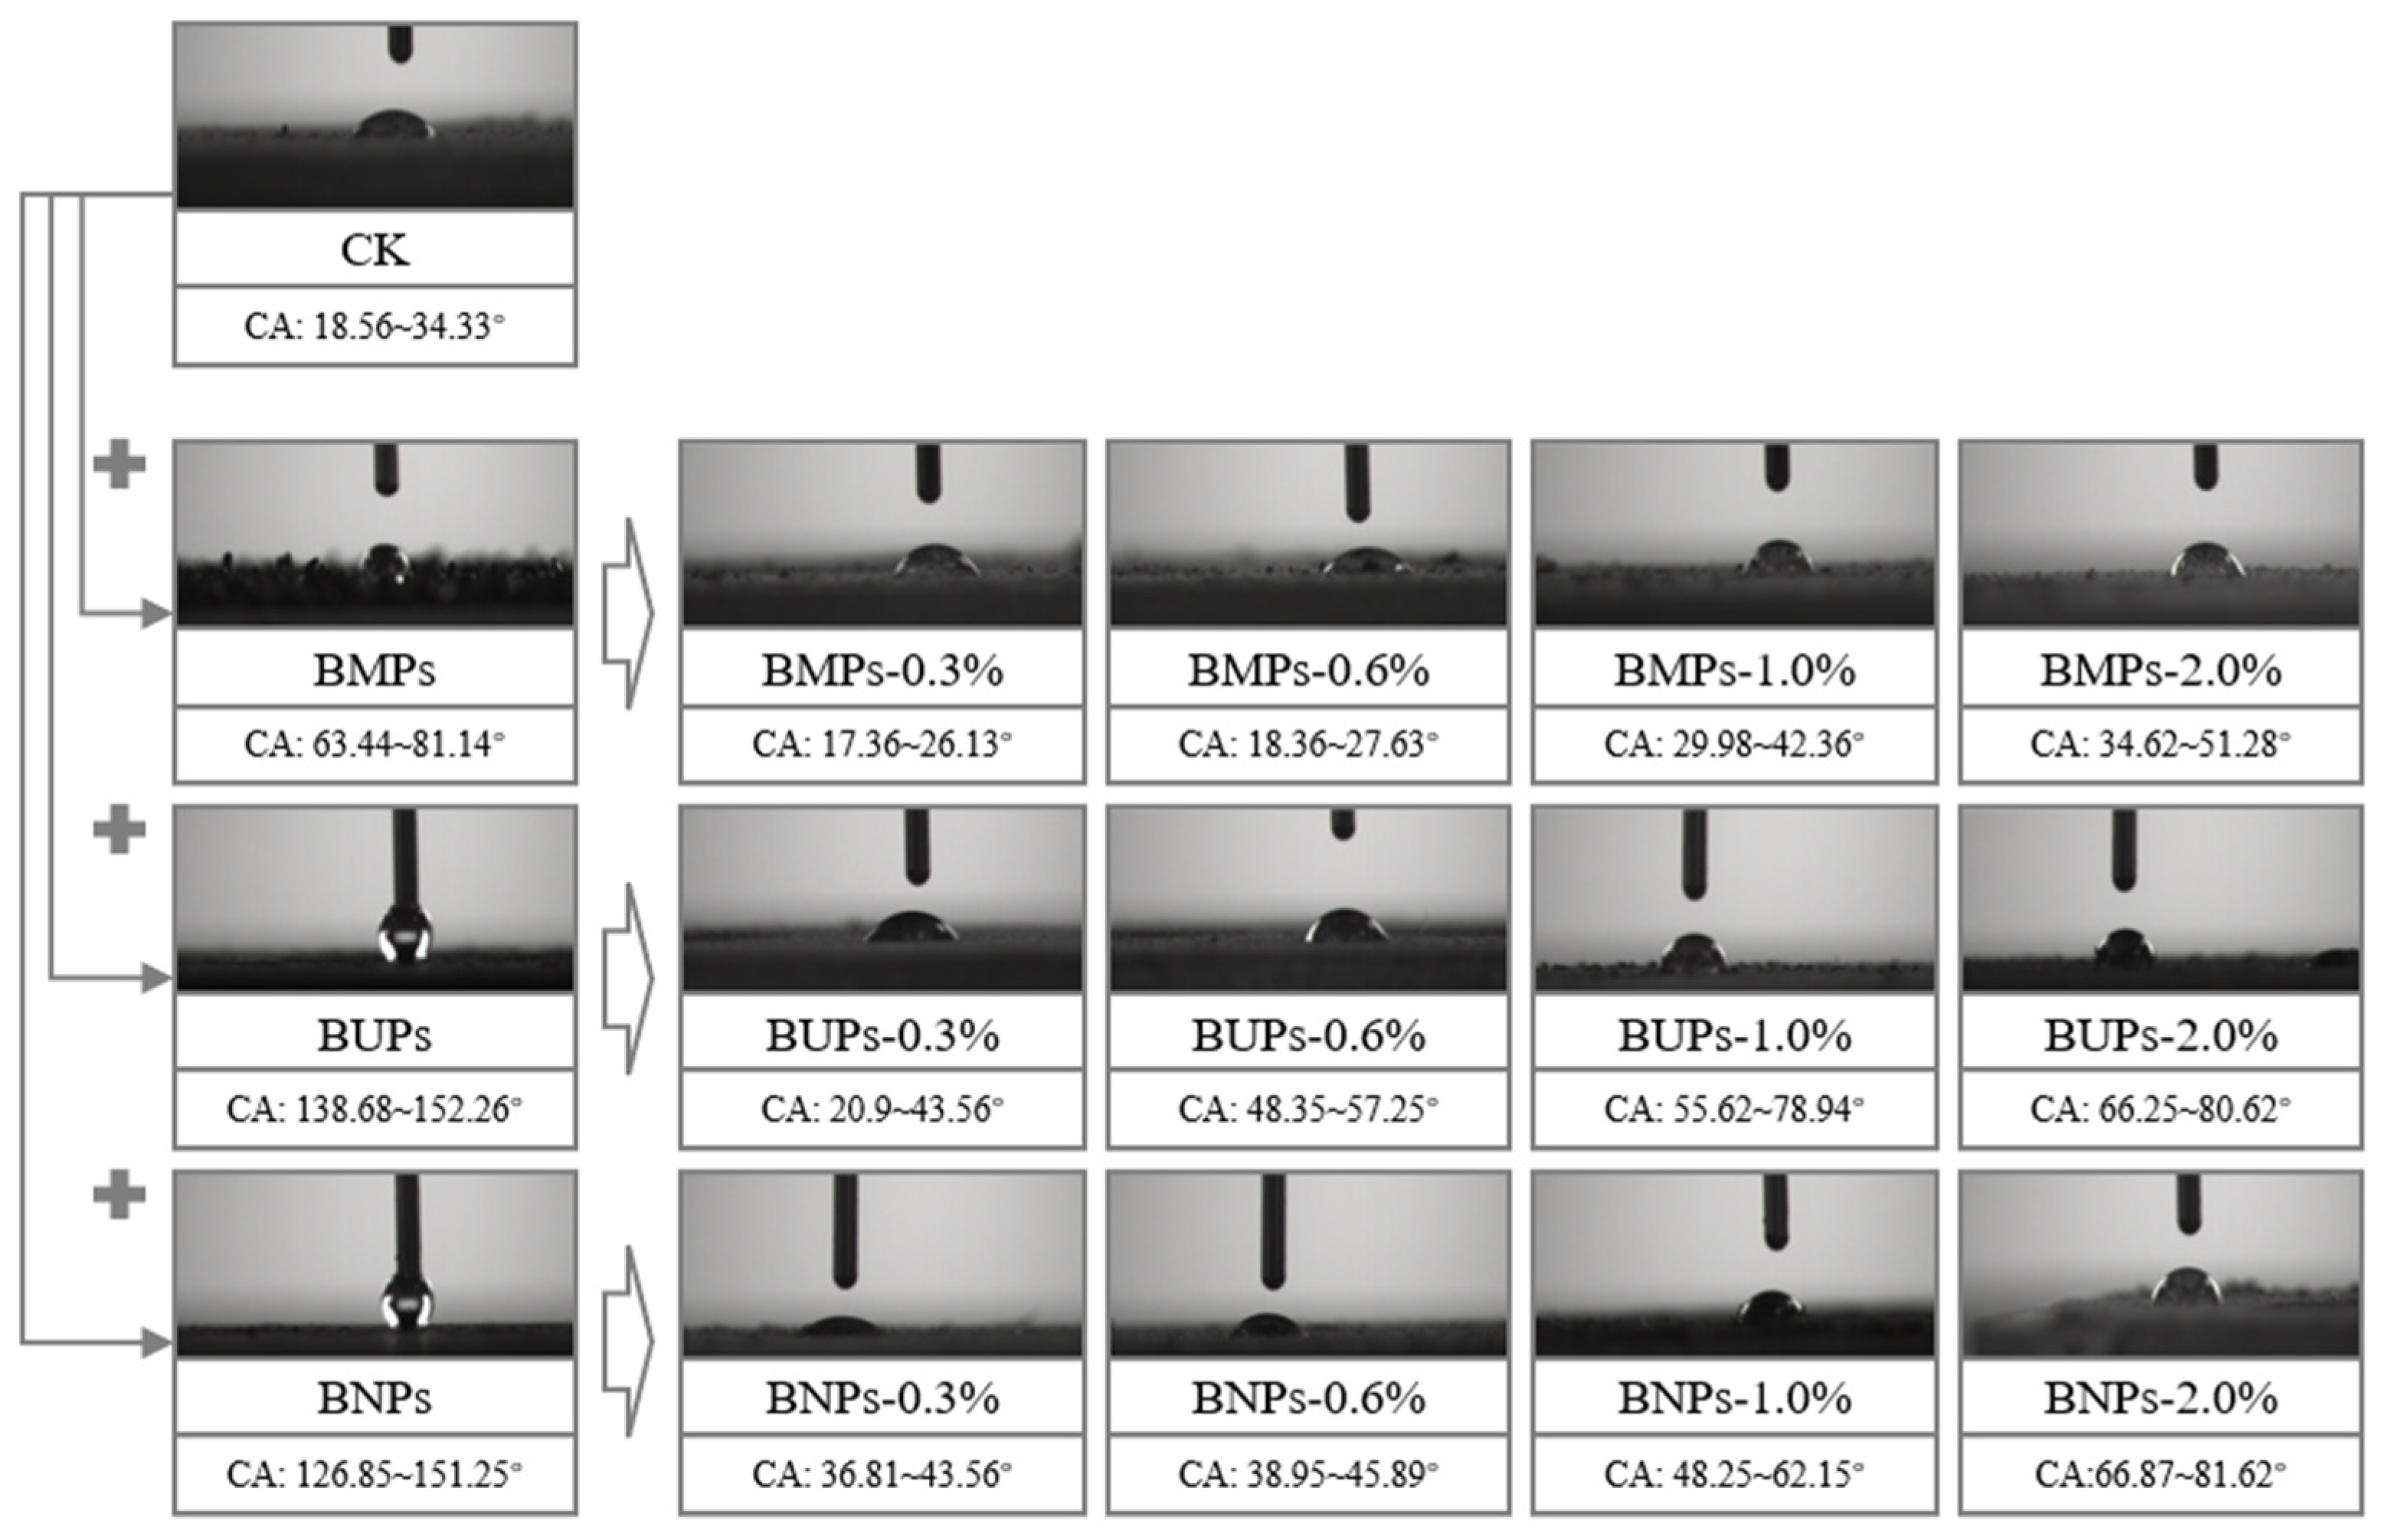
2.3.3. Contact Angle Determination of the Hydrophilicity and Hydrophobicity of Homogeneous Carbonaceous Soils

The soil particles were applied to one side of the slide using double-sided adhesive tape so that the surface of the particles was slightly flattened, and excess soil particles were removed around the double-sided adhesive tape until the surface of the tape was covered with a thin layer of soil particles that were evenly distributed and had no visible unevenness. The prepared soil samples were placed on the release table of the contact angle meter for drop measurements. From the results of the contact angle measurements, the Fowkes model was used in this study to calculate the solid surface free energy of the biochar–soil hybrid substrate. Fowkes suggested that surface energy is the sum of multiple components, each of which is induced by specific intermolecular forces. Therefore, the interfacial energy between a solid and a liquid is the sum of the solid’s surface energy and the liquid’s surface energy, minus the geometric mean of their dispersive components, which can be expressed as follows:
c o s θ = 2 γ s v d · γ l v d / γ l v 1
where θ is the solid/liquid contact angle (°); γ s v d is the solid dispersed surface energy component; and γ l v d is the liquid dispersed surface energy component.

2.3.4. Methods of Testing

As shown in Figure 4, the Martens bottles (height: 40 cm; inner diameter: 8 cm) provided a stable water head for the soil water infiltration process. Plexiglas soil columns, with dimensions of 45 cm in height and 8 cm in diameter, were filled to a height of 40 cm with soil samples of a given capacity to simulate the soil profile. The soil profile within the columns was divided into two layers: the upper layer (0–20 cm below the surface) was filled with air-dried homogeneous carbonaceous soil samples, while the lower layer (20–40 cm below the surface) was filled with non-carbonaceous soil samples. Each type of soil was filled into 13 groups of columns. During filling, the soil layers were carefully scraped to ensure uniform distribution. After filling, a layer of filter paper was placed on the surface of the soil to prevent the surface soil particles from being washed away by the water supplied from the Martens bottles.
The Martens bottles provided a stable head for standing water infiltration, and the head height was maintained at approximately 2 cm. During the soil infiltration, the advancing distance of the wetting front of the soil column and the cumulative infiltration volume of the Martens bottles were recorded at various times (1, 2, 3, 5, 10, 15, 20, 25, 30, 60, 90, 120, 150, 180, 240, 300, … (min) after the start of the infiltration) until the infiltration was completed when the wetting front had advanced to 40 cm below the surface layer. The experiment was then terminated. Throughout the determination and analysis, we used the ring knife method to determine the saturated hydraulic conductivity of the soil (according to F-HZ-DZ-TR-0021) and the GB7172-1987 [28]-Soil Moisture Determination Method to determine the saturated water content of the soil.
At the end of the infiltration experiment, the water supply to the soil column was continued until the interior of the soil column was completely saturated. Then the head of water accumulated in the surface layer of the soil column was rapidly removed. Cl content was determined using silver nitrate titration [29]. The water supply to the soil column was continued using a Martens bottle containing 0.15 mol/L CaCl2 solution (Cl was chosen as the simulated solute ion, and the head of water accumulated in the soil column was still maintained at approximately 2 cm). At the bottom of the soil column, a 50 mL graduated cylinder was used to receive the effluent from the soil column (samples were taken every 10 mL), and the Cl concentration in the effluent was determined by titration with 0.01 mol/L AgNO3 solution, and the penetration test was completed when the Cl concentration in the effluent was essentially equal to that in the injected solution.

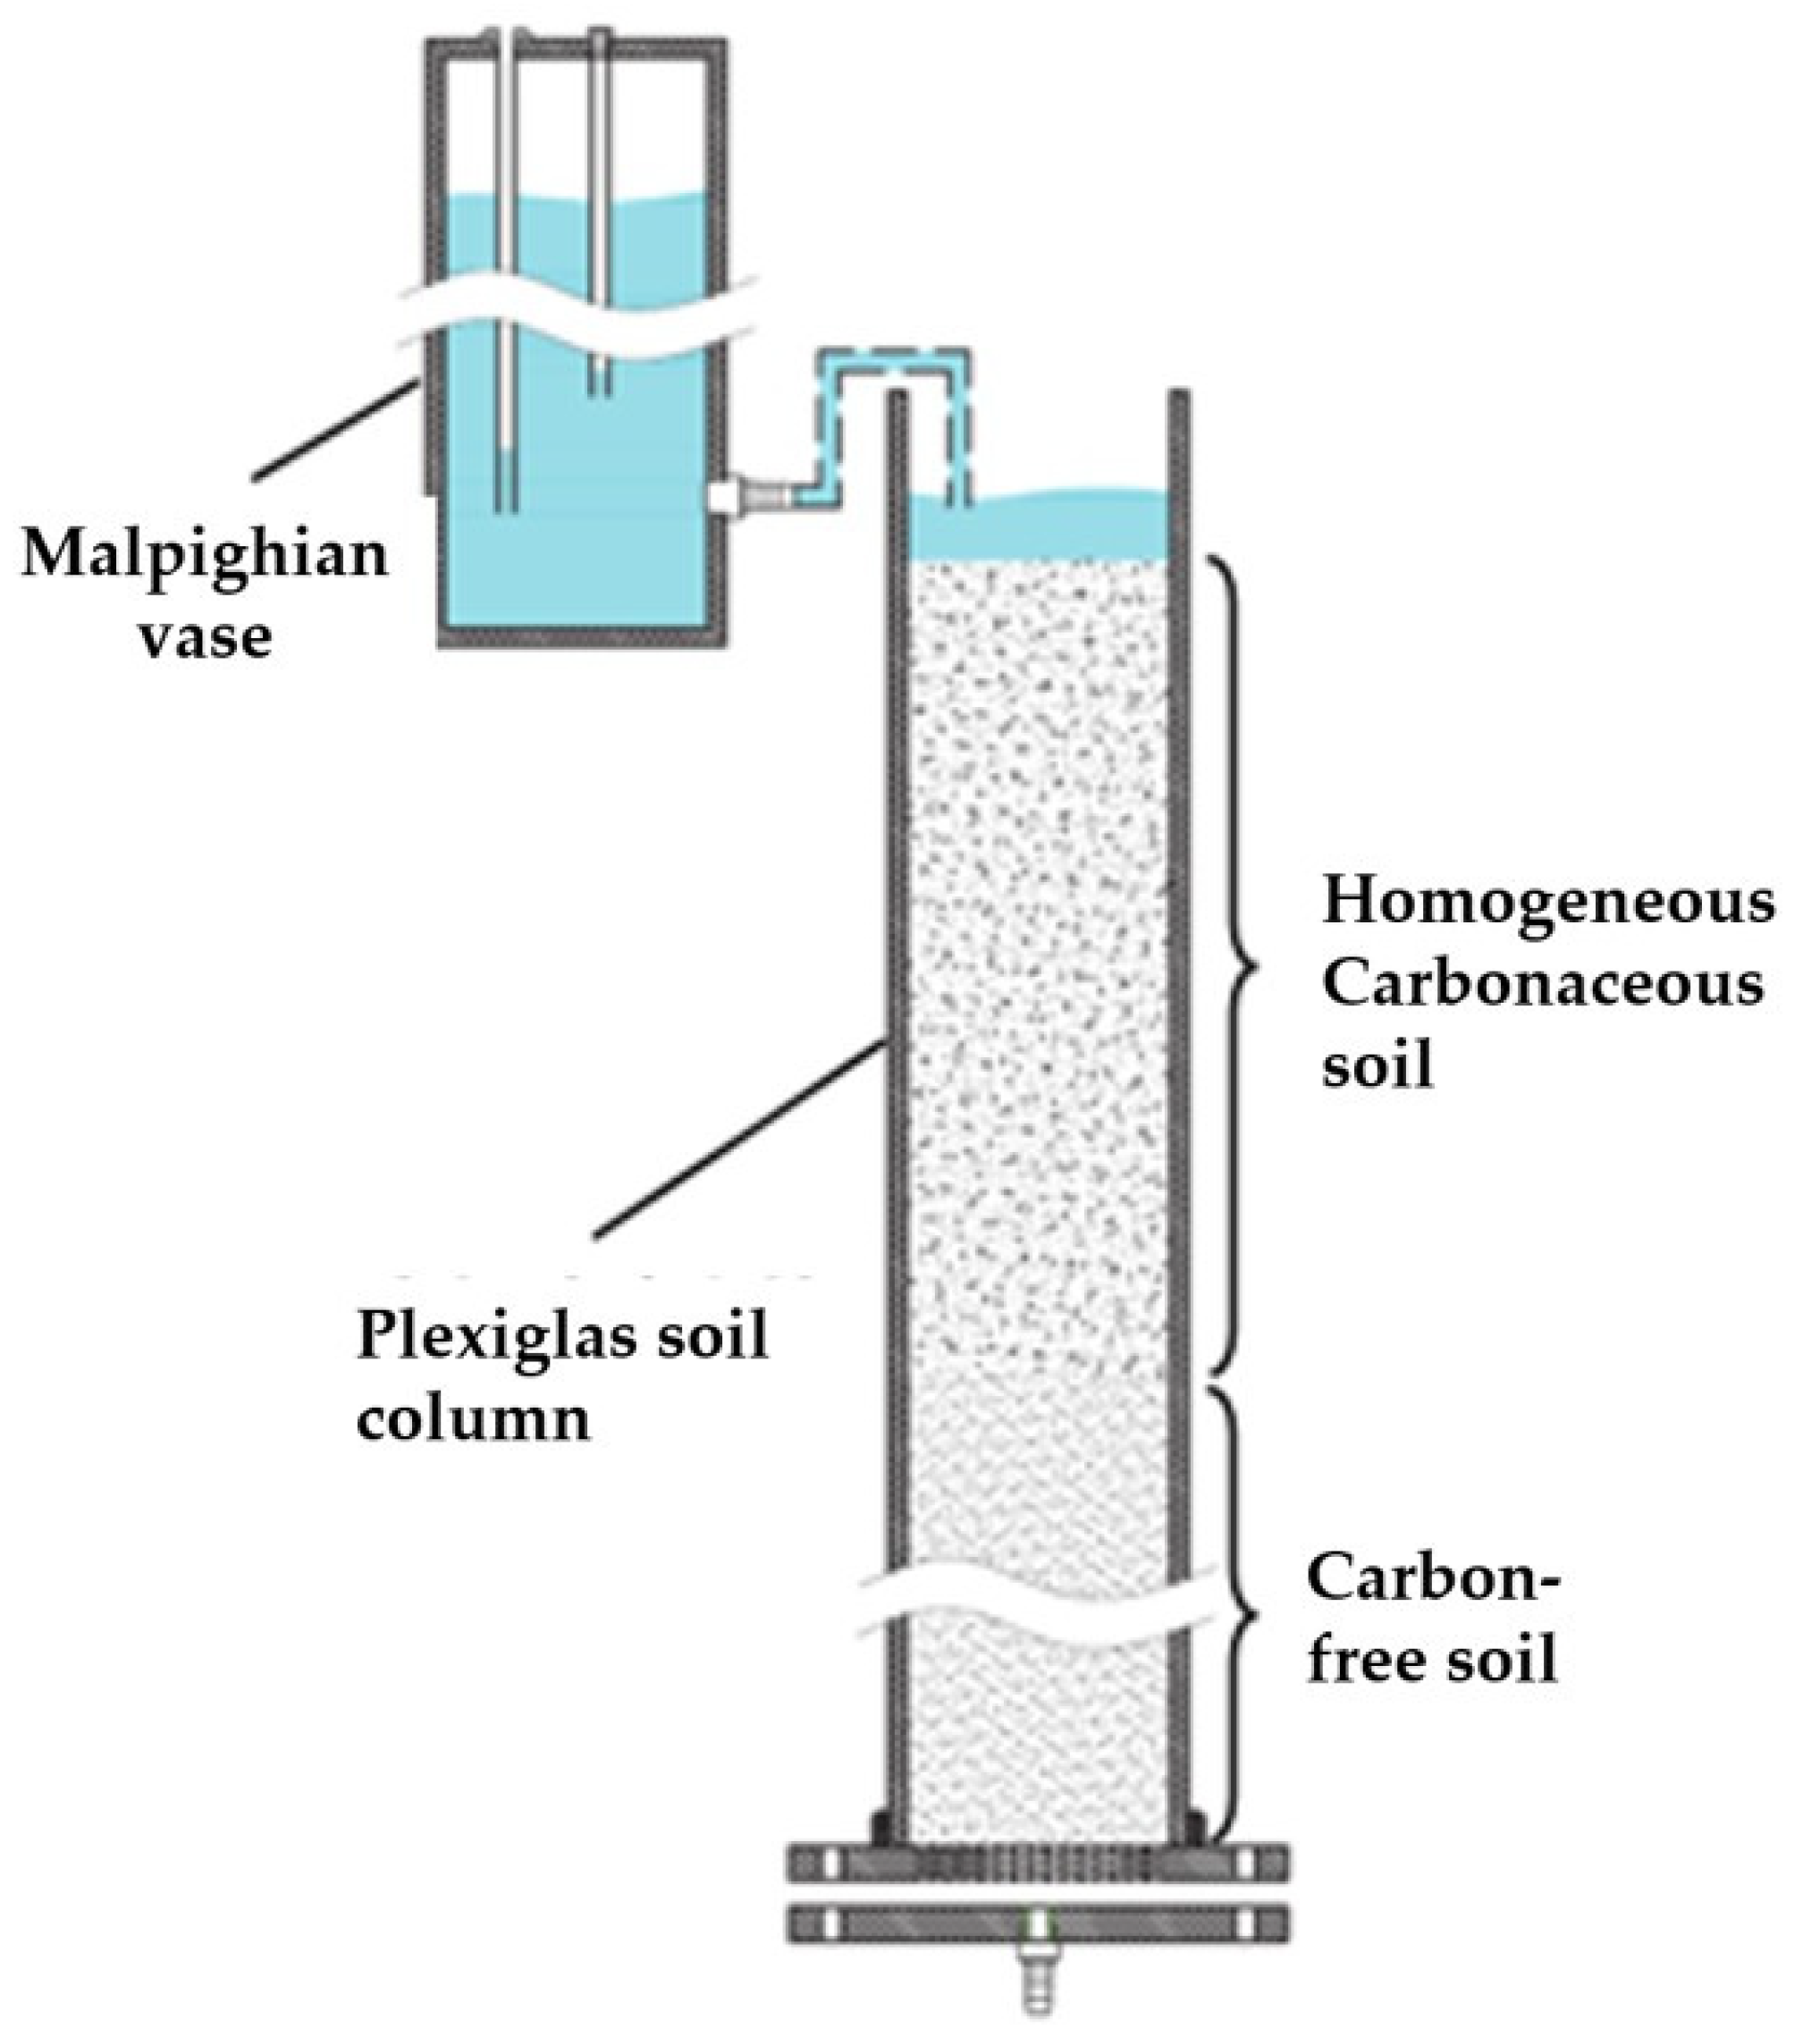
2.3.5. Soil Infiltration Modeling

In this study, a soil water infiltration model under the influence of different biochars was established based on the Philip model, Green-Ampt model, and Kostiakov model fitted to the measured data. Then the distribution pattern of soil water infiltration parameters was obtained. The specific expressions are as follows:
The Philip model:
i P = 0.5 S t 0.5 + A
where i P represents the soil infiltration rate, cm/min; S represents the soil absorption rate, cm/min; t represents the infiltration time, min; and A is the constant, cm/min.
The Green-Ampt model:
i G = K s h 0 + h f + Z f / Z f
where i G represents the soil infiltration rate, cm/min; K s represents the characterized saturated hydraulic conductivity of the soil, which depends on the degree of influence of soil-confined air on infiltration, cm/min; h 0 represents the depth of water ponding on the soil surface, cm; h f represents the suction at the wetting front surface, cm; and Z f represents the probability wetting front depth, cm. The depth of the generalized wetting front can be determined from the cumulative infiltration, which is calculated as follows:
I = θ s θ i Z f
where I is the cumulative infiltration volume, cm; θ s is the saturated soil water content; and θ i is the initial soil water content, cm3/cm3.
The most common way of applying biochar today is to homogeneously mix it with soil 0–20 cm below the soil surface in the field. The infiltration of irrigation or rainwater in the soil profile where biochar is applied involves a process of infiltration between different layers, from the biochar–soil mixture layer to the homogeneous soil layer. The presence of different soil layers has an obstructive effect on the downward flow of infiltrating water, and the whole infiltration process is divided into two stages: the non-linear infiltration stage transitions into the linear steady infiltration stage, and at the transition between the two stages, there is an interfacial suction between the layers, S m . According to the expression of the Green-Ampt model (Equation (4)), the wetting front advances to the interlayer transition, Z f Z ,   K θ K ( θ ) ,   h f S m , and, thus, the expression for the steady infiltration rate is the following:
i G = f p = K θ h 0 + S m / Z + 1
where f p denotes the infiltration rate after infiltration stabilization (steady infiltration rate), cm/min; K θ denotes the approximate saturated hydraulic conductivity of the soil, cm/min, and the value of constant A in the Philip model can be equated to the value of K θ ; S m denotes the value of interfacial suction determined by the difference in the properties of the upper and lower two layers of the different soils, cm; and Z represents the depth of the upper layer of the soil, cm.
Equation (6) is converted to give an expression for the interfacial suction value S m as follows:
S m = Z f p / K θ 1 h 0
The Kostiakov model:
i K = a t b
where   i K denotes the soil infiltration rate, cm/min; a is a parameter indicating the average infiltration rate at the beginning of the soil infiltration stage; and b indicates the speed of change in the soil infiltration rate with time.
The formula for calculating the saturated hydraulic conductivity of the measured soil is as follows:
K s = ( V / t A ) · ( L / H )
where K s is the saturated hydraulic conductivity of the mixed medium, cm/min; V is the volume of flow from the soil column, cm3; t is the infiltration time, min; A is the cross-sectional area of the soil column for the test, cm2; L is the length of the soil column for the test, cm; and H is the head of accumulated water, cm.

2.3.6. Convective Dispersion Equation Fitting

The convective dispersion equation applicable to conservative solutes under one-dimensional saturated steady flow conditions was used to fit the analytical solute penetration process with the following expression:
R C r t = D 2 C r x 2 v C r x C o n t r o l   c o n d i t i o n s C r x , 0 = 0     I n i t i a l   c o n d i t i o n s D C r x + v C r x = 0 + = V C 0 B o u n d a r y   c o n d i t i o n
where D denotes the hydrodynamic dispersion coefficient, cm2/h, and R is the retardation factor, and since Cl in principle does not react in the soil and the adsorption correlation with negatively charged soil particles is small, R takes the value 1. v is the average pore flow rate, cm/h; C r is the residual soil concentration, mol/L; C 0 is the initial concentration of the transport solution (mol/L); and t is the transport time, h. x is the transport distance, cm.
Soil solute penetration curves were fitted and analyzed using the convective dispersion equation (CDE) in the CXTIFIT 2.1 software [30]. The following relationship exists between the hydrodynamic dispersion coefficient and the dispersion degree under one-dimensional infiltration conditions:
D = D 0 τ + λ v n
where D 0 denotes molecular diffusion coefficient, cm2/h; τ denotes tortuosity, %; D 0 τ denotes ionic diffusion coefficient, cm/h; λ denotes dispersivity, cm; and n is an empirical parameter, which is approximately equal to 1 under saturated soil conditions. In the actual process of solute penetration, the diffusion of ions is much smaller than the dispersion and therefore negligible so that the dispersion can be simplified as follows:
λ = D / v

2.4. Data Processing and Analysis

In this study, the experimental data were processed using Microsoft Excel 2021 and SPSS 22.0, and the data were graphed using Origin 2021 and R. The Mantel test was carried out using the R built-in package (linkET), and the infiltration parameters were modeled using Microsoft Excel 2021, and the infiltration curves were fitted and analyzed using the convective dispersion equation (CDE) in the CXTIFIT2.1 software, which was used to fit the soil solute penetration curves. Multifactor analysis of variance (ANOVA) and least significant difference (LSD) were used to analyze multiple comparisons of the significance of differences between the factors and levels (between/within groups) and to resolve hypotheses for statistical tests (significance level: p < 0.05).
Three indicators, such as root mean square error (RMSE) and coefficient of determination (R2), were used to analyze the experimental data error and the accuracy of the fitted data. Among them, the smaller the RMSE value and the closer the R2 is to 1, the higher the accuracy of the model fitting results. The specific calculation formula is as follows:
R M S E = 1 m i = 1 m O i S i 2
R 2 = 1 i = 1 m O i S i 2 i = 1 m O i O i ¯ 2
where O i are the measured values, S i are the fitted model values, O i ¯ is the mean of the measured values, and m is the number of measured samples.

3. Results and Analysis

3.1. Apparent Properties of Biochars and Mixed Substrates

The results of the electron microscopic characterization of biochars with different structures are shown in Figure 1. As shown in Figure 1a, the BMPs clearly showed a strip-like structure at the scale of 500 μm, and their surfaces were obviously distributed with multilevel pore structures, with pore diameters mainly concentrated in the range of 10–20 μm (Figure 1d), and the pore shapes were regular. Compared to the multi-porous structural features of the BMPs, the particles of the BUPs and BNPs, due to the reduction in the particle sizes by a few thousand times or even more, at the same resolution scale, it was no longer possible to clearly identify the surface features of the independent particles (Figure 1b,c). The average particle sizes of BUPs and BNPs are smaller than the diameter of the pores on the surface of BMPs, and, in the commonly prepared biochar, the pores of the large biochar particles may be mixed with some small-sized biochar particles, resulting in a more complex pore structure characterization on the surface of the biochar. By increasing the resolution scale of the electron microscopy observations, it can be found that the particles of BUPs and BNPs have an irregular block structure (Figure 1e,f). Through the use of SEM with higher resolution scales, the existence of the morphology of the small particles of biochar is more significant, and the irregular morphology of the particles of BUPs exist independently or a small part of them are agglomerated, presenting a graphite-like lamellar structure.
In contrast, the particles of BNPs mainly exist in agglomerated form, presenting a nano-fragmented crystalline structure. Figure 2 shows electron micrographs of the apparent morphology of the mixed media of biochar and soil. From Figure 2a, the soil particles had an irregular blocky structure with a rough surface and more porous structure (Figure 2b). Figure 2c shows the comparison of the external morphology of BMPs and soil particles. In the sampling comparison area, the size of BMPs was larger than that of normal soil microaggregates (diameter < 0.25 mm), and there was no adhesion between BMPs, soil particles, and microaggregates. In contrast to the BMPs, the contrast between the BUPs and BNPs and the surrounding soil particles was not obvious (Figure 2d,e). The particle sizes of the BUPs and BNPs were small, which was similar to that of the smallest particle size unit of the soil particles, and it was not possible to distinguish the morphology of the biochar particles at an observation scale of 50 μm. By performing observations at a higher-resolution scale, the BUPs and BNPs and the soil particles are were seen to be in the state of mutual adsorption (Figure 2f,g). The BUPs had a small amount of soil particles attached to their surface, while the BNPs, due to their smaller particle size, formed charcoal agglomerates that were interspersed and adsorbed together with the soil particles.

3.2. Effect of the Structural Heterogeneity of Biochar on the Pore Structure Parameters of Biochar–Soil Hybrid Substrates

Other parameters of soil pore structure characteristics can be calculated using the BoneJ module, and the differences in soil pore connectivity (Coo.), anisotropy (DA), fractal dimension (FD), and volumetric porosity ( V P o ) as a function of biochar particle size and application are listed in Table 2. As can be seen from the table, the biochar amendments with different particle sizes had different effects on the characteristic parameters of soil pore structures. Compared to the CK treatment, the three particle sizes of the biochar treatments, BMP, BUP, and BNP, showed an overall tendency to reduce soil porosity. The differences in porosity became more significant as the amount of each application increased (Table 2). In the BMP treatment, soil porosity reached a minimum of 0.715% when the application rate was 1.0%, and soil porosity increased after more BMPs were applied. In the BUP treatment, soil porosity decreased significantly when the application rate exceeded 0.6%, and soil porosity fluctuated after more BUPs were applied. Changes in soil porosity caused by applying BNPs were generally consistent with those caused by applying BUPs in the treatments. Soil’s pore connectivity was significantly lower in all biochar treatments than in the control treatment.
Furthermore, an overall trend of decreasing connectivity was observed with increasing amounts of biochar applied to different structures (Table 2). The decrease in the values of DA indicates that the vertical permeability of the BUP and BNP treatments was greater than that of the original soil and that the BUP and BNP amendments increased the infiltration capacity of the soil pores. In contrast, the BMP treatments did not show a similar characterization. From the comparison results of the soil fractal dimension, the values of FD did not show obvious differences, indicating that the geometric characteristics of the soil pore space improved by the three different structures of biochar did not change significantly. As the amount of biochar increased, the value of V P o showed a decreasing trend, indicating that the more biochar was applied to the soil, the more the soil pore space was ‘invaded’, leading to a gradual decrease in the soil’s porosity.

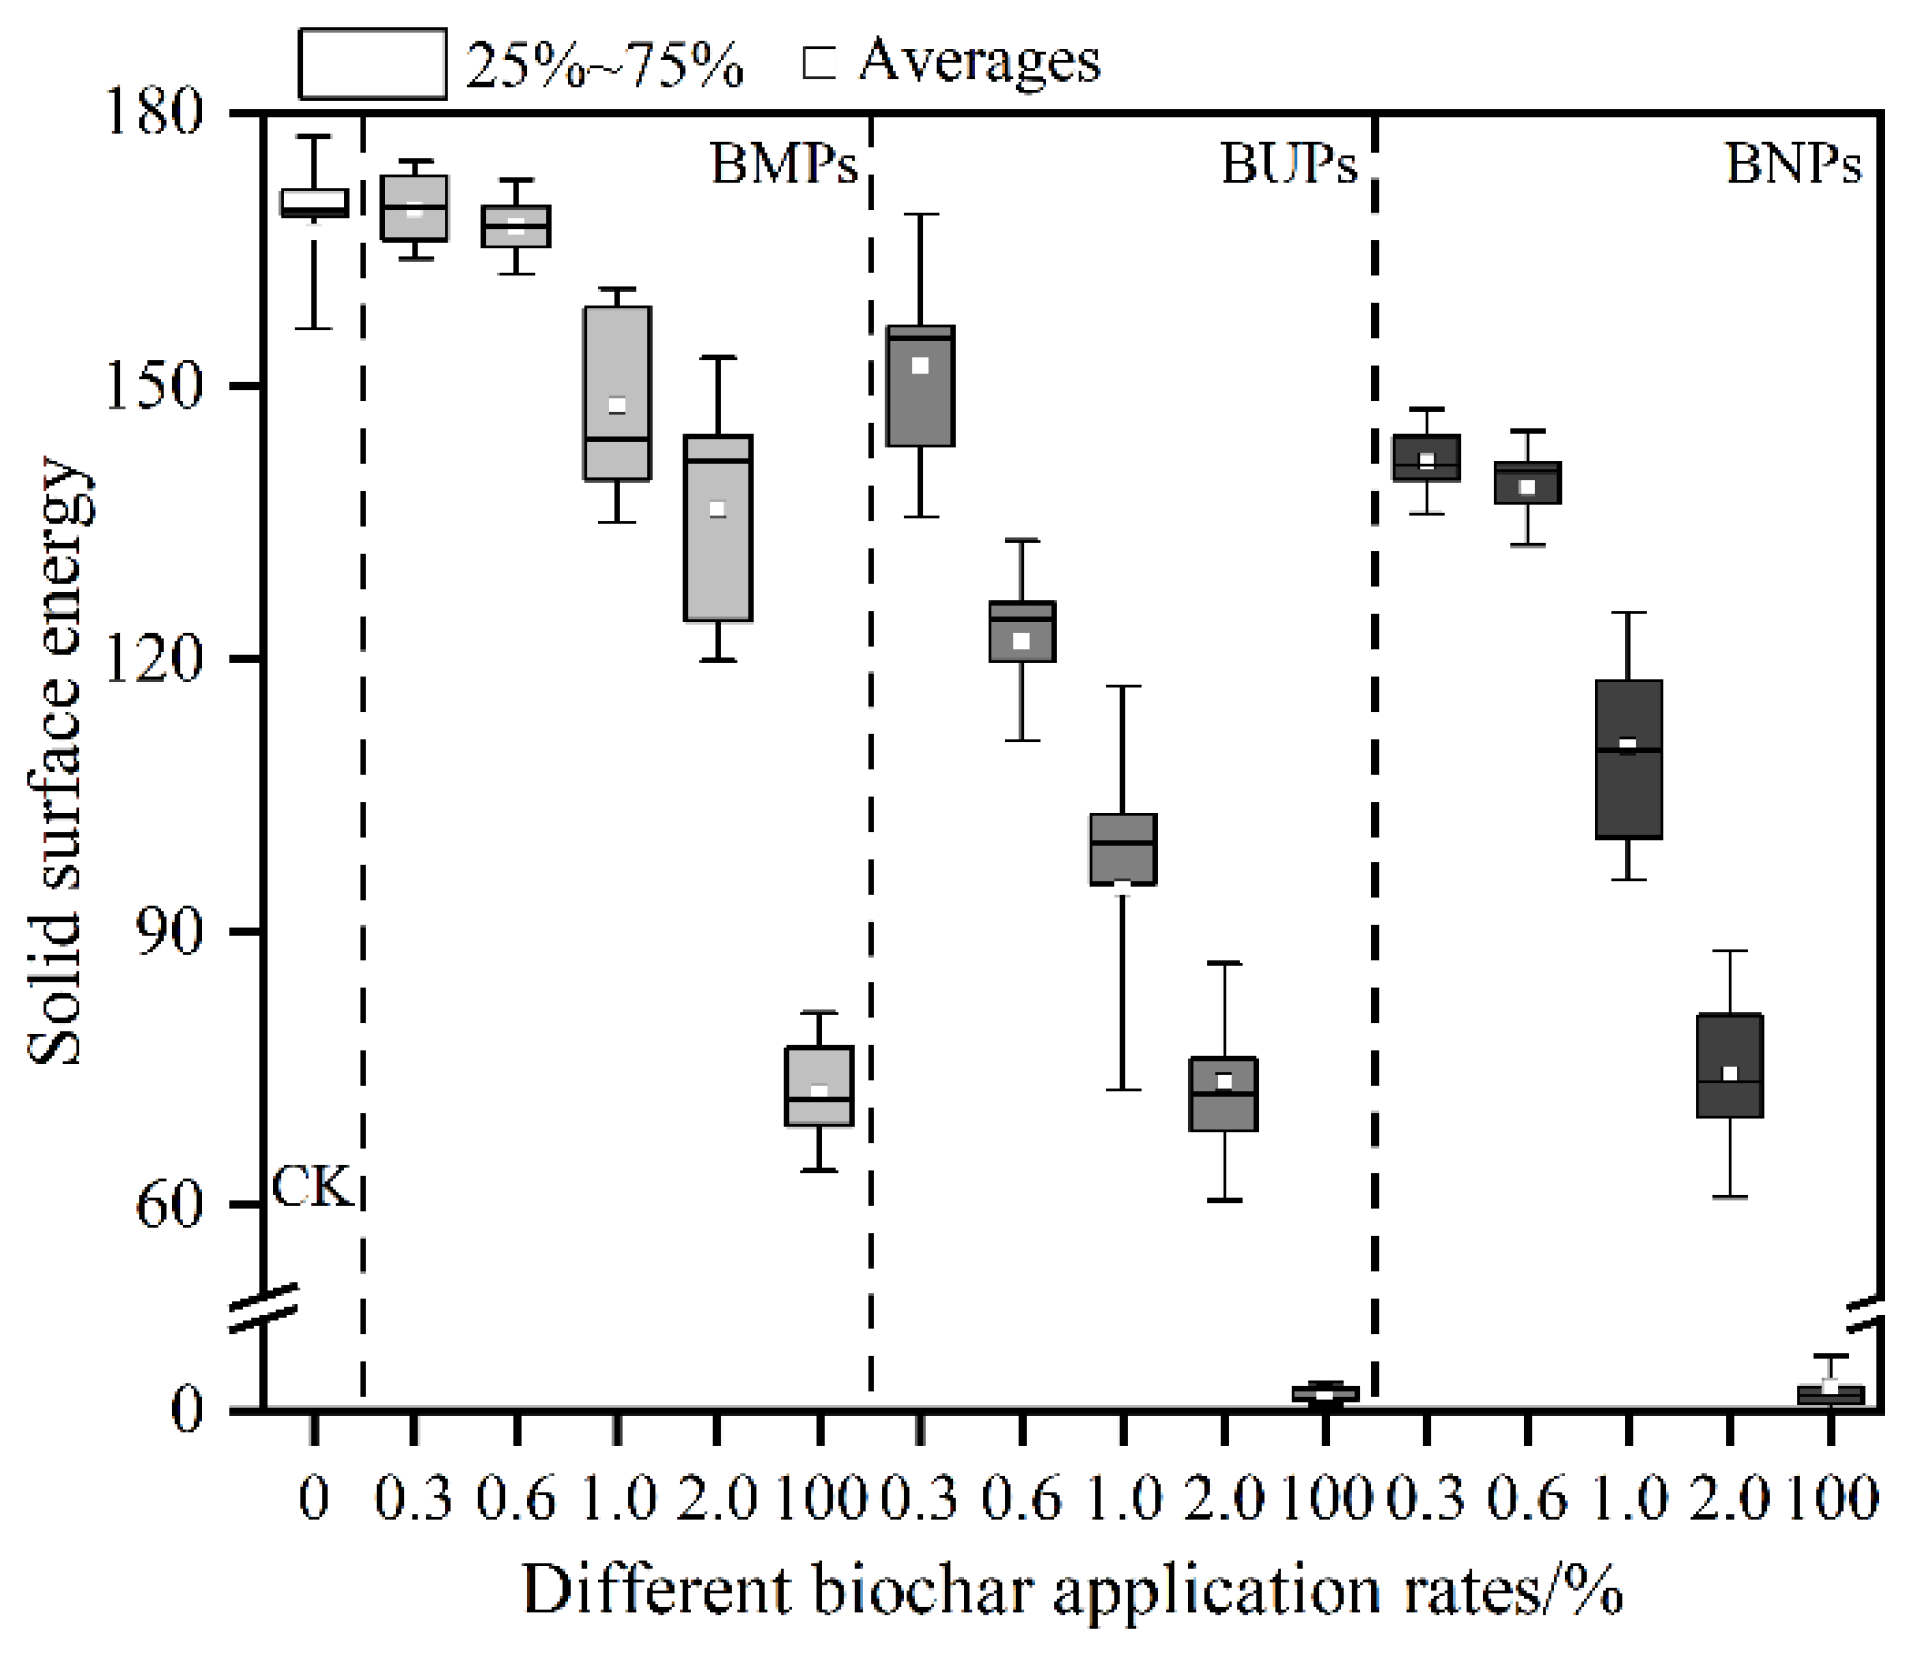
3.3. Effect of the Structural Heterogeneity of Biochar on the Water Repellency of Soil and the Surface Energy of the Solids

Figure 5 shows the contact angle values of different types and application amounts of biochar–soil hybrid media. The figure shows that the contact angle of BMPs is less than 90°, which is a hydrophilic material, while the contact angle of both BUPs and BNPs is more than 120°, which shows strong hydrophobicity. The solid surface energies of the different biochar particles were calculated based on the Fokes model (Figure 6), and the solid surface energies of the biochar particles decreased as the particle sizes decreased. The changes in hydrophilicity and hydrophobicity due to the different particle sizes of the biochars are mainly due to the changes in their hydrophilic functional groups. The surface of BMPs contained abundant hydrophilic functional groups such as -OH, -CHO, -COOH, etc. As the particle sizes of the biochars decreased, the hydrophilic functional groups on their surfaces were gradually reduced or even disappeared, resulting in the original hydrophilicity of the large biochar particles being transformed into the hydrophobicity of the small biochar particles. The improved chalky clay soil showed strong hydrophilicity (Figure 5). The contact angle values increased after applying BMPs to the soil, but fell into the stronger hydrophilicity category. The contact angle values increased rapidly after the application of BUPs and BNPs to the soil, and the contact angle values of the mixed media were close to the cut-off values of hydrophilicity and hydrophobicity when the amount of each was 2.0%, and the BUPs and BNPs were not conducive to the hydrophilic development of the soil particles.

3.4. Effect of the Structural Heterogeneity of Biochar on Soil’s Hydraulic Parameters

The hydraulic parameters of the three different structures of the biochar-amended soils are shown in Table 3. Among them, in the BMP-application treatment, the SSHC (Ks) decreased continuously with the increase in the application amount in the smaller application range of 0~1.0%, with the maximum decrease reaching 8.38%, while the soil Ks increased instead of decreasing and was larger than that of the control treatment when the application amount was increased to 2.0%. In the BUP and BNP treatments, soil Ks decreased in 0–2.0%, with maximum decreases of 13.9 and 16.4 (%). In terms of soil θs, all three particle-size biochar treatments increased SSWC θs within a certain application rate range, but there were still some differences. Increasing the application rate of BMPs also resulted in an increase in soil θs, but the difference in increase between application rates was not significant. In contrast, in the BUP- and BNP-application treatments, there was a small increase in soil (θs) in the range of 0 to 1.0% of the application amount, but when the application amount was 2.0%, the soil θs did not increase, but decreased, and its value was lower than that of the treatment with a 0.3% application amount. From the results of the soil field WHC (θf), the application of biochar did not have the same effect on soil θf. In the BMP application treatments, the values of soil θf were taken to increase gradually with the increase in the application amount, and all of them were greater than the control treatment. In contrast, BUPs and BNPs decreased soil θf, and soil θf gradually decreased with increasing applications.

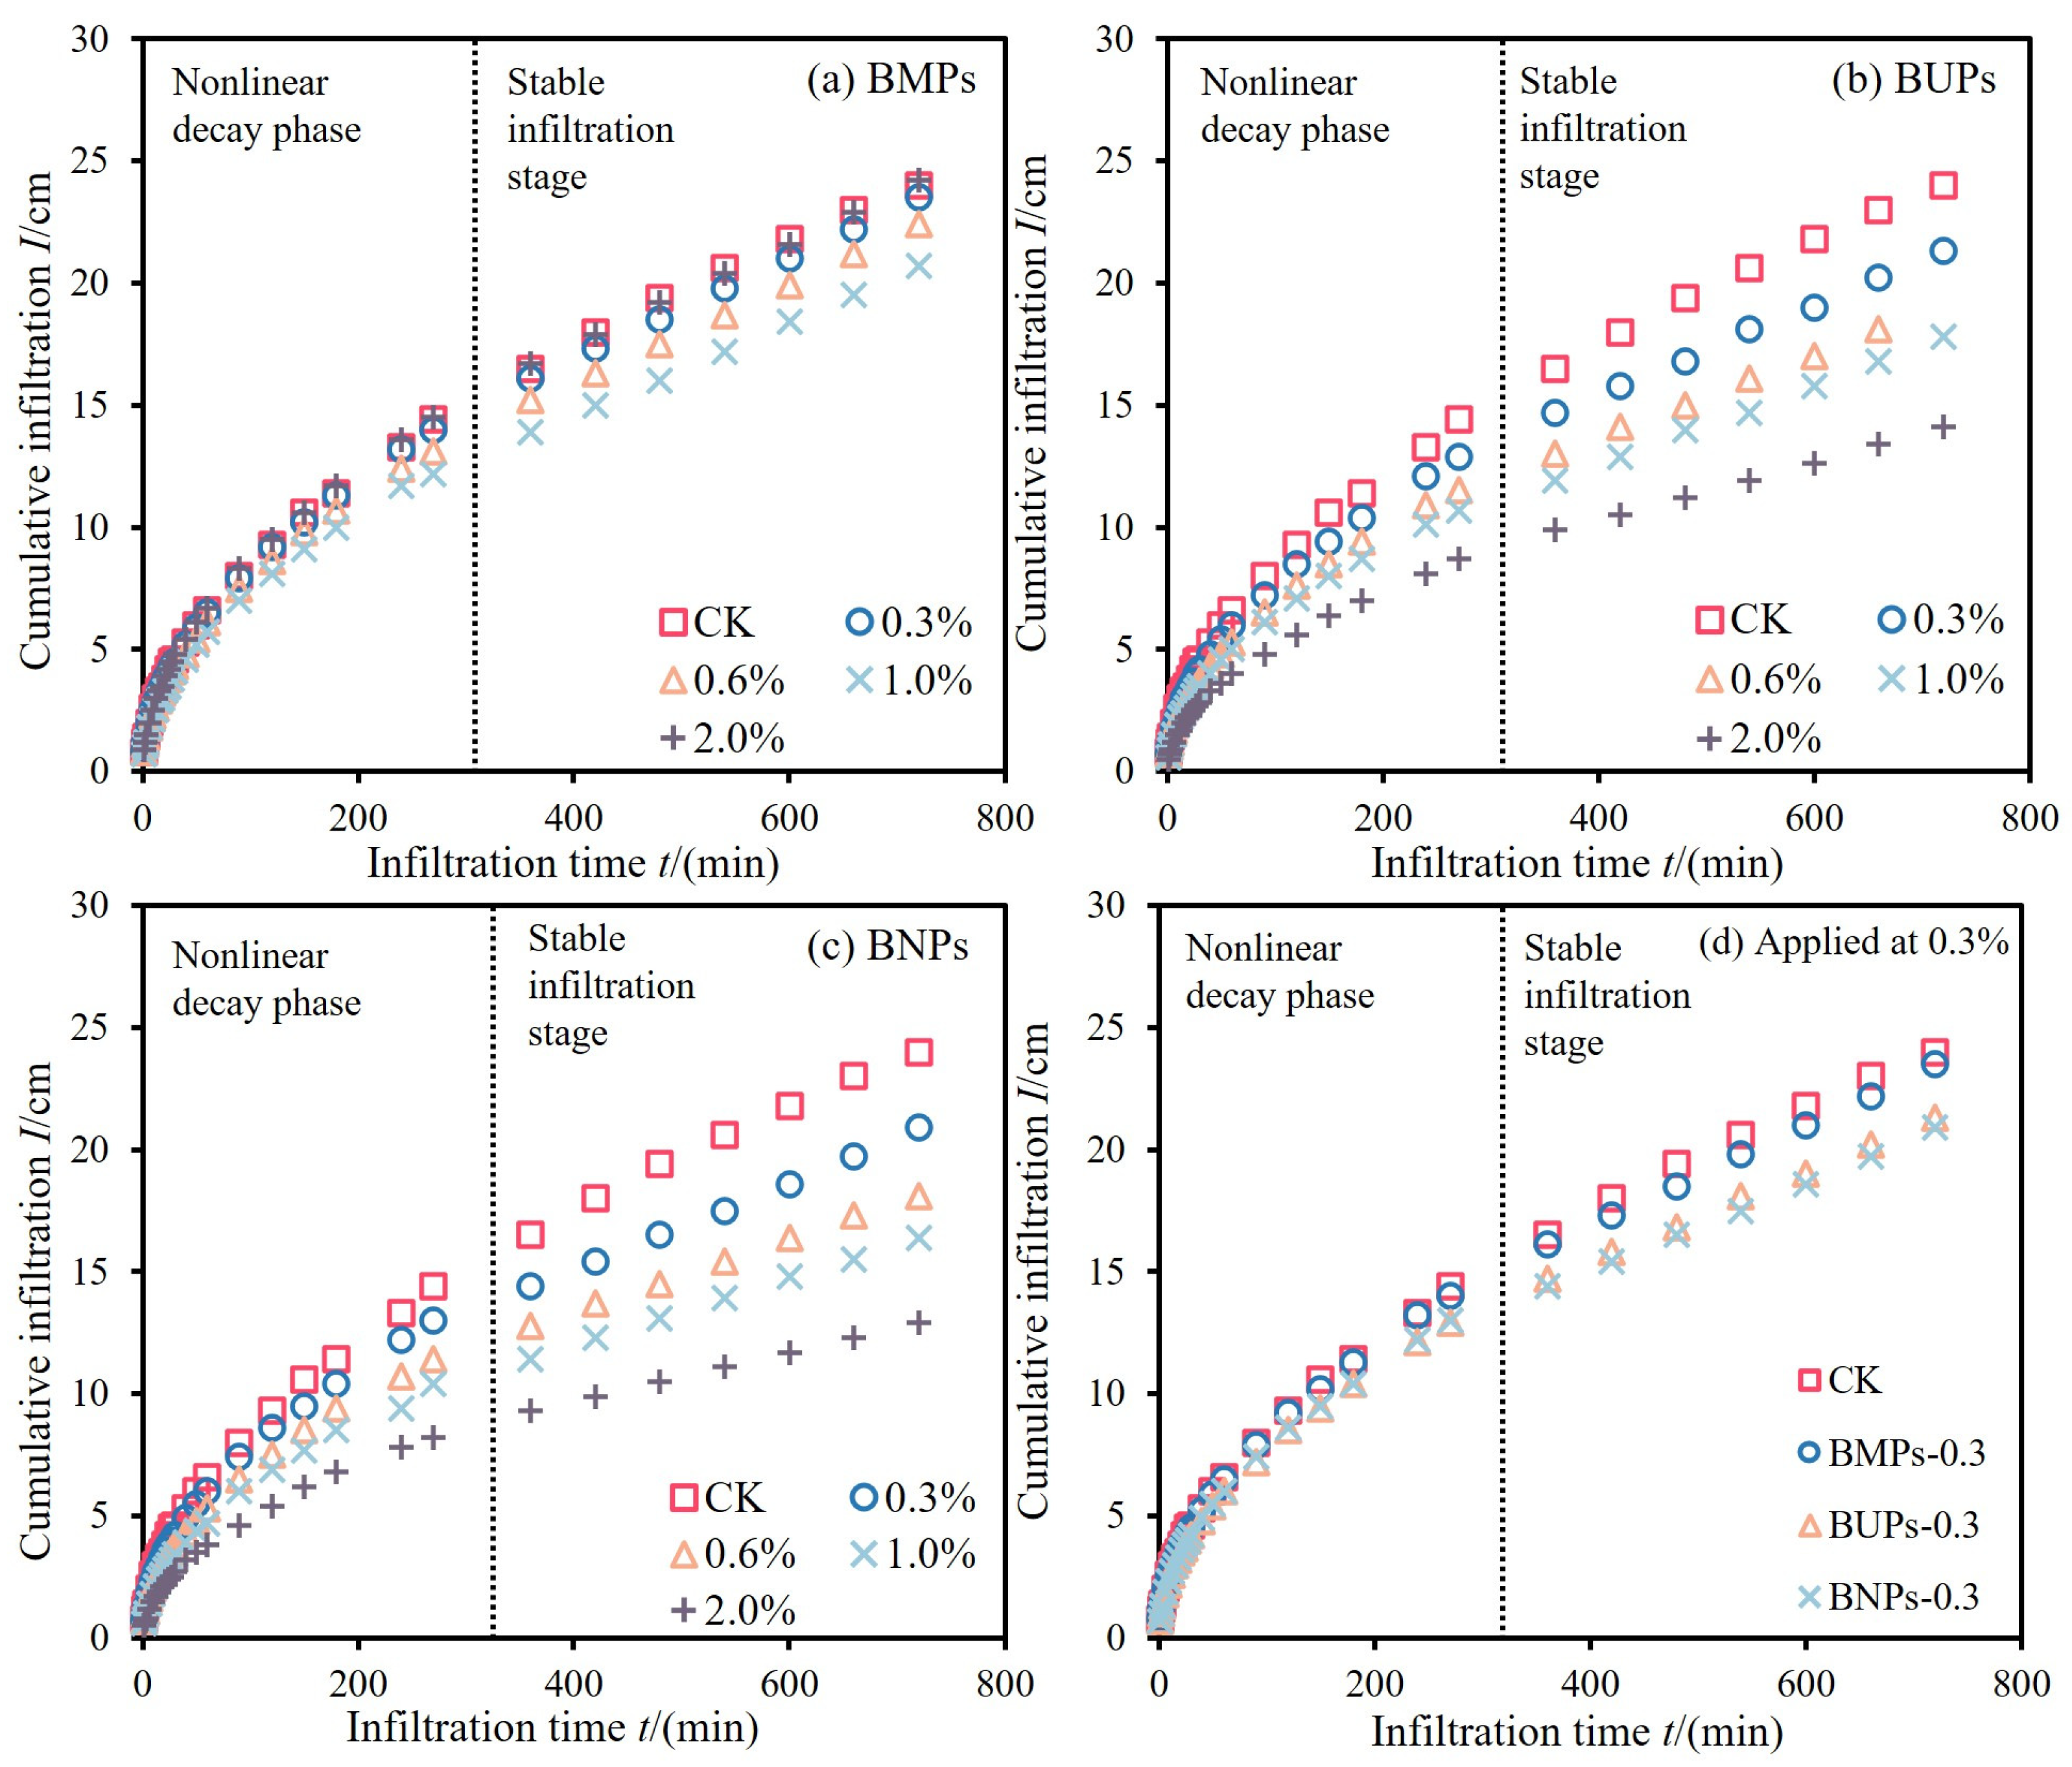
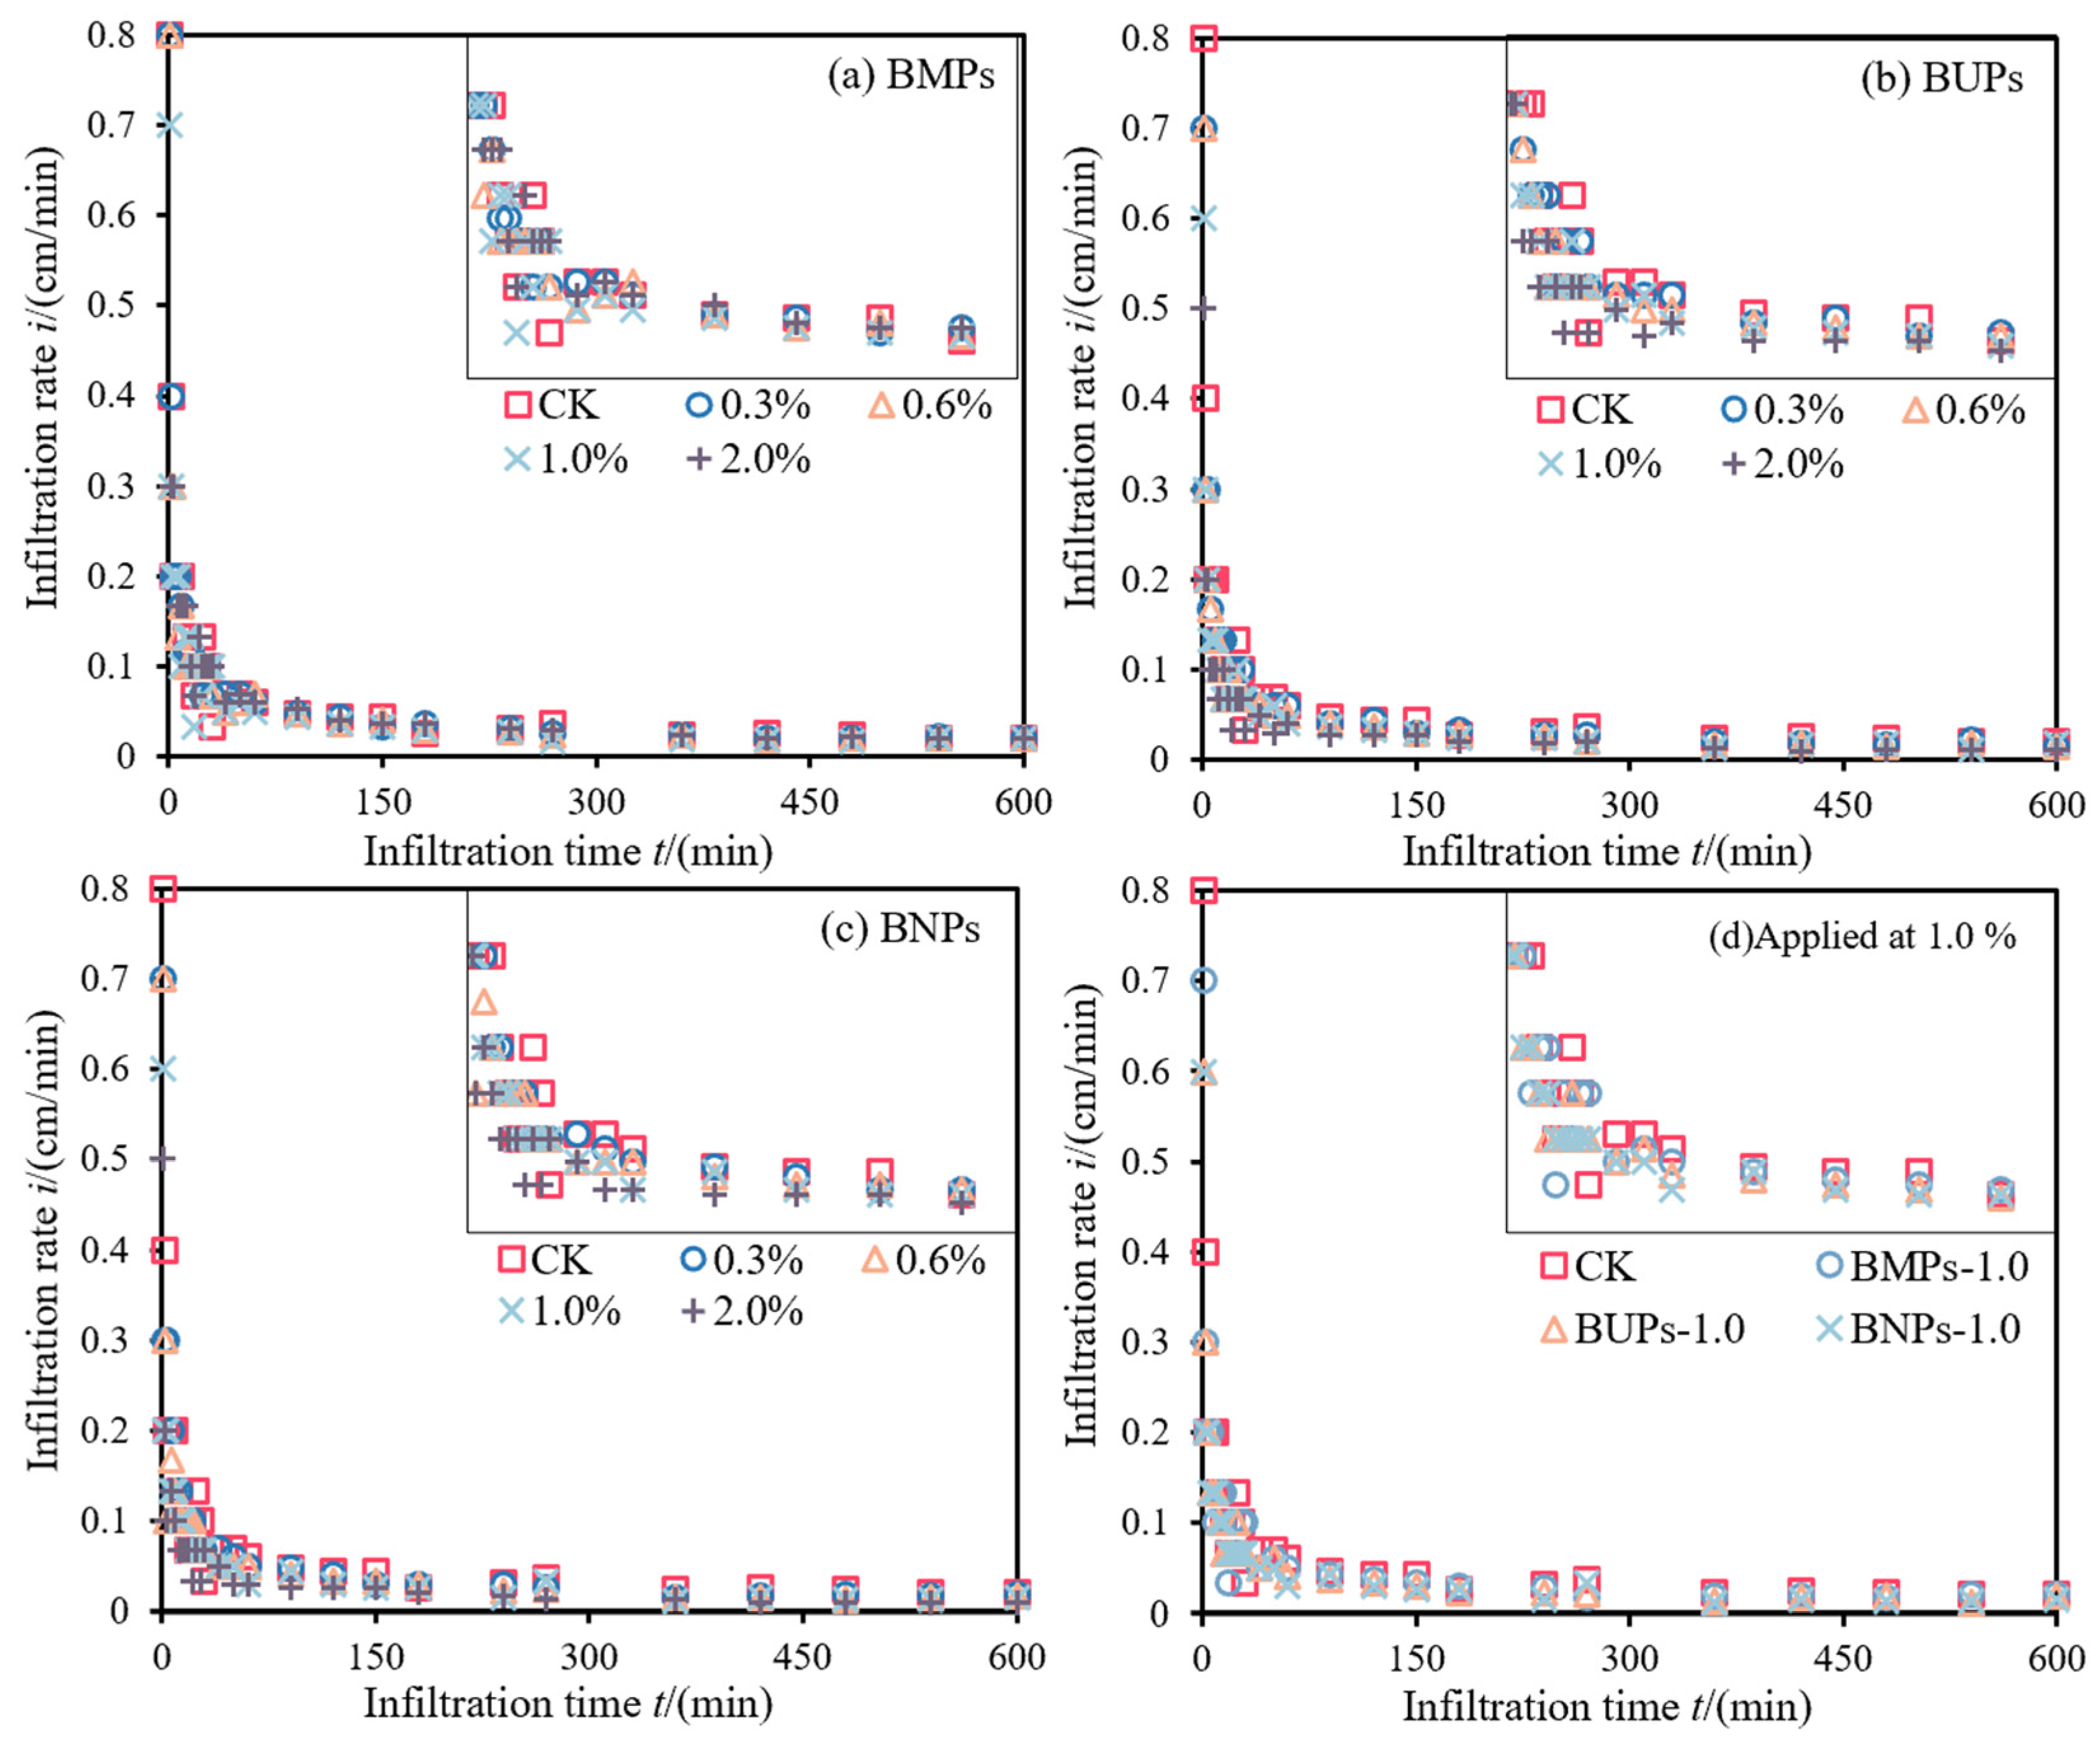
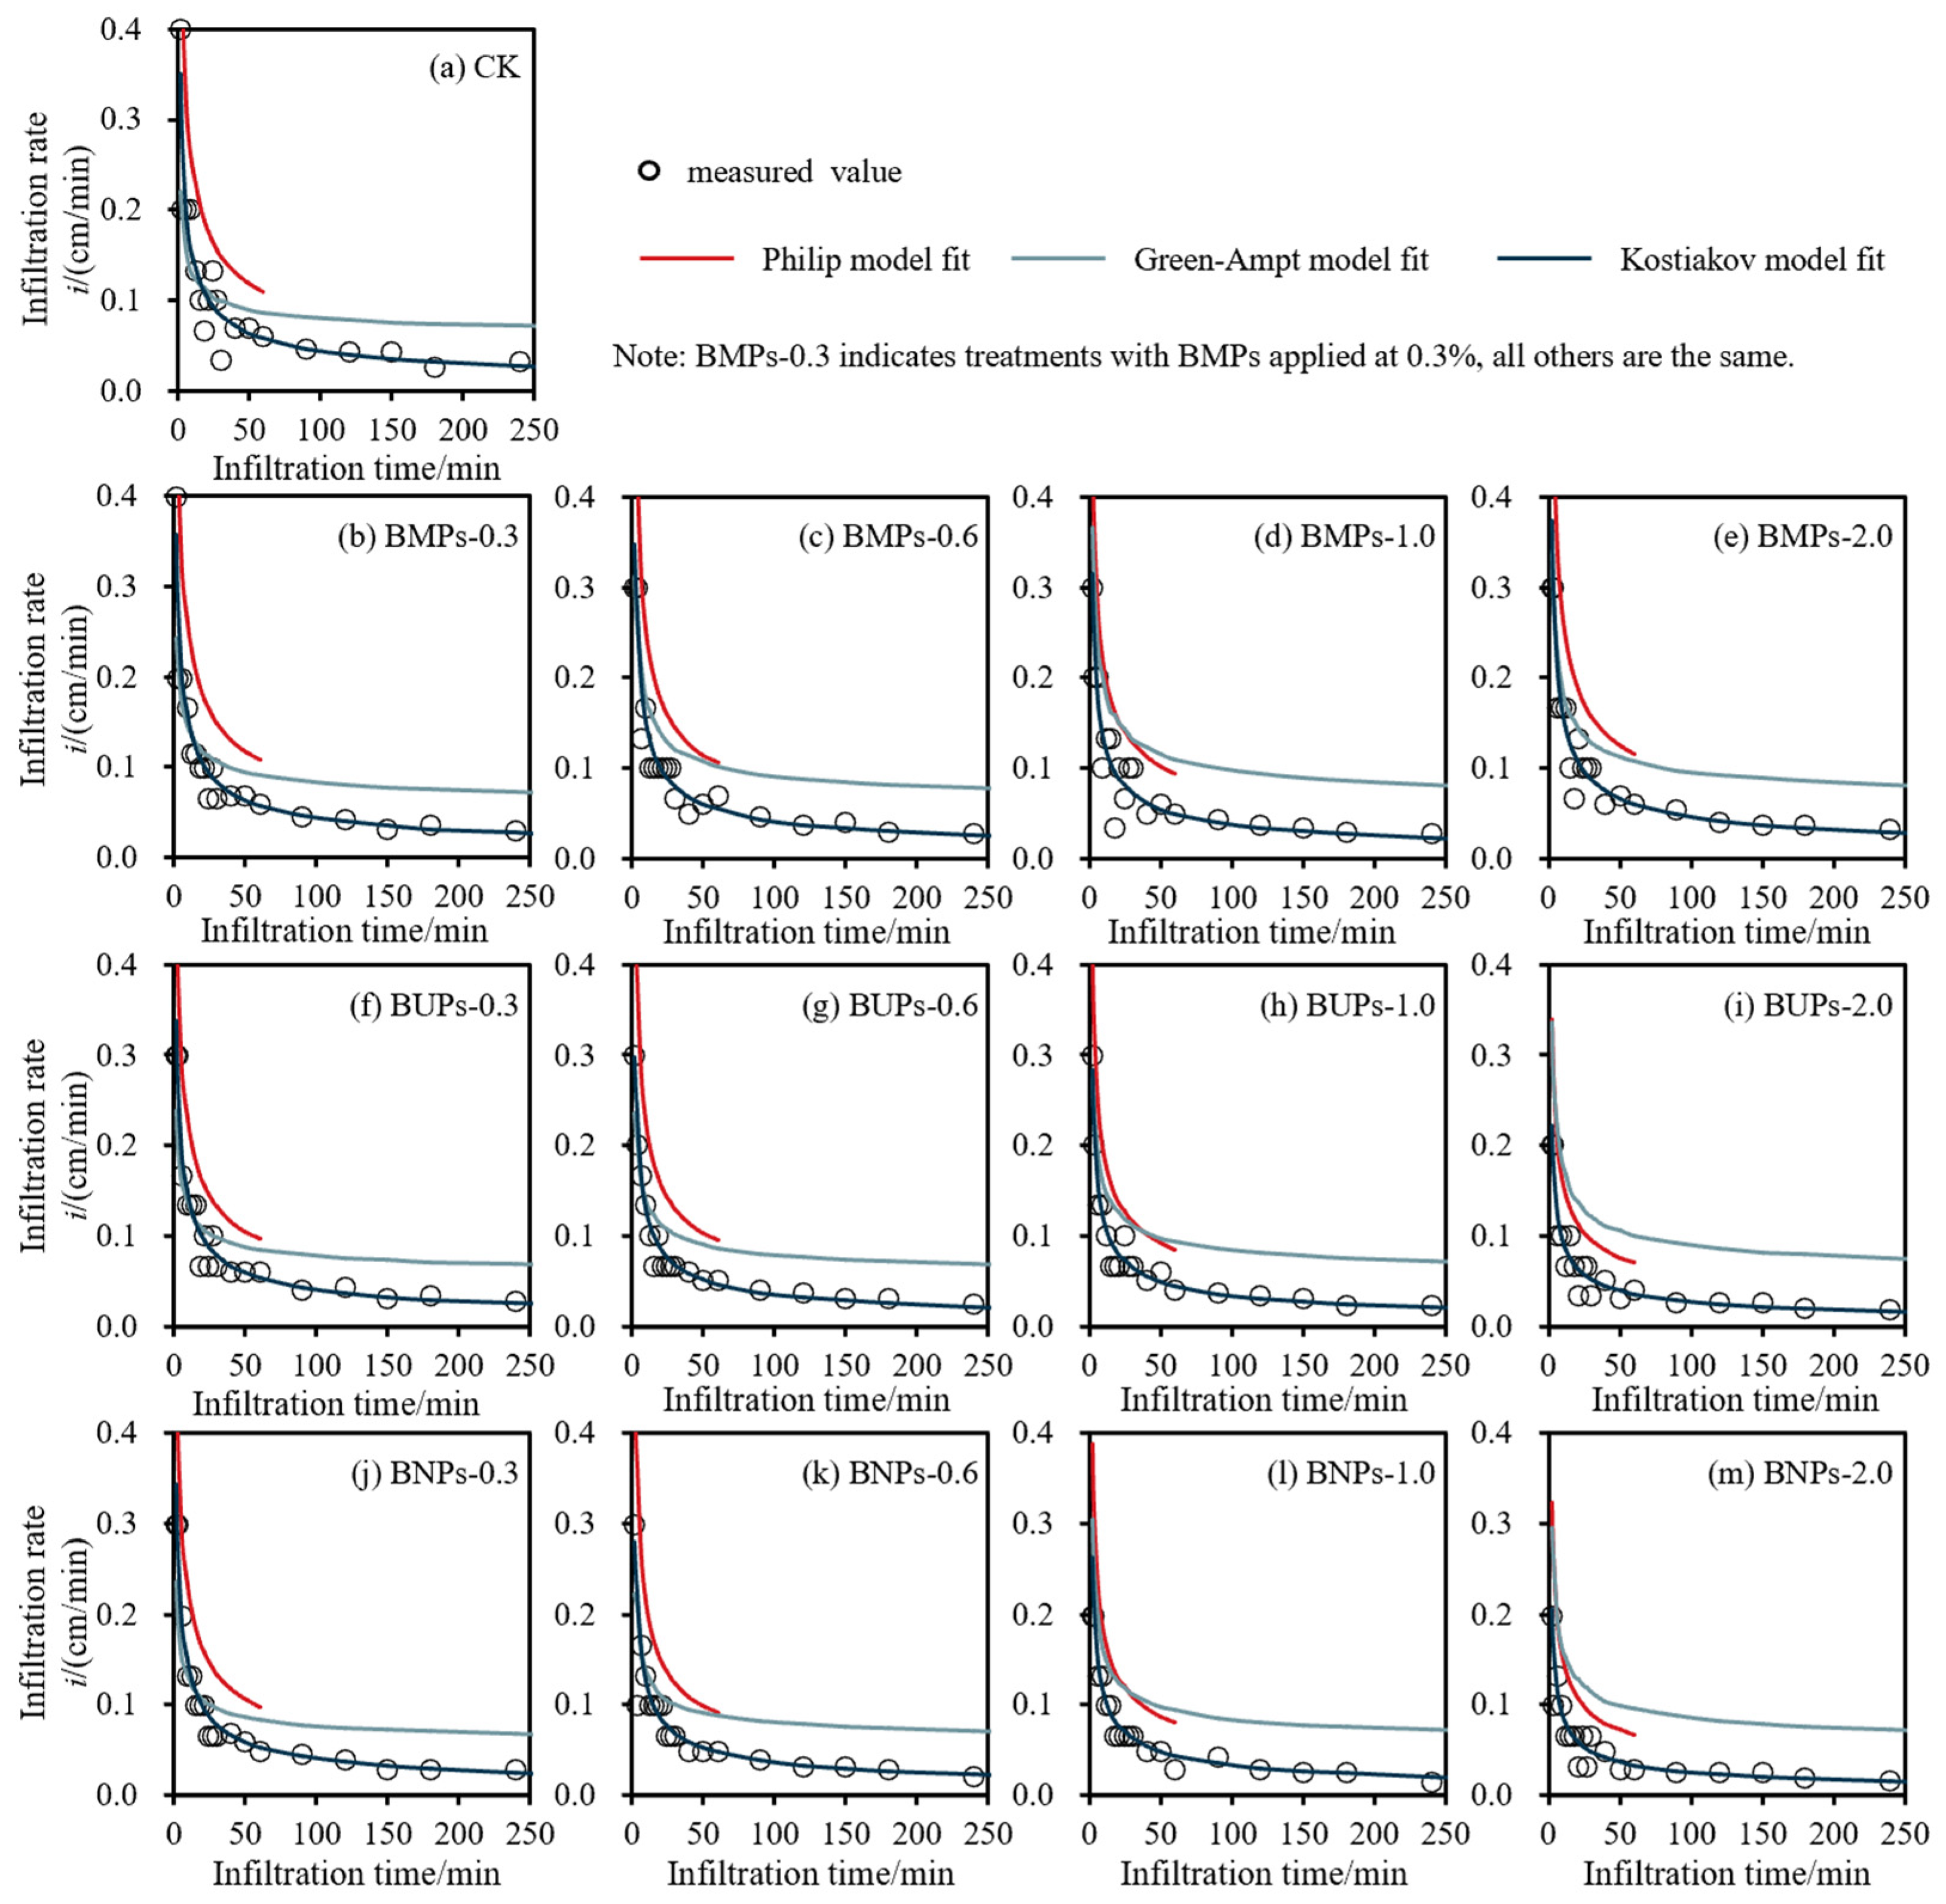
3.5. Effect of the Structural Heterogeneity of Biochar on Soil’s Infiltration Properties

The effects of different biochar structures on cumulative soil infiltration (infiltration time of 720 min) are shown in Figure 7. In the BMP treatment (Figure 7a), cumulative soil infiltration decreased with increasing BMP application (0–1.0%), with a maximum reduction of 13.8% (1.0% BMP). When the application rate was increased to 2.0%, the cumulative soil infiltration did not decrease, but rather increased, and the value was almost the same as that of the control treatment. The relationship between cumulative infiltration and BMP application was similar to the trend of soil Ks, where a moderate amount of BMPs reduced the infiltration of soil moisture, but increasing BMP application to a certain level increased the number of water conducting pores, which, in turn, promoted the infiltration of soil moisture. In the BUP-application treatments (Figure 7b), the differences in cumulative infiltration between application rates were relatively significant, and the cumulative infiltration decreased with the increase in application rate. The cumulative infiltration decreased by 11.3, 20.0, 25.8, and 41.3 (%) with the rise in BUP application amount from 0.3% to 2.0%, and the infiltration reduction in BUP was significant. The BNP-application treatments’ changes, reflected in the cumulative infiltration, were like those of the BUP treatments (Figure 7c), and the cumulative infiltration decreased continuously with the increase in BNP application. When BNPs were applied at 2.0%, the cumulative infiltration was reduced by 46.3% compared to the control treatment, which is better than BUPs regarding infiltration reduction.
The relationship between the soil infiltration rate and infiltration time is shown in Figure 8. The infiltration rate decreases with increasing infiltration time, showing a non-linear decay trend, and it stabilizes at a certain point in time. In the pre-infiltration phase, the infiltration rate was significantly lower in the biochar application treatment than in the control treatment during the rapid decay phase of the infiltration rate, further indicating that biochar application can slow the infiltration of soil moisture. In terms of comparative differences between the different applications, the infiltration rate in the BMP treatment did not show a more obvious distribution pattern, whereas in the BUP and BNP treatments, the infiltration rate decreased with increasing application amount, but did not show a large difference interval. The Philip, Green-Ampt, and Kostiakov models were used to fit the infiltration rate under the influence of different structural biochar applications, respectively, and the results are shown in Figure 8. Since the Philip model for determining the infiltration rate is affected by the timescale and soil structure, it is generally applicable to short-term infiltration, and the soil matrix potential is dominant, and the time reference zone selected in each one-dimensional infiltration process is not unique, but must be determined according to the actual infiltration process. Therefore, in this study, the change in infiltration rate with infiltration time from 0 to 60 min was used to fit the Philip model. Both the Green-Ampt model and the Kostiakov model were fitted and analyzed using the process of infiltration rate change with infiltration time in the range of 0–250 min. The fitting results of the three infiltration models show that the fitting curve of the Green-Ampt model was higher than the measured curve in the middle and later stages, and the fitted value was large, and the fitting results of the Philip model also showed a large fitted value, while the Kostiakov model outperformed the Philip and Green-Ampt models in describing the relationship between infiltration rate and infiltration time, and the fitting curve basically coincided with the measured curve. The fitted curves are in good agreement with the measured curves and the correlation coefficients R2 > 0.91.
The results of the comparative analysis of the fitting parameters of each infiltration model are shown in Table 4 and Figure 9. In the Philip model, the fitting coefficient S reflects the absorption rate of the soil, and the fitting parameter A reflects the steady infiltration rate of the soil. From the fitting results of biochar-amended soils with different structures, the absorption infiltration rate S and the steady infiltration rate A decreased with the increase in biochar application rate. In the BMP application treatment, the infiltration rate S did not continue to decrease after the application amount was greater than 1.0%, but instead increased to greater than the control treatment; this phenomenon was consistent with the change rule of soil Ks, and a BMP application of more than 1.0% would promote the infiltration of soil moisture, which is related to its characteristics of changing the pore structure of soil. In contrast, in the BUP and BNP application treatments, both the absorption rate S and the steady percolation rate A decreased with the increase in the application rate. The Ks obtained from the fitting calculations in the Green-Ampt model show a slight difference due to the application of different structural biochars. In the BMP application treatments, the values of Ks in the interval of 0–1.0% of the application rate decreased with the increase in the application rate, but the difference between the decreasing magnitudes was not significant. At 2.0%, Ks and the control treatment were basically equal, indicating that the fitting effect of Ks in the BMP application treatments reflected by the Green-Ampt model was unsatisfactory and that there was a certain gap between the results and the actual measurements. For the remaining two particle-size biochar treatments, the trend of Ks with applied rate was essentially the same as the measured results. In contrast, the pattern of change in wetting front suction hf with applied amount was significant, with the value of hf increasing significantly with the increase in applied amount and then decreasing below the level of hf in the control treatment when the applied amount was greater than 1.0%, which was similar to the results of the Philip model fitting. In the BUP and BNP treatments, the fitted Ks gradually decreased as the applied amount increased, and the fitted hf increased sequentially with a significant pattern of change. The fitted coefficients, a, in the Kostiakov model reflect the cumulative infiltration in the initial unit time. In both the BUP- and BNP-applied treatments, the value of the fitted a gradually decreased with the increase in the applied amount, while in the BMP-applied treatment, no significant law of change appeared between the value of the fitted a and the applied amount.
For the infiltration characterization of 0–40 cm stratified soils, the difference in the potential energy between the two substrate soils at the stratification interface is key to the overall infiltration of soil water. It is well known that the infiltration process of stratified soils is divided into a non-linear decay phase and a steady infiltration phase, with the boundary between the two being the arrival of the wetting front at the stratification interface (Figure 6). The near-saturated hydraulic conductivity K(θ) involved in Equation (6) can be determined from the results of fitting the infiltration rate over the range 0–20 cm in the Philip model; the value of K(θ) can be taken as the value of the fitting parameter A, and the value of the steady infiltration rate, fp, can be taken as the average value of the infiltration rate over the range 20–40 cm. The interfacial suction force Sm can be calculated using Equation (7) (Table 5), and the value of Sm decreases with the increase in the applied amount (except for an applied amount of 2.0%).

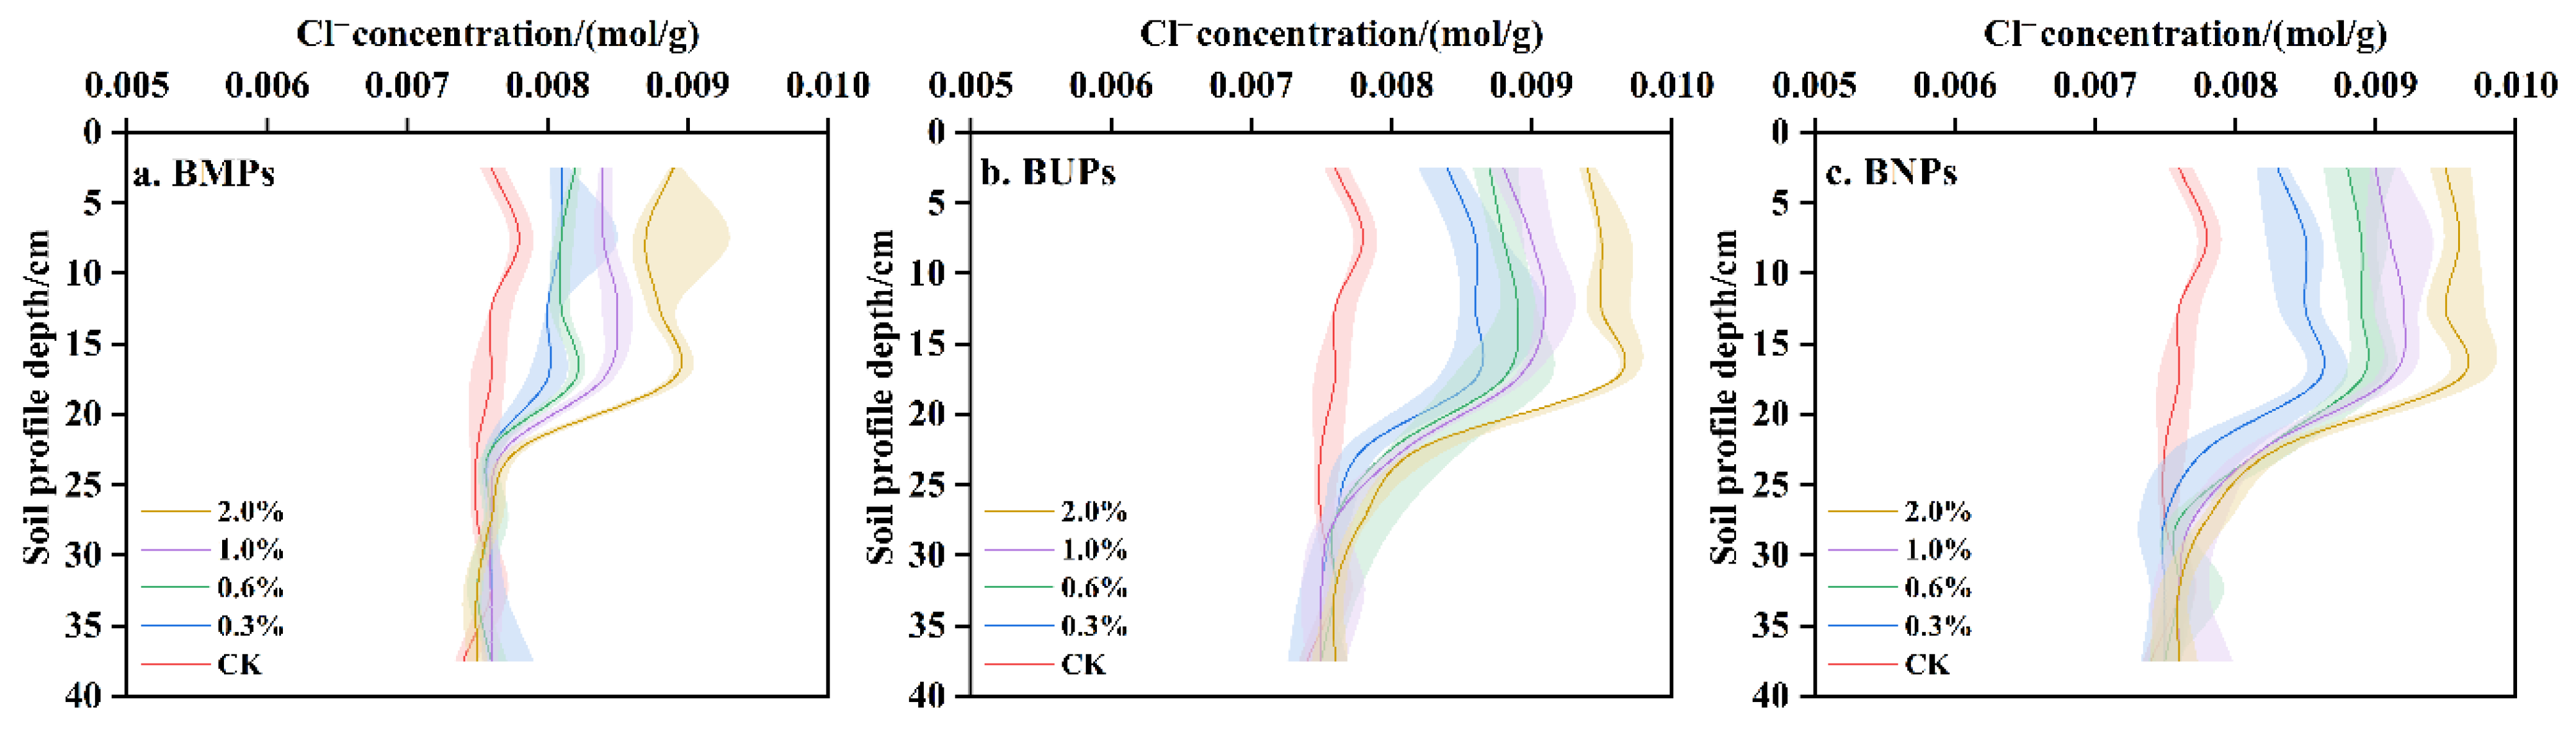
3.6. Effect of Biochar’s Structural Heterogeneity on Soil’s Solute Penetration

Soil solute breakthrough curves (BTCs) reflect the relationship between the relative solute concentration C in the soil column effluent and the number of soil pore volumes T. The BTCs are based on the relative solute concentration C in the soil column effluent and the number of soil pore volumes T in the soil column effluent. Conservative Cl ions were selected as tracer ions in this study to reduce measurement errors due to the chemical reactions of solute ions during migration. Based on the measured results, the Cl penetration curves of each treatment are plotted in Figure 10. As shown in the figure, the pore volume T and relative concentration of Cl in each applied biochar treatment shows a smooth ‘S’ shaped penetration curve between pore volume T and relative concentration of Cl, similar to that of the control treatment in the mean soil. In the control treatment, the effluent volume at initial penetration was less than the individual pore volume.
In contrast, the effluent volume at initial penetration gradually increased with increasing biochar application, and the overall solute penetration curve shifted backward with increasing application. However, differences in biochar particle size were also reflected in the solute penetration curves. In the BMP application treatment, the increasing trend of the relative concentration C with the increase in the pore volume number T gradually slowed down with the increase in the applied amount, and the trailing characteristics of the curves were more obvious. In the BUP and BNP treatments, the increasing trend of the solute penetration curves slowed down significantly, and there was a significant difference between the curves with the increase in the applied amount, and the trailing characteristics of the curves were very substantial. When the applied amount was 2.0%, the pore volume T reached 1.5 at full penetration in the small-particle-size biochar applied treatment. The above results show that different structures of biochar have various degrees of influence on the solute infiltration process.
Figure 11 shows the measured values of Cl concentration at different profile depths in each treatment. As can be seen from the figure, the Cl concentration at the upper and lower positions of the soil column (0–20 and 20–40 (cm)) in the biochar treatments were filled with two types of soil (i.e., the upper layer was biochar-amended soil, and the lower layer was unamended soil), resulting in significant differences in the Cl concentration at the upper and lower positions of the soil column. At 0–20 cm, the Cl concentration was generally higher than that at the lower level due to the addition of biochar, and it increased gradually with increasing applied amount. At 20–40 cm, there was no significant difference in Cl concentration between treatments due to the same soil matrix. The difference in Cl concentration indicates that the biochar-amended soils have certain adsorption properties for Cl. Although Cl belongs to the non-reactive adsorption of inert ions and does not have strong adsorption with the soil matrix, biochar has a large specific surface area and magnetic and other adsorption bases, so it still has a certain adsorption effect for Cl. Moreover, the adsorption amount of Cl in the upper layer of biochar-amended soils with different structures differed, and the adsorption capacity of the amended soil for Cl increased with the decrease in the particle size of biochar.
Soil solute penetration curves were fitted and analyzed using the convective dispersion equation (CDE) using CXTIFIT 2.1 software (Figure 9). Table 6 presents the results of the CDE equations fitted to the solute penetration curves of soils amended with different biochar structures, as well as the changes in the fitted solute penetration parameters. As can be seen from the table, the correlation coefficients R2 between the fitted results of the CDE equation and the measured results in each treatment were all greater than 0.99, and the SSQ << 1, indicating that the CDE equation can better describe the process of Cl penetration in soil columns under the influence of biochar with different structures. From each of the fitted solute penetration parameters in the table, biochar application delayed the initial penetration time t1 and the total penetration time t2 of Cl, which was reflected in all three biochar application treatments with different particle sizes, and the penetration time increased with the applied amount. The average pore water flux v, which refers to the effective water flux of the soil, was reduced after biochar application compared to the control treatment, and gradually decreased with increasing application rate. Among the different structural biochar application treatments, the decrease in v was greatest in the BNP treatment and second greatest in the BUP treatment at the same application rate. The trend in v values with structural differences in biochar is consistent with the results for SSHC Ks in the previous section. Biochar changed the characteristics of the soil’s pore structure, the proportion of water conducting macropores was reduced, and the water flow path in the soil’s profile was more tortuous and complex, which slowed down the average water flow rate in the soil’s pore space, especially in the treatment with small-size biochar. The hydrodynamic dispersion coefficient D represents the solute flux caused by hydrodynamic dispersion, and biochar application increased the value of D. Since the main influencing factors of hydrodynamic dispersion include the soil’s water content and pore water flow rate, biochar application decreased the average soil pore water flow rate and increased the degree of curvature of the hydrodynamic flux path, and, therefore, the mechanical dispersion of Cl was enhanced in the process of moving with soil water. When comparing and analyzing the D values of the three different particle-size biochar application treatments, the D value in the BNP treatment increased the most. The solute dispersion under its influence was the strongest, mainly caused by the changes in the soil’s pore structure characteristics. Dispersity λ indicates the ability of solute dispersion in the pore medium, which is mainly influenced by the pore medium’s average particle size and homogeneity. Consistent with the trend of the hydrodynamic dispersion coefficient, D, biochar application increased the value of λ. Increasing the application rate resulted in a sequential increase in the value of λ, which increased the ability of solutes to fully diffuse in the soil’s pore space. The greatest increase in λ value was observed in the BNP treatment.

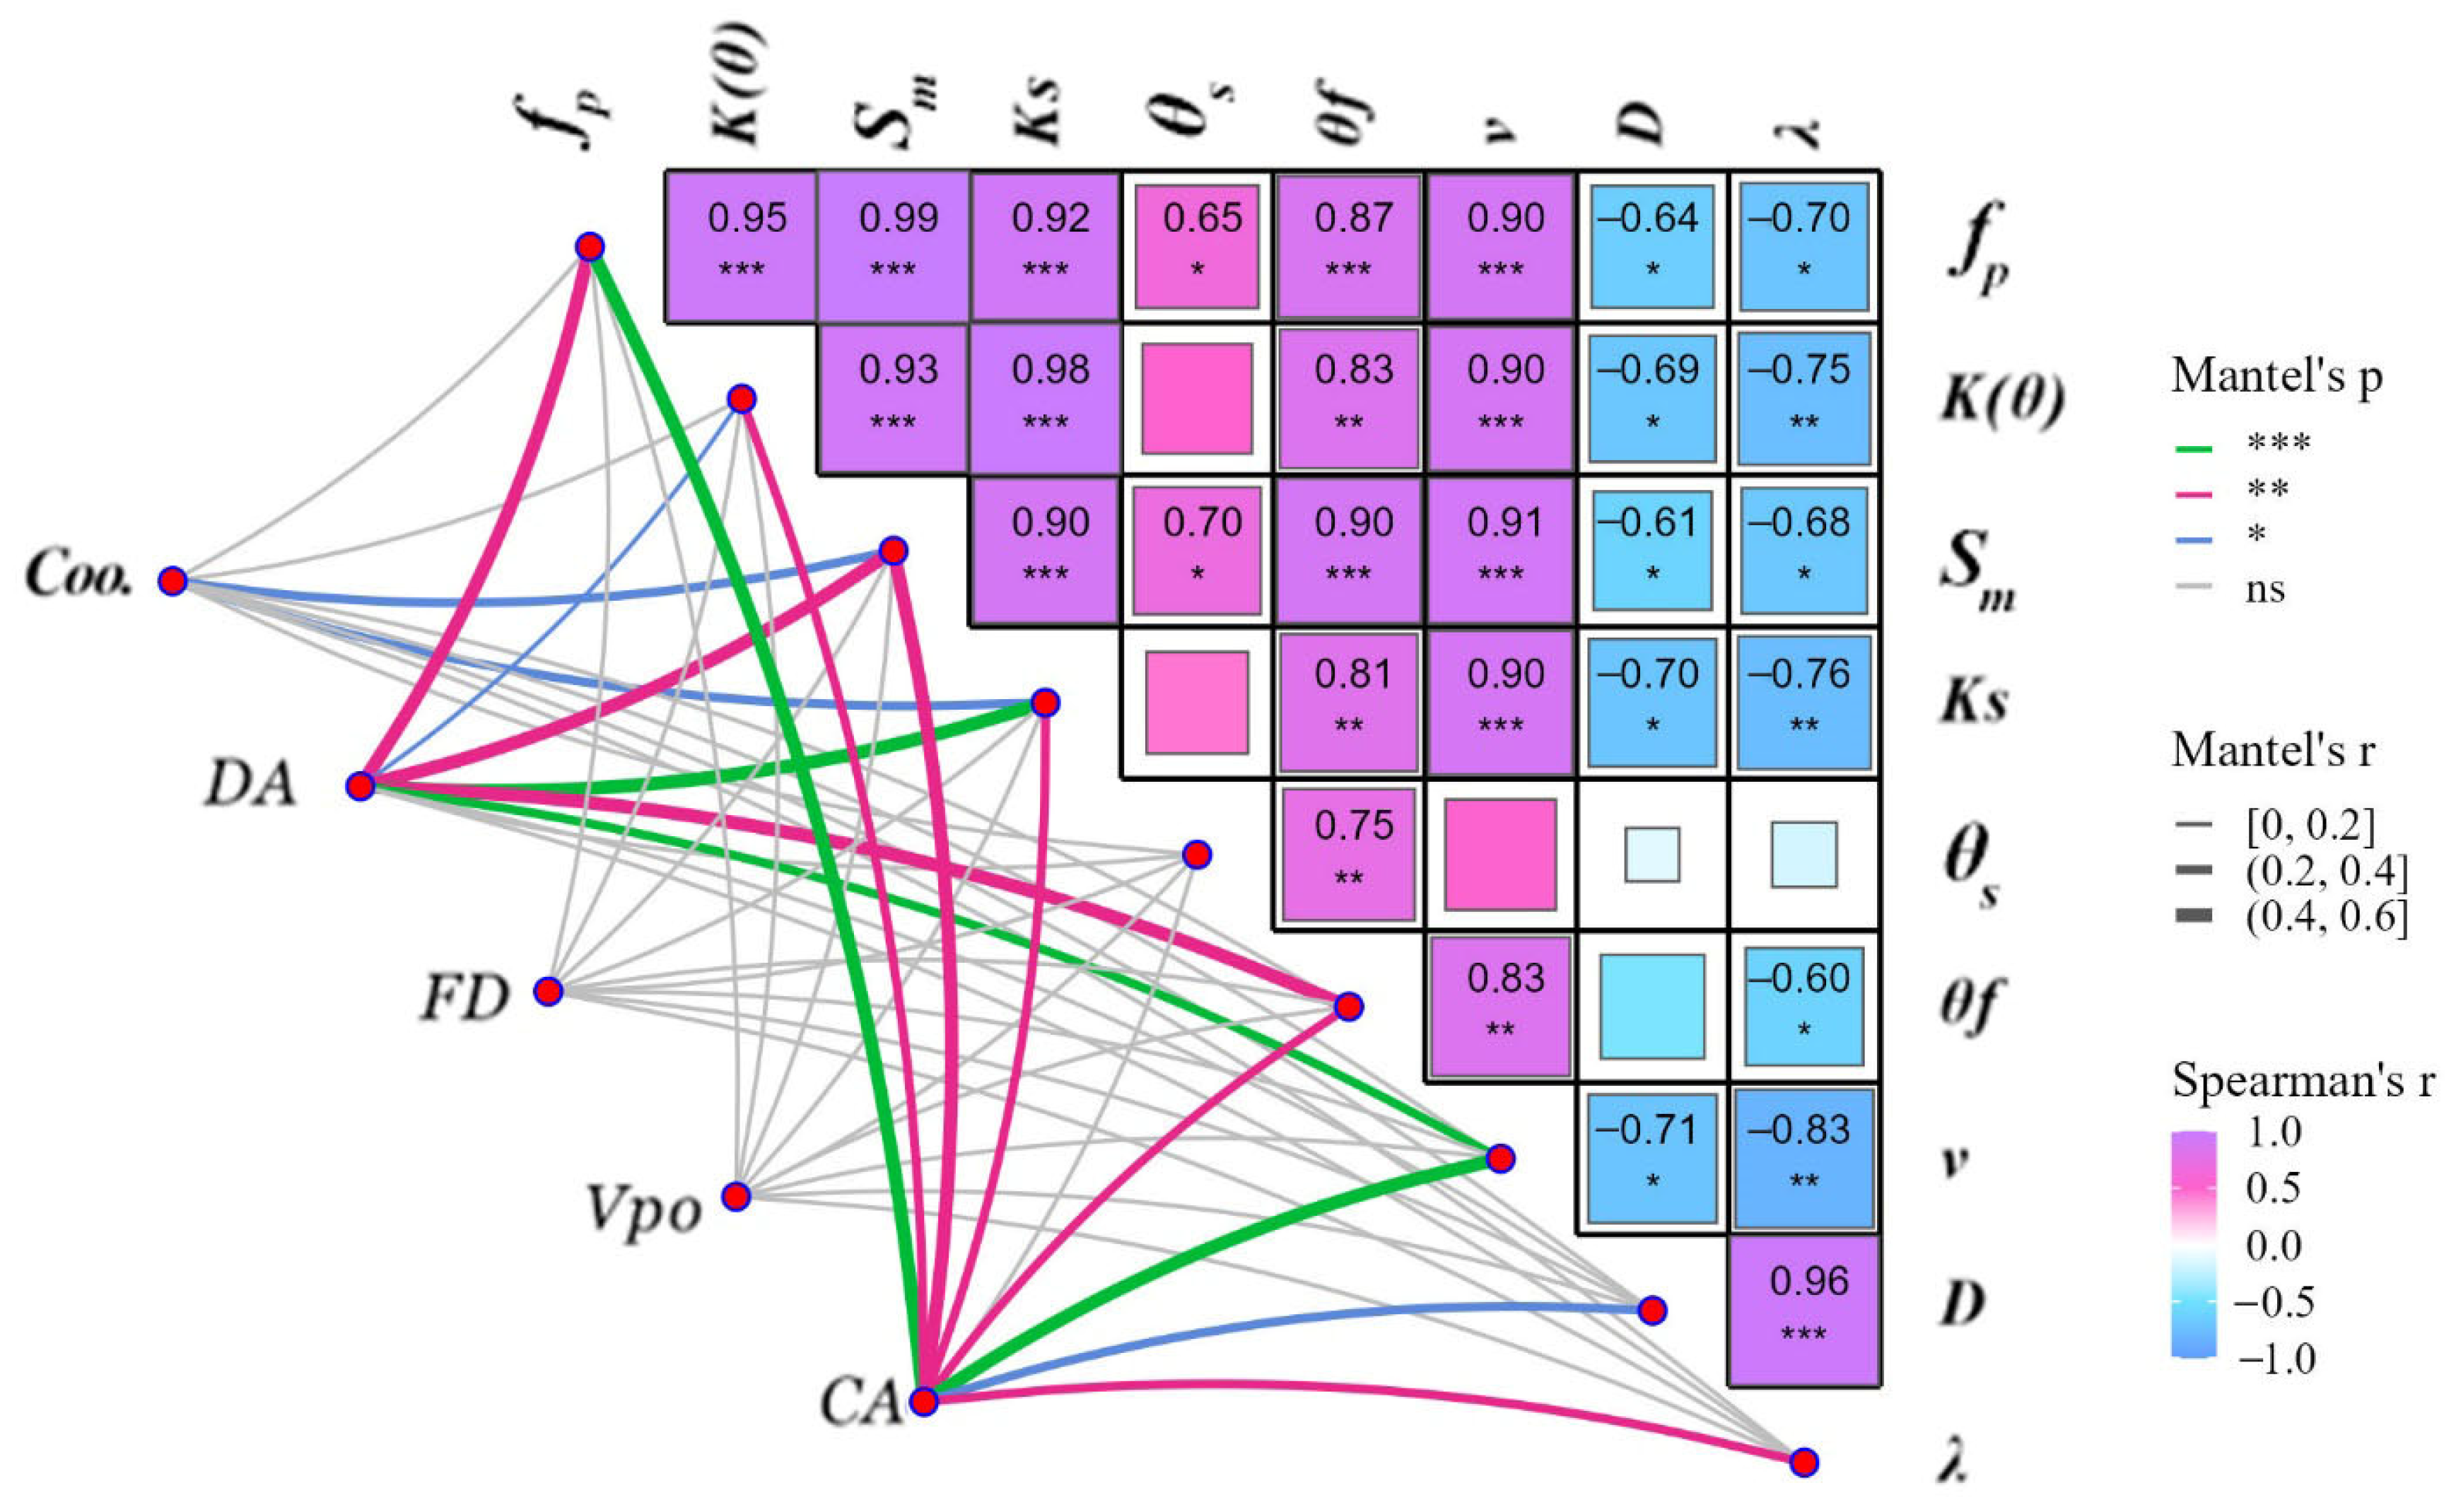
3.7. Mantel Test and Pearson Correlation Analysis

The pore characteristic parameters of the biochar–soil matrix were analyzed alongside the soil’s hydraulic parameters, infiltration parameters, and solute penetration parameters using the Mantel test. The results are shown in Figure 12. The degree of connectivity was significantly and positively correlated with interfacial suction and SSHC (p < 0.05). Anisotropy is significantly and positively correlated with the steady infiltration rate (p < 0.01), approximate saturated hydraulic conductivity (p < 0.05), interfacial suction (p < 0.01), SSHC (p < 0.001), field WHC (p < 0.01) and mean pore flow rate (p < 0.001); the contact angle has a significant positive correlation with the steady percolation rate, the approximate saturated hydraulic conductivity, the interfacial suction, the saturated hydraulic conductivity of the soil, the field WHC, the mean pore flow rate, the hydrodynamic dispersion coefficient, and the dispersion degree. The results of the Pearson correlation analysis show that the steady infiltration rate, the approximate saturated hydraulic conductivity, the interfacial suction, the SSHC, the SSHC, the SSWC, the field WHC, and the mean pore flow rate were positively correlated, and the coefficient of hydrodynamic dispersion was significantly positively correlated with the degree of dispersion, but the coefficient and degree of hydrodynamic dispersion were negatively correlated with the steady infiltration rate, the approximate saturated hydraulic conductivity, the interfacial suction, the SSHC, the SSWC, the field WHC, and the average pore flow rate. Steady infiltration rate, approximate saturated hydraulic conductivity, interfacial suction, SSHC, field WHC, and average pore flow rate were negatively correlated.

4. Discussion

4.1. Effect of the Structural Heterogeneity of Biochar on Soil’s Pore Structure

The amendment of biochars with different particle sizes exerts distinct influences on soil pore structure characteristic parameters, and pore characteristics can alter soil water and nutrient transport [31]. Thus, investigating the effect of biochar particle size variation on soil pore characteristics is of significant importance. This study reveals that both soil Coo. and Vpo were significantly lower in the biochar-applied treatments compared to the control. Moreover, with the increase in biochar application of different structures, Coo. exhibited an overall decreasing trend, potentially attributed to the fact that soil-added biochars blocked some pore spaces, leading to reductions in the original soil Coo. and Vpo [32,33]. As shown in Figure 1 and Figure 2, the biochar particles in the BMP treatment were larger, with more extensive internal pore spaces, which, in turn, increased their Coo. and Vpo [12]. Previous studies [34] have demonstrated that the non-spherical arrangement of soil particles leads to non-uniformity in pore scale, contributing to soil anisotropy. Notably, the BMP treatment showed no obvious trend in DA values, whereas both BUP and BNP treatments exhibited an overall decrease in DA. The decline in DA indicates that the vertical permeability of BUP- and BNP-amended soils was higher than that of the original soil, suggesting that BUP and BNP amendments enhance soil pore infiltration capacity—a characteristic not observed in the BMP treatment. Figure 2 further shows that biochar particles in the BMP treatment were significantly larger than those in the BUP and BNP treatments, and such irregular arrangements of large particles may exacerbate soil anisotropy. Comparisons of soil fractal dimensions (FD) showed no significant differences among treatments, implying that the geometric characteristics of pore spaces in soils amended with the three different structural biochars did not vary substantially. In conclusion, clarifying the impact of biochar heterogeneity on pore structure is of critical importance for soil improvement strategies aimed at regulating soil water and nutrient dynamics.

4.2. Effect of Biochar’s Heterostructural Texture on Soil’s Hydraulic Properties

In the soil environment, biochar particles and soil particles act both independently and interactively, with changes in soil hydraulic properties reflecting the strong microscale interaction between biochar and soil [35] rather than the intrinsic properties of the added biochar [36]. Sun et al. [37] demonstrated that biochar amendment introduces high pore spatial variability, complex pore structures, and irregular pore shapes, endowing biochar-amended saline soils with enhanced water holding capacity. This study found that increasing biochar application decreased SSHC while increasing SSWC. As biochar particle sizes decreased, both SSHC and SSWC showed an overall downward trend, potentially because exogenous biochar reduces soil macropore distribution, thereby decreasing SSHC and impeding moisture infiltration [38]. Meanwhile, the porous structure of biochar particles provides additional water holding pore spaces, improving SSWC. Notably, the BMP treatment exhibited an increasing SSWC trend at 2% application, likely due to the dense porous structure on the surface of large-particle biochar (Figure 1 and Figure 2). These structures introduce tiny pores into the soil’s overall pore system, acting as water holding pores and explaining the consistent trend between WHC and SSWC changes [39,40]. Biochar-induced soil water repellency is another key factor affecting soil’s hydraulic properties. This study reveals that BMPs had a contact angle < 90°, indicating overall hydrophilicity. Thus, BMPs did not significantly impede soil water movement, allowing for easier water molecule transport through soil pores—explaining why BMP-amended soils had higher SSHC than BUP/BNP treatments [41,42]. Conversely, BUP/BNP amendment rapidly increased contact angles. At 2.0% application, the contact angles of the mixed media approached the hydrophilic–hydrophobic cutoff, suggesting that decreasing particle size promotes a stepwise transition from hydrophilicity to hydrophobicity. This hydrophobicity may trap water in small pores or constrict flow paths in large pores, reducing soil water permeability. For effective agricultural application, identifying specific soil improvement objectives and selecting appropriate biochar types are crucial to optimize their benefits [43].

4.3. Effects of the Structural Heterogeneity of Biochar on Soil Infiltration

Soil water infiltration is a critical component of the soil water cycle, governing water recharge to agricultural soils from natural rainfall and surface irrigation, as well as crop-available water resources [44]. Elucidating how different biochar structural characteristics influence soil water infiltration processes is essential for deciphering the mechanisms by which biochar modifies soil water movement dynamics. This study found that cumulative soil infiltration decreased with increasing BMP application within the 0–1.0% range (maximum reduction of 13.8%), but rebounded to control levels at 2.0% application. This trend aligned with changes in soil saturated hydraulic conductivity (Ks), indicating that moderate BMP application inhibits water infiltration [45], while excessive application enhances infiltration by expanding water conducting pore spaces. In contrast, both BUPs and BNPs significantly reduced soil infiltration, with inhibitory effects intensifying with application rate. BNPs exhibited more pronounced inhibition (46.3% infiltration reduction at 2.0% application) compared to BUPs, attributed to their small-particle-size-driven pore filling and water repellent effects. Biochar amendment reduces soil macropores and lowers hydraulic conductivity, whereas large-particle biochar’s porous structure increases tiny water holding pores, enhancing soil water retention [46]. Eibisch et al. [47] emphasized that biochar particle size and intra-particle pore characteristics are pivotal for regulating water holding capacity and hydraulic conductivity. Conversely, ultra-micro pores from fine-particle biochars (e.g., BUPs, BNPs) are ineffective and clog original soil pores, failing to improve hydraulic properties. Additionally, water repellent biochar particles may trap water in small pores or constrict flow paths in macropores, reducing soil water permeability—although BMPs exhibited inherent hydrophilicity, contrasting with the hydrophobic tendencies of BUPs/BNPs.
This study systematically investigated the impacts of biochar on soil water transport using the Philip, Green-Ampt, and Kostiakov models, further revealing the key role of interfacial potential driving forces in stratified soils (0–40 cm). The results show that, during the non-linear decay stage (before the wetting front reached the interface), soil infiltration followed the universal infiltration law, with infiltration rate decaying as the wetting front advanced—synergistically regulated by pressure potential and suction potential gradients. In the controlled steady state infiltration stage (after wetting front arrival), the potential difference across the interface became the dominant factor: the upper soil layer continued water storage until the potential gradient drove water breakthrough. At this point, upper layer hydraulic conductivity approached saturation (Ks), and interface suction (Sm) gradually decayed to a steady state with water accumulation, stabilizing infiltration dynamics. Notably, in BMP treatments (large particle size), Sm generally decreased with application rate (except at 2.0%), indicating weakened lower-layer suction potential that promoted gravity-driven water movement. The abnormal Sm increase at 2.0% BMP may relate to the “critical threshold effect” (>1.0% application promotes infiltration), where large BMP-formed pores amplified upper–lower potential differences (consistent with Ks elevation mechanisms). Conversely, BUP/BNP treatments showed persistent Sm decline without reversal, attenuating wetting-front transport—likely due to nanoparticle-induced clogging of original upper layer pores, reducing effective water conducting spaces, or enhanced soil water repellency at the particle–soil interface, which increased upper layer water storage capacity. These findings highlight that modifying soil properties via dual-mechanism biochar amendments (water repellency + pore blockage) can regulate interlayer water transport, offering new insights for optimizing soil water retention potential.

4.4. Effect of the Structural Heterogeneity of Biochar on Soil’s Solute Penetration

Soil nutrient transport primarily relies on soil water as the migration medium, moving to deeper soil layers through water flow. Beyond the adsorption properties of soil and biochar particles, the structural heterogeneity of biochar significantly alters soil’s hydraulic properties, thereby reshaping nutrient transport patterns. This study reveals that solute breakthrough curve tailing became more pronounced with decreasing biochar particle size, while pore volume number (T) increased at complete breakthrough, indicating that smaller biochar particles more effectively hindered nutrient leaching [48]. For BMPs (large-particle biochars), filling soil macropores and the supplementation of small pores via inherent porosity slightly increased flow path curvature, enhancing mechanical dispersion [49]. This prolonged Cl breakthrough time in soil columns. Conversely, fine-particle biochars (BUPs/BNPs) altered pore size distributions, with BNPs infiltrating all pore scales. This significantly increased solute path tortuosity, decelerated Fickian transport, and enhanced mechanical dispersion, manifesting as prolonged breakthrough curve tailing and increased pore volumes for complete breakthrough [50]. These findings align with Alkharabsheh et al. [51], who showed that biochar improves shallow soil water fertilizer retention, reduces nutrient leaching, and enhances nitrogen use efficiency. CDE model fitting revealed that pore water velocity (v) trends mirrored hydraulic conductivity, with reduced velocity enhancing solute lateral dispersion (λ), particularly in BNP-amended soils [52]. This confirms that biochar structural heterogeneity influences solute transport by modulating water flow dynamics. Increasing biochar application and decreasing particle size enhanced solute dispersion, mitigating leaching risks. Correlation analyses showed that contact angle (CA) significantly correlated with hydraulic properties, infiltration parameters (except saturated water content), and solute breakthrough parameters. Under combined pore characteristics and water repellency, hydrophobicity dominated biochar’s soil improvement effects. Modulating biochar–soil hydrophilicity–hydrophobicity thus regulates water nutrient transport, offering a strategy to enhance soil water fertilizer retention—critical for agricultural soil amendment practices [53].

5. Conclusions

This paper investigates the role of the heterogeneous structure of biochar on soil’s WHC and nutrient, and the main conclusions are as follows:
(1) In this paper, the BNPs-2.0% treatment had the best effect of blocking water infiltration to water nutrients in agricultural soils, which prolonged the time of nutrient storage in the soil and helped to improve the efficiency of water and fertilizer use, while the BMPs-2.0% treatment had a better water retention effect, which effectively reduced water loss.
(2) The BNPs-2.0% treatment was the most effective in reducing soil infiltration. Calculation of the steady-state infiltration rate, approximate saturated hydraulic conductivity, and interfacial suction through the parameters of the well-fitted Philip model also showed that the BNPs-2.0% treatment had the strongest inhibiting effect on water infiltration.
(3) Applying biochar could improve the adsorption of soil ions, and the adsorption capacity of the improved soil increased with decreasing biochar particle size. The BNPs-2.0% treatment was effective in slowing the migration of soil ions. Solute penetration curves analyzed using the CDE model fitting different structures of biochar decreased the mean water flow rate v and increased the dispersion λ in soil pores, and the value of λ increased sequentially when increasing the applied amount.
(4) Using the mantle test, the heterogeneity of the biochar structure mainly caused differences in the pore structure characteristics and the soil’s hydrophilicity/hydrophobicity, while the water repellency had a significant effect on the soil’s strength characteristics, water infiltration, and solute penetration. BNPs-2.0% treatment had high water and fertilizer holding capacity, and it is recommended that BNPs-2.0% treatment be considered to improve the water and fertilizer holding capacity of amended soils, which are important for the future sustainability of agriculture and the efficient use of water and fertilizer in crops.

Author Contributions

Writing—original draft preparation, formal analysis, G.L.; data curation, methodology and software, Y.C.; conceptualization, writing—review and editing, funding acquisition, X.C.; writing—review and editing, funding acquisition, B.Z.; investigation, validation and data curation, M.D.; methodology, data curation and software, H.Z.; project administration, software and validation, G.S. All authors have read and agreed to the published version of the manuscript.

Funding

This research was funded by the National Natural Science Foundation of China (52222903; 52409067), Key Research and Development Program of Shaanxi Province (2025NC-YBXM-233). The authors also gratefully acknowledge the Xi’an University of Technology and Shaanxi University Young Innovation Team for providing lab facilitation and experimental measurements.

Data Availability Statement

All data in the figures is listed in the tables.

Conflicts of Interest

The authors declare no conflicts of interest.

References

  1. Ju, X.; She, D.; Huang, X.; Xia, Y.; Gao, L. Characterization and prediction of soil hydraulic and solute transport parameters using a random forest model. Eur. J. Soil Sci. 2024, 75, 13471. [Google Scholar] [CrossRef]
  2. Sombroek, W. Spatial and Temporal Patterns of Amazon Rainfall. AMBIO J. Hum. Environ. 2001, 30, 388–396. [Google Scholar] [CrossRef]
  3. Feng, Z.; Nie, W.; Ma, Y.; Li, Y.; Ma, X.; Zhu, H. Effects of urea solution concentration on soil hydraulic properties and water infiltration capacity. Sci. Total Environ. 2023, 898, 165471. [Google Scholar] [CrossRef]
  4. Verheijen, F.G.A.; Zhuravel, A.; Silva, F.C.; Amaro, A.; Ben-Hur, M.; Keizer, J.J. The influence of biochar particle size and concentration on bulk density and maximum water holding capacity of sandy vs sandy loam soil in a column experiment. Geoderma 2019, 347, 194–202. [Google Scholar] [CrossRef]
  5. Yang, C.; Lu, S. Effects of five different biochars on aggregation, water retention and mechanical properties of paddy soil: A field experiment of three-season crops. Soil Tillage Res. 2021, 205, 104798. [Google Scholar] [CrossRef]
  6. Razzaghi, F.; Obour, P.; Arthur, E. Does biochar improve soil water retention? a systematic review and meta-analysis. Geoderma 2020, 361, 114055. [Google Scholar] [CrossRef]
  7. Gloria, I.; Ondřej, M. The role of biochar particle size and hydrophobicity in improving soil hydraulic properties. Eur. J. Soil Sci. 2022, 73, 13138. [Google Scholar] [CrossRef]
  8. Zanutel, M.; Garré, S.; Sanglier, P.; Bielders, C. Biochar modifies soil physical properties mostly through changes in soil structure rather than through its internal porosity. Vadose Zone J. 2023, 23, e20301. [Google Scholar] [CrossRef]
  9. Wang, K.; Zhang, X.; Sun, C.; Yang, K.; Zheng, J.; Zhou, J. Biochar application alters soil structure but not soil hydraulic conductivity of an expansive clayey soil under field conditions. J. Soils Sediments 2021, 21, 73–82. [Google Scholar] [CrossRef]
  10. Rabbi, S.; Minasny, B.; Salami, S.; McBratney, A.; Young, I. Greater, but not necessarily better: The influence of biochar on soil hydraulic properties. Eur. J. Soil Sci. 2021, 72, 2033–2048. [Google Scholar] [CrossRef]
  11. Chandra, S.; Bhattacharya, J. Influence of temperature and duration of pyrolysis on the property heterogeneity of rice straw biochar and optimization of pyrolysis conditions for its application in soils. J. Clean. Prod. 2019, 215, 1123–1139. [Google Scholar] [CrossRef]
  12. Edeh, I.G.; Masek, O.; Buss, W. A meta-analysis on biochar’s effects on soil water properties—New insights and future research challenges. Sci. Total Environ. 2020, 714, 136857. [Google Scholar] [CrossRef]
  13. Alghamdi, A.; Alkhasha, A.; Ibrahim, H. Effect of biochar particle size on water retention and availability in a sandy loam soil. J. Saudi Chem. Soc. 2020, 24, 1042–1050. [Google Scholar] [CrossRef]
  14. Esmaeelnejad, L.; Shorafa, M.; Gorji, M.; Hosseini, S. Impacts of woody biochar particle size on porosity and hydraulic conductivity of biochar-soil mixtures: An incubation study. Commun. Soil Sci. Plant Anal. 2017, 48, 1710–1718. [Google Scholar] [CrossRef]
  15. Lim, T.; Spokas, K.; Feyereisen, G.; Novak, J. Predicting the impact of biochar additions on soil hydraulic properties. Chemosphere 2016, 142, 136–144. [Google Scholar] [CrossRef]
  16. Chandi, K.; Udomkun, P.; Boonupara, T.; Kaewlom, P. Enhancing soil health, microbial count, and hydrophilic methomyl and hydrophobic lambda-cyhalothrin remediation with biochar and nano-biochar. Sci. Rep. 2024, 14, 19551. [Google Scholar] [CrossRef]
  17. Mohanasundaram, S.; Kumar, S.; Nagabhooshanam, N.; Sharma, K.; Rao, P.; Pravallika, V.; Shankar, M. Electromagnetic interference shielding and mechanical and hydrophobic properties of papaya peel biocarbon and banana fiber–reinforced epoxy composite: Synthesize and Characterization. Biomass Convers. Biorefin. 2024, 15, 12689–12698. [Google Scholar] [CrossRef]
  18. Daraei, E.; Bayat, H.; Gregory, S. Impact of natural biochar on soil water retention capacity and quinoa plant growth in different soil textures. Soil Tillage Res. 2024, 244, 106281. [Google Scholar] [CrossRef]
  19. Fahmi, A.; Samsuri, A.; Jol, H.; Singh, D. Physical modification of biochar to expose the inner pores and their functional groups to enhance lead adsorption. RSC Adv. 2018, 8, 38270–38280. [Google Scholar] [CrossRef] [PubMed]
  20. Chen, X.; Duan, M.; Zhou, B.; Cui, L. Effects of biochar nanoparticles as a soil amendment on the structure and hydraulic characteristics of a sandy loam soil. Soil Use Manag. 2021, 38, 836–849. [Google Scholar] [CrossRef]
  21. Chen, Z.; Chen, C.; Kamchoom, V.; Chen, R. Gas permeability and water retention of a repacked silty sand amended with different particle sizes of peanut shell biochar. Soil Sci. Soc. Am. J. 2020, 84, 1630–1641. [Google Scholar] [CrossRef]
  22. Song, B.; Chen, M.; Zhao, L.; Qiu, H.; Cao, X. Physicochemical property and colloidal stability of micron- and nanoparticle biochar derived from a variety of feedstock sources. Sci. Total Environ. 2019, 661, 685–695. [Google Scholar] [CrossRef] [PubMed]
  23. Melo, L.; Lehmann, J.; Carneiro, J.; Camps-Arbestain, M. Biochar-based fertilizer effects on crop productivity: A meta-analysis. Plant Soil 2022, 472, 45–58. [Google Scholar] [CrossRef]
  24. Tian, L.; Shao, G.; Gao, Y.; Song, E.; Lu, J. Effects of Biochar on Soil Organic Carbon in Relation to Soil Nutrient Contents, Climate Zones and Cropping Systems: A Chinese Meta-Analysis. Land 2024, 13, 1608. [Google Scholar] [CrossRef]
  25. Wu, B.; Yang, H.; Li, S.; Tao, J. The effect of biochar on crop productivity and soil salinity and its dependence on experimental conditions in salt-affected soils: A meta-analysis. Carbon Res. 2024, 3, 56. [Google Scholar] [CrossRef]
  26. Oppong Danso, E.; Monnie, F.; Abenney-Mickson, S.; Arthur, E.; Sabi, E.; Andersen, M. Does Biochar Particle Size, Application Rate and Irrigation Regime Interact to Affect Soil Water Holding Capacity, Maize Growth and Nutrient Uptake? J. Soil Sci. Plant Nutr. 2021, 21, 3180–3193. [Google Scholar] [CrossRef]
  27. Vadakkan, K.; Sathishkumar, K.; Raphael, R.; Mapranathukaran, V.O.; Mathew, J.; Jose, B. Review on biochar as a sustainable green resource for the rehabilitation of petroleum hydrocarbon-contaminated soil. Sci. Total Environ. 2024, 941, 173679. [Google Scholar] [CrossRef]
  28. GB 7172-1987; Method for the Determination of Soil Water Content. China Standard Publishing House: Beijing, China, 1989.
  29. Bao, S. Soil and Agricultural Chemistry Analysis; China Agriculture Press: Beijing, China, 2000. [Google Scholar]
  30. Toride, N.; Leijand, F.J.; Van Genuchten, M.T. The CXTFIT Code for Estimating Transport Parameters from Laboratory or Field Tracer Experiments; U.S. Salinity Laboratory, USDA, ARS: Riverside, CA, USA, 1995; Volume 131, pp. 181–189. [Google Scholar]
  31. Zhang, W.; Meng, J.; Huang, Y.; Sarkar, B.; Singh, B.; Zhou, X.; Gao, J.; Teng, Y.; Wang, H.; Chen, W. Effects of soil grain size and solution chemistry on the transport of biochar nanoparticles. Front. Environ. Sci. 2023, 10, 1114940. [Google Scholar] [CrossRef]
  32. Yu, X.; Lu, S. Double effects of biochar in affecting the macropore systemof paddy soils identified by high-resolution X-ray tomography. Sci. Total Environ. 2020, 720, 137690. [Google Scholar] [CrossRef]
  33. Ouyang, L.; Wang, F.; Tang, J.; Yu, L.; Zhang, R. Effects of biochar amendment on soil aggregates and hydraulic properties. J. Soil Sci. Plant Nutr. 2013, 13, 991–1002. [Google Scholar] [CrossRef]
  34. Stewart, M.L.; Ward, A.L.; Rector, D. A study of pore geometry effects on anisotropy in hydraulic permeability using the lattice-Boltzmann method. Adv. Water Resour. 2005, 9, 1328–1340. [Google Scholar] [CrossRef]
  35. Petersen, C.; Hansen, E.; Larsen, H.; Hansen, L.; Ahrenfeldt, J.; Hauggaard-Nielsen, H. Pore-size distribution and compressi-bility of coarse sandy subsoil with added biochar. Eur. J. Soil Sci. 2016, 67, 726–736. [Google Scholar] [CrossRef]
  36. Acharya, B.S.; Dodla, S.; Wang, J.; Pavuluri, K.; Darapuneni, M.; Dattamudi, S.; Kharel, G. Biochar impacts on soil water dynamics: Knowns, unknowns, and research directions. Biochar 2024, 6, 34. [Google Scholar] [CrossRef]
  37. Sun, X.; She, D.; Fei, Y.; Wang, H.; Gao, L. Three-dimensional fractal characteristics of soil pore structure and their relationships with hydraulic parameters in biochar-amended saline soil. Soil Tillage Res. 2021, 205, 104809. [Google Scholar] [CrossRef]
  38. Lucia, T.; Dušan, I.; Ján, H.; Aydin, E. Can application of biochar improve the soil water characteristics of silty loam soil? J. Soils Sediments 2023, 23, 2832–2847. [Google Scholar] [CrossRef]
  39. Albalasmeh, A.; Quzaih, M.; Gharaibeh, M.; Rusan, M.; Mohawesh, O.; Rababah, S.; Alqudah, A.; Alghamdi, A.; Naserin, A. Significance of pyrolytic temperature, application rate and incubation period of biochar in improving hydro-physical properties of calcareous sandy loam soil. Sci. Rep. 2024, 14, 7012. [Google Scholar] [CrossRef]
  40. Garg, A.; Zhu, H.; Sarmah, A.K.; Mei, G.; Gadi, V. Evaluating mechanism and inconsistencies in hydraulic conductivity of unsaturated soil using newly proposed biochar conductivity factor. Biochar 2023, 5, 34. [Google Scholar] [CrossRef]
  41. Yang, X.; Fan, H.; Du, Y.; Zhang, L. Effect of biochar application on physicochemical and hydraulic properties of Loess. Adv. Civ. Eng. 2020, 2020, 4592092. [Google Scholar] [CrossRef]
  42. Abel, S.; Peters, A.; Trinks, S.; Schonsky, H.; Facklam, M.; Wessolek, G. Impact of biochar and hydrochar addition on water retention and water repellency of sandy soil. Geoderma 2013, 202, 183–191. [Google Scholar] [CrossRef]
  43. Chen, X.; Liu, L.; Yang, Q.; Xu, H.; Shen, G.; Chen, G. Optimizing Biochar Application Rates to Improve Soil Properties and Crop Growth in Saline–Alkali Soil. Sustainability 2024, 16, 2523. [Google Scholar] [CrossRef]
  44. Wang, H.; Shao, D.; Ji, B.; Gu, W.; Yao, M. Biochar effects on soil properties, water movement and irrigation water use efficiency of cultivated land in Qinghai-Tibet Plateau. Sci. Total Environ. 2022, 829, 154520. [Google Scholar] [CrossRef]
  45. Zou, Y.; Zhang, S.; Shi, Z.; Zhou, H.; Zheng, H.; Hu, J.; Jia, J. Effects of mixed-based biochar on water infiltration and evaporation in aeolian sand soil. J. Arid Land 2022, 14, 374–389. [Google Scholar] [CrossRef]
  46. Ramezanzadeh, H.; Zarehaghi, D.; Baybordi, A.; Bouket, A.C.; Oszako, T.; Alenezi, F.N.; Belbahri, L. The impacts of biochar-assisted factors on the hydrophysical characteristics of amended soils: A review. Sustainability 2023, 15, 8700. [Google Scholar] [CrossRef]
  47. Eibisch, N.; Durner, W.; Bechtold, M.; Fuß, R.; Mikutta, R.; Woche, S.K.; Helfrich, M. Does water repellency of pyrochars and hydrochars counter their positive effects on soil hydraulic properties? Geoderma 2015, 245, 31–39. [Google Scholar] [CrossRef]
  48. Fu, G.; Qiu, X.; Xu, X.; Zhang, W.; Zang, F.; Zhao, C. The role of biochar particle size and application rate in promoting the hydraulic and physical properties of sandy desert soil. CATENA 2021, 207, 105607. [Google Scholar] [CrossRef]
  49. Duan, Z.; Li, Z.; Wu, Y.; Niu, B.; Shen, R. Mechanical and microscopic properties of soil according to the rate of increase in pore water pressure. Soil Tillage Res. 2023, 225, 105530. [Google Scholar] [CrossRef]
  50. Awedat, A.M.; Zhu, Y.; Bennett, J.M.; Raine, S.R. The impact of clay dispersion and migration on soil hydraulic conductivity and pore networks. Geoderma 2021, 404, 115297. [Google Scholar] [CrossRef]
  51. Alkharabsheh, H.M.; Seleiman, M.F.; Battaglia, M.L.; Shami, A.; Jalal, R.S.; Alhammad, B.A.; Almutairi, K.F.; Al-Saif, A.M. Biochar and its broad impacts in soil quality and fertility, nutrient leaching and crop productivity: A review. Agronomy 2021, 11, 993. [Google Scholar] [CrossRef]
  52. Lowe, M.A.; McGrath, G.; Leopold, M. The impact of soil water repellency and slope upon runoff and erosion. Soil Tillage Res. 2021, 205, 104756. [Google Scholar] [CrossRef]
  53. Izaditame, F.; LeMonte, J.J.; Siebecker, M.G.; Yu, X.; Fischel, M.; Tappero, R.; Sparks, D.L. Sea-level rise and arsenic-rich soils: A toxic relationship. J. Hazard. Mater. 2024, 472, 134528. [Google Scholar] [CrossRef]
Figure 1. Apparent morphology of biochars with different particle sizes ((af): photos obtained using ESEM scanning electron microscopy; (g,h): photos obtained using SEM transmission electron microscopy).
Agronomy 15 01830 g001
Figure 2. Apparent morphology of soils containing biochars ((a,cg): photos obtained using ESEM scanning electron microscopy; (b,f,g): photos obtained using SEM transmission electron microscopy).
Agronomy 15 01830 g002
Figure 3. Three-dimensional pore distribution of soils containing different types and amounts of biochars.
Agronomy 15 01830 g003
Figure 4. Schematic diagram of the test setup.
Agronomy 15 01830 g004
Figure 5. Contact angle values of soils containing different types and amounts of biochars. Note: CA denotes the contact angle.
Agronomy 15 01830 g005
Figure 6. Solid surface energy of soils containing different types and amounts of biochars.
Agronomy 15 01830 g006
Figure 7. Soil cumulative infiltration improved with the application of biochars with different particle sizes. Note: The time nodes for the transition from the non-linear decay phase to the steady state infiltration phase varied between treatments, and the average time nodes between treatments are used in the figure to represent the transition between the two phases visually.
Agronomy 15 01830 g007
Figure 8. Soil infiltration rate improved by biochars with different particle sizes.
Agronomy 15 01830 g008
Figure 9. Fitting results of the soil infiltration models on the infiltration process of biochar-improved soil with biochars of different particle sizes.
Agronomy 15 01830 g009
Figure 10. Soil Cl penetration curve improved by biochar with different particle sizes.
Agronomy 15 01830 g010
Figure 11. Cl concentration in soil profiles in soil improved by biochar with different particle sizes after solute penetration. Note: The shaded portion of the figure indicates the error line of the measured data.
Agronomy 15 01830 g011
Figure 12. Mantel test analysis of the pore characterization parameters and contact angle with the biochar–soil matrix’s hydraulic, infiltration, and solute penetration parameters. Note: Coo.: connectivity; DA: anisotropy; FD: fractal dimension; Vpo: porosity; CA: contact angle; fp: steady percolation rate; K(θ): approximate saturated hydraulic conductivity; Sm: interfacial suction; Ks: saturated hydraulic conductivity of the soil; θs: saturated water content of the soil; θf: water holding capacity of the field; v: average pore flow rate; D: hydrodynamic dispersion coefficient; λ: dispersion degree; ‘*’, ‘**’, and ‘***’ denote significance at p < 0.05, p < 0.01, and p < 0.001 level, respectively; ns: not significant.
Agronomy 15 01830 g012
Table 1. Physicochemical properties of biochars with different particle sizes.
Biochar TypeMaterialSize
/nm
Padding
/%
Ash
/%
pHIodine Absorption Value/(mg/g)BET
/(m2/g)
BMPscoconut shell1 × 1067.13.69.71010960
BUPs(1–2) × 1031.53.19.816301580
BNPs(0.4–2) × 1022.13.39.816501620
Table 2. Pore structure characteristic parameters of soils containing different amounts of biochars.
TreatmentRateConnectivity
Coo.
Anisotropy
DA
Fractal Dimension
FD
Volumetric Porosity
Vpo/%
CK 2173 ± 261 a0.198 ± 0.028 c2.495 ± 0.091 a1.188 ± 0.021 a
BMPs0.3%704 ± 106 c0.225 ± 0.009 a2.223 ± 0.065 d0.858 ± 0.018 cd
0.6%492 ± 163 d0.206 ± 0.063 b2.431 ± 0.082 b0.900 ± 0.027 c
1.0%226 ± 129 e0.189 ± 0.017 d2.423 ± 0.035 bc0.715 ± 0.008 d
2.0%842 ± 226 b0.225 ± 0.052 a2.408 ± 0.088 c1.035 ± 0.023 b
CK 2173 ± 261 a0.198 ± 0.028 b2.495 ± 0.091 a1.188 ± 0.021 a
BUPs0.3%850 ± 151 b0.211 ± 0.016 a2.488 ± 0.008 b1.031 ± 0.016 b
0.6%170 ± 72 d0.199 ± 0.010 b2.304 ± 0.017 d0.605 ± 0.023 e
1.0%300 ± 116 c0.183 ± 0.007 c2.440 ± 0.006 c0.872 ± 0.017 c
2.0%133 ± 85 d0.182 ± 0.015 c2.421 ± 0.011 cd0.785 ± 0.011 d
CK 2173 ± 261 a0.198 ± 0.028 c2.495 ± 0.091 a1.188 ± 0.021 ab
BNPs0.3%1323 ± 128 b0.202 ± 0.012 b2.473 ± 0.007 b1.203 ± 0.022 a
0.6%634 ± 145 c0.206 ± 0.014 a2.399 ± 0.013 d0.963 ± 0.106 b
1.0%369 ± 125 d0.182 ± 0.005 d2.494 ± 0.042 a0.940 ± 0.041 c
2.0%198 ± 117 e0.179 ± 0.010 e2.451 ± 0.013 c0.834 ± 0.033 d
Note: Anisotropy DA is used to quantify the directionality of small pores, which may indicate the ability of the pore structure to resist seepage damage, and was estimated using the mean retention length; fractal dimension reflects the geometry of soil pores and was calculated using digital box counting; and each of the above parameters was completed using the built-in commands of the BoneJ module. Data in the table are mean ± standard deviation, and letters in the same column indicate significant differences at the p < 0.05 level.
Table 3. Soil’s hydraulic parameters improved by biochars with different particle sizes.
TreatmentRate/%Ks/(cm/d)θs/(g/g)θf/(g/g)
BMPs0 (CK)48.672 ± 0.121 b0.381 ± 0.003 d0.236 ± 0.003 d
0.347.544 ± 0.215 c0.395 ± 0.004 c0.243 ± 0.002 c
0.646.920 ± 0.188 d0.399 ± 0.004 b0.244 ± 0.001 c
1.044.592 ± 0.246 e0.402 ± 0.003 a0.247 ± 0.003 b
2.049.344 ± 0.134 a0.403 ± 0.005 a0.250 ± 0.002 a
BUPs0 (CK)48.672 ± 0.118 a0.381 ± 0.003 d0.236 ± 0.001 d
0.347.640 ± 0.153 b0.385 ± 0.002 c0.233 ± 0.002 b
0.645.288 ± 0.217 c0.389 ± 0.003 b0.232 ± 0.002 c
1.044.136 ± 0.161 d0.395 ± 0.003 a0.229 ± 0.003 a
2.041.928 ± 0.249 e0.382 ± 0.002 d0.228 ± 0.002 a
BNPs0 (CK)48.672 ± 0.115 a0.381 ± 0.003 d0.236 ± 0.002 c
0.346.896 ± 0.148 b0.386 ± 0.004 c0.232 ± 0.001 d
0.644.640 ± 0.162 c0.388 ± 0.003 b0.232 ± 0.002 b
1.043.584 ± 0.207 d0.392 ± 0.003 a0.228 ± 0.002 b
2.040.680 ± 0.284 e0.380 ± 0.004 d0.226 ± 0.003 a
Note: BMP and 0.3 represent biochar treatments and applications; all other treatments are equal. Ks represents the saturated soil hydraulic conductivity; θs represents the saturated water content of the soil; θf represents the amount of water held in the field. Data in the table are mean ± standard deviation, and letters in the same column indicate significant differences at the p < 0.05 level.
Table 4. Effect of biochars with different particle sizes on the fitting infiltration parameters of soil infiltration models.
TreatmentPhilip
i P = 0.5 S t 0.5 + A
Green−Ampt
i G = K s h 0 + h f + Z f / Z f
Kostiakov
i K = a t b
SAR2KshfR2abR2
CK1.4970.01210.9460.05711.8110.9490.505−0.5290.951
BMPs-0.3%1.4960.01210.9510.05612.1870.9530.517−0.5360.956
BMPs-0.6%1.4570.01190.9410.05612.6900.9310.506−0.5430.949
BMPs-1.0%1.2690.01170.9370.05517.5380.9390.459−0.5440.948
BMPs-2.0%1.5950.01230.9260.0579.6710.9120.542−0.5350.935
CK1.4970.01210.9460.05711.8110.9490.505−0.5290.951
BUPs-0.3%1.3150.01190.9620.05417.8880.9660.491−0.5400.968
BUPs-0.6%1.2960.01180.9490.05218.2000.9450.434−0.5440.954
BUPs-1.0%1.1360.01160.9630.05225.3590.9680.414−0.5450.968
BUPs-2.0%0.9290.01050.950.05137.7180.9470.321−0.5360.955
CK1.4970.01210.9460.05711.8110.9490.505−0.5290.951
BNPs-0.3%1.3310.01190.9680.05318.0980.9710.500−0.5470.973
BNPs-0.6%1.2280.01170.9080.05616.4140.8930.400−0.5190.916
BNPs-1.0%1.0620.01150.9320.05226.3370.9210.378−0.5280.938
BNPs-2.0%0.8880.00920.920.05137.1970.9090.297−0.5350.928
Table 5. Infiltration parameters of layered soil improved by biochars with different particle sizes.
Treatmentfp
/(cm/min)
K(θ)
/(cm/min)
Sm
/cm
BMPs-0.3%0.0217 ± 0.0005 b0.0121 ± 0.0001 b13.8127 b
BMPs-0.6%0.0208 ± 0.0009 c0.0119 ± 0.0001 c13.0140 c
BMPs-1.0%0.0186 ± 0.0009 d0.0117 ± 0.0001 d9.8139 d
BMPs-2.0%0.0224 ± 0.0004 a0.0123 ± 0.0002 a14.4724 a
BUPs-0.3%0.0196 ± 0.0003 a0.0119 ± 0.0002 a10.9131 a
BUPs-0.6%0.0175 ± 0.0003 b0.0118 ± 0.0001 b7.6610 b
BUPs-1.0%0.0165 ± 0.0005 c0.0116 ± 0.0002 c6.3764 c
BUPs-2.0%0.0129 ± 0.0007 d0.0105 ± 0.0002 d2.6032 d
BNPs-0.3%0.0188 ± 0.0008 a0.0119 ± 0.0001 a9.6293 a
BNPs-0.6%0.0159 ± 0.0004 b0.0117 ± 0.0001 b5.1842 c
BNPs-1.0%0.0160 ± 0.0003 b0.0115 ± 0.0002 c5.7778 b
BNPs-2.0%0.0107 ± 0.0006 c0.0092 ± 0.0003 d1.2488 d
Note: Data are mean ± standard deviation from graphs, where the interfacial suction Sm is the result calculated from Equation (7). fp represents the stable permeability; K(θ) represents the approximate saturated hydraulic conductivity; and Sm represents the interface suction. Data in the table are mean ± standard deviation, and letters in the same column indicate significant differences at the p < 0.05 level.
Table 6. Effect of biochar with different particle sizes on the fitting soil’s solute penetration parameters in the CDE model.
Treatmentv/(cm/min)D/(cm2/min)λ/cmt1/mint2/minR2SSQ
CK0.36850.00150.0040385.65515.320.99890.0002
BMPs-0.3%0.33680.00240.0071401.23563.330.99910.0001
BMPs-0.6%0.32170.00310.0096412.92581.720.99870.0003
BMPs-1.0%0.30340.00490.0162453.81644.390.99850.0003
BMPs-2.0%0.30750.00550.0179449.72629.580.99910.0001
CK0.36850.00150.0040385.65515.320.99890.0002
BUPs-0.3%0.31980.00130.0041461.39641.170.99940.0001
BUPs-0.6%0.30360.00410.0135513.72705.490.99910.0001
BUPs-1.0%0.26870.00480.0179576.66845.920.99900.0002
BUPs-2.0%0.22450.00750.0334669.231049.660.99950.0001
CK0.36850.00150.0041385.65515.320.99890.0002
BNPs-0.3%0.30060.00230.0077509.18701.590.99940.0001
BNPs-0.6%0.28310.00490.0173542.34758.920.99970.0001
BNPs-1.0%0.26940.00610.0226596.15838.660.99960.0001
BNPs-2.0%0.20780.00830.0399694.161119.470.99930.0001
Note: Data are mean ± standard deviation from the graphs, where v denotes mean pore flow rate; D denotes hydrodynamic dispersion coefficient; λ denotes dispersion; t1 denotes initial penetration time; t2 denotes full penetration time; SSQ denotes the residual sum of squares of fitted and measured values; and R2 denotes correlation coefficient.
Disclaimer/Publisher’s Note: The statements, opinions and data contained in all publications are solely those of the individual author(s) and contributor(s) and not of MDPI and/or the editor(s). MDPI and/or the editor(s) disclaim responsibility for any injury to people or property resulting from any ideas, methods, instructions or products referred to in the content.

