Article

Revalorization of Olive Stones from Olive Pomace: Phenolic Compounds Obtained by Microwave-Assisted Extraction

by
Alicia Castillo-Rivas
*,
Paloma Álvarez-Mateos
and
Juan Francisco García-Martín
Departamento de Ingeniería Química, Facultad de Química, Universidad de Sevilla, 41012 Seville, Spain
*
Author to whom correspondence should be addressed.
Agronomy 2025, 15(8), 1761; https://doi.org/10.3390/agronomy15081761
Submission received: 14 February 2025 / Revised: 10 April 2025 / Accepted: 11 July 2025 / Published: 23 July 2025
(This article belongs to the Section Plant-Crop Biology and Biochemistry)

Abstract

Olive stones (OS) are a by-product of great interest from olive oil mills and the table olive industry due to their high content of phenolic compounds. In this work, the extraction of phenolic compounds from OS via microwave-assisted extraction (MAE) with aqueous acetone was assayed. A central composite design of experiments was used to determine the optimal extraction conditions, with the independent variables being temperature, process time, and aqueous acetone (v/v). The dependent variables were the total content of phenolic compounds (TPC) measured by the Folin–Ciocalteu method and the main phenolic compounds identified and quantified by UPLC. Under optimal conditions (75 °C, 20 min, and 60% acetone), 3.32 mg TPC was extracted from 100 g of dry matter (DM) OS. The most suitable extraction conditions were different for each polyphenol. Therefore, 292.11 μg vanillin/g DM; 10.94 μg oleuropein/g DM; and 10.11 protocatechuic acid μg/g DM were obtained under conditions of 60 °C, 15 min, and 100% acetone; 43.8 °C, 10.45 min, and 61.3% acetone; and 64.8 °C, 16.58 min, and 97.8% acetone, respectively. Finally, MAE was compared with the traditional Soxhlet method under the same conditions. As a result, MAE was proven to be an enhanced and more feasible method for polyphenol extraction from OS.

1. Introduction

According to FAOSTAT, 98% of the worldwide production of the olive sector is conducted in Mediterranean countries. In fact, approximately 23.8% of the olives produced in 2018 were from Spain [1,2]. Olive oil, the main product of this sector, is obtained through a continuous centrifugation system using two-outlet or three-outlet decanters. In the former, one outlet is for olive oil, and another is for olive pomace (pulp and stones) and vegetable water (plus the water added during the process), while in the latter, there are three outlets (olive oil, pomace and wastewater) [1,3]. It is estimated that 70 kg of stones per ton of milled olives is produced [2,3].
Although olive oil is considered a mixture rich in phenolic compounds, proteins, and pigments [1,4,5], olive stones (OS) contain other special compounds, such as some polyunsaturated fatty acids (mainly linoleic acid) [1].
Olive stones are mainly a lignocellulosic material essentially composed of three structural polymers: cellulose, hemicellulose, and lignin, where the latter is the principal source of polyphenols [5,6]. In general, this by-product is used as a heating source and animal feed; however, new approaches aim for more profitable revalorization by obtaining compounds of high added value for the industrial and pharmaceutical industries [4,7].
Natural antioxidant compounds can be classified as phenolic compounds, carotenoids, and vitamins [1,6]. Phenolic acids, which belong to the former group, are simple compounds made with at least one phenol ring and several hydroxyl groups. These moieties allow polyphenols to have a wide range of polarity and antioxidant properties [1,5,8].
Some studies show the importance of polyphenols in the food industry due to their biological properties (i.e., anti-inflammatory, anti-cancer, or antimicrobial properties) [4,8,9]. Thus, the most representative olive polyphenolic compounds in olives are oleuropein, hydroxytyrosol, and oleocanthal [5]. Regarding OS, other polyphenols (caffeic acid, protocatechuic acid, vanillic acid, vanillin, coumaric acid, or ferulic acid) have been reported in addition to those mentioned above [7,10]. Beyond their antioxidant activity, vanillin is a well-known and valuable flavor agent [11], while protocatechuic acid has anti-inflammatory and neuroprotective activities [12,13].
Although synthetic antioxidants are the main source of polyphenols, there is increasing interest in natural polyphenols as consumer awareness grows for natural supplements, and furthermore, sustainable chemical processes are being developed to produce these natural antioxidants [4,9].
Several extraction techniques have been reported for obtaining phenolic compounds from different agrifood wastes. These techniques can be classified into conventional methods (i.e., maceration, Soxhlet extraction) and emergent methods (i.e., ultrasound-assisted extraction, UAE; microwave-assisted extraction, MAE; homogenizer-assisted extraction, HAE; pressurized liquid extraction, PLE) [4].
In fact, conventional methods are less effective than phenolic extraction techniques and emergent methods, as the former are time-consuming and require large amounts of solvent, while the latter use much less. Rafiee et al. [14] studied maceration and MAE applied to olive leaves, obtaining the highest TPC via MAE (88.298 mg tannic acid/g DM) when using methanol as solvent and 15 min process time. Proestos and Komaitis [15] reported better results using MAE (23.8 mg gallic acid equivalents (GAEs)/g DM) than conventional techniques applied to different plants, under conditions of 750 W, 4 min process time, and acetone as solvent. Koraqi et al. [16] compared maceration and UAE with different solvents (ethanol, acetone, acetonitrile, methanol, and water) in strawberry fruits, resulting in the highest TPC extraction for UAE (18.78 mg GAE/g DM) under the following conditions: 17.5 °C, 52 min, and acetone as solvent.
Among emergent methods, diverse studies have reported different results according to operational conditions and raw materials. Chanioti and Tzia [17] compared HAE, MAE, and UAE using various solvents (NADEs, ethanol, and water) for extracting phenolic compounds from OS. These authors found that the optimal extraction of TPC was achieved when using HAE (18.30 GAE mg/g DM) under the following conditions: NADEs, 60 °C, and 12,000 rpm. On the other hand, Tapia-Quirós et al. [18] studied polyphenol extraction from olive pomace, comparing MAE, PLE, and UAE, with MAE (11 mg GAE/g DM) being the most efficient technique under conditions of 50% ethanol, 90 °C, and 5 min.
MAE principles (Figure 1) are based on the ionic conduction and dipole rotation of polar molecules (sample and solvents) absorbing microwave radiation, converting it into thermal energy, and resulting in the heating of the sample [5,19]. Consequently, unidirectional temperature and mass transfer occurs from the sample matrix to the solvent. In contrast, in Soxhlet extraction, bidirectional transfer occurs, where temperatures are transferred from the solvent to the sample [19,20,21].
Many operating parameters affect the MAE process (i.e., temperature, solvent, process time, stirring, and sample–solvent ratio). Time, temperature, and stirring depend on the sample and equipment. The nature of the solvent is by far one of the most critical parameters because polar chemical molecules, which have a high dielectric constant, can absorb more microwave energy [22,23]. However, the degree of polarity of polyphenols is wide, as it depends on their hydroxyl number as well as other functional groups (e.g., keto or carboxylic groups). Therefore, neither extremely polar nor non-polar solvents are suitable for extracting large amounts of phenolic compounds [24,25]. Regarding the extracting solvent, aqueous acetone has been reported as the most suitable solvent for microwave-assisted extraction of polyphenols because of its wide polarity range [14,23,26,27] and its high lignin solubilization capacity [28,29].
This work focuses on enhancing the MAE of polyphenols from OS. To achieve this, we optimized the most important operating factors (temperature, process time, and aqueous acetone solution (% v/v)) through a response surface methodology (RSM) with a central composite design (CCD). This factorial model allows us to adjust the response (dependent variable), the parameter of interest which is controlled by operating conditions (independent variables), to a curve surface to find a maximum for the TPC and the most interesting phenolic compounds.

2. Materials and Methods

2.1. Standards and Reagents

Folin–Ciocalteu’s reagent, methanol 99.9% (HPLC grade), formic acid 98.0% (HPLC grade), and gallic acid (anhydrous 98.0%) were all supplied by Sigma-Aldrich Chemie GmbH (Taufkirchen, Germany); Anhydrous sodium carbonate was purchased from Merck KGaA (Gernsheim, Germany), while acetone and hexane for analysis were supplied by Panreac Química S.L.U. (Castellar del Vallès, Spain). Phenolic standards: vanillin (Sigma, Saint-Quentin-Fallavie, France), oleuropein (TRC, Vaughan, ON, Canada), 3-hydroxytyrosol, and protocatechuic acid (Ehrenstorfer, Augsburg, Germany).

2.2. Raw Material and Pretreatment

OS obtained during the olive pomace pitting process were provided by Agrícola Olivarera Virgen del Campo S.C.A. (Cañete de las Torres, Córdoba, Spain) olive mill.
The raw material was dried at 40 °C in a drying oven (JP Selecta, Barcelona, Spain). Subsequently, it was ground through a PM 200 planetary ball mill (Retsch, Düsseldorf, Germany) to obtain olive stone powder (OSP) with a 150 μm size.

2.3. Polyphenolic Extraction Methods

2.3.1. Microwave-Assisted Extraction (MAE)

OSP (1 g) was mixed with 20 mL of aqueous acetone in a Teflon vessel, i.e., a sample–solvent ratio of 1:20 (m/v) was used [26,27]. The mixture in closed Teflon vessels was subjected to different extraction conditions (Table 1) in an Ethos One microwave digester (Milestone, Sorisole, Italy), with 3 experimental variables being modified: process temperature (T), extraction time (t), and acetone:water (v/v) ratio (A:W). A total of 20 experiments were run, and three replicates were performed per experiment.
After the MAE process, the solution was filtered through vacuum filtration using a GF/C glass fiber filter (Whatman, Dassel, Germany) with a 1.2 μm pore diameter, which resulted in a liquid extract.
Similarly to the Soxhlet extraction, the solvent in the resulting liquid extract was removed at 40 °C in a Hei-VAP Core rotary evaporator (Heindolph, Schwabach, Germany), and the solid extract was weighed and stored at −4 °C in a freezer.
The amount of solid extract was expressed in mg E/g DM, where E stands for extract and DM for dry matter.

2.3.2. Soxhlet Extraction

Solid–liquid extraction of OSP (30–40 g) was carried out using a Soxhlet system; first, hexane was used for 5 h to extract residual oil, and then pure acetone was used for another 5 h to extract polyphenols [30]. Every extraction experiment was carried out in triplicate, and the extraction was coded as Soxhlet 100.
The solvent in the resulting liquid extract was removed at 40 °C using a Hei-VAP Core rotary evaporator (Heindolph, Schwabach, Germany) to allow the solid extract to be weighed and kept at −4 °C in a freezer. The quantity of solid extract was expressed in mg E/g DM, where E stands for extract and DM stands for dry matter.
Finally, a Soxhlet extraction using the optimized concentration of aqueous acetone solution (% v/v) obtained for MAE was carried out in duplicate to compare the performance between the two methods. This extraction was coded as Soxhlet 60.

2.4. Total Phenolic Content

The total phenolic content (TPC) was determined using the Folin–Ciocalteu method described by Singleton and Rossi [31] with modifications [5,32,33,34]. In addition, gallic acid was used as standard.
The dry extracts were dissolved in 1 mL of 7% aqueous acetone to ensure that the results were reliable. In a 96-well plate, 70 μL of sample and 70 μL of 10% Folin–Ciocalteu’s reagent were added, and, after 8 min, 140 μL of 3.5% Na2CO3 was added as well.
Immediately, the plate was incubated with shaking at 25 °C in the dark for 45 min. Thereafter, the absorbance of the solution was measured at 765 nm using a Bio-Tek Synergy HT microplate spectrophotometer (Agilent, Santa Clara, CA, USA).
TPC was determined by comparing the absorbance of the samples with a calibration curve of gallic acid, and it was expressed as mg GAE/g DM, where GAE stands for gallic acid equivalents and DM stands for dry matter.

2.5. Chromatographic Analysis of Phenolic Compounds

The samples were prepared by dissolving dry extract in a solution of 50% (v/v) methanol and 0.1% (v/v) formic acid and vortexed. The mixture was filtered using a nylon filter with a 0.2 μm pore size. The injection volume in the UHPLC system was 5 μL of sample.
Phenolic compound analysis was performed on a liquid chromatography system, namely a binary UHPLC Dionex UltiMate 3000 RS (Thermo Scientific, Waltham, MA, USA) coupled to a quadrupole-orbitrap QExactive hybrid mass spectrometer (Thermo Scientific, Waltham, MA, USA) with HESI ionization probe.
To separate phenolic compounds, an Acquity UPLC BEH C18 column (100 × 2.1 mm, 130 Ǻ, 1.7 μm) (Waters, Milford, MA, USA) was used under the following conditions: a process temperature of 40 °C and a volume flow rate of 0.5 mL/min. The elution solvents consisted of (A) water with (B) 0.1% (v/v) methanol solution, both mixed with 0.1% (v/v) formic acid. The elution gradient was as follows: 0–10 min, 95% A and 5% B; 10–12 min, 100% B; and 12–15 min, 95% A and 5% B. The Xcalibur 4.3 software was used to control the equipment and acquire data.
Phenolic compounds were identified by comparing three parameters with a database: retention time, exact masses of pseudomolecular ions, and their fragment ions. Trace Finder 5.1 software (Thermo Fisher Scientific, Waltham, MA, USA) was used for data analysis [35].
After identifying the most interesting polyphenols, we carried out another chromatographic analysis for the quantification of phenolic compounds using their standards.
The phenolic quantity was expressed as mg polyphenol/g DM, where polyphenol stands for each studied phenolic compound and DM for dry matter.

2.6. Glucose Content

The glucose content was determined using the phenol-sulfuric method described by DuBois [36] with modifications [37,38]. The dried extracts were dissolved in 1 mL of 7% aqueous acetone to ensure that the results were reliable. In a 96-well plate, 30 μL of sample per well was added with 150 μL of concentrated sulfuric acid. The mixture was shaken for 5 min, and, after 10 min more, 30 μL of 5% phenol was added. After allowing the sample to rest for 1 h, the absorbance was measured at 490 nm using a Synergy HT microplate spectrophotometer (Bio-Tek, Winooski, VT, USA).
The glucose content was determined by comparing the absorbance of the samples with a calibration curve of D-glucose (Glc), and it was expressed as mg Glc/g DM, where DM stands for dry matter.

2.7. Lignin Content

The lignin content was determined using the Klason lignin content method [39]. In a crucible, 50–60 mg of dry extract was added with titrated 72% H2SO4 (ratio 1:15), and the mixture was shaken for 2 h. After this time, the mix was dissolved up to 4% H2SO4 using distillate water. This solution was boiled for 4 h and then filtered through vacuum filtration using a GF/C glass fiber filter (Whatman, Germany) with 1.2 μm pore diameter. The solid was dried in a drying oven (JP Selecta, Barcelona, Spain) at 105 °C until a constant weight was obtained.
Lignin content was expressed as mg KL/g DM, where KL stands for Klason lignin and DM stands for dry matter.

2.8. Experimental Design, Modeling, and Optimization

The selected MAE process parameters were optimized using Response Surface Methodology (RSM) through the Echip 7 software (Experimentation by Design, Wilmington, DE, USA). These parameters were independent variables (temperature, time, and acetone:water (v/v) ratio, A:W) related to the enhancement of dependent variables (responses) in a statistical model. The responses were TPC, extraction yield (ηE), and the amounts of the most interesting polyphenols found. The rest of the extraction conditions were fixed: sample–solvent ratio of 1:20 (w/v) and microwave power of 500 W.
The central composite design (CCD) was chosen as the most suitable statistical model because it was expected to find a complex behavior of the sample with linear and quadratic interactions (Equation (1)).
y = β 0 + i = A n β i · x i + i = A n β i i · x i 2 + i j n β i j · x i j + ε                     i , j = A ,   B ,   C
where y was the response; xi and xij were the values of the independent variable; βi, βii, and βij were the coefficients related to the independent variables (xi and xij, respectively); and β0 was the independent coefficient.
The CCD model consists of 3 factors and 5 levels (Table 1), which translated into 15 different experiments and repeats 5 times the central point, so there were 20 experiments in total. In this case, the range of values for each level was based on previous studies [11,12,15,19,20].
The Echip software was used to obtain RSM and an experimental statistical equation with high reliability. The experimental data were fitted to the statistical equation in order to obtain regression coefficients for each response. The program used two statistical tools: t-student test to determine statistically non-significant terms (p > 0.15) that might be removed in the model, and Analysis of Variance (ANOVA) to determine the accuracy of the developed model (no lack of fit).
In addition, the Echip program allowed us to apply a regression analysis through R-square (R2) and adjusted R-square (R2adj). Both measure the accuracy of statistical terms fitting to a linear model, and their values must be not only as high as possible but also similar.

3. Results and Discussion

3.1. Soxhlet Extraction

3.1.1. Extraction Yield and TPC with Soxhlet

Two different types of Soxhlet experiments were carried out: Soxhlet extraction with conditions according to Juhaimi et al. [30], named Soxhlet 100, and the same experiment but using optimal MAE conditions (A:W of 60%), named Soxhlet 60.
On the one hand, the oil extraction from OSP with hexane was poor; it represented only 0.083 ± 0.012% (w/w). However, the amounts of extracts obtained using acetone solutions were 3.75 ± 0.46 mg E/g DM and 11.90 ± 4.03 mg E/g DM for Soxhlet 100 and Soxhlet 60, respectively. Similarly, the values of TFC were 0.021 ± 0.003 mg GAE/g DM and 0.368 ± 0.016 mg GAE/g DM for Soxhlet 100 and Soxhlet 60, respectively. Hence, the application of optimal MAE conditions to Soxhlet extraction led to the highest extraction yields.

3.1.2. Phenolic Compounds with Soxhlet

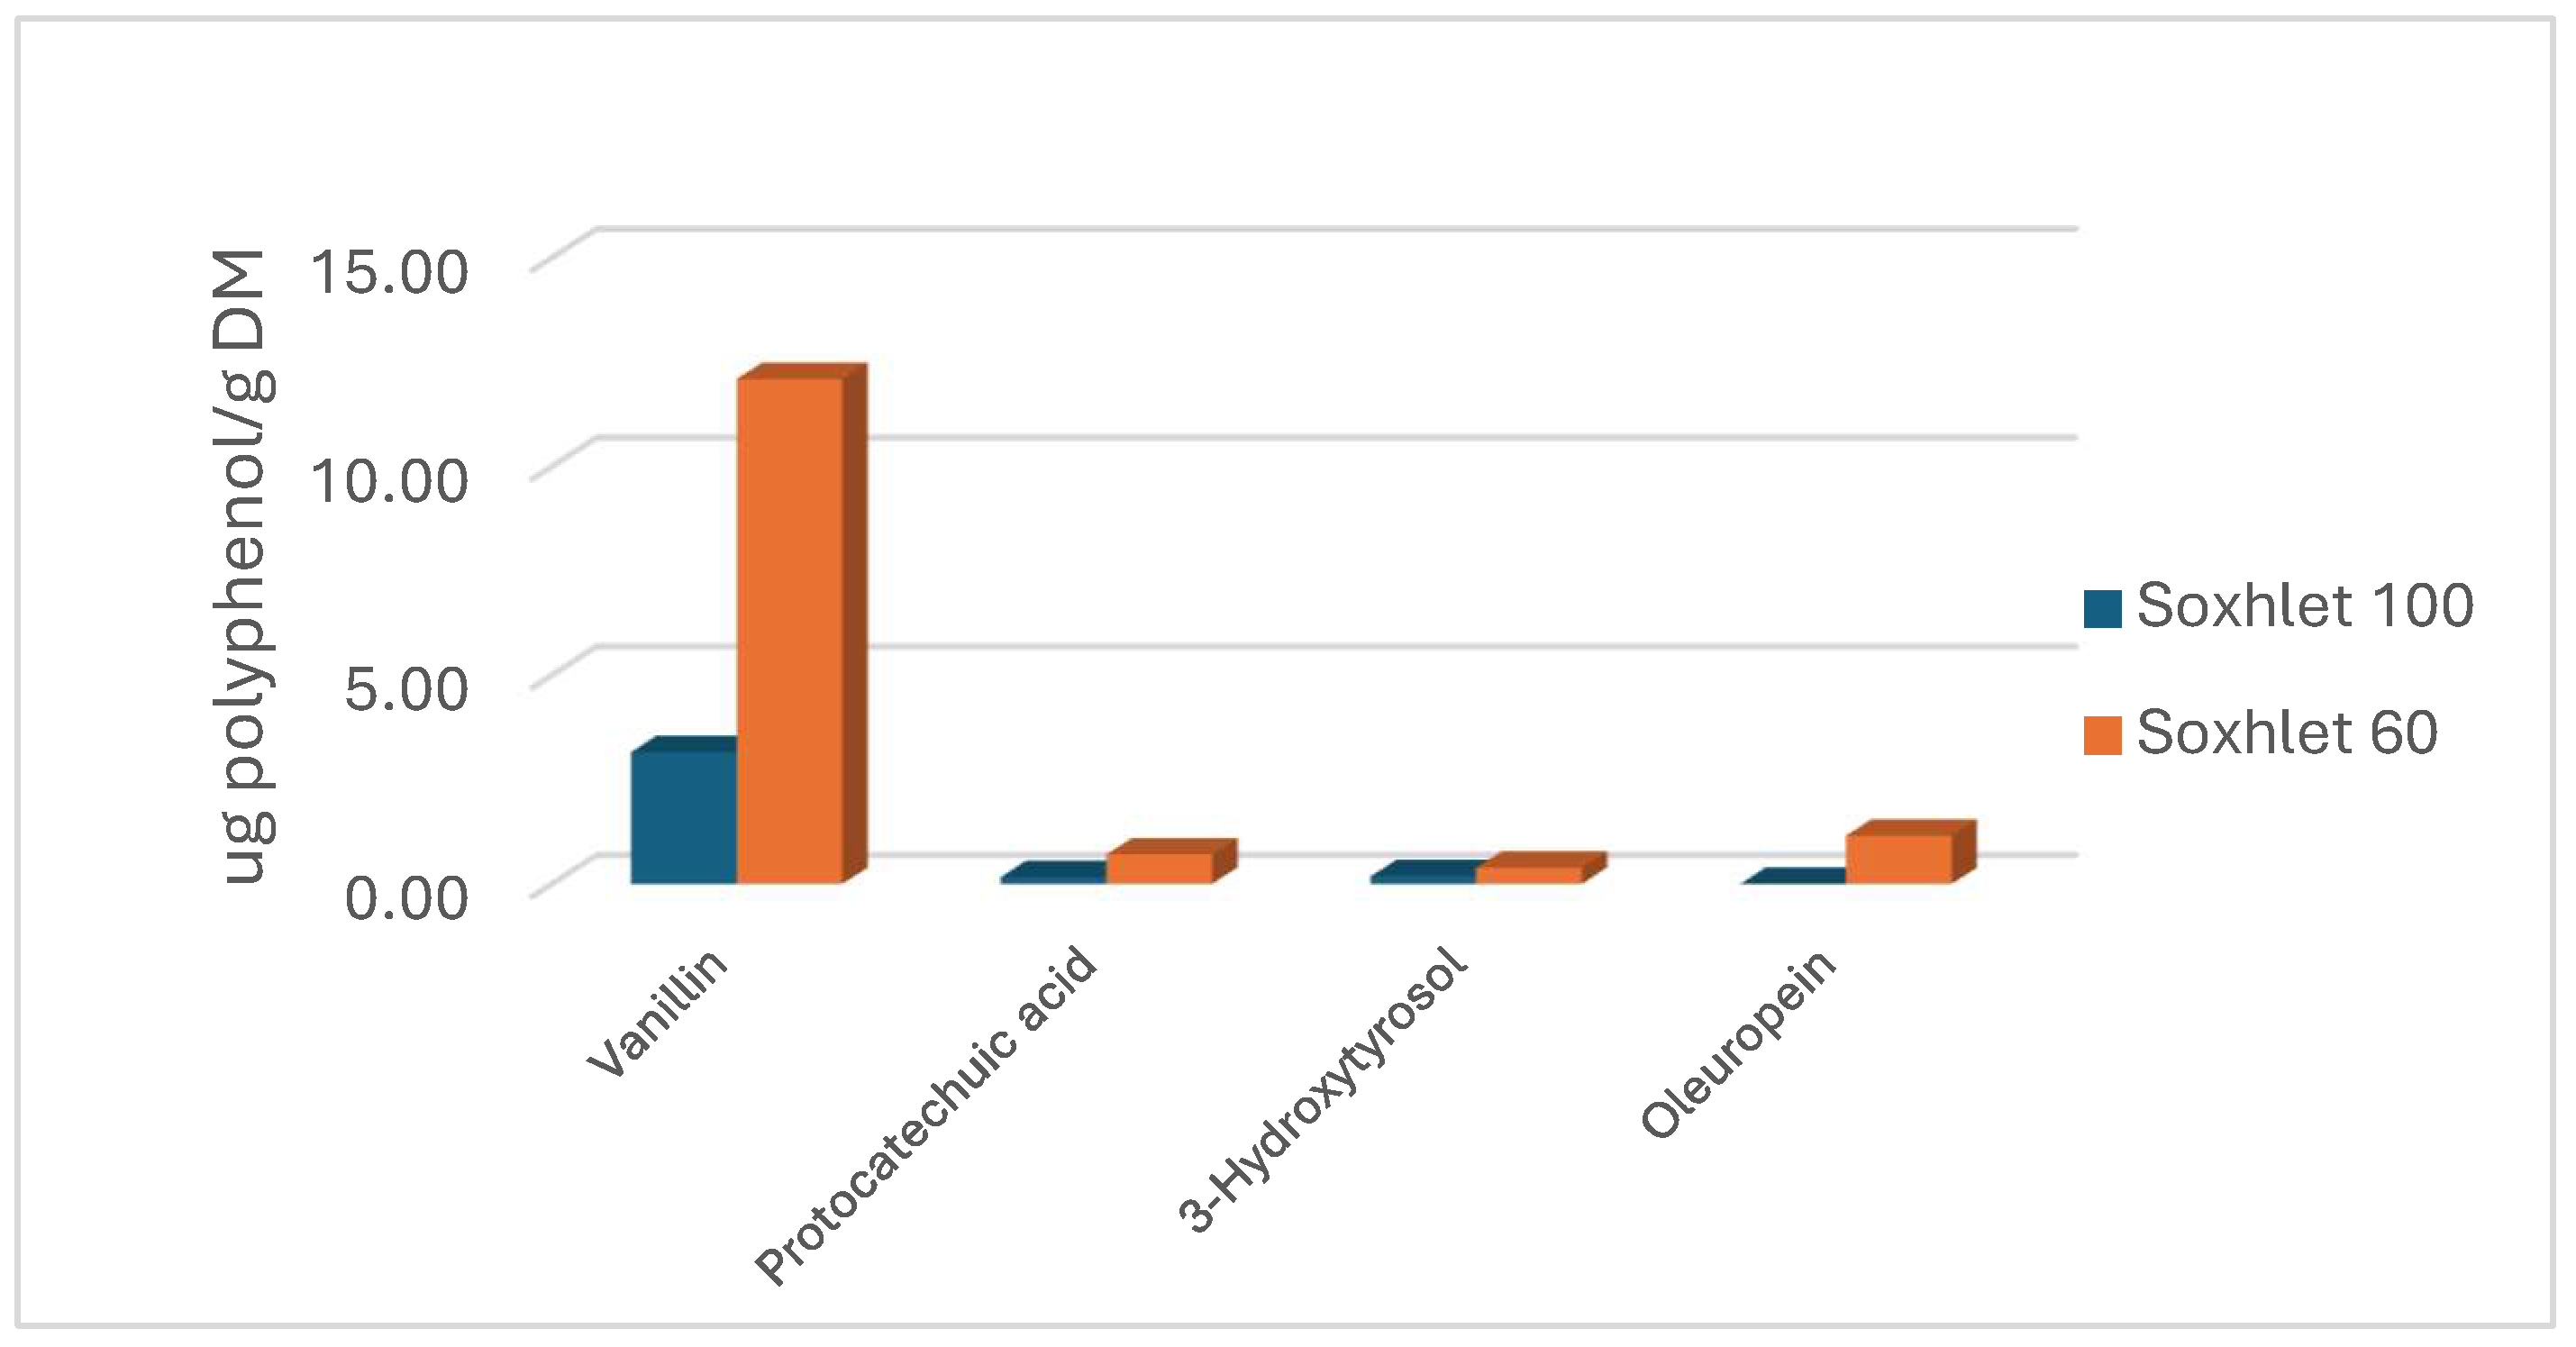
As Figure 2 shows, the main polyphenol obtained in both Soxhlet experiments was vanillin. This compound is obtained from the depolymerization of lignin, where its extraction is more efficient because it is very soluble in acetone and at high temperatures [11]. Apart from phenolic compounds, two main organic acids were obtained as well: L-(-)-malic acid and succinic acid (Table 2), which are compounds of hemicellulose [40].
In the same case as phenolic extraction, better results were obtained using Soxhlet 60 (with optimal MAE conditions for A:W). Other polyphenols, such as 3-O-methylgallic acid and oleuropein, were also extracted. This is due to the higher polarity of aqueous acetone.
Once the polyphenols present in the samples had been identified (Table 2), the most interesting phenolic compounds from a healthy and alimentary point of view, i.e., vanillin, protocatechuic acid, oleuropein, and hydroxytyrosol, were selected.

3.2. MAE of Polyphenols

One of the goals of this study was to optimize the process parameters (temperature, A; time, B; and A:W, C) through DoE (Table 3). Initially, a quadratic model was used to predict different responses; however, in some cases, a linear model provided a better fit.

3.2.1. Extraction Yield and TPC with MAE

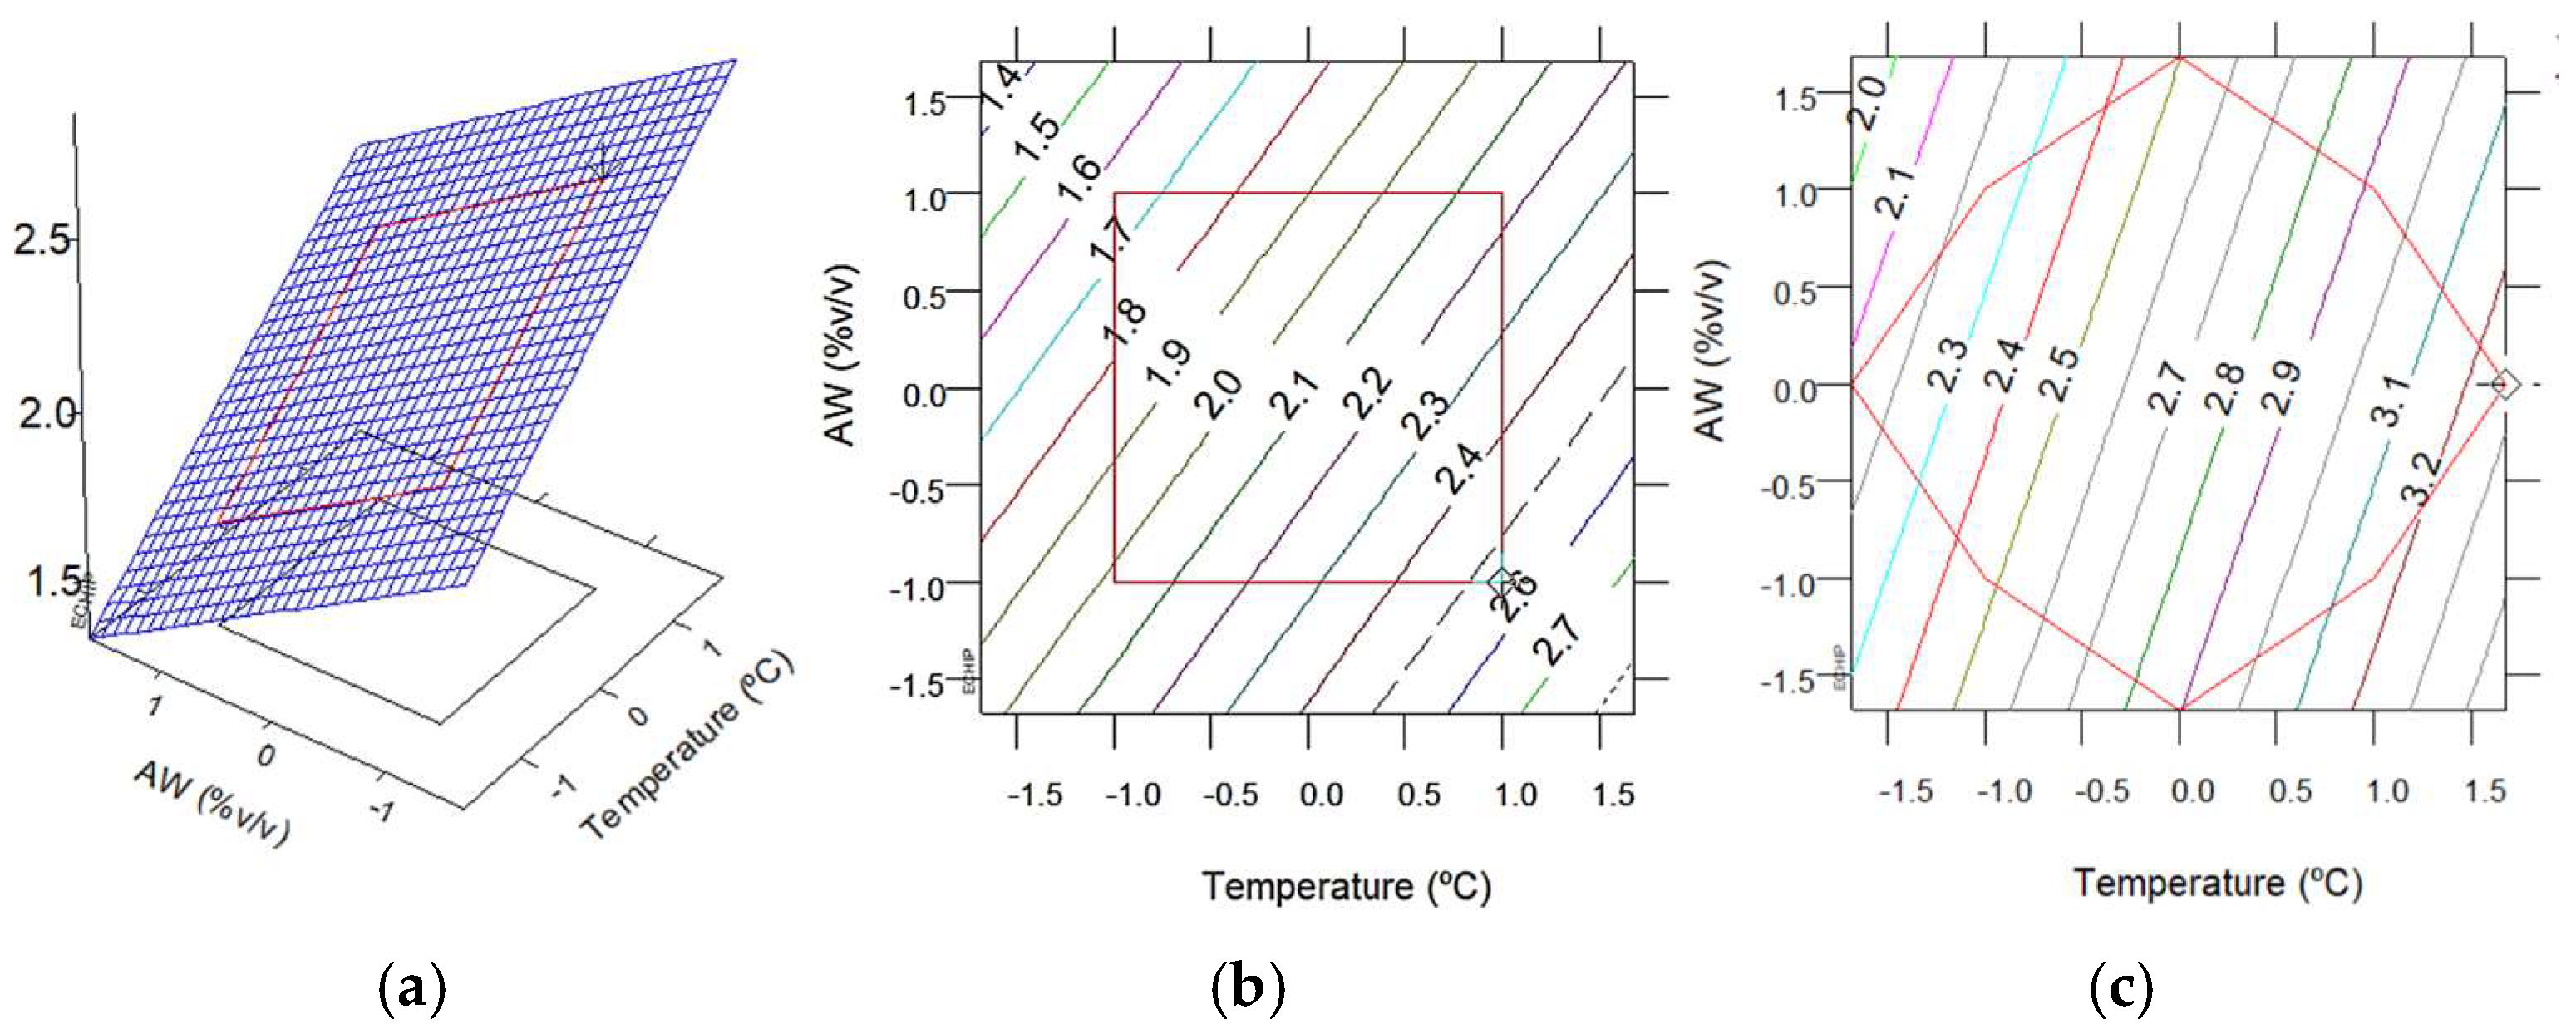
As shown in Table 3, the extract yield (ηE) and TPC values ranged from 1.37 to 2.71 mg E/g DM and from 1.83 to 3.55 mg GAE/g DM, respectively. For polyphenolic extraction, the optimized predicted value was 2.54 ± 0.33% (w/w) under the following conditions: temperature of 75 °C, process time of 20 min, and A:W of 60%. Regarding TPC, the optimum, according to DoE, was 3.27 ± 0.64 mg GAE/g DM under conditions similar to those for phenolic extraction (Figure 3).
Both statistical equations for the polyphenolic extraction response (Equation (2)) and the TPC response (Equation (3)) are described as linear. Although the model fits with accuracy (R2 = 0.803; R2adj = 0.765, and R2 = 0.621; R2adj = 0.560, respectively), they did not achieve the actual maximum value. Therefore, it was necessary to redefine the range of values for time and/or temperature (Figure 3).
y = 2.02 + 0.26 · x A + 0.06 · x B 0.18 · x C + 0.01 · ε
y = 2.734 + 0.347 · x A + 0.118 · x B 0.121 · x C + 0.035 · ε
where y represents the response, xA is the temperature value (°C), xB is the process time value (min), xC is the A:W (% v/v), and ε is the error.

3.2.2. Phenolic Compounds with MAE

In most extracts, the same main polyphenols and organic acids were identified: oleuropein, protocatechuic acid, vanillin, vanillic acid, caffeic acid, 3-O-methylgallic, L-malic acid, and succinic acid (Table 2). A CCD model was used for the most interesting polyphenols in the industry: vanillin, protocatechuic acid, hydroxytyrosol, and oleuropein. Their models are described in Equations (4), (5), (6), and (7), respectively, and the value of R2 and R2adj show that all fit accurately: R2 = 0.877 and R2adj = 0.833 (Equation (4)), R2 = 0.733 and R2adj = 0.638 (Equation (5)), R2 = 0.790 and R2adj = 0.668 (Equation (6)), and R2 = 0.971 and R2adj = 0.906 (Equation (7)).
y = 121.62 + 12.82 · x A + 16.53   x C + 17.59 ·   x B · x C 13.345 · x B ·   x C 9.97 · x A 2 + 50.43 · x C 2 + 105.23 · ε
y = 4.78 + 0.92 · x A + 1.03 · x B + 0.82 ·   x C + 1.06   t · x C 13.345 · x B ·   x C + 1.40 · x C 2 + 1.02 · ε    
y = 3.37 0.05 · x A 0.47 · x B 0.43 · x C 0.49 · x A · x B + 0.53 · x A · x C + 0.29 · x B · x C 0.39   13.648 · x A 2 + 0.31 · ε  
y = 4.15 + 0.62 · x A 0.67 · x B 1.70 ·   x C + 1.68   x A · x C + 2.37 · x B ·   x C + 1.40 · x B 2 + 0.29 · ε
where y refers to the response (quantity of polyphenol), xA is the temperature value (°C), xB is the process time value (min), xC is the A:W (% v/v), and ε is the error.
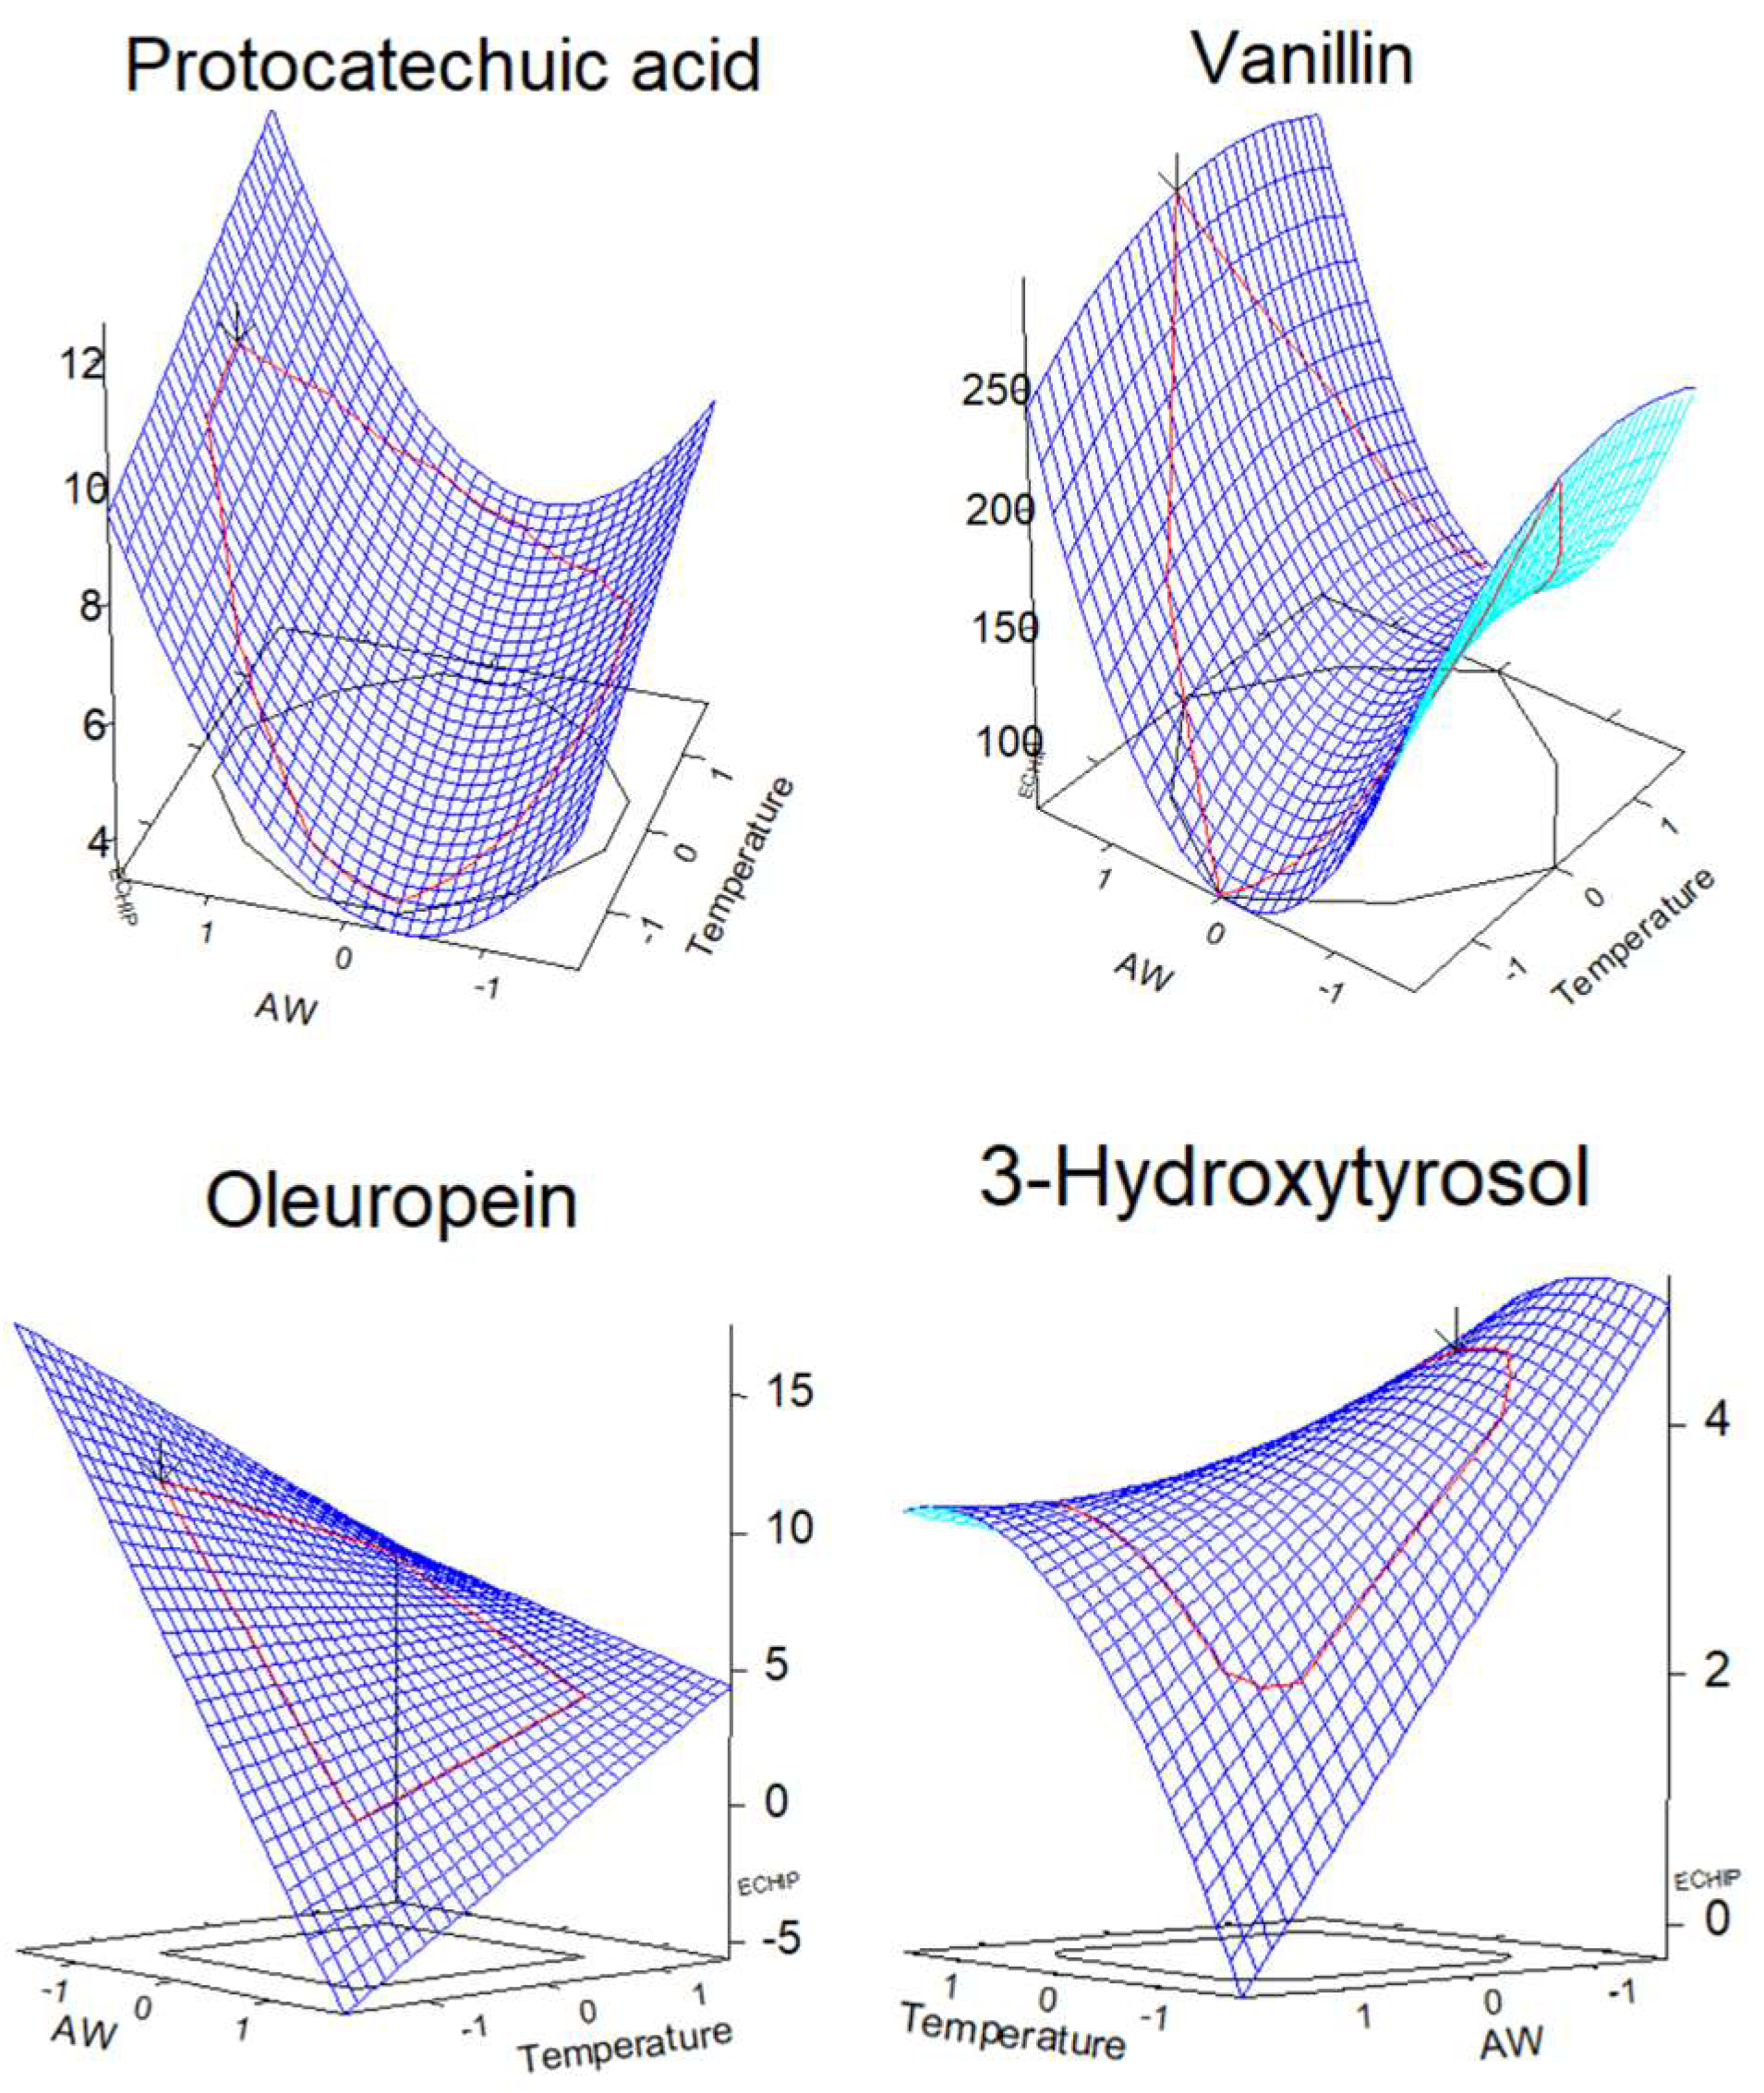
According to the Echip software, the expected value for optimal conditions for vanillin extraction was 292.11 ± 59.63 μg vanillin/g DM for 60 °C, 15 min, and 100% A:W, while the optimal value for protocatechuic acid was 10.11 ± 3.49 μg protocatechuic/g DM for the following conditions: temperature of 64.8 °C, process time of 16.58 min, and an A:W of 97.8%. In the case of 3-hydroxytyrosol, the optimal value was 4.60 ± 1.21 μg hydroxytyrosol/g DM with the following experimental parameters: 56.97 °C, 11.45 min, and 56.97% acetone. For oleuropein, the optimal value was 10.94 ± 2.28 μg oleuropein/g DM under the following experimental conditions: 43.8 °C, 10.45 min, and 61.3% acetone (Figure 4).

3.3. Glucose Content

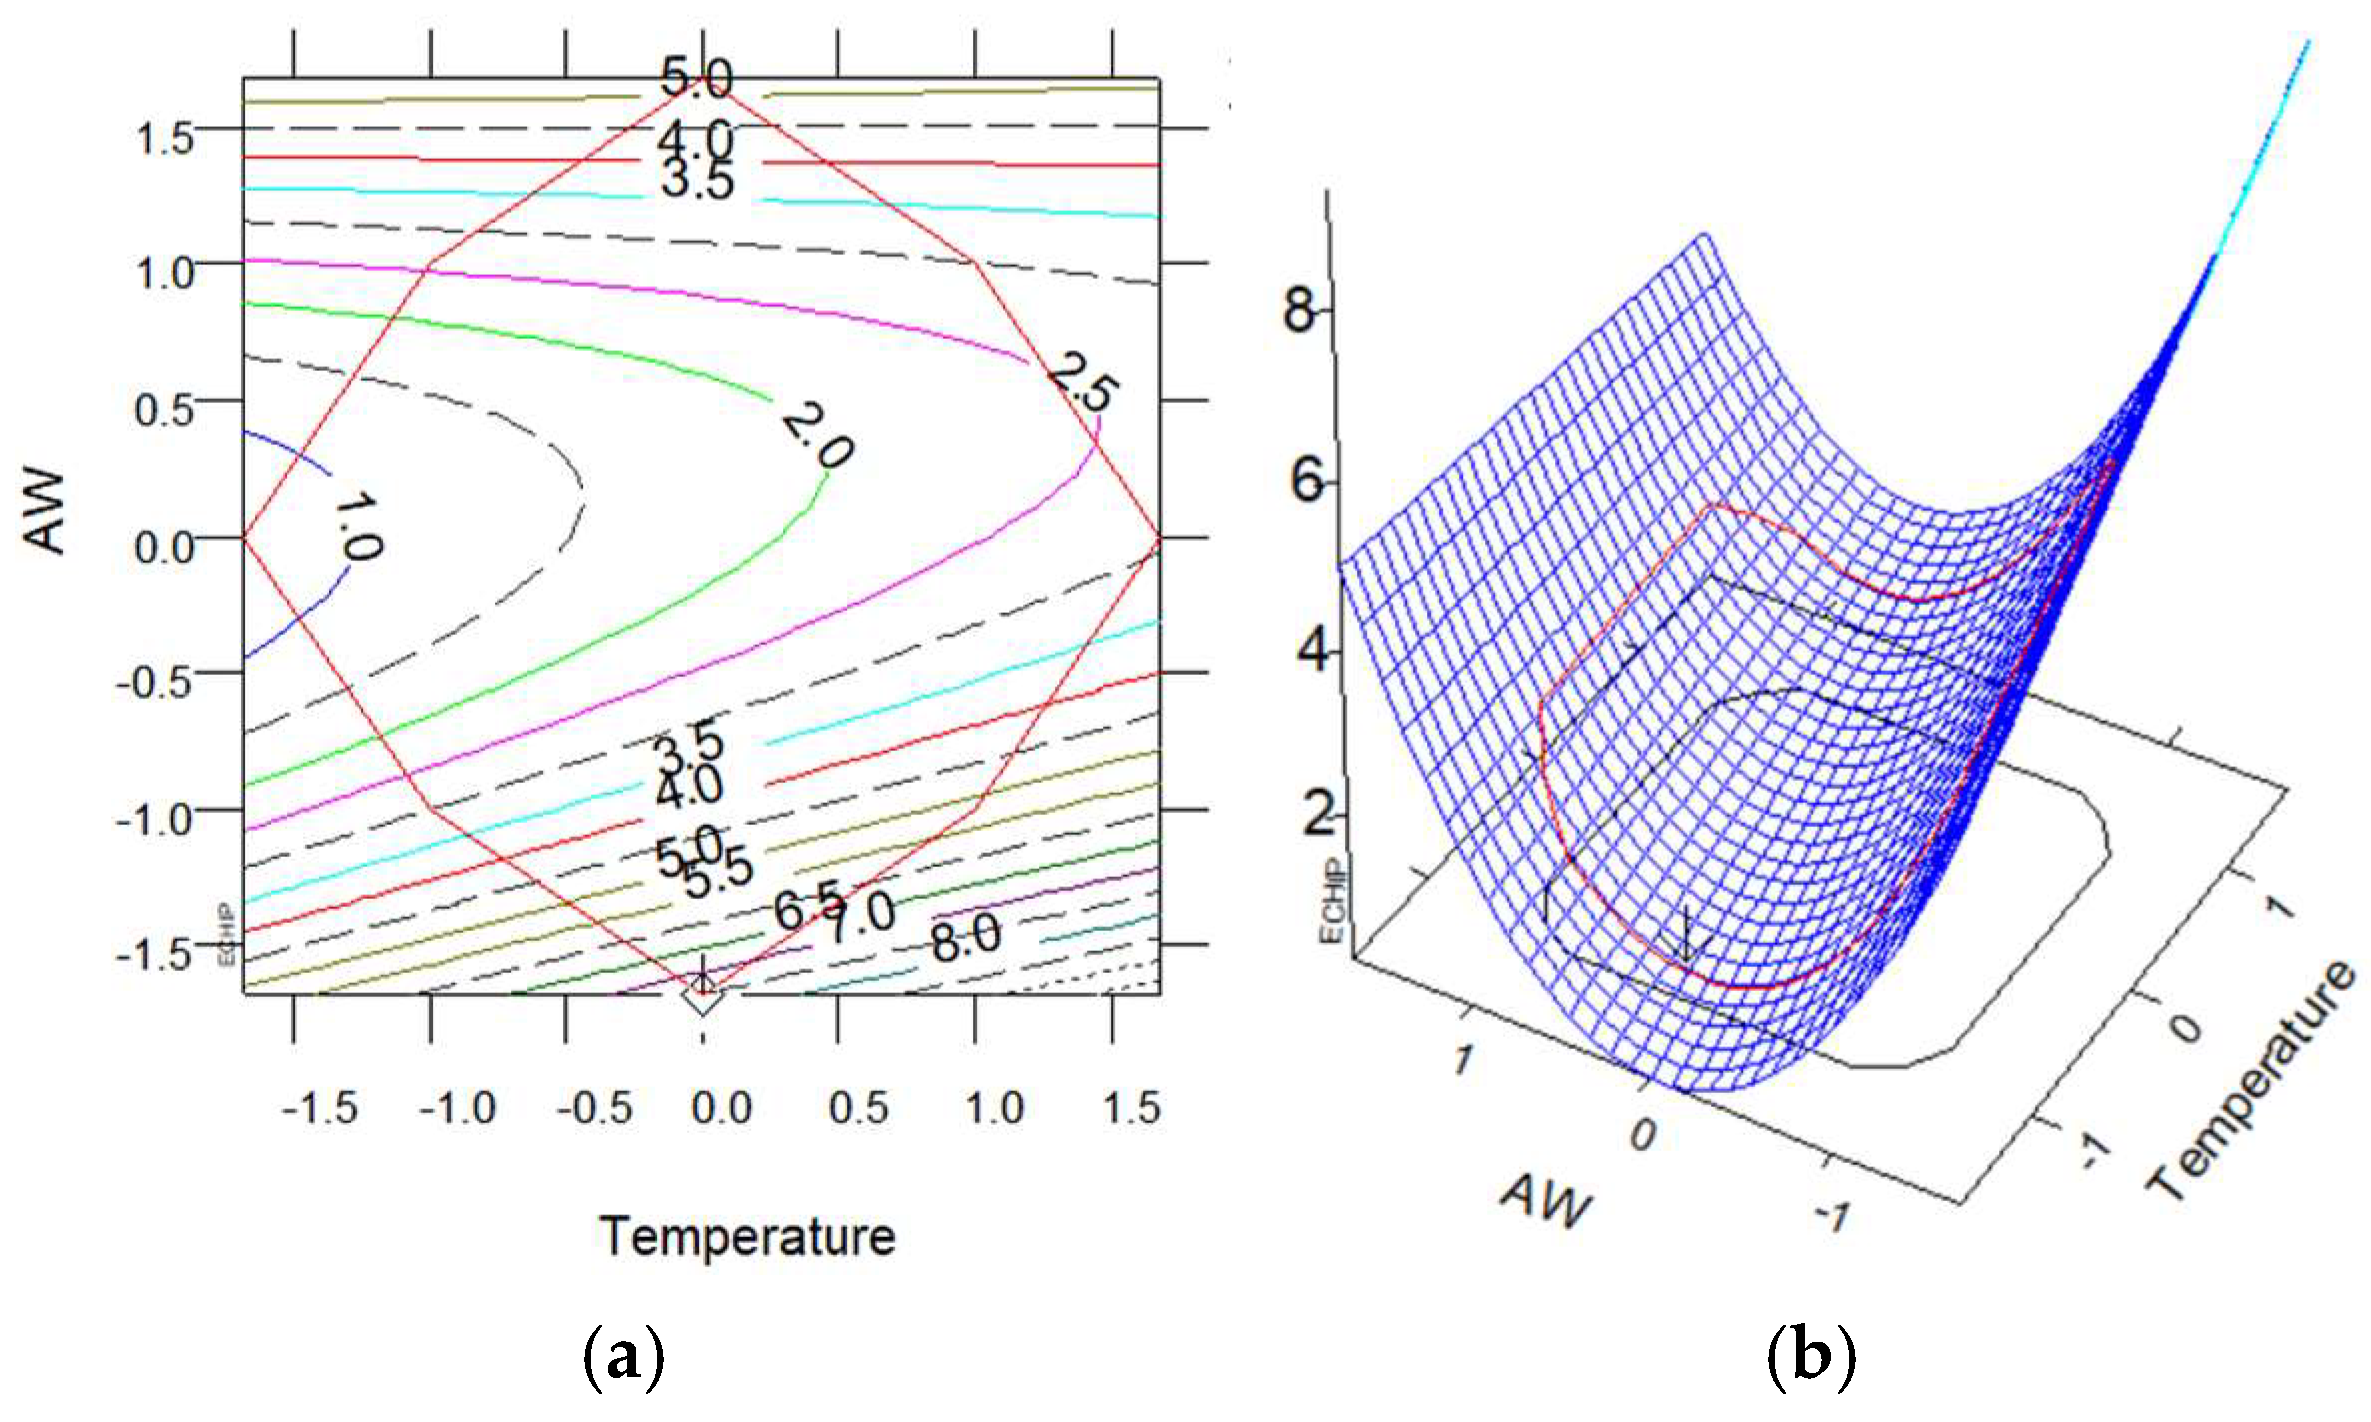
Table 3 shows the results of the CCD. The model for the extraction of glucose from cellulose has R2 = 0.864 and R2adj = 0.815 (Equation (8)) and shows that the maximum value of glucose in dry extracts is 7.49 ± 2.15 mg Glc/g DM, under the following conditions: 60 °C, 15.02 min, and an A:W of 50.03% (Figure 5). The extraction process using the lowest A:W yielded the extract with the highest glucose content.
y = 1.81 + 0.65 · x A + 0.60 · x B 0.65 · x C 0.45 ·   x A · x C + 1.63 · x C 2 + 0.64 · ε

3.4. Composition of Dry Extracts

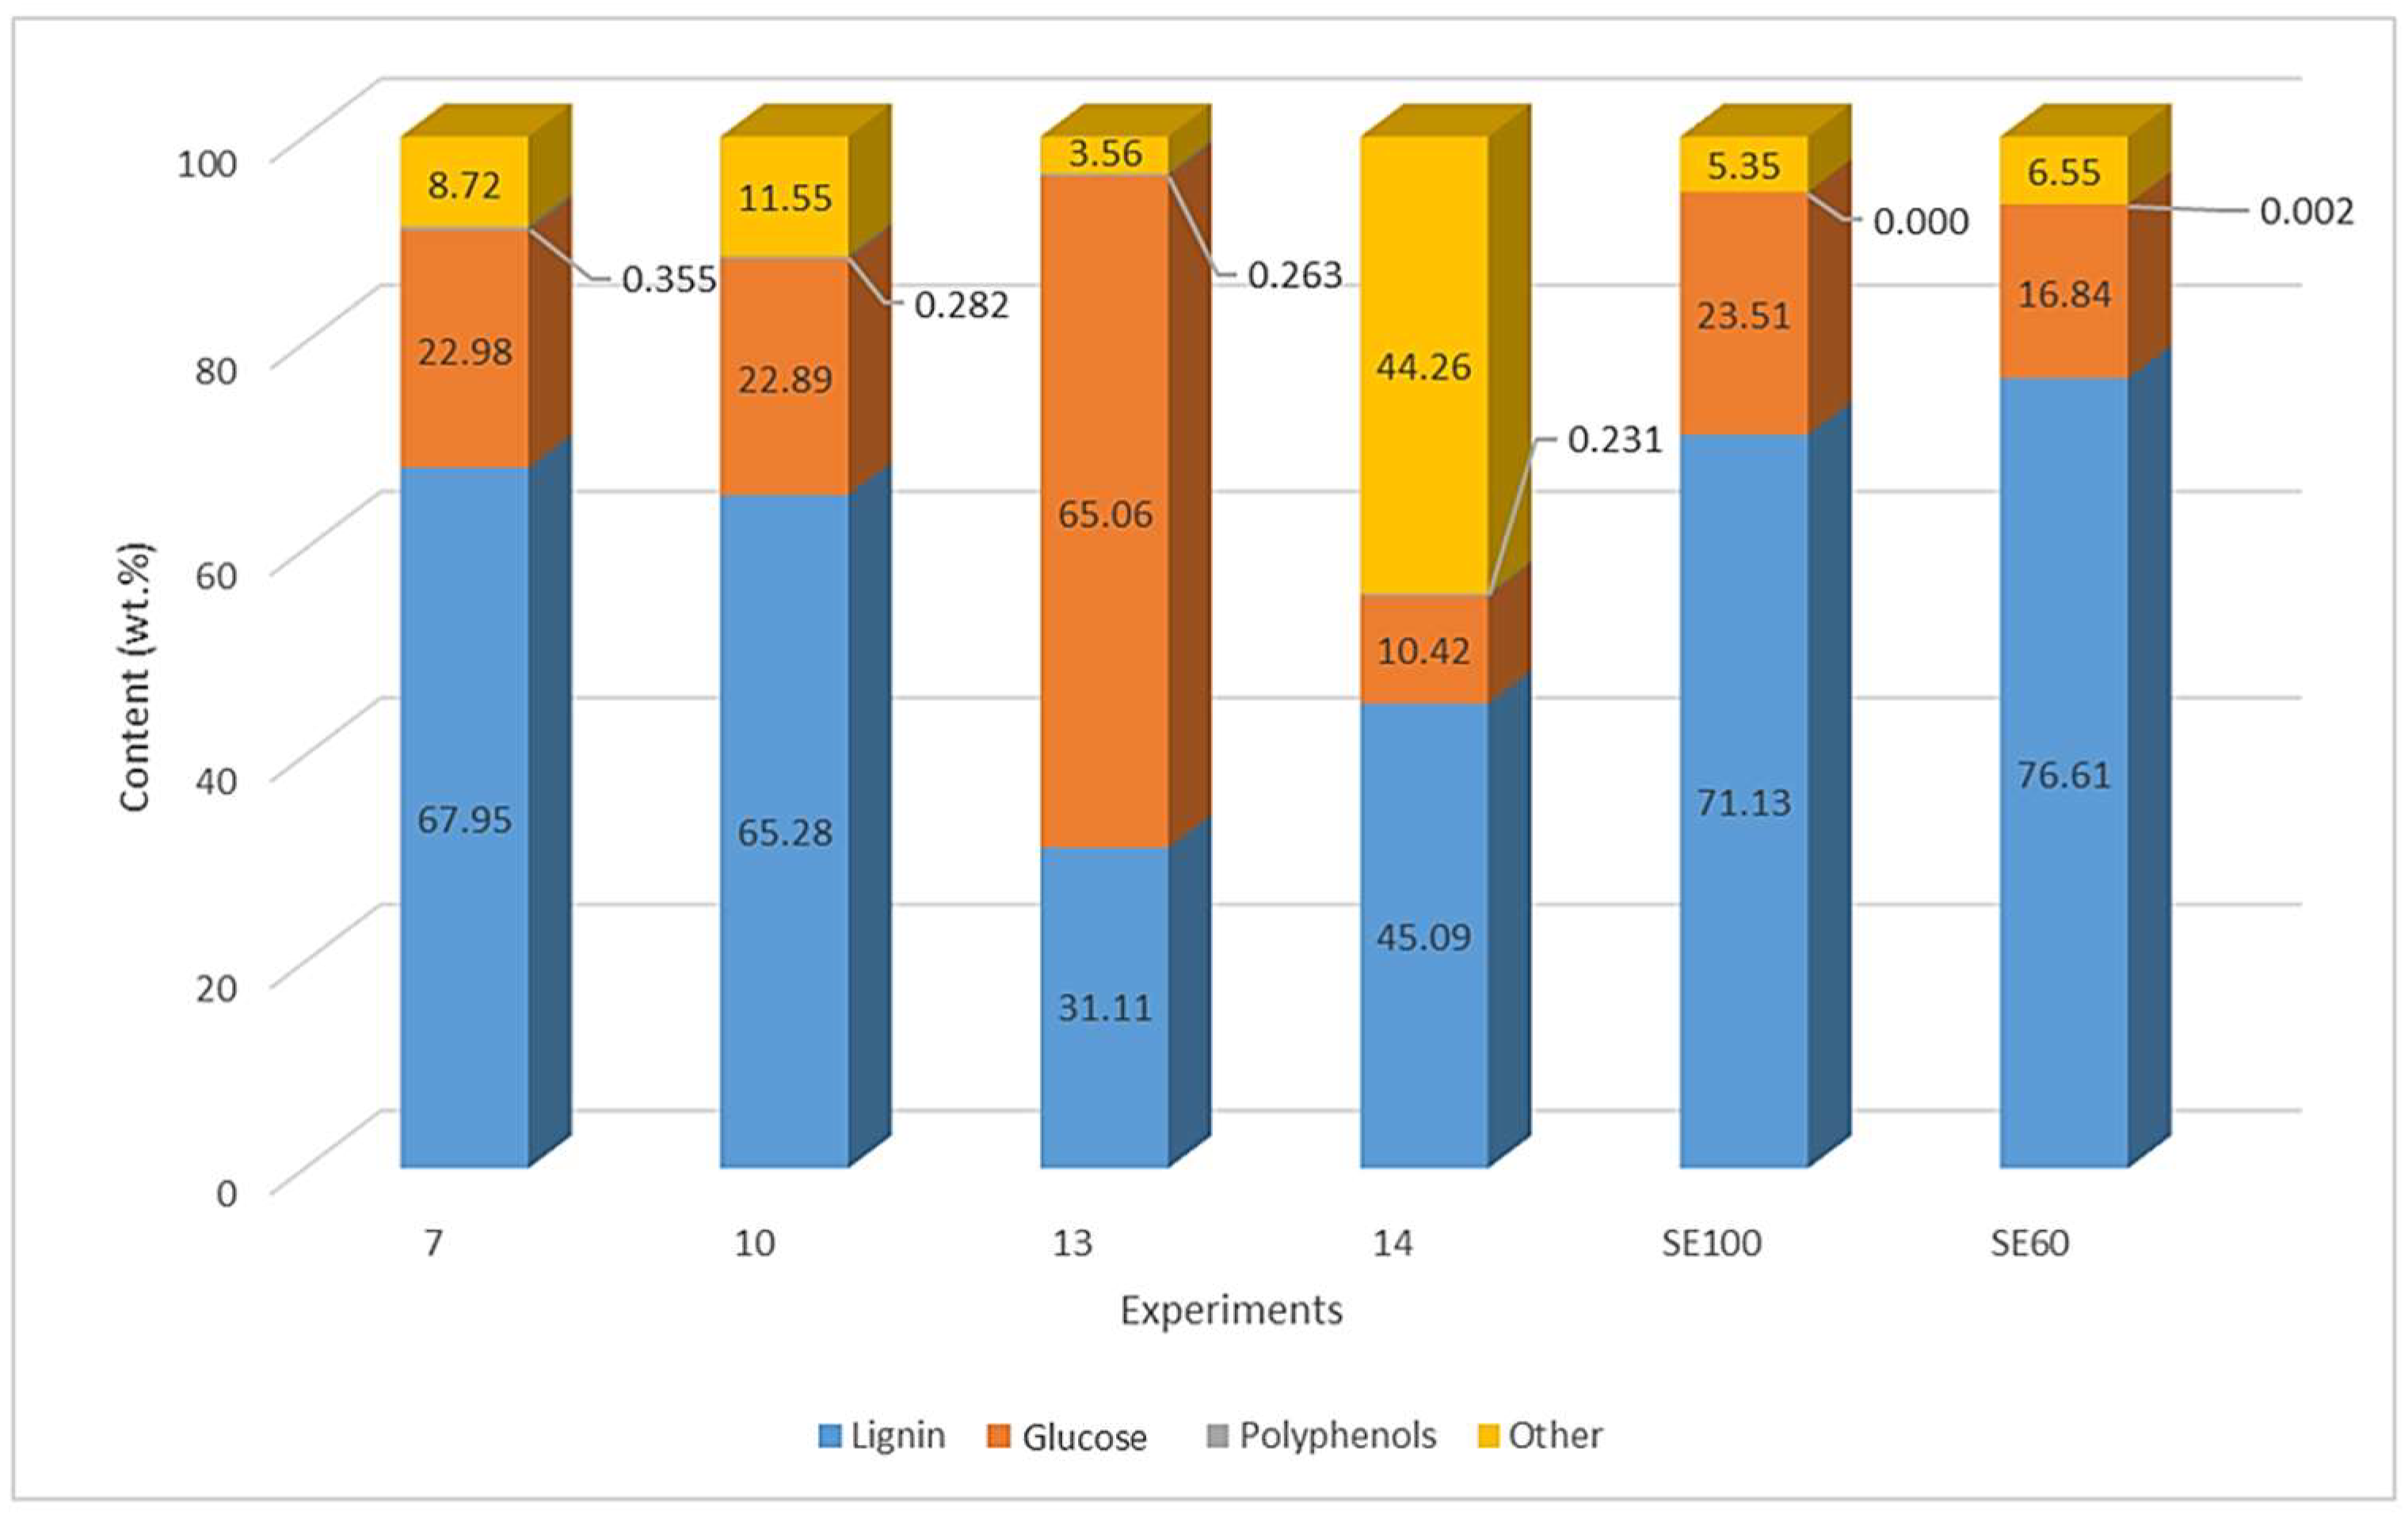
The composition of the most interesting dry extracts was analyzed (Figure 6), which means optimal extraction under MAE conditions (Exp. 7), MAE conditions of maximum temperature (Exp. 10), MAE conditions of 50% water (Exp. 13), MAE conditions of pure acetone (Exp. 14), Soxhlet conditions of pure acetone (Soxhlet 100), and Soxhlet conditions of 60% acetone (Soxhlet 60).
All these extracts contain a large quantity of small lignin polymers. However, in experiment 13, where aqueous acetone was used with 50% water, the main component in the extract was cellulose-derived glucose released during microwave extraction.
The phenolic content of the extracts was low, but in the case of dry extracts under Soxhlet conditions, it was non-existent.

3.5. Comparison Between MAE and Soxhlet Methods

The MAE and Soxhlet methods were compared under similar conditions, that is, with the same A:W for their phenolic results. The polyphenol content of the extracts from Soxhlet extraction was lower than from MAE. The remaining components (lignin, glucose, organic acids, etc.) were present in similar amounts, making Soxhlet extraction a more expensive and inefficient process in terms of time and energy consumption. It is well known that extraction methods such as MAE are more efficient than traditional methods such as Soxhlet, and that the yield reached depends on the solvent used and the conditions applied [16,17,18,19]. The results obtained in the present work not only confirm this statement but also show that a more specific extraction under mild conditions can be performed depending on the degree of polarity of the polyphenols.
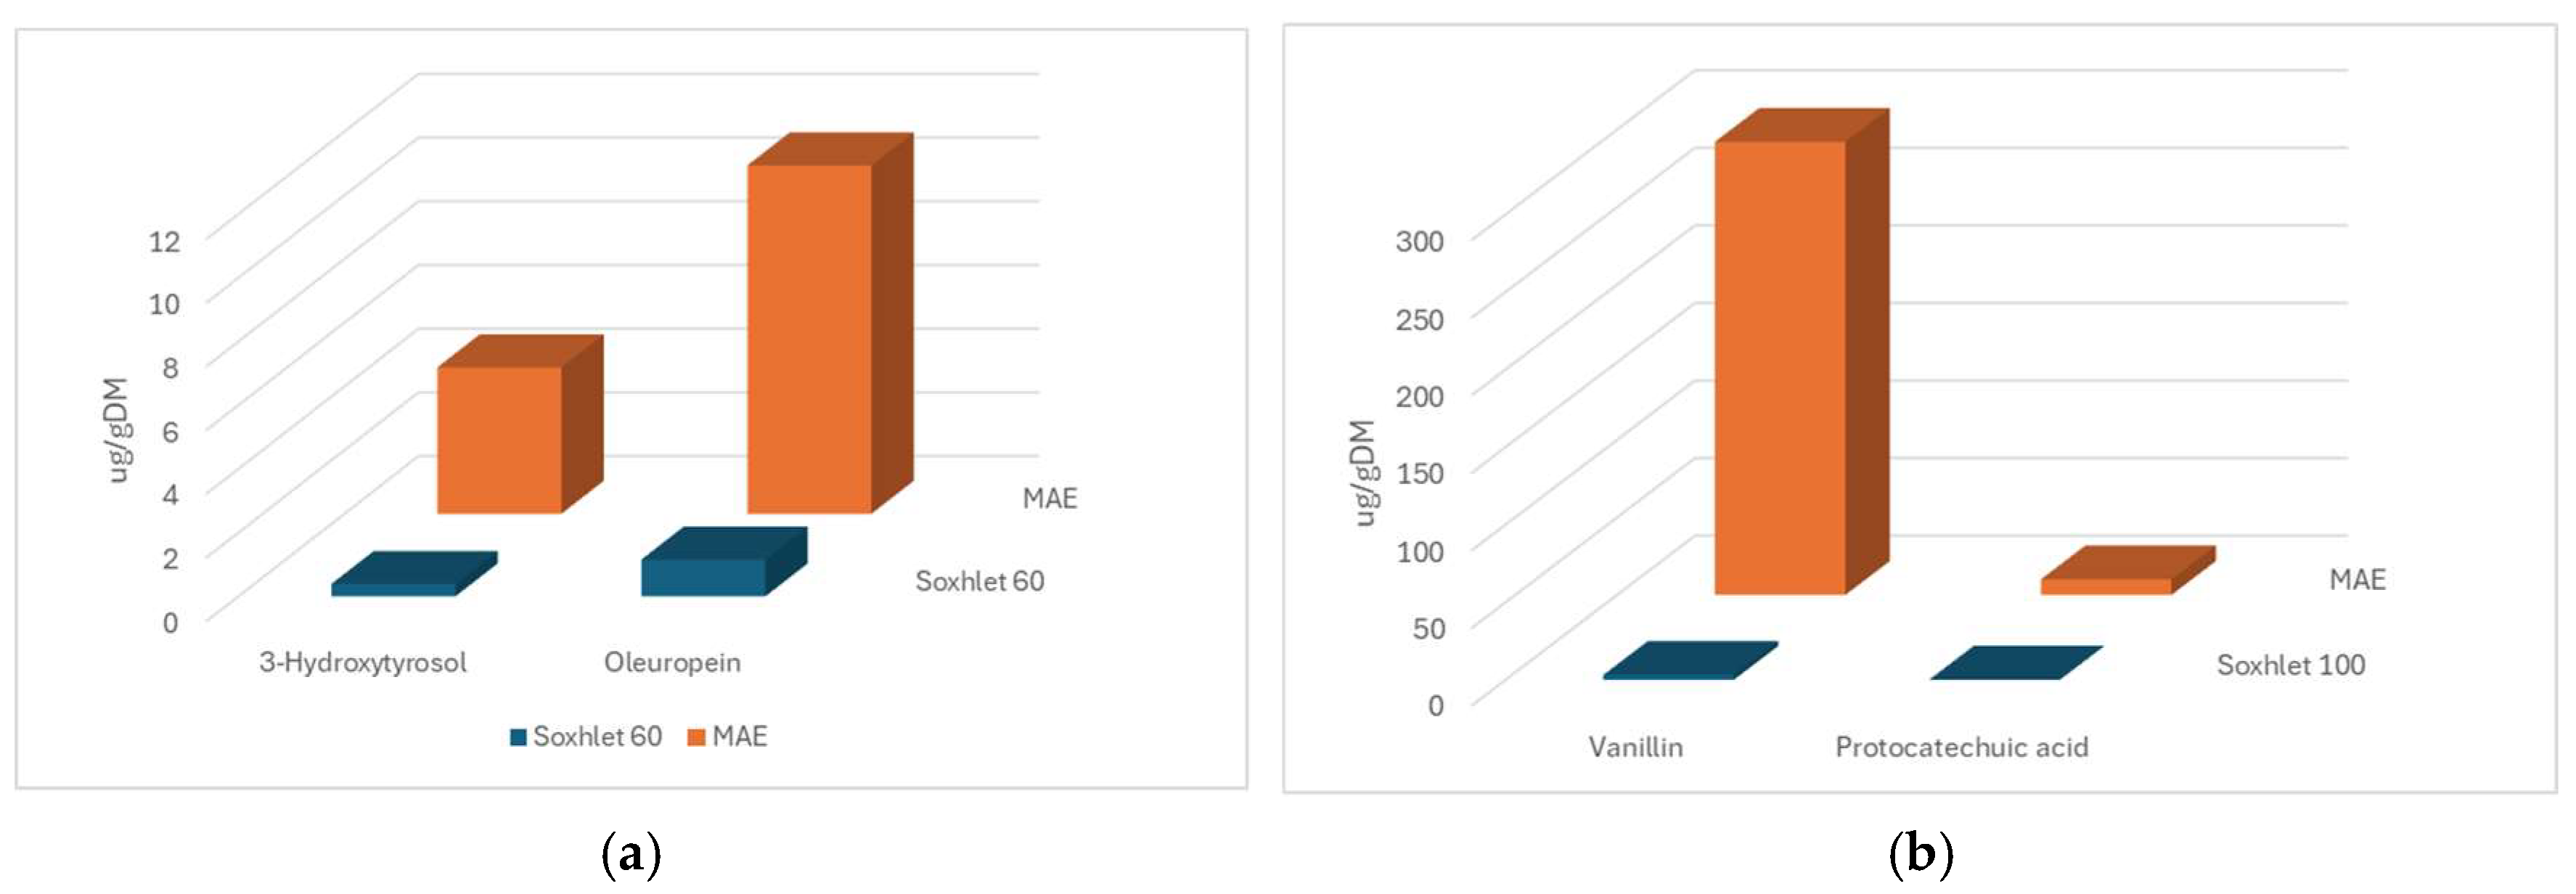
In both extraction methods, vanillin and protocatechuic acid were the predominant phenolic compounds when pure acetone was used, while oleuropein and 3-hydroxytyrosol were most abundant with 60% acetone. As Figure 7 shows, the highest yield was obtained using MAE, especially in the case of vanillin.
The results revealed that, with the same solvent but different A:W, the MAE of certain polyphenols was enhanced. For example, the highest yield of vanillin and protocatechuic acid was obtained in experiment 14 under mild temperature and time conditions, but with an A:W of 100% (Figure 7). On the contrary, the most suitable conditions for MAE of oleuropein were A:W of 60% and a lower temperature and time of 43.8 °C and 10.45 min. It can be concluded that the higher the percentage of water, the less selective the polyphenolic extraction [24,25], and the more glucose obtained. This is illustrated in experiment 13. Moreover, no significant improvement was observed at higher temperatures, i.e., the composition of these extracts was similar to others obtained under mild conditions, such as those from experiments 10 and 7, respectively (Figure 6).
Regarding the TPC and extraction yield, the best result corresponds to experiment 7. These values are similar to those achieved by Tapia-Quirós et al. [18] in the microwave-assisted extraction of polyphenols from olive pomaces, but at a lower temperature and with aqueous acetone. By modifying the process conditions (temperature, time, and, especially, A:W), it is possible to perform serial extractions of specific polyphenols from the same sample, which in turn would improve the yield extraction. Because acetone is a good solvent for lignin, a significant amount of small lignin polymers remains in the extract [28]. Therefore, it would be useful to extend the studied parameter range to more extreme values to improve the depolymerization process and the yield of polyphenol extraction in future research.
Finally, this study provides a clearer view of the polyphenol extraction process from olive stones and the composition of the extracts obtained; in particular, it shows that modifying the A:W can enhance a more selective extraction, which could be applied to other lignocellulosic materials.

4. Conclusions

OS are an important by-product of the olive-oil sector, but also, their lignin part results in an interesting source of polyphenols for the industry.
MAE was more effective than Soxhlet extraction because it allowed saving solvent and time in the process while obtaining more polyphenols. Although MAE yielded better results than Soxhlet extraction, results were lower than expected: 3.32 ± 0.66 mg GAE/g DM at 75 °C for 20 min using 60% aqueous acetone. Additionally, smaller polymers of lignin were obtained as the main components.
Regarding phenolic compounds, UHPLC analysis showed that each polyphenol is extracted by MAE under different optimal conditions. For instance, about 292.00 ± 59.63 μg/g DM of vanillin was obtained with the following operating parameters: temperature of 60 °C, time of 15 min, and an A:W of 100%, while the highest quantity of extracted 3-hydroxytyrosol was about 4.60 ± 1.21 μg hydroxytyrosol/g DM for 54.97 °C, 11.45 min, and an A:W of 56.97%.
Consequently, the results suggest that these optimal operating conditions, obtained from statistical models, can be used to extract a certain quantity of polyphenols. To improve the MAE process, it would be interesting to assay other types of pretreatments to further break down OS lignin and to try other solvents to more selectively extract polyphenols.

Author Contributions

Conceptualization, P.Á.-M.; methodology, A.C.-R. and P.Á.-M.; formal analysis, A.C.-R.; investigation, A.C.-R. and P.Á.-M.; resources, P.Á.-M.; data curation, A.C.-R., P.Á.-M. and J.F.G.-M.; writing—original draft preparation, A.C.-R.; writing—review and editing, A.C.-R. and J.F.G.-M.; supervision, P.Á.-M. and J.F.G.-M.; project administration, P.Á.-M. and J.F.G.-M.; funding acquisition, P.Á.-M. and J.F.G.-M. All authors have read and agreed to the published version of the manuscript.

Funding

This research was funded by the Ministry of Science, Innovation and Universities of Spain through the project “Biomasa y residuos como precursores de la producción acoplada de hidrógeno y metano en el nuevo escenario de transición energética industrial (ALL-TO-GAS)” of the State Plan 2021–2023—Strategic I&D lines (PLEC2022-009349), by the University of Seville through the call “Ayudas a Proyectos de Investigación Precompetitivos” of the “VI Plan Propio de Investigación y Transferencia” (grant number 2021/00001290), and by the European Commission through the project LIFE23/ENV/ES/LIFE NEEVE (project number 101148428).

Data Availability Statement

The dataset generated for this study will be available on idUS repository (Depósito de Investigación Universidad de Sevilla).

Acknowledgments

The authors acknowledge the cooperative Agrícola Olivarera Virgen del Campo S.C.A. (Cañete de las Torres, Córdoba, Spain) for providing the olive stones and the University of Seville Research, Technology and Innovation Centre (CITIUS) for allowing us to use their research services, especially mass spectrometry, microanalysis, and biology services. The authors also acknowledge Danae Abigail Candelera Juracan (C2 Proficiency qualification) for revising and improving the language of this manuscript and her insightful suggestions.

Conflicts of Interest

The authors declare no conflicts of interest.

References

  1. Gullón, P.; Gullón, B.; Astray, G.; Carpena, M.; Fraga-Corral, M.; Prieto, M.A.; Simal-Gandara, J. Valorization of By-Products from Olive Oil Industry and Added-Value Applications for Innovative Functional Foods. Food Res. 2020, 137, 109683. [Google Scholar] [CrossRef]
  2. Databases & Software|Land & Water|Food and Agriculture Organization of the United Nations. Available online: https://www.fao.org/land-water/databases-and-software/crop-information/olive/en/ (accessed on 7 May 2025).
  3. García-Martín, J.F.; Cuevas, M.; Feng, C.H.; Álvarez-Mateos, P.; Torres-García, M.; Sánchez, S. Energetic Valorisation of Olive Biomass: Olive-Tree Pruning, Olive Stones and Pomaces. Processes 2020, 8, 511. [Google Scholar] [CrossRef]
  4. Chanioti, S.; Katsouli, M.; Tzia, C. Novel Processes for the Extraction of Phenolic Compounds from Olive Pomace and Their Protection by Encapsulation. Molecules 2021, 26, 1781. [Google Scholar] [CrossRef] [PubMed]
  5. Zeb, A. Phenolic Antioxidants in Foods: Chemistry, Biochemistry and Analysis; Springer International Publishing: Cham, Switzerland, 2021; ISBN 9783030747688. [Google Scholar]
  6. Vuolo, M.M.; Lima, V.S.; Maróstica Junior, M.R. Phenolic Compounds: Structure, Classification, and Antioxidant Power. In Bioactive Compounds: Health Benefits and Potential Applications; Segura Campos, M.R., Ed.; Woodhead Publishing: Sawston, UK, 2019; pp. 33–50. ISBN 9780128147740. [Google Scholar]
  7. Khwaldia, K.; Attour, N.; Matthes, J.; Beck, L.; Schmid, M. Olive Byproducts and Their Bioactive Compounds as a Valuable Source for Food Packaging Applications. Compr. Rev. Food Sci. Food Saf. 2022, 21, 1218–1253. [Google Scholar] [CrossRef]
  8. Amawi, H.; Ashby, C.R.; Samuel, T.; Peraman, R.; Tiwari, A.K. Polyphenolic Nutrients in Cancer Chemoprevention and Metastasis: Role of the Epithelial-to-Mesenchymal (EMT) Pathway. Nutrients 2017, 9, 911. [Google Scholar] [CrossRef]
  9. Yan, B.; Chen, Z.S.; Hu, Y.; Yong, Q. Insight in the Recent Application of Polyphenols From Biomass. Front. Bioeng. Biotechnol. 2021, 9, 753898. [Google Scholar] [CrossRef] [PubMed]
  10. Vásquez-Villanueva, R.; Plaza, M.; García, M.C.; Turner, C.; Marina, M.L. A Sustainable Approach for the Extraction of Cholesterol-Lowering Compounds from an Olive by-Product Based on CO2-Expanded Ethyl Acetate. Anal. Bioanal. Chem. 2019, 411, 5885–5896. [Google Scholar] [CrossRef]
  11. Walton, N.J.; Mayer, M.J.; Narbad, A. Vanillin. Phytochemistry 2003, 63, 505–515. [Google Scholar] [CrossRef]
  12. Song, J.; He, Y.; Luo, C.; Feng, B.; Ran, F.; Xu, H.; Ci, Z.; Xu, R.; Han, L.; Zhang, D. New Progress in the Pharmacology of Protocatechuic Acid: A Compound Ingested in Daily Foods and Herbs Frequently and Heavily. Pharmacol. Res. 2020, 161, 105109. [Google Scholar] [CrossRef]
  13. Kakkar, S.; Bais, S. A Review on Protocatechuic Acid and Its Pharmacological Potential. ISRN Pharmacol. 2014, 2014, 952943. [Google Scholar] [CrossRef]
  14. Rafiee, Z.; Jafari, S.M.; Alami, M.; Khomeiri, M. Microwave-Assisted Extraction of Phenolic Compounds from Olive Leaves; a Comparison with Maceration. J. Anim. Plant Sci. 2011, 21, 738–745. [Google Scholar]
  15. Proestos, C.; Komaitis, M. Application of Microwave-Assisted Extraction to the Fast Extraction of Plant Phenolic Compounds. LWT-Food Sci. Technol. 2008, 41, 652–659. [Google Scholar] [CrossRef]
  16. Koraqi, H.; Petkoska, A.T.; Khalid, W.; Sehrish, A.; Ambreen, S.; Lorenzo, J.M. Optimization of the Extraction Conditions of Antioxidant Phenolic Compounds from Strawberry Fruits (Fragaria x Ananassa Duch.) Using Response Surface Methodology. Food Anal. Methods 2023, 16, 1030–1042. [Google Scholar] [CrossRef]
  17. Chanioti, S.; Tzia, C. Extraction of Phenolic Compounds from Olive Pomace by Using Natural Deep Eutectic Solvents and Innovative Extraction Techniques. Innov. Food Sci. Emerg. Technol. 2018, 48, 228–239. [Google Scholar] [CrossRef]
  18. Tapia-Quirós, P.; Montenegro-Landívar, M.F.; Reig, M.; Vecino, X.; Alvarino, T.; Cortina, J.L.; Saurina, J.; Granados, M. Olive Mill and Winery Wastes as Viable Sources of Bioactive Compounds: A Study on Polyphenols Recovery. Antioxidants 2020, 9, 1074. [Google Scholar] [CrossRef] [PubMed]
  19. Sharma, M.; Dash, K.K. Microwave and Ultrasound Assisted Extraction of Phytocompounds from Black Jamun Pulp: Kinetic and Thermodynamics Characteristics. Innov. Food Sci. Emerg. Technol. 2022, 75, 102913. [Google Scholar] [CrossRef]
  20. Uzel, R.A. Microwave-Assisted Green Extraction Technology for Sustainable Food Processing. In Emerging Microwave Technologies in Industrial, Agricultural, Medical and Food Processing; Kok Yeow, Y., Ed.; IntechOpen: London, UK, 2018; pp. 159–178. [Google Scholar]
  21. Gomez, L.; Tiwari, B.; Garcia-Vaquero, M. Emerging Extraction Techniques: Microwave-Assisted Extraction. In Sustainable Seaweed Technologies: Cultivation, Biorefinery, and Applications; Torres, M.D., Kraan, S., Dominguez, H., Eds.; Elsevier: Amsterdam, The Netherlands, 2020; pp. 207–224. ISBN 9780128179437. [Google Scholar]
  22. Chirinos, R.; Rogez, H.; Campos, D.; Pedreschi, R.; Larondelle, Y. Optimization of Extraction Conditions of Antioxidant Phenolic Compounds from Mashua (Tropaeolum tuberosum Ruíz & Pavón) Tubers. Sep. Purif. Technol. 2007, 55, 217–225. [Google Scholar] [CrossRef]
  23. Aires, A. Phenolics in Foods: Extraction, Analysis and Measurements. In Phenolic Compounds-Natural Sources, Importance and Applications; Soto-Hernández, M., Palma-Tenango, M., García-Mateos, R., Eds.; IntechOpen: London, UK, 2017; pp. 61–88. ISBN 978-953-51-5089-3. [Google Scholar]
  24. Das, A.J.; Khawas, P.; Seth, D.; Miyaji, T.; Deka, S.C. Optimization of the Extraction of Phenolic Compounds from Cyclosorus extensa with Solvents of Varying Polarities. Prep. Biochem. Biotechnol. 2016, 46, 755–763. [Google Scholar] [CrossRef]
  25. Sridhar, A.; Ponnuchamy, M.; Kumar, P.S.; Kapoor, A.; Vo, D.V.N.; Prabhakar, S. Techniques and Modeling of Polyphenol Extraction from Food: A Review. Environ. Chem. Lett. 2021, 19, 3409–3443. [Google Scholar] [CrossRef]
  26. Araujo, R.G.; Rodríguez-Jasso, R.M.; Ruíz, H.A.; Govea-Salas, M.; Pintado, M.; Aguilar, C.N. Recovery of Bioactive Components from Avocado Peels Using Microwave-Assisted Extraction. Food Bioprod. Process. 2021, 127, 152–161. [Google Scholar] [CrossRef]
  27. Elboughdiri, N.; Ghernaout, D.; Kriaa, K.; Jamoussi, B. Enhancing the Extraction of Phenolic Compounds from Juniper Berries Using the Box-Behnken Design. ACS Omega 2020, 5, 27990–28000. [Google Scholar] [CrossRef]
  28. Arefmanesh, M.; Nikafshar, S.; Master, E.R.; Nejad, M. From Acetone Fractionation to Lignin-Based Phenolic and polyurethane Resins. Ind. Crops. Prod. 2022, 178, 114604. [Google Scholar] [CrossRef]
  29. Li, M.F.; Sun, S.N.; Xu, F.; Sun, R.C. Sequential Solvent Fractionation of Heterogeneous Bamboo Organosolv Lignin for Value-Added Application. Sep. Purif. Technol. 2012, 101, 18–25. [Google Scholar] [CrossRef]
  30. Al Juhaimi, F.; Uslu, N.; Babiker, E.E.; Ghafoor, K.; Mohamed Ahmed, I.A.; Özcan, M.M. The Effect of Different Solvent Types and Extraction Methods on Oil Yields and Fatty Acid Composition of Safflower Seed. J. Oleo Sci. 2019, 68, 1099–1104. [Google Scholar] [CrossRef] [PubMed]
  31. Singleton, V.L.; Rossi, J.A. Colorimetry of Total Phenolics with Phosphomolybidc-Phosphotungstic Acid Reagents. Am. J. Enol. Vitic. 1965, 16, 144–158. [Google Scholar] [CrossRef]
  32. Carmona-Hernandez, J.C.; Taborda-Ocampo, G.; González-Correa, C.H. Folin-Ciocalteu Reaction Alternatives for Higher Polyphenol Quantitation in Colombian Passion Fruits. Int. J. Food Sci. 2021, 2021, 8871301. [Google Scholar] [CrossRef] [PubMed]
  33. Raposo, F.; Borja, R.; Gutiérrez-González, J.A. A Comprehensive and Critical Review of the Unstandardized Folin-Ciocalteu Assay to Determine the Total Content of Polyphenols: The Conundrum of the Experimental Factors and Method Validation. Talanta 2024, 272, 125771. [Google Scholar] [CrossRef]
  34. Magalhães, L.M.; Santos, F.; Segundo, M.A.; Reis, S.; Lima, J.L.F.C. Rapid Microplate High-Throughput Methodology for Assessment of Folin-Ciocalteu Reducing Capacity. Talanta 2010, 83, 441–447. [Google Scholar] [CrossRef]
  35. Valderrama Fernández, M.d.R. Cuantificación de Hormonas Vegetales y Estudio Metabolómico Mediante Cromatografia-Espectrometría de Masas de Alta Resolución. Aplicación a La Interacción Alfalfa-PGPR. Ph.D. Thesis, Universidad de Sevilla, Seville, Spain, 2024. [Google Scholar]
  36. DuBois, M.; Gilles, K.A.; Hamilton, J.K.; Rebers, P.A.; Smith, F. Colorimetric Method for Determination of Sugars and Related Substances. Anal. Chem. 1956, 28, 350–356. [Google Scholar] [CrossRef]
  37. Ogura, I.; Sugiyama, M.; Tai, R.; Mano, H.; Matsuzawa, T. Optimization of Microplate-Based Phenol-Sulfuric Acid Method and Application to the Multi-Sample Measurements of Cellulose Nanofibers. Anal. Biochem. 2023, 681, 115329. [Google Scholar] [CrossRef]
  38. Masuko, T.; Minami, A.; Iwasaki, N.; Majima, T.; Nishimura, S.I.; Lee, Y.C. Carbohydrate Analysis by a Phenol-Sulfuric Acid Method in Microplate Format. Anal. Biochem. 2005, 339, 69–72. [Google Scholar] [CrossRef]
  39. Technical Association of the Pulp and Paper Industry (TAPPI). Acid-Insoluble Lignin in Wood and Pulp (T-222-om-02); TAPPI Press: Atlanta, GA, USA, 2006; pp. 1–7. [Google Scholar]
  40. Nitzsche, R.; Gröngröft, A.; Köchermann, J.; Meisel, K.; Etzold, H.; Verges, M.; Leschinsky, M.; Bachmann, J.; Saake, B.; Torkler, S.; et al. Platform and Fine Chemicals from Woody Biomass: Demonstration and Assessment of a Novel Biorefinery. Biomass Convers. Biorefinery 2020, 11, 2369–2385. [Google Scholar] [CrossRef]
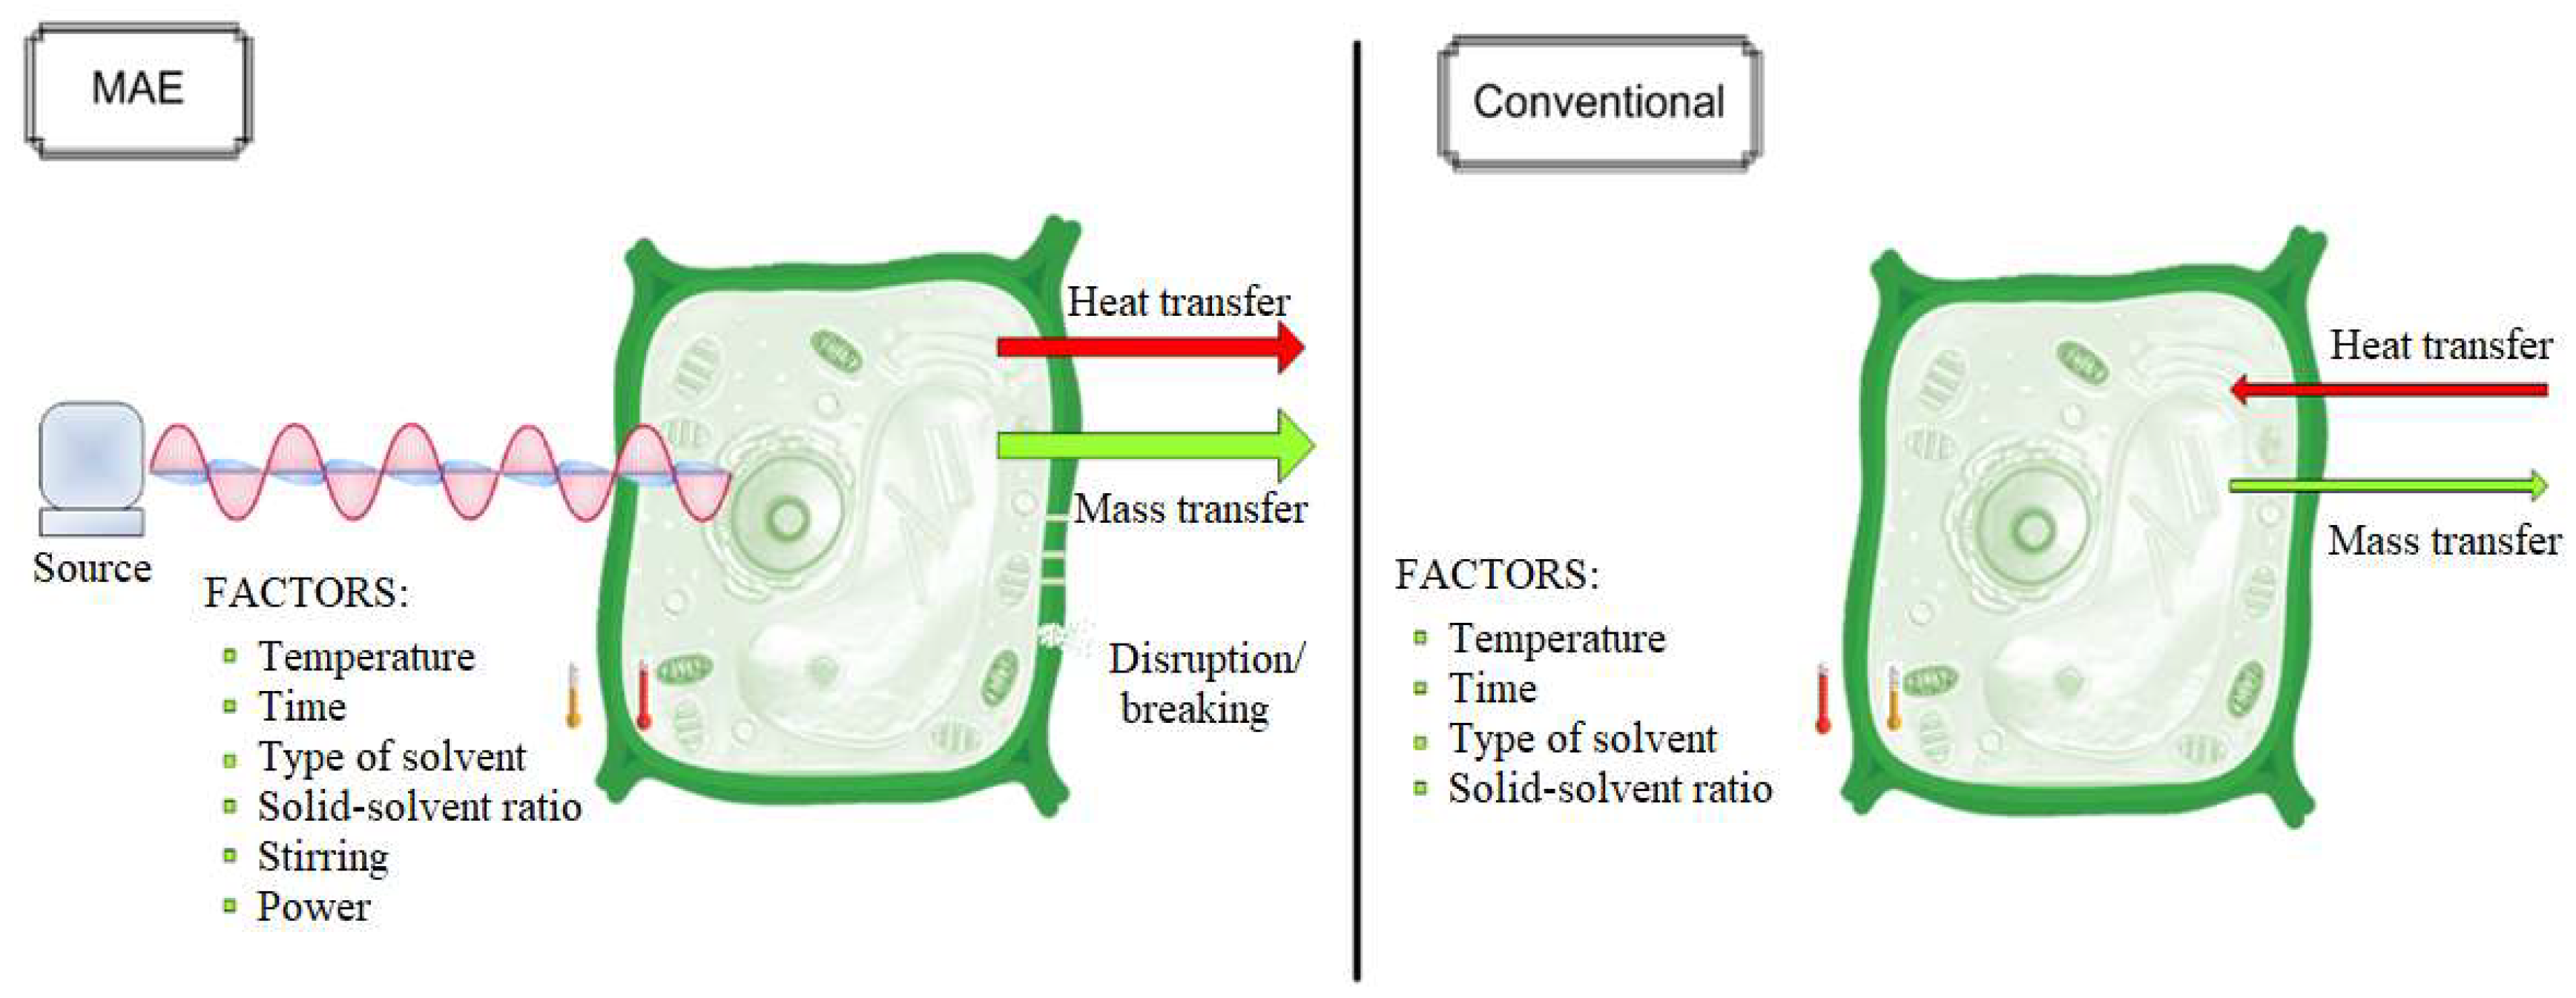
Figure 1. Principles of microwave-assisted extraction (MAE) and conventional extraction.
Agronomy 15 01761 g001
Figure 2. Comparison between the main phenolic compounds obtained by Soxhlet extraction according to the literature [14,23,26,27] and optimal MAE conditions (blue and orange, respectively).
Agronomy 15 01761 g002
Figure 3. (a) Generated response surface plot of the extraction yield (temperature vs. acetone:water (v/v) ratio, A:W), where the red frame indicates the experimental range, and the black arrow is the optimum. The 2D contour plot shows the optimum for phenolic compounds (b) and the optimum for total phenolic content (TPC) (c), where the optimal value is represented as a cross in the square of the red frame.
Agronomy 15 01761 g003
Figure 4. The response surface plots; temperature vs. acetone:water (v/v), ratio, A:W. The black arrow indicates the optimum, while the red frame indicates the study area.
Agronomy 15 01761 g004
Figure 5. (a) The 2D contour plot shows the optimum for each polyphenol and (b) generated response surface plots, temperature vs. acetone:water (v/v) ratio (A:W). The red frame indicates the experimental range, and the black arrow is the optimum.
Agronomy 15 01761 g005
Figure 6. Composition in different dry extracts obtained by microwave-assisted extraction (MAE) (7, 10, 13, and 14) and Soxhlet. Sugars from the depolymerization of hemicellulose and organic acids were not measured; therefore, they are included in other (yellow bar).
Agronomy 15 01761 g006
Figure 7. Comparison between the best process conditions for (a) Soxhlet and (b) microwave-assisted extraction (MAE) according to acetone:water (v/v) ratio (A:W).
Agronomy 15 01761 g007
Table 1. Data about 5 levels of each factor (temperature, T; time, t; and acetone:water (v/v) ratio, A:W), where ± α = ± 1682.
IDFactor (Unit)Levels
−α−10+1
AT (°C)27.545607592.5
Bt (min)210152028
CA:W (% v/v)50607590100
Table 2. Phenolic compounds and organic acids identified by UPLC in the microwave-assisted extraction (MAE) of olive stones. Blue square (found) and grey square (not found).
Phenolic CompoundMAE ExperimentsSoxhlet
12345678910111213141560100
Gallic acid 1 A
Protocatechuic acid 1
3-Hydroxytyrosol 1
3-O-Methylgallic acid 1
4-Hydroxybenzoic acid 1
Chlorogenic acid 2 A
Dihydrocaffeic acid 3
2,4-Dihydroxybenzoic acid 1
Caffeic acid 3
Vanillin 4
Phloretic acid 5
p-Coumaric acid 3
Ferulic acid 3
Salicylic acid 1
Naringin 6
Neohesperidin 6
Oleuropein 7 A
Apigenin-7-O-glucoside 6
Kaempferol-3-O-glucoside 6
Luteolin-4′-O-glucoside 6
Quercetin 6
Organic acid
(L)-Malic acid
Succinic acid
Phenolic compounds: 1 Hydroxybenzoic acid; 2 Cinnamyl ester; 3 Cinnamic acid and derivatives; 4 Phenolic aldehydes; 5 Phenylpropanoid acid; 6 Flavonoid; 7 Secoiridoid [1,6]. A In some replicates, it was not found.
Table 3. A Central Composite Design (CCD model) for microwave-assisted extraction (MAE) with the following process conditions: 3 factors (temperature, T, time, t, and acetone:water (v/v) ratio, A:W) and their levels (real and codified), and the following studied parameters: extraction yield (ηE), total polyphenolic content (TPC), and the quantity of polyphenols and glucose.
ExpFactorsCodified FactorsηE 1TPC Polyphenol Quantity
(µg/g DM)
Glucose Quantity 1
T (°C)t (min)A:W (%)ABC(wt.%)(mg GAE/g DM)VanillinProtocatechuic AcidHydroxytyrosolOleuropein(mg Glc/g DM)
175.010901−112.233.10 ± 0.00173.935.173.624.342.31 ± 0.01
245.01090−1−111.371.83 ± 0.00122.503.402.221.251.35 ± 0.02
375.020901112.303.27 ± 0.03203.499.882.448.484.84 ± 0.01
445.02090−1111.842.78 ± 0.00 177.559.172.152.883.46 ± 0.05
575.010601−1−12.503.25 ± 0.00175.315.784.289.584.24 ± 0.04
645.01060−1−1−12.052.57 ± 0.00164.886.184.9912.672.30 ± 0.05
775.0206011−12.713.55 ± 0.04136.228.001.923.676.23 ± 0.06
845.02060−11−12.082.69 ± 0.03147.825.943.755.392.26 ± 0.01
927.51575−1.682001.552.01 ± 0.0063.102.241.931.581.50 ± 0.01
1092.515751.682002.262.82 ± 0.00121.917.232.024.301.88 ± 0.01
1160.02750−1.68201.822.51 ± 0.00108.493.583.527.930.93 ± 0.00
1260.0287501.68201.922.55 ± 0.00109.554.582.616.911.92 ± 0.01
1360.0155000−1.6822.202.63 ± 0.02212.125.223.616.518.23 ± 0.04
1460.015100001.6821.602.31 ± 0.00314.7010.862.791.334.75 ± 0.01
1560.015750002.002.77 ± 0.00126.764.893.734.191.95 ± 0.02
1560.015750001.912.56 ± 0.0075.992.662.953.472.83 ± 0.02
1560.015750001.962.64 ± 0.00136.564.852.894.062.20 ± 0.04
1560.015750001.892.39 ± 0.00131.094.693.013.902.00 ± 0.03
1560.015750002.172.93 ± 0.01145.415.674.304.971.90 ± 0.03
1560.015750002.062.76 ± 0.00137.64.813.264.681.33 ± 0.04
1. Data are presented with standard deviation.
Disclaimer/Publisher’s Note: The statements, opinions and data contained in all publications are solely those of the individual author(s) and contributor(s) and not of MDPI and/or the editor(s). MDPI and/or the editor(s) disclaim responsibility for any injury to people or property resulting from any ideas, methods, instructions or products referred to in the content.