Article

FGS-YOLOv8s-seg: A Lightweight and Efficient Instance Segmentation Model for Detecting Tomato Maturity Levels in Greenhouse Environments

1
College of Mechanical and Electronic Engineering, Shandong Agricultural University, Tai’an 271018, China
2
Shandong Engineering Research Center of Agricultural Equipment Intelligentization, Shandong Agricultural University, Tai’an 271018, China
3
Shandong Key Laboratory of Intelligent Production Technology and Equipment for Facility Horticulture, Shandong Agricultural University, Tai’an 271018, China
*
Author to whom correspondence should be addressed.
These authors contributed equally to this work.
Agronomy 2025, 15(7), 1687; https://doi.org/10.3390/agronomy15071687
Submission received: 11 June 2025 / Revised: 2 July 2025 / Accepted: 10 July 2025 / Published: 12 July 2025
(This article belongs to the Section Precision and Digital Agriculture)

Abstract

In a greenhouse environment, the application of artificial intelligence technology for selective tomato harvesting still faces numerous challenges, including varying lighting, background interference, and indistinct fruit surface features. This study proposes an improved instance segmentation model called FGS-YOLOv8s-seg, which achieves accurate detection and maturity grading of tomatoes in greenhouse environments. The model incorporates a novel SegNext_Attention mechanism at the end of the backbone, while simultaneously replacing Bottleneck structures in the neck layer with FasterNet blocks and integrating Gaussian Context Transformer modules to form a lightweight C2f_FasterNet_GCT structure. Experiments show that this model performs significantly better than mainstream segmentation models in core indicators such as precision (86.9%), recall (76.3%), average precision (mAP@0.5 84.8%), F1-score (81.3%), and GFLOPs (35.6 M). Compared with the YOLOv8s-seg baseline model, these metrics show improvements of 2.6%, 3.8%, 5.1%, 3.3%, and 6.8 M, respectively. Ablation experiments demonstrate that the improved architecture contributes significantly to performance gains, with combined improvements yielding optimal results. The analysis of detection performance videos under different cultivation patterns demonstrates the generalizability of the improved model in complex environments, achieving an optimal balance between detection accuracy (86.9%) and inference speed (53.2 fps). This study provides a reliable technical solution for the selective harvesting of greenhouse tomatoes.

1. Introduction

Tomato is the most typical greenhouse vegetable crop globally, with rich nutritional value and high economic value [1]. The selective harvesting of tomatoes represents a key link in agricultural production and quality control, which directly affects many aspects such as fruit quality, taste, storage, and economic benefits [2]. Determining tomato maturity serves as the core basis for selective harvesting, affecting product quality, market value, and supply chain efficiency [3,4]. Therefore, accurate maturity determination in greenhouse environments holds significant importance for improving harvesting efficiency, ensuring fruit quality, promoting intelligent picking, and optimizing production management.
The traditional method for assessing tomato maturity relies primarily on experience and sensory testing [5,6]. Although offering advantages such as low cost and simplicity, it suffers from strong subjectivity, environmental interference, and inefficiency. These limitations make it difficult to ensure consistency and accuracy, rendering it unsuitable for large-scale cultivation scenarios [7]. With advances in high-performance image processors and the availability of millions of labeled data samples, deep learning models have achieved breakthroughs in fruit detection [8,9,10,11,12,13,14], particularly in efficient and accurate identification of tomato varieties and their phenotypic characteristics [15,16]. Wang et al. proposed the PDSI-RTDETR model for tomato maturity detection, achieving an mAP50 of 86.8–3.9% higher than the original RT-DETR with 17.6% lower GFLOPs [4]. Wang et al. designed the MatDet model for tomato maturity detection, attaining an mAP of 96.14% and demonstrating excellent performance in complex scenarios [17]. Gu et al. improved the RTDETR model for tomato fruit detection and phenotyping, achieving 88.3% precision, an mAP0.5 of 0.86, and a correlation coefficient of 0.79 for fruit diameter calculations [18]. Zhang et al. proposed a cascaded deep learning network based on YOLOv5 for tomato detection and classification, achieving a precision of 82.4% and a recall of 90.9% for unobstructed tomatoes. In addition, the network achieved an average precision of 96.9% for tomato maturity classification and a detection speed of 20 fps [19]. Zeng et al. optimized the YOLOv5 model for real-time tomato detection and maturity assessment, reducing the model size and FLOP by 51% and 84.15%, respectively. Meanwhile, the model achieved an mAP of 96.9% and a detection speed of 26.5 fps [20]. The MTD-YOLOv7 model [21] and LACTA algorithm [22] were applied to cherry tomato maturity detection, achieving accuracies of 86.6% and 94%, respectively.
However, tomatoes in a greenhouse environment exhibit significant variations in color and shape across different growth stages [23]. During their immature and color transition stages, tomato fruits often blend with the background, exacerbating image recognition challenges. Furthermore, the single-stage bounding-box-based detection algorithms used in these studies struggle to meet subsequent processing requirements such as centroid localization, size measurement, and posture prediction. Compared with traditional bounding-box-based detection methods, instance segmentation algorithms can not only identify objects and provide category labels but also generate pixel-level masks that accurately represent object shapes and boundaries, thereby reducing background interference more effectively [24]. Qi et al. enhanced the YOLOv8-seg model by modifying the neck layer and introducing the Soft-SPPF module for tomato stem diameter measurement, achieving mAP50 values of 66.4% (bounding box) and 66.5% (mask detection) [25]. Zhang et al. [26] applied the Mask R-CNN framework to address background interference in Huangguan Pear segmentation, significantly improving contrast feature extraction through CLAHE preprocessing. Yue et al. [27] developed the YOLOv8s-Seg model via architectural reorganization and convolutional enhancement, attaining an 88.7% F1-score and a 92.2% mAP@0.5 on a tomato dataset with diverse maturity and disease characteristics. Liu et al. [28] combined YOLOv7 and HRNet architectures to create a maturity segmentation network with 84.69% MIoU, 91.52% MPA, and 94.39% overall precision. In a comparative study of orchard segmentation algorithms, Sapkota et al. [29] demonstrated YOLOv8’s superiority over Mask R-CNN for apple development stage detection.
Although the existing bounding-box-based detection algorithm can solve the problem of tomato maturity classification and recognition, the application of bounding box detection is very limited, and it is difficult to apply it to the positioning and picking of tomatoes. The application of instance segmentation in tomato maturity classification in greenhouse environments is still in the early stage of exploration. This paper proposes FGS-YOLOv8s-seg, a small-target detection model designed to address tomato maturity grading in greenhouse environments with complex backgrounds. The algorithm achieves an optimal balance between precision, GFLOPs, and detection speed, and the model effect is better than the mainstream methods. By applying instance segmentation to tomato maturity grading, this work not only overcomes existing algorithmic limitations in fine-grained tasks but also provides reliable technical support for precise picking-point localization and occlusion compensation in intelligent harvesting systems. The main contributions of this study are as follows:
(1)
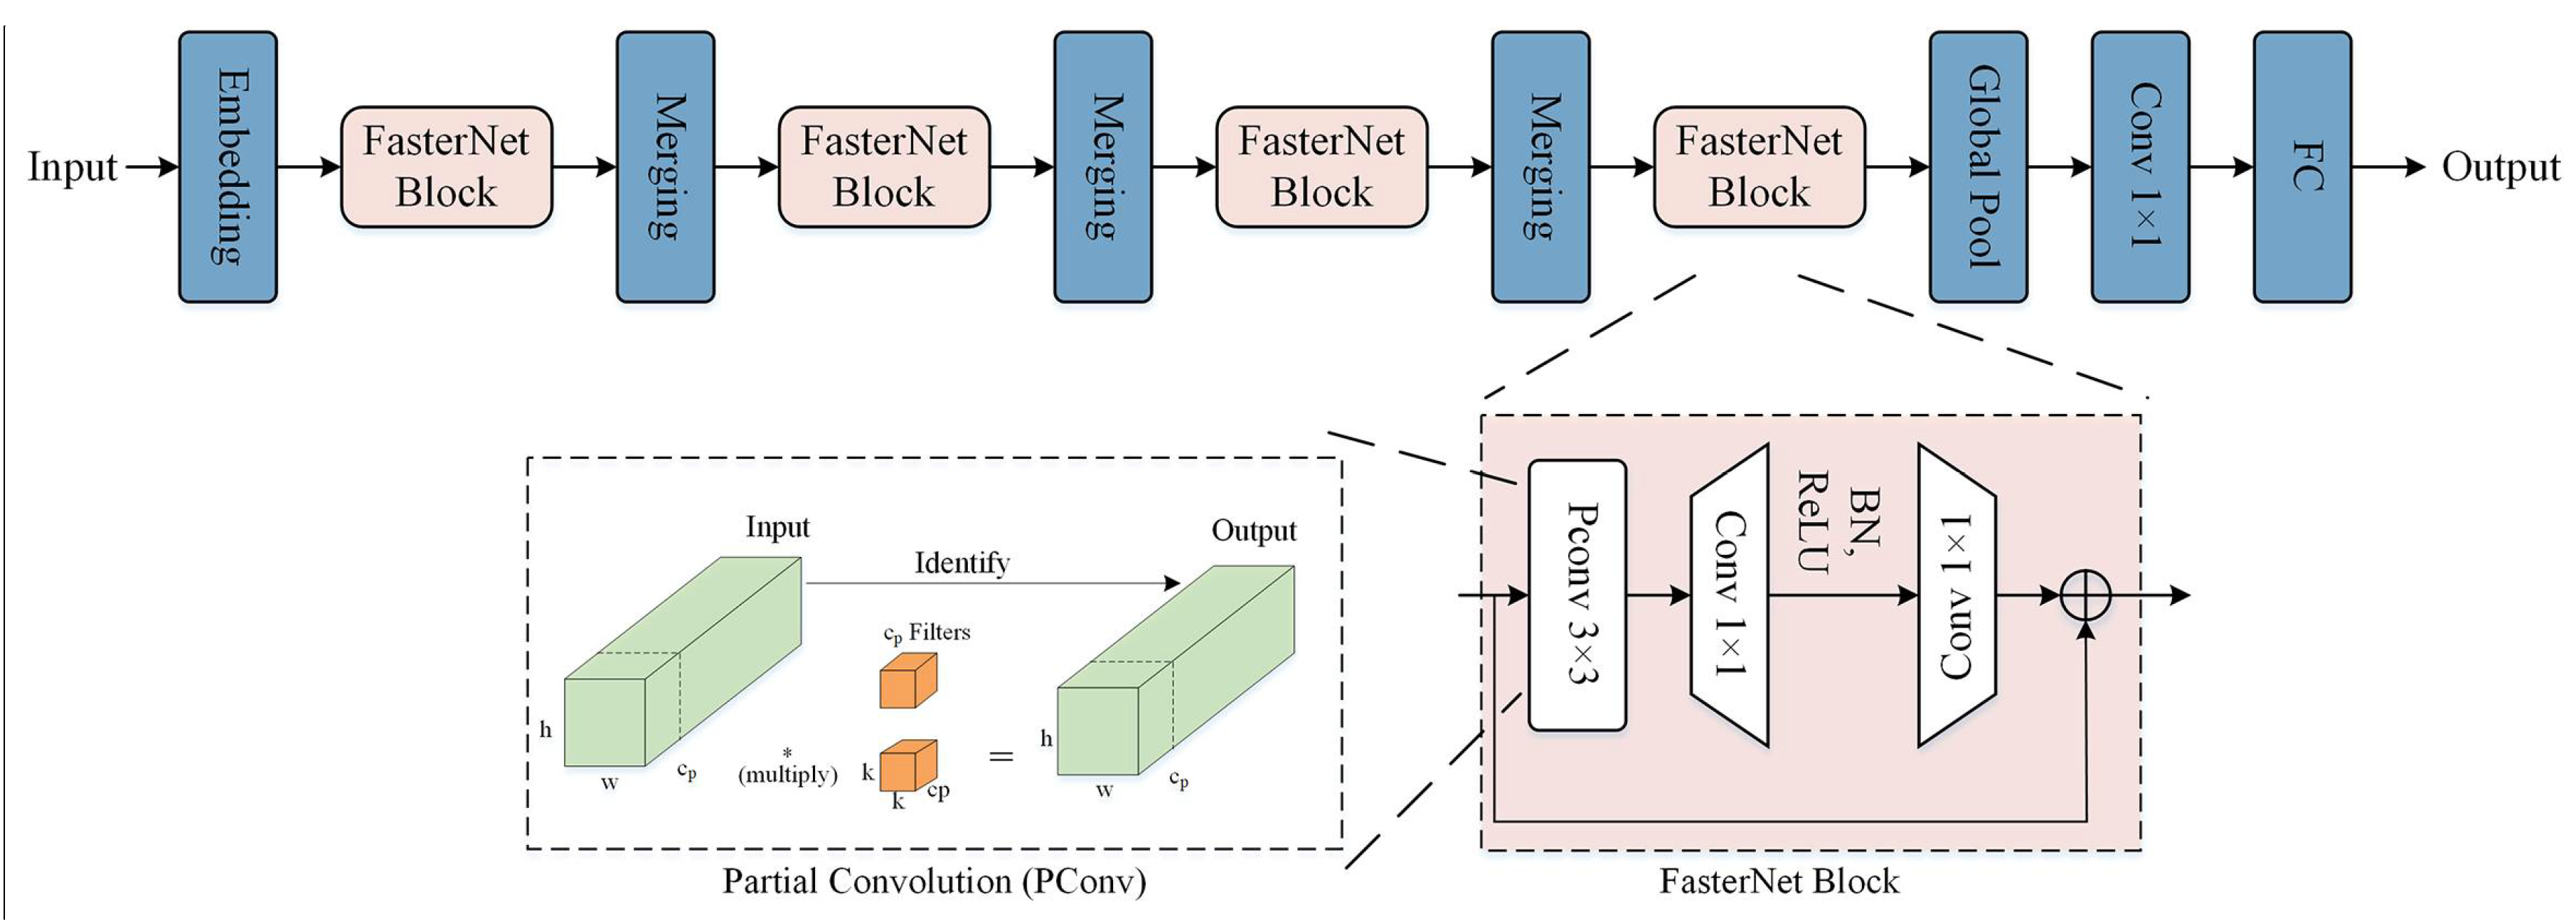
In order to improve the recognition ability of tomato boundaries, the GCT attention mechanism was embedded after the Split operation in the C2f module so that the model could more accurately recognize the target boundary when extracting multi-scale features. At the same time, the FasterNet module was added to form a lightweight C2f_Faster_GCT module, which significantly reduced the computational complexity and improved the model efficiency.
(2)
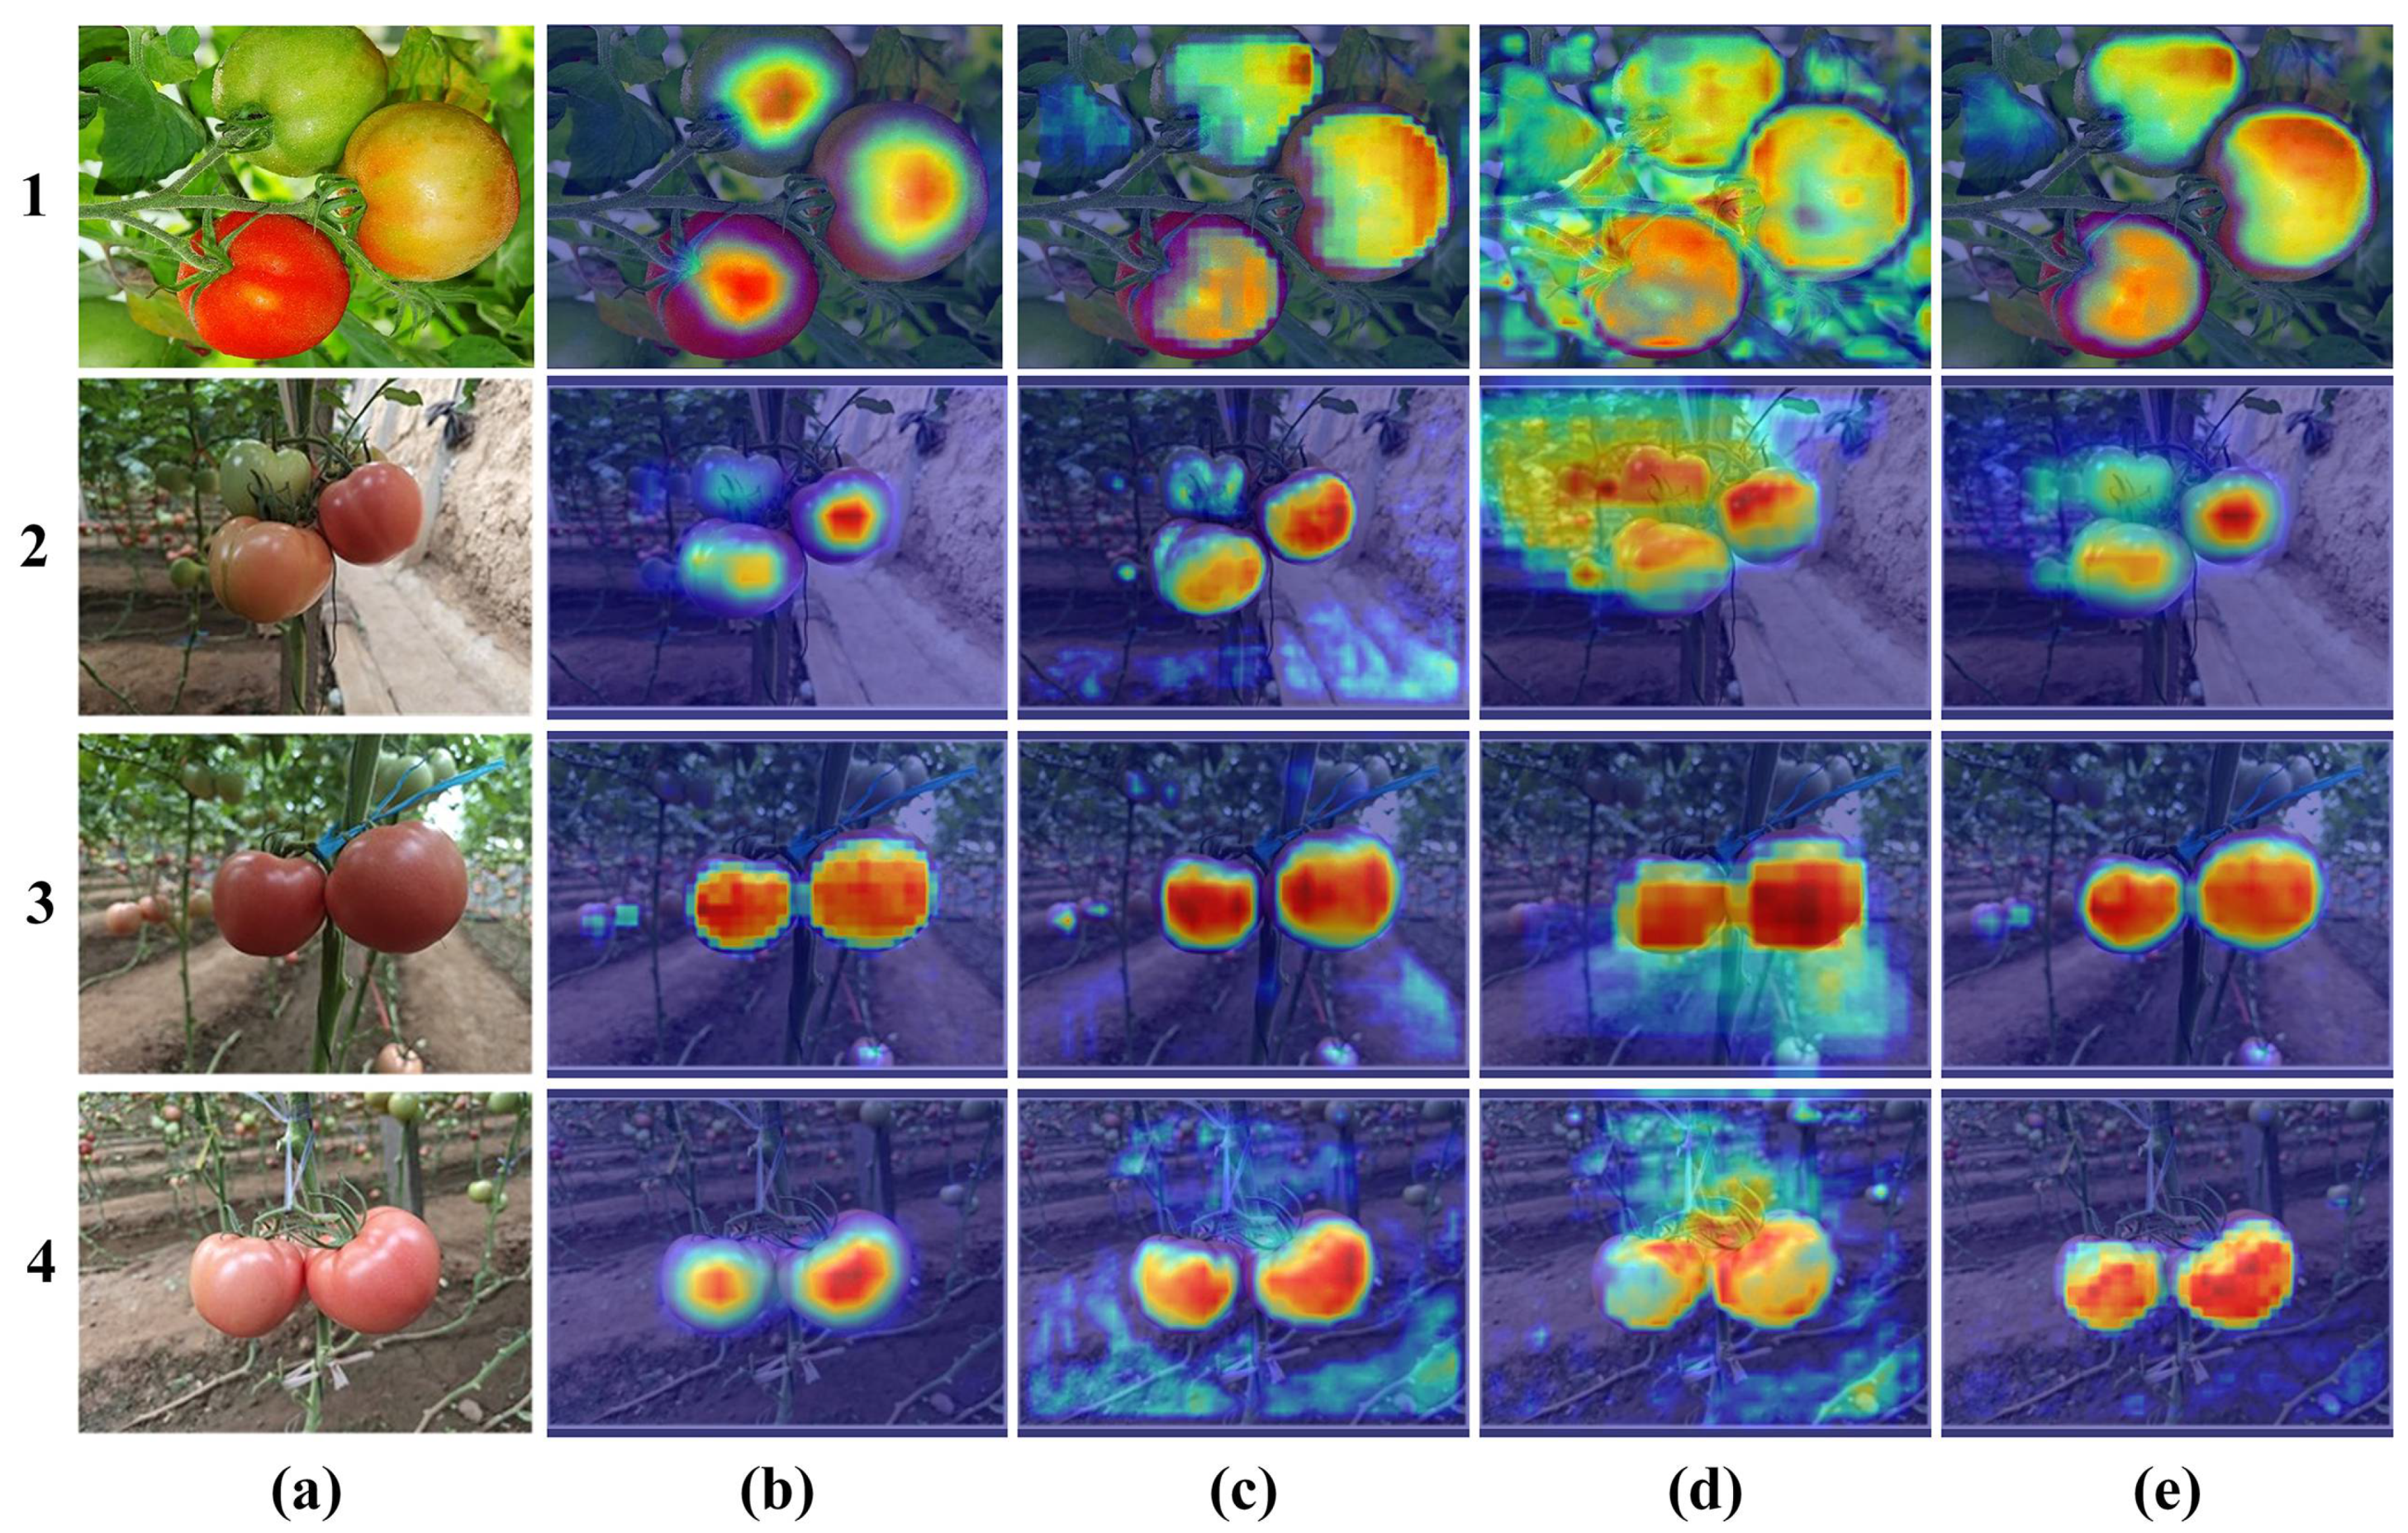
To address the interference of overall structural orientation, peduncle distribution patterns, and occluded backgrounds in tomato detection, the SegNext_Attention mechanism was constructed. By enhancing the spatial attention performance of the model, the model can better utilize global semantic dependencies and adaptively focus on discriminative areas at different scales.
(3)
Different types of experiments have demonstrated that the FGS-YOLOv8s-seg instance segmentation model outperforms existing mainstream instance segmentation models for small-target tomato maturity detection in greenhouse environments. This enhanced segmentation framework shows significant potential for practical applications in tomato-picking robotics.
This study is organized as follows: Section 2 introduces the materials and methods; Section 3 presents and discusses the experimental results; Section 4 summarizes the conclusions.

2. Materials and Methods

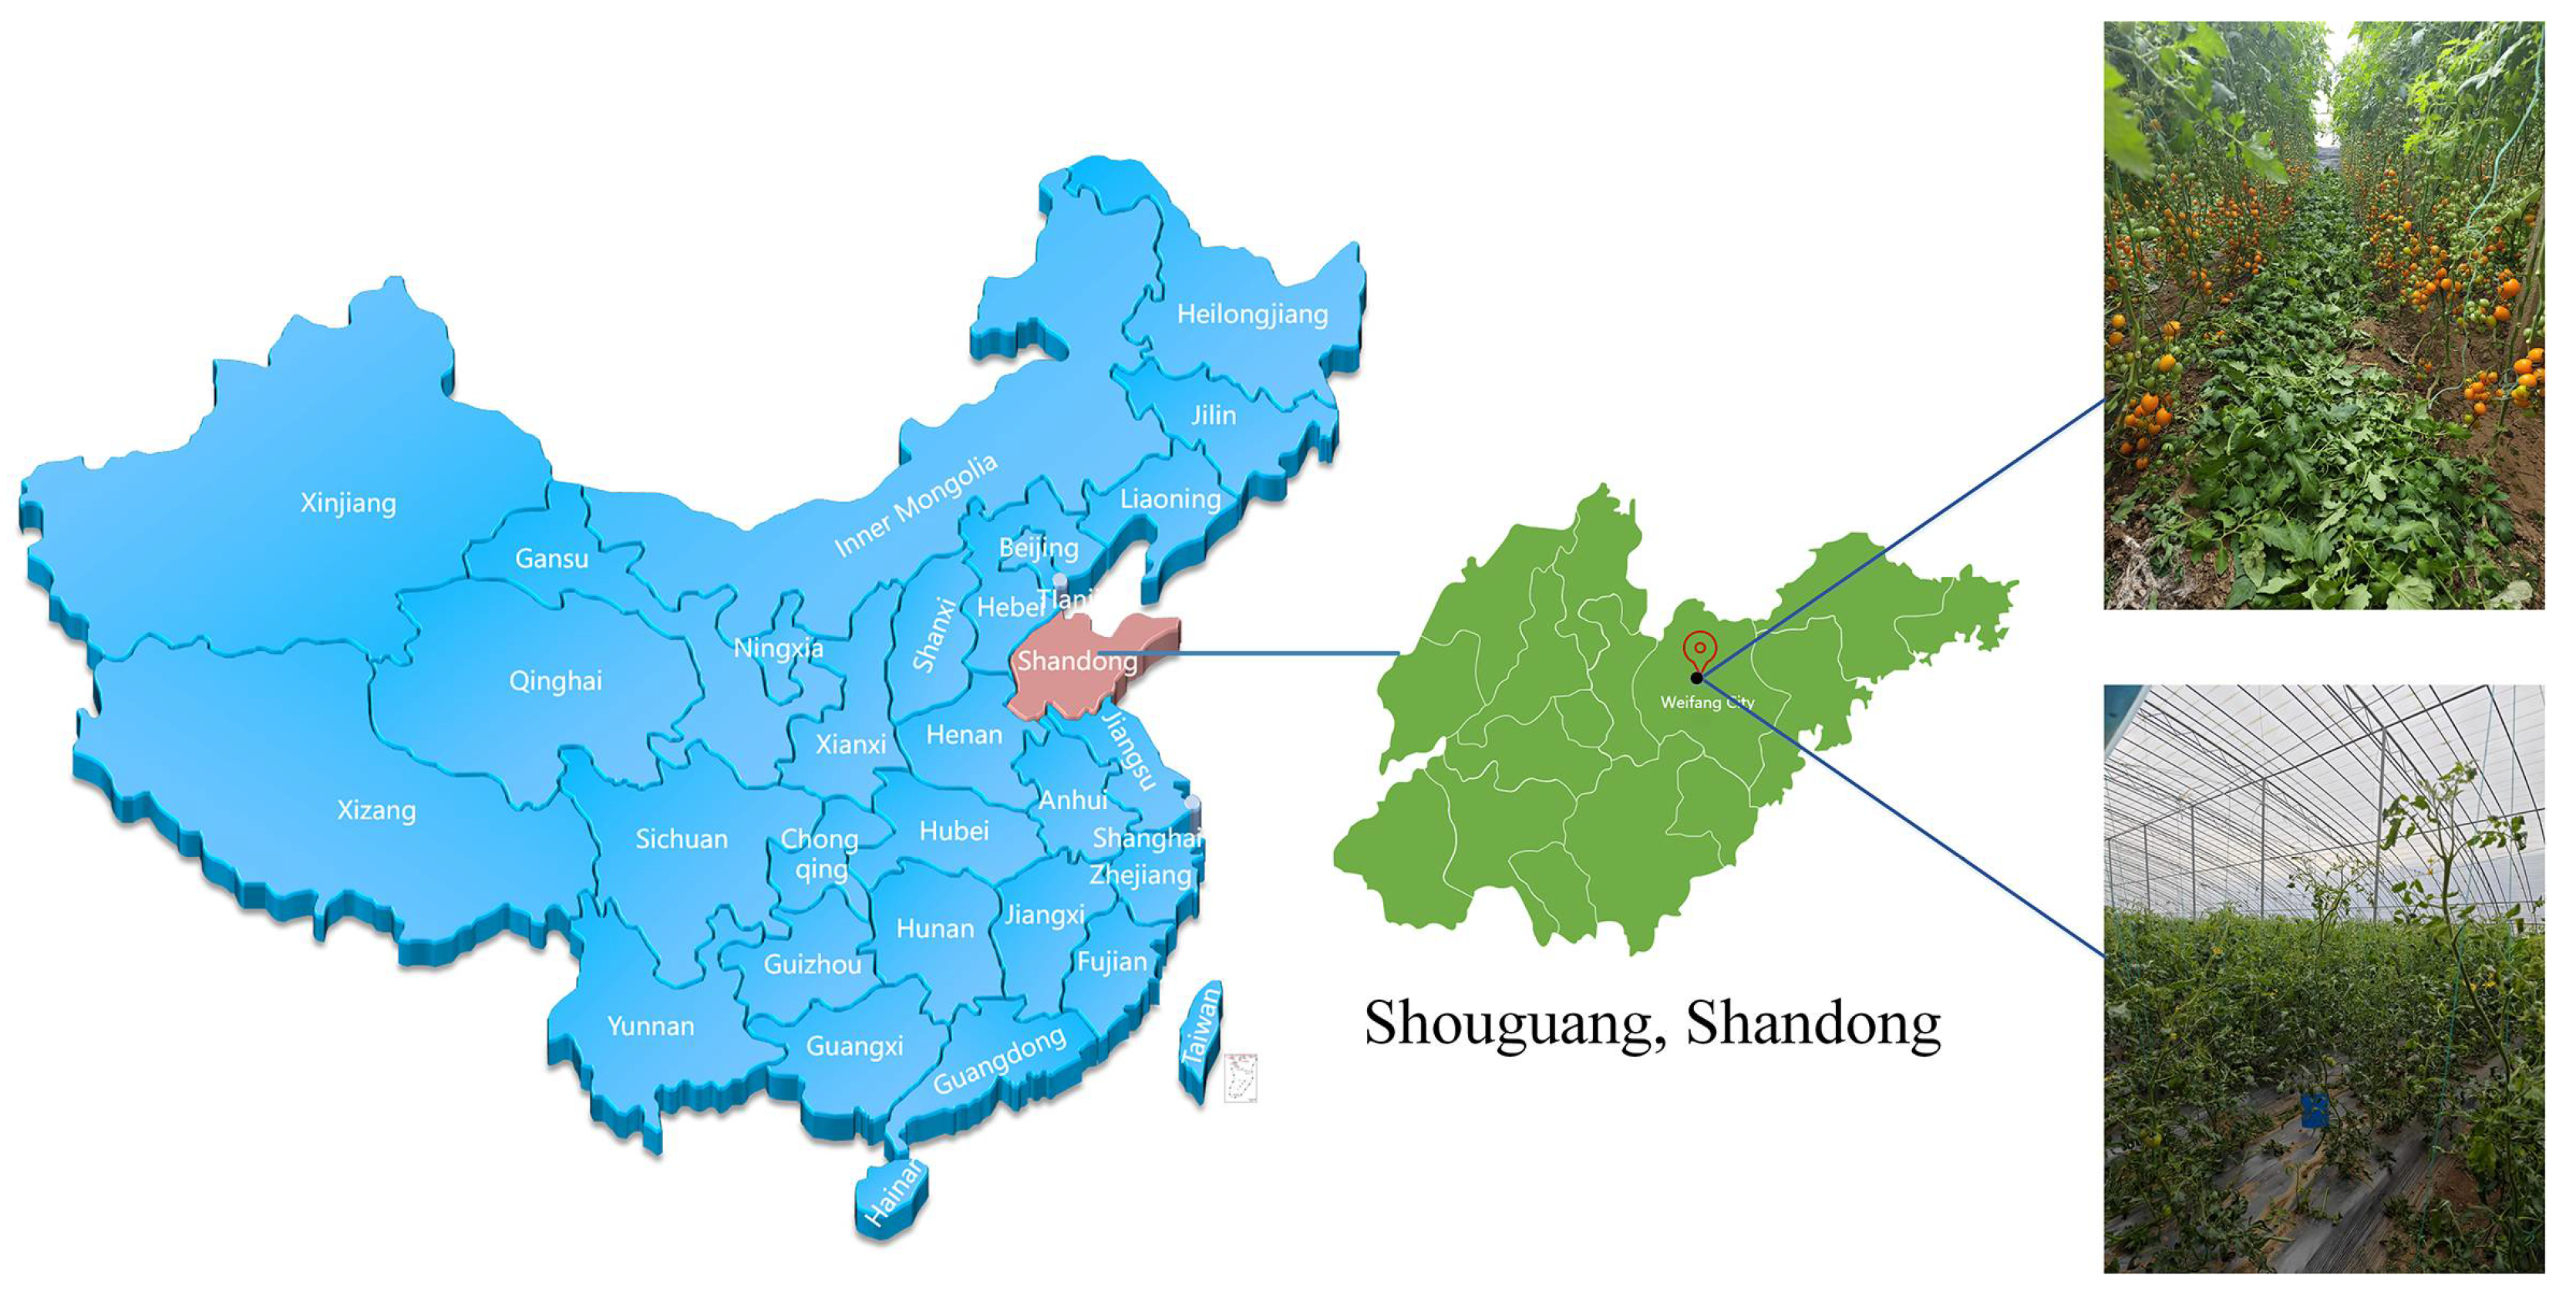
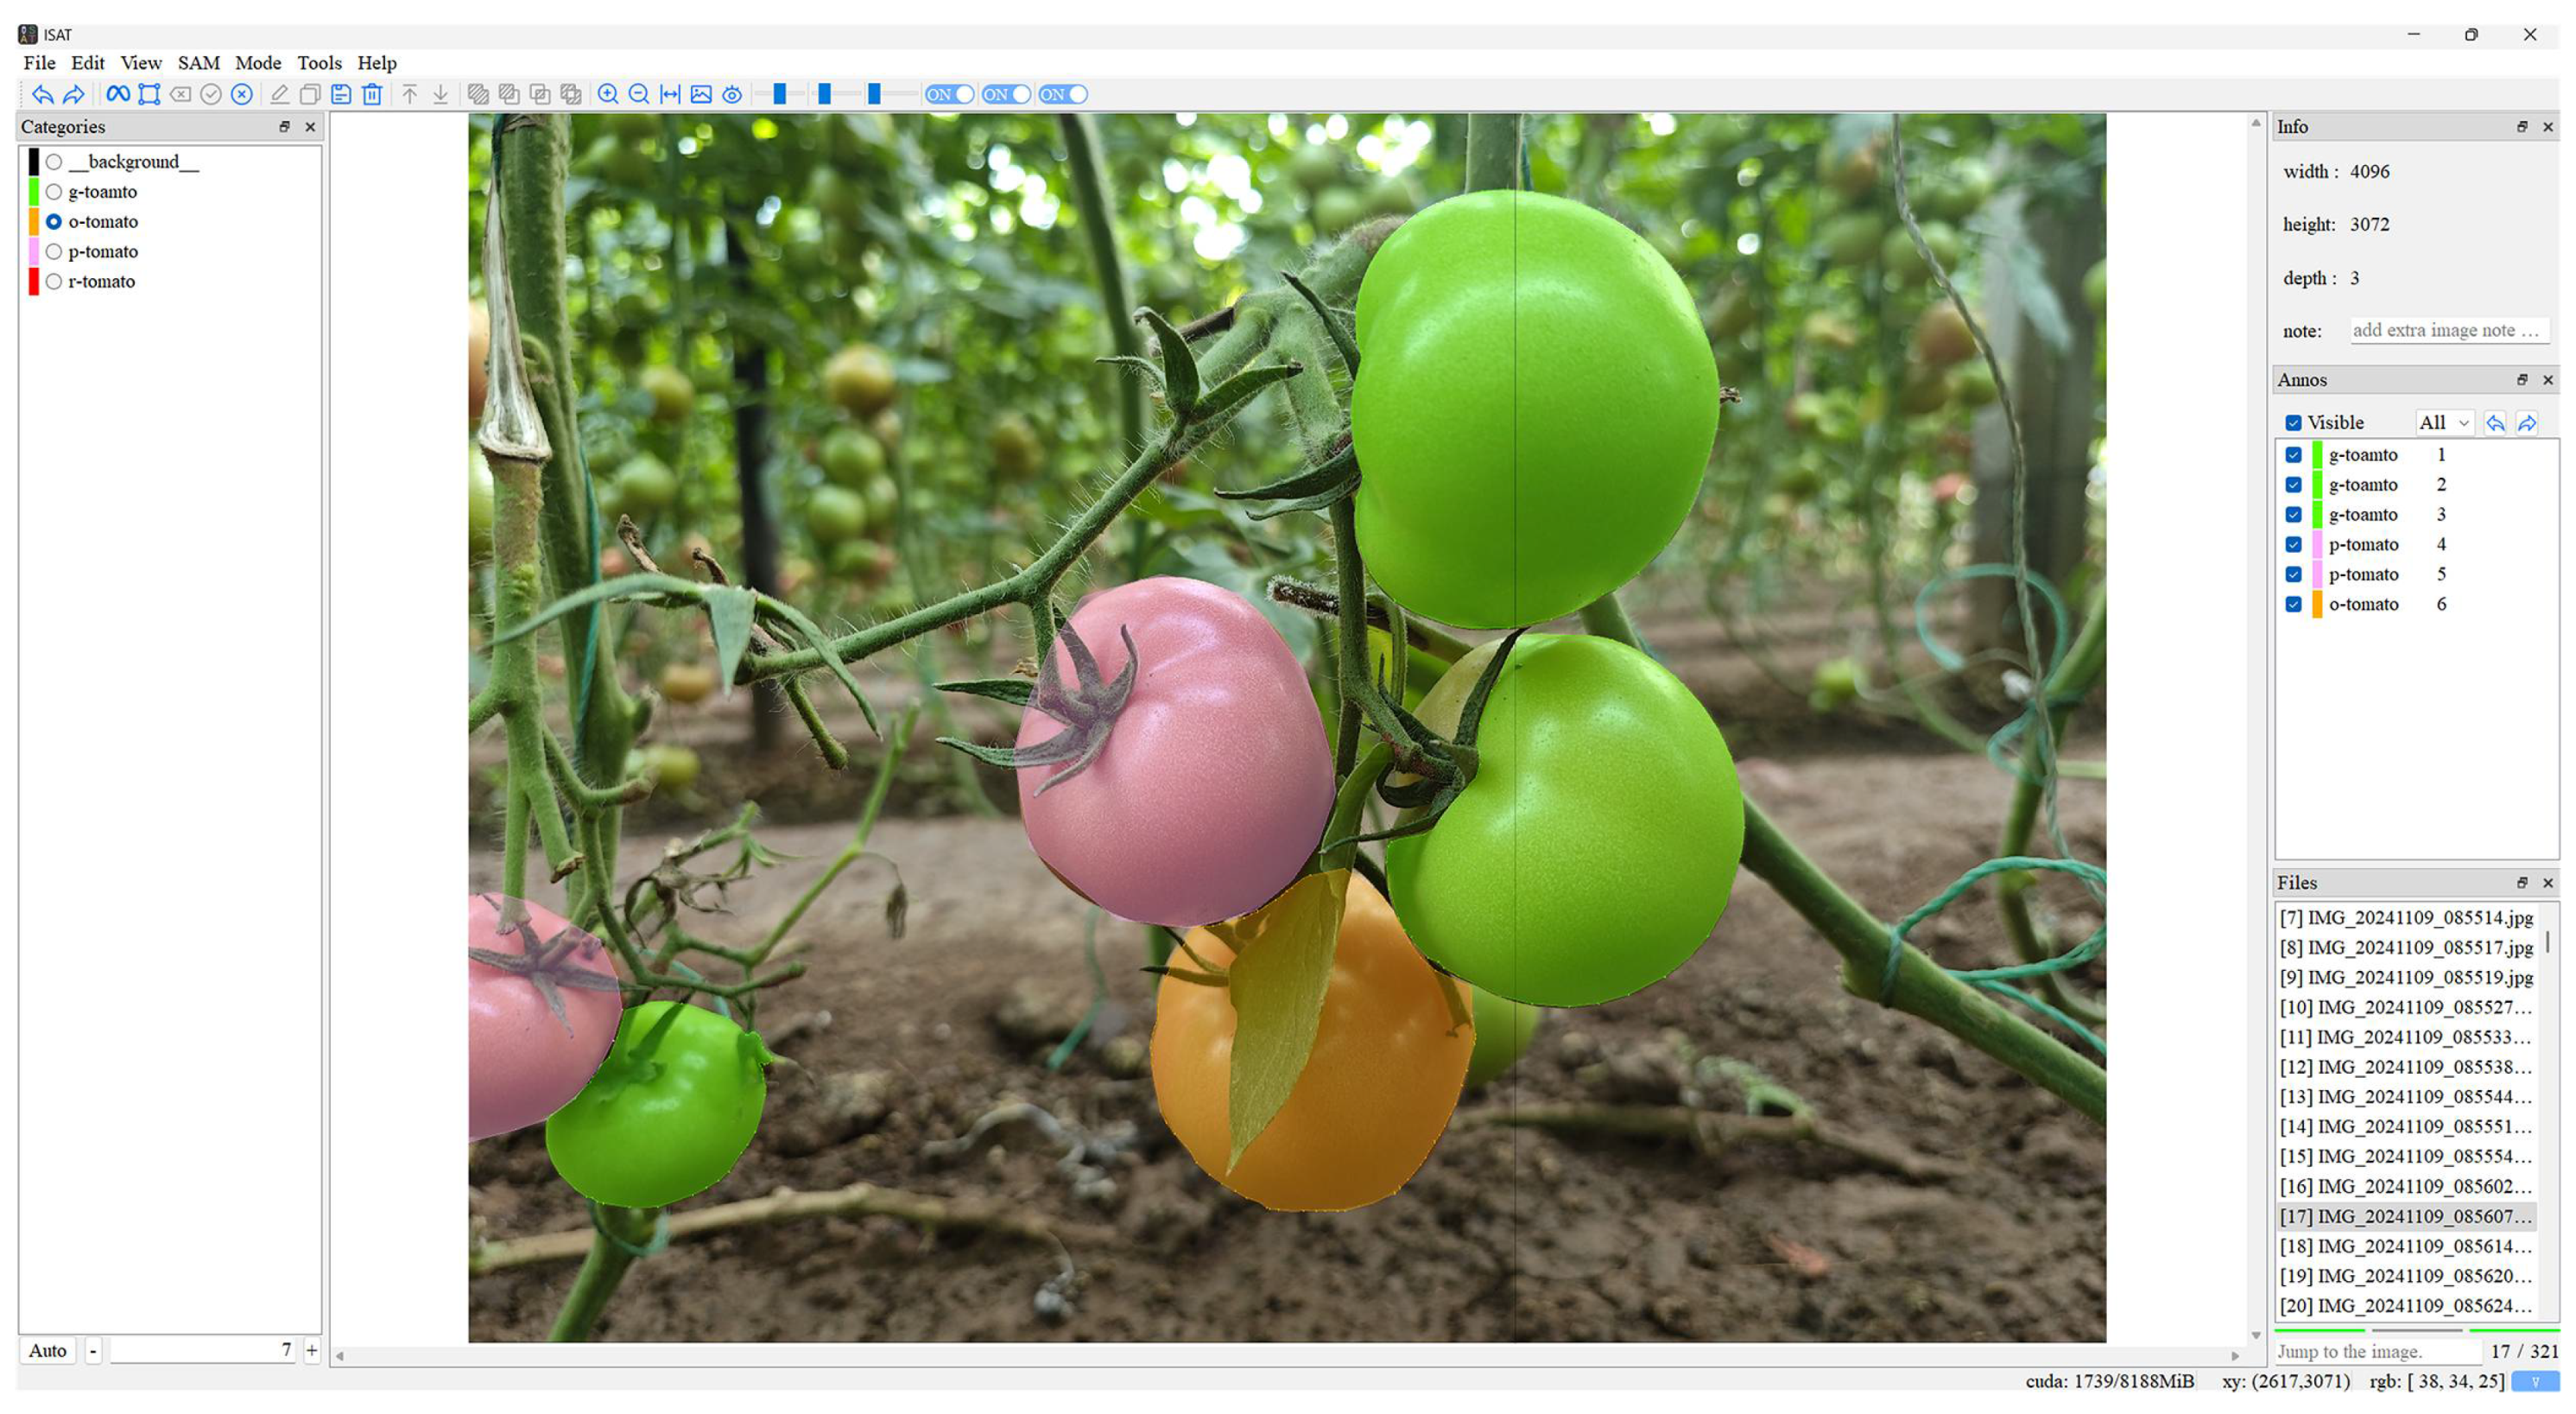
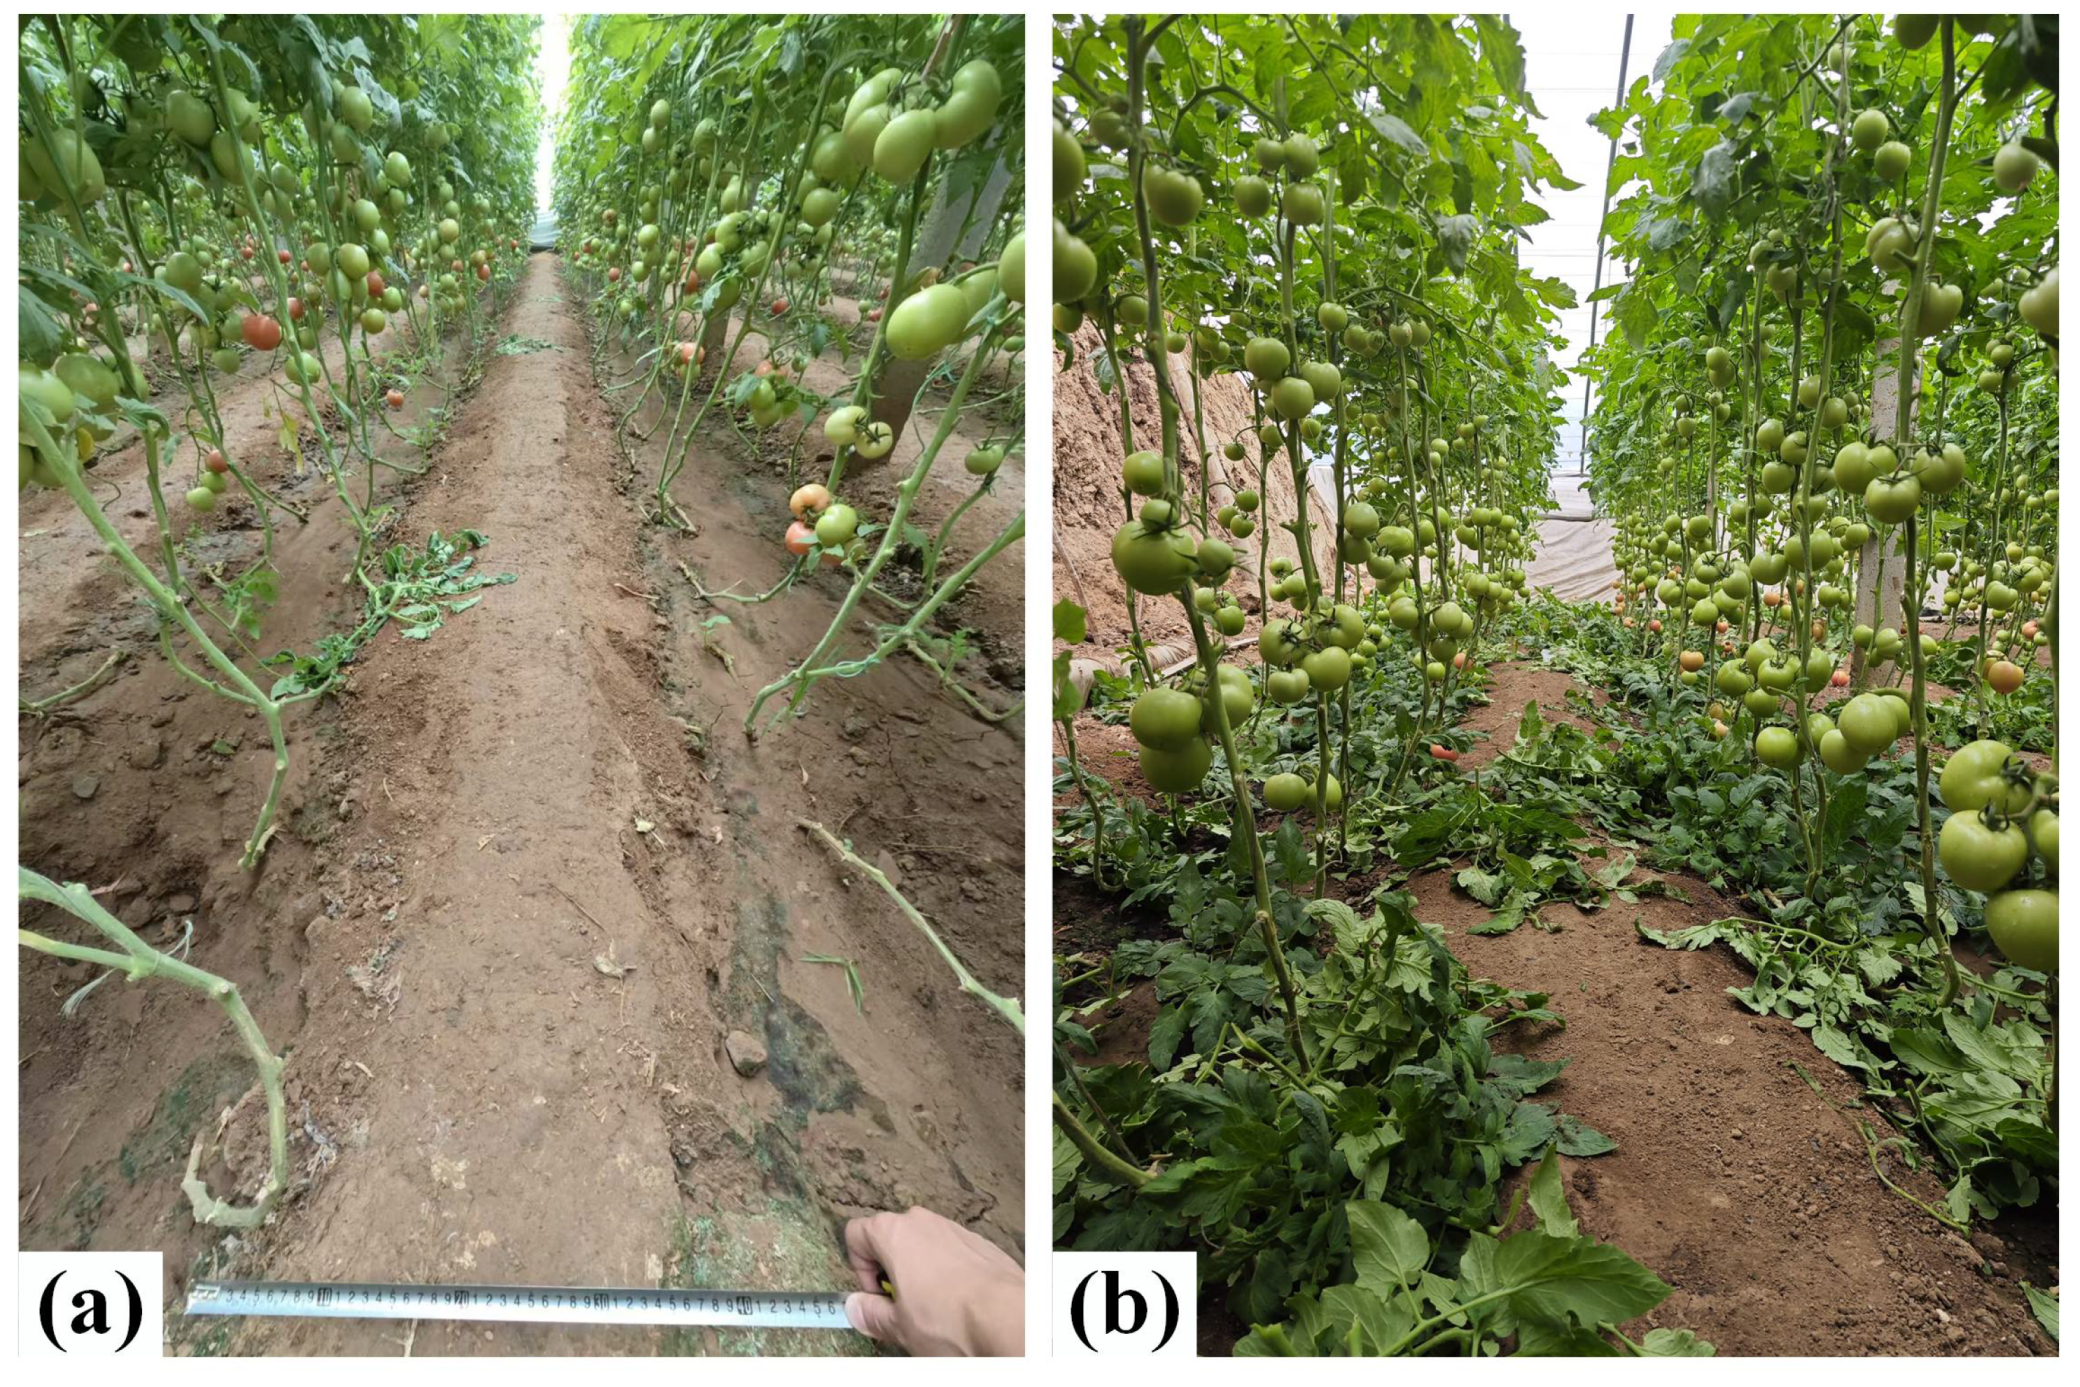
2.1. Image Acquisition and Data Processing

The tomato image dataset was collected from Xichen Village, Wenzhuang Street, Shouguang City, Shandong Province (118.44° E, 36.55° N), as shown in Figure 1. The data were collected during the tomato harvest from September to October 2024, covering different time periods in the morning, noon, and afternoon. The dataset was collected under diverse natural lighting conditions, including sunny, cloudy, and overcast weather, to enhance the robustness of the model across varying illumination environments. Image acquisition was performed using a Xiaomi 13 Pro smartphone (Xiaomi Technology Co., Ltd., Beijing, China) equipped with a Sony IMX989 1-inch sensor (Sony Group Corporation, Tokyo, Japan), offering a resolution of 50 megapixels. To ensure annotation consistency, all instance segmentation masks were manually labeled by the same annotator. After annotation, each sample was carefully reviewed to correct potential boundary errors or label inconsistencies.
To ensure diversity and universality, the dataset included four tomato varieties: Dahong, Ruifen, Sheraton 103, and Provence (Figure 2). Images were captured from multiple perspectives within the greenhouse, yielding 1600 raw images at 4096 × 3072 resolution. After removing duplicates and invalid samples, a final dataset of 1451 images was retained. The dataset was divided into training, validation, and test sets in an 8:1:1 ratio, comprising 1160 training samples, 146 validation samples, and 145 test samples. The Instance Segmentation Annotation Tool (ISAT) was used to annotate the training set and validation set with pixel-level masks, storing annotations in JSON format, as shown in Figure 3. Data augmentation techniques (including image rotation, brightness adjustment, and adding Gaussian blur or salt-and-pepper noise) were applied to expand the training set to 2320 samples, thereby enhancing diversity, reducing overfitting, and addressing class imbalance.

2.2. General Framework for Maturity Grading of Greenhouse Tomatoes

Tomato maturity is closely linked to appropriate methods for storage, processing, and transportation. According to the GH/T 1193-2021 standard [30], tomato maturity can be divided into four stages based on the fruit’s morphological characteristics: Immature Green, Mature Green, Turning, and Firm Ripe (Table 1). Tomatoes in the immature green stage are underdeveloped and typically smaller in size. Due to their inability to undergo artificial ripening after harvest, fruits at this stage are not suitable for selective picking. Therefore, the mature green stage, turning stage, and firm ripe stage were selected to judge the maturity of tomatoes (see Figure 4).

2.3. Construction of FGS-YOLOv8s-seg Model

This experiment presents enhancements to the YOLOv8s-seg model. First, the SegNext_Attention mechanism was integrated at the end of the backbone. In the neck layer, the Bottleneck structures in the four C2f modules were replaced with FasterNet structures, and GCT modules were subsequently added to form the C2f_Faster_GCT structure. The architecture of the proposed FGS-YOLOv8s-seg network is illustrated in Figure 5.

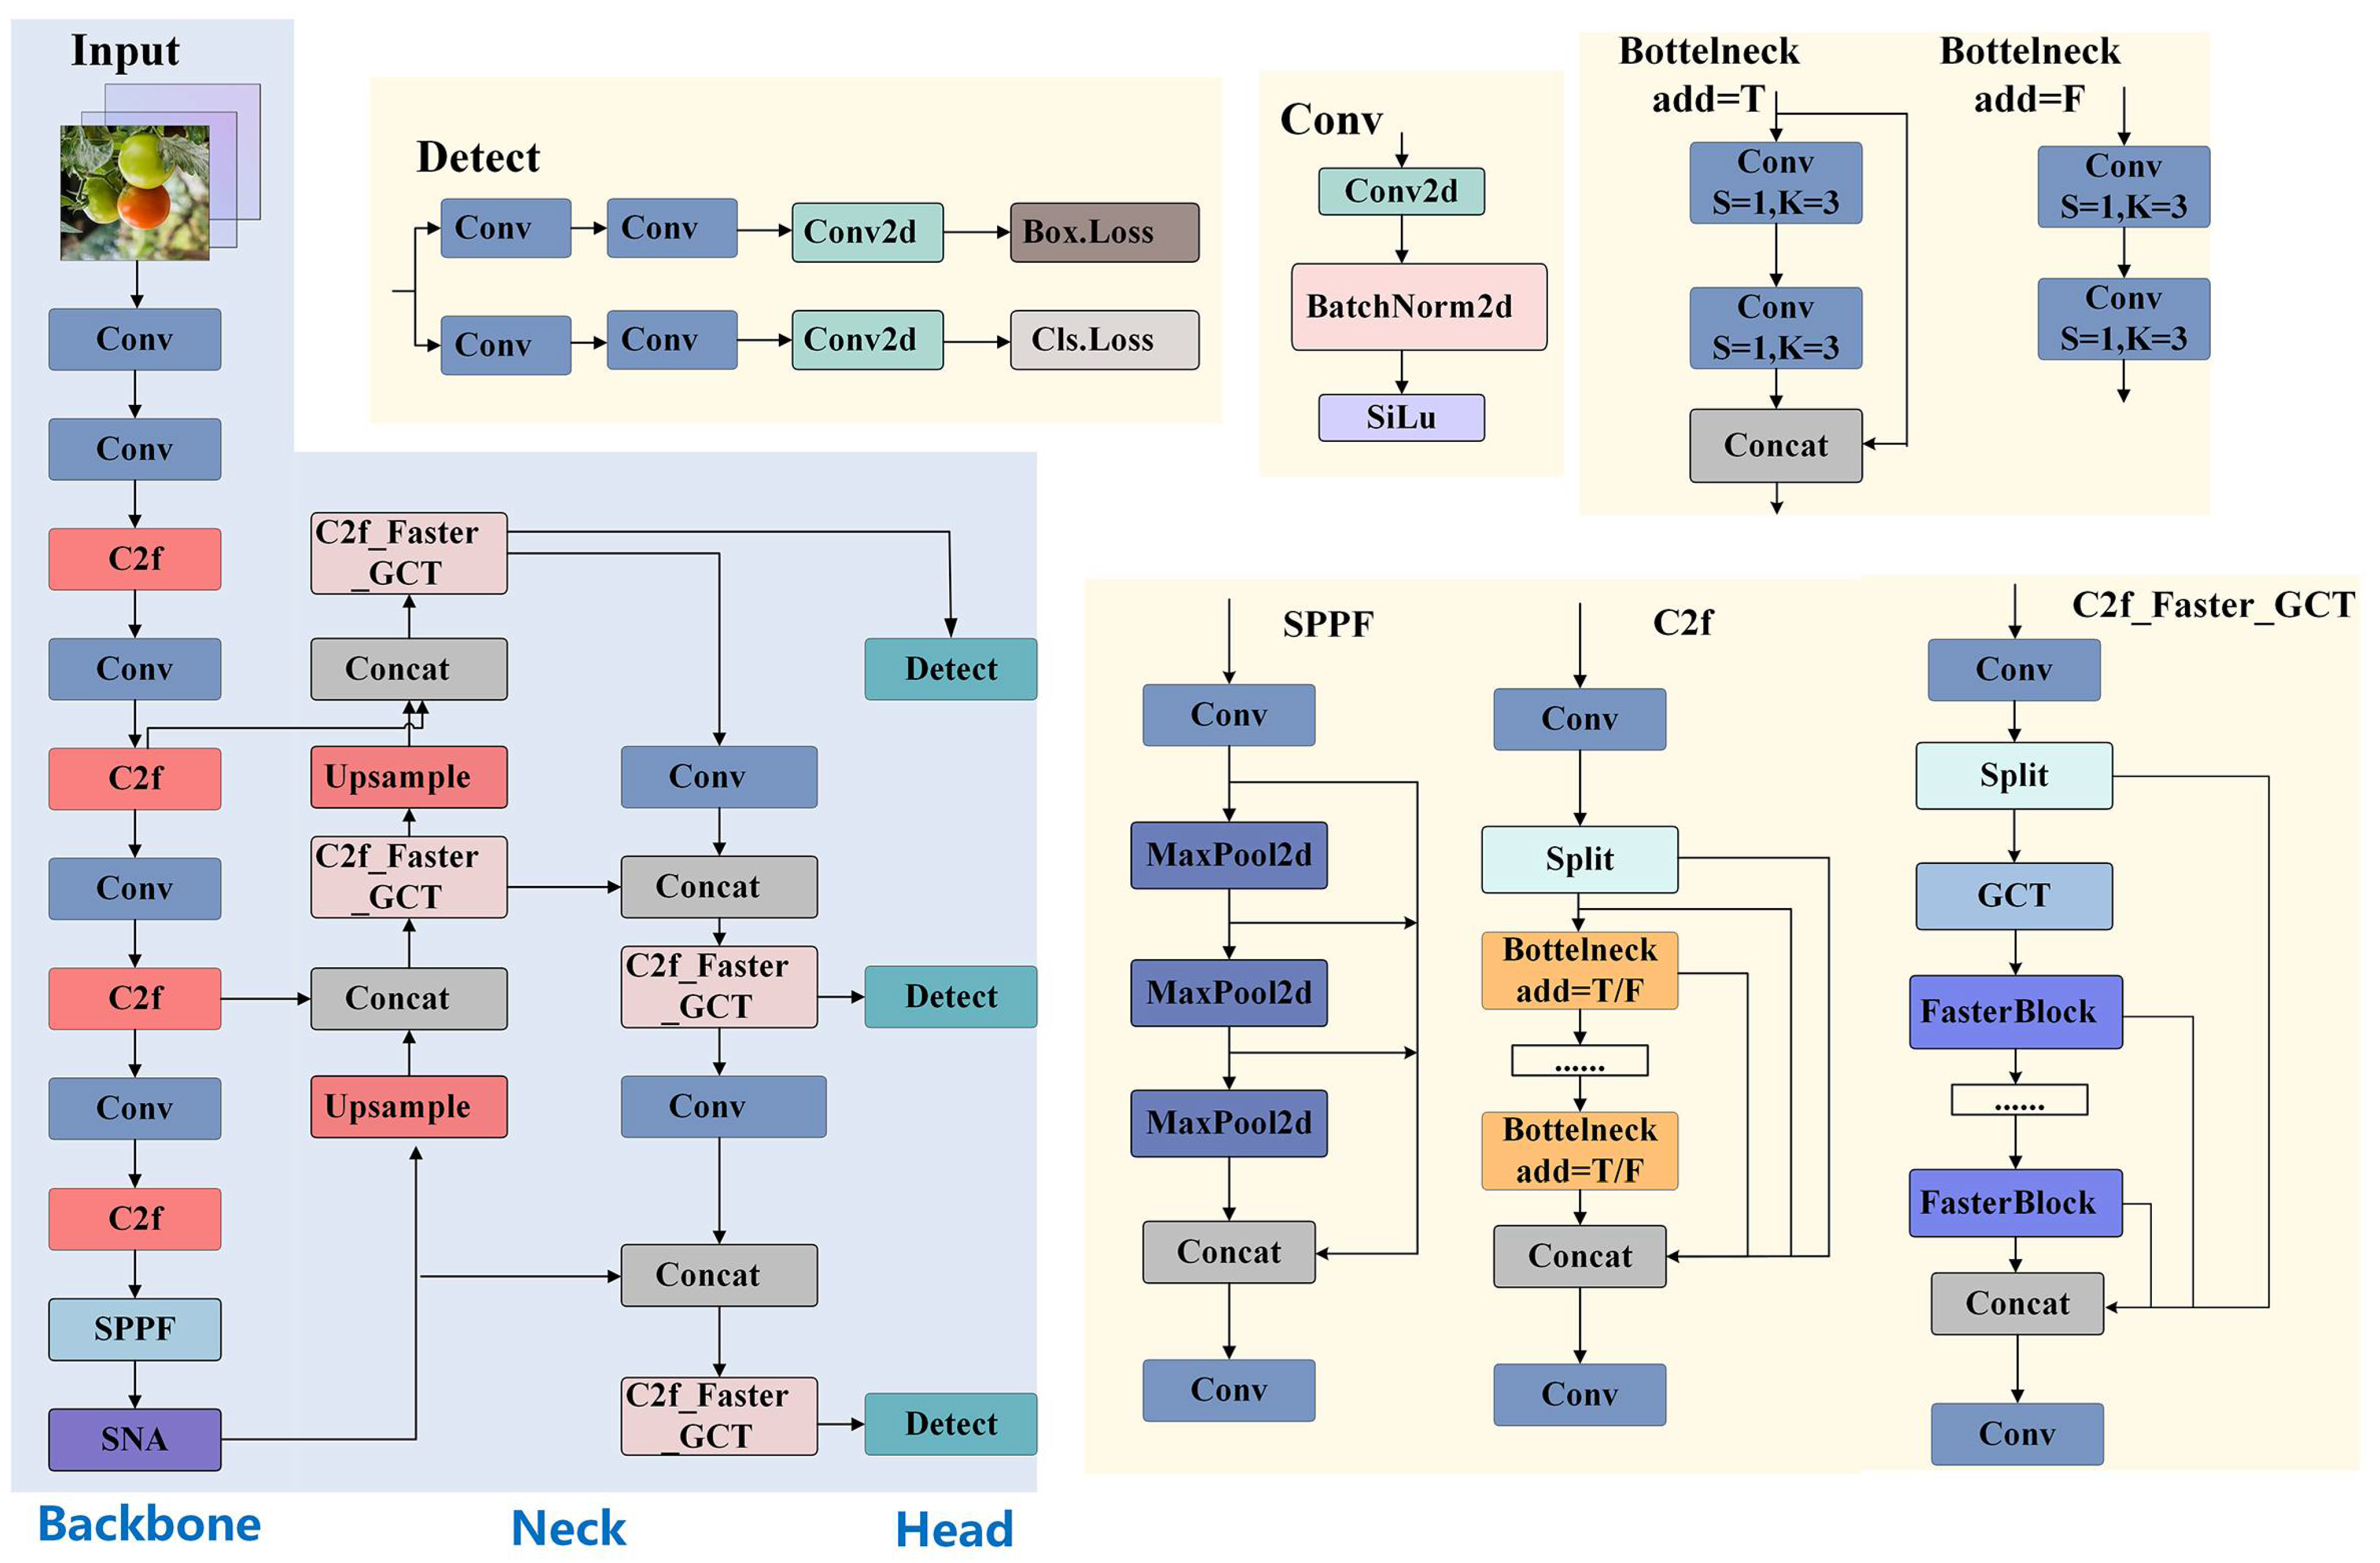
2.3.1. YOLOv8 Instance Segmentation Algorithm

YOLOv8s-seg is an efficient instance segmentation algorithm [31]. This study proposes an improved version of YOLOv8s-seg for tomato maturity segmentation and recognition. YOLOv8s-seg incorporates a decoupled head structure. It extracts the location information and category information separately and then learns them through different network branches before fusing them. In this experiment, we needed to handle multiple targets of different tomato maturity levels simultaneously, and high precision in terms of location was required. Using a decoupled head can better improve the classification accuracy and location precision. During training, YOLOv8s-seg does not rely on the prior knowledge in the dataset [32]. Instead, it fits the object size based on the learned bounding box distances and key-point positions. This makes it suitable for the target segmentation of tomatoes with varying scales in this experiment [33].

2.3.2. SegNext_Attention Module

The detection and background elimination of tomatoes involve multiple factors such as overall structural orientation, maturity-related color variations, peduncle distribution patterns, and occlusive background interference. The SegNext_Attention module introduces a novel attention mechanism between the encoder and decoder, enabling the model to better leverage global semantic dependencies.
The core of SegNext_Attention lies in the Multi-Scale Convolutional Attention Module (MSCA). The MSCA architecture, as illustrated in Figure 6 [34], consists of three key components: Depthwise convolution for aggregating local spatial information; multi-branch depthwise strip convolution for capturing hierarchical multi-scale contextual features; and 1 × 1 convolution for modeling inter-channel relationships.
In the MSCA module, the outputs of the 1 × 1 convolution serve as attention weights to reweight the input of the MSCA via elementwise multiplication (Hadamard product), thereby enabling spatial attention modeling. The functional expression is formulated as
A t = C o n v 1 × 1 i 3 S c a l e i D W C o n v F
O u t = A t × F
where A t represents the attention weights, F is the input feature map, D W C o n v stands for depth wise convolution, and S c a l e i represents the convolutional branches of different scales.

2.3.3. C2f_FasterNet_GCT Module

The Gaussian Context Transformer (GCT) hypothesizes a negative correlation between global context and attention activation values, directly mapping global context to attention maps using Gaussian functions without requiring additional parameters [35]. Its basic architecture consists of three components: Global Context Aggregation (GCA), normalization, and Gaussian Context Excitation (GCE).
GCA aggregates global information across the spatial dimensions of feature maps using Global Average Pooling (GAP). The functional expression for the global contextual information of the input feature map is
a v g X = z k = 1 H × W i = 1 W j = 1 H X k i , j : k 1 , ... , C
where C denotes the number of channels and H and W represent the width and height of the feature map.
To stabilize the distribution of global context, the GCT performs normalization on the channel vectors to ensure zero mean and unit variance. The normalization process is formulated as
z = 1 σ z μ
where μ denotes the mean of the global context and σ represents the standard deviation of the global context.
GCE implements transformation and activation operations through Gaussian functions to satisfy the negative correlation assumption. The expression of the Gaussian function is as follows:
g = G z = e z 2 2 c 2
where c denotes a constant and g represents the attention activation value.
In pursuit of low latency and high throughput, contemporary neural networks prioritize reducing the number of floating-point operations (FLOPs). Chen proposed the FasterNet block at CVPR 2023 to address this problem [36], significantly improving computing speed without compromising accuracy. Its key component is partial convolution (PConv), which exploits feature map redundancy and applies traditional convolution to only some input channels for spatial feature extraction. The FLOPs computational formula is expressed as
h × w × k 2 × c p 2
The architecture uses PConv (partial convolution) and PWConv (pointwise convolution) as its main building blocks, and consists of four hierarchical stages, each preceded by an embedding layer or a pooling layer, and the stacking of FasterNet blocks is shown in Figure 7. Each FasterNet block features a PConv layer followed by two PWConv layers, resembling an inverted residual block structure with intermediate channel expansion.
This experiment modified all C2f modules in the neck layer by embedding the GCT attention mechanism after the Split operation within the C2f module. The Bottleneck in the original C2f module was replaced with a FasterNet block to form the lightweight C2f_Faster_GCT module. During multi-scale feature extraction, the GCT can more accurately identify object boundaries and integrate target feature information from different spatial locations, enabling better adaptation to target scale variations and improving segmentation performance. The FasterNet block significantly reduces computational complexity while maintaining the feature extraction capability to generate high-quality segmentation masks. The integrated C2f_FasterNet_GCT network architecture is shown in Figure 8.

2.4. Experimental Setup and Evaluation Indicators

All experiments were conducted on a server with a Windows 11 system (Python version 3.8, PyTorch version 2.3.1, and CUDA version 12.5). The central processing unit and graphics processing unit used were an Intel Core i7-12650H 2.30 GHz (16 GB random access memory) and an NVIDIA GeForce RTX 4060 (NVIDIA Corporation, California, United States). During the training process, the initial learning rate, final learning rate, learning rate momentum, batch size, and epoch were set to 0.0001, 0.1, 0.937, 16, and 300, respectively. The specifications of each parameter are provided in Table 2. The experimental design was produced in accordance with the principles of reproducibility, with each baseline network architecture being trained using the same optimization scheme.
To evaluate the performance of the FGS-YOLOv8s-seg model, the following five metrics were used: precision (P), recall (R), F1-score, mean average precision (mAP), and parameters. The indicators were evaluated using the following formulas:
P = T P T P + F P
R = T P T P + F N
F 1 s c o c e = 2 P R P + R
m A P = 1 n k = 1 n P k R k d R k
where T P represents the number of true positive samples (correctly predicted positive targets), F P denotes the number of false positive samples (incorrectly predicted positive samples), and F N refers to the number of false negative samples (incorrectly predicted negative targets). The total sample count is given by F N + T P . Under different confidence thresholds, the model generates multiple P and R pairs for a specific class. By sorting the model’s predictions by confidence score in descending order and successively calculating the corresponding P and R values for each prediction, a PR curve was plotted. The average precision (AP) corresponds to the area under this curve, and the m A P was obtained by calculating the average of these AP values across all classes.

3. Results and Discussion

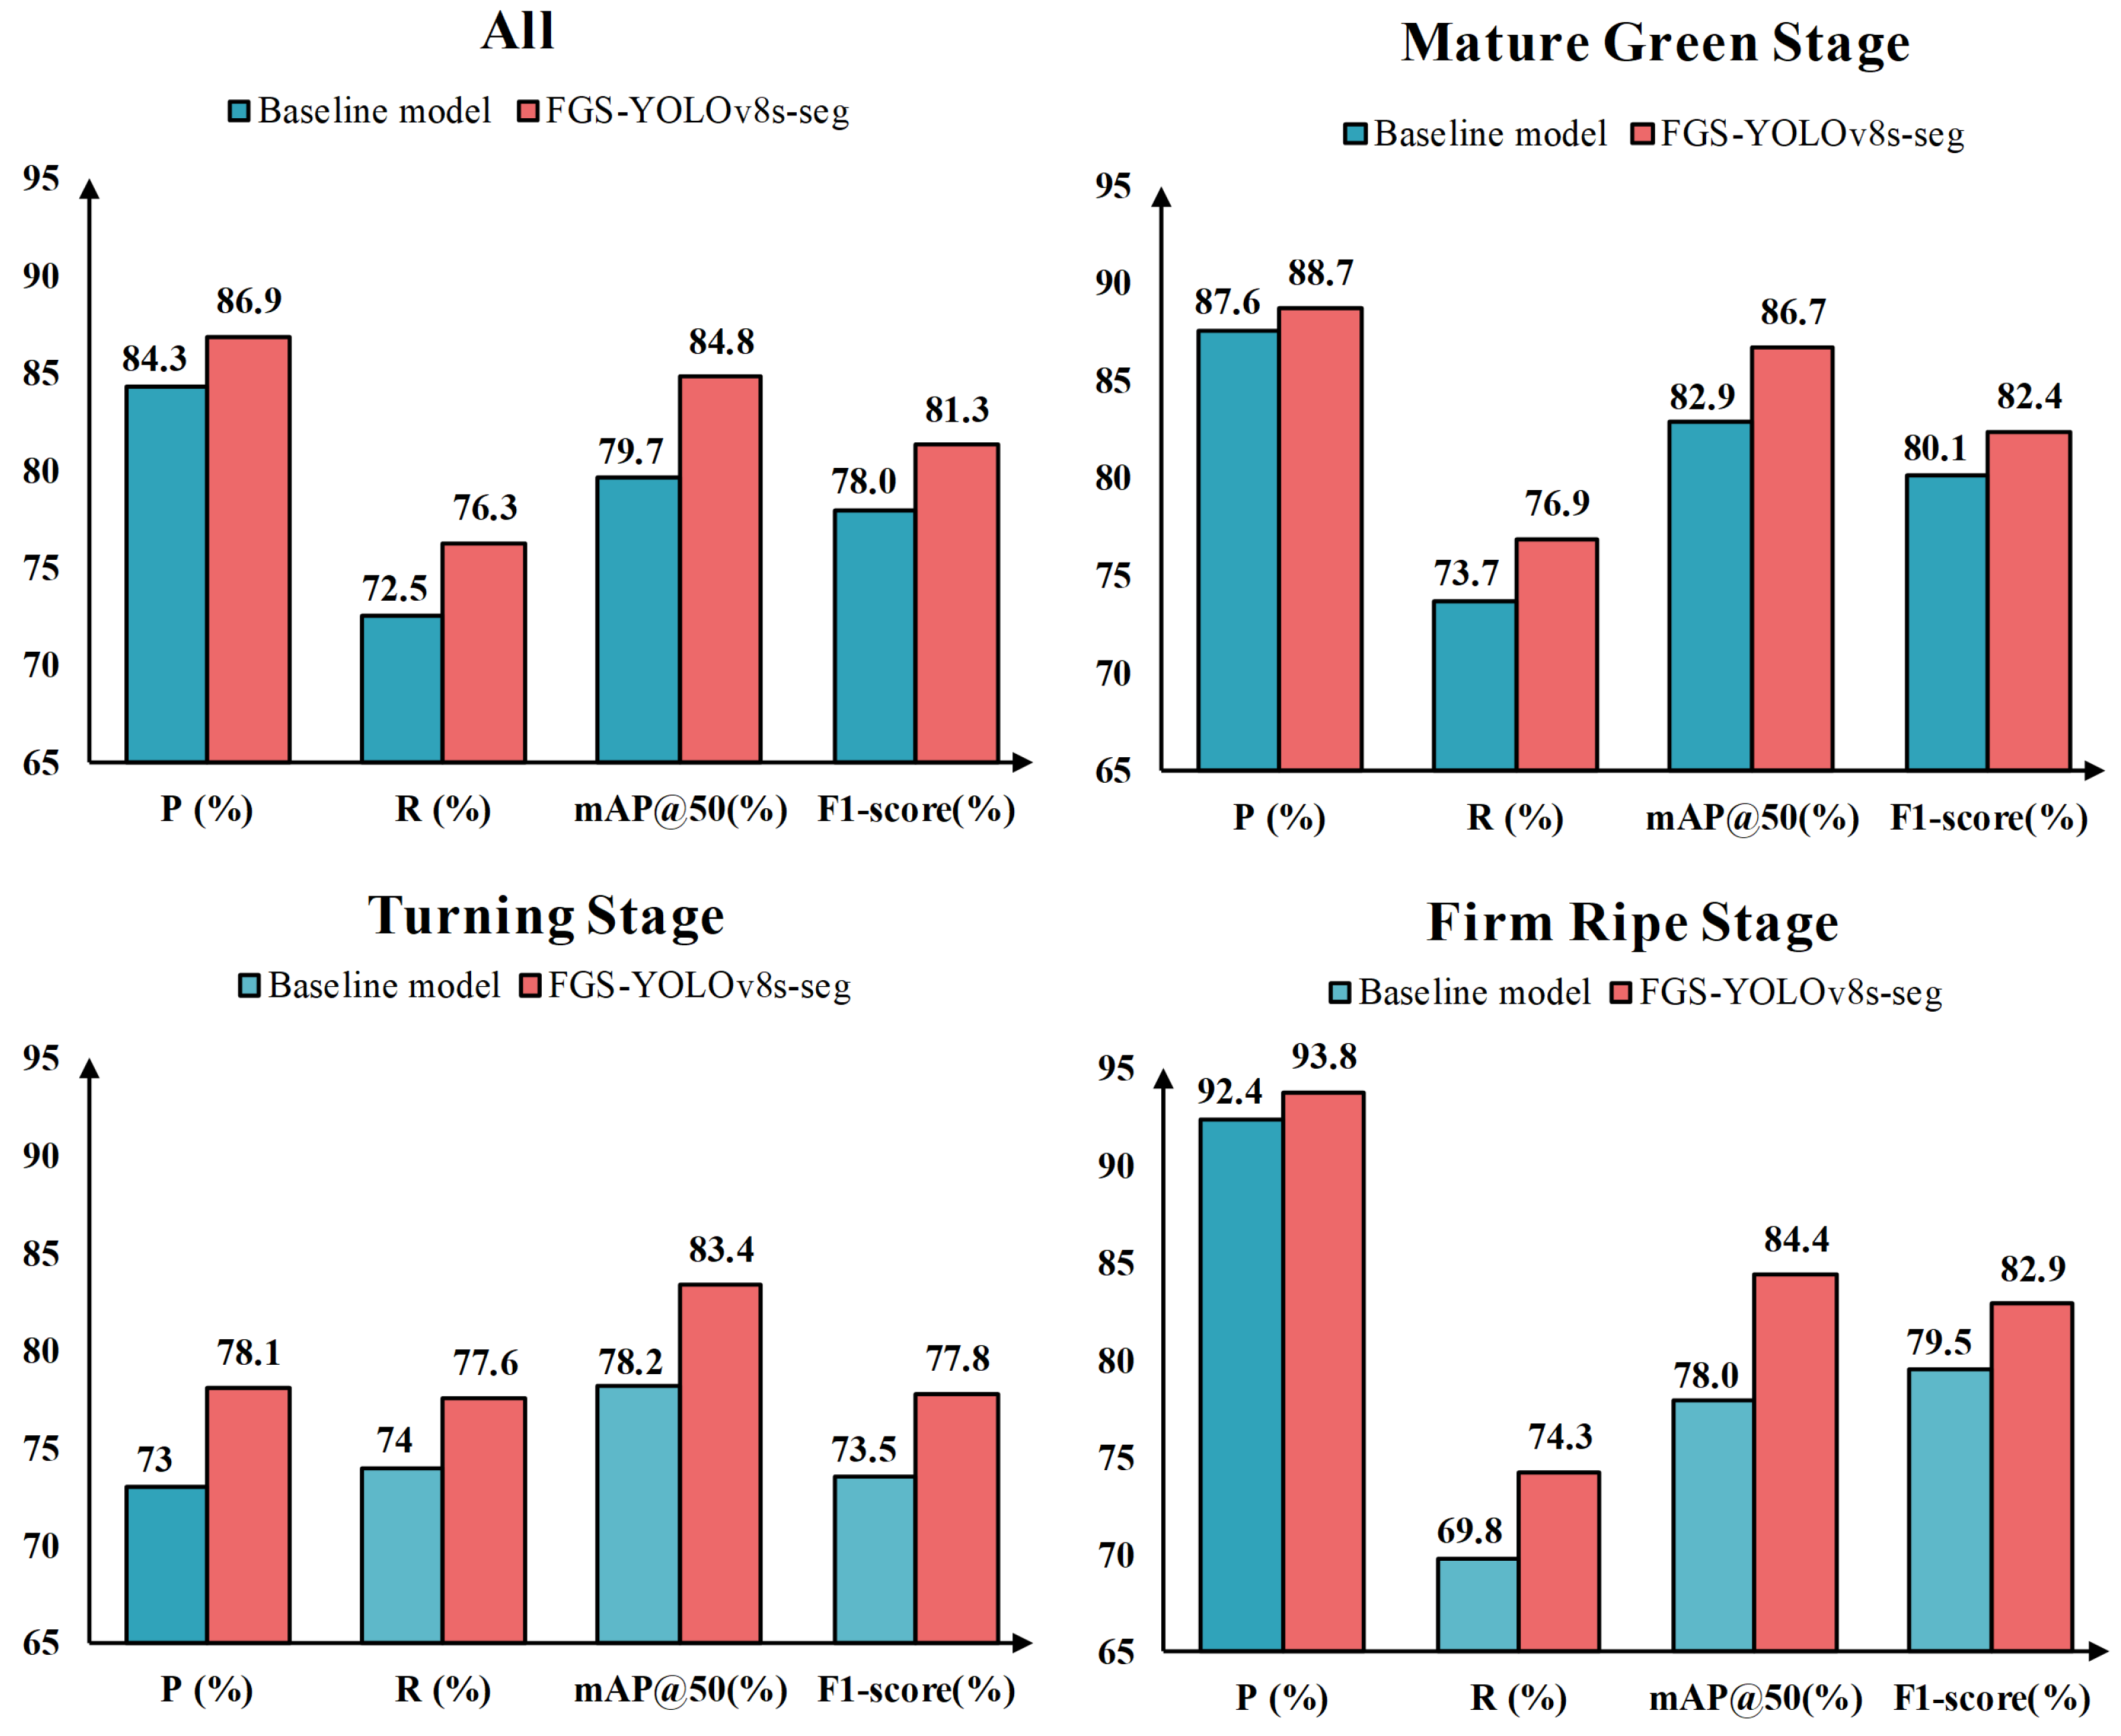
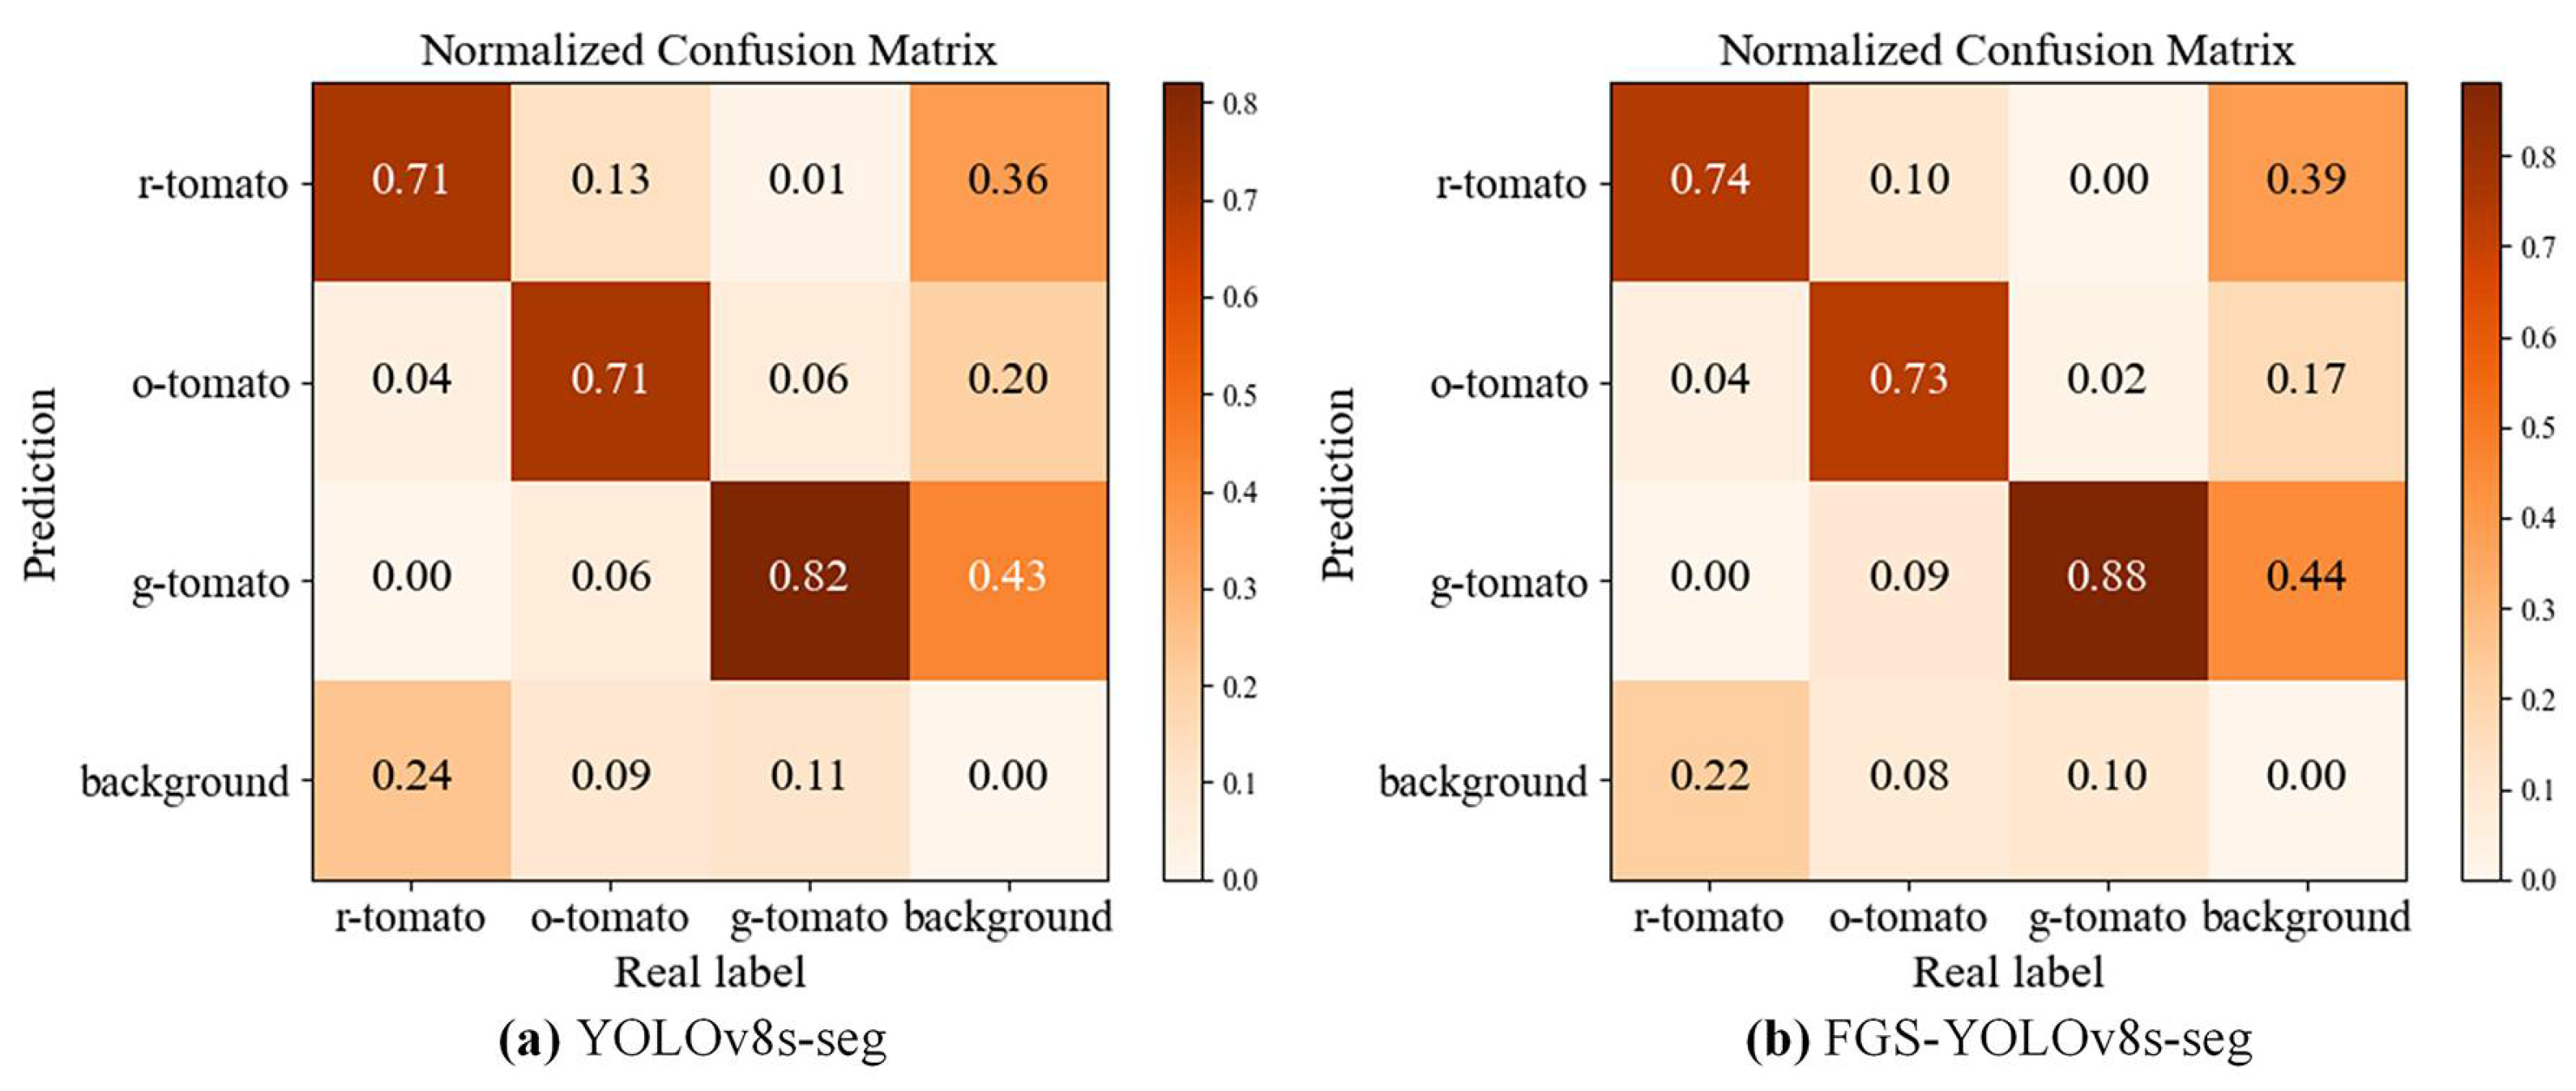
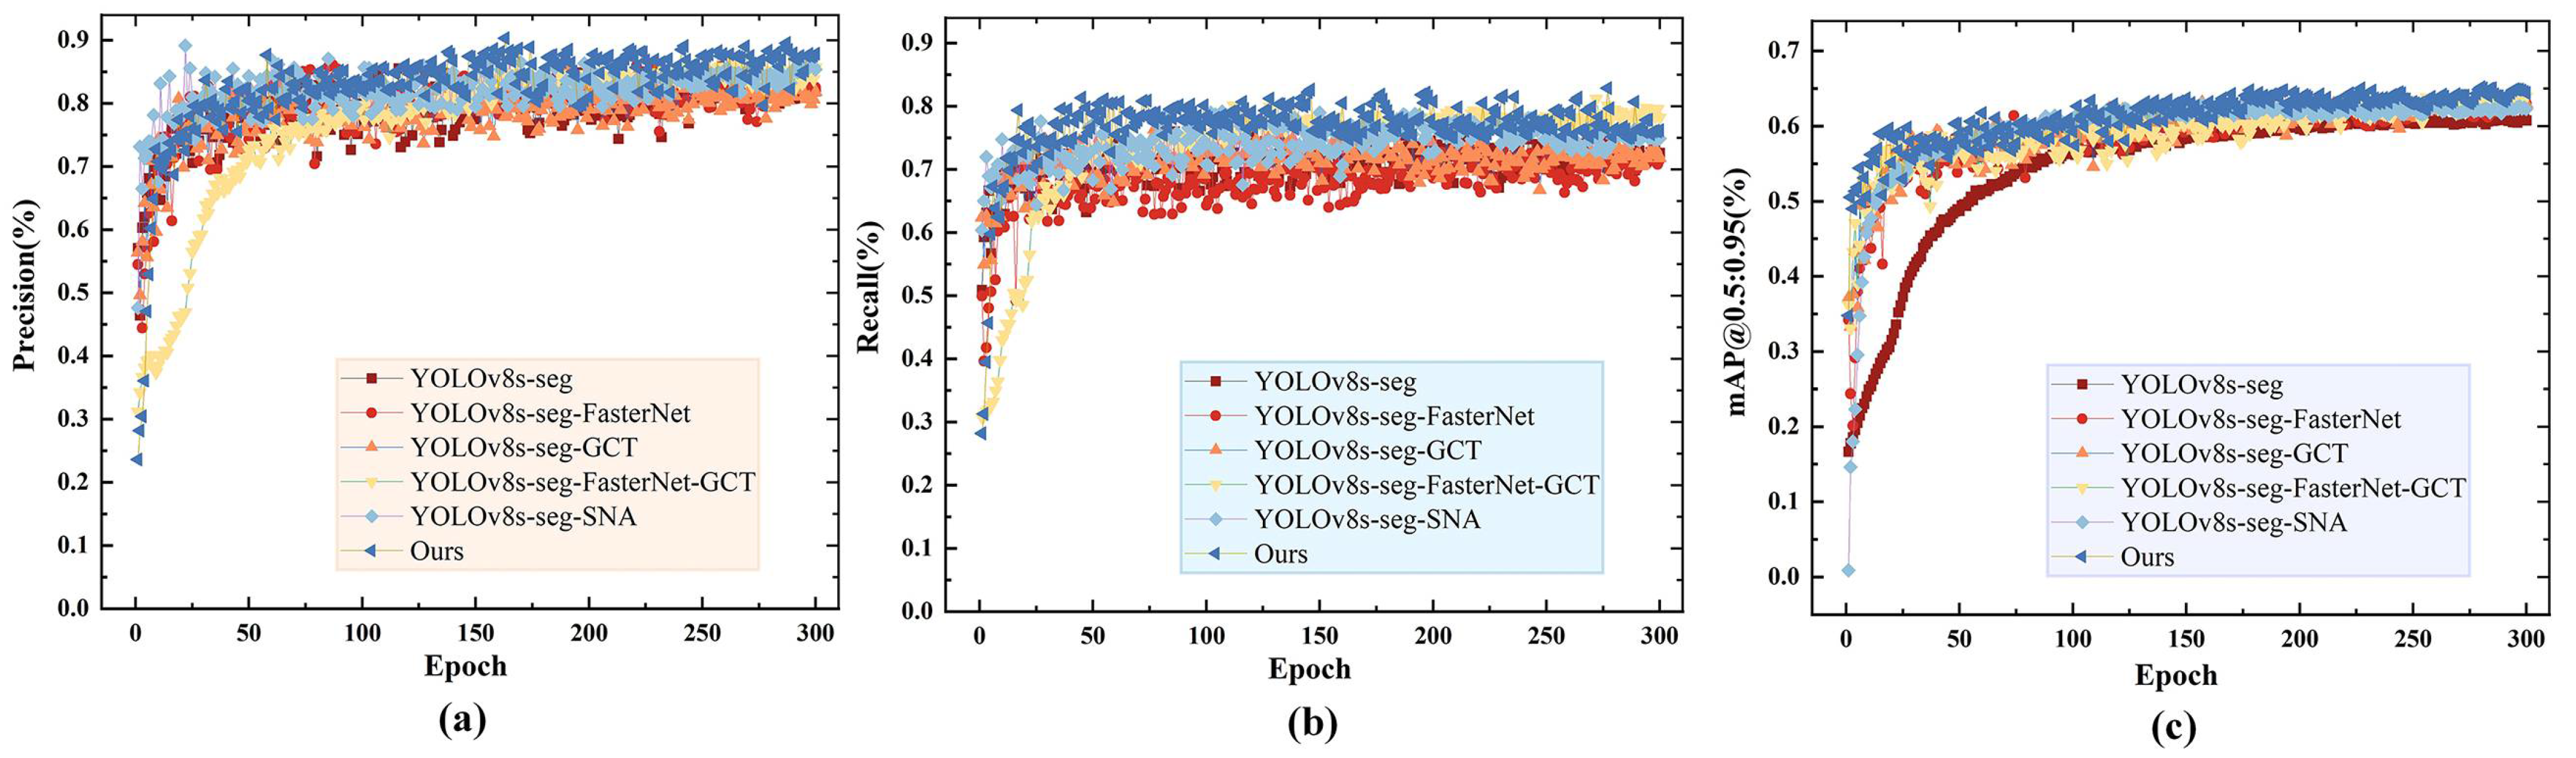
3.1. Evaluation of Improved Model and Baseline Model

FGS-YOLOv8s-seg shows a significant improvement in identifying all maturity levels compared to the baseline model, as shown in Figure 9. For the mature green stage, the recall and mAP@0.5 have the greatest improvement, increasing by 3.2% and 3.8%, respectively. This is because the GCT module has an advantage in identifying object boundaries and can better separate the boundary feature information between green tomatoes and fruit stems, thereby enhancing the segmentation performance. The most significant improvement in detection performance was observed during the turning stage and the firm ripe stage. In the turning stage, precision, recall, mAP@0.5, and F1-score increased by 5.1%, 3.6%, 5.2%, and 4.3%, respectively; during the firm ripe stage, recall, mAP@0.5, and F1-score increased by 4.5%, 6.4%, and 3.4%, respectively. This is because when detecting tomatoes in the turning and firm ripe stages, the detection is easily interfered with by a combination of light and changes in the orientation of tomato color, leading to misjudgments. The SNA module excels in extracting hierarchical visual features, and when combined with the GCT module, the model can adaptively focus on the scale changes in different colors, thereby enhancing the discrimination performance. These performance improvements for different maturity levels further demonstrate the effectiveness and robustness of the FGS-YOLOv8s-seg model in handling complex and diverse targets.
The confusion matrix is a key evaluation tool for calculating the performance of a computer vision model in classification tasks [37]. By analyzing the confusion matrix on the validation set, the effectiveness of the model can be further evaluated. The confusion matrices for tomato fruit recognition before and after improvement are shown in Figure 10. The results show that the FGS-YOLOv8s-seg model improved recognition rates across all maturity stages, achieving 88% for the mature green stage, 73% for the turning stage, and 74% for the firm ripe stage, with a particularly significant 6% increase in mature green stage recognition. Recognition errors for the FGS-YOLOv8s-seg model primarily occurred in two scenarios: 3.9% of background pixels were misclassified as firm ripe tomatoes, and 4.4% of background pixels were misclassified as mature green tomatoes. This is because, while the improved model increases the precision of target detection, the SNA and GCT modules focus on an excessively large scale, causing some pixels in the background to be misdetected as tomatoes. The values on the main diagonal of the confusion matrix represent the number of correctly predicted samples. The larger the diagonal value, the more accurate the model prediction. From the comparison in Figure 10a,b, the improvement in detection precision of the improved model can be seen to be far higher than the impact of false detections.

3.2. Ablation Experiment

To validate the effectiveness of the improved algorithm, this study designed six groups of ablation experiments. These experiments used the same equipment and dataset for training and validation to ensure the comparability of the results. The evaluation results of precision, recall, mAP@0.5, F1-score, and GFLOPs are shown in Table 3 and Figure 11. The performance of the improved combined model exceeds that of any single improved model and reaches the optimal level.
As shown in Table 3, after adding only the FasterNet module, the number of GFLOPs of the model was reduced by 10.7 M. This is attributed to the fact that the FasterNet block uses PConv to perform convolution operations on only part of the input feature map, thereby reducing unnecessary calculations, memory accesses, and the computational complexity of the model. When the C2f module is used in combination with the FasterNet block and GCT, the model’s P, R, mAP, and F1-score are improved by 1.3%, 5.7%, 1.4%, and 3.7%, respectively. This is mainly because the model can fuse features of different scales, and the GCT module can extract features more effectively, while maintaining detection precision, paying more attention to the tomato target in a complex background. After adding only the SNA attention mechanism, the P, R, mAP, and F1-score of the model are improved to varying degrees, but the number of GFLOPs increases by 3.5 M. This is because, while SNA significantly increases the segmentation capability of the model, its model complexity and parameter count are also larger. The addition of the C2f_FasterNet_GCT module solves this problem, making the number of parameters of the final model significantly lower than that of the baseline model. Figure 11 shows the results of the ablation experiment training process. The improved FGS-YOLOv8s-seg model is better than any combination model in the ablation experiment in terms of learning ability, and is significantly better than the baseline model (see Figure 11b,c), reducing the occurrence of missed detection and false detection. Compared with the baseline model, the P, R, mAP, and F1-score of the improved model increased by 2.6%, 3.8%, 5.1%, and 3.3%, respectively, and the number of GFLOPs decreased significantly by 6.8M (Table 3). The improvement measures taken effectively improved the detection performance of the model and reduced the model size.
To further verify the stability of the performance improvement achieved by the proposed model [38], a paired t-test was conducted between FGS-YOLOv8s-seg and the baseline model, and 95% confidence intervals were calculated for the performance differences. All results were averaged over five independent runs. Table 4 presents a statistical comparison between the baseline and the proposed FGS-YOLOv8s-seg model across key performance metrics, including precision (P), recall (R), mAP@0.5, and F1-score. As shown in the table, all p-values are below 0.001, and the 95% confidence intervals for each metric difference do not overlap zero, confirming the statistical significance and robustness of the observed performance improvements.

3.3. Evaluation of Segmentation Performance with Different Network Models

The FGS-YOLOv8s-seg model was compared with five commonly used segmentation algorithms (YOLOv5s, YOLOv9, YOLOv11, Mask R-CNN, and Cascade Mask R-CNN) to verify its effectiveness and superiority in greenhouse tomato maturity grading. To mitigate dataset-related randomness, each learning algorithm was trained and evaluated using the same training and validation datasets under the same conditions, and the results are shown in Table 5. Among the five commonly used segmentation algorithms, the YOLOv11 model shows the best performance. It is worth noting that, compared with the YOLOv11 model, the FGS-YOLOv8s-seg model achieved 4.4%, 1.4%, 2.5%, and 2.8% improvements in P, R, mAP@0.5, and F1-score, respectively, but the number of GFLOPs of the model increased by 2.2 M. This shows that although the FGS-YOLOv8s-seg model has high detection precision, its detection speed is lower than that of the YOLOv11 model. This is because a major improvement of YOLOv11 over YOLOv8 is to replace all the C2f modules with C3k2 modules. The structures of C3k2 and C2f are shown in Figure 12. The C3k2 module reduces the number of parameters through optimized design and dynamic structure switching. At the same time, YOLOv11 also introduces lightweight modules (such as MobileNet v2, ShuffleNet v1, etc.) to replace the original backbone network, further reducing computational complexity and memory usage.
The power consumption and inference speed of the actual model deployment are positively correlated with the GFLOPs indicator in Table 5. The fewer floating-point operations per second the model performs, the lower the power consumption and the faster the inference speed when the model is deployed. As shown in Table 5, in actual deployment, the YOLOv11-seg model has more advantages in power consumption and inference speed, but its precision, recall, mAP@0.5, and F1-score are all lower than FGS-YOLOv8s-seg. In practical applications, the benefit of high target recognition accuracy often outweighs that of inference speed. Although the proposed FGS-YOLOv8s-seg model has a lower inference speed compared to the YOLOv11-seg model, it still achieves 53.2 fps, which meets the speed requirements for tomato ripeness grading and harvesting. Therefore, FGS-YOLOv8s-seg demonstrates greater practical advantages in real-world deployment.
To further assess the statistical significance and reliability of the observed performance improvements, a paired t-test was conducted between the proposed FGS-YOLOv8s-seg model and the YOLOv11-seg model. All results were averaged over five independent runs. As shown in Table 6, the p-values of all key performance indicators are less than 0.001, indicating that the improvement of model performance is statistically significant. Furthermore, the 95% confidence intervals for each metric difference do not include zero, confirming the robustness of the performance gains.
To objectively evaluate the performance of the FGS-YOLOv8s-seg model proposed in this study, comparison experiments were conducted between the FGS-YOLOv8s-seg model and five instance segmentation detection models using the test set. As shown in Figure 13, when tomatoes exhibit overlapping, color interference, or small target sizes, the five instance segmentation detection models encounter misdetection and missed detection issues for distinct target feature maps, particularly for non-target tomatoes in the background. As can be seen from Figure 13, panel e1, e2, and e5, Mask R-CNN has obvious missed detection issues for tomatoes of firm ripe stage. When the image background complexity is high, the false detection probability of YOLOv5s-seg and YOLOv9-seg increases, and YOLOv5s-seg even misses detection (Figure 13, panel b2, b4, c2, and c4). Although YOLOv11 has a smaller number of GFLOPs and faster detection speed, it produces many false detections in complex greenhouse environments, with many non-target tomatoes detected in image backgrounds (Figure 13, panel d3 and d5), which is unfavorable for subsequent selective picking. In contrast, the FGS-YOLOv8s-seg model not only effectively improves the detection capability of small objects for tomato picking, but also improves the detection performance for tomatoes with large feature distribution differences in greenhouse environments, reduces the interference caused by complex backgrounds, and significantly improves the instance segmentation detection precision of greenhouse tomato maturity grading.
The Eigen-CAM technique was used to visualize the tomato detection results and highlight the image regions that the models focused on during prediction [39]. Experiments were conducted on the test set using the YOLOv5s-seg, YOLOv8s-seg, YOLOv11-seg, and FGS-YOLOv8s-seg models, and Eigen-CAM heatmaps were generated for each image. The experimental results are shown in Figure 14. As shown in Figure 14, panel d1 and d3, although YOLOv11-seg can capture all the features of the tomato target, it has difficulty handling the interference caused by the complex environment, causing the model to over-focus on the image background and produce many false detections against the complex background (Figure 13, panel d3 and d5). Although YOLOv5s-seg can eliminate most of the interference caused by the complex environment, it ignores the edge feature information of many targets (Figure 14, panel b1, b2 and b4), thereby increasing the probability of missed detection (Figure 13, panel b2 and b4). Compared with the three baseline models of instance segmentation detection, YOLOv8s-seg shows better performance in target edge detection capability and comprehensive processing of complex environmental information interference. However, in the backlight environment, as shown in Figure 14, panel c4, the detection effect of the YOLOv8s-seg model still needs to be improved, and part of the detection computing power is still focused on the image background. The improved FGS-YOLOv8s-seg model can focus more on the recognition of tomatoes, effectively eliminate the interference of complex backgrounds, and achieve more accurate tomato detection and positioning. Additionally, the FGS-YOLOv8s-seg model also has an enhanced ability to recognize individual tomatoes and tomato clusters against complex backgrounds, which fully demonstrates the effectiveness of the improved module.
The effectiveness of a model in tomato maturity grading can be evaluated through targeted detection tests. In order to ensure the diversity and comprehensiveness of the model test environment and fully simulate the complex scenes encountered in actual agricultural production, three tomato maturity grading test videos from different planting patterns were selected (Videos S1–S3, Supplementary Materials). The tomato maturity grading results of some frame images are shown in Figure 15. The results show that the FGS-YOLOv8s-seg model shows excellent detection speed and precision in the test videos of three different planting patterns. Its average times for single-frame preprocessing, inference and postprocessing are 1.5 ms, 15.3 ms and 2.0 ms, respectively, and the detection frame rate is 53.2 fps. Under uniform motion conditions, even if it is disturbed by natural light changes and surrounding weeds, the FGS-YOLOv8s-seg model still maintains a high detection precision and can accurately distinguish tomato fruits of different maturities (Videos S1–S3, Supplementary Materials). This not only verifies the versatility and effectiveness of the model in complex environments, but also provides technical support for intelligent tomato-picking decisions.

3.4. Limitations and Future Perspectives

The data collection environment is shown in Figure 16. In this study, greenhouse tomatoes needed to be defoliated before harvesting (Figure 16b). This was in order to improve the ventilation and light transmission conditions of the tomatoes, reduce the risk of pests and diseases, and thus improve the quality and yield of tomatoes. During the dataset collection process, leaf shading was effectively avoided, ensuring sufficient light in the collection environment.
To achieve efficient detection and classification, this study employs the FGS-YOLOv8s-seg model. This model enables the real-time detection of tomatoes at different maturity stages, while acquiring mask-level coordinate information through instance segmentation. When combined with subsequent depth information and camera coordinates, this approach allows for more accurate fruit assessment. However, the model still faces challenges related to environmental constraints and general applicability. Future work will focus on addressing these issues, with the planned directions including the following: (1) transfer learning will be applied to enhance the recognition capability for a wider range of tomato varieties and even other solanaceous crops, thereby improving the general applicability of the model; (2) data collection will be expanded to include diverse environmental conditions and cultivation patterns in order to improve the robustness of the detection performance and the stability of real-time tracking, thereby reducing the limitations of the model; (3) addressing computational complexity and deployment requirements through model compression techniques such as pruning and knowledge distillation; (4) exploring smaller computational modules without compromising accuracy to further reduce model size; (5) implementing cross-modal calibration with complementary technologies (e.g., multispectral cameras) to mitigate environmental interference errors in tomato maturity detection; (6) widening ridges and adopting a “big and small rows” planting pattern to create dedicated operational channels for harvesting robots.

4. Conclusions

In this study, the FGS-YOLOv8s-seg detection model was proposed for the multi-task detection of different ripeness levels of greenhouse tomatoes in complex environments, providing technical support for the rapid detection of tomato fruit ripeness phenotypes. This tomato ripeness detection algorithm improves on YOLOv8s-seg, designs the SNA attention mechanism, and fuses the FasterNet block and GCT modules to form a lightweight C2f_FasterNet_GCT module, which constructs a tomato ripeness grading detection system with faster model inference, higher precision, and smaller computational and memory resource requirements. The ablation experiments show that, compared with the baseline model, FGS-YOLOv8s-seg improves P, R, mAP@0.5, and F1-score by 2.6%, 3.8%, 5.1%, and 3.3%, respectively, while reducing GFLOPs by 6.8M. Statistical significance testing indicates that the proposed FGS-YOLOv8s-seg model achieves significant improvements over the baseline YOLOv8s-seg model across all evaluated metrics. In particular, the mAP improved by an average of 4.62 percentage points (p < 0.001), with a 95% confidence interval of [3.8781, 5.3618], demonstrating that the performance gain was statistically meaningful and robust throughout the training process. The model comparison experiments demonstrate that FGS-YOLOv8s-seg outperforms the current mainstream instance segmentation detection model, with an average inference time of only 18.8 ms and an image processing speed of 53.2 fps. This cost-effective methodology establishes critical benchmarks for standardizing greenhouse tomato cultivation and enhancing fruit detection and localization in harvesting robots. Future work will expand the dataset with diverse tomato varieties and environmental conditions to improve detection precision and model robustness.

Supplementary Materials

The following supporting information can be downloaded at: https://www.mdpi.com/article/10.3390/agronomy15071687/s1, Video S1: Greenhouse cultivation; Video S2: Low trellis cultivation; Video S3: High trellis cultivation.

Author Contributions

Conceptualization, P.L.; methodology, K.Z.; validation, D.S. and Y.Z.; formal analysis, T.L.; investigation, T.L. and K.Z.; writing—original draft preparation, D.S.; writing—review and editing, P.L.; visualization, D.S. and K.Z.; supervision, Y.Z. and K.Z.; project administration, K.Z. and P.L.; funding acquisition, P.L. All authors have read and agreed to the published version of the manuscript.

Funding

This research was funded by the Key R&D Program of Shandong Province, grant numbers 2023TZXD027 and 2024LZGC006.

Data Availability Statement

The data presented in this study are available on request from the corresponding author.

Acknowledgments

We appreciate and thank the anonymous reviewers for their helpful comments that led to the overall improvement of the manuscript. We also thank the Journal Editor Board for their help and patience throughout the review process.

Conflicts of Interest

The authors declare no conflicts of interest.

References

  1. Zhang, J.; Lyu, H.; Chen, J.; Cao, X.; Du, R.; Ma, L.; Wang, N.; Zhu, Z.; Rao, J.; Wang, J. Releasing a sugar brake generates sweeter tomato without yield penalty. Nature 2024, 635, 647–656. [Google Scholar] [CrossRef] [PubMed]
  2. Duret, S.; Aubert, C.; Annibal, S.; Derens-Bertheau, E.; Cottet, V.; Jost, M.; Chalot, G.; Flick, D.; Moureh, J.; Laguerre, O. Impact of harvest maturity and storage conditions on tomato quality: A comprehensive experimental and modeling study. Postharvest Biol. Technol. 2025, 219, 113286. [Google Scholar] [CrossRef]
  3. Kasampalis, D.S.; Tsouvaltzis, P.; Siomos, A.S. Chlorophyll fluorescence, non-photochemical quenching and light harvesting complex as alternatives to color measurement, in classifying tomato fruit according to their maturity stage at harvest and in monitoring postharvest ripening during storage. Postharvest Biol. Technol. 2020, 161, 111036. [Google Scholar] [CrossRef]
  4. Wang, S.; Jiang, H.; Yang, J.; Ma, X.; Chen, J.; Li, Z.; Tang, X. Lightweight tomato ripeness detection algorithm based on the improved RT-DETR. Front. Plant Sci. 2024, 15, 1415297. [Google Scholar] [CrossRef]
  5. Cano-Lara, M.; Rostro-Gonzalez, H. Tomato quality assessment and enhancement through Fuzzy Logic: A ripe perspective on precision agriculture. Postharvest Biol. Technol. 2024, 212, 112875. [Google Scholar] [CrossRef]
  6. Rizzo, M.; Marcuzzo, M.; Zangari, A.; Gasparetto, A.; Albarelli, A. Fruit ripeness classification: A survey. Artif. Intell. Agric. 2023, 7, 44–57. [Google Scholar] [CrossRef]
  7. Gupta, S.; Tripathi, A.K. Tripathi, Fruit and vegetable disease detection and classification: Recent trends, challenges, and future opportunities. Eng. Appl. Artif. Intell. 2024, 133, 108260. [Google Scholar] [CrossRef]
  8. Zhu, A.; Zhang, R.; Zhang, L.; Yi, T.; Wang, L.; Zhang, D.; Chen, L. YOLOv5s-CEDB: A robust and efficiency Camellia oleifera fruit detection algorithm in complex natural scenes. Comput. Electron. Agric. 2024, 221, 108984. [Google Scholar] [CrossRef]
  9. Gill, H.S.; Murugesan, G.; Mehbodniya, A.; Sajja, G.S.; Gupta, G.; Bhatt, A. Fruit type classification using deep learning and feature fusion. Comput. Electron. Agric. 2023, 211, 107990. [Google Scholar] [CrossRef]
  10. Gulzar, Y. Fruit image classification model based on MobileNetV2 with deep transfer learning technique. Sustainability 2023, 15, 1906. [Google Scholar] [CrossRef]
  11. Paul, A.; Machavaram, R.; Kumar, D.; Nagar, H. Smart solutions for capsicum Harvesting: Unleashing the power of YOLO for Detection, Segmentation, growth stage Classification, Counting, and real-time mobile identification. Comput. Electron. Agric. 2024, 219, 108832. [Google Scholar] [CrossRef]
  12. Azgomi, H.; Haredasht, F.R.; Motlagh, M.R.S. Diagnosis of some apple fruit diseases by using image processing and artificial neural network. Food Control 2023, 145, 109484. [Google Scholar] [CrossRef]
  13. Zhu, Y.; Sui, S.; Du, W.; Li, X.; Liu, P. Picking point localization method of table grape picking robot based on you only look once version 8 nano. Eng. Appl. Artif. Intell. 2025, 146, 110266. [Google Scholar] [CrossRef]
  14. Yousaf, J.; Abuowda, Z.; Ramadan, S.; Salam, N.; Almajali, E.; Hassan, T.; Gad, A.; Alkhedher, M.; Ghazal, M. Autonomous smart palm tree harvesting with deep learning-enabled date fruit type and maturity stage classification. Eng. Appl. Artif. Intell. 2025, 139, 109506. [Google Scholar] [CrossRef]
  15. Miao, Z.; Yu, X.; Li, N.; Zhang, Z.; He, C.; Li, Z.; Deng, C.; Sun, T. Efficient tomato harvesting robot based on image processing and deep learning. Precis. Agric. 2023, 24, 254–287. [Google Scholar] [CrossRef]
  16. Kaur, P.; Harnal, S.; Gautam, V.; Singh, M.P.; Singh, S.P. An approach for characterization of infected area in tomato leaf disease based on deep learning and object detection technique. Eng. Appl. Artif. Intell. 2022, 115, 105210. [Google Scholar] [CrossRef]
  17. Wang, Z.; Ling, Y.; Wang, X.; Meng, D.; Nie, L.; An, G.; Wang, X. An improved Faster R-CNN model for multi-object tomato maturity detection in complex scenarios. Ecol. Inform. 2022, 72, 101886. [Google Scholar] [CrossRef]
  18. Gu, Z.; Ma, X.; Guan, H.; Jiang, Q.; Deng, H.; Wen, B.; Zhu, T.; Wu, X. Tomato fruit detection and phenotype calculation method based on the improved RTDETR model. Comput. Electron. Agric. 2024, 227, 109524. [Google Scholar] [CrossRef]
  19. Zhang, J.; Xie, J.; Zhang, F.; Gao, J.; Yang, C.; Song, C.; Rao, W.; Zhang, Y. Greenhouse tomato detection and pose classification algorithm based on improved YOLOv5. Comput. Electron. Agric. 2024, 216, 108519. [Google Scholar] [CrossRef]
  20. Zeng, T.; Li, S.; Song, Q.; Zhong, F.; Wei, X. Lightweight tomato real-time detection method based on improved YOLO and mobile deployment. Comput. Electron. Agric. 2023, 205, 107625. [Google Scholar] [CrossRef]
  21. Chen, W.; Liu, M.; Zhao, C.; Li, X.; Wang, Y. MTD-YOLO: Multi-task deep convolutional neural network for cherry tomato fruit bunch maturity detection. Comput. Electron. Agric. 2024, 216, 108533. [Google Scholar] [CrossRef]
  22. Gao, J.; Zhang, J.; Zhang, F.; Gao, J. LACTA: A lightweight and accurate algorithm for cherry tomato detection in unstructured environments. Expert Syst. Appl. 2024, 238, 122073. [Google Scholar] [CrossRef]
  23. Liu, Z.; Wu, X.; Liu, H.; Zhang, M.; Liao, W. DNA methylation in tomato fruit ripening. Physiol. Plant. 2022, 174, e13627. [Google Scholar] [CrossRef]
  24. Charisis, C.; Argyropoulos, D. Deep learning-based instance segmentation architectures in agriculture: A review of the scopes and challenges. Smart Agric. Technol. 2024, 8, 100448. [Google Scholar] [CrossRef]
  25. Qi, Z.; Hua, W.; Zhang, Z.; Deng, X.; Yuan, T.; Zhang, W. A novel method for tomato stem diameter measurement based on improved YOLOv8-seg and RGB-D data. Comput. Electron. Agric. 2024, 226, 109387. [Google Scholar] [CrossRef]
  26. Zhang, Y.; Shi, N.; Zhang, H.; Zhang, J.; Fan, X.; Suo, X. Appearance quality classification method of Huangguan pear under complex background based on instance segmentation and semantic segmentation. Front. Plant Sci. 2022, 13, 914829. [Google Scholar] [CrossRef]
  27. Yue, X.; Qi, K.; Na, X.; Zhang, Y.; Liu, Y.; Liu, C. Improved YOLOv8-Seg network for instance segmentation of healthy and diseased tomato plants in the growth stage. Agriculture 2023, 13, 1643. [Google Scholar] [CrossRef]
  28. Liu, M.; Chen, W.; Cheng, J.; Wang, Y.; Zhao, C. Y-HRNet: Research on multi-category cherry tomato instance segmentation model based on improved YOLOv7 and HRNet fusion. Comput. Electron. Agric. 2024, 227, 109531. [Google Scholar] [CrossRef]
  29. Sapkota, R.; Ahmed, D.; Karkee, M. Comparing YOLOv8 and Mask R-CNN for instance segmentation in complex orchard environments. Artif. Intell. Agric. 2024, 13, 84–99. [Google Scholar] [CrossRef]
  30. GH/T 1193-2021; Tomato. China CO-OP: Beijing, China, 2021.
  31. Lee, Y.-S.; Patil, M.P.; Kim, J.G.; Seo, Y.B.; Ahn, D.-H.; Kim, G.-D. Hyperparameter optimization of apple leaf dataset for the disease recognition based on the YOLOv8. J. Agric. Food Res. 2025, 21, 101840. [Google Scholar] [CrossRef]
  32. Singh, A.; Yadav, A.; Verma, A.; Rana, P.S. Comparative Analysis of YOLO Models for Plant Disease Instance Segmentation. In Proceedings of the 2024 IEEE International Conference on Computer Vision and Machine Intelligence (CVMI), Prayagraj, India, 19–20 October 2024; pp. 1–6. [Google Scholar]
  33. Randar, S.; Shah, V.; Kulkarni, H.; Suryawanshi, Y.; Joshi, A.; Sawant, S. YOLOv8-based frameworks for liver and tumor segmentation task on LiTS. SN Comput. Sci. 2024, 5, 741. [Google Scholar] [CrossRef]
  34. Guo, M.-H.; Lu, C.-Z.; Hou, Q.; Liu, Z.; Cheng, M.-M.; Hu, S.-M. Segnext: Rethinking convolutional attention design for semantic segmentation. Adv. Neural Inf. Proc. Syst. 2022, 35, 1140–1156. [Google Scholar]
  35. Ruan, D.; Wang, D.; Zheng, Y.; Zheng, N.; Zheng, M. Gaussian Context Transformer. In Proceedings of the IEEE/CVF Conference on Computer Vision and Pattern Recognition, Nashville, TN, USA, 20–25 June 2021. [Google Scholar]
  36. Chen, J.; Kao, S.-H.; He, H.; Zhuo, W.; Wen, S.; Lee, C.-H.; Chen, S.-H.G. Run,Don’t Walk: Chasing Higher FLOPS for Faster Neural Networks. In Proceedings of the IEEE/CVF Conference on Computer Vision and Pattern Recognition, Vancouver, BC, Canada, 17–24 June 2023. [Google Scholar]
  37. Deng, X.; Liu, Q.; Deng, Y.; Mahadevan, S. An improved method to construct basic probability assignment based on the confusion matrix for classification problem. Inf. Sci. 2016, 340, 250–261. [Google Scholar] [CrossRef]
  38. Song, X.; Zhang, W.; Pan, W.; Liu, P.; Wang, C. Real-time monitor heading dates of wheat accessions for breeding in-field based on DDEW-YOLOv7 model and BotSort algorithm. Expert Syst. Appl. 2025, 267, 126140. [Google Scholar] [CrossRef]
  39. Muhammad, M.B.; Yeasin, M. Eigen-cam: Class Activation Map Using Principal Components. In Proceedings of the 2020 International Joint Conference on Neural Networks (IJCNN), Glasgow, UK, 19–24 July 2020. [Google Scholar]
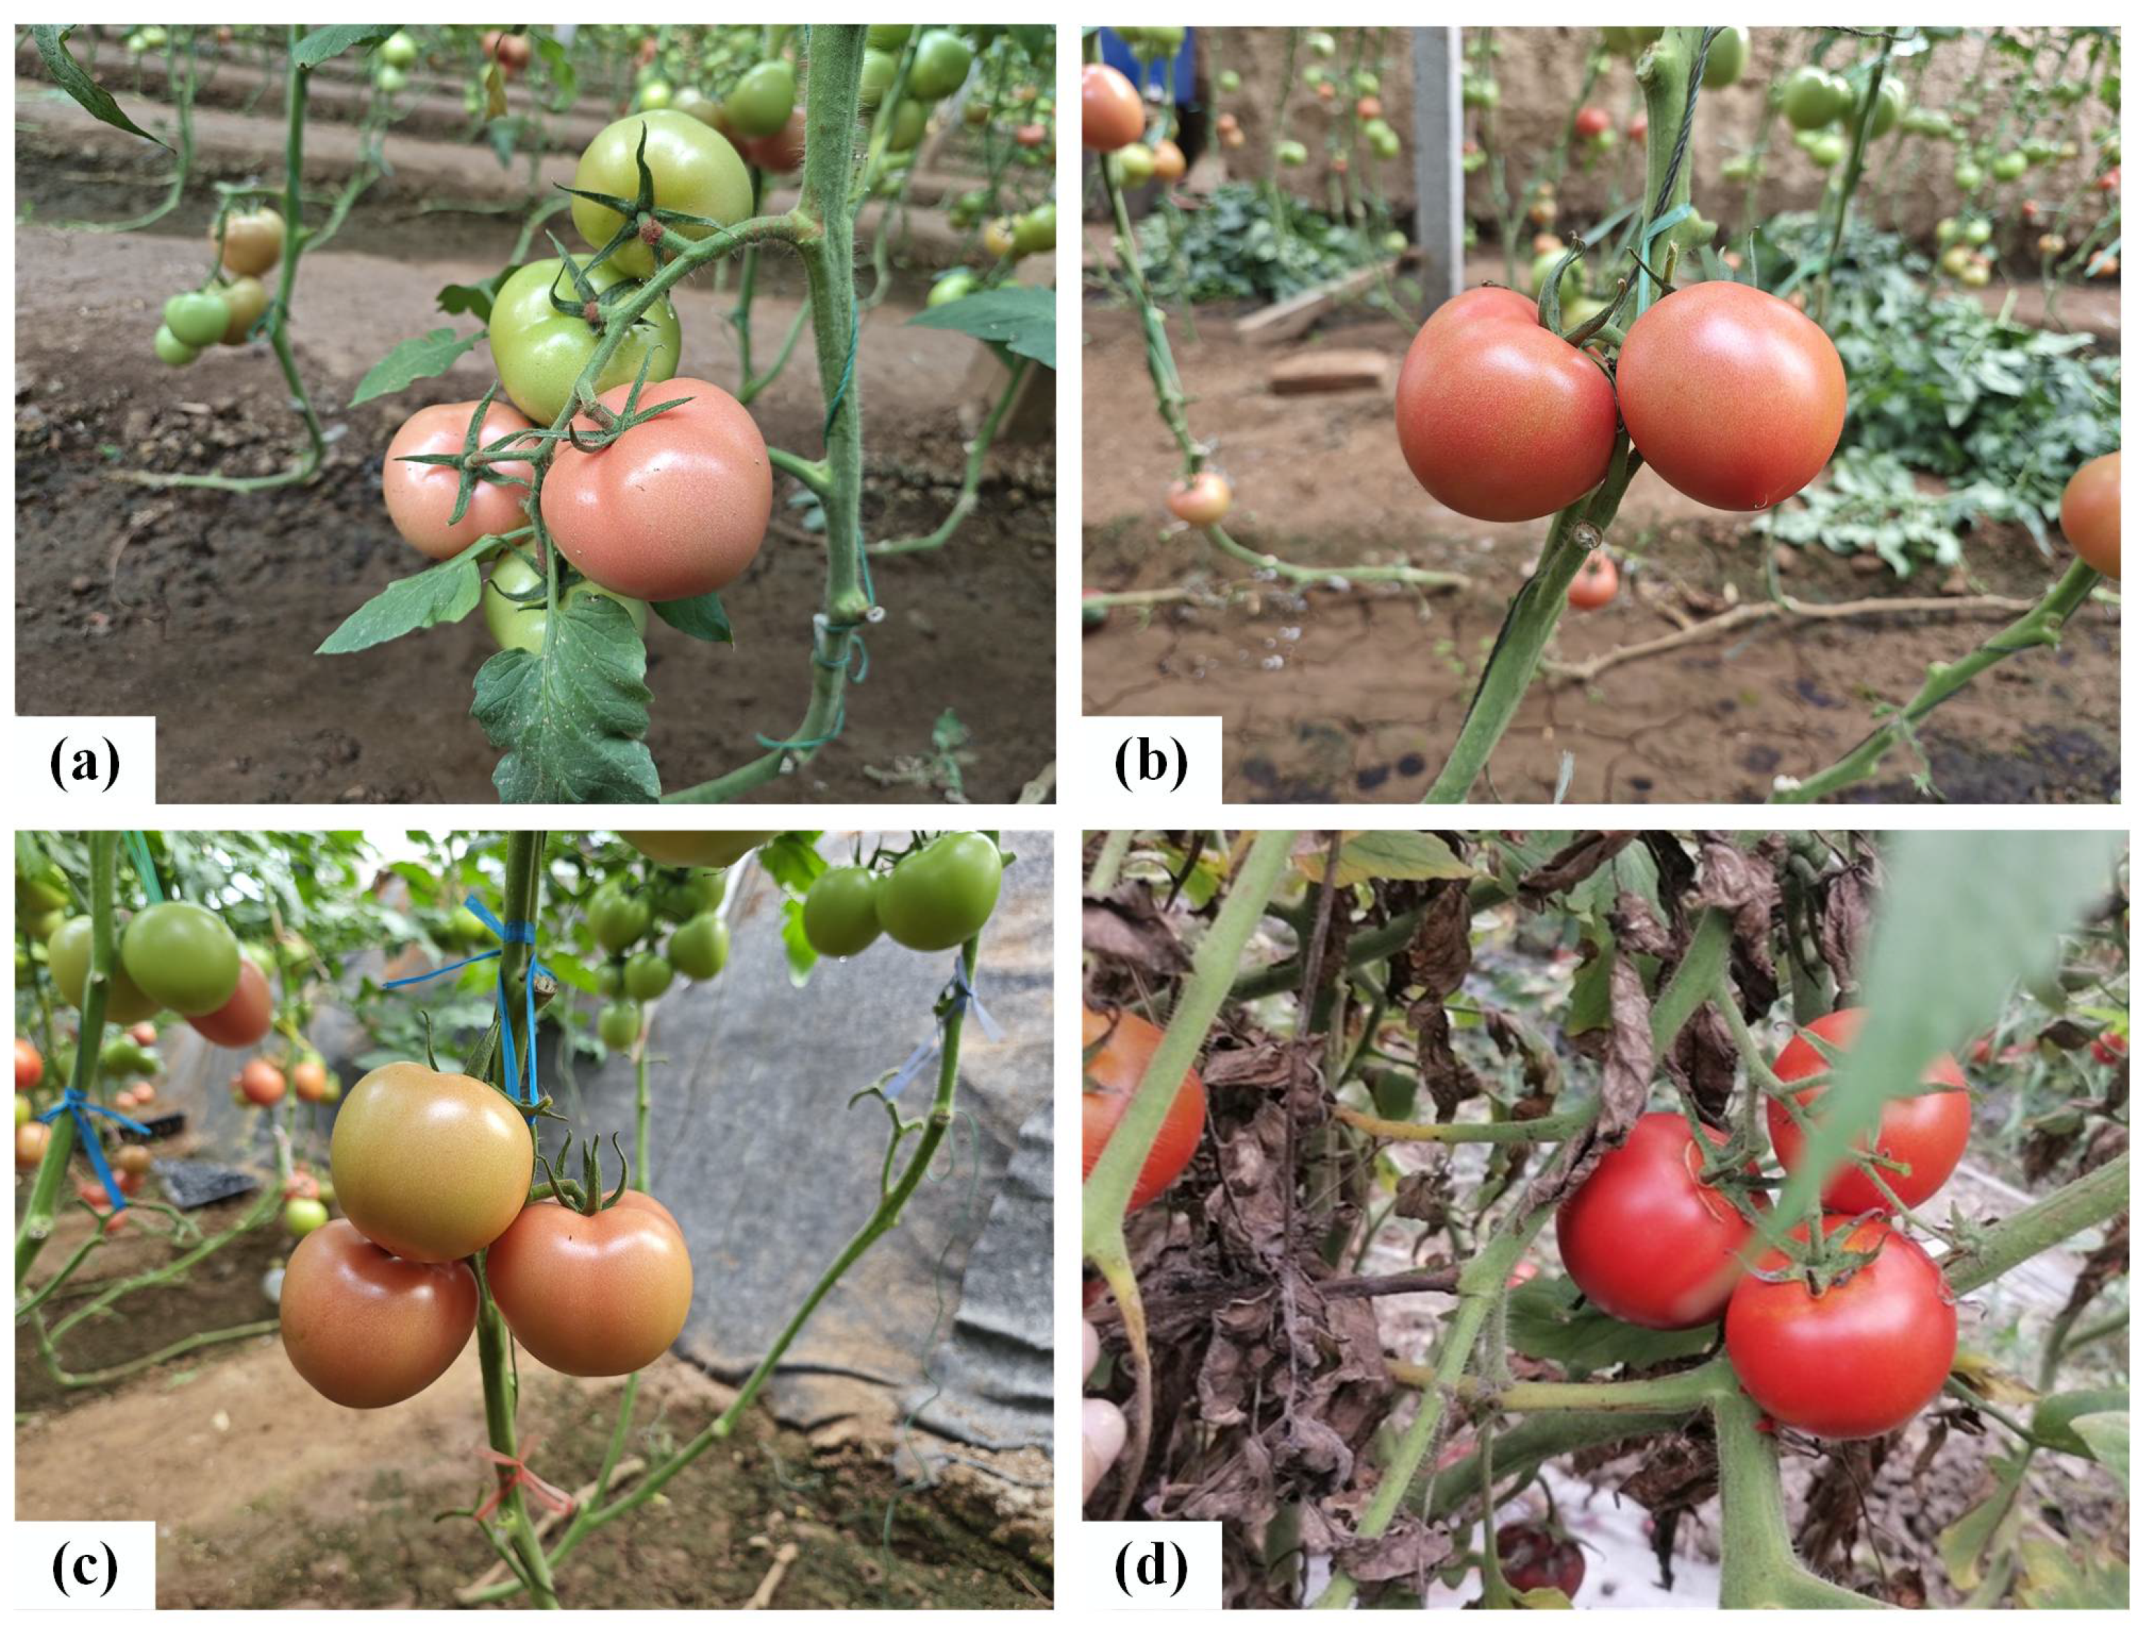
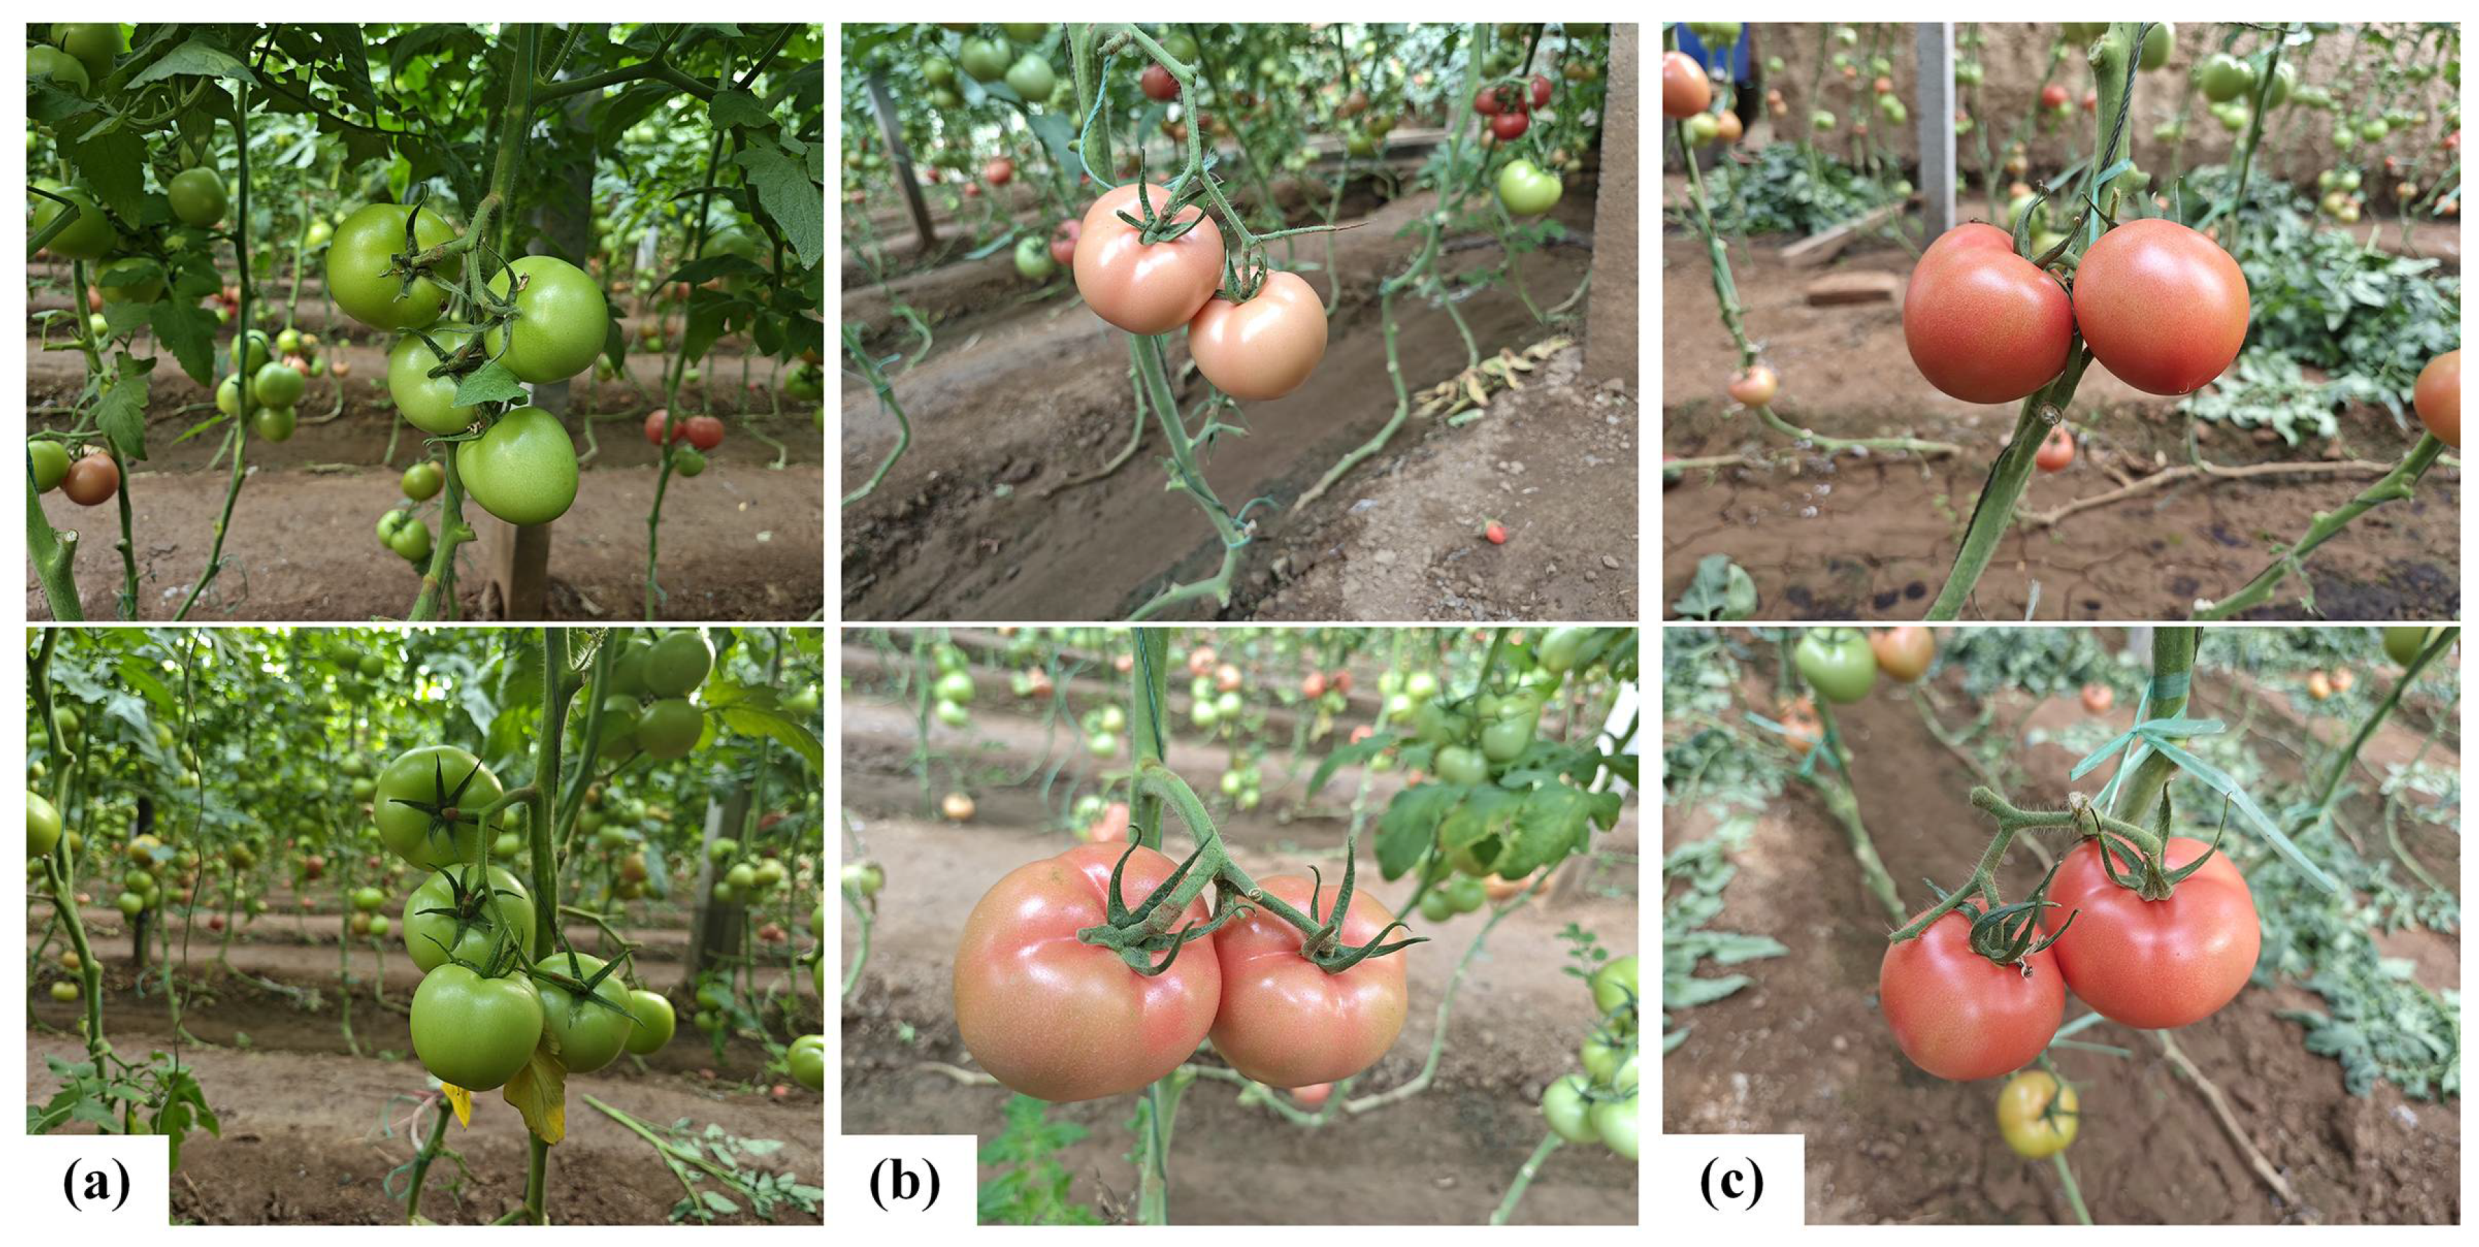
Figure 1. Location of tomato data collection.
Agronomy 15 01687 g001
Figure 2. Examples of different collected tomato varieties. (a) DaHong, (b) RuiFen, (c) Sheraton103, (d) Provence.
Agronomy 15 01687 g002
Figure 3. Tomato fruit labeling.
Agronomy 15 01687 g003
Figure 4. Selected tomato ripeness grading. (a) Mature green, (b) turning stage, (c) firm ripe.
Agronomy 15 01687 g004
Figure 5. The network structure of FGS-YOLOv8s-Seg.
Agronomy 15 01687 g005
Figure 6. Multi-scale convolutional attention (MSCA) module.
Agronomy 15 01687 g006
Figure 7. FasterNet block and stacking.
Agronomy 15 01687 g007
Figure 8. C2f_FasterNet_GCT structure.
Agronomy 15 01687 g008
Figure 9. Performance comparison of FGS-YOLOv8s-seg and baseline models.
Agronomy 15 01687 g009
Figure 10. Comparison of confusion matrix results. (a) YOLOv8s-seg; (b) FGS-YOLOv8s-seg.
Agronomy 15 01687 g010
Figure 11. The performance changes in the model with different improvements. (a) Precision, (b) recall, (c) mAP@0.5.
Agronomy 15 01687 g011
Figure 12. Structure comparison of C2f module and C3k2 module.
Agronomy 15 01687 g012
Figure 13. A comparison of the recognition effects of different model tests. (a) represents the original image. (bg), respectively, represent the recognition effect comparison of the six models: YOLOv5s-seg, YOLOv9-seg, YOLOv11-seg, Mask R-CNN, Cascade Mask R-CNN, and FGS-YOLOv8s-seg.
Agronomy 15 01687 g013
Figure 14. Eigen-CAM heatmaps. (a) represents original image; (be), respectively, represent Eigen-CAM heatmaps of four models: YOLOv5s-seg, YOLOv8s-seg, YOLOv11-seg, and FGS-YOLOv8s-seg.
Agronomy 15 01687 g014
Figure 15. Example diagram of tomato maturity grading results from. (a) Video S1, (b) Video S2, (c) Video S3.
Agronomy 15 01687 g015
Figure 16. Harvesting environment in tomato greenhouse. (a) Ridge measurement in greenhouse during tomato data collection; (b) Greenhouse environment during tomato data collection.
Agronomy 15 01687 g016
Table 1. Tomato ripeness grading.
MaturityMorphological CharacteristicsPicking Situation
Immature GreenFruit size not stabilized, small in shape, white-green skinNot suitable for picking
Mature GreenFruit size stabilized, skin transitioning from white-green to greenSuitable for artificial ripening or long-distance transportation
Turning StageFruit size stabilized, 10% to 60% of surface turns red or orangeSuitable for storage or short-distance transportation
Firm Ripe60–90% of fruit surface fully red/orangePicking for sale within 2 days
Table 2. Experimental environment and parameters.
Environment ConfigurationParameter
Operating SystemWindows 11
CPUIntel Core i7-12650H
GPUNVIDIA GeForce RTX 4060
Python3.8
Pytorch2.3.1
CUDA12.5
lr00.0001
lrf0.1
Momentum0.937
Batch Size16
Epochs300
Table 3. FGS-YOLOv8s-seg ablation experiment.
MethodP (%)R (%)mAP@0.5F1-ScoreGFLOPs
FasterNetGCTSNA
---84.372.579.778.042.4
--83.971.478.977.231.7
--86.471.783.178.443.8
-85.678.281.181.733.1
--85.174.981.679.745.9
86.9
(↑2.6)
76.3
(↑3.8)
84.8
(↑5.1)
81.3
(↑3.3)
35.6
(↓6.8)
Table 4. Statistical significance analysis of detection performance between YOLOv8s-seg and FGS-YOLOv8s-seg.
IndicatorYOLOv8s-seg
(Mean ± SD)
FGS-YOLOv8s-seg
(Mean ± SD)
Mean
Difference
p-Value95% Confidence Interval
P (%)84.2 ± 0.19286.9 ± 0.152+2.76<0.001(2.5522, 2.9678)
R (%)72.4 ± 0.19576.2 ± 0.274+3.76<0.001(3.3713, 4.1487)
mAP@0.5 (%)79.9 ± 0.27084.6 ± 0.385+4.62<0.001(3.8781, 5.3618)
F1-score (%)77.9 ± 0.16581.2 ± 0.193+3.34<0.001(3.1517, 3.5283)
Table 5. Comparison between different example segmentation models.
ModelsPrecision (%)Recall (%)mAP@0.5F1-ScoreGFLOPs
YOLOv5s-seg82.169.378.575.259.7
YOLOv9-seg75.471.379.273.371.3
YOLOv11-seg82.574.982.378.533.4
Mask R-CNN51.252.855.852.091.1
Cascade Mask R-CNN59.455.160.457.296.8
FGS-YOLOv8s-seg86.9
(↑4.4)
76.3
(↑1.4)
84.8
(↑2.5)
81.3
(↑2.8)
35.6
(↑2.2)
Table 6. Statistical significance analysis of detection performance between YOLOv11-seg and FGS-YOLOv8s-seg.
IndicatorYOLOv11-seg
(Mean ± SD)
FGS-YOLOv8s-seg
(Mean ± SD)
Mean
Difference
p-Value95% Confidence Interval
P (%)82.6 ± 0.21986.9 ± 0.152+4.38<0.001(4.0355, 4.7245)
R (%)74.9 ± 0.27476.2 ± 0.274+1.3<0.001(0.7176, 1.8824)
mAP@0.5 (%)82.3 ± 0.32184.6 ± 0.385+2.22<0.001(1.5724, 2.8676)
F1-score (%)78.5 ± 0.18481.2 ± 0.193+2.68<0.001(2.2204, 3.1396)
Disclaimer/Publisher’s Note: The statements, opinions and data contained in all publications are solely those of the individual author(s) and contributor(s) and not of MDPI and/or the editor(s). MDPI and/or the editor(s) disclaim responsibility for any injury to people or property resulting from any ideas, methods, instructions or products referred to in the content.

