
Rapid and Accurate Measurement of Major Soybean Components Using Near-Infrared Spectroscopy


Abstract
1. Introduction
2. Materials and Methods
2.1. Sample Preparation
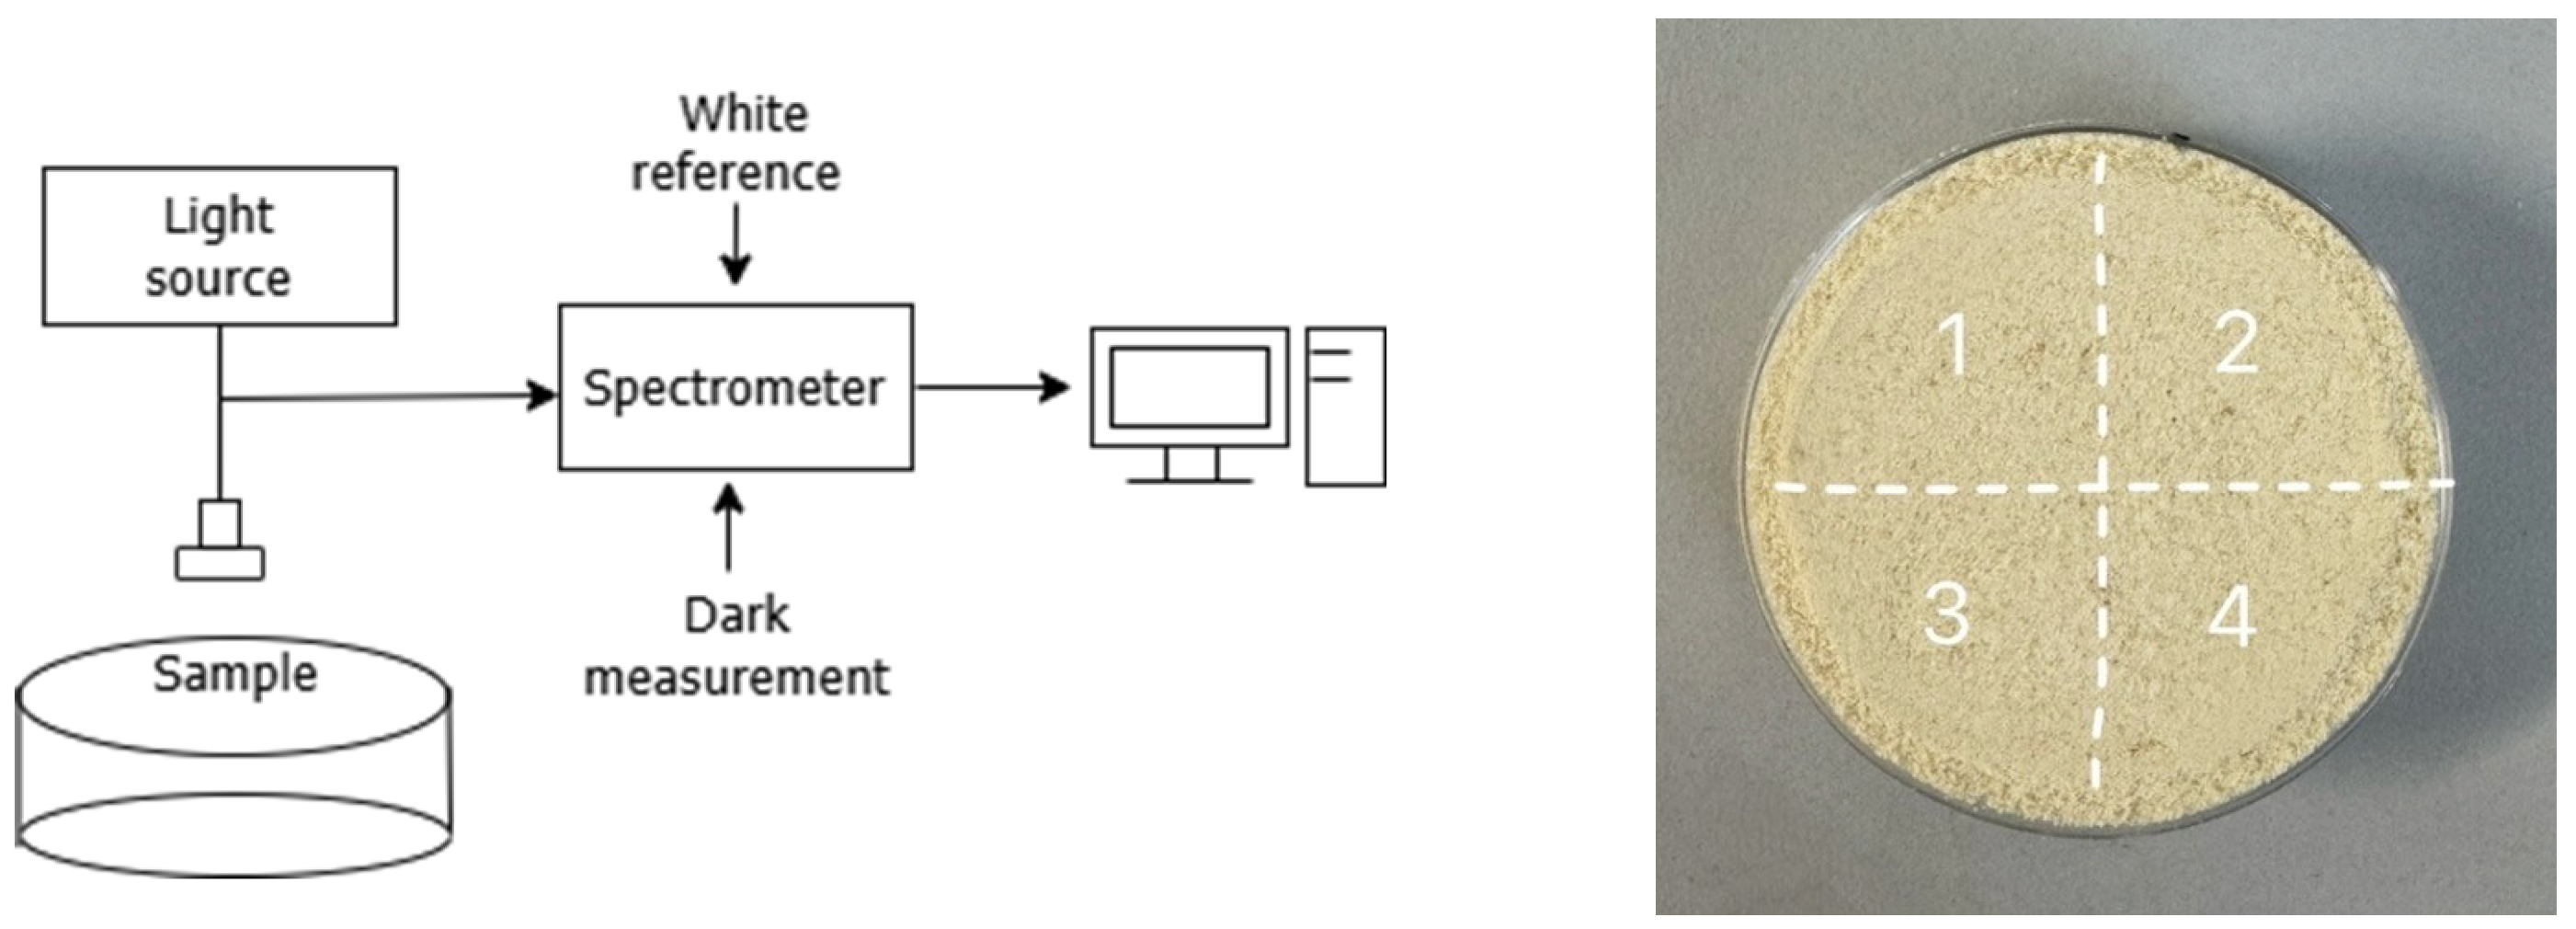
2.2. Spectral Measurement
2.3. Chemometrics
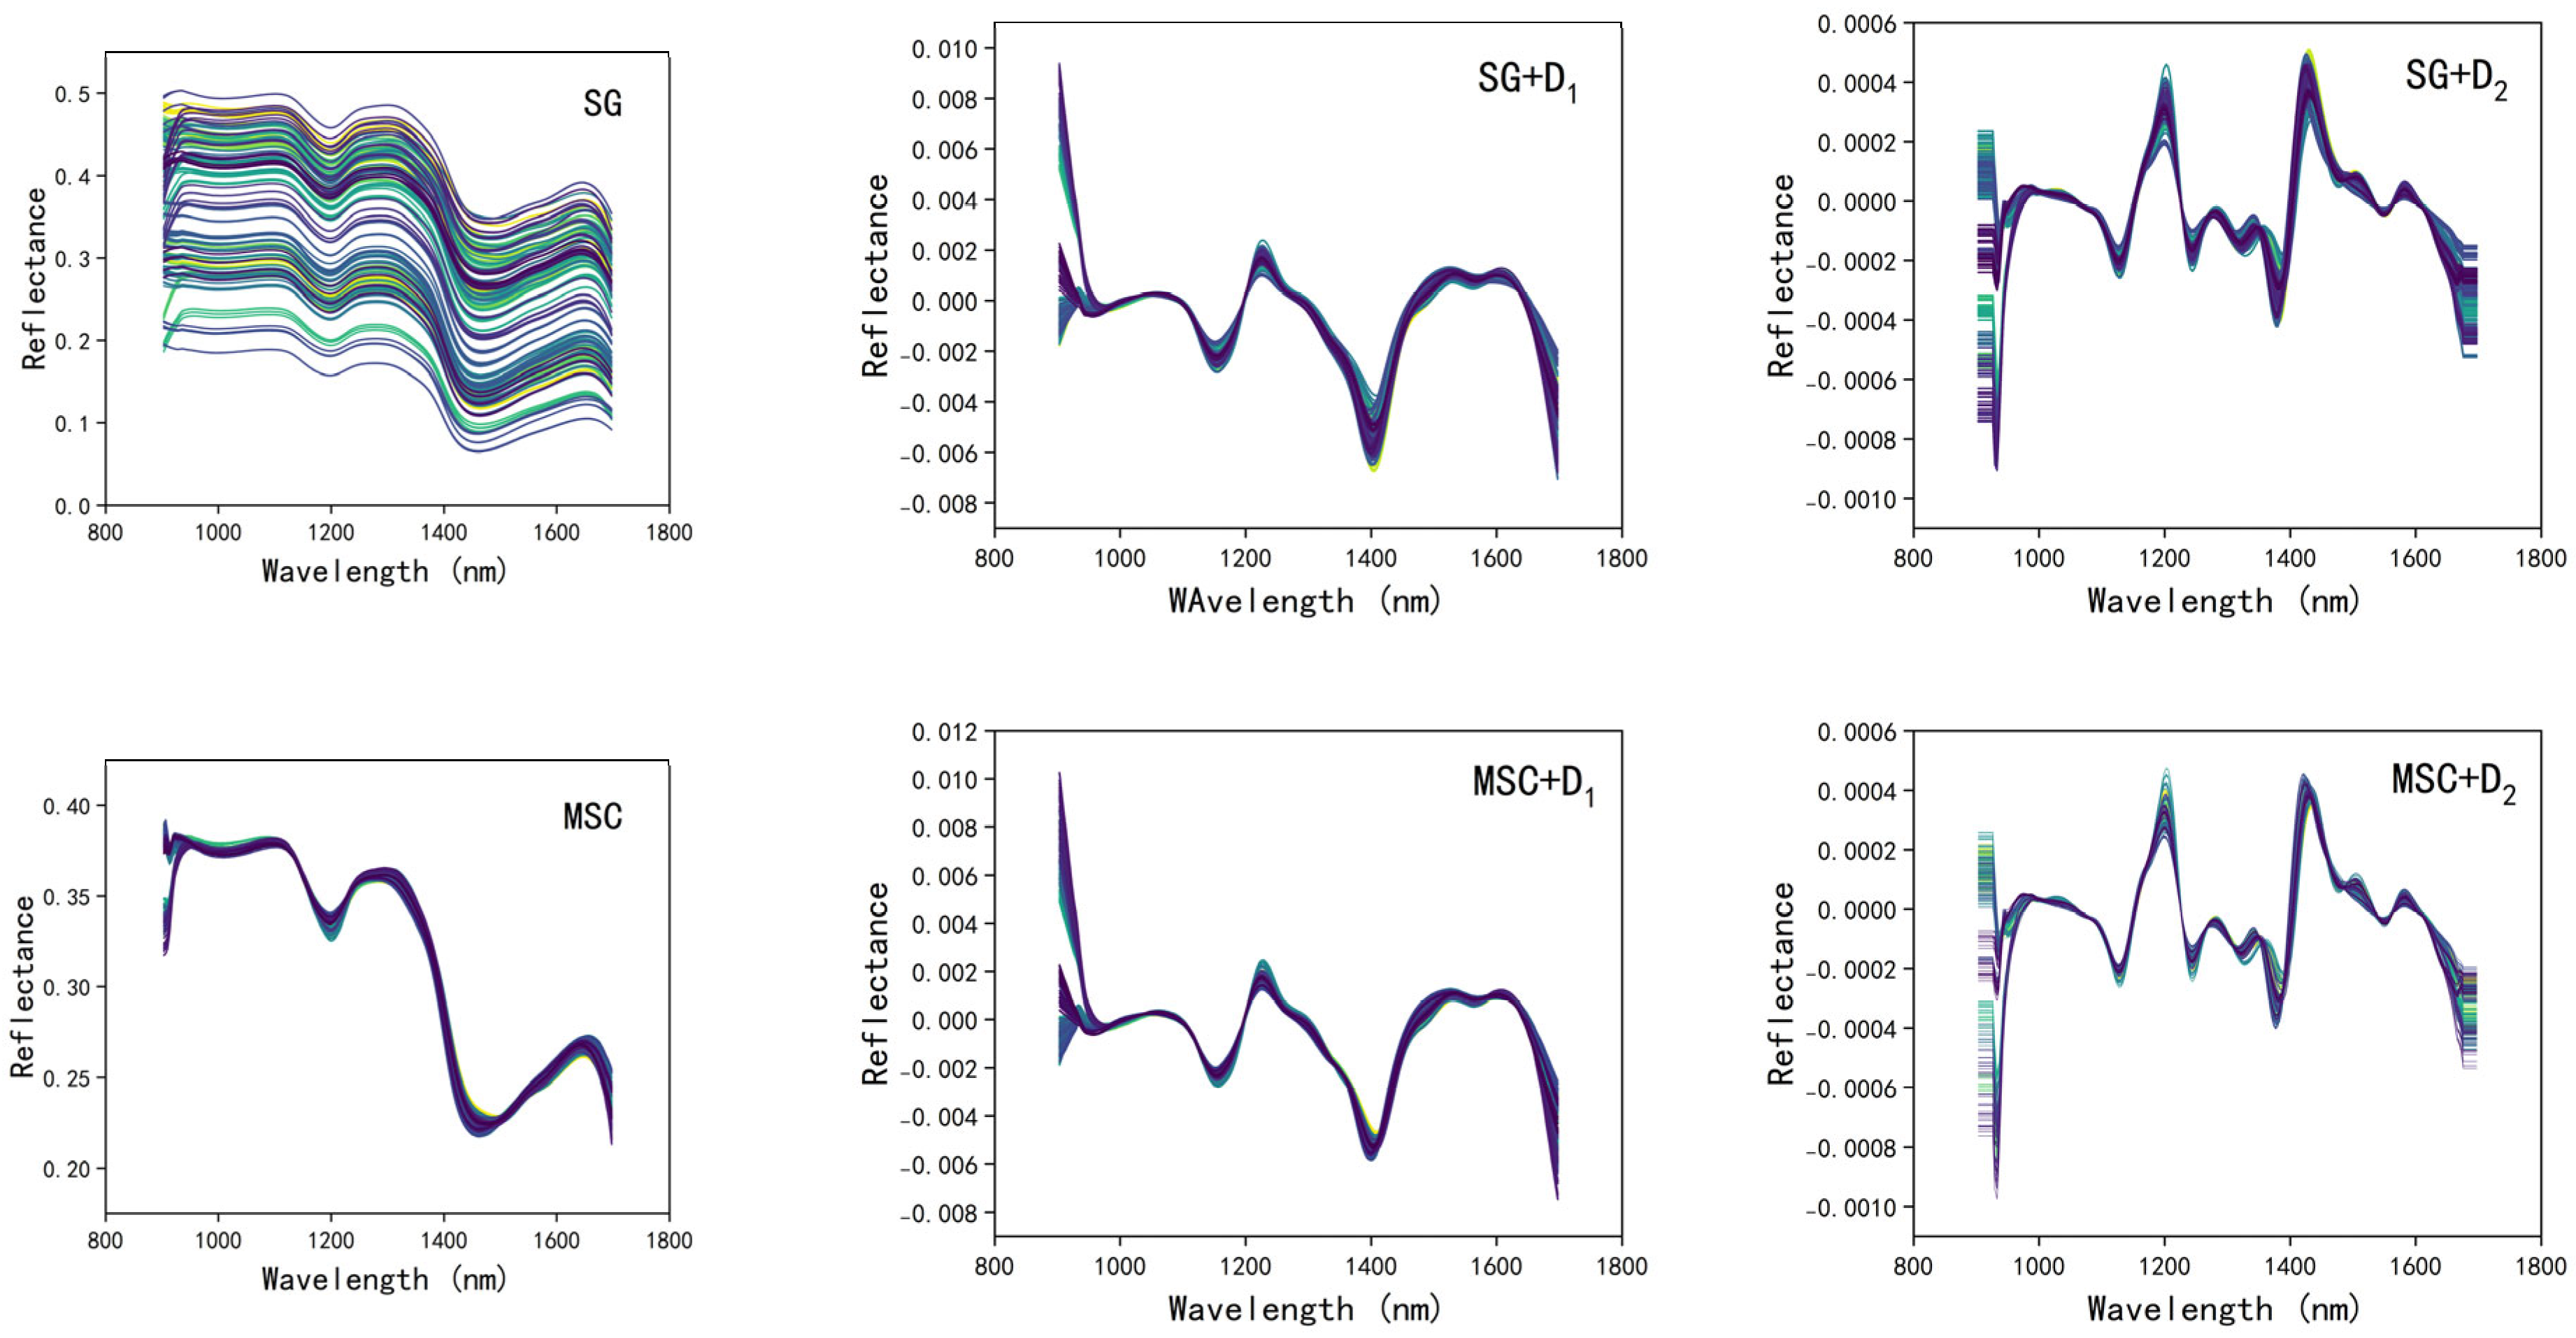
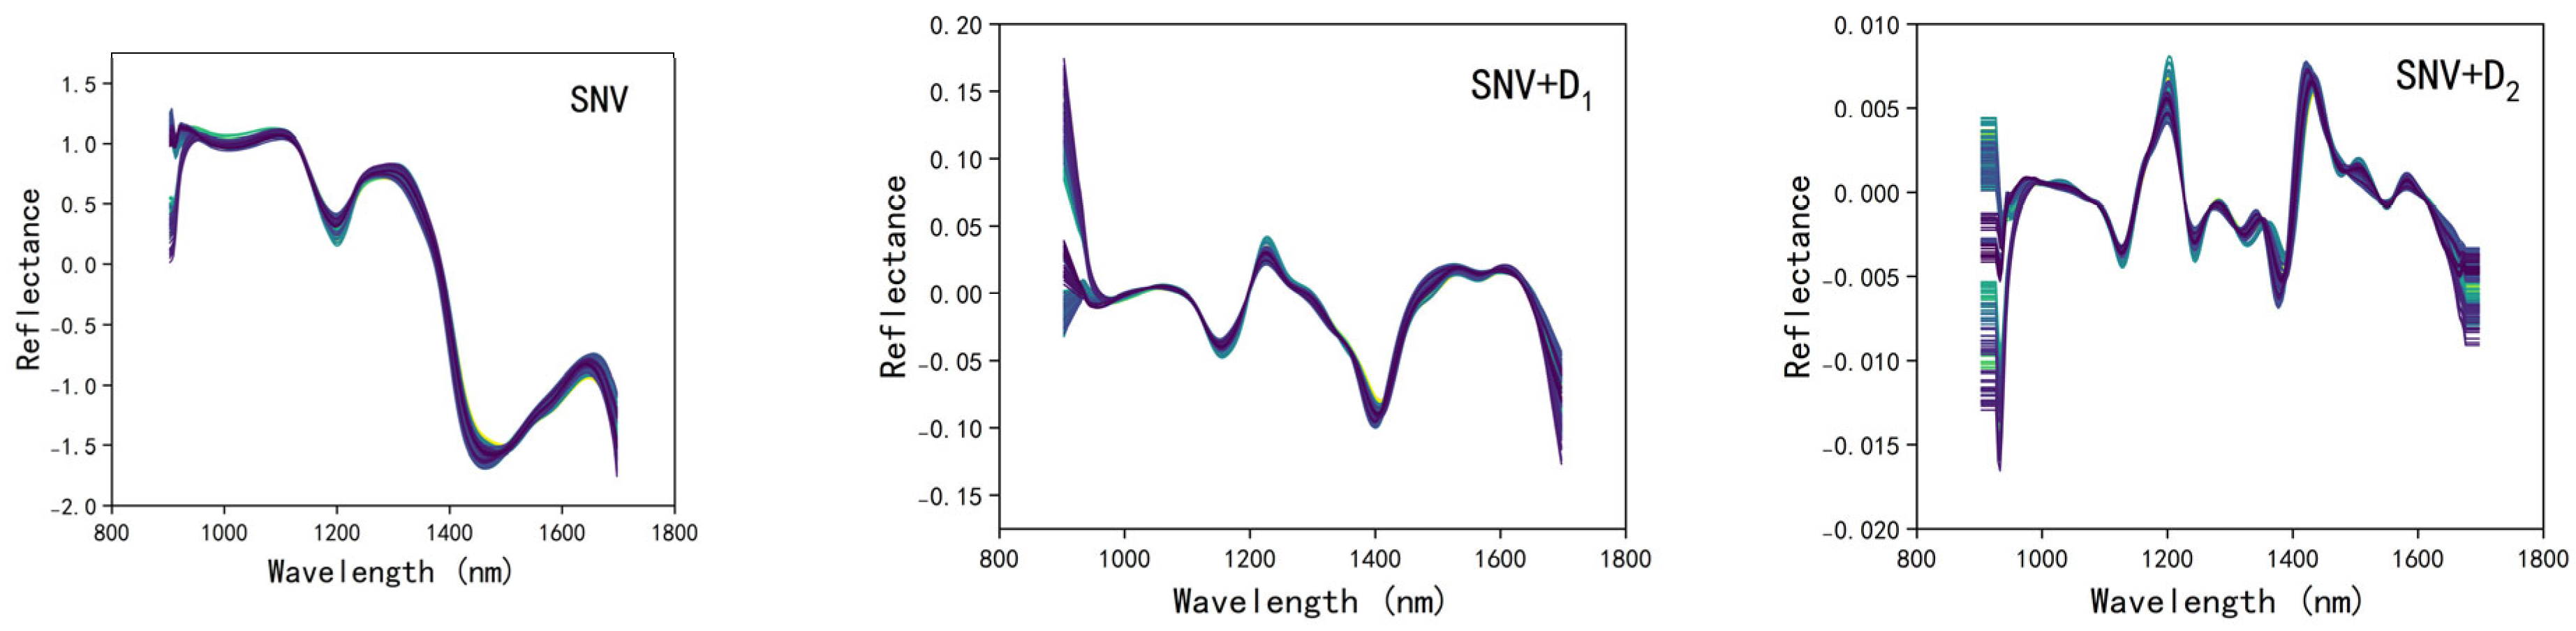
2.3.1. Spectral Preprocessing
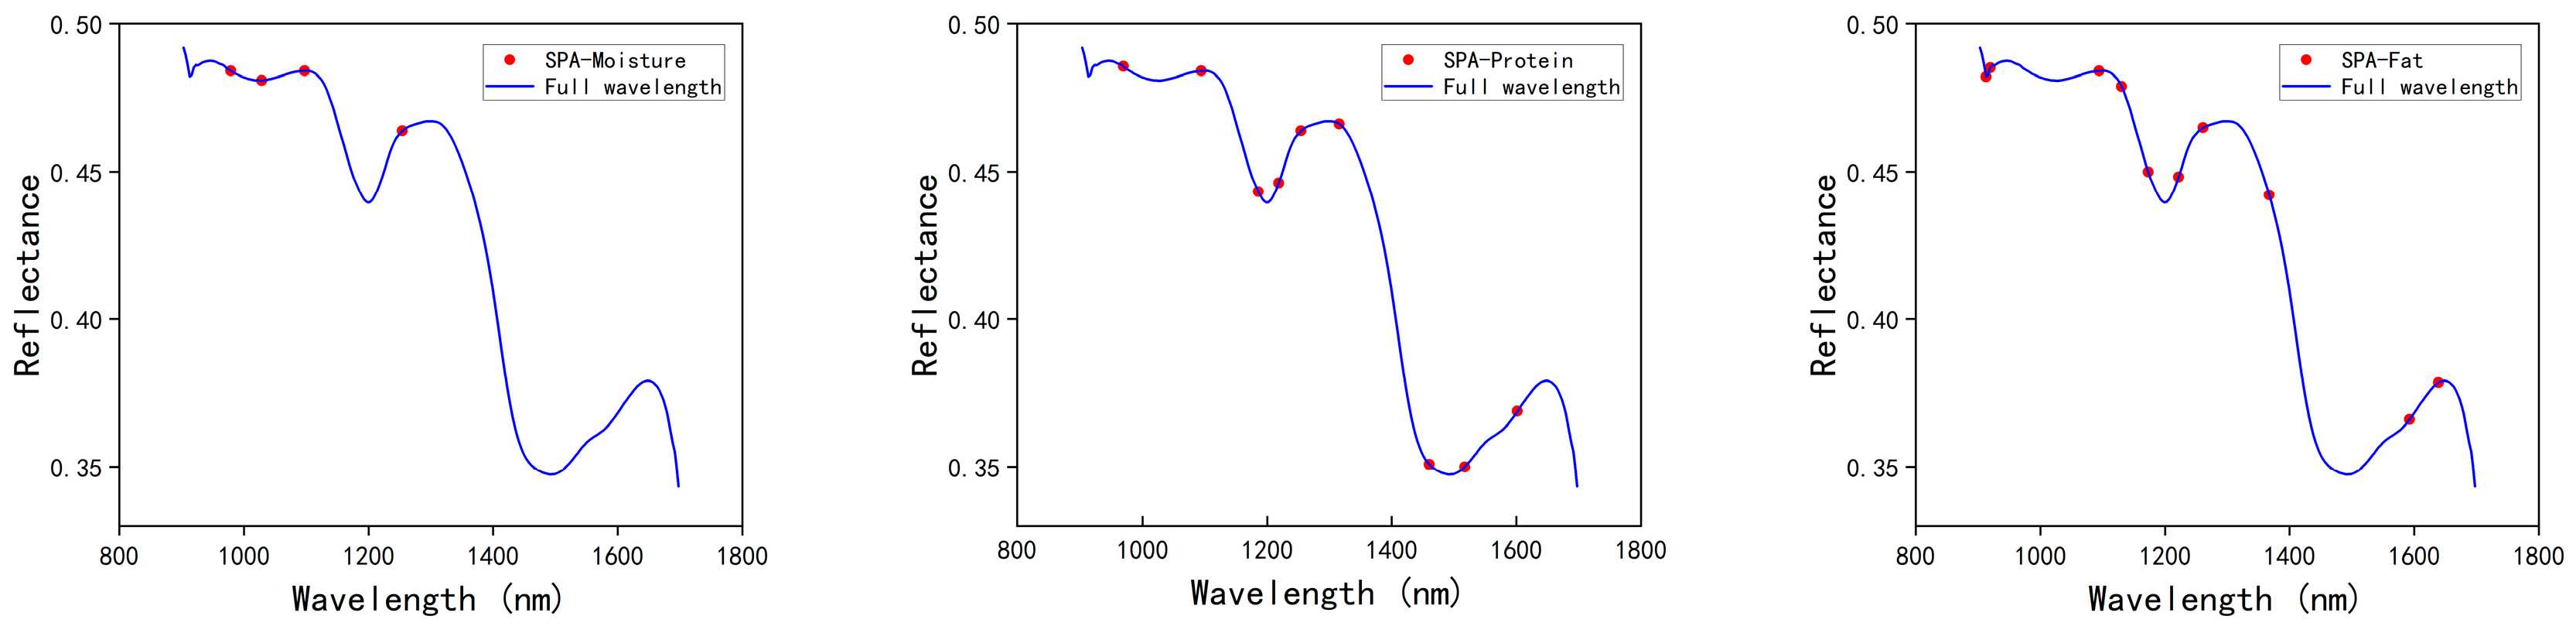
2.3.2. Selection of Optimal Wavelength
2.3.3. Development of Quantitative Prediction Models
2.4. Evaluation Metrics
2.5. Software
3. Results
3.1. Descriptive Statistics
3.2. Selection of the Optimal Spectral Preprocessing Method
3.3. Feature Variable Extraction
3.3.1. CARS
3.3.2. SPA
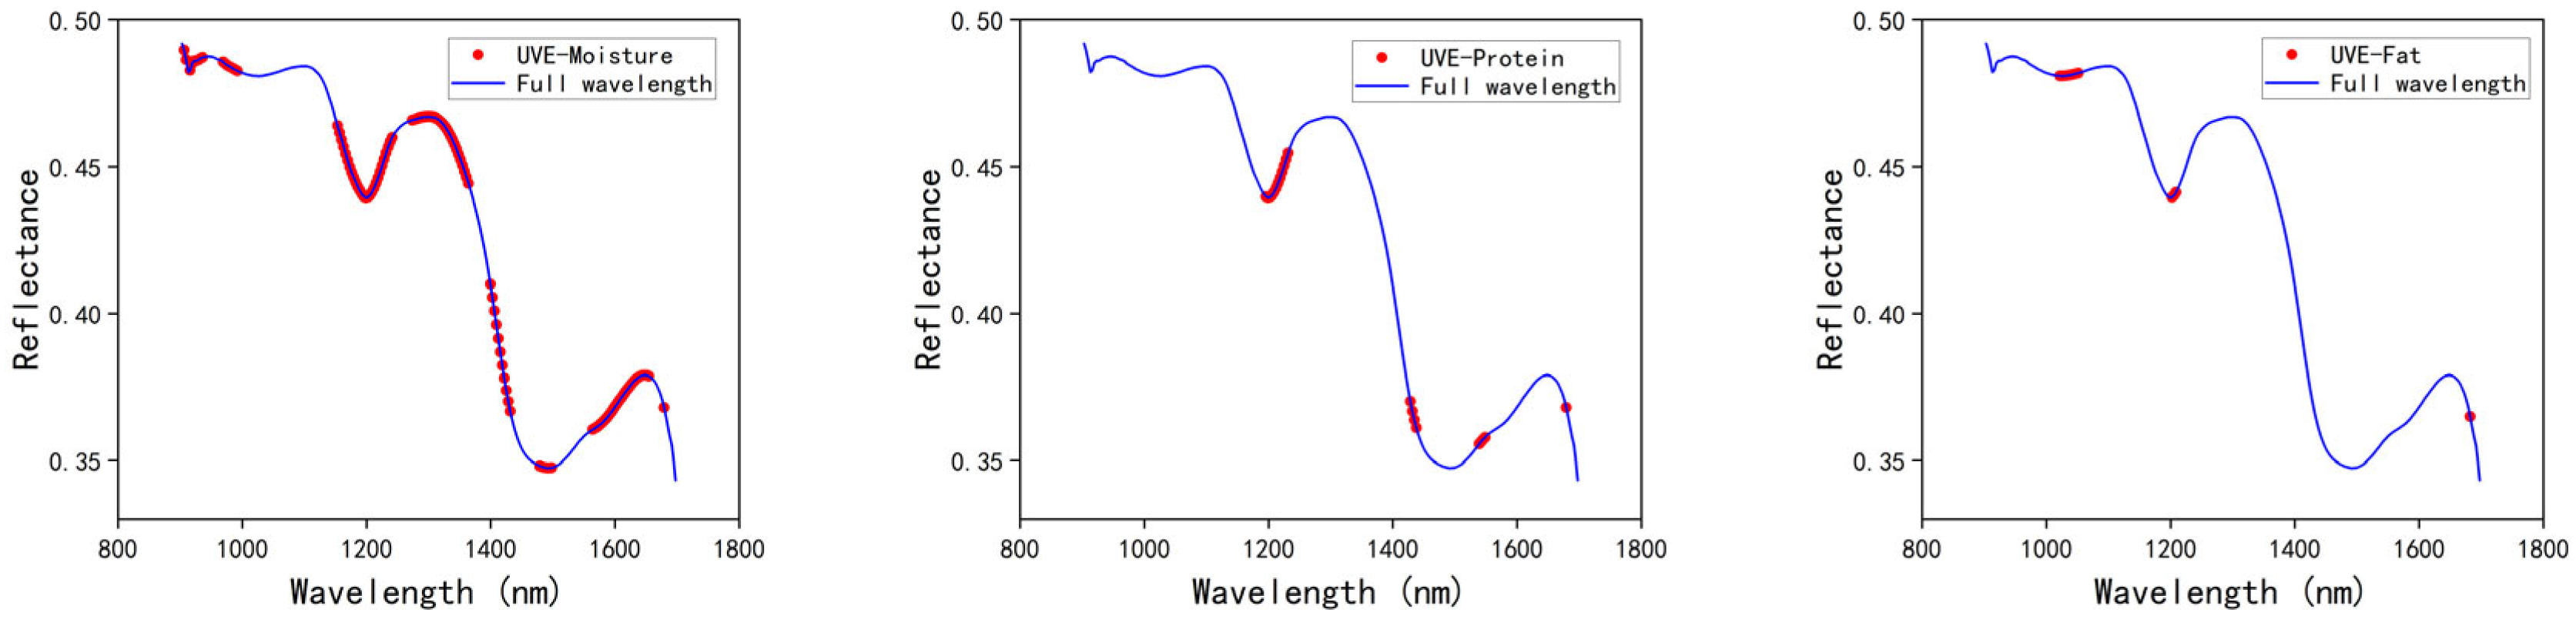
3.3.3. UVE
3.4. Model Evaluation
3.4.1. Estimation of Moisture Content
3.4.2. Estimation of Protein Content
3.4.3. Estimation of Fat Content
4. Discussion
5. Conclusions
Author Contributions
Funding
Data Availability Statement
Conflicts of Interest
References
- Anderson, E.J.; Ali, M.L.; Beavis, W.D.; Chen, P.; Clemente, T.E.; Diers, B.W.; Graef, G.L.; Grassini, P.; Hyten, D.L.; McHale, L.K.; et al. Soybean [Glycine max (L.) Merr.] breeding: History, improvement, production and future opportunities. Adv. Plant Breed. Strateg. Legumes 2019, 7, 431–516. [Google Scholar]
- Peiris, K.H.S.; Bean, S.R.; Wu, X.; Sexton-Bowser, S.A.; Tesso, T. Performance of a Handheld MicroNIR Instrument for Determining Protein Levels in Sorghum Grain Samples. Foods 2023, 12, 3101. [Google Scholar] [CrossRef] [PubMed]
- Raffo, M.A.; Sarup, P.; Jensen, J.; Guo, X.; Jensen, J.D.; Orabi, J.; Jahoor, A.; Christensen, O.F. Genomic prediction for yield and malting traits in barley using metabolomic and near-infrared spectra. Theor. Appl. Genet. 2025, 138, 24. [Google Scholar] [CrossRef] [PubMed]
- Nirmaan, A.M.C.; Rohitha Prasantha, B.D.; Peiris, B.L. Comparison of microwave drying and oven-drying techniques for moisture determination of three paddy (Oryza sativa L.) varieties. Chem. Biol. Technol. Agric. 2020, 7, 1. [Google Scholar] [CrossRef]
- Ramluckan, K.; Moodley, K.G.; Bux, F. An evaluation of the efficacy of using selected solvents for the extraction of lipids from algal biomass by the soxhlet extraction method. Fuel 2014, 116, 103–108. [Google Scholar] [CrossRef]
- Moore, J.C.; DeVries, J.W.; Lipp, M.; Griffiths, J.C.; Abernethy, D.R. Total Protein Methods and Their Potential Utility to Reduce the Risk of Food Protein Adulteration. Compr. Rev. Food Sci. Food Saf. 2010, 9, 330–357. [Google Scholar] [CrossRef]
- Li, C.; Zhao, C.; Ren, Y.; He, X.; Yu, X.; Song, Q. Microwave traveling-standing wave method for density-independent detection of grain moisture content. Measurement 2022, 198, 111373. [Google Scholar] [CrossRef]
- Liu, J.; Munnaf, M.A.; Mouazen, A.M. Micro-Near-Infrared (Micro-NIR) sensor for predicting organic carbon and clay contents in agricultural soil. Soil Tillage Res. 2024, 242, 106155. [Google Scholar] [CrossRef]
- Abasi, S.; Minaei, S.; Jamshidi, B.; Fathi, D.; Khoshtaghaza, M.H. Rapid measurement of apple quality parameters using wavelet de-noising transform with Vis/NIR analysis. Sci. Hortic. 2019, 252, 7–13. [Google Scholar] [CrossRef]
- Ni, H.; Fu, W.; Wei, J.; Zhang, Y.; Chen, D.; Tong, J.; Chen, Y.; Liu, X.; Luo, Y.; Xu, T. Non-destructive detection of polysaccharides and moisture in Ganoderma lucidum using near-infrared spectroscopy and machine learning algorithm. LWT 2023, 184, 115001. [Google Scholar] [CrossRef]
- Yao, K.; Sun, J.; Cheng, J.; Xu, M.; Chen, C.; Zhou, X. Monitoring S-ovalbumin content in eggs during storage using portable NIR spectrometer and multivariate analysis. Infrared Phys. Technol. 2023, 131, 104685. [Google Scholar] [CrossRef]
- Wang, Y.; Xu, Y.; Wang, X.; Wang, H.; Liu, S.; Chen, S.; Li, M. Optimizing the effects of potato size and shape on near-infrared prediction models of potato quality using a linear-nonlinear algorithm. J. Food Compos. Anal. 2024, 135, 106679. [Google Scholar] [CrossRef]
- Teixido-Orries, I.; Molino, F.; Gatius, F.; Sanchis, V.; Marín, S. Near-infrared hyperspectral imaging as a novel approach for T-2 and HT-2 toxins estimation in oat samples. Food Control. 2023, 153, 109952. [Google Scholar] [CrossRef]
- Luo, Y.; Jin, Q.; Lu, H.; Li, P.; Qiu, G.; Qi, H.; Li, B.; Zhou, X. Advancing Loquat Total Soluble Solids Content Determination by Near-Infrared Spectroscopy and Explainable AI. Agriculture 2025, 15, 281. [Google Scholar] [CrossRef]
- Yu, M.; Bai, X.; Bao, J.; Wang, Z.; Tang, Z.; Zheng, Q.; Zhi, J. The Prediction Model of Total Nitrogen Content in Leaves of Korla Fragrant Pear Was Established Based on Near Infrared Spectroscopy. Agronomy 2024, 14, 1284. [Google Scholar] [CrossRef]
- Saugo, M.; Franzoi, M.; Niero, G.; De Marchi, M. Mineral equilibrium in commercial curd and predictive ability of near-infrared spec-troscopy. J. Dairy Sci. 2021, 104, 3947–3955. [Google Scholar] [CrossRef]
- Mendes, W.S.; Sommer, M. Advancing soil organic carbon and total nitrogen modelling in peatlands: The impact of envi-ronmental variable resolution and vis-NIR spectroscopy integration. Agronomy 2023, 13, 1800. [Google Scholar] [CrossRef]
- Cao, L.; Sun, M.; Yang, Z.; Jiang, D.; Yin, D.; Duan, Y. A Novel Transformer-CNN Approach for Predicting Soil Properties from LUCAS Vis-NIR Spectral Data. Agronomy 2024, 14, 1998. [Google Scholar] [CrossRef]
- Zhang, J.; Guo, Z.; Ren, Z.; Wang, S.; Yin, X.; Zhang, D.; Wang, C.; Zheng, H.; Du, J.; Ma, C. A non-destructive determination of protein content in potato flour noodles using near-infrared hyperspectral imaging technology. Infrared Phys. Technol. 2023, 130, 104595. [Google Scholar] [CrossRef]
- Chadalavada, K.; Anbazhagan, K.; Ndour, A.; Choudhary, S.; Palmer, W.; Flynn, J.R.; Mallayee, S.; Pothu, S.; Prasad, K.V.S.V.; Varijakshapanikar, P.; et al. NIR Instruments and Prediction Methods for Rapid Access to Grain Protein Content in Multiple Cereals. Sensors 2022, 22, 3710. [Google Scholar] [CrossRef]
- Mihaljev, Ž.A.; Jakšić, S.M.; Prica, N.B.; Ćupić, Ž.N.; Živkov-Baloš, M.M. Comparison of the Kjeldahl method, Dumas method and NIR method for total nitrogen determination in meat and meat products. Gas 2015, 2, 1. [Google Scholar]
- Difford, G.F.; Horn, S.S.; Dankel, K.R.; Ruyter, B.; Dagnachew, B.S.; Hillestad, B.; Sonesson, A.K.; Afseth, N.K. The heritable landscape of near-infrared and Raman spectroscopic measurements to improve lipid content in Atlantic salmon fillets. Genet. Sel. Evol. 2021, 53, 12. [Google Scholar] [CrossRef] [PubMed]
- Ferreira, D.; Galão, O.; Pallone, J.; Poppi, R. Comparison and application of near-infrared (NIR) and mid-infrared (MIR) spectroscopy for determination of quality parameters in soybean samples. Food Control. 2014, 35, 227–232. [Google Scholar] [CrossRef]
- Pasquini, C. Near infrared spectroscopy: A mature analytical technique with new perspectives—A review. Anal. Chim. Acta 2018, 1026, 8–36. [Google Scholar] [CrossRef]
- Bi, Y.; Yuan, K.; Xiao, W.; Wu, J.; Shi, C.; Xia, J.; Chu, G.; Zhang, G.; Zhou, G. A local pre-processing method for near-infrared spectra, combined with spectral segmentation and standard normal variate transformation. Anal. Chim. Acta 2016, 909, 30–40. [Google Scholar] [CrossRef]
- Xiaobo, Z.; Jiewen, Z.; Povey, M.J.; Holmes, M.; Hanpin, M. Variables selection methods in near-infrared spectroscopy. Anal. Chim. Acta 2010, 667, 14–32. [Google Scholar] [CrossRef]
- Li, J.; Wang, Q.; Xu, L.; Tian, X.; Xia, Y.; Fan, S. Comparison and Optimization of Models for Determination of Sugar Content in Pear by Portable Vis-NIR Spectroscopy Coupled with Wavelength Selection Algorithm. Food Anal. Methods 2019, 12, 12–22. [Google Scholar] [CrossRef]
- Zheng, K.; Li, Q.; Wang, J.; Geng, J.; Cao, P.; Sui, T.; Wang, X.; Du, Y. Stability competitive adaptive reweighted sampling (SCARS) and its applications to multivariate calibration of NIR spectra. Chemom. Intell. Lab. Syst. 2012, 112, 48–54. [Google Scholar] [CrossRef]
- Ouyang, A.; Liu, J. Classification and determination of alcohol in gasoline using NIR spectroscopy and the successive projections algorithm for variable selection. Meas. Sci. Technol. 2013, 24, 025502. [Google Scholar] [CrossRef]
- Abdi, H.; Williams, L.J. Partial least squares methods: Partial least squares correlation and partial least square regression. Methods Mol. Biol. 2012, 930, 549–579. [Google Scholar]
- Prajwala, T.R. A comparative study on decision tree and random forest using R tool. Int. J. Adv. Res. Comput. Commun. Eng. 2015, 4, 196–199. [Google Scholar]
- Khanna, R.; Awad, M. Support vector regression. In Efficient Learning Machines: Theories, Concepts, and Applications for Engineers and System Designers; Apress: Berkeley, CA, USA, 2015; pp. 67–80. [Google Scholar] [CrossRef]
- Zhao, Z.; Luo, S.; Zhao, X.; Zhang, J.; Li, S.; Luo, Y.; Dai, J. A Novel Interpolation Method for Soil Parameters Combining RBF Neural Network and IDW in the Pearl River Delta. Agronomy 2024, 14, 2469. [Google Scholar] [CrossRef]


| Parameter | Calibration Set | Validation Set | ||||||||
|---|---|---|---|---|---|---|---|---|---|---|
| Mean | SD | Min | Max | Range | Mean | SD | Min | Max | Range | |
| Moisture | 15.506 | 5.2176 | 6.59 | 25 | 18.41 | 16.003 | 5.1745 | 6.59 | 25 | 18.41 |
| Protein | 39.159 | 3.2829 | 31.5 | 45.4 | 13.9 | 39.455 | 2.6735 | 31.5 | 45.4 | 13.9 |
| Fat | 21.65 | 1.659 | 14.5 | 23.8 | 9.29 | 21.524 | 1.8715 | 14.5 | 23.8 | 9.29 |
| Feature Selection | Pre-Processing | Model | Calibration Set | Prediction Set | |||
|---|---|---|---|---|---|---|---|
| Rc | RMSEC (%) | Rp | RMSEP (%) | RPD | |||
| SPA | SG + D1 | PLSR | 0.984 | 0.642 | 0.979 | 0.772 | 6.9 |
| SVR | 0.981 | 0.711 | 0.985 | 0.655 | 8.1 | ||
| RF | 0.999 | 0.187 | 0.995 | 0.386 | 13.7 | ||
| SG + D2 | PLSR | 0.976 | 0.802 | 0.975 | 0.830 | 6.4 | |
| SVR | 0.975 | 0.819 | 0.977 | 0.809 | 6.6 | ||
| RF | 0.997 | 0.282 | 0.982 | 0.716 | 7.4 | ||
| MSC + D1 | PLSR | 0.985 | 0.632 | 0.980 | 0.751 | 7.1 | |
| SVR | 0.975 | 0.811 | 0.970 | 0.912 | 5.8 | ||
| RF | 0.998 | 0.241 | 0.991 | 0.495 | 10.7 | ||
| MSC + D2 | PLSR | 0.976 | 0.793 | 0.977 | 0.805 | 6.6 | |
| SVR | 0.982 | 0.688 | 0.982 | 0.712 | 7.4 | ||
| RF | 0.998 | 0.219 | 0.985 | 0.642 | 8.3 | ||
| SNV + D1 | PLSR | 0.985 | 0.636 | 0.980 | 0.750 | 7.1 | |
| SVR | 0.971 | 0.881 | 0.960 | 1.057 | 5.0 | ||
| RF | 0.999 | 0.181 | 0.995 | 0.360 | 14.7 | ||
| SNV + D2 | PLSR | 0.974 | 0.825 | 0.976 | 0.821 | 6.5 | |
| SVR | 0.981 | 0.708 | 0.980 | 0.748 | 7.1 | ||
| RF | 0.998 | 0.226 | 0.986 | 0.631 | 8.4 | ||
| CARS | SG + D1 | PLSR | 0.984 | 0.649 | 0.977 | 0.808 | 6.6 |
| SVR | 0.985 | 0.630 | 0.988 | 0.589 | 9.0 | ||
| RF | 0.998 | 0.202 | 0.992 | 0.483 | 11.0 | ||
| SG + D2 | PLSR | 0.984 | 0.659 | 0.974 | 0.856 | 6.2 | |
| SVR | 0.980 | 0.725 | 0.975 | 0.840 | 6.3 | ||
| RF | 0.997 | 0.297 | 0.984 | 0.676 | 7.8 | ||
| MSC + D1 | PLSR | 0.984 | 0.649 | 0.980 | 0.742 | 7.1 | |
| SVR | 0.976 | 0.800 | 0.968 | 0.943 | 5.6 | ||
| RF | 0.998 | 0.208 | 0.990 | 0.521 | 10.2 | ||
| MSC + D2 | PLSR | 0.983 | 0.665 | 0.976 | 0.815 | 6.5 | |
| SVR | 0.981 | 0.709 | 0.979 | 0.766 | 6.9 | ||
| RF | 0.998 | 0.246 | 0.976 | 0.820 | 6.5 | ||
| SNV + D1 | PLSR | 0.985 | 0.633 | 0.979 | 0.767 | 6.9 | |
| SVR | 0.974 | 0.822 | 0.970 | 0.918 | 5.8 | ||
| RF | 0.998 | 0.211 | 0.995 | 0.370 | 14.3 | ||
| SNV + D2 | PLSR | 0.983 | 0.661 | 0.980 | 0.755 | 7.0 | |
| SVR | 0.976 | 0.791 | 0.961 | 1.043 | 5.1 | ||
| RF | 0.997 | 0.268 | 0.977 | 0.800 | 6.6 | ||
| UVE | SG + D1 | PLSR | 0.985 | 0.630 | 0.979 | 0.765 | 6.9 |
| SVR | 0.981 | 0.703 | 0.979 | 0.768 | 6.9 | ||
| RF | 0.999 | 0.189 | 0.994 | 0.425 | 12.5 | ||
| SG + D2 | PLSR | 0.985 | 0.632 | 0.973 | 0.875 | 6.1 | |
| SVR | 0.986 | 0.615 | 0.987 | 0.593 | 8.9 | ||
| RF | 0.998 | 0.208 | 0.994 | 0.423 | 12.5 | ||
| MSC + D1 | PLSR | 0.982 | 0.688 | 0.978 | 0.782 | 6.8 | |
| SVR | 0.982 | 0.692 | 0.981 | 0.726 | 7.3 | ||
| RF | 0.998 | 0.235 | 0.994 | 0.425 | 12.5 | ||
| MSC + D2 | PLSR | 0.964 | 0.977 | 0.957 | 1.105 | 4.8 | |
| SVR | 0.966 | 0.946 | 0.957 | 1.100 | 4.8 | ||
| RF | 0.995 | 0.347 | 0.980 | 0.746 | 7.1 | ||
| SNV + D1 | PLSR | 0.981 | 0.708 | 0.977 | 0.806 | 6.6 | |
| SVR | 0.981 | 0.700 | 0.981 | 0.724 | 7.3 | ||
| RF | 0.998 | 0.220 | 0.994 | 0.425 | 12.5 | ||
| SNV + D2 | PLSR | 0.977 | 0.774 | 0.973 | 0.867 | 6.1 | |
| SVR | 0.980 | 0.731 | 0.984 | 0.672 | 7.9 | ||
| RF | 0.997 | 0.264 | 0.980 | 0.750 | 7.1 | ||
| Feature Selection | Pre-Processing | Model | Calibration Set | Prediction Set | |||
|---|---|---|---|---|---|---|---|
| Rc | RMSEC (%) | Rp | RMSEP (%) | RPD | |||
| SPA | SG + D1 | PLSR | 0.955 | 0.668 | 0.949 | 0.731 | 4.4 |
| SVR | 0.947 | 0.726 | 0.938 | 0.805 | 4.0 | ||
| RF | 0.990 | 0.321 | 0.954 | 0.692 | 4.7 | ||
| SG + D2 | PLSR | 0.942 | 0.757 | 0.929 | 0.861 | 3.7 | |
| SVR | 0.943 | 0.750 | 0.925 | 0.881 | 3.7 | ||
| RF | 0.989 | 0.330 | 0.921 | 0.907 | 3.5 | ||
| MSC + D1 | PLSR | 0.926 | 0.855 | 0.931 | 0.845 | 3.8 | |
| SVR | 0.737 | 1.609 | 0.785 | 1.493 | 2.2 | ||
| RF | 0.994 | 0.252 | 0.957 | 0.671 | 4.8 | ||
| MSC + D2 | PLSR | 0.943 | 0.752 | 0.927 | 0.868 | 3.7 | |
| SVR | 0.927 | 0.849 | 0.908 | 0.977 | 3.3 | ||
| RF | 0.983 | 0.408 | 0.925 | 0.881 | 3.7 | ||
| SNV + D1 | PLSR | 0.940 | 0.772 | 0.945 | 0.753 | 4.3 | |
| SVR | 0.907 | 0.957 | 0.898 | 1.031 | 3.1 | ||
| RF | 0.993 | 0.259 | 0.945 | 0.755 | 4.3 | ||
| SNV + D2 | PLSR | 0.934 | 0.807 | 0.926 | 0.876 | 3.7 | |
| SVR | 0.935 | 0.799 | 0.929 | 0.858 | 3.8 | ||
| RF | 0.980 | 0.447 | 0.873 | 1.149 | 2.8 | ||
| CARS | SG + D1 | PLSR | 0.965 | 0.583 | 0.954 | 0.688 | 4.7 |
| SVR | 0.956 | 0.661 | 0.949 | 0.725 | 4.4 | ||
| RF | 0.988 | 0.345 | 0.913 | 0.951 | 3.4 | ||
| SG + D2 | PLSR | 0.963 | 0.602 | 0.936 | 0.816 | 3.9 | |
| SVR | 0.962 | 0.611 | 0.947 | 0.742 | 4.3 | ||
| RF | 0.989 | 0.334 | 0.925 | 0.881 | 3.7 | ||
| MSC + D1 | PLSR | 0.960 | 0.631 | 0.949 | 0.728 | 4.4 | |
| SVR | 0.954 | 0.672 | 0.952 | 0.707 | 4.6 | ||
| RF | 0.988 | 0.342 | 0.944 | 0.759 | 4.2 | ||
| MSC + D2 | PLSR | 0.958 | 0.645 | 0.937 | 0.810 | 4.0 | |
| SVR | 0.958 | 0.643 | 0.947 | 0.738 | 4.4 | ||
| RF | 0.989 | 0.329 | 0.950 | 0.723 | 4.5 | ||
| SNV + D1 | PLSR | 0.960 | 0.631 | 0.951 | 0.712 | 4.5 | |
| SVR | 0.955 | 0.662 | 0.950 | 0.717 | 4.5 | ||
| RF | 0.994 | 0.250 | 0.971 | 0.547 | 5.9 | ||
| SNV + D2 | PLSR | 0.957 | 0.650 | 0.932 | 0.843 | 3.8 | |
| SVR | 0.962 | 0.610 | 0.951 | 0.716 | 4.5 | ||
| RF | 0.991 | 0.290 | 0.924 | 0.886 | 3.6 | ||
| UVE | SG + D1 | PLSR | 0.966 | 0.582 | 0.950 | 0.722 | 4.5 |
| SVR | 0.947 | 0.721 | 0.944 | 0.765 | 4.2 | ||
| RF | 0.991 | 0.290 | 0.958 | 0.664 | 4.9 | ||
| SG + D2 | PLSR | 0.960 | 0.624 | 0.940 | 0.789 | 4.1 | |
| SVR | 0.942 | 0.757 | 0.937 | 0.810 | 4.0 | ||
| RF | 0.995 | 0.231 | 0.961 | 0.638 | 5.0 | ||
| MSC + D1 | PLSR | 0.956 | 0.656 | 0.949 | 0.724 | 4.5 | |
| SVR | 0.920 | 0.890 | 0.919 | 0.917 | 3.5 | ||
| RF | 0.991 | 0.289 | 0.957 | 0.669 | 4.8 | ||
| MSC + D2 | PLSR | 0.950 | 0.701 | 0.938 | 0.804 | 4.0 | |
| SVR | 0.951 | 0.698 | 0.946 | 0.749 | 4.3 | ||
| RF | 0.992 | 0.288 | 0.959 | 0.655 | 4.9 | ||
| SNV + D1 | PLSR | 0.956 | 0.655 | 0.946 | 0.745 | 4.3 | |
| SVR | 0.941 | 0.762 | 0.929 | 0.856 | 3.8 | ||
| RF | 0.992 | 0.284 | 0.955 | 0.681 | 4.7 | ||
| SNV + D2 | PLSR | 0.948 | 0.716 | 0.929 | 0.860 | 3.7 | |
| SVR | 0.919 | 0.892 | 0.915 | 0.936 | 3.4 | ||
| RF | 0.993 | 0.263 | 0.962 | 0.627 | 5.1 | ||
| Feature Selection | Pre-Processing | Model | Calibration Set | Prediction Set | |||
|---|---|---|---|---|---|---|---|
| Rc | RMSEC (%) | Rp | RMSEP (%) | RPD | |||
| SPA | SG + D1 | PLSR | 0.982 | 0.694 | 0.977 | 0.801 | 6.6 |
| SVR | 0.979 | 0.752 | 0.972 | 0.880 | 6.0 | ||
| RF | 0.998 | 0.199 | 0.992 | 0.475 | 11.2 | ||
| SG + D2 | PLSR | 0.961 | 1.008 | 0.958 | 1.089 | 4.9 | |
| SVR | 0.978 | 0.767 | 0.981 | 0.728 | 7.3 | ||
| RF | 0.998 | 0.215 | 0.993 | 0.446 | 11.9 | ||
| MSC + D1 | PLSR | 0.981 | 0.716 | 0.975 | 0.831 | 6.4 | |
| SVR | 0.979 | 0.738 | 0.972 | 0.885 | 6.0 | ||
| RF | 0.999 | 0.173 | 0.989 | 0.544 | 9.7 | ||
| MSC + D2 | PLSR | 0.975 | 0.817 | 0.969 | 0.941 | 5.6 | |
| SVR | 0.975 | 0.819 | 0.979 | 0.767 | 6.9 | ||
| RF | 0.998 | 0.238 | 0.991 | 0.507 | 10.5 | ||
| SNV + D1 | PLSR | 0.983 | 0.673 | 0.977 | 0.801 | 6.6 | |
| SVR | 0.979 | 0.745 | 0.973 | 0.870 | 6.1 | ||
| RF | 0.999 | 0.147 | 0.987 | 0.594 | 8.9 | ||
| SNV + D2 | PLSR | 0.969 | 0.900 | 0.969 | 0.934 | 5.7 | |
| SVR | 0.970 | 0.887 | 0.972 | 0.883 | 6.0 | ||
| RF | 0.998 | 0.254 | 0.970 | 0.921 | 5.8 | ||
| CARS | SG + D1 | PLSR | 0.985 | 0.622 | 0.978 | 0.786 | 6.7 |
| SVR | 0.976 | 0.788 | 0.966 | 0.983 | 5.4 | ||
| RF | 0.998 | 0.216 | 0.992 | 0.482 | 11.0 | ||
| SG + D2 | PLSR | 0.973 | 0.849 | 0.958 | 1.082 | 4.9 | |
| SVR | 0.977 | 0.785 | 0.968 | 0.945 | 5.6 | ||
| RF | 0.998 | 0.248 | 0.993 | 0.444 | 12.0 | ||
| MSC + D1 | PLSR | 0.982 | 0.680 | 0.977 | 0.799 | 6.6 | |
| SVR | 0.976 | 0.798 | 0.970 | 0.922 | 5.8 | ||
| RF | 0.998 | 0.229 | 0.983 | 0.695 | 7.6 | ||
| MSC + D2 | PLSR | 0.982 | 0.680 | 0.975 | 0.845 | 6.3 | |
| SVR | 0.978 | 0.765 | 0.979 | 0.771 | 6.9 | ||
| RF | 0.998 | 0.226 | 0.983 | 0.689 | 7.7 | ||
| SNV + D1 | PLSR | 0.981 | 0.717 | 0.973 | 0.865 | 6.1 | |
| SVR | 0.981 | 0.716 | 0.975 | 0.841 | 6.3 | ||
| RF | 0.998 | 0.230 | 0.985 | 0.639 | 8.3 | ||
| SNV + D2 | PLSR | 0.979 | 0.753 | 0.971 | 0.898 | 5.9 | |
| SVR | 0.978 | 0.768 | 0.978 | 0.784 | 6.8 | ||
| RF | 0.998 | 0.208 | 0.978 | 0.789 | 6.7 | ||
| UVE | SG + D1 | PLSR | 0.557 | 3.419 | 0.611 | 3.305 | 1.6 |
| SVR | 0.610 | 3.207 | 0.688 | 2.959 | 1.8 | ||
| RF | 0.917 | 1.476 | 0.780 | 2.485 | 2.1 | ||
| SG + D2 | PLSR | 0.548 | 3.454 | 0.624 | 3.250 | 1.6 | |
| SVR | 0.589 | 3.293 | 0.732 | 2.744 | 1.9 | ||
| RF | 0.811 | 2.232 | 0.724 | 2.786 | 1.9 | ||
| MSC + D1 | PLSR | 0.881 | 1.770 | 0.877 | 1.859 | 2.9 | |
| SVR | 0.912 | 1.521 | 0.880 | 1.834 | 2.9 | ||
| RF | 0.991 | 0.495 | 0.930 | 1.401 | 3.8 | ||
| MSC + D2 | PLSR | 0.724 | 2.700 | 0.694 | 2.930 | 1.8 | |
| SVR | 0.822 | 2.169 | 0.778 | 2.497 | 2.1 | ||
| RF | 0.978 | 0.759 | 0.859 | 1.991 | 2.7 | ||
| SNV + D1 | PLSR | 0.883 | 1.758 | 0.879 | 1.846 | 2.9 | |
| SVR | 0.914 | 1.507 | 0.883 | 1.815 | 2.9 | ||
| RF | 0.984 | 0.644 | 0.929 | 1.417 | 3.7 | ||
| SNV + D2 | PLSR | 0.584 | 3.314 | 0.510 | 3.709 | 1.4 | |
| SVR | 0.622 | 3.160 | 0.497 | 3.759 | 1.4 | ||
| RF | 0.958 | 1.059 | 0.589 | 3.398 | 1.6 | ||
| Element | Feature Selection | Model | RPD |
|---|---|---|---|
| Moisture | SPA | SNV + D1 + RF | 14.7 |
| CARS | SNV + D1 + RF | 14.3 | |
| UVE | SG + D2 + RF | 12.5 | |
| Protein | SPA | MSC + D1 + RF | 4.8 |
| CARS | SNV + D1 + RF | 5.9 | |
| UVE | SNV + D2 + RF | 5.1 | |
| Fat | SPA | SG + D2 + RF | 11.9 |
| CARS | SG + D2 + RF | 12.0 | |
| UVE | MSC + D1 + RF | 3.8 |
Disclaimer/Publisher’s Note: The statements, opinions and data contained in all publications are solely those of the individual author(s) and contributor(s) and not of MDPI and/or the editor(s). MDPI and/or the editor(s) disclaim responsibility for any injury to people or property resulting from any ideas, methods, instructions or products referred to in the content. |
© 2025 by the authors. Licensee MDPI, Basel, Switzerland. This article is an open access article distributed under the terms and conditions of the Creative Commons Attribution (CC BY) license (https://creativecommons.org/licenses/by/4.0/).
Share and Cite
Li, C.; Yu, J.; Wang, S.; Zhao, Q.; Song, Q.; Xu, Y. Rapid and Accurate Measurement of Major Soybean Components Using Near-Infrared Spectroscopy. Agronomy 2025, 15, 1505. https://doi.org/10.3390/agronomy15071505
Li C, Yu J, Wang S, Zhao Q, Song Q, Xu Y. Rapid and Accurate Measurement of Major Soybean Components Using Near-Infrared Spectroscopy. Agronomy. 2025; 15(7):1505. https://doi.org/10.3390/agronomy15071505
Chicago/Turabian StyleLi, Chenxiao, Jiatong Yu, Sheng Wang, Qinglong Zhao, Qian Song, and Yanlei Xu. 2025. "Rapid and Accurate Measurement of Major Soybean Components Using Near-Infrared Spectroscopy" Agronomy 15, no. 7: 1505. https://doi.org/10.3390/agronomy15071505
APA StyleLi, C., Yu, J., Wang, S., Zhao, Q., Song, Q., & Xu, Y. (2025). Rapid and Accurate Measurement of Major Soybean Components Using Near-Infrared Spectroscopy. Agronomy, 15(7), 1505. https://doi.org/10.3390/agronomy15071505