Review

Recent Advances and Applications of Imaging and Spectroscopy Technologies for Tea Quality Assessment: A Review

1
College of Artificial Intelligence, Nanjing Agricultural University, Nanjing 210031, China
2
Shandong Academy of Agricultural Sciences, Jinan 250131, China
3
Tea Research Institute, The Chinese Academy of Agricultural Sciences, Hangzhou 310008, China
4
School of Computer Science, Nanjing University, Nanjing 210031, China
5
College of Engineering, Nanjing Agricultural University, Nanjing 210031, China
*
Authors to whom correspondence should be addressed.
These authors contributed equally to this work.
Agronomy 2025, 15(7), 1507; https://doi.org/10.3390/agronomy15071507
Submission received: 8 May 2025 / Revised: 13 June 2025 / Accepted: 18 June 2025 / Published: 21 June 2025
(This article belongs to the Section Precision and Digital Agriculture)

Abstract

Significant research has been carried out on the applications of imaging and spectroscopy technologies for a variety of foods and agricultural products, and the technical fundamentals and their feasibilities have also been widely demonstrated in the past decade. Imaging technologies, including computer vision, Raman, X-ray, magnetic resonance (MR), fluorescence imaging, spectroscopy technology, as well as spectral imaging technologies, including hyperspectral or multi-spectral imaging, have found their applications in non-destructive tea quality assessment. Tea quality can be assessed by considering their external qualities (color, texture, shape, and defect), internal qualities (contents of polyphenols, amino acids, caffeine, theaflavin, etc.), and safety. In recent years, numerous studies have been published to advance non-destructive methods for assessing tea quality using imaging and spectroscopy technologies. This review aims to give a thorough overview of imaging and spectroscopy technologies, data processing and analyzing methods, as well as their applications in tea quality non-destructive assessment. The challenges and directions of tea quality inspection by using imaging and spectroscopy technologies for future research and development will also be reported and formulated in this review.

1. Introduction

After water, tea is one of the most widely consumed non-alcoholic beverages globally with a rapidly growing market. It is made exclusively by soaking cured leaves of the Camellia sinensis in hot or boiling water [1]. Owing to its fragrant aroma, sweet and fresh taste, lipid-lowering, radiation-proof, antioxidant, anti-inflammatory, anticancer, central nervous system-stimulating properties, and other health benefits [2,3,4], tea plays an indispensable role in both domestic and international agricultural industries. Along with the growth of customers’ living standards, the increased awareness of health, and the rising of tea culture, the pursuit of teas with higher quality and better flavor has become a new trend. The inherent flavor of dried tea leaves depends on the tea bush cultivar, the quality of the fresh leaves plucked, and the techniques used in their production processing [5,6]. Tea processing is essentially a process of fresh tea leaves which are harvested from the tea plant Camellia sinensis, and then processed into dried leaves by means of fixing, shaping, drying, and other procedures [7]. There are various types of tea products due to different processes applied to freshly plucked tea leaves. According to the processing methods of tea (described in Figure 1), teas are categorized into six primary types: green tea, black tea, oolong tea, white tea, yellow tea, and post-fermented tea.
The quality index of tea is various, including not only the variation in external attributes (color, texture, and shape) but also the change in internal chemical properties (contents of amino acids content (AAC), caffeine content (CC), moisture content (MC), total polyphenols (TP), etc.). HPLC separates analytes according to differential partition coefficients between the stationary and mobile phases, subsequently detecting tea quality. This method identifies compounds including caffeine and theanine. UV-Vis analysis irradiates samples with full-spectrum UV-Vis light, measures absorbance at specific wavelengths, and quantifies components via standard curves. It detects tea constituents such as total polyphenols and chlorophyll. Organoleptic approaches like inspection by a human sensory panel, as well as instrumental technologies like high-performance liquid chromatography [8,9], protein electrophoresis, and gas chromatography [10,11,12] are used to evaluate the quality of tea in various tea processing stages. Among them, high-performance liquid chromatography is used to detect non-volatile substances to achieve the purpose of tea quality inspection. Protein electrophoresis is used to evaluate based on protein properties. Gas chromatography achieves the purpose of assessment by analyzing volatile substances. These chemical and physical approaches are generally reliable. However, they have limitations, including being costly, time-consuming, destructive, and occasionally inaccurate. With the growing demand for rapid, reliable, and non-destructive technologies for evaluating the quality of tea, higher-performance technologies must be developed in the modern agricultural industry to surmount the aforementioned disadvantages. One such method is the electronic nose (e-nose), a non-destructive technology used for analyzing tea quality. Essentially, it simulates the human olfactory system and assesses the quality of tea quickly and objectively by analyzing the volatile organic compounds released by it. However, e-nose sensors are sensitive to environmental factors like humidity and temperature, leading to sensor drift [13,14].
In recent decades, people have paid growing attention to the application of imaging and spectroscopy technologies in agriculture for the rapid, non-destructive assessment of foods and agricultural products. Extensive research has been conducted on technical fundamentals, and their feasibility has also been widely demonstrated in the past decade. Imaging technologies such as computer vision, Raman, X-ray, Magnetic Resonance (MR), and fluorescence imaging, as well as spectroscopy technologies such as infrared spectroscopy, Raman, ultraviolet and visible (UV-Vis), fluorescence, MR spectroscopy, hyperspectral, or multi-spectral imaging are the main imaging and spectroscopy technologies.
In recent years, different kinds of literature have been reported to promote the development of non-destructive tea quality assessment by applying imaging and spectroscopy technologies. The potential of applying imaging and spectroscopy technology for non-destructive and objective tea quality evaluation has been proven in the industry. Each of the wide range of different imaging and spectroscopy techniques has its own individual characteristics. This review is aimed at offering a comprehensive overview of imaging and spectroscopy technologies on the external and internal assessment of tea with emphasis on the applications of those non-destructive determination techniques. The challenges and directions of tea quality inspection by using imaging and spectroscopy technologies for future research and development will also be reported and formulated in this review.

2. Overview of Non-Destructive Technologies

In recent decades, non-destructive technologies have been developed as scientific tools for tea quality assessment, driven by advancements in information science, image processing, and pattern recognition. Non-destructive technologies, such as imaging technology, spectroscopy technology, as well as spectral imaging technology, are extremely advantageous for the quality assessment and online inspection of tea leaves. Various imaging and spectroscopy technologies have their respective characteristics. In this section, a comprehensive overview of varying imaging and spectroscopy technologies is presented.

2.1. Imaging Technologies

2.1.1. Computer Vision

Computer vision systems, known for their speed, objectivity, automation, and cost-efficiency, are increasingly utilized for food quality evaluation [15,16,17,18,19]. It is an engineering technology that establishes the theoretical and algorithmic foundation for automatically extracting and analyzing useful information about an object or scene from an observed image, set of images, or image sequence [20]. This technology is an interdisciplinary subject that combines artificial intelligence, computer science, image processing, pattern recognition, digital video and image processing technology together [21]. Although the origin of the computer vision is traced back to the 1960s, it is still a relatively novel technology for food assessment and has made great progress with its applications expanding in diverse fields. In general, a typical computer vision system includes five main components: illumination, an image capture board, a camera, computer hardware, and computer software.
During the food assessment process, the quality and intensity of illumination play a crucial role in influencing the performance and reliability of the computer vision system. Elango and Karunamoorthy [22] studied the impact of different lighting conditions on the optical surface finish parameter by employing the analysis of variance and the signal to noise ratio of robust design. They concluded that illumination is a major factor that influences the image pattern. Therefore, a well-designed illumination system and the use of an appropriate light source are essential for minimizing noise in the image. These two factors lead to the production of high-quality images and help reduce the complexity and processing time required for subsequent image analysis. The selection of a light source significantly influences the quality of the image and the overall accuracy of image analysis. Various types of light sources are commonly used, including incandescent lamps, fluorescent lamps, mercury lamps, sodium lamps, X-ray tubes, ultraviolet, lasers, and infrared lamps [23].
The camera is a two-dimensional detector used for capturing the spatial information of food. Typically, charged coupled device (CCD) and complementary metal oxide semiconductor (CMOS) cameras have become widely used for the acquisition of digital images in recent years [23,24,25]. The CCD camera is a miniature image sensor that uses electric charges to carry signals. The working principle of the CDD camera relies on light absorption of silicon and photoelectron collection, while the CMOS camera uses light-sensitive diodes to perform photoelectric conversion, which in turn captures images [26]. Compared with the CCD camera adopting the vertical and horizontal register, the CMOS camera has its own competitive edge because of the characteristics of lower voltage operation, lower cost, lower consumption, and high transmission speed [27]. By uploading pictures from digital cameras which are connected directly to the computer, users are able to collect images of the object.
In the past decades, imaging technologies have been widely applied for the visual assessment of tea and other food qualities, enabling the rapid detection of processing line defects through shape, color, and texture analysis. For volatile compound variations, electronic noses typically monitor alterations in their characteristic profiles. Owing to exceptional accuracy, rapid processing, extensive data capacity, and broad functionality, computer vision now serves as the primary tool for tea quality assessment.

2.1.2. X-Ray Imaging

In 1895, X-ray radiation was discovered by Wilhelm Conrad Roentgen by bombarding electrons on a metallic anode [28]. Since that time, it has usually been observed that many various materials may react to the presence of X-rays, finally leading to many various types of detectors. X-rays have a wavelength ranging from 0.01 to 10 nm, which correspond to frequencies ranging from 30 to 30,000 Petahertz (3 × 10¹⁶ Hz to 3 × 10¹⁹ Hz) and energies ranging from 120 eV to 120 keV [28]. Regarding the energy of X-rays, it can be divided into hard X-rays and soft X-rays. Generally, soft X-rays are mainly used in the detection of agricultural products. Until now, X-ray inspection units are typically classified into three categories: film, line-scan machines, and direct detection semiconductor materials.
The principle of X-ray imaging involves using X-rays to create tomographic images of scanned samples. As X-rays pass through the sample, they are attenuated by the tissues, allowing a thin cross-sectional image of the sample to be obtained [29,30]. By stacking and reconstructing multiple thin cross-sectional images, a three-dimensional visualization of the internal features of the sample can be achieved [31]. Originally, X-ray imaging technology was mainly applied in medicine, namely, the detection of human tissue lesions. With the rapid development of digital technology, computer network, and communication technology, the application field of X-ray imaging expanded. Nowadays, X-ray imaging technology is utilized to detect internal quality defects in agricultural products, which possesses great application potential.

2.1.3. Magnetic Resonance Imaging

Similarly to the imaging methods that were mentioned before, MR imaging (MRI), which was originally called nuclear MRI (NMRI), has also been used as a rapid, non-destructive, and cost-effective method for the detection of foods. MRI is mainly used to capture high-resolution images of the interior of objects in two or three dimensions [32,33]. As an analytical tool, MRI operates based on the absorption and emission of energy within the radio frequency range of the electromagnetic spectrum. Depending on the applied frequency, this leads to specific nuclei generating a rotating magnetic field that can be detected by the MRI scanner. Such information is recorded to construct an image of nuclear density within the scanned region of the object. MRI provides a distinctive capability to produce cross-sectional images of the entire target object, and the formation of MRI images can be regulated by the radiofrequency pulse sequences employed to excite the nuclear spins [34,35,36]. Numerous studies in the literature have shown that MRI can be used as a non-invasive method to assess key quality attributes of food products [37,38,39,40,41]. In certain studies, MRI has been utilized to measure moisture content and its migration within food systems. Some research has highlighted the potential of MRI for investigating the physical and biological properties of food products, while other studies have focused on estimating the yield [42,43,44,45,46]. These studies all indicate that MRI has significant advantages and potential in food quality assessment, especially in tea quality assessment.

2.1.4. Fluorescence Imaging

Fluorescence refers to the emission of light by a substance after it has absorbed light or other forms of electromagnetic radiation. Fluorescence imaging exploits the ability of certain substances that can emit fluorescence after absorbing light or other electromagnetic radiation [47]. Generally, the emitted light features a longer wavelength and lower energy compared to the absorbed radiation. Fluorescence ceases instantly upon removal of the incident light. Two categories of fluorescence exist: autofluorescence and fluorescence assisted by fluorescent pigments. The most remarkable instances of fluorescence happen when the absorbed radiation lies in the ultraviolet part of the spectrum (invisible to the human eye), whereas the emitted light resides in the visible region. According to most literature, fluorescence imaging is capable of determining several properties (nutritional, composition, functional) without the application of chemical reagents [48,49]. However, fluorescence imaging has some limitations in assessing tea quality and safety, as not all materials can be excited to emit fluoresce. To overcome these limitations, fluorescence imaging is often combined with other non-invasive technologies, such as HSI or MSI, which have been more widely used to predict quality traits in tea. The combination of fluorescence imaging and HSI/MSI can simultaneously achieve functional activity labeling and chemical composition scanning to achieve the synchronous assessment of various tea characteristics.

2.1.5. Raman Imaging

Raman imaging is an innovative technology that merges the benefits of Raman spectroscopy and digital imaging to analyze the structure and composition of food products [50,51,52,53,54]. In 1929, Raman and Krishnan first proposed Raman scattering as an inelastically scattered light phenomenon. When a laser beam interacts with a sample, a small fraction of photons with specific polarization and frequency are scattered [55,56,57]. The scattered radiation consists of both inelastic and elastic scattering. Inelastic scattering is also referred to as Raman scattering, and it accounts for a small portion of the total scattered light. The principle of Raman imaging is to integrate Raman spectroscopy with imaging, permitting the simultaneous acquisition of both morphological and compositional data of the target samples. In addition, Raman imaging allows the simultaneous acquisition of both spectral and spatial information. This technology provides a powerful method for visualizing attributes like the distribution of chemical components and external properties that cannot be detected by the naked eye. It also provides clear spectral signals to distinguish not only chemical structures but also crystal forms. Raman imaging can be used to perform measurements at both the micro and macro levels, making it particularly valuable in agricultural applications. Hyperspectral imaging is typically constrained to macro-scale evaluations and Raman imaging overcomes this limitation [58,59]. Compared with traditional technologies, the superiority of Raman imaging is obvious. It is non-destructive, meaning it does not damage the sample, and only requires a minimal sample size for analysis [60,61]. Raman imaging can be used to assess the oxidation degree of catechins in tea and other aspects. In addition, it can also detect imidacloprid, a nicotinoid insecticide, on the surface of tea leaves.

2.2. Spectroscopy Technology

While imaging technology can accurately predict the external attributes of food, it falls short in providing detailed spectral information or insights into internal attributes (e.g., polyphenols, moisture, amino acids, caffeine). However, this information is vital to food evaluation. Spectroscopy technology has been another increasingly growing technology on account of its simplicity, rapidity, and its capacity to measure chemical properties or characteristics of food [62,63,64]. Initially, spectroscopy focused on investigating the interaction between electromagnetic radiation and matter as a function of wavelength, and it later expanded to encompass the measurement of any property dependent on wavelength or frequency [65]. Spectroscopy technologies such as infrared, Raman, ultraviolet and visible (UV-Vis), fluorescence, and magnetic resonance (MR) spectroscopy have been widely and successfully used as fast and sensitive analytical technologies for the quality analysis of a variety of teas. Most of these technologies enable the analysis of relatively small sample extracts in a non-destructive, straightforward, and direct manner, while allowing the simultaneous determination of multiple sample properties [66,67,68,69]. Depending on the processes under investigation and the magnitudes of the energy changes involved, different spectroscopic technologies operate over different, limited wavelength ranges within the electromagnetic spectrum. Spectroscopy technology is widely used to evaluate and estimate food properties like polyphenols, moisture, and other components. However, although spectroscopy technology offers accurate predictions of food composition, it lacks the ability to map the spatial distribution of these quality parameters [70].
UV-Vis spectroscopy involves the interaction between samples and radiation within the 200–780 nm wavelength range. The absorption regions measured by UV-Vis spectroscopy correspond to electron transitions between orbitals, entailing higher energies than those in infrared spectroscopy. Infrared spectroscopy is the electromagnetic spectrum from 780 nm to 10 6 nm, and it is divided into three spectroscopies according to the scope of the spectrum, namely near-infrared spectroscopy (NIR) (780–2500 nm), middle-infrared spectroscopy (MIR) (2500–25,000 nm), and far-infrared spectroscopy (25,000– 10 6 nm). The theory of infrared technology is to obtain the construction or content of various components in the sample by analyzing the spectral information within the wavelength range. With superiorities such as high efficiency, low cost, minimal sample preparation, simplicity, non-invasive measurement [71], it has been an advanced technology for the quality assessment of food products [72]. The NIR spectrum is commonly used for analysis because it can detect the signals from almost all major structures and functional groups of organic compounds, providing a stable and reliable spectrogram [73]. To evaluate food quality, wavebands commonly used in multi-spectral and hyperspectral imaging technologies are within the NIR region. The close correlation between NIR and food components renders NIR more appealing than other spectroscopic techniques. When incident radiation hits a sample, it may undergo reflection, transmission, or absorption. A spectrum is subsequently acquired in reflectance, transmittance, or absorbance modes, with each mode offering insights into the sample’s physical and chemical properties. Upon obtaining the spectrum, chemometric methods are employed to extract relevant information about the sample’s quality attributes or to eliminate interference from factors unrelated to sample concentration. Fluorescence spectroscopy is a specific type of spectroscopic method in which the fluorescence emitted by the sample is measured after being excited by light, typically in the ultraviolet spectrum [74]. It is a very selective and sensitive method since even a small amount of compounds can exhibit fluorescence. As a whole, UV-Vis spectroscopy is less sensitive and has more spectral overlap than fluorescence spectroscopy, but many organic compounds can absorb UV light. Fluorescence spectroscopy can serve as either an alternative or a complement to UV-Vis and NIR. It involves measuring the photoluminescence of molecules that emit light after absorbing ultraviolet, visible, or infrared radiation [75].

2.3. Spectral Imaging Technologies

A computer vision or other imaging system excels at providing detailed spatial information for the recognition, detection, and classification of agri-food products by predicting external attributes like size, shape, color, and texture. However, they cannot detect internal attributes related to chemical composition, such as moisture, amino acids, or caffeine, by themselves. Spectrometry technologies complement computer vision by enabling the successful extraction of these internal attributes. Spectroscopy technology is a common analytical approach for quantitatively assessing the chemical components of food. However, spectroscopy technologies possess certain deficiencies since they are not able to obtain any spatial information about objects. Owing to the limitations of conventional imaging technology and spectroscopy technologies, spectral imaging technology was developed to solve these problems. Spectral imaging technology is a combination of imaging technology and spectroscopy technology which can simultaneously extract spatial information and spectral information of targets, finally forming the so-called data cube. The data cube is typically three-dimensional (3-D), consisting of two spatial dimensions and one spectral dimension [76,77,78]. This technology is a comprehensive information acquisition technology that integrates optics, electronics, spectroscopy, computers, and other technologies. By analyzing the data cube, it has crucial application value in many fields because it can reflect the image features, as well as the physical and chemical attributes of the targets. Recent advancements in camera technology and computer hardware processing power have made spectral imaging technology an important tool for ensuring the safety and quality of agricultural products. Spectral imaging can be categorized into two main technologies based on the continuity of data in the wavelength domain: hyperspectral imaging (HSI) and multi-spectral imaging (MSI).
HSI technology, also referred to as chemical or spectroscopic imaging technology, is an emerging technology that combines traditional imaging with spectroscopy. It enables the simultaneous collection of both spatial and spectral data from an object [79]. The term “hyperspectral imaging” originated from remote sensing research, first mentioned by Goetz et al. [80] in 1985. Its goal was to directly identify surface materials through images. Hyperspectral imaging systems were originally developed for remote sensing applications, and since then they have demonstrated significant advantages over traditional computer vision systems [76] in diverse fields such as agriculture [81,82,83,84,85,86]. With advancements in optical sensing and imaging technologies, hyperspectral imaging has recently become an effective tool for the scientific inspection and quality assessment of tea leaves. The main objective of hyperspectral imaging is to acquire the spectrum for every pixel within a scene’s image. This necessitates in-depth analysis to recognize objects, detect materials, and monitor different processes [47,87,88]. To obtain high spectral resolution and narrowband image data, hyperspectral imaging is commonly combined with spectroscopic techniques, along with the detection of two-dimensional geometric space and one-dimensional spectral information. A typical hyperspectral imaging system consists of several essential components: a light source (illumination), a wavelength dispersion device (spectrograph), an area detector (camera), a transportation stage, and a computer equipped with specialized software, as illustrated in Figure 2a. Generally, HSI typically requires considerable time for image acquisition in controlled laboratory settings and involves complex offline analysis procedures. Three common methods for acquiring three-dimensional hyperspectral cubes are point-scan, line-scan, and area-scan techniques. The hyperspectral imaging equipment and the main steps for establishing MCs distribution maps in tea buds by using HSI (Figure 2) are proposed by Yu et al. [89].
The goal of MSI technology is to collect spatial and spectral information suitable for real-time applications in the field. The process typically requires rapid image acquisition and straightforward algorithms for processing and decision-making. A critical aspect of developing efficient MSI systems is minimizing data volume, often achieved by capturing images at lower spatial resolutions and key wavelengths in practice [90]. In general, hyperspectral images serve as foundational datasets for determining the optimal wavebands that can be used for a particular application by an MSI solution. The point-scan approach, which involves lengthy scans across two spatial dimensions, is impractical for rapid image capture due to its inefficiency, while the other two methods (i.e., line-scan and area-scan) can be adapted to satisfy the requirements of rapid multi-spectral image acquisition. In the line-scan approach, this is accomplished by defining the positions of relevant tracks along the CCD detector’s spectral axis. By capturing data only from these designated tracks, the volume of data per line-scan image (y, k) is reduced, thereby speeding up the acquisition process. Additionally, the bandwidth of the chosen tracks can be fine-tuned through pixel binning along the spectral axis. Unlike the line-scan method, the area-scan technique enables the simultaneous collection of single-band images at multiple preselected wavelengths [91,92]. Optical separation devices typically split light from the spatial scene into multiple components. These spectrally separated scenes are then individually directed through predefined bandpass filters. Narrowband images are subsequently captured by using multiple cameras or a single camera equipped with a large CCD sensor. Unlike area-scan-based HSI, which requires extensive spectral scanning, this area-scan approach eliminates the need for prolonged spectral domain scans, significantly shortening the image acquisition time for MSI applications [93].
Computer vision is often used to extract the external qualities, such as color, texture, and shape features of tea samples. This technology can capture the changes in quality information that are not easily detected by the human eye. It is commonly used to evaluate the processing stages of time series samples, quantitatively predict pigment substances (chlorophyll, theaflavins, thearubin, and theabanthin), and perceive the appearance score in the sensory quality of finished tea. Spectral technology is used to quantitatively perceive the intrinsic substances related to taste in tea samples (catechins, soluble sugars, caffeine, free amino acids, and tea polyphenols). The principle is to generate characteristic absorption in the infrared band by means of the molecular bond vibration of specific functional groups. Although computer vision can obtain the feature information inside the sample, it cannot achieve the digital perception of the shape quality. Compared with computer vision, spectral imaging technology integrates the advantages of spectral technology and machine vision technology, achieving a two-dimensional distribution perception of key non-volatile substances.

3. Data Processing and Analyzing Methods

3.1. Image Processing and Analysis Methods

Image processing and analysis play a pivotal role in imaging systems, with numerous algorithms and methods designed to achieve precise measurement and classification tasks [76]. The subsequent section will outline the commonly used image processing and analysis methods in tea quality inspection.

3.1.1. Image Processing Methods

The accuracy of food quality measurement largely depends on images. Because the original image will be affected by various factors (i.e., hardware and light) during the process of image acquisition and transmission, the directly obtained images should undergo some digital processing steps first in the quality analysis of tea leaves. Image processing is aimed at improving image quality, and it encompasses a sequence of operations to address issues like geometric distortion, repetitive noise, camera motion, and non-uniformity [23]. The basic operations of this process typically involve image acquisition, image preprocessing, image segmentation, feature extraction, and advanced image processing techniques [94,95]. These operations form the entire image processing procedure, and the results of each operation will have an influence on the subsequent operations. So, they must be performed carefully to reduce errors and achieve high precision.
Image acquisition marks the initial stage of the entire processing workflow, encompassing preparation, illumination, noise reduction, and mitigation of specular reflection. This step is crucial to improve accuracy and ensure the reliability of data [23]. Image quality is often compromised by factors such as noise, distortion, and limitations of electronic input devices. The goal of image preprocessing is to enhance the quality of the obtained images by eliminating noise, increasing the contrast, and addressing issues such as gray-level inconsistencies, blurring, and distortion [76]. Image segmentation is a critical and complex step in image processing, focused on dividing an image into distinct areas or regions of interest (ROI). Its precision plays a significant role in subsequent processing and analysis. In general, the main categories of image segmentation methods include threshold segmentation, edge-based segmentation, classification-based segmentation, and region-based segmentation [76]. Feature extraction is a vital step in image processing and analysis, which focuses on converting image data or segmented regions into a set of feature vectors. The aim of feature extraction is to generate informative and non-redundant representations to support subsequent learning and generalization tasks [96,97]. Thus, feature extraction plays a vital role in ensuring the accuracy and precision of quality inspection. In general, color, texture, shape, and size features of targets or segmented regions are the most commonly extracted attributes for external quality assessment. Advanced image processing involves recognition and classification, fulfilling the core objective of computer vision in enabling process monitoring and control.

3.1.2. Image Analysis Methods

Image analysis is a non-destructive technology for generating measurements and statistical data based on pixel intensity values and their spatial relationships within images [76]. This process relies on features derived from images to produce meaningful interpretations. The outcomes of image analysis can reveal details about objects within images, enabling quantitative assessments of these objects or confirming their existence. Image analysis encompasses a variety of algorithms and techniques designed for measurement and multivariate classification [98].
Measurement refers to the process of quantifying specific parameters based on features derived from images. Imaging analysis technology enables various types of measurements, such as assessing color, texture, shape, and size. In tea quality inspection, external attributes like color, texture, shape, and size of objects or segmented areas in images are quantified for evaluation. Multivariate classification, also known as pattern classification, involves drawing conclusions from measured features by using technologies such as probability, multivariate analysis, computational geometry, statistics, and algorithm design. It can be categorized into supervised learning methods and unsupervised classification methods [76]. Supervised learning methods, which aim at establishing a classification model by linking features to predefined class labels, are among the most widely used technologies in image analysis [99]. Unsupervised classification methods do not require any prior knowledge of the categories in the data. Instead, they categorize data by identifying similarities among selected features and rely on clustering algorithms based on inherent patterns to group the data [100]. However, in image-based tea quality assessment, both supervised learning methods and unsupervised learning methods have their limitations. Supervised learning methods rely on high-quality labeled data and have weak adaptability to dynamic environments. Compared to supervised learning methods, unsupervised learning methods have a poorer ability to extract complex features. Meanwhile, there are challenges like less predictable outcomes and lower reliability in categorization.
K-Nearest Neighbor (KNN), artificial neural network (ANN), linear discriminant analysis (LDA), partial least squares-discriminant analysis (PLS-DA), principal component analysis (PCA), and support vector machine (SVM) are widely used in image analysis within the food inspection industry. KNN, a non-parametric method, is ideal for multi-modal classes as it classifies objects based on the predominant class among their k closest neighbors [101]. Its accuracy hinges on the choice of distance metric and the optimal selection of the parameter k. ANN, a non-linear supervised approach, draws inspiration from biological neural systems [102]. The models used in ANN mathematically emulate neural structures to identify shared patterns among labeled training samples, enabling classification based on learned features. Meanwhile, LDA serves dual purposes: it reduces data dimensionality while performing supervised classification by maximizing separability between predefined classes [103]. It achieves classification by optimizing class separation through maximizing inter-class variance and minimizing intra-class variance [104]. PLS-DA classification is based on PLS approaches and the dependent variable is selected to represent the class membership [105]. PCA, an unsupervised dimensionality reduction technique, decomposes spectral data into principal components—linear combinations of original variables—to simplify datasets for exploratory analysis, though it is not inherently a classification method [106]. It transforms data into uncorrelated variables ranked by their variance contribution, prioritizing components that explain the most variability. SVM, a supervised learning method, classifies data by projecting it into higher-dimensional spaces and identifying optimal hyperplanes that maximize the margin between classes, relying on critical support vectors to define these boundaries. Du and Sun provide a comprehensive review of imaging technology for food quality assessment, including detailed discussions on measurement and multivariate classification methodologies. In tea quality evaluation, pattern classification techniques are widely employed to identify attributes such as color, texture, shape, and size by analyzing segmented regions or objects during image processing.

3.2. Spectral Analysis Methods

3.2.1. Spectral Preprocessing

The spectra of solid and scattering samples are often distorted by physical attributes like particle size and morphology, leading to broad-spectrum baseline shifts and noise when analyzing quality parameters [107]. This necessitates spectral preprocessing to mitigate physical artifacts and enhance the accuracy of subsequent multivariate analyses. It is a critical step in chemometric modeling, including regression, classification, and exploratory studies [108]. The choice of preprocessing methods must align with the requirements of subsequent modeling phases. A typical workflow of data processing involves three stages: spectral preprocessing to mitigate artifacts, calibration model development, and validation to assess robustness [109]. For an in-depth discussion of preprocessing techniques, please refer to dedicated resources [73,110].
Some typical methods of spectra preprocessing include smoothing, centering, averaging, Multiplicative Scatter Correction (MSC), Standard Normal Variate (SNV), derivative correction, and transformation [111]. The principle enhances data quality by deriving optimal estimates through mathematical operations, such as averaging or curve fitting data points within a defined window [73]. According to different smoothing fitting approaches, smoothing can be classified into multiple methods, such as moving average smoothing, Gaussian filter smoothing, median filter smoothing, and Savitzky–Golay smoothing (S–G smoothing). Each smoothing technique is adapted to distinct noise models. Centering functions ensure that all results can be interpreted based on variations around the mean [112]. If the variables differ significantly in their relative magnitudes, centering is especially crucial because regression analysis tends to prioritize values with the highest variance. In order to minimize the thermal noise of the detector, averaging over spectra is generally performed in the original spectra. MSC is a transformation method utilized to compensate for additive or multiplicative effects on spectral data. It aims to correct spectral deviations caused by particle size and scattering effects. SNV, a row-oriented transformation, eliminates multiplicative interferences from scattering and particle size effects in spectral data. It removes scatter effects by centering and scaling each spectrum to zero mean and unit variance [113]. The key distinction between the above two techniques lies in that MSC normalizes each spectrum by the mean of the entire spectral dataset, while SNV relies solely on the data from the respective spectrum. Consequently, MSC generally exhibits less robust correction for individual spectra than SNV. In SNV correction, each spectrum is normalized to zero mean and unit variance [112]. Derivative techniques are employed to eliminate overlapping peaks and baseline drifts induced by particle size variations and instrument fluctuations, thereby revealing more detailed spectral information [110,112]. This generally comprises two approaches: first derivative (FD) and second derivative (SD). In spectral analysis, Fourier Transformation (FT) and Wavelet Transformation (WT) are widely utilized for data compression, smoothing, filtering, and useful information extraction [114].

3.2.2. Wavelength Selection

The high-resolution datasets generated by modern spectroscopic instruments contain thousands of spectral wavelengths (variables) and numerous samples, which create computational challenges for direct calibration [115]. This makes direct calibration of spectral data time-consuming and complex. To simplify computations, improve detection efficiency, and meet the speed requirements of industrial applications, wavelength selection becomes crucial. It helps identify the optimal variables and eliminate unnecessary ones [116,117]. Several methods, such as uninformative variables elimination (UVE), competitive adaptive reweighted sampling (CARS), successive projections algorithm (SPA), random frog (RF), and genetic algorithm (GA), have been developed for this purpose and can be applied before building regression and classification models. Further details can be found in the literature.

3.2.3. Calibration Models

Multivariate regression techniques (quantitative analysis) are used to establish the relationship between the observed response values and the spectral data matrix. The most widely used method includes conventional algorithms such as multiple linear regression (MLR), partial least squares (PLS), least square support vector machine (LS-SVM), and artificial neural network (ANN) [118,119]. The detailed instruments of these algorithms are illustrated as follows.
MLR is the simplest and most widely used method for constructing models or, in other words, finding the optimal parameters to minimize the difference between the theoretical and experimental data. The MLR model is constructed based on the assumption that a linear correlation exists between a set of molecular descriptors of a compound (spectral data X) and a specific activity (quantity Y). An MLR model can be expressed by the following equation,
Y ^ = β 0 + β 1 X 1 + β 2 X 2 + + β n X n
where X 1 , , X n represent molecular descriptors. β 0 denotes the regression model constant, and β 1 to β n are the coefficients for individual descriptor X 1 to X n . The values from β 1 to β n are determined by minimizing the sum of squared residuals between observed and predicted values, as defined by the equation, to achieve the optimal prediction of y from X. However, MLR performs effectively only when the structure–activity relationship exhibits a linear characteristic.
PLS regression is a widely used multivariate technique for calibrating spectroscopy data. It employs linear least-squares fitting to model relationships between variables. It constructs a linear relationship between the independent spectral matrix X and the dependent response matrix y, estimating regression coefficients through least-squares optimization. PLS is extensively utilized in modern chemometrics for calibration purposes [120,121,122]. As a supervised method, PLS is applied when both predictor X and response Y datasets are available, enabling predictions of Y from X [112]. Two common variable selection approaches in PLS include leveraging variable importance in projection scores and analyzing PLS-derived regression coefficients [123]. The objective of PLS is to find latent variables by projecting both X and Y into a new space where their covariance is maximized [124]. A crucial step in PLS is the selection of an appropriate number of latent variables for constructing a quality assessment model. Unusually, this is determined by utilized cross-validation approaches such as leave-one-out cross-validation.
LS-SVM is a supervised learning method used for data analysis and pattern recognition, applicable to both classification and regression tasks [125,126]. While the PLS method is limited to linear problems, some studies have shown that non-linear patterns may exist in spectral data, such as in food analysis, where non-linear models are superior to linear models. Unlike PLS, the computational complexity and performance of SVM are not directly affected by the input data dimensions. As a result, LS-SVM has been used to develop non-linear models of prediction performance with linear PLS models. LS-SVM is favored in pattern recognition and regression due to its ability to minimize overfitting, offer high predictive reliability, and demonstrate strong generalization [73]. Further details about the LS-SVM method can be found in the following literature sources [127,128].
ANN is a multivariate approach that employs multiple simple units to build a network system. An ANN model generally comprises three neuron layers: the input layer, hidden layer, and output layer [129]. Neurons in one layer are linked to each neuron in the subsequent layer, with each connection featuring a weight factor. These weights are adjusted based on a calibration set using cross-validation and are updated as new information is introduced [73]. Hidden layer neuron values are computed as a weighted sum of input layer values, transformed by a non-linear function, while output layer values are derived similarly from hidden layer outputs. Despite the strong predictive capabilities, ANNs often suffer from slow training, overfitting, and challenges in model interpretability.

3.2.4. Model Evaluation

Calibration model performance is typically assessed using the root mean square error of calibration (RMSEC) and the calibration correlation coefficient ( R c ). Similarly, the root mean square error of prediction (RMSEP) or validation (RMSEV), along with the prediction or validation correlation coefficient ( R p ), are employed to evaluate the performance of models on the prediction or validation dataset. The root mean square error of cross-validation (RMSECV) serves as an indicator of prediction performance during cross-validation. These metrics are mathematically defined as follows:
R M S E C = 1 n c i = 1 n c ( y ^ i y i ) 2                
R M S E P = 1 n p i = 1 n p ( y ^ i y i ) 2      
R c = i = 1 n c ( y ^ i y i ) 2 i = 1 n c ( y ^ i y m c ) 2      
R p = i = 1 n p ( y ^ i y i ) 2 i = 1 n p ( y ^ i y m p ) 2      
where y i is the measured value of the ith observation, y ^ i is the predicted value of the ith observation, y m c or y m p refers to the mean value of the calibration or prediction set. n c and n p are the number of observations in the calibration and prediction set, respectively. Typically, a good model is characterized by higher correlation coefficients and lower values of RMSEC and RMSEP [130].

4. Applications in Tea Quality Assessment

4.1. External Quality Assessment

Being a highly valuable farm crop all around the world, the quality of tea plays an indispensable part in its marketability. The prominent physical attributes that determine tea quality include color, shape, texture, etc. Among them, color and texture have a direct impact on the external quality of tea. Over the past few decades, significant efforts have been devoted to advancing non-destructive techniques for evaluating the external quality attributes of tea products. Modern analytical technologies employ distinct principles, methodologies, and instrumentation systems to effectively characterize the multifaceted quality attributes of tea products. These advancements offer diverse approaches for precise and efficient quality assessment. Table 1 summarizes methodological implementations of key non-destructive techniques in tea exterior quality assessment. Subsequent sections critically examine recent advances in imaging-based surface characterization systems for tea products. The acquisition of external features of tea samples is often achieved based on machine vision technology. The practical application of this technology relies on a stable external environment. For example, during the fermentation stage of black tea, due to the high humidity required in the processing link, it will affect the clarity of the imaging by machine vision technology.

4.1.1. Color Features

Tea color includes a lot of features, such as basic hue, polish, saturation, color uniformity, etc. Despite differing color specifications among tea varieties, superior quality leaves consistently demonstrate standardized visual parameters, particularly even pigmentation and radiant surface glow. Thus, the color of tea leaves is a significant attribute in the perception and evaluation of tea quality. The correlation between tea color and tea quality was studied by Lu et al. and Liang et al. [131]. Since any color can be reproduced by the combination of three primary color components, each pixel in a color image consists of three intensity values. Color features of an image can be extracted by analyzing statistical measures, primarily the mean and standard deviation of pixel intensity values across various color spaces. Imaging technology can simulate the human eye to record the target objects in the form of images. Through the application of imaging and spectroscopy technology to capture sample images and to extract the color feature parameter with digitization as a main feature parameter, the color information of tea can be quantitatively described more accurately and objectively. Usually, the images are obtained through a digital device and stored in the three-dimensional (3D) RGB (red, green, and blue) color space, which is one of the most extensively applied hardware-oriented color spaces in color inspection.
A computer vision-based RGB color model has been successfully utilized to evaluate the external quality of tea. Singh and Kamal [132] designed and developed a personal computer (PC)-based system for monitoring the color changes in tea during the fermentation process to determine the quality of tea. The color histogram on red (R) and blue (B) channels of the particles’ image was applied for the extraction of color information. The evaluation method has been proven to be effective in identifying the quality of fermented teas. A study conducted by Borah and Bhuyan [133] monitored quality parameters of black tea by using an automated electronic and intelligent color measuring system. They explored the possibility of measuring the color changes in tea during the fermentation process by applying the RGB color model and digital camera imaging. Gejima et al. [134] monitored the color changes in tea in the drying process based on the RGB color model by using computer vision technology. The study found that the practicability of this RGB color model is restricted since it does not have the ability to make up for variations in surface orientation, direction, intensity of illumination, and viewing direction. Therefore, the application of the RGB color model based on computer vision to the appearance quality inspection of tea has certain limitations. This technology is highly susceptible to the influence of environmental lighting. At the same time, the color gamut of the RGB model cannot fully cover the entire color range perceived by the human eye. In complex environments, the adaptability of this technology is relatively poor.
Therefore, several other color coordinate systems which are able to correctly describe, measure, and evaluate the color of an object have also been developed. In the color inspection of foods, two categories of color spaces are widely used: human-oriented spaces and instrumental spaces. Human-oriented spaces, which align with human perception of color, include HIS (hue, intensity, and saturation) space, HSV (hue, saturation, and value) space, HSL (hue, saturation, and lightness), and HSB (hue, saturation, brightness). And instrumental spaces, such as CIE L*a*b* space and CIE XYZ space [135], are standardized by the Commission Internationale de l’Eclairage (CIE) under controlled conditions. Borah and Bhuyan [133] attempted to determine the optimum fermentation conditions of tea by utilizing a color-matching algorithm and imaging technology. The HIS color model was applied to the color-matching algorithm, and the HIS data were converted to the RGB color model via an image processing add-on card.
A study was carried out to explore the potential of identifying five distinct green tea varieties based on color feature and texture extraction methods. Spatial color distributions were quantified using RGB and HIS models, complemented by texture characterization via first-/second-order statistical moments and Fourier spectral analysis. The identification model, constructed on a PCA framework, employed Linear Discriminant Analysis (LDA) to classify tea varieties by optimizing principal component (PC) selection. Systematical determination of the optimal PC subset achieved 100% training accuracy and 98.33% prediction accuracy, validating the robustness of this PCA-LDA integrated computer vision approach for rapid tea quality assessment. By extracting the appropriate color and texture features, different tea varieties can be effectively distinguished [136]. In the study of Dong et al. [137], the machine vision technology and non-linear modeling algorithms were utilized to analyze the color space variations in Congou black tea in RGB, CIE L*a*b*, and HSV. This study aimed to investigate the relationship between image colors and quality indices, as illustrated in Figure 3. In this study, they extracted nine color variables (R, G, B, L*, a*, b*, H, S, V) as the color features to construct both linear and non-linear models for the quantitative evaluation of physicochemical indexes and sensory characteristics. The experimental results showed a strong correlation between color characteristics and quality indices. It was found that the CIE L*a*b* model more accurately reflected the dynamic variations in black tea quality indices and foliage color information compared to the RGB and HSV color models. To identify optimal methods for improving the accuracy and efficacy of the quality index prediction, the researchers compared the performance of three typical modeling algorithms (PLS, RF, and SVM), respectively. The results demonstrated that the SVM model achieved significantly superior performance to the PLS linear model, with lower RMSEP and higher R/RPD values. Furthermore, while both RF and SVM non-linear models surpassed PLS in predictive accuracy, RF exhibited marginal advantages over SVM due to its enhanced capacity to model complex image-quality interdependencies. In the work of Wang et al. [138], they verified the correlations between nine color variables (R, G, B, L*, a*, b*, H, S, V) and key quality indicators (catechins, theaflavins, and chlorophylls) in fermentation tea samples. Furthermore, the PLS models of these key quality indicators were established in the fermentation process of black tea. Finally, the spatial and temporal distributions of indicators of these fermentation samples were mapped to visualize the fermentation quality [139]. In addition, tea quality identification with NIR hyperspectral imaging has also been utilized in the research on color variation in the process of tea products. Xie et al. [140] discussed the feasibility of applying hyperspectral imaging technology to non-destructively measure of color components (ΔL*, Δa*, Δb*) and the classification of tea leaves. The overall classification accuracy was 96.43% in the calibration set and 85.71% in the prediction set. This indicates that hyperspectral imaging technology is a robust and objective tool for characterizing color attributes and categorizing tea leaves at various stages of the drying process, enabling reliable quality monitoring and assessment throughout the whole process. There are other studies on the quality assessment and classification of tea by using imaging and spectroscopy technologies on the basis of tea color feature parameters [141,142,143,144,145,146,147,148,149,150,151,152,153].

4.1.2. Texture Features

Texture features, including uniformity, linearity, roughness, direction, frequency, regularity, density, and phase [142], are another index in the quality evaluation of tea. It is a visual feature of an image with the ability to reflect the spatial information present on the surfaces of an object and identifying a segment which belongs to a specific class [154]. Since the first literature on texture analysis appeared in the 1950s, texture analysis has always been a prominent area of research in the field of machine intelligence and pattern analysis. Due to the complex appearance of the tea, it is hard to detect a single tea leaf. However, the image acquired by spreading a sample of dry tea leaves can present overall texture features. Thus, it is feasible for computer vision to simulate the human sensory evaluation to extract texture features. The methods for describing imaging texture features are numerous and can generally be grouped into statistical, geometrical, model-based, and transform-based approaches [155,156].
The statistical texture is extracted through the application of various statistical methods on a matrix, which is generated by organizing the pixel intensities across images according to their specific order, and can be used to capture the patterns and correlations present in the texture of images [157]. A widely adopted approach for statistical texture characterization involves deriving texture features from the Gray-Level Co-Occurrence Matrix (GLCM). Originally introduced by Haralick et al. in the 1970s, this method was initially applied to analyze remotely sensed images, leveraging spatial pixel relationships to quantify surface patterns [158]. Since then, various modifications were studied and published. In addition, other statistical techniques include calculating the autocorrelation function, gray-level pixel-run length matrix, neighboring gray-level dependence matrix, etc. [159]. Generally, the statistical approaches are cited to study the coarseness, graininess, and smoothness of products [160]. Yu et al. [161] achieved a highly accurate classifying process of green tea by combining color and texture features coupled with an LS-SVM classifier. The texture features were computed from the GLCM of every channel in RGB and HIS color coordinate systems. Based on the optimal experimental results (about 96.33%), it was found that only color features or texture features are not sufficient for accurate category classification of green tea. Thus, combined color and texture features can be a rapid and efficient technique used for classifying green tea. Parallel research efforts were undertaken by Gill et al. [156] to differentiate among four distinct grades of manufactured black tea through the application of textural descriptors derived from GLCM.
Parallel research efforts were undertaken by Gill et al. [156] to differentiate among four distinct grades of manufactured black tea through the application of textural features derived from GLCM. Their method yielded a classification accuracy of 82.33%, demonstrating the efficacy of GLCM-based features in tea quality evaluation. Following this, Tang et al. [162] explored an advanced texture characterization strategy by integrating non-overlapping window Local Binary Pattern (LBP) operators with GLCM for the classification of freshly harvested green tea leaves. By synergizing both LBP and GLCM, the proposed framework achieved computationally efficient extraction of discriminative texture signatures while substantially enhancing classification precision. This approach thereby addressed the dual challenges of algorithmic complexity and accuracy optimization in automated grading systems of tea leaves. In order to compare the performance of LBP, GLCM, and LBP-GLCM texture extraction methods, three distinct categories of fresh tea leaf images, including one bud with one leaf, one bud with two leaves and one bud with multiple leaves, were utilized to systematically evaluate the operational efficiency and classification performance of multiple analytical methods. The results demonstrated that the LBP-GLCM approach possessed superior performance, achieving classification accuracies of 94.0%, 92.0%, and 100% for the respective leaf configurations. In comparison, LBP yielded accuracies of 62.0%, 60.0%, and 82.0%, while traditional GLCM achieved 60.0%, 65.0%, and 62.0%. Furthermore, the computational runtime of the non-overlap window LBP-GLCM was three times faster than LBP and four times faster than GLCM. Besides the computer image analysis technology, a number of studies have been investigating the performance of texture feature for multi-spectral images at the visible and near-infrared (NIR) wavelengths [162]. In a pioneering investigation by Wu et al. [163], a multi-spectral imaging system incorporating three discrete wavelength bands (580 nm, 680 nm, and 800 nm) was implemented for the automated classification of green tea varieties. Textural entropy metrics derived from spectral images at these wavelengths served as discriminative features for category differentiation. After training the entropy features with SVM, the LS-SVM model using a radial basis function (RBF) kernel achieved a 100% correct classification rate, outperforming LS-SVM with a linear kernel, PLS, and RBF neural networks. The study also demonstrated the feasibility of using multi-spectral imaging to accurately identify tea categories. Chen et al. [164] conducted similar research, investigating the potential of monitoring tea leaf quality using multi-spectral images. They extracted texture features from multi-spectral images of tea canopies and employed PLS, SVR, and RFR algorithms to develop key models for quality parameters. The results showed that the spectral characteristics of fresh tea leaf canopies had a significant correlation with tea quality parameters (r >= 0.462). Specifically, the RFR model exhibited the best performance for predicting total sugar content [164].
Within the domain of quality inspection, three principal approaches, which include geometrical methods, model-based methods, and transform-based methods, are also employed, yet they are less commonly used compared to statistical approaches. Geometrical methods operationalize textural characterization through the identification of texture elements or primitives [142]. Geometrical analysis approaches typically depend on the geometric characteristics of these primitives, as well as the rules governing their spatial arrangement and distribution within the image. Within the methodological framework of texture characterization, Voronoi tessellation-based features have garnered substantial research attention [165]. Over recent decades, Voronoi polygon-derived textural features have emerged as a prominent analytical tool in image segmentation research. However, this method exhibits intrinsic limitations in practical applications, rendering it suboptimal for the analysis of biological specimens such as tea leaves. Consequently, scholarly investigations leveraging geometric texture characterization for the analysis of tea leaves remain scarce. Model-based texture features can be derived by computing coefficients from autoregressive models, field models (Markov random fields and discrete Gibbs random fields), or fractal models, based on the correlations of the intensity values between pixels and their neighboring pixels [159]. The transform-based approach transforms an image into a new representation by leveraging spatial property information, incorporating variations in pixel intensity across the image [157]. Transform-based methods used for texture analysis primarily encompass the wavelet transform (WT), the Fourier transform (FT), and the convolution operator (CO). In 2007, Borah et al. [155] developed a wavelet texture analysis approach utilizing texture feature estimation techniques to perform image classification of eight distinct grades of CTC (cutting, tearing, and curling) tea. This method combines the feature information from one image group with the corresponding data from the remaining groups. In comparative assessments, this new set of feature vectors demonstrated superior discriminative capacity over conventional statistical feature vectors, achieving enhanced efficacy in differentiating images containing tea granules of varying sizes. Experimental validation implemented two neural networks, namely multi-layer perceptron (MLP) and learning vector quantization (LVQ). Performance metrics revealed classification accuracies of 74.67% in MLP and 80% in LVQ, respectively. The performance of both MLP and LVQ surpassed that of traditional statistical texture feature-based methods. Additionally, Li et al. [166] explored an innovative approach for identifying green tea categories using multi-spectral imaging technology. Two feature extraction approaches, including GLCM and WT, were employed to extract texture features from multi-spectral images of famous Chinese teas. With the purpose of augmenting classification efficacy, an LS-SVM classifier was engineered based on the optimized texture features. Validation on prediction set demonstrated exceptional performances, achieving 100%, 100%, 75%, and 100% for four kinds of green teas (YYGQ, LSYW, AJBP, and XHLJ), respectively. Comparative analysis demonstrated that the texture feature extraction combined with GLCM and WT exhibited enhanced discriminative capacity, outperforming the approach utilizing either GLCM or WT in isolation. Subsequent advancements by Wang et al. [73] pioneered an automatic tea taxonomy framework, where a computer vision technology was systematically based on color and texture feature analysis for real-time varietal classification. The architectural workflow and feature extraction results are schematically illustrated in Figure 4. They derived 64 color histogram features and 16 wavelet packet entropy (WPE) features to represent color and texture characteristics, respectively. The features decreased by PCA algorithms were used as the input of the fuzzy SVM (FSVM) classifier. The winner-take-all (WTA) strategy was utilized to enable the FSVM classifier to handle the three-class problem. Additionally, other studies have focused on tea quality evaluation by leveraging imaging and spectroscopy technologies, primarily based on texture feature parameters [16,117,148,167,168,169,170,171,172,173,174].

4.1.3. Shape Features

Shape typically refers to the geometric structure or outline of objects, and this geometric definition can be directly applied to analyze shapes in digital images [159]. The shape of tea is one of the most common objective measurements that affects the decision of customers in purchasing. Different tea varieties possess distinct morphological features which can be utilized to classify them into specific categories. Compared to features like color and texture, shape is more straightforward to quantify using image processing methods. Shape features can typically be measured either independently or in conjunction with size metrics. Size-dependent attributes, including compactness, roundness, length, diameter, and area, along with Fourier descriptors, boundary encoding, and invariant moments, are widely used shape features in food quality inspection [76].
So far, there have been some works of literature on the quality assessment of tea based on the shape feature parameters. For evaluating the quality of tea, which undergoes different roasting techniques more objectively, Jian et al. [175] explored the application of computer vision and image processing technology for grading and testing different tea leaves, based on the shape and color parameters (HIS model) of tea. On the basis of the HIS images model and the binary shape of tea leaves, a new approach to select parameters as the automatic identification indices of the genetic neural-network algorithm (GNN) was proposed to identify tea images effectively. According to the analysis of the experimental results, this method could achieve a better identification effect with eight parameters of shape and color. The results of computer vision analysis showed high consistency with those of manual tests, indicating that it was feasible for a computer vision system to substitute human senses in tea identification. Yang et al. [176] recognized the tea sprouts that were grown in Xixiang County, Shaanxi Province, around the Pure Brightness solar term (5th solar term) using an image processing method based on color and shape features. Firstly, the green component of the tea leaf image in the RGB color space was extracted. Secondly, the green component image was segmented using the double threshold method. Thirdly, the edges of tea sprouts were detected according to their shape features. The experimental results illustrated that this recognition method, based on color and shape features, could recognize tea sprouts with a correct detection rate of 94% (48 out of 50), providing an effective method for automatic tea sprout picking. Similar studies are summarized in Table 1 [177,178,179,180,181,182,183,184,185,186].
Table 1. Summary of non-destructive technology for tea external quality evaluation.
ApplicationTea CategoriesTechnologyFeature(s)/Spectra Region (nm)Analysis Method (s)Optimal ResultReferences
Identification of tea varietiesGreen teaComputer visionColor, TextureLDA, PCA,98.33%[136]
Prediction of fermentation quality indicesBlack teaMachine visionColorPCA, PLS, SVM, Random forest R p = 0.941, RMSEP = 1.733[137]
Evaluation of black tea fermentation qualityBlack teaMachine visionColorPLSRPD = 4.13 for catechins
RPD = 3.53 for theaflavins
RPD = 3.39 for chlorophylls
[95]
Prediction of nitrogen contentTea plantsMachine visionColorOLS, XGBoost, RNN-LSTM, CNN, ResNetMA = 0.9144 for elder tea leaves in experimental strategy I
MA = 0.8696 for elder tea shoots in experimental strategy I
MA = 0.9148 in experimental strategy II
[121]
Color MeasurementGreen teaHSIColor
380–1030 nm
CARS, SPA, PLS, MLR, LS-SVM R p = 0.902 to 0.931 for ΔL*
R p = 0.618 to 0.973 for Δa*
R p = 0.904 to 0.944 for Δb*
[140]
Evaluation of tea authenticationArgentinean and Sri Lankan black teas and Argentinean green teasMachine visionColorPCA, PLS, DD-SIMCA100% for category and geographical origin
REP = 6.38% for MC
REP = 9.031% for TP
REP = 14.58% for caffeine
[144]
Monitoring green tea fixation qualityGreen teaMachine vision
NIRS
Color
900–1700 nm
CARS, LS-SVM100% for fixation degree
RPD = 6.46 for MC
[143]
Quantitative prediction and visualization of color physicochemical indicatorsMatchaHMI400–998 nmCARS, IRF, SPA,Rp = 0.9262 for L*
Rp = 0.8826 for a*
Rp = 0.8583 for b*
Rp = 0.8243 for chlorophyll a
Rp = 0.7518 for chlorophyll b
Rp = 0.8093 for chlorophyll total
[147]
Tea shoots detectionTeaMachine visionColorYOLOv791.12%[153]
Evaluation of fermentation degreeBlack teaFT-NIR
Computer vision
Color
800–2500 nm
PCA, KNN, LDA, SVM100% for fermentation degree[145]
Monitoring withering degree Black teaMachine vision
NIRs
CSA sensors
Color
900–1700 nm
Color variables
PCA, Spearman correlation analysis, SVM97.5%[152]
Evaluation of fermentation degreePu-erh teaMachine vision
NIRS
Color, texture
900–1700 nm
SNV, PLS-DA, GAL, CARS, SPA, PLS, LS-SVM99.3% for fermentation degree
RPD = 4.76 for TC
RPD = 2.36 for GA/TC
RPD = 4.76 for R-TI
RPD = 4.76 for G-TI
[148]
Classification of tea varietiesOolong teaMachine visionColor, textureSVM, CNN>93%[174]
Classification of tea samplesBlack tea and green teaMachine visionColor, textureDT92.917% for Black tea
95% for green tea
[167]
Evaluation of fermentation degreeBlack teaMachine visionMathematical values, color, text, texture strength, histogram gradients, and flexible discrete wavelet KNN, SRC, SVM98.75%[168]
Detection of tea impurityPu-erh teaMSI713, 736, 759, 782, 805, 828, 851, 874, 897, and 920 nm,
Color
SVM93%[146]
Evaluation of the appearance modalityBlack teaMachine Vision
HSI
Color, texture, shapeSVM, RF, LS-SVM100%[150]
Identification of tea categoriesGreen, black, oolong teaComputer visionColor, texturePCA, SVM97.9%[141]
Identification of tea categoriesGreen teaComputer visionColor, textureLS-SVM96.33%[161]
Classification of teaFresh tea leavesComputer visionTextureBP-NN94.0%, 92.0% and 100%[162]
Discrimination between various grades of teaBlack teaComputer visionTextureMLP80–82.33%[156]
Sorting of tea categoriesGreen teaMSITexture
580, 680, and 800 nm
GA, PCA, LS-SVM,Up to 100%[163]
Monitoring the quality parameters of fresh tea leavesFresh tea leavesMulti-spectral cameraTexturePLS, SVR, RFRR2 = 0.85 for total sugar[164]
Discrimination of eight grades of teaBlack teaComputer visionTextureMLP, LVQ74.67% and 80% for MLP and LVQ[156]
Recognition of tea categoriesGreen teaMSITextureLS-SVM100%, 100%, 75%, and 100% for four kinds of teas[166]
Identification of tea categoriesGreen, black, oolong teaComputer visionColor, textureFuzzy SVM97.77%[5]
Evaluation of appearance qualityBlack teaComputer visionColor, textureRF, SVR, BPNNRPD = 3.207 for appearance quality[16]
Evaluation of tea qualityBlack teaHSITexture
900–1700 nm
DT93.13%[169]
Evaluation of fermentation degreeBlack teaHSI and CSA sensorsColor, texture
400–1000 nm
SFLA, CARS, VCAP-IRIV, PCA, SVM97.5%[117]
Detection of moisture content Fresh tea leavesComputer visionColor and textureLDA, PCA, GA, PSO, BPNNR2 = 0.94[139]
Evaluation of tea qualityBlack teaHSI900–1750 nm
texture
GLCM, GLPCM, IRIV, ISFLA, LS-SVM99.57%[149]
Recognition of different Longjing fresh tea varietiesFresh tea leavesHSI370–1042 nm
Color, texture
SVM, BPNN100%[173]
Detection of drying qualityBlack teaNIRS
Computer vision
900–1700 nm
Color, texture
LS-SVRRp = 0.9696 for MC[171]
Evaluation of tea gradeBlack teaNIRS, E-eye, E-tongue, and E-nose3600–12,500 cm−1, color, texture, shape, optical and electronic signalCARS, IRIV, VCPA, VCPA-IRIV, CNN0.86% for misclassification rate[170]
Grading and testing of different teasGreen teaComputer visionColor, shapeGNN[175]
Recognition of tea sproutGreen teaComputer visionColor, shape94%[176]
Recognition of tea diseaseTea plantHSIColor, texture, shapePCA, Fischer95% for non-disease
90% for disease
[178]
Assessment of the severity of tea DiseaseTea plantMachine visionColor, texture, shapeU-Net, SVM, metric learning model (MLM)82%[180]
Recognition and positioning of fresh tea budsFresh tea budsMachine visionColor, shapeYOLOv487.10%[179]
Grade evaluation of teasBlack teaMachine vision
NIRS
CSA sensors
Color, shape
900–1700 nm
RGB response values
SVM, LS-SVM, PLS-DA, ELM98.75%[181]
Automatic sorting of fresh tea leavesFresh tea leavesMachine visionShapeSVM94%[178]
Grade evaluation of teasBlack teaMachine visionShapeSVM, LS-SVM100%[182]
Grade evaluation of teasBlack teaMachine vision
NIRS
Shape
900–1700 nm
ANN100%[183]

4.2. Internal Quality Assessment

During the processing of fresh tea leaves, including oxidation and fermentation, raw tea leaves may be blended with other varieties or mixed with flavoring agents, thereby modifying the chemical composition of finished products. Green, white, and yellow teas undergo minimal processing, black and oolong tea products have been oxidized, while post-fermented tea has been fermented. Freshly harvested tea leaves contain a complex mixture of polyphenols, caffeine, polysaccharides, and nutrients like amino acids, proteins, and vitamins. After processing, key chemical components such as total polyphenols, caffeine, amino acids, and moisture are critical for quality control in final tea products. These compounds primarily contribute to the distinct strong, astringent, bitter, and fresh flavors of tea infusions. The measurement of chemical composition is a kind of indispensable and vital approach for determining and evaluating the internal quality of tea. The past few decades have witnessed a surge in research efforts to implement imaging and spectroscopy technologies for their ability to provide non-destructive and rapid analysis of tea processing and internal quality monitoring. The evaluation of tea quality by various non-destructive methods is presented in Table 2. In the next section, we will introduce imaging and spectroscopy to detect the internal attribute of teas. The internal quality assessment of tea samples is often achieved based on spectroscopy and spectral imaging techniques. The established models usually take spectral features as input information. However, these technologies often acquire feature information in the form of diffuse reflection, and the penetration ability for piled tea leaves is relatively weak. Further optimization is still needed in the direction of software algorithms or hardware equipment.

4.2.1. Total Polyphenols Content

The polyphenol content in tea has attracted considerable attention of consumers due to its beneficial medicinal properties. Growing evidence demonstrates that the total polyphenols (TP) present in tea can offer potential health benefits to consumers. Recent research has suggested that antioxidants within polyphenol compounds may play a significant role in providing protection against certain cancers, including chronic gastritis and cardiovascular disease. In addition, polyphenols contents govern the astringency taste and special flavor of the tea. Thus, the total polyphenols of tea have been regarded as a primary quality parameter of tea [187]. Generally, tea polyphenols include flavonoids, catechins, tannins, and theaflavins. In recent decades, many imaging and spectroscopy methods have been employed as a replacement of time-consuming chemical methods to determine total polyphenol content in tea [188,189,190,191].
Chen et al. [192] systematically evaluated the viability of NIR combined with multivariate calibration methods for non-destructive quantification of polyphenolic compounds in green tea. Their study implemented a comparative framework to assess PLS, interval PLS (iPLS), and synergy interval PLS (siPLS), analyzing their predictive accuracy in NIR-based quantitative analysis of polyphenol concentrations of tea. Experimental validation confirmed that NIR coupled with optimized multivariate calibration models facilitates precise quantification of tea polyphenols. When comparing PLS, iPLS, and siPLS algorithms, iPLS demonstrated the lowest performance, while siPLS achieved the optimal results. The best-performing calibration model achieved an R p value of 0.9583 and an RMSEP of 0.7327 in the prediction set. Empirical evidence confirmed the efficacy of siPLS-optimized NIR spectral analysis for measuring polyphenols in green tea, with siPLS outperforming other multivariate calibration approaches. It is evident that NIR combined with the siPLS algorithm enables rapid and simultaneous analysis of multiple tea components, offering real-time, on-site measurements that greatly enhance quality control and assurance efficiency. Li et al. [193] conducted a systematic investigation into the application of infrared spectroscopy combined with data mining approaches for quantifying the tea polyphenols across 14 genetically diverse cultivars of tea trees. Distinct from prior studies, this research expanded both the sample size and the variety of cultivars, ensuring a more representative dataset. In light of the excellent performance demonstrated by the previously mentioned models, we conducted a comparative analysis of three algorithms, including the PLS regression, the iPLS regression, and the backward interval PLS (biPLS), for building tea polyphenol determination models. The modeling results revealed that the biPLS-based model, utilizing optimal subinterval selection (2452-dimensional wavenumbers), was superior to other models. The best-performing regression model achieved a high validation correlation of 0.9059 and a low RMSE of 1.0277. Based on the optimal subinterval selection from biPLS, the random frog method was utilized to further identify characteristic wavenumbers. As a result, the tea polyphenol determination model, utilizing 18 characteristic wavenumbers extracted from the 7355-dimensional full spectrum, achieved results comparable to those of the full spectral model. Wang et al. [5] engineered a hybrid analytical methodology integrating NIR, UV-Vis, and chemometric algorithms to achieve simultaneous varietal authentication and total polyphenolic quantification across five green tea cultivars. Several spectral processing methods, such as SNV, MSC, Svizky–Golay first-derivative (FD), and moving window smoothing, were utilized to enhance the quality of spectra. It was concluded that SNV was selected as the optimal spectral preprocessing method compared with the model efficiency estimation in PLS model. Likewise, there were also investigations on NIR coupled with differing spectra preprocessing, wavelength selection, and calibration method used to determine the TP contents, amino acids contents, etc., in teas [194,195,196]. In summary, NIR combined with chemometric modeling offers a rapid method for determining key chemical components and distinguishing tea varieties, demonstrating significant potential for widespread industrial application.
The results ( R c , R p , RMSEC, and RMSEP are 0.9731, 0.9563, 0.2107, and 0.2676, respectively) suggested that the predictive model by the MSI system applying the PLS algorithm was an optimal method for non-destructive and rapid determination of TP content in tea leaves. The LS-SVM and backpropagation neural network (BP-NN) models were employed to assess the efficacy of MSI for chronological classification of tea leaves based on storage period (the year of 2004, 2007, 2011, 2012, and 2013), achieving classification accuracies of 95.0% and 97.5%. These findings demonstrated that MSI combined with an appropriate analysis model is a highly promising non-destructive approach for determining TP content and classifying storage periods of tea leaves [189]. Bian et al. [197] explored the potential of HSI technology for predicting TP content as a key indicator of tea quality at the canopy level. They presented a novel integrated method involving SPA as a wavelength selection method and an ANN algorithm as the calibration model to detect the concentration of TP for one tea variety, to explore the model complex non-linearity relationships between wavebands and bio-chemicals variables. Overall, the successful chemical estimation from canopy spectra, derived through the methodology described in this study, demonstrated the feasibility of hyperspectral remote sensing technology for non-destructive and quantitative determination of tea quality at landscape or regional scales prior to tea leaf plucking. Likewise, the field hyperspectral data was cited to estimate the TP of Deha tea in Dutta et al.’s study [198]. The PLS regression of first derivative reflectance was the most accurate ( R p = 0.90 and RMSEP = 0.0014) among all the multivariate analysis for predicting the TP of fresh tea leaves. There was other research on the quantitative evaluation of total polyphenol content of tea samples using imaging and spectroscopy technology [144,199,200,201,202,203,204,205,206,207,208].

4.2.2. Amino Acids Content

Amino acid, as one of the most vital chemical components in tea and a main contributor to the brisk and fresh taste of the liquid, serves as the foundation for aroma formation. It contributes to its fresh taste and quality while also offering essential health benefits as vital human nutrients. The decrease in amino acid content can lead to the deterioration of the fresh taste, while an adequate reduction in amino acids not only produces no significant effect on the taste but also improves the aroma and brisk taste of tea. Contemporary scholarly investigations extensively document the application of FT-NIR combined with a PLS algorithm as an effective method for measuring amino acid content in tea. Guo [209] evaluated the total free amino acid content in green tea using NIR combined with multivariate calibration. The study compared the predictive accuracy of backpropagation neural networks (BP-NN) and PLS regression analysis for estimating total free amino acid levels in green tea. The results demonstrated that, in terms of predictive capability, the optimal BP-NN model ( R p = 0.958 and RMSEP = 0.246) outperformed the optimal PLS model ( R p = 0.925 and RMSEP = 0.323). This indicated that NIR combined with BP-NN holds significant potential for the quantitative analysis and monitoring of free AAC in green tea. The study of Ai et al. [100] investigated the feasibility of using NIR combined with synergy interval PLS (siPLS) algorithms to determine the ratio of TP content to amino acid content in green tea infusions. The SNV algorithm was first employed to preprocess the original spectra of tea infusion, subsequently, the siPLS algorithms were utilized as the wavelength selection approach to pick out the effective spectral ranges from the preprocessed spectra. The optimal PLS model was obtained with the RMSEP of 0.316 and R p of 0.8727 in the prediction set, which suggested that siPLS is a powerful tool for the variable selection to determinate the ration of tea polyphenols to amino acids in green tea infusion. In conclusion, these works of the literature revealed that NIR is effective for measuring key chemical components in a wide variety of teas [100]. Bian et al. [197] utilized reflectance spectroscopy to quantify amino acids, TP, and soluble sugars, while systematically evaluating the accuracy of tea quality assessments at three distinct levels (powder, leaf, and canopy) using 48 sample observations. At the powder level, the average R p values in the prediction sets were 0.94 for polyphenols, 0.90 for amino acids, and 0.88 for soluble sugars, with relative RMSEP values (RMSEP/mean) of 5.47%, 5.50%, and 2.75%, respectively. As for the leaf level, the average R p values ranged from 0.68 to 0.90, and the relative RMSEP values varied between 4.46% and 7.09%. Compared to the results obtained at the leaf level, the canopy spectra provided slightly higher accuracy, yielding average R p values of 0.91, 0.88, and 0.75, along with relative RMSEP values of 6.79%, 5.73%, and 4.03% for polyphenols, amino acids, and sugars, respectively. These findings suggest that the prediction accuracies achieved at the canopy level are valuable for future research on tea quality assessment at the landscape scale using airborne and space-borne sensors. There was numerous literature about the assessment of amino acid in tea, which demonstrated that NIR integrated with chemometric tools serves as an efficient and rapid method for evaluating the primary chemical components of tea.
As an objective and non-destructive technology, HSI can also be applied to measure the amino acid of tea. In the research conducted by Yang et al. [210], a new procedure was proposed (Figure 5), which combines spectral and textural features from hyperspectral images to predict the free amino acid concentration in yellow tea. To facilitate exploration and comparison, hyperspectral images of 150 yellow tea samples were acquired and analyzed. Prediction models using genetic algorithm-support vector regression (GA-SVR) were developed by combining different data fusions of spectral features (spectral features at 944, 955, 1112, 1473, 1687 nm extracted using the SPA method) and textural features (angular second moment, entropy, correlation, contrast, and homogeneity features derived from GLCM). After conducting analysis and comparison, it was observed that the full-wavelength-based GA-SVR model, along with the feature wavelength-based GA-SVR model, performed exceptionally well in predicting free amino acids, achieving an R p of 0.83 and an RMSEP of 18.81%. The results demonstrated that better prediction efforts were obtained to measure the AAC of yellow tea by using HSI. In addition, it indicated that data fusion can facilitate HSI ability for the prediction of AACs in yellow tea. Some similar studies, which evaluated the amino acid content of tea samples based on imaging and spectroscopy technology, are displayed in Table 2 [68,147,211,212,213,214,215,216,217,218].

4.2.3. Caffeine Content

Caffeine in tea, which is famous for its stimulative effect, has been recognized as a crucial quality factor in tea leaves. It varies in commercial specimens from 2.5% to 5.5% of the dry matter in tea leaves. In contrast to the catechins in polyphenols, caffeine can noticeably enhance tea flavor and is therefore subject to intense scrutiny. The feasibility of applying NIR as an effective analysis approach to the qualitative and quantitative assessment of green tea quality was discussed by Chen et al. [219]. This paper proposed the use of the soft independent modeling of class analogy (SIMCA) method for the rapid identification of tea varieties (Longjing, Biluochun, Qihong, and Tieguanyin), while PLS calibration models with 3PLS factors under SNV preprocess were applied to predict the content of caffeine and TP in tea. The experimental results ( R p = 0.9688, RMSEP = 0.0836% for the caffeine) suggested that NIR combined with multivariate calibration can serve as an efficient method to quickly identify tea varieties and simultaneously determine both TP and caffeine content in teas. The study by Ren et al. [220] utilized PLS calibration models to predict the levels of caffeine, free amino acids, moisture, and TP, and introduced a new factorization method to trace black tea samples from various geographical origins. In the calibration set, the RMSEP and R p for free caffeine in teas were 0.102% and 0.983, while in the prediction set, the RMSEV and R for free amino acids were 0.160% and 0.955, which demonstrated that NIR with chemometric tools is an effective approach to assess the caffeine concentration of black tea. In addition, the study of Sinija and Mishra [221] validated the FT-NIR method to estimate the caffeine recovery in instant green tea and granules. The results acquired through FT-NIR were compared with those acquired by the conventional UV spectroscopy method. It was found that the results obtained through FT-NIR prediction were slightly more successful than those obtained by UV spectroscopy method. To date, there are many other studies investigating NIR application to estimate the caffeine of tea leaves [222], which concluded that spectroscopy combined with the chemometrics method (PLS, biPLS, siPLS, MLR, etc.) was able to be successfully utilized for the quantification of various chemical components, such as CCs in tea. In addition, various preprocessing methods were discussed and prepared to establish the calibration model for the prediction of caffeine in different teas. Compared with routine analytical methods, proton nuclear MR (1H-NMR) spectroscopy has been extensively proved as a more attractive technique which could not only qualitatively but also quantitatively obtain information for a wider range of chemical metabolites with simple sample preparation and fast acquisitions, yet without a further time-consuming purification process [223]. To the best of our knowledge, a few studies also focused on the application of high-resolution proton nuclear MR (1H-NMR) spectroscopy to evaluate the quality of tea. Gall et al. [224] united the 1H-NMR spectroscopy with chemometrics and univariate statistics to analyze a set of 191 green teas from diverse countries. The study revealed that 1H-NMR spectroscopy was capable of simultaneously analyzing the chemical components, like amino acid, caffeine, etc., from a single green tea extract. Subsequently, 1H-NMR spectroscopy was utilized for the simultaneous quantification of caffeine, amino acids, and other components in nine lots of commercial green tea samples for the first time, based on the comprehensive metabolic fingerprinting reported in Yuan et al.’s study [225]. The findings indicated that 1H-NMR spectroscopy can be employed as a highly accurate and robust tool for rapid quality assessment of green tea. Overall, following comprehensive spectral assignment, 1H-NMR spectroscopy was confirmed to provide abundant information about the main metabolites of the teas under investigation. Additionally, HSI technology has also been shown to be an efficient approach for evaluating tea sample quality, particularly for the quantitative assessment of caffeine content. Yang et al. [210] discussed the changes and influencing factors of key endoplasmic components at different time points of stacking fermentation samples. Subsequently, some intelligent algorithms were applied to establish the quantitative prediction models of key internal quality for fermentation leaves. The results showed that the random forest (RF) model displayed the best performance for theafuscin, thearubigin, catechin, caffeine, and soluble sugar, with the RPD values of 3.40, 2.21, 5.71, 1.46, and 2.89, respectively. The SVM model showed the best performance for theaffavin and TP/FAA, with the RPD values of 3.78 and 2.91, respectively. Importantly, the visualization process of these key components was successfully displayed [210]. Some other related studies, which evaluated the caffeine content of tea using imaging and spectroscopy technology, are presented in Table 2 [68,198,206,214,221,224,226,227,228,229,230,231,232,233,234].

4.2.4. Moisture Content

Chinese green tea processing is essentially a process of dehydrating fresh leaves. Thus, changes in the MC of tea leaves during these procedures will directly affect the content of tea quality ingredients, finally affecting the sensory quality of the product. The BP-MLP and RBF neural networks methods were adopted in Zhu et al. [7] for establishing the sensory quality prediction model of needle green tea via the estimation of changes in tea leaves temperature, MC, etc., as well as a sensory quality evaluation model via image information technology. The overall results ( R p of 0.962) suggested that the two prediction models built by the tea leaves temperature and MCs are able to effectively evaluate and predict the sensory quality of needle green tea. Additionally, the RBF model showed significantly higher accuracy as a prediction model, lowering the relative error from 0.204 to 0.006 compared to the BP-MLP neural network. The effects of the MC of tea on Vis-NIR were investigated by integrating WT and multivariate analysis in the research of Li et al. [235] The prediction models developed through PLS, MLR, and LS-SVM regression algorithms were investigated and compared, concluding that the MLR model gave the optimal result. The overall findings suggested that the Vis-NIR of tea is strongly influenced by MC, and it is possible to predict the MC of tea on the basis of Vis-NIR with the conjunction of WT and multivariate analysis. Sinija and Mishra [221] developed a rapid and simple FT-NIR procedure to estimate the amount of MC in green tea granules using a single calibration model. For a model developed to predict MC, the maximum coefficient of determination reached 0.997 and the RMSECV value was 0.83. The performance of the developed method was validated using freshly prepared samples, and the MC values obtained by this method showed no significant differences from those measured by the gravimetric method or moisture analyzer. Additionally, the time required for each measurement ranged from 5 to 10 s. This method can be directly adopted by industries to determine the MC of green tea samples at various drying stages to check if drying is complete, as well as during packaging or storage without destroying the sample. Subsequently, Dai et al. [88] presented a methodology by applying NIR and PLS regression coupled with the SPA for interval selection (SPA-iPLS) to measure the content of moisture and TP contents in commercial tea samples. They applied two varying preprocessing methods of SNV and MSC to the full spectra. The best result with the smallest RMSEP (0.599 mg/kg) and the highest R p   ( 0.966 ) were acquired by applying MSC/10-SPA-iPLS for determining of TP content. The best result with the smallest RMSEP (0.32 mg/kg) and the highest R p   ( 0.970 ) were acquired by applying MSC/10-SPA-iPLS for determining MC. The research above concludes that NIR combined with various chemometric methods is a promising tool for monitoring tea quality.
To address the limitations of traditional MC detection methods, Liang et al. [236] developed a computer vision-based non-destructive testing method for detecting the MC of withered leaves. The flowchart for image acquisition and data analysis in this paper is shown in Figure 6a. Firstly, color and texture features were extracted by analyzing the spatial variations in colors over time using a computer vision system that captured visible-light images of tea leaf surfaces. Subsequently, quantitative prediction models for MC detection of tea leaves were developed through linear PLS and non-linear SVM algorithms. Depicted as Figure 6b, the correlation coefficients between the MCs and G, L*, and uniformity were higher than 0.8, revealing that the extracted characteristics possess a powerful potential to evaluate the MCs. Compared with the linear modeling algorithm (the performance parameters of R p and RMSEP are 0.8349 and 0.0607, shown in Figure 6d), the non-linear modeling algorithm (the performance parameters as R p and RMSEP are 0.9314 and 0.0411, shown in Figure 6c) can better describe the quantitative association relations between the image and MC [236]. Dong et al. [237] used HSI as a rapid technique to predict the MC of green tea. The textures of tea leaves were described through a three-dimensional Gabor Filter and its corresponding filter bank. The overall metrics indicated that combining the texture features extracted from the hyperspectral image and spectral data facilitated PLS regression modeling predicting the MC of green tea. In addition, the study of Xie et al. [140] was carried out to explore the feasibility of utilizing time-series HSI technology, over the spectral range of 380 nm to 1030 nm, to detect MC in tea leaves during drying periods. The best performance model was the SPA-PLS regression model based on the four wavelengths suggested by SPA, finally obtaining R p and RMSEP of 0.973 and 0.052. Later, the work of Yu et al. [89] demonstrated that his, as a promising technology, could achieve the aim of mapping the spatial distribution of MC in tea buds during the drying process. The spatial variation in MC could provide significant information for the optimization of tea processing techniques and apply a method to kinetic analysis of MC in the drying process. These works of literature above showed that HSI technology could be a suitable alternative approach for determining the MC in tea leaves at varying drying processes. In addition, some similar studies predicted that the moisture content of tea leaves, based on imaging and spectroscopy technology, are demonstrated in Table 2 [106,151,237,238,239,240,241,242,243,244,245,246,247,248,249,250].
Table 2. Assessment of tea quality by using different non-destructive techniques.
Quality IndicesTea CategoriesMethodFeature(s)/Spectra RegionData AnalysisOptimal ResultReferences
TPGreen teaNIR1000–2500 nmMSC, SNV, PLS, iPLS, siPLS R p = 0.9583, RMSEP = 0.7327[136]
TPBlack, green, oolong, Kamairi, Pu’er, Houji, and Sunrouge teas, tea extracts.VIS-NIRS400–2498 nmSNV, PLS, SG-2DR = 0.96[204]
TP, antioxidant activity (AA)Black tea, oolong tea, green tea, and green tea powder (matcha)Synchronous fluorescence spectroscopy (SFS)350–750 nmPLSR2 > 0.86[200]
TPGreen tea beveragespaper-based colorimetric biosensorColorscanometric methodRSD = 3.11%[201]
TPGreen teaMIR1282–28571 nmMSC, SNV, iPLS, biPLS, RF, PLS R p = 0.9059, RMSEP = 1.0277[193]
TPGreen teaUV-Vis spectroscopy, NIR200–800 nm, 1000–2500 nmSNV, RF, PCA, PLS R p = 0.9983, RMSEP = 0.2693[5]
TP, MCBlack teaVis, NIR350–2500 nmSNV, FD, PLS R p = 0.89, RMSEP = 0.54 for TP;
R p = 0.96, RMSEP = 0.11 for MC
[194]
TP, caffeine, FAAPost-fermented tea, black tea, oolong tea, green teaNIR1000–2500 nmS-G smoothing, MSC, RF, CARS, PLS, R p = 0.997, RMSEP = 0.595 for TP;
R p = 0.99, RMSEP = 0.07 for caffeine;
R p = 0.996, RMSEP = 0.063 for FAA
[195]
TPWhite teaHSI350–2500 nmSPA, PLS, ANN R p = 0.91, RMSEP = 0.004[197]
TP, FAA, etc.Green teaNIR1000–2500 nmMSC, Centering, PLS, PCA, siPLS R p = 0.90, RMSEP = 0.242%[196]
TPOolong teaMSI800–2500 nmSNV, LS-SVM, BPNN, PCA R p = 0.96, RMSEP = 0.27 for tea power; R p = 0.90, RMSEP = 0.54 for tea power; total classification accuracy = 97.5%[189]
TPGreen teaVis, NIR347–2506 nmS-G smoothing, PCA, MLR, PLS R p = 0.90, RMSEP = 1.39[192]
TPPu-erh teaNIRS900–1700 nmSNV, CARS, PLSRPD = 2.372[203]
TP, catechinBlack teaComputer vision
NIRS
Color
900–1700 nm
CARS, Pearson correlation analysis, PLSRPD = 5.41 for TP
RPD = 4.03 for catechin
[188]
TPGreen, white, yellow, oolong, black, and dark teaHSI900–1700 nmPLSRPD = 3.34 for TP[205]
TPGreen teaComputer vision
Color sensitive sensor
ColorACO, ELMRp = 0.8035 for TP[202]
TP, AAC, TP/ACCPostharvest fresh tea leavesNIRS900–1700 nmSNV, 1D, 2D, GA, CARS, IVSO, PLSRPD = 2.24 for TP
RPD = 2.43 for AAC
RPD = 2.42 for TP/AAC
[216]
TP, FAA, TP/FAAMatchaNIRS4000 to 10,000 cm−1SNV, MSC, 1D, 2D, S-G-M, SPA, GA, SA, Si-PLSRp > 0.97 for TP
Rp > 0.98 for FAA
Rp > 0.98 for TP/FAA
[211]
TP, FAADark teaHSI387–1035 nmSG, MSC, SNV, PCA, Adaboost, GBDT, SVM100% for tea grade
RPD = 3.646 for TP
RPD = 2.813 for FAA
[212]
TP, MC, caffeine, tea polysaccharidesInstant teaNIRS10,000–4000 cm−1SVR, PLS, BPSORp = 0.9678 for MC
Rp = 0.9757 for caffeine
Rp = 0.7569 for TP
Rp = 0.8185 for tea polysaccharides
[199]
Total catechin, FAA, and chlorophyll a,Dark teaHSI400–1000 nmLS-SVM98.63%
RPD = 11.26 for total catechin
RPD = 4.34 for FAA
RPD = 3.89 for chlorophyll a
[147]
TP, FAA, caffeine, and total sugarFresh tea leavesVIS-NIRS400–2400 nmCWT, VCPA-IRIV, BOSS, VISSA, GA, PLSRp = 0.6891 for TP
Rp = 0.8385 for FAA
Rp = 6810 for caffeine
Rp = 0638 for total sugar
[151]
AACGreen teaNIR1000–2500 nmSNV, MSC, FD, SD, BP-NN, PLS R p = 0.958, RMSEP = 0.246[209]
TP, AACGreen teaNIR1000–2500 nmSNV, siPLS, PLS R p = 0.87, RMSEP = 0.316[100]
TP, AAC, etc.White tea, etc.Vis, NIR350–2500 nmPLS R p = 0.94, 0.90 for TP, AAC at powder level; R p = 0.90, 0.87 for TP, AAC at leaf level; R p = 0.91, 0.88 for TP, AAC at canopy level;[197]
AACYellow teaHSITexture/908–1735 nmS-G smoothing, SPA, GA, SVM, R p = 0.83, RMSEP = 0.188[211]
TP, caffeineGreen teaNIR909–2632 nmSNV, FD, SD, PLS, R p = 0.9299, RMSEP = 1.1138% for TP, R p = 0.9688, RMSEP = 0.0836% for caffeine[217]
N, TP, AACTea canopyMSI450, 555, 660, 720, 750 and 840 nmPLS, SVMR2 = 0.7583 for N
R2 = 0.7533 for TP
R2 = 0.7597 for AAC
[211]
TP, caffeine, FAA, TP/FAA, chlorophyll MatchaHSI400–1000 nmSNV, BOSS, CARS, PLSRp = 0.8077 for caffeine
Rp = 0.7098 for TP
Rp = 0.7942 for FAA
Rp = 0.8314 for TP/FAA
Rp = 0.8473 for chlorophyll
[68]
FAA, caffeineMatchaNIRS Si-PLS, CARS, BOSSRp = 0.8920 for FAA
Rp = 0.8992 for caffeine
[228]
TP, FAA, caffeineBlack teaHSI391–1010 nmSPA, CARS, UVE, SVM, PLS, RFRp = 0.91 for TP
Rp = 0.88 for FAA
Rp = 0.81 for caffeine
[214]
Caffeine, AAC, MC, TPBlack teaFT-NIR800–2500 nmSNV, MSC, min/max normalization, PLS R p = 0.983, 0.977, 0.975, 0.943 for caffeine, MC, TP, AAC; RMSEP = 0.102%, 0.654%, 0.552%, 0.248% for caffeine, MC, TP, AAC[220]
CaffeineGreen teaVis, NIR400–2500 nmSNV, MSC, PLS, R p = 0.98, RMSEP = 1.538[216]
AAC, caffeine, MC,Black teaFT-NIR1000–2500 nmMSC, SNV, siPLS, PLS, GA, CARS, biPLS, R p = 0.9232, 0.9498, 0.8785 for caffeine, AAC, MC; RMSEP = 0.209, 0.214, 1.47 for caffeine, AAC, MC[215]
TP, caffeine, AACGreen, black teaNIR1100–2500 nmMLR, PLS[222]
CaffeineGreen teaNIR1100–2500 nmSNV, FD, SD, PLS R p = 0.96 for the whole leaves; R p = 0.93 for the ground leaves[214]
CaffeineGreen tea1H-NMR spectroscopyPCA,[211]
caffeineGreen teaUV, FT-NIR833–2500 nmFD, SD, PLSthe recovery of caffeine in instant tea: 101.2–103.9% (UV), 98.3–99.8% (FT-NIR); the recovery of caffeine in tea granules: 101.8–104.2% (UV), 97.9–101.1% (FT-NIR);[221]
Caffeine, etc.Green tea1H-NMR spectroscopy R p = 0.9995[212]
Theafuscin, thearubigin, catechin, caffeine, soluble sugar, theaffavin and TP/FAABlack teaHSI400–1000 nmZ-score, MSC, Smooth, 2D, Min-Max, Center, PCA, SPA, VCPA-IRIV, SFLA, CARS, VISSA, MCUVE, VCPA-GA, PLS, SVR, RFRPD = 3.4 for theafuscin
RPD = 2.21 for thearubigin
RPD = 5.71 for catechin
RPD = 1.46 for caffeine
RPD = 2.89 for soluble sugar
RPD = 3.78 for theaffavin
RPD = 2.91 for TP/FAA
[210]
Total catechins, soluble sugar and caffeineBlack teaHSI and electrical properties400–1000 nm
0.02–1000 kHz
CARS, BOSS, MASS, PLS, SVR, RFRp = 0.9978 for total catechins
Rp = 0.9973 for soluble sugar
Rp = 0.9560 for caffeine
[226]
Sensory score, catechins, and caffeineGreen teaFT-NIRS
Colorimeter
3800–12,000 cm−1
Color
S-G, SNV, MSC, CARS BOSS, SPA, PCA, SVRRPD = 2.8 for Sensory score
RPD = 1.6 for catechins
RPD = 2.6 for caffeine
[198]
Sensory score, catechins, and caffeineGreen teaNIRS900–1700 nmPCA, CARS, RF, SVR, VCPA-IRIVRPD = 2.485 for Sensory score
RPD = 2.584 for catechins
RPD = 2.873 for caffeine
[229]
TP, caffeineGreen tea, Black teaFluorescence, medium (MIR), and near (NIR) infrared spectroscopy260–600 nm
4000 to 650 cm−1
8300–4000 cm−1
PSCMRMSE < 5.82 for TP
RMSE < 1.79 for caffeine
[227]
Caffeine, catechins, bitterness, astringencyPu-erh ripen teaNIRS1000–1800 nmPLSRRPD > 2.5[153]
Caffeine, catechinsGreen and Black teaNIRS900–1700 nmSNV, PSO, SVRRPD = 9.83 for catechins
RPD = 2.71 for caffeine
[231]
Bitterness score, astringency score, caffeine, EGCGBlack teaNIRS900–1700 nmCARS, SPA, PLSRPD = 3.07 for bitterness score
RPD = 2.28 for astringency score
RPD = 3.29 for caffeine
RPD = 2.91 for EGCG
[206]
Caffeine, EGCG, MCGreen teaFT-NIR4000 to 10,000 cm−1MSC, SD, SG, FD, ND, NS, PLSp > 0.5[233]
Polyphenol and caffeineGreen teaVIS-NIRS400–2498 nmPCA, SPA, PLS, MLRRp2 > 0.834[221]
Catechin polyphenols, caffeineFresh tea leavesVIS-NIRS400–2498 nmPLS, MLR, CARS, SPAR2 > 0.89[228]
TP, caffeine, MCArgentinean and Sri Lankan black teas and Argentinean green teasMachine visionColorPCA, PLS, DD-SIMCAREP = 6.38% for MC
REP = 9.031% for TP
REP = 14.58% for caffeine
[144]
Caffeine, total ashes, MCYerba mateNIRS1100–2500 nmPLSREP < 6.97%[243]
MCGreen teaComputer visionANN, RBF R p = 0.905[7]
MCGreen teaVis, NIR325–1075 nmWT, PCA, LS-SVM, MLR, PLS R p = 0.86, RMSEP = 0.046[239]
TP, MCUnknownNIR1111–2631 nmSNV, MSC, SPA, PLS R p = 0.966, RMSEP = 0.599 mg/kg for TP; R p = 0.970, RMSEP = 0.32 mg/kg for TP;[233]
MCGreen teaFT-NIR1111–2631 nmFD, PLS[221]
MCFresh tea leavesComputer visionColor, texturePLS, SVM, Random Forest R p = 0.9314, RMSEP = 0.0411[236]
MCGreen teaHSITexture/874.41–1733.91 nmSPA, PCA, PLS R p = 0.9855, RMSEP = 0.0988[230]
MCFresh tea leavesHSI380–1030 nmSPA, PLS, MSC, R p = 0.973, RMSEP = 0.052[140]
MCGreen teaHSI874–1734 nmCARS, PLS, LS-SVM R p = 0.946, RMSEP = 0.0507[89]
MCTea leavesMSI and depth images679, 693, 719, 732, 745, 758, 771, 784, 796, 808, 827, 839, 849, 860, 871, 880, 889, 898, 915, 922, 931, 937, 944, 951, 956 nmLDA, LS-SVR,Rp2 = 0.77 for front surface
Rp2 = 0.68 for back surface
[246]
MCTea leavesVis-NIR350–2500 nm0–2 D, PLS, PCR0.4 or 0.6 D displayed best performance[247]
MCTea leavesVis-NIR220–1100 nmPLS, MSC, PCA, DSRp2 > 0.85[240]
MCBlack teamicro-NIRS900–1700 nmENN, PCARPD = 11.8108[244]
MCGreen teaHSI
NIR
908.15–1735.68 nm
950–1750 nm
DS, PLS, SNVRPD = 2.76[172]
MCBlack teaHSI400–1000 nmSPA, SFLA, PLS, ELMRPD = 1.6 for local region[106]
MCGreen teaMachine vision
NIRS
Color, texture
900–1700 nm
CARS, PLSR, SVRRPD = 4.5[242]
MCTea leavesVIS-NIRS400–1000 nmSPRS, SNV-based Aug-TrAdaBoost.R2, S/B, PLSR2 = 0.9895[241]
MCBlack teaMachine visionColor, texture
Image
PLS, SVR, CNNRPD = 9.5781[238]
MCBlack teaNIRS833–2630 nmDWT, BOSS, GA, PLSR2p = 0.951[248]
MCBlack teaNIRS
Machine vision
900–1700 nm
Color, texture
SFLA, SVR, PCARPD = 5.5596[239]
MC, total nitrogen, crude fiber, quality indexFresh leavesHSI328–1115 nmSPA, PLS, MLR, CARSRPD = 4.0 for MC
RPD = 2.56 for total nitrogen
RPD = 2.31 for crude fiber
RPD = 3.51 for quality index
[245]
MC, roduct qualityPu-erh teaMachine visionImage, Environmental parameters (EP)CNN, NCARPD > 13 for MC in each batch of tea
RPD > 4 for final quality score
[239]
MCBlack teaHSI400–1000 nmSNV, Si-PLS, CARS, ELMRPD = 13.0907[237]

5. Challenges and Future Trends

Tea is one of the most widely consumed non-alcoholic beverages globally, drawing significant interest from consumers due to its distinctive flavor. However, the complex taste quality of tea infusion is the result of the combined action of multiple substances in the tea sample. Generally speaking, the evaluation of tea quality mainly relies on the evaluation factor scoring coefficient method (GB/T 23776-2018 [251]). In addition, the determination of key components in tea samples mainly depends on some precision instruments, such as GC, MS, GC-MS, and HPLC [225,252,253,254,255]. Remarkably, the evaluation factor scoring coefficient method is very subjective and traditional components measurement methods, including GC, MS, GC-MS, and HPLC, are very time-consuming. Compared with traditional detection, non-destructive detection has a significant speed improvement. Meanwhile, non-destructive detection can achieve synchronous detection of multiple indicators. Hence, non-destructive detection strategies based on imaging and spectroscopy technology have been applied to the evaluation of tea quality. Spectroscopy technologies, imaging technologies and spectral imaging methods have been effectively utilized for tea quality evaluation and inspection, as summarized in Table 1 and Table 2. Compared to traditional organoleptic and instrumental methods, imaging and spectroscopy technologies have demonstrated their advantages as non-contact, objective, and cost-effective tools, making them suitable for routine implementation in the tea industry for quality assessment. In recent years, imaging technologies, mainly computer vision, have been extensively adopted for the external quality evaluation of tea and have provided great accuracy. As shown in Table 1, computer vision has become a valuable tool for the inspection of external tea quality and safety because of the merit of high-accuracy and speed and large information capacity. MRI and X-ray imaging techniques may be effective for a large number of works in agriculture, especially for the visual presentation of the internal structure of tea. These technologies can achieve rapid grading and the precise prediction of tea, enhancing the efficiency and accuracy of quality inspection. At the same time, it can optimize resource utilization and reduce production costs. For some small businesses, the emergence of portable spectral devices has made real-time field detection possible, eliminating the need to rely on laboratory equipment and lowering the technical threshold. However, there are also some challenges at present. Most of these technologies are not convenient for small businesses. Despite significant technological advantages, small businesses still have to confront problems such as high equipment costs and insufficient technical training. Their high cost also restricts applications to large enterprises and developed countries only. In addition, the MRI and X-ray imaging techniques can show only the internal structure of the material, not the compositional or nutritional details. Overall, it can be concluded that imaging technology can only provide accuracy in the prediction of external attributes of tea and not provide accurate details of internal attributes.
Spectroscopy technology is a great analytical approach for quantitatively assessing the internal properties or characteristics of tea. A lot of research work has been carried out on the internal quality determination of tea by using NIR in recent decades. NIR spectroscopy is a powerful approach to assess the internal quality of tea such as TP, MC, caffeine, AAC, and other internal contents. However, the drawbacks of NIR spectroscopy cannot be ignored. To some extent, the established model of NIR spectroscopy technique must need a large number of chemical measurements and the accuracy of the analysis results is impressionable to the impact of external factors, such as the reliability of the reference approaches employed and the presentation of sample. Raman spectroscopy is highly useful for evaluating tea quality by monitoring variations in its properties. However, certain limitations, such as the inherently weak Raman scattering effect, higher instrument costs, and heat generation from the laser, may impact its effectiveness in tea quality measurement [256]. MR spectroscopy has been demonstrated to be a robust technology for assessing tea quality, particularly in analyzing chemical oxidation and measuring metabolites. However, due to its high cost and limitations, MR spectroscopy faces challenges in enabling online detection of tea quality changes. With the help of spectroscopy technology, internal quality parameters can be extracted successfully. However, spectroscopy technologies possess certain deficiencies since they are not able to obtain any spatial information about objects.
Although the above technologies have displayed good representation ability for samples in some respects, they still exhibit some limitations. For instance, the computer vison technology could acquire external features including color, texture and shape features of tea samples within a certain field of view. However, this technology exhibits limited penetration capability, making it unsuitable for detecting information from deeper layers of the sample. Compared with computer vision technology, the spectroscopy technology could demonstrate better penetration ability. Nevertheless, the spectroscopy technology could acquire local information of tea samples due to its small field of view. In order to compensate for the limitations of conventional imaging technology and spectroscopy technology, spectral imaging, including HSI and MSI, were developed for the prediction of internal tea quality parameters. Spectral imaging, combining the strengths of both spectroscopy and imaging, holds significant potential for rapid online assessment of tea quality and safety. The spatial features of HSI and MSI facilitate the analysis of complex heterogeneous samples, while their spectral capabilities enable the identification of diverse surface and sub-surface multi-constituent characteristics [257]. However, difficulties exist in generating a hypercube and a large amount of hyperspectral data may lead to the time-consuming process of HSI technology. The limitation of MSI systems may also exist due to the redundancy of data, the detection speed, and the difficulty of selecting effective wavelengths. Additionally, the conventional HSI and MSI techniques have limitations in the analysis of micro substances concerning tea quality. Raman imaging performs measurements at the micro-scale or macro-scale level of tea, overcoming the restrictions of HSI and MSI techniques that are only able to be applied for evaluating substances at macro level. In comparison to traditional techniques, Raman imaging is less destructive, unaffected by water interference, and requires only minimal sample quantities for analysis [60]. Currently, Raman imaging technology is not extensively applied compared with spectroscopy.
Although the application of non-destructive technology in tea quality assessment has broad prospects, its large-scale implementation still faces multiple challenges. Due to the poor universality of the existing models and the lack of unified standards for data formats, large-scale implementation faces obstacles. At the same time, the high investment and maintenance costs of the equipment also need to be taken into consideration. Therefore, to broaden the scope of these imaging and spectroscopy techniques, the technical challenges existing in each imaging and spectroscopy technique should be solved. In order to meet the demand for the low cost and effective prediction of tea quality, imaging and spectroscopy need to be perfected. On the one hand, exploring powerful and novel algorithms for data processing and analysis is a development trend for improving the accuracy of predicting food. On the other hand, it is promising to combine various imaging techniques and spectroscopy techniques. Meanwhile, the portable automatic inspection system is becoming a trend with the increase in electronic components test outdoors and the miniaturization of electronic components.

6. Conclusions

Tea is popular in the global agriculture production field for its fragrant aroma, lipid-lowering, antioxidant, and other health benefits. The physical and chemical quality parameters of tea vary with the cultivar. This review provided a summarized overview of the advanced applications of imaging and spectroscopy for tea quality and safety evaluation, which included imaging techniques such as computer vision, infrared imaging, Raman imaging, X-ray imaging, MR imaging, and fluorescence imaging, spectroscopy techniques like Raman spectroscopy, UV-Vis spectroscopy, fluorescence spectroscopy, and MR spectroscopy, as well as spectral imaging like HSI and MSI. Each of the wide ranges of technology has its own virtues. On the basis of the observed results, it was found that these imaging and spectroscopy technologies have the ability to assess external (color, texture, and shape) and internal attributes (TP, MC, AAC, CC) in various types of tea, including green tea, yellow tea, white tea, oolong tea, black tea, and post-fermented tea. Furthermore, the advantages, technical challenges, and future trends of each imaging and spectroscopy technique were proposed. So far, there have been some practical applications of imaging and spectroscopy technology in tea quality assessment, but there are still some technical difficulties in the process of industrialization and implementation. For instance, in tea processing, rolling machines operate in enclosed environments, and special aroma-developing machines are not only enclosed but also have extremely high internal temperatures, making it difficult for digital information sensing devices to effectively integrate with existing equipment. Furthermore, due to the uneven surface of stacked tea samples, errors are prone to occur during digital information acquisition. Therefore, in future research, we believe that developing flexible digital information devices that can be integrated with closed tea processing equipment and addressing the errors in digital information collection caused by surface unevenness at the algorithmic level, will be important research directions.

Author Contributions

Conceptualization, S.Z. and T.A.; methodology, T.A. and S.Z.; analysis, S.Z.; investigation, S.Z., T.A., H.Z., Y.B., B.Z. and G.T.; resources, H.Z. and B.Z.; data curation, T.A.; writing—original draft preparation, S.Z.; writing—review and editing, S.Z., T.A. and Y.B.; visualization, T.A.; supervision, Y.B. and H.Z.; funding acquisition, B.Z. and G.T. All authors have read and agreed to the published version of the manuscript.

Funding

This work was supported by the National Natural Science Foundation of China (Project no. 32472010), the Jiangsu Agricultural Science and Technology Innovation Fund (JASTIF) (Grant no. CX (24)3027), and the Natural Science Foundation of Jiangsu Province (Grant no. BK20231478).

Conflicts of Interest

The authors declare no conflicts of interest.

References

  1. Achudume, A.C.; Owoeye, D. Quantitative assessment of heavy metals in some tea marketed in Nigeria—Bioaccumulation of heavy metals in tea. Health 2010, 2, 1097–1100. [Google Scholar] [CrossRef]
  2. Bhattacharya, U.; Halder, B.; Mukhopadhyay, S.; Giri, A.K. Role of oxidation-triggered activation of JNK and p38 MAPK in black tea polyphenols induced apoptotic death of A375 cells. Cancer Sci. 2010, 100, 1971–1978. [Google Scholar] [CrossRef] [PubMed]
  3. Halder, B.; Bhattacharya, U.; Mukhopadhyay, S.; Giri, A.K. Molecular mechanism of black tea polyphenols induced apoptosis in human skin cancer cells: Involvement of Bax translocation and mitochondria mediated death cascade. Carcinogenesis 2008, 29, 129–138. [Google Scholar] [CrossRef]
  4. Yang, Z.; Tu, Y.; Xia, H.; Jie, G.; Chen, X.; He, P. Suppression of free-radicals and protection against H2O2-induced oxidative damage in HPF-1 cell by oxidized phenolic compounds present in black tea. Food Chem. 2007, 105, 1349–1356. [Google Scholar] [CrossRef]
  5. Wang, X.; Huang, J.; Fan, W.; Lu, H. Identification of green tea varieties and fast quantification of total polyphenols by near-infrared spectroscopy and ultraviolet-visible spectroscopy with chemometric algorithms. Anal. Methods 2015, 7, 787–792. [Google Scholar] [CrossRef]
  6. Sarımehmet, B.; Pınarbaşı, M.; Alakaş, H.M.; Eren, T. Harvest optimization for sustainable agriculture: The case of tea harvest scheduling. Artif. Intell. Agric. 2023, 10, 35–45. [Google Scholar] [CrossRef]
  7. Zhu, H.; Ye, Y.; He, H.; Dong, C. Evaluation of green tea sensory quality via process characteristics and image information. Food Bioprod. Process. 2017, 102, 116–122. [Google Scholar] [CrossRef]
  8. Sultana, N.; Arayne, M.S.; Ali, S.S.; Sajid, S. Simultaneous determination of olmesartan medoxomil and irbesartan and hydrochlorothiazide in pharmaceutical formulations and human serum using high performance liquid chromatography. Chin. J. Chromatogr. 2008, 26, 544–549. [Google Scholar] [CrossRef]
  9. Wang, L.; Xu, R.; Hu, B.; Li, W.; Sun, Y.; Tu, Y.; Zeng, X. Analysis of free amino acids in Chinese teas and flower of tea plant by high performance liquid chromatography combined with solid-phase extraction. Food Chem. 2010, 123, 1259–1266. [Google Scholar] [CrossRef]
  10. Jumtee, K.; Komura, H.; Bamba, T.; Fukusaki, E. Predication of Japanese green tea (Sen-cha) ranking by volatile profiling using gas chromatography mass spectrometry and multivariate analysis. J. Biosci. Bioeng. 2011, 112, 252–255. [Google Scholar] [CrossRef]
  11. Yang, Y.Q.; Qian, M.C.; Deng, Y.L.; Yuan, H.B.; Jiang, Y.W. Insight into aroma dynamic changes during the whole manufacturing process of chestnut-like aroma green tea by combining GC-E-Nose, GC-IMS, and GC x GC-TOFMS. Food Chem. 2022, 387, 132813. [Google Scholar] [CrossRef] [PubMed]
  12. Izquierdo, P.F.; Delagado, L.C.; Benavides, F.O. An artificial neuronal network coupled with a genetic algorithm to optimise the production of unsaturated fatty acids in Parachlorella kessleri. Artif. Intell. Agric. 2024, 13, 32–44. [Google Scholar]
  13. Baldwin, E.A.; Jinhe, B.; Anne, P.; Sharon, D. Electronic noses and tongues: Applications for the food and pharmaceutical industries. Sensors 2011, 11, 4744–4766. [Google Scholar] [CrossRef] [PubMed]
  14. An, T.; Huang, W.Q.; Tian, X.; Fan, S.X.; Duan, D.D.; Dong, C.W.; Zhao, C.J.; Li, G.L. Hyperspectral imaging technology coupled with human sensory information to evaluate the fermentation degree of black tea. Sens. Actuators B-Chem. 2022, 366, 131994. [Google Scholar] [CrossRef]
  15. Brosnan, T.; Sun, D.W. Inspection and grading of agricultural and food products by computer vision systems—A review. Comput. Electron. Agric. 2002, 36, 193–213. [Google Scholar] [CrossRef]
  16. Yu, X.L.; Sun, D.W.; He, Y. Emerging techniques for determining the quality and safety of tea products: A review. Compr. Rev. Food Sci. Food Saf. 2020, 19, 2613–2638. [Google Scholar] [CrossRef]
  17. Song, F.H.; Lu, X.L.; Lin, Y.Q.; Zhou, Q.Y.; Li, Z.F.; Ling, C.J.; Song, C.F. Evaluation of black tea appearance quality using a segmentation-based feature extraction method. Food Biosci. 2024, 58, 103644. [Google Scholar] [CrossRef]
  18. Sachithra, V.; Subhashini, L. How artificial intelligence uses to achieve the agriculture sustainability: Systematic review. Artif. Intell. Agric. 2023, 8, 46–59. [Google Scholar] [CrossRef]
  19. Rizzo, M.; Marcuzzo, M.; Zangari, A.; Gasparetto, A.; Albarelli, A. Fruit ripeness classification: A survey. Artif. Intell. Agric. 2023, 7, 44–57. [Google Scholar] [CrossRef]
  20. Haralick, R.M.; Shapiro, L.G. Computer and Robot Vision; Addison-Wesley: Reading, MA, USA, 1992; Volume 1. [Google Scholar]
  21. Patel, K.K.; Kar, A.; Jha, S.; Khan, M. Machine vision system: A tool for quality inspection of food and agricultural products. J. Food Sci. Technol. 2012, 49, 123–141. [Google Scholar] [CrossRef]
  22. Elango, V.; Karunamoorthy, L. Effect of lighting conditions in the study of surface roughness by machine vision—An experimental design approach. Int. J. Adv. Manuf. Technol. 2008, 37, 92–103. [Google Scholar] [CrossRef]
  23. Brosnan, T.; Sun, D.W. Improving quality inspection of food products by computer vision—A review. J. Food Eng. 2004, 61, 3–16. [Google Scholar] [CrossRef]
  24. Zhou, J.C.; Li, L.F.; Qadir, A.; Li, H.X.; Lv, J.H.; Shehzad, K.; Xu, X.Y.; Liu, L.X.; Tian, F.; Liu, W.; et al. Charge Sampling Photodetector Based on van der Waals Heterostructures. Adv. Opt. Mater. 2022, 10, 2201442. [Google Scholar] [CrossRef]
  25. Zhu, H.; Yang, L.; Wang, Y.; Wang, Y.; Hou, W.; Rao, Y.; Liu, L. Enhanced detection algorithm for apple bruises using structured light imaging. Artif. Intell. Agric. 2024, 11, 50–60. [Google Scholar] [CrossRef]
  26. Bigas, M.; Cabruja, E.; Forest, J.; Salvi, J. Review of CMOS image sensors. Microelectron. J. 2006, 37, 433–451. [Google Scholar] [CrossRef]
  27. Xiong, Z.; Sun, D.W.; Zeng, X.A.; Xie, A. Recent developments of hyperspectral imaging systems and their applications in detecting quality attributes of red meats: A review. J. Food Eng. 2014, 132, 1–13. [Google Scholar] [CrossRef]
  28. Kotwaliwale, N.; Singh, K.; Kalne, A.; Jha, S.N.; Seth, N.; Kar, A. X-ray imaging methods for internal quality evaluation of agricultural produce. J. Food Sci. Technol. 2014, 51, 1–15. [Google Scholar] [CrossRef]
  29. Xiong, Z.; Sun, D.W.; Pu, H.; Gao, W.; Dai, Q. Applications of emerging imaging techniques for meat quality and safety detection and evaluation: A review. Crit. Rev. Food Sci. Nutr. 2017, 57, 755–768. [Google Scholar] [CrossRef]
  30. Khazem, S.; Richard, A.; Fix, J.; Pradalier, C. Deep learning for the detection of semantic features in tree X-ray CT scans. Artif. Intell. Agric. 2023, 7, 13–26. [Google Scholar] [CrossRef]
  31. Navajas, E.A.; Lambe, N.R.; Mclean, K.A.; Glasbey, C.A.; Fisher, A.V.; Charteris, A.J.L.; Bünger, L.; Simm, G. Accuracy of in vivo muscularity indices measured by computed tomography and their association with carcass quality in lambs. Meat Sci. 2007, 75, 533–542. [Google Scholar] [CrossRef]
  32. Mathiassen, J.R.; Misimi, E.; Bondø, M.; Veliyulin, E.; Østvik, S.O. Trends in application of imaging technologies to inspection of fish and fish products. Trends Food Sci. Technol. 2011, 22, 257–275. [Google Scholar] [CrossRef]
  33. Antequera, T.; Caballero, D.; Grassi, S.; Uttaro, B.; Perez-Palacios, T. Evaluation of fresh meat quality by Hyperspectral Imaging (HSI), Nuclear Magnetic Resonance (NMR) and Magnetic Resonance Imaging (MRI): A review. Meat Sci. 2021, 172, 108340. [Google Scholar] [CrossRef] [PubMed]
  34. Bushong, S.C.; Clarke, G. Magnetic Resonance Imaging-E-Book: Physical and Biological Principles; Elsevier Health Sciences: Amsterdam, The Netherlands, 2013. [Google Scholar]
  35. Abbasi, R.; Martinez, P.; Ahmad, R. Estimation of morphological traits of foliage and effective plant spacing in NFT-based aquaponics system. Artif. Intell. Agric. 2023, 9, 76–88. [Google Scholar] [CrossRef]
  36. Abbasi, R.; Martinez, P.; Ahmad, R. Crop diagnostic system: A robust disease detection and management system for leafy green crops grown in an aquaponics facility. Artif. Intell. Agric. 2023, 10, 1–12. [Google Scholar] [CrossRef]
  37. Thybo, A.K.; Szczypiński, P.M.; Karlsson, A.H.; Dønstrup, S.; Stødkilde-Jørgensen, H.S.; Andersen, H.J. Prediction of sensory texture quality attributes of cooked potatoes by NMR-imaging (MRI) of raw potatoes in combination with different image analysis methods. J. Food Eng. 2004, 61, 91–100. [Google Scholar] [CrossRef]
  38. Shaarani, S.M.; Cardenas-Blanco, A.; Amin, M.G.; Soon, N.G.; Hall, L.D. Monitoring Development and Ripeness of Oil Palm Fruit (Elaeis guneensis) by MRI and Bulk NMR. Int. J. Agric. Biol. 2010, 12, 1560–8530. [Google Scholar]
  39. Ozel, B.; Oztop, M.H. A quick look to the use of time domain nuclear magnetic resonance relaxometry and magnetic resonance imaging for food quality applications. Curr. Opin. Food Sci. 2021, 41, 122–129. [Google Scholar] [CrossRef]
  40. Qiu, Z.J.; Bian, Y.L.; Wang, F.Y.; Huang, T.; Wang, Z.P. A novel method for detection of internal quality of walnut kernels using low-field magnetic resonance imaging. Comput. Electron. Agric. 2024, 217, 108546. [Google Scholar] [CrossRef]
  41. Juwono, F.H.; Wong, W.; Verma, S.; Shekhawat, N.; Lease, B.A.; Apriono, C. Machine learning for weed–plant discrimination in agriculture 5.0: An in-depth review. Artif. Intell. Agric. 2023, 10, 13–25. [Google Scholar] [CrossRef]
  42. Ives, J.; Warach, S.; Schmitt, F.; Edelman, R.; Schomer, D. Monitoring the patient’s EEG during echo planar MRI. Electroencephalogr. Clin. Neurophysiol. 1993, 87, 417–420. [Google Scholar] [CrossRef]
  43. Clark, C.J.; Hockings, P.D.; Joyce, D.C.; Mazucco, R.A. Application of magnetic resonance imaging to pre- and post-harvest studies of fruits and vegetables. Postharvest Biol. Technol. 1997, 11, 1–21. [Google Scholar] [CrossRef]
  44. Schmidt, S.J.; Sun, X.; Litchfield, J.B. Applications of magnetic resonance imaging in food science. Crit. Rev. Food Sci. Nutr. 1996, 36, 29. [Google Scholar] [CrossRef] [PubMed]
  45. Zeng, F.Y.; Shao, W.D.; Kang, J.M.; Yang, J.X.; Zhang, X.; Liu, Y.; Wang, H.H. Detection of moisture content in salted sea cucumbers by hyperspectral and low field nuclear magnetic resonance based on deep learning network framework. Food Res. Int. 2022, 156, 111174. [Google Scholar] [CrossRef] [PubMed]
  46. Adhinata, F.D.; Sumiharto, R. A comprehensive survey on weed and crop classification using machine learning and deep learning. Artif. Intell. Agric. 2024, 13, 45–63. [Google Scholar] [CrossRef]
  47. Cheng, J.-H.; Dai, Q.; Sun, D.-W.; Zeng, X.-A.; Liu, D.; Pu, H.-B. Applications of non-destructive spectroscopic techniques for fish quality and safety evaluation and inspection. Trends Food Sci. Technol. 2013, 34, 18–31. [Google Scholar] [CrossRef]
  48. Karoui, R.; Blecker, C. Fluorescence Spectroscopy Measurement for Quality Assessment of Food Systems—A Review. Food Bioprocess Technol. 2011, 4, 364–386. [Google Scholar] [CrossRef]
  49. Miao, L.M.; Ren, K.Y.; Feng, J.L.; Dong, H.X.; Wang, H.; Tong, X.H.; Jiang, L.Z. Effects of fibrillation combined with glycation by different chain length sugars on structural and functional properties of soybean protein. Food Hydrocoll. 2024, 153, 110026. [Google Scholar] [CrossRef]
  50. Sasic, S.; Ozaki, Y. Raman, Infrared, and Near-Infrared Chemical Imaging; John Wiley & Sons: Hoboken, NJ, USA, 2011. [Google Scholar]
  51. Qu, C.; Li, Y.Z.; Du, S.S.; Geng, Y.C.; Su, M.K.; Liu, H.L. Raman spectroscopy for rapid fingerprint analysis of meat quality and security: Principles, progress and prospects. Food Res. Int. 2022, 161, 111805. [Google Scholar] [CrossRef]
  52. Liu, H.; Ren, Y.; Chu, H.; Shan, H.; Wong, K.W. A fuzzy risk assessment model used for assessing the introduction of African swine fever into Australia from overseas. Artif. Intell. Agric. 2023, 7, 27–34. [Google Scholar] [CrossRef]
  53. Houetohossou, S.C.A.; Houndji, V.R.; Hounmenou, C.G.; Sikirou, R.; Kakaï, R.L.G. Deep learning methods for biotic and abiotic stresses detection and classification in fruits and vegetables: State of the art and perspectives. Artif. Intell. Agric. 2023, 9, 46–60. [Google Scholar] [CrossRef]
  54. Ditcharoen, S.; Sirisomboon, P.; Saengprachatanarug, K.; Phuphaphud, A.; Rittiron, R.; Terdwongworakul, A.; Malai, C.; Saenphon, C.; Panduangnate, L.; Posom, J. Improving the non-destructive maturity classification model for durian fruit using near-infrared spectroscopy. Artif. Intell. Agric. 2023, 7, 35–43. [Google Scholar] [CrossRef]
  55. Yaseen, T.; Sun, D.W.; Cheng, J.H. Raman imaging for food quality and safety evaluation: Fundamentals and applications. Trends Food Sci. Technol. 2017, 62, 177–189. [Google Scholar] [CrossRef]
  56. Silva, R.; Melo-Pinto, P. t-SNE: A study on reducing the dimensionality of hyperspectral data for the regression problem of estimating oenological parameters. Artif. Intell. Agric. 2023, 7, 58–68. [Google Scholar] [CrossRef]
  57. Razavi, M.A.; Nejadhashemi, A.P.; Majidi, B.; Razavi, H.S.; Kpodo, J.; Eeswaran, R.; Ciampitti, I.; Prasad, P.V. Enhancing crop yield prediction in Senegal using advanced machine learning techniques and synthetic data. Artif. Intell. Agric. 2024, 14, 99–114. [Google Scholar] [CrossRef]
  58. He, H.J.; Sun, D.W. Hyperspectral imaging technology for rapid detection of various microbial contaminants in agricultural and food products. Trends Food Sci. Technol. 2015, 46, 99–109. [Google Scholar] [CrossRef]
  59. Suárez, P.L.; Velesaca, H.O.; Carpio, D.; Sappa, A.D. Corn kernel classification from few training samples. Artif. Intell. Agric. 2023, 9, 89–99. [Google Scholar] [CrossRef]
  60. Herrero, A.M. Raman spectroscopy for monitoring protein structure in muscle food systems. Crit. Rev. Food Sci. Nutr. 2008, 48, 512–523. [Google Scholar] [CrossRef]
  61. Wang, Y.J.; Liu, Y.; Chen, Y.Y.; Cui, Q.Q.; Li, L.Q.; Ning, J.M.; Zhang, Z.Z. Spatial distribution of total polyphenols in multi-type of tea using near-infrared hyperspectral imaging. LWT-Food Sci. Technol. 2021, 148, 111737. [Google Scholar] [CrossRef]
  62. Huang, L.; Zhao, J.; Chen, Q.; Zhang, Y. Nondestructive measurement of total volatile basic nitrogen (TVB-N) in pork meat by integrating near infrared spectroscopy, computer vision and electronic nose techniques. Food Chem. 2014, 145, 228–236. [Google Scholar] [CrossRef]
  63. Badaró, A.T.; Tavares, J.; Blasco, J.; Aleixos-Borrás, N.; Barbin, D.F. Near infrared techniques applied to analysis of wheat-based products: Recent advances and future trends. Food Control 2022, 140, 109115. [Google Scholar] [CrossRef]
  64. Zhang, L.H.; Zhang, M.; Mujumdar, A.S. Technological innovations or advancement in detecting frozen and thawed meat quality: A review. Crit. Rev. Food Sci. Nutr. 2023, 63, 1483–1499. [Google Scholar] [CrossRef] [PubMed]
  65. Tkachenko, N.V. Optical Spectroscopy Methods and Instrumentations; Elsevier: Amsterdam, The Netherlands, 2006. [Google Scholar]
  66. Esslinger, S.; Riedl, J.; Fauhl-Hassek, C. Potential and limitations of non-targeted fingerprinting for authentication of food in official control. Food Res. Int. 2014, 60, 189–204. [Google Scholar] [CrossRef]
  67. Jin, S.; Li, M.J.; Liu, Z.Q.; Liu, R.H.; Li, Y.C.; Zhu, Y.Y.; Yuan, Y.W.; Li, P.C.; Li, P.M.; Chen, C.M.; et al. Study on the correlation between color and taste of beauty tea infusion and the pivotal contributing compounds based on UV-visible spectroscopy, taste equivalent quantification and metabolite analysis. Food Chem.-X 2024, 21, 101192. [Google Scholar] [CrossRef]
  68. Zhang, H.L.; Zhan, B.S.; Pan, F.; Luo, W. Determination of soluble solids content in oranges using visible and near infrared full transmittance hyperspectral imaging with comparative analysis of models. Postharvest Biol. Technol. 2020, 163, 111148. [Google Scholar] [CrossRef]
  69. Ouyang, Q.; Wang, L.; Park, B.; Kang, R.; Chen, Q.S. Simultaneous quantification of chemical constituents in matcha with visible-near infrared hyperspectral imaging technology. Food Chem. 2021, 350, 129141. [Google Scholar] [CrossRef]
  70. Barbin, D.F.; Elmasry, G.; Sun, D.W.; Allen, P.; Morsy, N. Non-destructive assessment of microbial contamination in porcine meat using NIR hyperspectral imaging. Innov. Food Sci. Emerg. Technol. 2013, 17, 180–191. [Google Scholar] [CrossRef]
  71. Hansson, M.; Nordberg, Å.; Mathisen, B. On-line NIR monitoring during anaerobic treatment of municipal solid waste. Water Sci. Technol. 2003, 48, 9–13. [Google Scholar] [CrossRef]
  72. Fakhlaei, R.; Babadi, A.A.; Sun, C.J.; Ariffin, N.M.; Khatib, A.; Selamat, J.; Xiaobo, Z. Application, challenges and future prospects of recent nondestructive techniques based on the electromagnetic spectrum in food quality and safety. Food Chem. 2024, 441, 138402. [Google Scholar] [CrossRef]
  73. Wang, S.; Yang, X.; Zhang, Y.; Phillips, P.; Yang, J.; Yuan, T.-F. Identification of green, oolong and black teas in China via wavelet packet entropy and fuzzy support vector machine. Entropy 2015, 17, 6663–6682. [Google Scholar] [CrossRef]
  74. Sankaran, J.; Manna, M.; Guo, L.; Kraut, R.; Wohland, T. Diffusion, Transport, and Cell Membrane Organization Investigated by Imaging Fluorescence Cross-Correlation Spectroscopy. Biophys. J. 2009, 97, 2630–2639. [Google Scholar] [CrossRef]
  75. Dankowska, A.; Kowalewski, W. Tea types classification with data fusion of UV–Vis, synchronous fluorescence and NIR spectroscopies and chemometric analysis. Spectrochim. Acta Part A Mol. Biomol. Spectrosc. 2019, 211, 195–202. [Google Scholar] [CrossRef] [PubMed]
  76. Zhang, B.; Huang, W.; Li, J.; Zhao, C.; Fan, S.; Wu, J.; Liu, C. Principles, developments and applications of computer vision for external quality inspection of fruits and vegetables: A review. Food Res. Int. 2014, 62, 326–343. [Google Scholar] [CrossRef]
  77. Qin, J.; Chao, K.; Kim, M.S.; Lu, R.; Burks, T.F. Hyperspectral and multispectral imaging for evaluating food safety and quality. J. Food Eng. 2013, 118, 157–171. [Google Scholar] [CrossRef]
  78. Wu, D.; Sun, D.W. Advanced applications of hyperspectral imaging technology for food quality and safety analysis and assessment: A review—Part II: Applications. Innov. Food Sci. Emerg. Technol. 2013, 19, 1–14. [Google Scholar] [CrossRef]
  79. An, T.; Wang, Z.L.; Li, G.L.; Fan, S.X.; Huang, W.Q.; Duan, D.D.; Zhao, C.J.; Tian, X.; Dong, C.W. Monitoring the major taste components during black tea fermentation using multielement fusion information in decision level. Food Chem.-X 2023, 18, 100718. [Google Scholar] [CrossRef]
  80. Goetz, A.F.; Vane, G.; Solomon, J.E.; Rock, B.N. Imaging spectrometry for Earth remote sensing. Science 1985, 228, 1147–1153. [Google Scholar] [CrossRef]
  81. Unoa, Y.; Prashera, S.O.; Lacroixb, R.; Goela, P.K.; Karimia, Y.; Viauc, A.; Patela, R.M. Artificial neural networks to predict corn yield from Compact Airborne Spectrographic Imager data. Comput. Electron. Agric. 2005, 47, 149–161. [Google Scholar] [CrossRef]
  82. Smail, V.W.; Fritz, A.K.; Wetzel, D.L. Chemical imaging of intact seeds with NIR focal plane array assists plant breeding. Vib. Spectrosc. 2006, 42, 215–221. [Google Scholar] [CrossRef]
  83. Monteiro, S.T.; Minekawa, Y.; Kosugi, Y.; Akazawa, T.; Oda, K. Prediction of sweetness and amino acid content in soybean crops from hyperspectral imagery. ISPRS J. Photogramm. Remote Sens. 2007, 62, 2–12. [Google Scholar] [CrossRef]
  84. Barbedo, J.G.A. A review on the combination of deep learning techniques with proximal hyperspectral images in agriculture. Comput. Electron. Agric. 2023, 210, 107920. [Google Scholar] [CrossRef]
  85. Kang, Y.S.; Ryu, C.; Suguri, M.; Park, S.B.; Kishino, S.; Onoyama, H. Estimating the catechin concentrations of new shoots in green tea fields using ground-based hyperspectral imagery. Food Chem. 2022, 370, 130987. [Google Scholar] [CrossRef] [PubMed]
  86. Xie, Y.T.; Plett, D.; Evans, M.; Garrard, T.; Butt, M.; Clarke, K.; Liu, H.J. Hyperspectral imaging detects biological stress of wheat for early diagnosis of crown rot disease. Comput. Electron. Agric. 2024, 217, 108571. [Google Scholar] [CrossRef]
  87. Grahn, H.; Geladi, P. Techniques and Applications of Hyperspectral Image Analysis; John Wiley & Sons: Hoboken, NJ, USA, 2007. [Google Scholar]
  88. Dai, F.S.; Shi, J.; Yang, C.S.; Li, Y.; Zhao, Y.; Liu, Z.Y.; An, T.; Li, X.L.; Yan, P.; Dong, C.W. Detection of anthocyanin content in fresh Zijuan tea leaves based on hyperspectral imaging. Food Control 2023, 152, 109839. [Google Scholar] [CrossRef]
  89. Yu, K.; Zhao, Y.; Li, X.; He, Y. NIR Hyperspectral Imaging for Mapping of Moisture Content Distribution in Tea Buds During Dehydration. In Processing and Analysis of Hyperspectral Data; IntechOpen: London, UK, 2019. [Google Scholar]
  90. Kim, M.S.; Mcmurtrey, J.E.; Mulchi, C.L.; Daughtry, C.S.; Chappelle, E.W.; Chen, Y.R. Steady-state multispectral fluorescence imaging system for plant leaves. Appl. Opt. 2001, 40, 157–166. [Google Scholar] [CrossRef]
  91. Park, B.; Lawrence, K.C.; Windham, W.R.; Smith, D.P. Multispectral imaging system for fecal and ingesta detection on poultry carcasses. J. Food Process Eng. 2004, 27, 311–327. [Google Scholar] [CrossRef]
  92. Orlando, S.; Minacapilli, M.; Sarno, M.; Carrubba, A.; Motisi, A. A low-cost multispectral imaging system for the characterisation of soil and small vegetation properties using visible and near-infrared reflectance. Comput. Electron. Agric. 2022, 202, 107359. [Google Scholar] [CrossRef]
  93. Jian-Liang, L.U.; Liang, Y.R.; Gong, S.Y.; Zhi-Lei, G.U.; Zhang, L.Y.; Yue-Rong, X.U. Studies on Relationship between Liquor Chromaticity and Organoleptic Quality of Tea. J. Tea Sci. 2002, 22, 57–61. [Google Scholar]
  94. Sharma, O.; Mioc, D.; Anton, F. Polygon feature extraction from satellite imagery based on colour image segmentation and medial axis. Int. Arch. Photogramm. Remote Sens. Spat. Inf. Sci. 2008, 37, 235–240. [Google Scholar]
  95. Wang, F.R.; Xie, B.M.; Lue, E.L.; Zeng, Z.X.; Mei, S.; Ma, C.Y.; Guo, J.M. Design of a Moisture Content Detection System for Yinghong No. 9 Tea Leaves Based on Machine Vision. Appl. Sci. 2023, 13, 1806. [Google Scholar] [CrossRef]
  96. Chen, C.; Zhang, W.; Shan, Z.; Zhang, C.; Dong, T.; Feng, Z.; Wang, C. Moisture contents and product quality prediction of Pu-erh tea in sun-drying process with image information and environmental parameters. Food Sci. Nutr. 2022, 10, 1021–1038. [Google Scholar] [CrossRef]
  97. Aharonov, R.; Goldschmidt, Y.; Ozery-Flato, M.; Yanover, C. Modular Memoization, Tracking and Train-Data Management of Feature Extraction. U.S. Patent No. 10,572,822, 25 February 2020. [Google Scholar]
  98. Krutz, G.W.; Gibson, H.G.; Cassens, D.L.; Zhang, M. Colour vision in forest and wood engineering. Landwards 2000, 55, 2–9. [Google Scholar]
  99. García-Pérez, P.; Becchi, P.P.; Zhang, L.L.; Rocchetti, G.; Lucini, L. Metabolomics and chemometrics: The next-generation analytical toolkit for the evaluation of food quality and authenticity. Trends Food Sci. Technol. 2024, 147, 104481. [Google Scholar] [CrossRef]
  100. Ai, S.R.; Wu, R.M.; Yan, L.Y.; Wu, Y.H. Measurement of the Ratio of Tea Polyphenols to Amino Acids in Green Tea Infusion Based on near Infrared Spectroscopy. Adv. Mater. Res. 2011, 301–303, 1093–1097. [Google Scholar] [CrossRef]
  101. Kumari, M.; Soni, S. A Review of Classification in Web Usage Mining using K-Nearest Neighbor. Adv. Comput. Sci. Technol. 2017, 10, 1405–1416. [Google Scholar]
  102. Squillacciotti, S. Prediction Oriented Classification in PLS Path Modeling. In Handbook of Partial Least Squares: Concepts, Methods and Applications; Springer: Berlin/Heidelberg, Germany, 2010. [Google Scholar]
  103. Temel, F.A.; Yolcu, O.C.; Turan, N.G. Artificial intelligence and machine learning approaches in composting process: A review. Bioresour. Technol. 2023, 370, 128539. [Google Scholar]
  104. Shuai, M.Y.; Peng, C.Y.; Niu, H.L.; Shao, D.L.; Hou, R.Y.; Cai, H.M. Recent techniques for the authentication of the geographical origin of tea leaves from camellia sinensis: A review. Food Chem. 2022, 374, 131713. [Google Scholar] [CrossRef]
  105. Barker, M.; Rayens, W. Partial least squares for discrimination. J. Chemom. J. Chemom. Soc. 2003, 17, 166–173. [Google Scholar] [CrossRef]
  106. An, T.; Li, Y.; Tian, X.; Fan, S.; Duan, D.; Zhao, C.; Huang, W.; Dong, C. Evaluation of aroma quality using multidimensional olfactory information during black tea fermentation. Sens. Actuators B-Chem. 2022, 371, 132518. [Google Scholar] [CrossRef]
  107. Magwaza, L.S.; Opara, U.L.; Cronje, P.J.R.; Saeys, W.; Nicolaï, B. NIR Spectroscopy Applications for Internal and External Quality Analysis of Citrus Fruit—A Review. Food Bioprocess Technol. 2012, 5, 425–444. [Google Scholar] [CrossRef]
  108. Wang, H.P.; Chen, P.; Dai, J.W.; Liu, D.; Li, J.Y.; Xu, Y.P.; Chu, X.L. Recent advances of chemometric calibration methods in modern spectroscopy: Algorithms, strategy, and related issues. TRAC-Trends Anal. Chem. 2022, 153, 116648. [Google Scholar] [CrossRef]
  109. Wang, W.; Yan, Y.; Liu, D.; Chen, Z.; Su, C.; Liu, F.; Geng, L.; Chen, L.; Du, J. Calibration and Data Processing for a Chinese Spectral Radioheliograph in the Decimeter Wave Range. Publ.-Astron. Soc. Jpn. 2013, 65, 2226–2237. [Google Scholar] [CrossRef]
  110. Rinnan, Å.; Berg, F.V.D.; Engelsen, S.B. Review of the most common pre-processing techniques for near-infrared spectra. Trends Anal. Chem. 2009, 28, 1201–1222. [Google Scholar] [CrossRef]
  111. Liu, Y.; Liu, Y.L.; Chen, Y.Y.; Zhang, Y.; Shi, T.Z.; Wang, J.J.; Hong, Y.S.; Fei, T.; Zhang, Y. The Influence of Spectral Pretreatment on the Selection of Representative Calibration Samples for Soil Organic Matter Estimation Using Vis-NIR Reflectance Spectroscopy. Remote Sens. 2019, 11, 450. [Google Scholar] [CrossRef]
  112. Nicolaï, B.M.; Beullens, K.; Bobelyn, E.; Peirs, A.; Saeys, W.; Theron, K.I.; Lammertyn, J. Nondestructive measurement of fruit and vegetable quality by means of NIR spectroscopy: A review. Postharvest Biol. Technol. 2007, 46, 99–118. [Google Scholar] [CrossRef]
  113. Li, X.; Li, R.; Wang, M.; Liu, Y.; Zhang, B.; Zhou, J. Hyperspectral Imaging and Their Applications in the Nondestructive Quality Assessment of Fruits and Vegetables. In Hyperspectral Imaging in Agriculture, Food and Environment; IntechOpen: London, UK, 2018; p. 27. [Google Scholar]
  114. Barclay, V.J.; Bonner, R.F. Application of Wavelet Transforms to Experimental Spectra: Smoothing, Denoising, and Data Set Compression. Anal. Chem. 1997, 69, 78–90. [Google Scholar] [CrossRef]
  115. Sun, X.D.; Zhang, H.L.; Liu, Y.D. Nondestructive assessment of quality of Nanfeng mandarin fruit by a portable near infrared spectroscopy. Int. J. Agric. Biol. Eng. 2009, 2, 65–71. [Google Scholar]
  116. Liu, D.; Sun, D.W.; Zeng, X.A. Recent Advances in Wavelength Selection Techniques for Hyperspectral Image Processing in the Food Industry. Food Bioprocess Technol. 2014, 7, 307–323. [Google Scholar] [CrossRef]
  117. An, T.; Yu, S.Y.; Huang, W.Q.; Li, G.L.; Tian, X.; Fan, S.X.; Dong, C.W.; Zhao, C.J. Robustness and accuracy evaluation of moisture prediction model for black tea withering process using hyperspectral imaging. Spectrochim. Acta Part A-Mol. Biomol. Spectrosc. 2022, 269, 120791. [Google Scholar] [CrossRef]
  118. Han, G.M.; Dai, L.M.; Sun, Y.H.; Li, C.; Ruan, S.L.; Li, J.M.; Xu, Y. Determination of the age of dry red wine by multivariate techniques using color parameters and pigments. Food Control 2021, 129, 108253. [Google Scholar] [CrossRef]
  119. Zhou, J.C.; Wang, D.; Kheirollah, S.N.; Maroufpoor, S.; Band, S.S. Sensitivity analysis of wheat yield based on growing degree days in different growth stages: Application of machine learning approach enhanced by grey systems theory. Comput. Electron. Agric. 2023, 210, 107876. [Google Scholar] [CrossRef]
  120. Guo, J.M.; Huang, H.; He, X.L.; Cai, J.W.; Zeng, Z.X.; Ma, C.Y.; Lue, E.L.; Shen, Q.Y.; Liu, Y.H. Improving the detection accuracy of the nitrogen content of fresh tea leaves by combining FT-NIR with moisture removal method. Food Chem. 2023, 405, 134905. [Google Scholar] [CrossRef]
  121. Wang, F.; Cao, Q.; Zhao, C.J.; Duan, D.D.; Chen, L.Y.; Meng, X.Y. Non-destructive determination of taste-related substances in fresh tea using NIR spectra. J. Food Meas. Charact. 2023, 17, 5874–5885. [Google Scholar] [CrossRef]
  122. Zhu, A.F.; Xu, Y.; Ali, S.; Ouyang, Q.; Chen, Q.S. Au@Ag nanoflowers based SERS coupled chemometric algorithms for determination of organochlorine pesticides in milk. LWT-Food Sci. Technol. 2021, 150, 111978. [Google Scholar] [CrossRef]
  123. Mehmood, T.; Warringer, J.; Snipen, L.; Sæbø, S. Improving stability and understandability of genotype-phenotype mapping in Saccharomyces using regularized variable selection in L-PLS regression. BMC Bioinform. 2012, 13, 3693. [Google Scholar] [CrossRef]
  124. Lorente, D.; Aleixos, N.; Gómez-Sanchis, J.; Cubero, S.; García-Navarrete, O.L.; Blasco, J. Recent Advances and Applications of Hyperspectral Imaging for Fruit and Vegetable Quality Assessment. Neuroimage 2012, 5, 1121–1142. [Google Scholar] [CrossRef]
  125. Zhang, Y.Y.; Gao, W.J.; Cui, C.J.; Zhang, Z.Z.; He, L.L.; Zheng, J.K.; Hou, R.Y. Development of a method to evaluate the tenderness of fresh tea leaves based on rapid, in-situ Raman spectroscopy scanning for carotenoids. Food Chem. 2020, 308, 125648. [Google Scholar] [CrossRef]
  126. Zhang, Z.X.; Liu, H.L.; Chen, D.Y.; Zhang, J.H.; Li, H.; Shen, M.S.; Pu, Y.G.; Zhang, Z.J.; Zhao, J.; Hu, J. SMOTE-based method for balanced spectral nondestructive detection of moldy apple core. Food Control 2022, 141, 109100. [Google Scholar] [CrossRef]
  127. Suykens, J.A.; Vandewalle, J. Multiclass least squares support vector machines. In Proceedings of the IJCNN’99. International Joint Conference on Neural Networks. Proceedings (Cat. No.99CH36339), Washington, DC, USA, 10–16 July 1999; p. 900. [Google Scholar]
  128. Wu, Q.; Liu, S.-y.; Du, Z. Fuzzy least square support vector machines for regression. J. Xidian Univ. 2007, 34, 773–778. [Google Scholar]
  129. Balabin, R.M.; Lomakina, E.I.; Safieva, R.Z. Neural network (ANN) approach to biodiesel analysis: Analysis of biodiesel density, kinematic viscosity, methanol and water contents using near infrared (NIR) spectroscopy. Fuel 2011, 90, 2007–2015. [Google Scholar] [CrossRef]
  130. Li, J.; Huang, W.; Zhao, C.; Zhang, B. A comparative study for the quantitative determination of soluble solids content, pH and firmness of pears by Vis/NIR spectroscopy. J. Food Eng. 2013, 116, 324–332. [Google Scholar] [CrossRef]
  131. Liang, Y.; Lu, J.; Zhang, L.; Wu, S.; Wu, Y. Estimation of black tea quality by analysis of chemical composition and colour difference of tea infusions. Food Chem. 2003, 80, 283–290. [Google Scholar] [CrossRef]
  132. Singh, G.; Kamal, N. Machine vision system for tea quality determination-Tea Quality Index (TQI). IOSR J. Eng. 2013, 3, 46–50. [Google Scholar] [CrossRef]
  133. Borah, S.; Bhuyan, M. Non-destructive testing of tea fermentation using image processing. Insight-Non-Destr. Test. Cond. Monit. 2003, 45, 55–58. [Google Scholar] [CrossRef]
  134. Gejima, Y.; Nagata, M. Basic study on Kamairicha tea leaves quality judgment system. In Proceedings of the ASAE Annual International Meeting, Milwaukee, WI, USA, 9–12 July 2000. [Google Scholar]
  135. Wu, D.; Sun, D.-W. Colour measurements by computer vision for food quality control–A review. Trends Food Sci. Technol. 2013, 29, 5–20. [Google Scholar] [CrossRef]
  136. Chen, Q.; Zhao, J.; Cai, J. Identification of Tea Varieties Using Computer Vision. Trans. Asabe 2008, 51, 623–628. [Google Scholar] [CrossRef]
  137. Dong, C.; Liang, G.; Hu, B.; Yuan, H.; Jiang, Y.; Zhu, H.; Qi, J. Prediction of Congou Black Tea Fermentation Quality Indices from Color Features Using Non-Linear Regression Methods. Sci. Rep. 2018, 8, 10535. [Google Scholar] [CrossRef]
  138. Wang, H.J.; Gu, J.A.; Wang, M.N. A review on the application of computer vision and machine learning in the tea industry. Front. Sustain. Food Syst. 2023, 7, 1172543. [Google Scholar] [CrossRef]
  139. Wang, Y.N.; Huang, C.; Lu, F.; Ye, X.F.; Ma, H.L. In-situ and real-time monitoring of two-stage enzymatic preparation of ACE inhibitory peptides from Cordyceps militaris medium residues by ultrasonic-assisted pretreatment. Food Chem. 2023, 418, 135886. [Google Scholar] [CrossRef]
  140. Xie, C.; Li, X.; Shao, Y.; He, Y. Color measurement of tea leaves at different drying periods using hyperspectral imaging technique. PLoS ONE 2014, 9, e113422. [Google Scholar] [CrossRef]
  141. Wang, S.; Phillips, P.; Liu, A.; Du, S. Tea category identification using computer vision and generalized eigenvalue proximal svm. Fundam. Inform. 2017, 151, 325–339. [Google Scholar] [CrossRef]
  142. Gill, G.S.; Kumar, A.; Agarwal, R. Monitoring and grading of tea by computer vision—A review. J. Food Eng. 2011, 106, 13–19. [Google Scholar] [CrossRef]
  143. Chen, Y.Y.; Wu, H.T.; Liu, Y.; Wang, Y.J.; Lu, C.Y.; Li, T.H.; Wei, Y.M.; Ning, J.M. Monitoring green tea fixation quality by intelligent sensors: Comparison of image and spectral information. J. Sci. Food Agric. 2023, 103, 3093–3101. [Google Scholar] [CrossRef] [PubMed]
  144. Fernandes, J.S.; Fernandes, D.D.D.; Pistonesi, M.F.; Diniz, P. Tea authentication and determination of chemical constituents using digital image-based fingerprint signatures and chemometrics. Food Chem. 2023, 421, 136164. [Google Scholar] [CrossRef] [PubMed]
  145. Jin, G.; Wang, Y.J.; Li, L.Q.; Shen, S.S.; Deng, W.W.; Zhang, Z.Z.; Ning, J.M. Intelligent evaluation of black tea fermentation degree by FT-NIR and computer vision based on data fusion strategy. LWT-Food Sci. Technol. 2020, 125, 109216. [Google Scholar] [CrossRef]
  146. Kuang, Z.K.; Yu, X.Y.; Guo, Y.C.; Cai, Y.F.; Hong, W.B. Design of a Multimodal Detection System Tested on Tea Impurity Detection. Remote Sens. 2024, 16, 1590. [Google Scholar] [CrossRef]
  147. Li, T.; Lu, C.; Wei, Y.; Zhang, J.; Shao, A.; Li, L.; Wang, Y.; Ning, J. Chemical imaging for determining the distributions of quality components during the piling fermentation of Pu-erh tea. Food Control 2024, 158, 110234. [Google Scholar] [CrossRef]
  148. Li, T.H.; Lu, C.Y.; Huang, J.L.; Chen, Y.Y.; Zhang, J.X.; Wei, Y.M.; Wang, Y.J.; Ning, J.M. Qualitative and quantitative analysis of the pile fermentation degree of Pu-erh tea. LWT-Food Sci. Technol. 2023, 173, 114327. [Google Scholar] [CrossRef]
  149. Ren, G.X.; Gan, N.; Song, Y.; Ning, J.M.; Zhang, Z.Z. Evaluating Congou black tea quality using a lab-made computer vision system coupled with morphological features and chemometrics. Microchem. J. 2021, 160, 105600. [Google Scholar] [CrossRef]
  150. Ren, G.X.; Wu, R.; Yin, L.L.; Zhang, Z.Z.; Ning, J.M. Description of tea quality using deep learning and multi-sensor feature fusion. J. Food Compos. Anal. 2024, 126, 105924. [Google Scholar] [CrossRef]
  151. Wang, S.M.; Ma, J.H.; Zhao, Z.M.; Yang, H.Z.Y.; Xuan, Y.M.; Ouyang, J.X.; Fan, D.M.; Yu, J.F.; Wang, X.C. Pixel-class prediction for nitrogen content of tea plants based on unmanned aerial vehicle images using machine learning and deep learning. Expert Syst. Appl. 2023, 227, 120351. [Google Scholar] [CrossRef]
  152. Wang, Y.J.; Li, L.Q.; Liu, Y.; Cui, Q.Q.; Ning, J.M.; Zhang, Z.Z. Enhanced quality monitoring during black tea processing by the fusion of NIRS and computer vision. J. Food Eng. 2021, 304, 110599. [Google Scholar] [CrossRef]
  153. Wu, Z.D.; Li, C.H.; Liu, H.C.; Lin, T.; Yi, L.Z.; Ren, D.B.; Gu, Y.; Wang, S. Quantification of caffeine and catechins and evaluation of bitterness and astringency of Pu-erh ripen tea based on portable near-infrared spectroscopy. J. Food Compos. Anal. 2024, 125, 105793. [Google Scholar] [CrossRef]
  154. Tamura, H.; Mori, S.; Yamawaki, T. Textural features corresponding to visual perception. IEEE Trans. Syst. Man Cybern. 1978, 8, 460–473. [Google Scholar] [CrossRef]
  155. Borah, S.; Hines, E.; Bhuyan, M. Wavelet transform based image texture analysis for size estimation applied to the sorting of tea granules. J. Food Eng. 2007, 79, 629–639. [Google Scholar] [CrossRef]
  156. Gill, G.S.; Kumar, A.; Agarwal, R. Nondestructive grading of black tea based on physical parameters by texture analysis. Biosyst. Eng. 2013, 116, 198–204. [Google Scholar] [CrossRef]
  157. Bharati, M.H.; Liu, J.J.; Macgregor, J.F. Image texture analysis: Methods and comparisons. Chemom. Intell. Lab. Syst. 2004, 72, 57–71. [Google Scholar] [CrossRef]
  158. Haralick, R.M.; Shanmugam, K. Textural features for image classification. IEEE Trans. Syst. Man Cybern. 1973, SMC-3, 610–621. [Google Scholar] [CrossRef]
  159. Zheng, C.; Sun, D.W.; Zheng, L. Recent applications of image texture for evaluation of food qualities—A review. Trends Food Sci. Technol. 2006, 17, 113–128. [Google Scholar] [CrossRef]
  160. Gunasekaran, S. Nondestructive Food Evaluation: Techniques to Analyze Properties and Quality; CRC Press: Boca Raton, FL, USA, 2000. [Google Scholar]
  161. Yu, X.J.; Liu, K.S.; He, Y.; Wu, D. Color and Texture Classification of Green Tea Using Least Squares Support Vector Machine (LSSVM). Key Eng. Mater. 2011, 460–461, 774–779. [Google Scholar] [CrossRef]
  162. Tang, D.; Qin, B.; Feng, X.; Liu, T. Effective LSTMs for Target-Dependent Sentiment Classification. arXiv 2015. [Google Scholar] [CrossRef]
  163. Wu, D.; Yang, H.; Chen, X.; He, Y.; Li, X. Application of image texture for the sorting of tea categories using multi-spectral imaging technique and support vector machine. J. Food Eng. 2008, 88, 474–483. [Google Scholar] [CrossRef]
  164. Chen, L.Y.; Xu, B.; Zhao, C.J.; Duan, D.D.; Cao, Q.; Wang, F. Application of Multispectral Camera in Monitoring the Quality Parameters of Fresh Tea Leaves. Remote Sens. 2021, 13, 3719. [Google Scholar] [CrossRef]
  165. Tuceryan, M.; Jain, A.K. Texture segmentation using Vornoi polygons. IEEE Trans. Pattern Anal. Mach. Intell. 1990, 12, 211–216. [Google Scholar] [CrossRef]
  166. Li, X.; Nie, P.; Qiu, Z.J.; Yong, H. Using wavelet transform and multi-class least square support vector machine in multi-spectral imaging classification of Chinese famous tea. Expert Syst. Appl. 2011, 38, 11149–11159. [Google Scholar] [CrossRef]
  167. Bakhshipour, A.; Zareiforoush, H.; Bagheri, I. Application of decision trees and fuzzy inference system for quality classification and modeling of black and green tea based on visual features. J. Food Meas. Charact. 2020, 14, 1402–1416. [Google Scholar] [CrossRef]
  168. Bhargava, A.; Bansal, A.; Goyal, V.; Shukla, A. Machine learning & computer vision-based optimum black tea fermentation detection. Multimed. Tools Appl. 2023, 82, 43335–43347. [Google Scholar]
  169. Ren, G.X.; Wang, Y.J.; Ning, J.M.; Zhang, Z.Z. Using near-infrared hyperspectral imaging with multiple decision tree methods to delineate black tea quality. Spectrochim. Acta Part A-Mol. Biomol. Spectrosc. 2020, 237, 118407. [Google Scholar] [CrossRef]
  170. Ren, G.X.; Wu, R.; Yin, L.L.; Zhang, Z.Z. Intelligent Evaluation of the Appearance Modality of Black Tea Based on Machine Vision and Hyperspectral Imaging. Anal. Lett. 2024, 57, 176–189. [Google Scholar] [CrossRef]
  171. Sheng, X.F.; Zan, J.Z.; Jiang, Y.W.; Shen, S.; Li, L.; Yuan, H.B. Data fusion strategy for rapid prediction of moisture content during drying of black tea based on micro-NIR spectroscopy and machine vision. Optik 2023, 276, 170645. [Google Scholar] [CrossRef]
  172. Wang, Y.J.; Ren, Z.Y.; Chen, Y.Y.; Lu, C.Y.; Deng, W.W.; Zhang, Z.Z.; Ning, J.M. Visualizing chemical indicators: Spatial and temporal quality formation and distribution during black tea fermentation. Food Chem. 2023, 401, 134090. [Google Scholar] [CrossRef]
  173. Yan, L.; Pang, L.; Wang, H.; Xiao, J. Recognition of different Longjing fresh tea varieties using hyperspectral imaging technology and chemometrics. J. Food Process Eng. 2020, 43, e13378. [Google Scholar] [CrossRef]
  174. Zhu, Y.W.; Chen, S.Y.; Yin, H.Z.; Han, X.H.; Xu, M.H.; Wang, W.L.; Zhang, Y.; Feng, X.X.; Liu, Y. Classification of oolong tea varieties based on computer vision and convolutional neural networks. J. Sci. Food Agric. 2024, 104, 1630–1637. [Google Scholar] [CrossRef] [PubMed]
  175. Jian, W.; Xianyin, Z.; Shiping, D. Identification and Grading of Tea Using Computer Vision. Appl. Eng. Agric. 2010, 26, 639–645. [Google Scholar] [CrossRef]
  176. Yang, F.; Yang, L.; Tian, Y.; Yang, Q. Recognition of the Tea Sprout Based on Color and Shape Features. Trans. Chin. Soc. Agric. Mach. 2009, 40, 19–123. [Google Scholar]
  177. Chen, J.; He, Q. Tea disease spot recognition based on image feature points extraction and matching. Glob. Nest J. 2020, 22, 492–501. [Google Scholar]
  178. Chen, Z.W.; He, L.Y.; Ye, Y.; Chen, J.N.; Sun, L.; Wu, C.Y.; Chen, L.; Wang, R.Y. Automatic sorting of fresh tea leaves using vision-based recognition method. J. Food Process Eng. 2020, 43, e13474. [Google Scholar] [CrossRef]
  179. Guo, S.D.; Yoon, S.C.; Li, L.; Wang, W.; Zhuang, H.; Wei, C.J.; Liu, Y.; Li, Y.W. Recognition and Positioning of Fresh Tea Buds Using YOLOv4-lighted. Agriculture 2023, 13, 518. [Google Scholar] [CrossRef]
  180. Hu, G.S.; Wei, K.; Zhang, Y.; Bao, W.X.; Liang, D. Estimation of tea leaf blight severity in natural scene images. Precis. Agric. 2021, 22, 1239–1262. [Google Scholar] [CrossRef]
  181. Li, L.Q.; Chen, Y.R.; Dong, S.; Shen, J.F.; Cao, S.C.; Cui, Q.Q.; Song, Y.; Ning, J.M. Rapid and comprehensive grade evaluation of Keemun black tea using efficient multidimensional data fusion. Food Chem.-X 2023, 20, 100924. [Google Scholar] [CrossRef]
  182. Ren, G.X.; Wang, Y.J.; Ning, J.M.; Zhang, Z.Z. Evaluation of Dianhongblack tea quality using near-infrared hyperspectral imaging technology. J. Sci. Food Agric. 2021, 101, 2135–2142. [Google Scholar] [CrossRef]
  183. Song, Y.; Wang, X.Z.; Xie, H.L.; Li, L.Q.; Ning, J.M.; Zhang, Z.Z. Quality evaluation of Keemun black tea by fusing data obtained from near-infrared reflectance spectroscopy and computer vision sensors. Spectrochim. Acta Part A-Mol. Biomol. Spectrosc. 2021, 252, 119522. [Google Scholar] [CrossRef] [PubMed]
  184. Chen, Y.; Guo, M.; Chen, K.; Jiang, X.; Ding, Z.; Zhang, H.; Lu, M.; Qi, D.; Dong, C. Predictive models for sensory score and physicochemical composition of Yuezhou Longjing tea using near-infrared spectroscopy and data fusion. Talanta 2024, 273, 125892. [Google Scholar] [CrossRef] [PubMed]
  185. Fodor, M.; Matkovits, A.; Benes, E.L.; Jókai, Z. The role of near-infrared spectroscopy in food quality assurance: A review of the past two decades. Foods 2024, 13, 3501. [Google Scholar] [CrossRef] [PubMed]
  186. Fu, Y.; Ren, Y.; Sun, D.-W. Novel analysis of food processes by terahertz spectral imaging: A review of recent research findings. Trends Food Sci. Technol. 2024, 147, 104463. [Google Scholar] [CrossRef]
  187. Owuor, P.O.; Othieno, C.O.; Howard, G.E.; Robinson, J.M.; Cooke, R.D. Flavanol Composition and Caffeine Content of Green Leaf as Quality Potential Indicators of Kenyan Black Teas. J. Sci. Food Agric. 2015, 74, 209–215. [Google Scholar]
  188. Xiong, C.W.; Liu, C.H.; Pan, W.J.; Ma, F.; Xiong, C.; Qi, L.; Chen, F.; Lu, X.Z.; Yang, J.B.; Zheng, L. Non-destructive determination of total polyphenols content and classification of storage periods of Iron Buddha tea using multispectral imaging system. Food Chem. 2015, 176, 130–136. [Google Scholar] [CrossRef]
  189. Wang, Y.J.; Li, T.H.; Li, L.Q.; Ning, J.M.; Zhang, Z.Z. Evaluating taste-related attributes of black tea by micro-NIRS. J. Food Eng. 2021, 290, 110181. [Google Scholar] [CrossRef]
  190. Han, C.; Qu, F.; Wang, X.; Zhai, X.; Li, J.; Yu, K.; Zhao, Y. Terahertz spectroscopy and imaging techniques for herbal medicinal plants detection: A comprehensive review. Crit. Rev. Anal. Chem. 2024, 54, 2485–2499. [Google Scholar] [CrossRef]
  191. He, Y.; Zhang, Q.; Inostroza, A.C.; Kierszniowska, S.; Liu, L.; Li, Y.; Ruan, J. Application of metabolic fingerprinting in tea quality evaluation. Food Control 2024, 160, 110361. [Google Scholar] [CrossRef]
  192. Chen, Q.; Zhao, J.; Liu, M.; Cai, J.; Liu, J. Determination of total polyphenols content in green tea using FT-NIR spectroscopy and different PLS algorithms. J. Pharm. Biomed. Anal. 2008, 46, 568–573. [Google Scholar] [CrossRef]
  193. Li, X.; Sun, C.; Luo, L.; Yong, H. Determination of tea polyphenols content by infrared spectroscopy coupled with iPLS and random frog techniques. Comput. Electron. Agric. 2015, 112, 28–35. [Google Scholar] [CrossRef]
  194. Panigrahi, N.; Bhol, C.S.; Das, B.S. Rapid assessment of black tea quality using diffuse reflectance spectroscopy. J. Food Eng. 2016, 190, 101–108. [Google Scholar] [CrossRef]
  195. Wang, J.; Wang, Y.; Cheng, J.; Wang, J.; Sun, X.; Shuang, S.; Zhang, Z. Enhanced cross-category models for predicting the total polyphenols, caffeine and free amino acids contents in Chinese tea using NIR spectroscopy. LWT 2018, 96, 90–97. [Google Scholar] [CrossRef]
  196. Chunlin, L.; Haowei, G.; Bangzheng, Z.; Puming, H.; Fangyuan, F.; Shuying, G. Rapid and non-destructive discrimination of special-grade flat green tea using Near-infrared spectroscopy. Spectrochim. Acta Part A Mol. Biomol. Spectrosc. 2019, 206, 254–262. [Google Scholar]
  197. Bian, M.; Skidmore, A.K.; Schlerf, M.; Liu, Y.; Wang, T. Estimating Biochemical Parameters of Tea (Camellia sinensis (L.)) Using Hyperspectral Techniques. ISPRS-Int. Arch. Photogramm. Remote Sens. Spat. Inf. Sci. 2012, 39, 237–241. [Google Scholar] [CrossRef]
  198. Dutta, D.; Das, P.K.; Bhunia, U.K.; Singh, U.; Singh, S.; Sharma, J.R.; Dadhwal, V.K. Retrieval of tea polyphenol at leaf level using spectral transformation and multi-variate statistical approach. Int. J. Appl. Earth Obs. Geoinf. 2015, 36, 22–29. [Google Scholar] [CrossRef]
  199. Bai, X.L.; Zhang, L.; Kang, C.Y.; Quan, B.Y.; Zheng, Y.; Zhang, X.L.; Song, J.; Xia, T.; Wang, M. Near-infrared spectroscopy and machine learning-based technique to predict quality-related parameters in instant tea. Sci. Rep. 2022, 12, 3833. [Google Scholar] [CrossRef]
  200. Bilge, G.; Özdemir, K.S. Synchronous fluorescence spectroscopy combined with chemometrics for determination of total phenolic content and antioxidant activity in different tea types. J. Sci. Food Agric. 2020, 100, 3741–3747. [Google Scholar] [CrossRef]
  201. Hidayat, M.A.; Maharani, D.A.; Purwanto, D.A.; Kuswandi, B.; Yuwono, M. Simple and Sensitive Paper-based Colorimetric Biosensor for Determining Total Polyphenol Content of the Green Tea Beverages. Biotechnol. Bioprocess Eng. 2020, 25, 255–263. [Google Scholar] [CrossRef]
  202. Liu, M.; Wang, R.X.; Shi, D.L.; Cao, R.Y. Non-destructive prediction of tea polyphenols during Pu-erh tea fermentation using NIR coupled with chemometrics methods. J. Food Compos. Anal. 2024, 131, 106247. [Google Scholar] [CrossRef]
  203. Jiang, H.; Xu, W.D.; Chen, Q.S. Determination of tea polyphenols in green tea by homemade color sensitive sensor combined with multivariate analysis. Food Chem. 2020, 319, 126584. [Google Scholar] [CrossRef] [PubMed]
  204. Ranatunga, M.; Uwadaira, Y.; Ikehata, A.; Ito, H. NIR Spectroscopic Determination of Polyphenol Content in Teas and Tea Extract at 2142 nm. Sens. Mater. 2021, 33, 4135–4145. [Google Scholar] [CrossRef]
  205. Wang, K.Q.; Li, Z.L.; Li, J.J.; Lin, H. Raman spectroscopic techniques for nondestructive analysis of agri-foods: A state-of-the-art review. Trends Food Sci. Technol. 2021, 118, 490–504. [Google Scholar] [CrossRef]
  206. Wang, Y.; Liu, Y.; Cui, Q.; Li, L.; Ning, J.; Zhang, Z. Monitoring the withering condition of leaves during black tea processing via the fusion of electronic eye (E-eye), colorimetric sensing array (CSA), and micro-near-infrared spectroscopy (NIRS). J. Food Eng. 2021, 300, 110534. [Google Scholar] [CrossRef]
  207. Hu, Y.; Chen, W.; Gouda, M.; Yao, H.; Zuo, X.; Yu, H.; Zhang, Y.; Ding, L.; Zhu, F.; Wang, Y. Fungal fermentation of Fuzhuan brick tea: A comprehensive evaluation of sensory properties using chemometrics, visible near-infrared spectroscopy, and electronic nose. Food Res. Int. 2024, 186, 114401. [Google Scholar] [CrossRef]
  208. Li, D.; Park, B.; Kang, R.; Chen, Q.; Ouyang, Q. Quantitative prediction and visualization of matcha color physicochemical indicators using hyperspectral microscope imaging technology. Food Control 2024, 163, 110531. [Google Scholar] [CrossRef]
  209. Guo, Z. Nondestructive estimation of total free amino acid in green tea by near infrared spectroscopy and artificial neural networks. Spectronic Instrum. Anal. 2011, 369, 43–53. [Google Scholar]
  210. Yang, C.; Zhao, Y.; An, T.; Liu, Z.; Jiang, Y.; Li, Y.; Dong, C. Quantitative prediction and visualization of key physical and chemical components in black tea fermentation using hyperspectral imaging. LWT-Food Sci. Technol. 2021, 141, 110975. [Google Scholar] [CrossRef]
  211. Guo, Z.M.; Barimah, A.O.; Yin, L.M.; Chen, Q.S.; Shi, J.Y.; El-Seedi, H.R.; Zou, X.B. Intelligent evaluation of taste constituents and polyphenols-to-amino acids ratio in matcha tea powder using near infrared spectroscopy. Food Chem. 2021, 353, 129372. [Google Scholar] [CrossRef]
  212. Hu, Y.; Huang, P.; Wang, Y.C.; Sun, J.; Wu, Y.L.; Kang, Z.L. Determination of Tibetan tea quality by hyperspectral imaging technology and multivariate analysis. J. Food Compos. Anal. 2023, 117, 105136. [Google Scholar] [CrossRef]
  213. Luo, D.N.; Gao, Y.; Wang, Y.; Shi, Y.J.; Chen, S.Z.; Ding, Z.T.; Fan, K. Using UAV image data to monitor the effects of different nitrogen application rates on tea quality. J. Sci. Food Agric. 2022, 102, 1540–1549. [Google Scholar] [CrossRef] [PubMed]
  214. Mao, Y.L.; Li, H.; Wang, Y.; Fan, K.; Song, Y.J.; Han, X.; Zhang, J.; Ding, S.B.; Song, D.P.; Wang, H.; et al. Prediction of Tea Polyphenols, Free Amino Acids and Caffeine Content in Tea Leaves during Wilting and Fermentation Using Hyperspectral Imaging. Foods 2022, 11, 2537. [Google Scholar] [CrossRef]
  215. Wang, Y.J.; Ren, Z.Y.; Li, M.Y.; Lu, C.Y.; Deng, W.W.; Zhang, Z.Z.; Ning, J.M. From lab to factory: A calibration transfer strategy from HSI to online NIR optimized for quality control of green tea fixation. J. Food Eng. 2023, 339, 111284. [Google Scholar] [CrossRef]
  216. Wang, Y.J.; Cui, Q.Q.; Jin, S.S.; Zhuo, C.; Luo, Y.H.; Yu, Y.L.; Ning, J.M.; Zhang, Z.Z. Tea Analyzer: A low-cost and portable tool for quality quantification of postharvest fresh tea leaves. LWT-Food Sci. Technol. 2022, 159, 113248. [Google Scholar] [CrossRef]
  217. Long, P.; Li, Y.; Han, Z.; Zhu, M.; Zhai, X.; Jiang, Z.; Wen, M.; Ho, C.-T.; Zhang, L. Discovery of color compounds: Integrated multispectral omics on exploring critical colorant compounds of black tea infusion. Food Chem. 2024, 432, 137185. [Google Scholar] [CrossRef]
  218. Pan, Y.; Zhang, H.; Chen, Y.; Gong, X.; Yan, J.; Zhang, H. Applications of hyperspectral imaging technology combined with machine learning in quality control of traditional Chinese medicine from the perspective of artificial intelligence: A review. Crit. Rev. Anal. Chem. 2024, 54, 2850–2864. [Google Scholar] [CrossRef]
  219. Chen, Q.; Zhao, J.; Huang, X.; Zhang, H.; Liu, M. Simultaneous determination of total polyphenols and caffeine contents of green tea by near-infrared reflectance spectroscopy. Microchem. J. 2006, 83, 42–47. [Google Scholar] [CrossRef]
  220. Ren, G.; Wang, S.; Ning, J.; Xu, R.; Wang, Y.; Xing, Z.; Wan, X.; Zhang, Z. Quantitative analysis and geographical traceability of black tea using Fourier transform near-infrared spectroscopy (FT-NIRS). Food Res. Int. 2013, 53, 822–826. [Google Scholar] [CrossRef]
  221. Sanaeifar, A.; Huang, X.Y.; Chen, M.Y.; Zhao, Z.F.; Ji, Y.F.; Li, X.L.; He, Y.; Zhu, Y.; Chen, X.; Yu, X.X. Nondestructive monitoring of polyphenols and caffeine during green tea processing using Vis-NIR spectroscopy. Food Sci. Nutr. 2020, 8, 5860–5874. [Google Scholar] [CrossRef]
  222. Yang, T.; Zhu, Y.; Shao, C.; Zhang, Y.; Shi, J.; Lv, H.-p.; Lin, Z. Enantiomeric analysis of linalool in teas using headspace solid-phase microextraction with chiral gas chromatography. Ind. Crops Prod. 2016, 83, 17–23. [Google Scholar] [CrossRef]
  223. Chen, Y.-G.; Song, Y.-L.; Wang, Y.; Yuan, Y.-F.; Huang, X.-J.; Ye, W.-C.; Wang, Y.-T.; Zhang, Q.-W. Metabolic differentiations of Pueraria lobata and Pueraria thomsonii using 1H NMR spectroscopy and multivariate statistical analysis. J. Pharm. Biomed. Anal. 2014, 93, 51–58. [Google Scholar] [CrossRef] [PubMed]
  224. Le Gall, G.; Colquhoun, I.J.; Defernez, M. Metabolite profiling using 1H NMR spectroscopy for quality assessment of green tea, Camellia sinensis (L.). J. Agric. Food Chem. 2004, 52, 692–700. [Google Scholar] [CrossRef] [PubMed]
  225. Yuan, Y.; Song, Y.; Jing, W.; Wang, Y.; Yang, X.; Liu, D. Simultaneous determination of caffeine, gallic acid, theanine,(−)-epigallocatechin and (−)-epigallocatechin-3-gallate in green tea using quantitative 1 H-NMR spectroscopy. Anal. Methods 2014, 6, 907–914. [Google Scholar] [CrossRef]
  226. An, T.; Yang, C.; Zhang, J.; Wang, Z.; Fan, Y.; Fan, S.; Huang, W.; Qi, D.; Tian, X.; Yuan, C.; et al. Evaluation of the Black Tea Taste Quality during Fermentation Process Using Image and Spectral Fusion Features. Fermentation 2023, 9, 896. [Google Scholar] [CrossRef]
  227. Carvalho, D.G.; Ranzan, L.; Jacques, R.A.; Trierweiler, L.F.; Trierweiler, J.O. Analysis of total phenolic compounds and caffeine in teas using variable selection approach with two-dimensional fluorescence and infrared spectroscopy. Microchem. J. 2021, 169, 106570. [Google Scholar] [CrossRef]
  228. Huang, Y.F.; Dong, W.T.; Sanaeifar, A.; Wang, X.M.; Luo, W.; Zhan, B.S.; Liu, X.M.; Li, R.L.; Zhang, H.L.; Li, X.L. Development of simple identification models for four main catechins and caffeine in fresh green tea leaf based on visible and near-infrared spectroscopy. Comput. Electron. Agric. 2020, 173, 105388. [Google Scholar] [CrossRef]
  229. Jia, J.M.; Zhou, X.F.; Li, Y.; Wang, M.; Liu, Z.Y.; Dong, C.W. Establishment of a rapid detection model for the sensory quality and components of Yuezhou Longjing tea using near-infrared spectroscopy. LWT-Food Sci. Technol. 2022, 164, 113625. [Google Scholar] [CrossRef]
  230. Ouyang, Q.; Liu, L.H.; Wang, L.; Zareef, M.; Wang, Z.; Li, H.Q.; Yin, J.; Chen, Q.S. Rapid determination of free amino acids and caffeine in matcha using near-infrared spectroscopy: A comparison of portable and benchtop systems. J. Food Compos. Anal. 2023, 115, 104868. [Google Scholar] [CrossRef]
  231. Wang, Y.J.; Li, L.Q.; Shen, S.S.; Liu, Y.; Ning, J.M.; Zhang, Z.Z. Rapid detection of quality index of postharvest fresh tea leaves using hyperspectral imaging. J. Sci. Food Agric. 2020, 100, 3803–3811. [Google Scholar] [CrossRef]
  232. Wu, Y.X.; Chen, J.N.; Wu, S.K.; Li, H.; He, L.Y.; Zhao, R.M.; Wu, C.Y. An improved YOLOv7 network using RGB-D multi-modal feature fusion for tea shoots detection. Comput. Electron. Agric. 2024, 216, 108541. [Google Scholar] [CrossRef]
  233. Zhang, S.S.; Zuo, Y.M.; Wu, Q.; Wang, J.; Ban, L.; Yang, H.L.; Bai, Z.W. Development and Validation of Near-Infrared Methods for the Quantitation of Caffeine, Epigallocatechin-3-gallate, and Moisture in Green Tea Production. J. Anal. Methods Chem. 2021, 2021, 9563162. [Google Scholar] [CrossRef] [PubMed]
  234. Rodrigues, S.S.; Dias, L.G.; Teixeira, A. Emerging methods for the evaluation of sensory quality of food: Technology at service. Curr. Food Sci. Technol. Rep. 2024, 2, 77–90. [Google Scholar] [CrossRef]
  235. Li, X.; Xie, C.; He, Y.; Qiu, Z.; Zhang, Y. Characterizing the moisture content of tea with diffuse reflectance spectroscopy using wavelet transform and multivariate analysis. Sensors 2012, 12, 9847–9861. [Google Scholar] [CrossRef] [PubMed]
  236. Liang, G.; Dong, C.; Hu, B.; Zhu, H.; Yuan, H.; Jiang, Y.; Hao, G. Prediction of Moisture Content for Congou Black Tea Withering Leaves Using Image Features and Nonlinear Method. Sci. Rep. 2018, 8, 7854. [Google Scholar] [CrossRef]
  237. Dong, C.W.; An, T.; Yang, M.; Yang, C.S.; Liu, Z.Y.; Li, Y.; Duan, D.D.; Fan, S.X. Quantitative prediction and visual detection of the moisture content of withering leaves in black tea (Camellia sinensis) with hyperspectral image. Infrared Phys. Technol. 2022, 123, 104118. [Google Scholar] [CrossRef]
  238. An, T.; Yu, H.; Yang, C.; Liang, G.; Dong, C. Black tea withering moisture detection method based on convolution neural network confidence. J. Food Process Eng. 2020, 43, e13428. [Google Scholar] [CrossRef]
  239. Chen, C.L.; Lu, J.Z.; Zhou, M.C.; Yi, J.; Liao, M.; Gao, Z.M. A YOLOv3-based computer vision system for identification of tea buds and the picking point. Comput. Electron. Agric. 2022, 198, 107116. [Google Scholar] [CrossRef]
  240. Huang, Z.X.; Sanaeifar, A.; Tian, Y.; Liu, L.; Zhang, D.Y.; Wang, H.; Ye, D.P.; Li, X.L. Improved generalization of spectral models associated with Vis-NIR spectroscopy for determining the moisture content of different tea leaves. J. Food Eng. 2021, 293, 110374. [Google Scholar] [CrossRef]
  241. Li, X.; Li, Z.; Yang, X.; He, Y. Boosting the generalization ability of Vis-NIR-spectroscopy-based regression models through dimension reduction and transfer learning. Comput. Electron. Agric. 2021, 186, 106157. [Google Scholar] [CrossRef]
  242. Liu, Z.Y.; Zhang, R.T.; Yang, C.S.; Hu, B.; Luo, X.; Li, Y.; Dong, C.W. Research on moisture content detection method during green tea processing based on machine vision and near-infrared spectroscopy technology. Spectrochim. Acta Part A-Mol. Biomol. Spectrosc. 2022, 271, 120921. [Google Scholar] [CrossRef]
  243. Rossi, G.B.; Lozano, V.A. Simultaneous determination of quality parameters in yerba mate (Ilex paraguariensis) samples by application of near-infrared (NIR) spectroscopy and partial least squares (PLS). LWT-Food Sci. Technol. 2020, 126, 109290. [Google Scholar] [CrossRef]
  244. Shen, S.; Hua, J.J.; Zhu, H.K.; Yang, Y.Q.; Deng, Y.L.; Li, J.; Yuan, H.B.; Wang, J.J.; Zhu, J.Y.; Jiang, Y.W. Rapid and real-time detection of moisture in black tea during withering using micro-near-infrared spectroscopy. LWT-Food Sci. Technol. 2022, 155, 112970. [Google Scholar] [CrossRef]
  245. Wang, Y.J.; Li, T.H.; Li, L.Q.; Ning, J.M.; Zhang, Z.Z. Micro-NIR spectrometer for quality assessment of tea: Comparison of local and global models. Spectrochim. Acta Part A-Mol. Biomol. Spectrosc. 2020, 237, 118403. [Google Scholar] [CrossRef] [PubMed]
  246. Wei, Y.Z.; Li, X.L.; He, Y. Generalisation of tea moisture content models based on VNIR spectra subjected to fractional differential treatment. Biosyst. Eng. 2021, 205, 174–186. [Google Scholar] [CrossRef]
  247. Wei, Y.Z.; He, Y.; Li, X.L. Tea moisture content detection with multispectral and depth images. Comput. Electron. Agric. 2021, 183, 106082. [Google Scholar] [CrossRef]
  248. Zhang, M.; Guo, J.; Ma, C.; Qiu, G.; Lü, E. An Effective Prediction Approach for Moisture Content of Tea Leaves Based on Discrete Wavelet Transforms and Bootstrap Soft Shrinkage Algorithm. Appl. Sci. 2020, 10, 4839. [Google Scholar] [CrossRef]
  249. Rong, Y.; Riaz, T.; Lin, H.; Wang, Z.; Chen, Q.; Ouyang, Q. Application of visible near-infrared spectroscopy combined with colorimetric sensor array for the aroma quality evaluation in tencha drying process. Spectrochim. Acta Part A Mol. Biomol. Spectrosc. 2024, 304, 123385. [Google Scholar] [CrossRef]
  250. Singh, R.; Nisha, R.; Naik, R.; Upendar, K.; Nickhil, C.; Deka, S.C. Sensor fusion techniques in deep learning for multimodal fruit and vegetable quality assessment: A comprehensive review. J. Food Meas. Charact. 2024, 18, 8088–8109. [Google Scholar] [CrossRef]
  251. GB/T 23776-2018; Methodology for Sensory Evaluation of Tea. Standardization Administration of China (SAC): Beijing, China, 2018.
  252. Shaltout, A.A.; Abd-Elkader, O.H. Levels of Trace Elements in Black Teas Commercialized in Saudi Arabia Using Inductively Coupled Plasma Mass Spectrometry. Biol. Trace Elem. Res. 2016, 174, 477–483. [Google Scholar] [CrossRef]
  253. Theppakorn, T.; Luthfivyyah, A.; Ploysri, K. Simultaneous determination of caffeine and 8 catechins in oolong teas produced in Thailand. Int. Food Res. J. 2014, 21, 2055–2061. [Google Scholar]
  254. Yun, J.; Cui, C.; Zhang, S.; Zhu, J.; Hou, R. Use of Headspace GC/MS Combined with Chemometric Analysis to Identify the Geographic Origins of Black Tea. Food Chem. 2021, 360, 130033. [Google Scholar] [CrossRef] [PubMed]
  255. Wei, Y.; Pang, Y.; Ma, P.; Miao, S.; Xu, J.; Wei, K.; Wang, Y.; Wei, X. Green preparation, safety control and intelligent processing of high-quality tea extract. Crit. Rev. Food Sci. Nutr. 2024, 64, 11468–11492. [Google Scholar] [CrossRef] [PubMed]
  256. Afseth, N.K.; Segtnan, V.H.; Marquardt, B.J.; Wold, J.P. Raman and near-infrared spectroscopy for quantification of fat composition in a complex food model system. Appl. Spectrosc. 2005, 59, 1324–1332. [Google Scholar] [CrossRef] [PubMed]
  257. Gowen, A.A.; O’Donnell, C.P.; Cullen, P.J.; Downey, G.; Frias, J.M. Hyperspectral imaging—An emerging process analytical tool for food quality and safety control. Trends Food Sci. Technol. 2007, 18, 590–598. [Google Scholar] [CrossRef]
Figure 1. The primary processing steps for six types of teas, from fresh tea leaves to final products.
Agronomy 15 01507 g001
Figure 2. The HSI equipment and the main steps for establishing MCs distribution maps in tea buds by using HSI (a) the HSI system, (b) measurement results of MC in tea sample, (c) main steps for establishing MCs distribution maps in tea buds by using HSI.
Agronomy 15 01507 g002
Figure 3. The measurement principle and results of tea quality indices based on image color features [137] are illustrated as follows: (a) algorithm flowchart; (b) diverse images and average color with different fermentation time; (c) change rules of quality indices in the fermentation; (d) RMSEC values of sensory score for RF models from different PCs and N; (e) reference values of sensory score versus predicted values of RF models.
Agronomy 15 01507 g003
Figure 4. Computer vision system and feature extraction results presented by Wang et al. [73] are as follows: (a) computer vision-based system to obtain the tea image database, (b) flowchart of the proposed automatic tea classification system, (c) feature extraction of different teas.
Agronomy 15 01507 g004
Figure 5. The HSI system and the prediction models based on GA-SVR using different data fusion of spectral feature and textural features from hyperspectral images.
Agronomy 15 01507 g005
Figure 6. The computer vision system with non-destructive methods to predict the MC of tea leaves and the results are as follows: (a) image acquisition and feature extraction, (b) correlation analysis on visual features and MC, (c) linear PLS model to predict the relations between the image feature and MC, (d) non-linear SVM model to predict the relations between the image feature and MC.
Agronomy 15 01507 g006
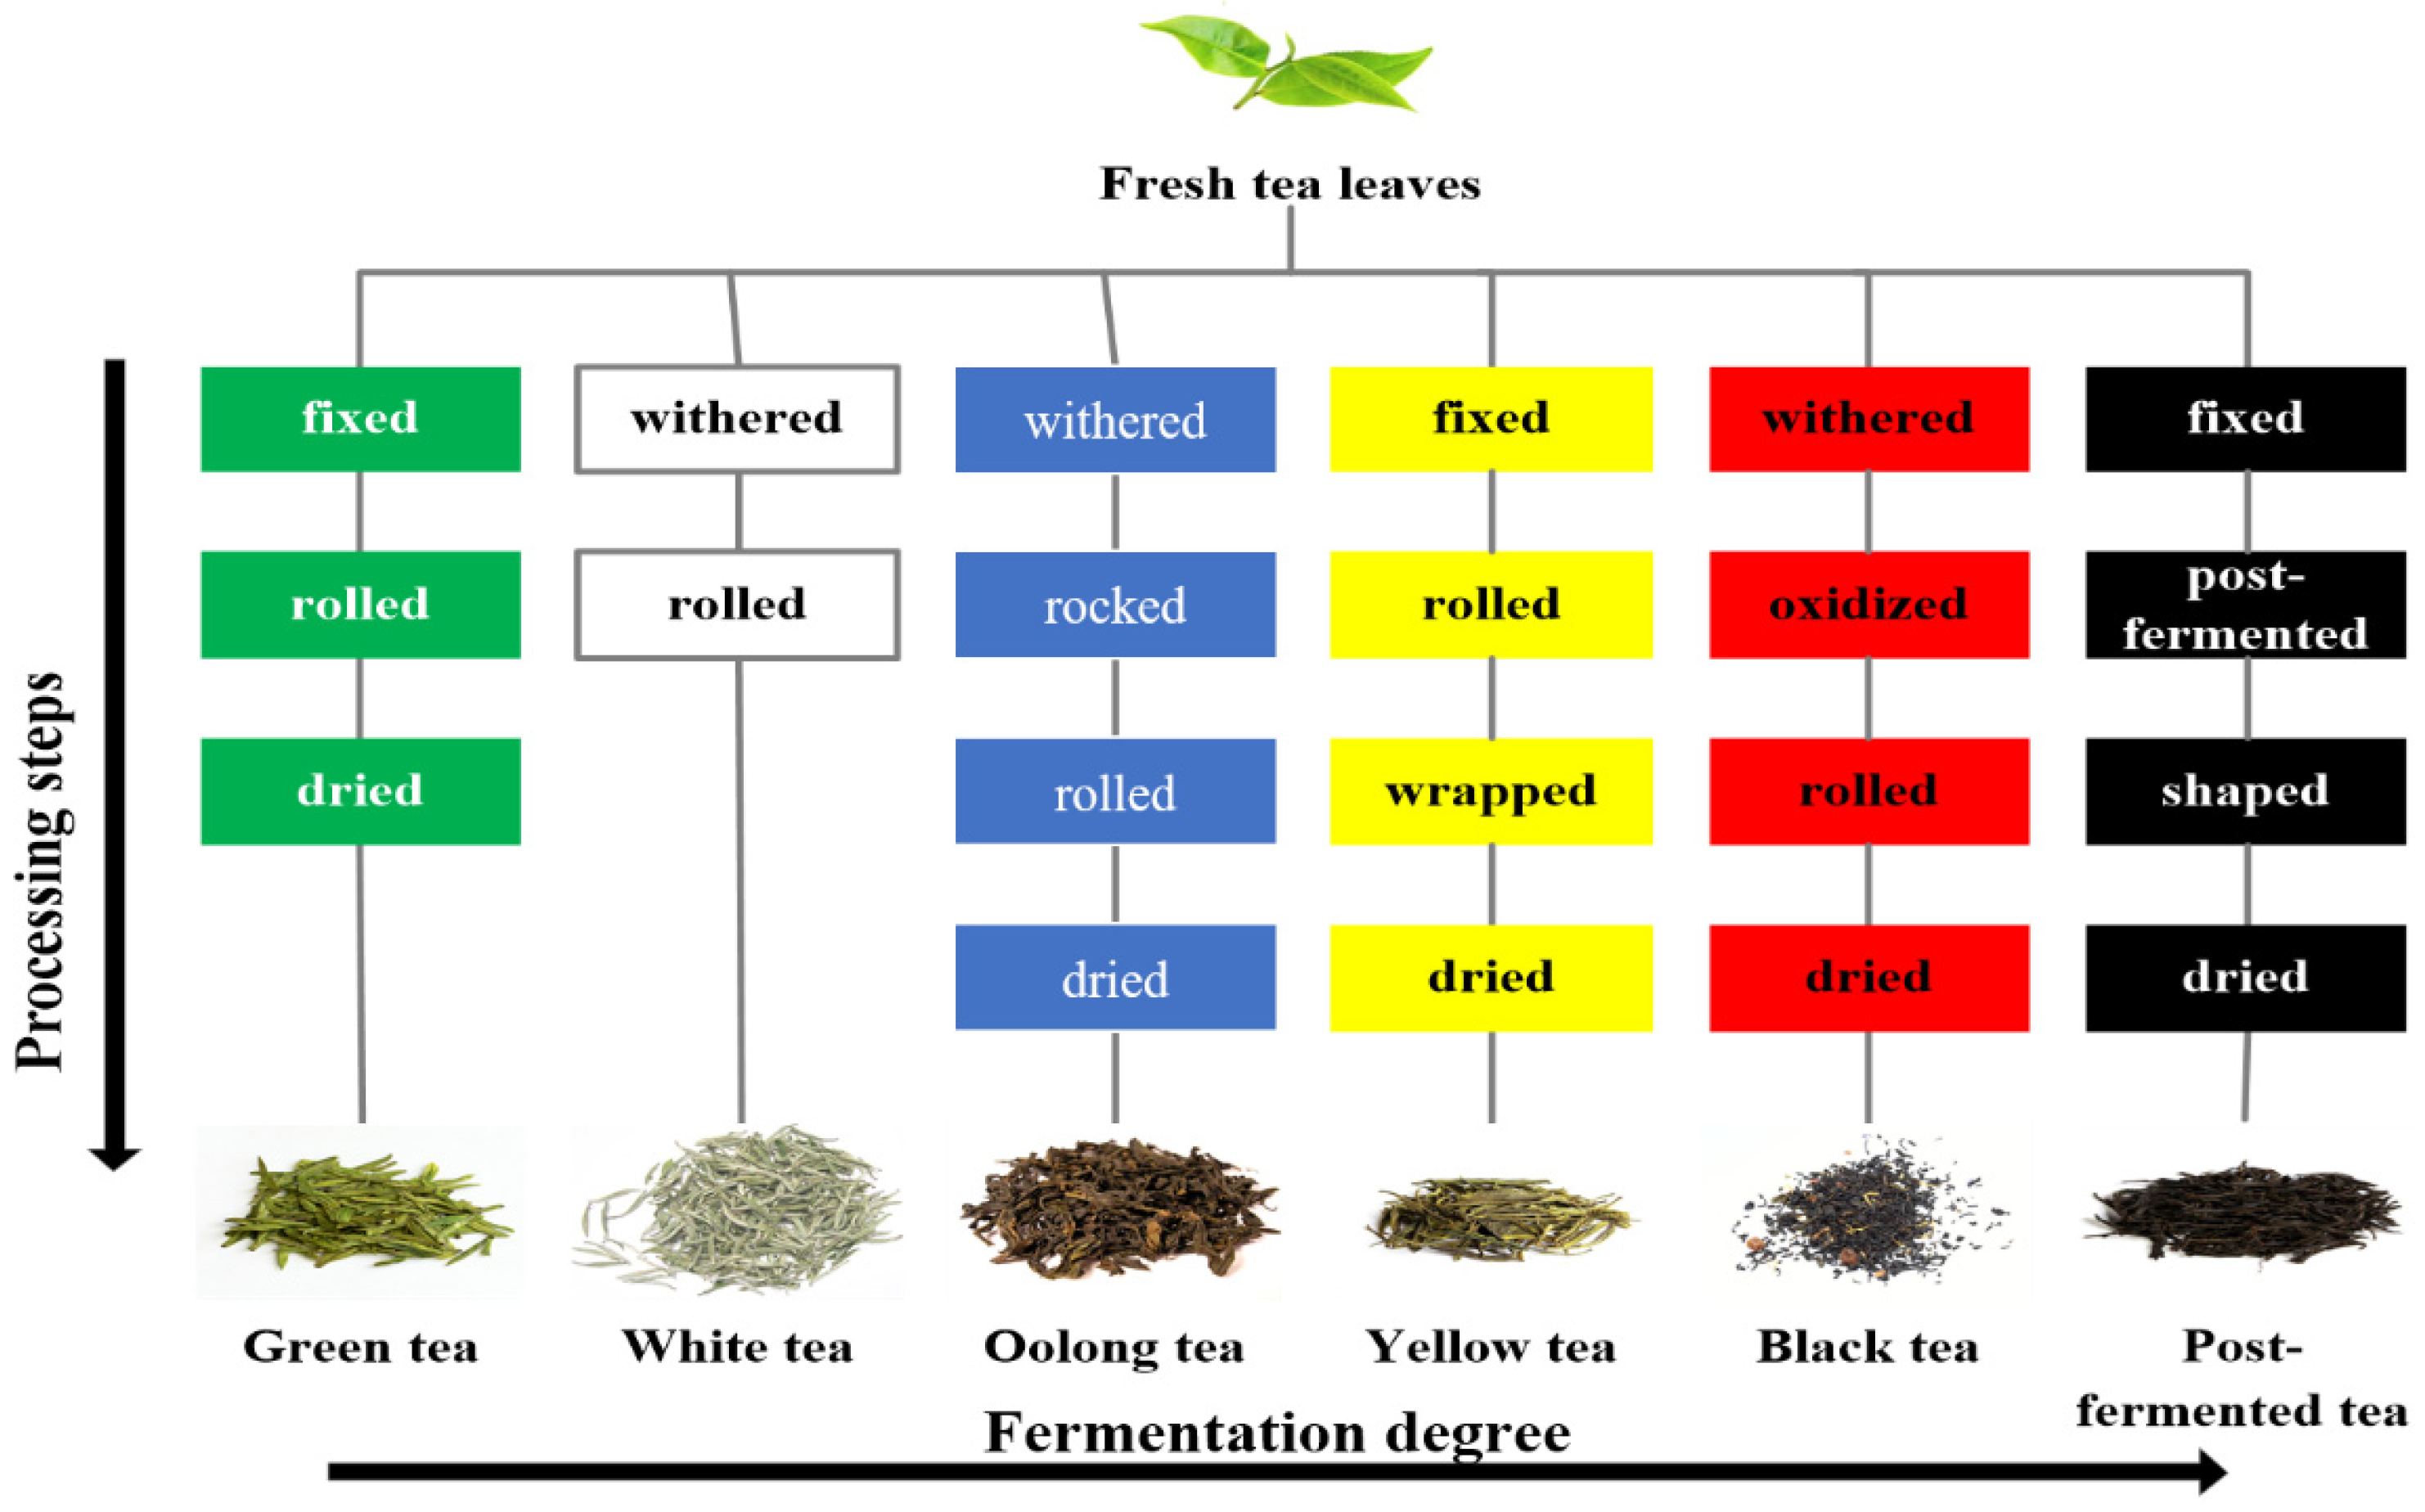
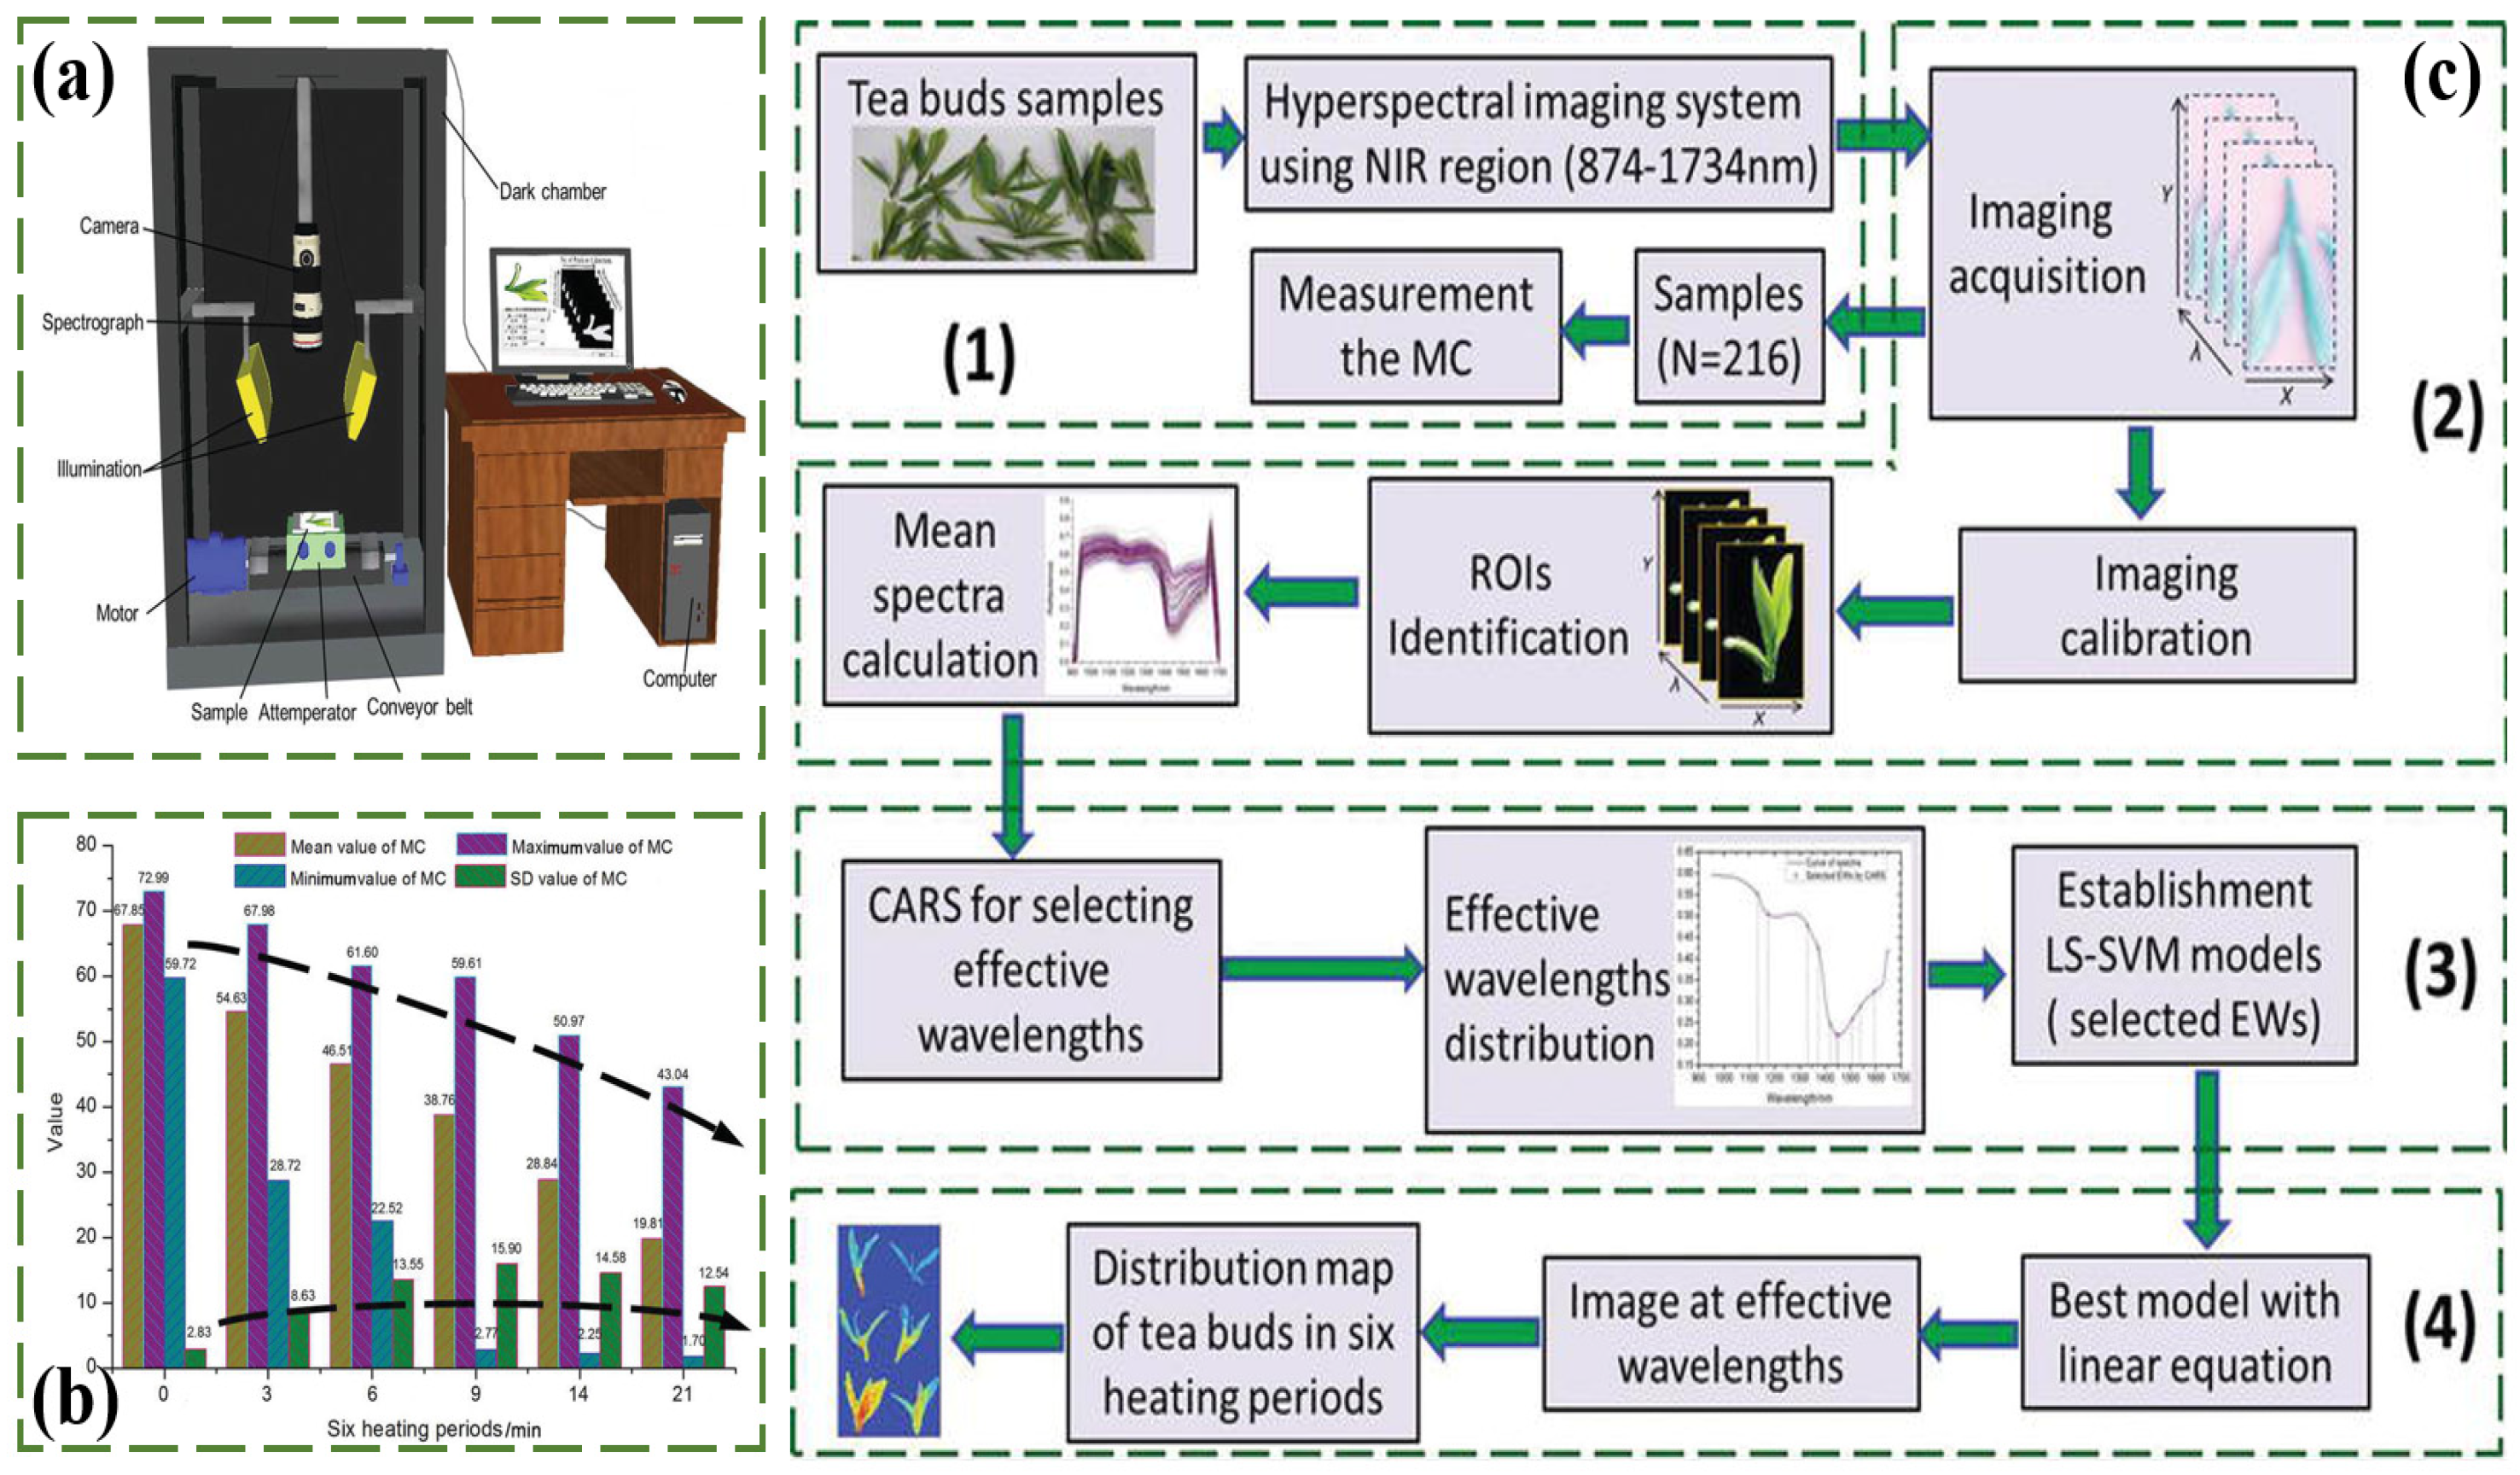
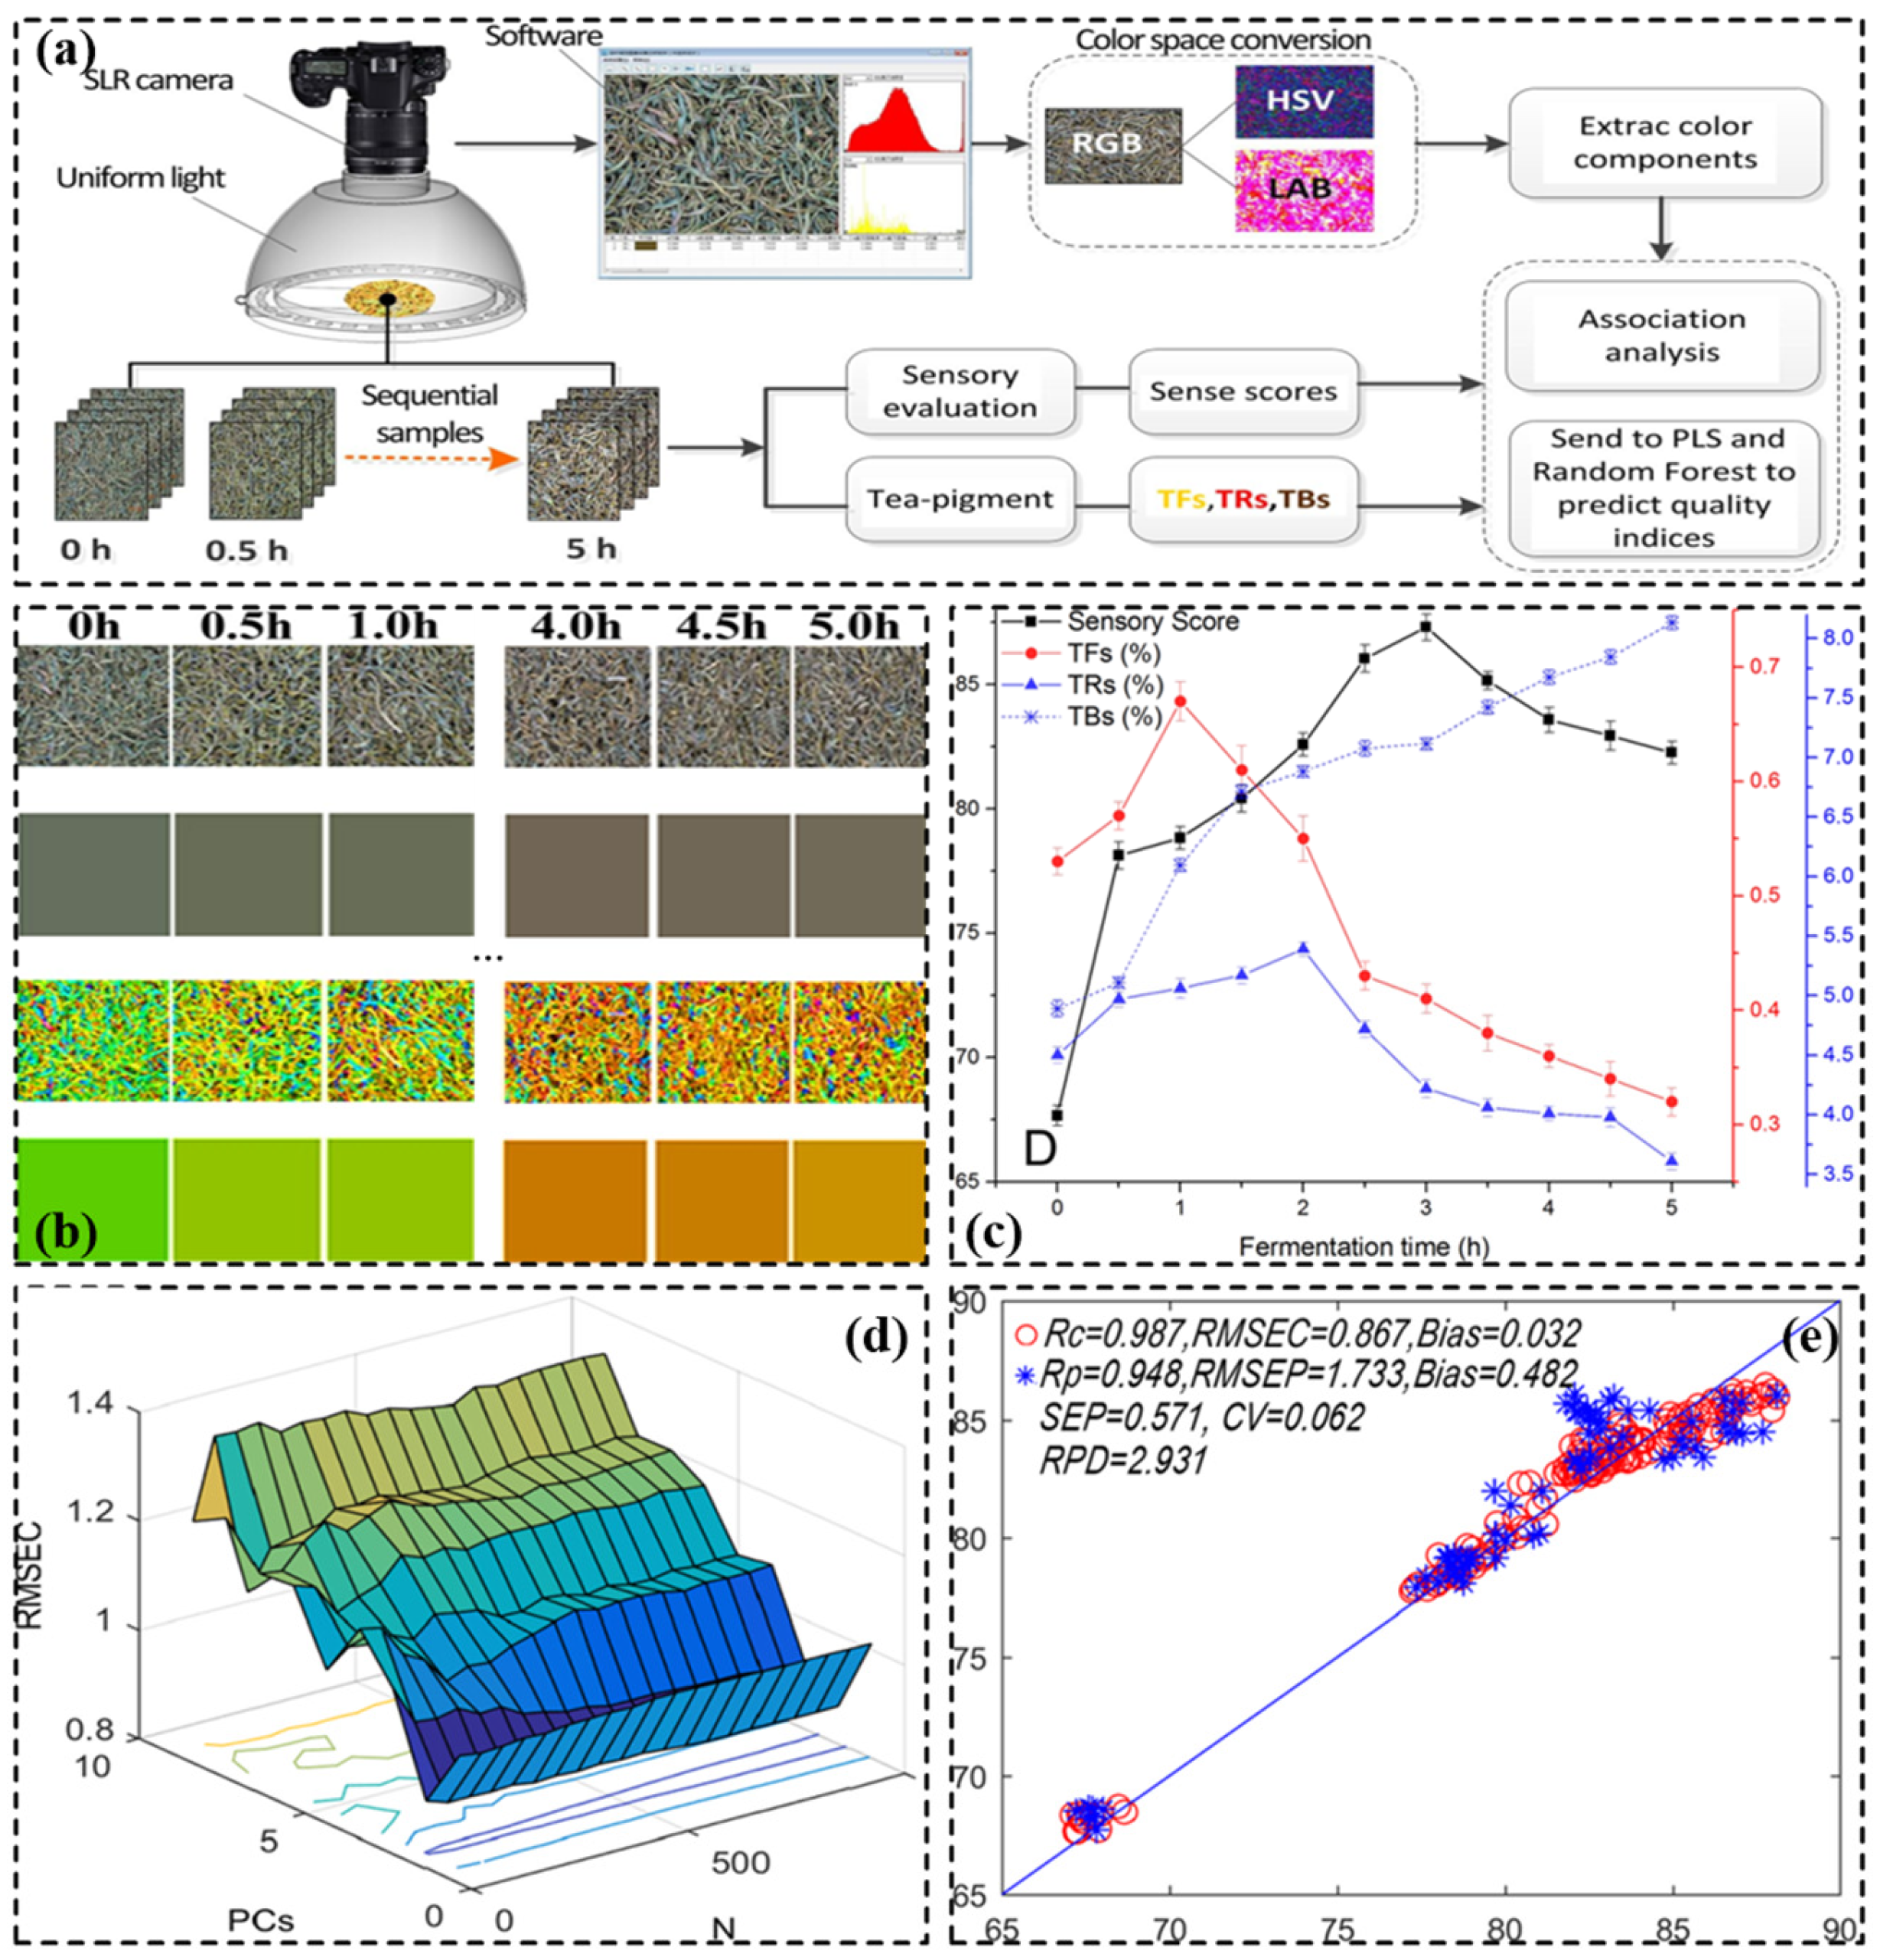
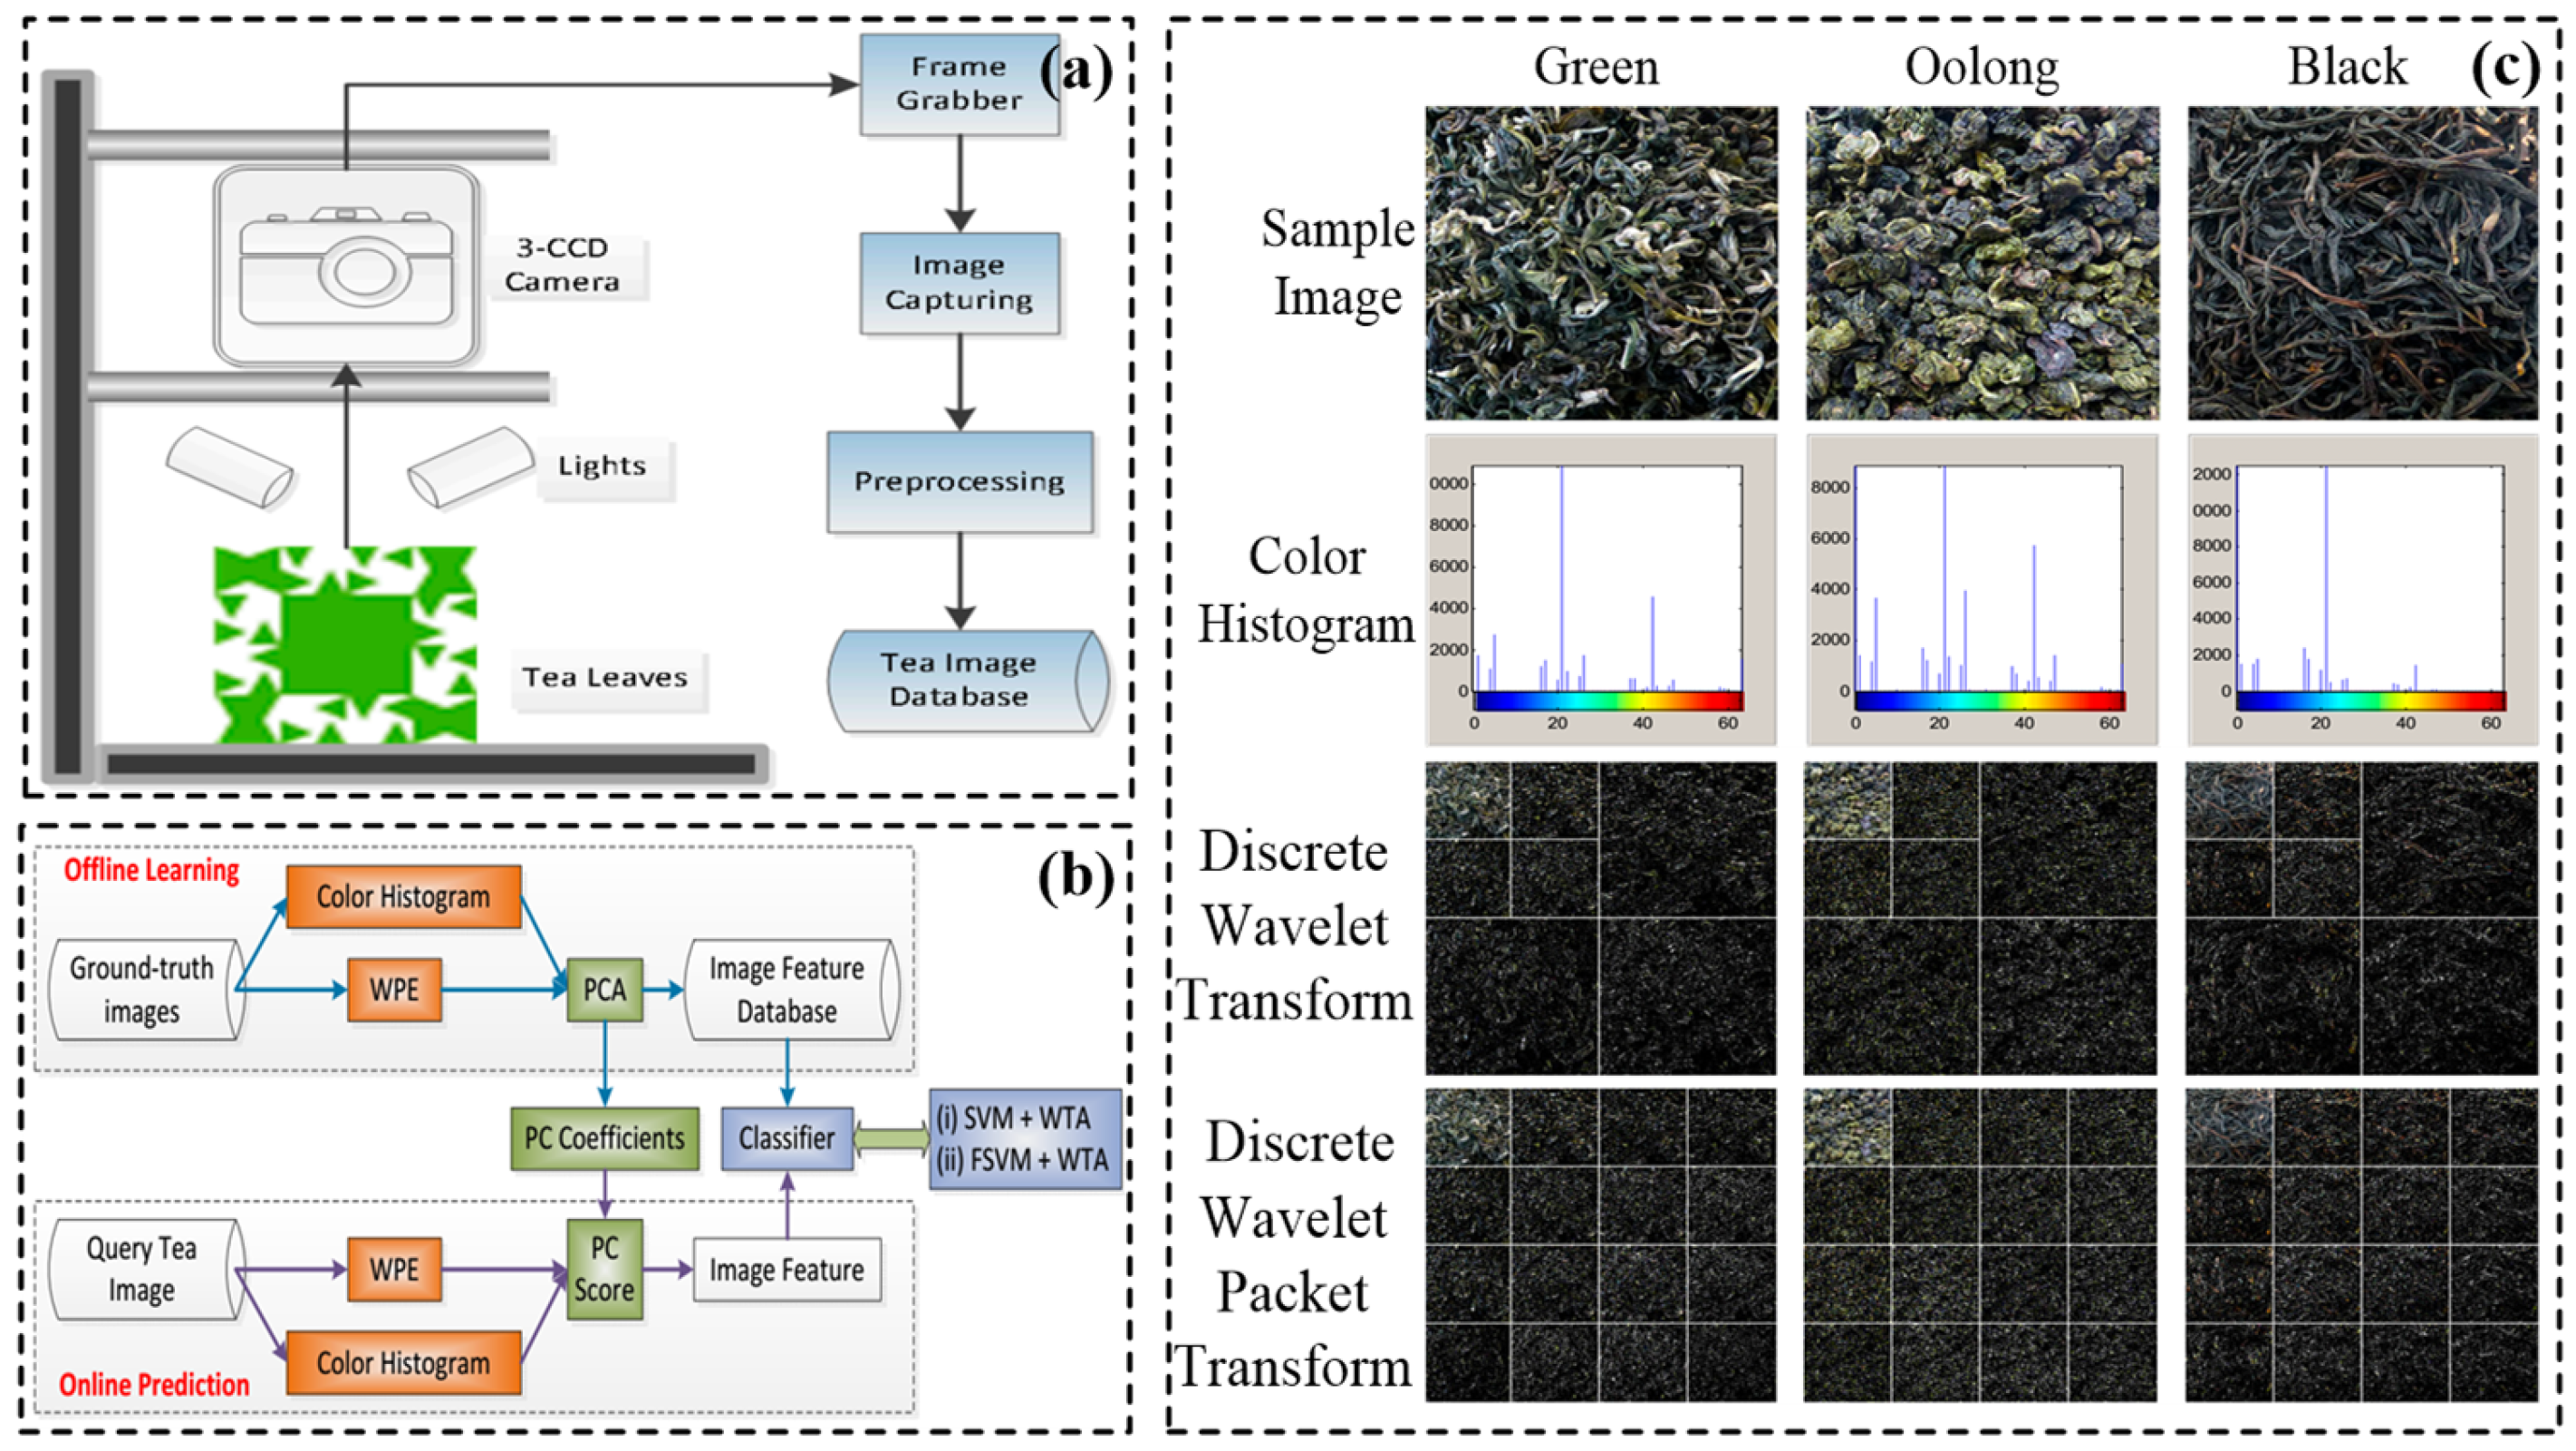
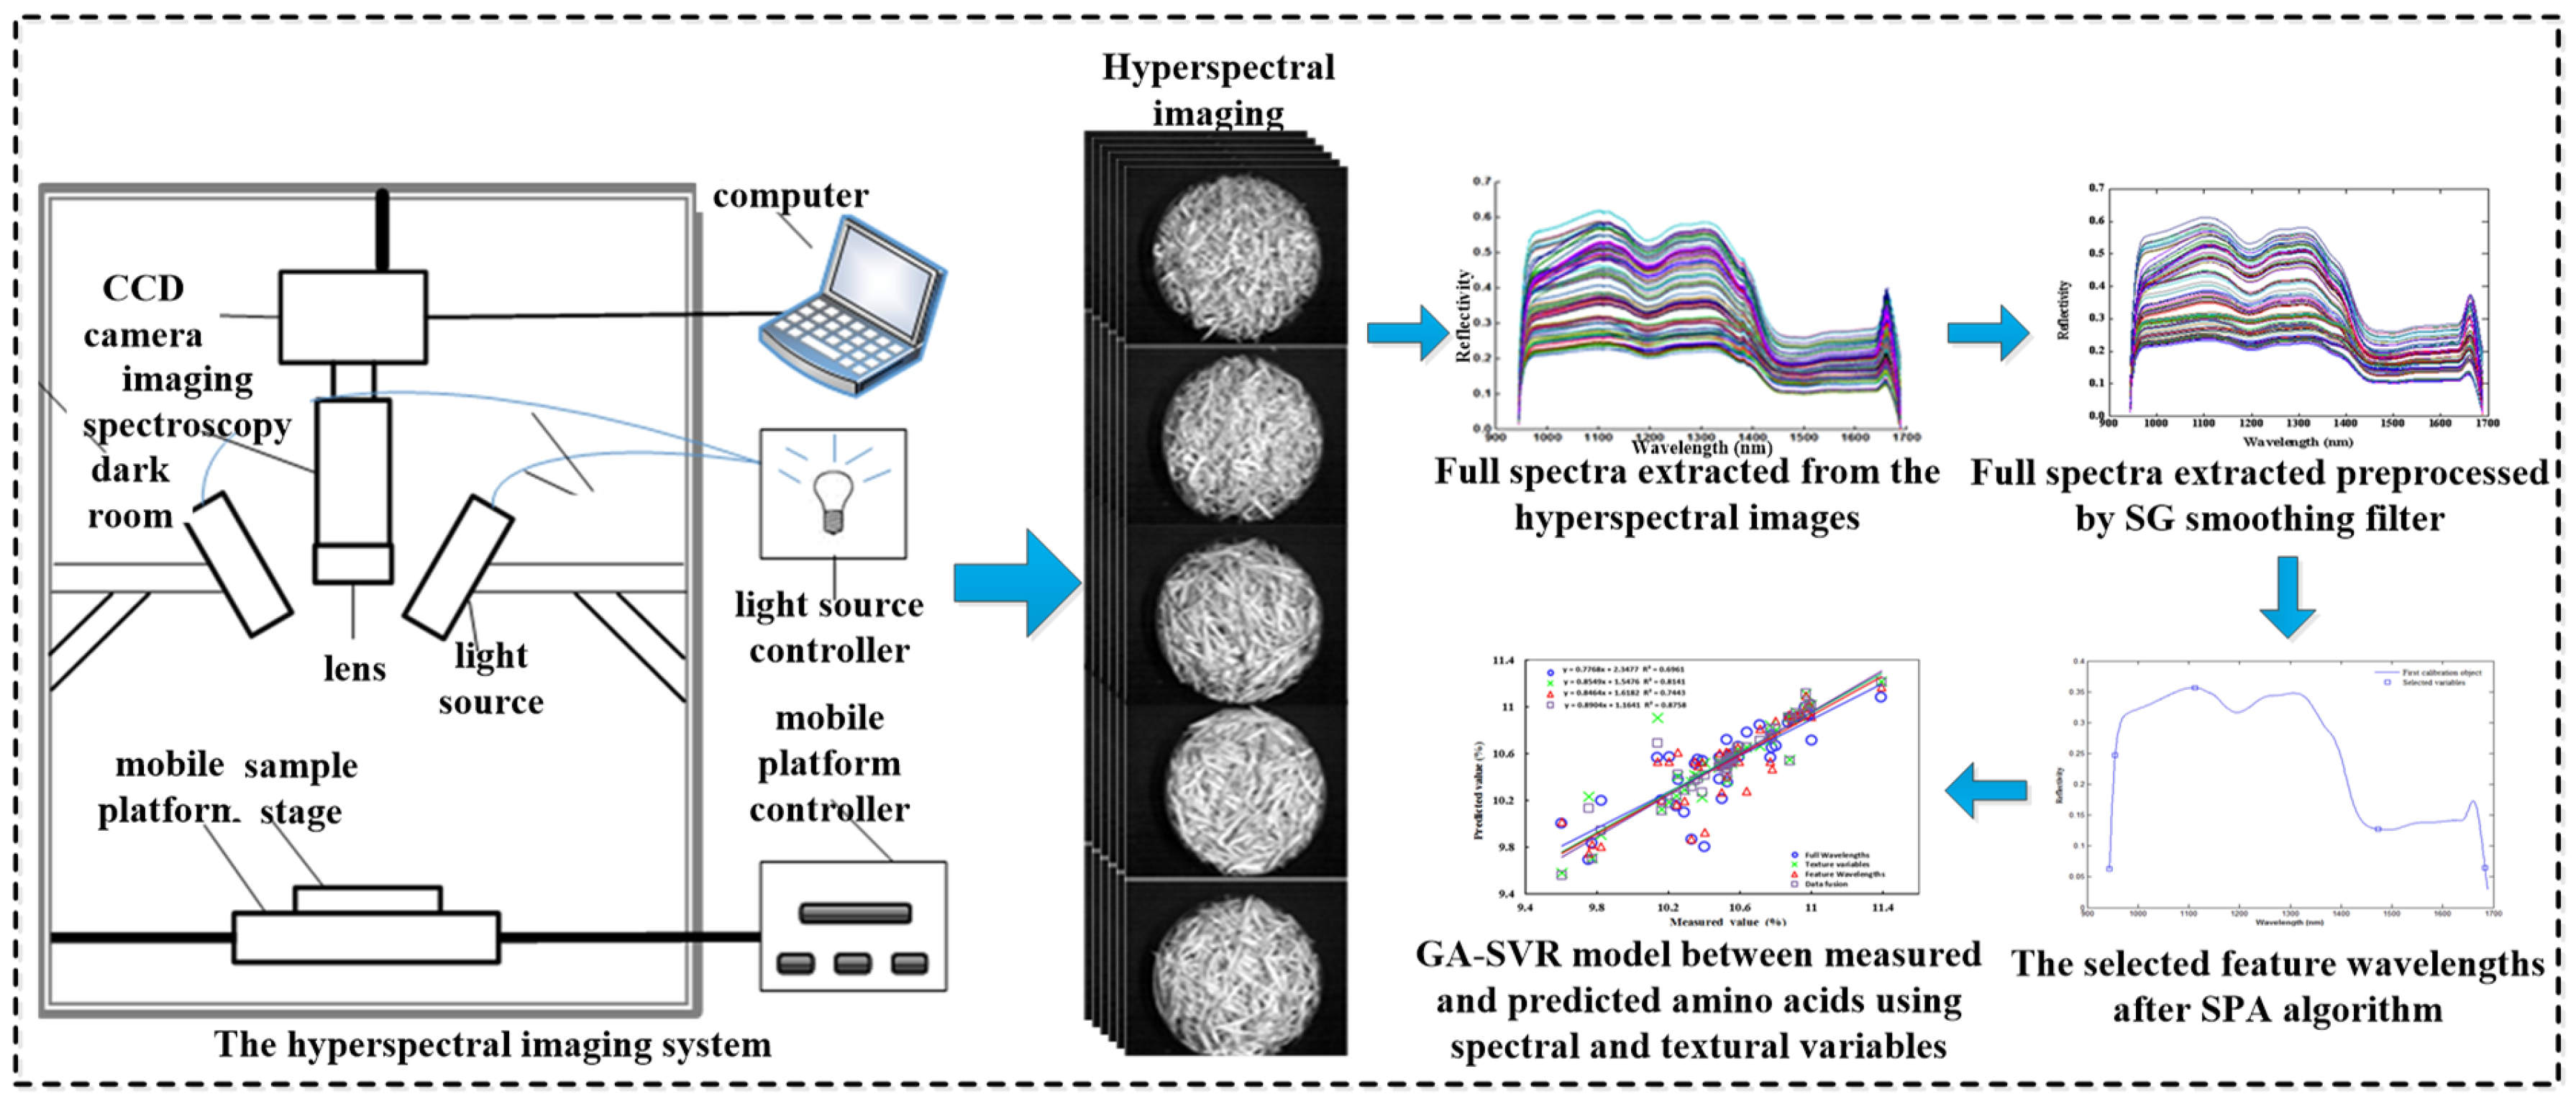
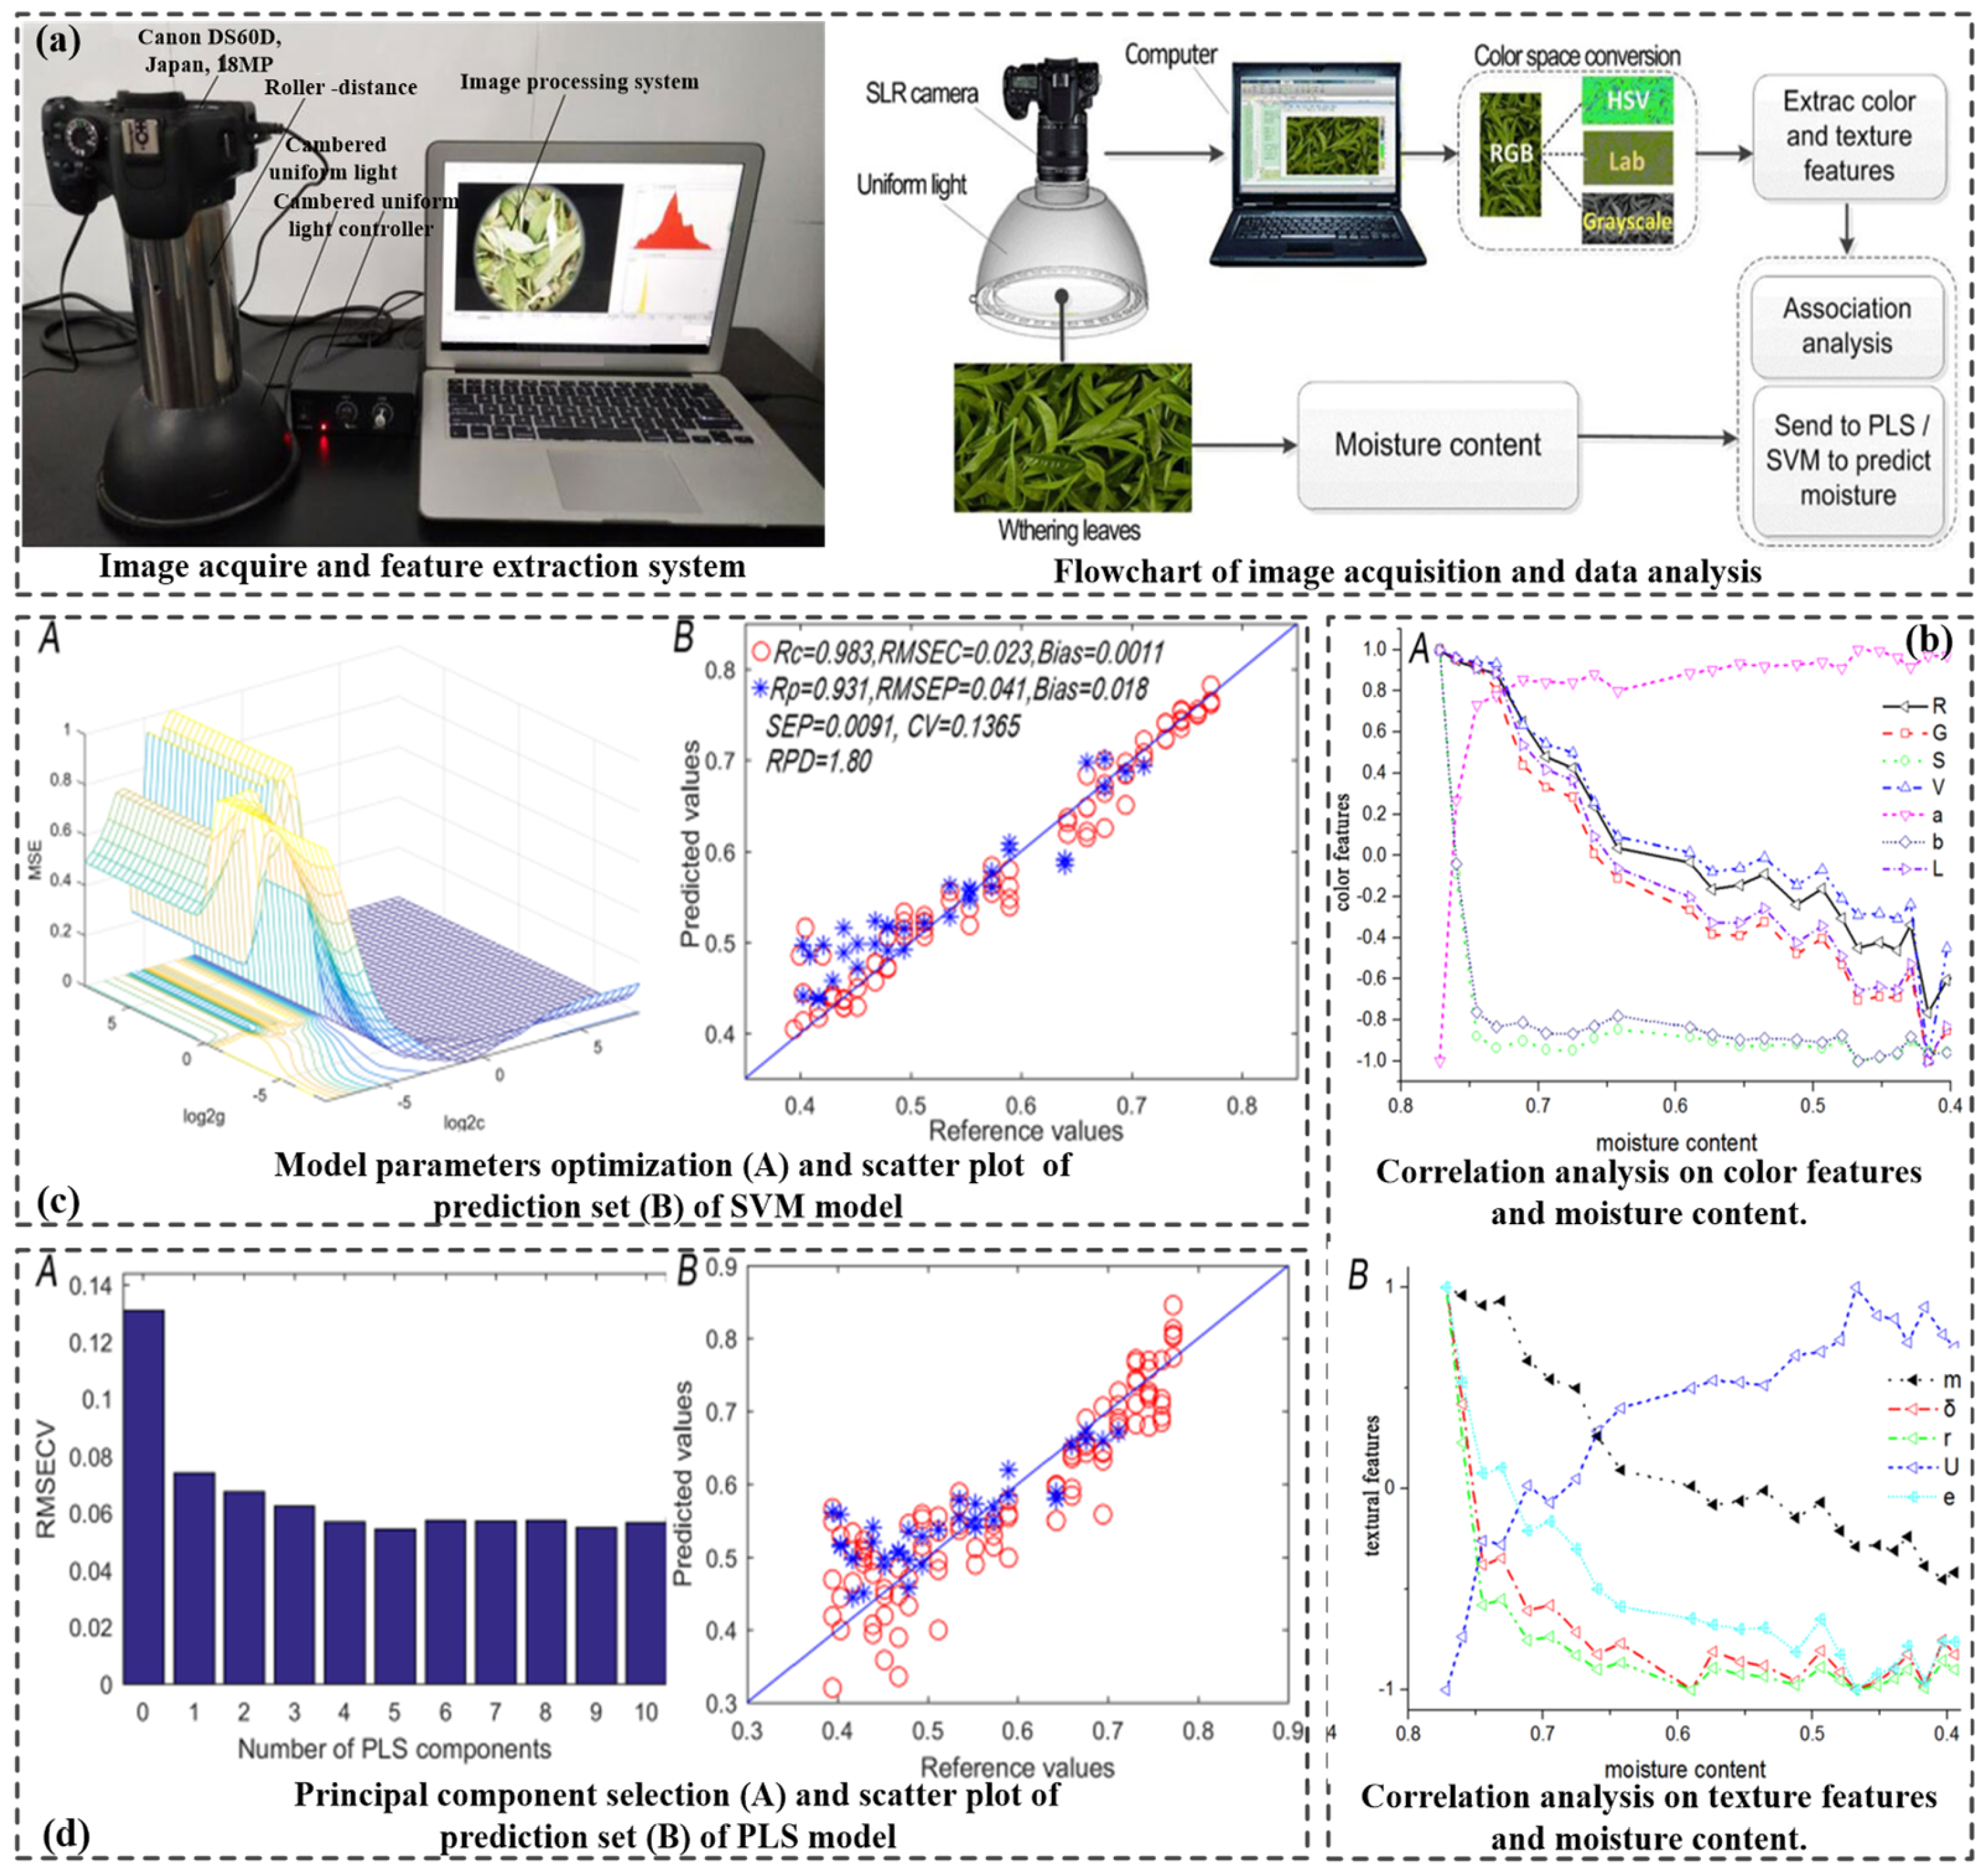
Disclaimer/Publisher’s Note: The statements, opinions and data contained in all publications are solely those of the individual author(s) and contributor(s) and not of MDPI and/or the editor(s). MDPI and/or the editor(s) disclaim responsibility for any injury to people or property resulting from any ideas, methods, instructions or products referred to in the content.

