Abstract
The accurate detection of tea buds in outdoor environments is crucial for the intelligent management of modern tea plantations. However, this task remains challenging due to the small size of tea buds and the limited computational capabilities of the edge devices commonly used in the field. Existing object detection models are typically burdened by high computational costs and parameter loads while often delivering suboptimal accuracy, thus limiting their practical deployment. To address these challenges, we propose TeaBudNet, a lightweight and robust detection framework tailored for small tea bud identification under outdoor conditions. Central to our approach is the introduction of Weight-FPN, an enhanced variant of the BiFPN designed to preserve fine-grained spatial information, thereby improving detection sensitivity to small targets. Additionally, we incorporate a novel P2 detection layer that integrates high-resolution shallow features, enhancing the network’s ability to capture detailed contour information critical for precise localization. To further optimize efficiency, we present a Group–Taylor pruning strategy, which leverages Taylor expansion to perform structured, non-global pruning. This strategy ensures a consistent layerwise evaluation while significantly reducing computational overhead. Extensive experiments on a self-built multi-category tea dataset demonstrate that TeaBudNet surpasses state-of-the-art models, achieving +5.0% gains in AP@50 while reducing parameters and computational cost by 50% and 3%, respectively. The framework has been successfully deployed on Huawei Atlas 200I DKA2 developer kits in real-world tea plantation settings, underscoring its practical value and scalability for accurate outdoor tea bud detection.
1. Introduction
Tea, as one of the most significant agricultural products globally, occupies a crucial position in world economic and cultural development [1,2]. According to the latest statistical data from Statista [3] and the International Tea Council [4], global tea consumption continues to expand, with annual consumption reaching up to 7.3 billion kilograms. Notably, China, as the world’s largest tea producer and exporter, achieved tea export volumes of 374,100 metric tons in 2024.
Tea buds, as the core raw material for tea production, primarily develop at the apex of tea branches and leaf axils [5]. Characterized by their delicate morphology and soft texture, they contain abundant bioactive compounds, including tea polyphenols, amino acids, and caffeine [6]. As a result, they play a central role in determining tea quality. In tea plantation management, the accurate detection and prediction of tea buds are critical for yield estimation, enabling producers to make informed, data-driven management decisions [7,8,9]. Moreover, due to their fragile epidermal structure, tea buds are particularly vulnerable to pest infestation [10]. Integrating computer vision technologies into tea bud detection could support pest monitoring and mitigate potential economic losses proactively. Traditional practices in tea bud harvesting and classification have relied heavily on manual labor. However, the ongoing expansion of tea cultivation, coupled with rising labor shortages in agriculture, increasingly impedes the scalability and industrial standardization of the tea industry [11,12]. Thus, precise and automated tea bud recognition has become vital technology for improving yield prediction, pest control, and mechanized harvesting.
In the domain of intelligent tea bud recognition, existing approaches are broadly categorized into two paradigms: traditional image processing and deep learning. Early efforts in the former leveraged low-level visual features. For example, Wang et al. developed a region-growing algorithm based on chromatic and contour features [13]; Wu et al. enhanced detection accuracy through LAB color space analysis combined with K-means clustering [14]; Tang et al. proposed a G-component-based tender leaf screening method coupled with an optimized Otsu segmentation strategy [15]. Additionally, Karunasena’s group integrated HOG descriptors with support vector machine classifiers to construct effective traditional models [16]. Wang et al. [17] implemented tea bud extraction using a method combining K-means clustering and image morphological processing. While these methods offered initial successes, they struggled in real-world scenarios. Field conditions—such as dynamic lighting, diverse angles, and meteorological variability—introduce significant variability in tea bud appearance. Compounding this, the high visual similarity between tea buds and surrounding foliage, along with their small size and complex background clutter, renders color- and shape-based segmentation inadequate for robust detection.
With the advancement of computer vision, deep learning has become the prevailing methodology for tea bud detection. State-of-the-art (SOTA) object detection models now dominate this space, offering significant improvements for estimating tea shoot quantities and locating tea shoot positions. However, in practical tea garden environments, tea buds are typically small, densely packed, and frequently occluded by leaves or branches. Environmental variables like lighting and background complexity further hinder detection reliability. To address these constraints, several enhanced detection frameworks have been proposed, for instance, the Tea-YOLOv8s model, which incorporates deformable convolutions, attention mechanisms, and spatial pyramid pooling to enhance feature representation and robustness [18]. By strengthening the model’s feature learning capability for complex-shaped targets, this approach significantly improves the accuracy and reliability of tea shoot detection. Building upon this, Liu et al. developed YOLO-TBD, integrating shallow feature maps with the Path Aggregation Feature Pyramid Network architecture and replacing standard convolutions with self-calibrating group convolutions [19]. Chen et al. [9] introduced a selective kernel attention mechanism and a multi-feature fusion module to capture local and global dependencies, achieving comprehensive and distinctive feature representation. To address multi-scale detection challenges, Lu et al. employed a dynamic head mechanism along with a lightweight C3Ghost module and -CIoU loss function to address scale variation and speed–accuracy tradeoffs [20]. The RT-DETR-Tea [21] model effectively optimizes deep features through a cascaded group attention mechanism and improves RepC3 using UniRepLKNet, enabling the efficient fusion of tea bud feature information.
However, in application scenarios such as real-time tea shoot monitoring for robotic harvesting, these complex models often fall short. Their high computational demands are incompatible with embedded systems and mobile terminals, where memory and processing resources are limited [22,23,24,25]. To address this, two key strategies have emerged: architectural lightweighting and post-training model compression.
On the one hand, lightweight architectural designs aim to reduce model complexity. For instance, Wang et al. reconstructed the YOLOv5 backbone by integrating lightweight Xception and ShuffleNetV2 modules, supplemented with reverse attention and receptive field blocks to enhance representational efficiency [26]. Similarly, Gui’s team employed Ghost convolutions and bottleneck attention modules to reduce computational load, further compressing the model via knowledge distillation and pruning [27]. On the other hand, post hoc methods such as knowledge distillation and pruning provide additional compression. Knowledge distillation enables knowledge transfer from teacher to student networks, while model pruning algorithms structurally eliminate redundant parameters. This significantly reduces computational complexity and storage requirements while preserving model performance. For example, Zheng et al. introduced the Reconstructed Feature and Dual Distillation framework, leveraging spatial attention-based masking and dual distillation to optimize feature learning in constrained environments [28].
This study proposes the following core hypotheses: An effective feature fusion architecture enhances the detectability of small tea bud targets, and analyzing layerwise contributions, followed by pruning redundant structures, reduces computational costs while improving accuracy.
Against this backdrop, we propose TeaBudNet, a novel lightweight detection framework tailored for small object tea bud recognition under complex natural conditions. Our key contributions include the following:
- Weight-FPN and P2 Module Design: We present a multi-scale feature fusion architecture that integrates weighted feature propagation and high-resolution shallow features. This significantly enhances the detection accuracy for small and multi-scale tea buds, achieving a +5.0% gain in mAP@50 compared to existing SOTA methods.
- Group–Taylor Pruning Strategy: A novel non-global pruning method grounded in Taylor expansion is introduced to structurally compress the model while preserving performance. This approach achieves a 50% reduction in parameter count and a 3% decrease in computational cost, alongside a 0.6% improvement in accuracy.
- Real-World Deployment and Dataset Contribution: We construct a benchmark multi-category tea bud dataset and demonstrate real-time deployment capabilities on Huawei Atlas 200I DKA2 edge devices. Field trials confirm the system’s practical utility for real-time tea bud monitoring in operational plantations.
2. Materials and Methods
The small size of tea buds and their high similarity to the background pose significant challenges for detection. Furthermore, the computational constraints of edge devices in outdoor environments impose stringent requirements on model size and computational load. To address these issues, this study proposes a novel multi-scale feature fusion framework that enhances the model’s capacity to discriminate subtle tea bud features across spatial hierarchies. Additionally, model pruning techniques not only substantially reduce computational overhead but also improve model accuracy. The overall research framework is illustrated in Figure 1.

Figure 1.
Research conceptual framework diagram.
2.1. Data Processing and Dataset Production
The data collection for this study was conducted from March to October 2024 at Wuben Tea Plantation in Mingshan District, Ya’an City, Sichuan Province, with the specific locations illustrated in Figure 2. To comprehensively capture tea bud information, a multi-source visual acquisition system was employed. This included both fixed and mobile imaging devices: dome-type Changhong CH001 cameras (Sichuan Changhong Electronic Holding Group Co., Ltd., Mianyang, China) were used for stationary capture, while mobile data were collected using smartphones and tablets from multiple brands, thereby ensuring broad device compatibility and heterogeneous image inputs.

Figure 2.
Spatial presentation of data collection sites.
In terms of imaging protocol, fixed cameras were installed with downward tilt angles to cover tea plantation plots at two distinct spatial resolutions (1–2 m2 and 5–10 m2). These systems were programmed for automated hourly image capture. In contrast, mobile data collection involved manual photography, with close-up images of tea buds captured every 1–2 weeks. Randomized angles and distances were applied to increase sample variability and mimic real-world visual conditions. This study focused on two representative tea cultivars, namely, Fuding Dabaicha and Sanhua 1951, with collection cycles spanning three tea growing seasons—spring (early March to late April), summer (late May to late July), and autumn (early September to early October).
To maximize data diversity and ecological validity, image acquisition was conducted under a variety of weather conditions (e.g., including rainy, sunny, and cloudy days) and during multiple timeslots between 7:00 and 18:00 daily. This spatiotemporally comprehensive strategy resulted in a robust tea bud image database with continuous phenological coverage across growth cycles.
To facilitate precise model training, rigorous manual annotation of the collected images was performed. Tea bud instances were labeled and saved in plain text format compatible with object detection frameworks. The annotated dataset was subsequently split into training, validation, and test subsets using a 60:20:20 ratio. A detailed summary of the dataset is presented in Table 1.

Table 1.
Tea bud detection dataset.
2.2. Deep Learning-Based Algorithm for Tea Bud Detection
2.2.1. TeaBudNet
Real-time object detection has been widely applied in fields such as industrial quality inspection, medical image analysis, and intelligent crop monitoring. The YOLO series, leveraging the unique advantages of its single-stage detection framework, has become a technical benchmark in this domain [29,30]. However, traditional YOLO models primarily rely on Convolutional Neural Networks (CNNs) to build their feature extraction systems. While they excel in balancing speed and accuracy, their inherent local receptive field characteristic limits their capabilities in modeling long-range dependencies and integrating global contextual information. Therefore, to better harness the efficacy of attention mechanisms in practical applications, YOLOv12 innovatively proposes a Region-Aware Attention mechanism and a Residual Efficient Layer Aggregation Network (Res-ELAN) [31]. These effectively mitigate two major technical bottlenecks: high computational complexity and low memory access efficiency. In the tea bud detection task addressed in this paper, this model demonstrates excellent performance across all metrics and is selected as the baseline model for further improvement.
To enhance the detection accuracy of multi-scale tea bud objects in images while accommodating lightweight deployment requirements, we propose TeaBudNet, a refined detection model built upon YOLOv12. A detailed structural comparison with the baseline models is presented in Figure 3. To address the limitations of conventional YOLO-based detectors in detecting tiny tea buds, TeaBudNet abandons the conventional feature concatenation operations in YOLOv12’s neck structure and innovatively introduces a multi-scale feature fusion module based on a dynamic weighting mechanism (Weight-FPN). Furthermore, an additional P2-level detection head is integrated into the original three-level detection head architecture of YOLOv12, thereby enhancing the model’s recognition and localization capabilities for small-scale tea buds. TeaBudNet not only improves detection accuracy but also significantly reduces model size, providing a more precise and lightweight solution for tea bud identification.

Figure 3.
TeaBudNet network structure diagram.
Addressing the issues of fine-grained feature loss and inadequate cross-scale modeling, which are common in micro-tea bud detection under natural conditions, this study proposes a systematic architectural optimization strategy. First, to mitigate information degradation during cross-layer feature fusion in traditional Feature Pyramid Networks (FPNs), a multi-scale feature fusion module based on a dynamic weighting mechanism (Weight-FPN) is designed. This module employs a bidirectional cross-scale connection structure and replaces the conventional concatenation operation with a non-linear fusion mechanism. Using convolutional kernels for channel alignment and a spatial attention-guided weighting unit, it enables adaptive, multi-level feature integration. Second, recognizing the difficulty of detecting small targets using conventional detection head structures, we introduce a P2 detection layer extension strategy. By reusing the down-sampled feature map from Stage 2 of the backbone network, this layer captures high-resolution shallow features essential for accurate small target localization. Furthermore, to support lightweight deployment on edge devices, a hierarchical group pruning optimization framework is proposed. This method clusters convolutional kernels via a channel correlation matrix, enabling a structured inter-group importance evaluation. Dynamic L1 regularization promotes intra-group sparsity, while a detection head sensitivity feedback mechanism adaptively tunes pruning thresholds. Collectively, these enhancements allow TeaBudNet to significantly reduce computational cost and model size while outperforming existing SOTA models in tea bud detection accuracy after fine-tuning.
2.2.2. Weight-FPN
To address the challenges of multi-scale tea bud detection, we adopt a cross-scale feature fusion framework based on the Bidirectional Feature Pyramid Network (BiFPN) and extend it through the design of an enhanced Weight-FPN architecture. This formulation enables us to integrate semantically rich features from deeper layers with geometrically detailed features from shallow layers while dynamically balancing their contributions. Specifically, given an input multi-scale feature set , where denotes the input feature at the i-th level, the core objective of feature fusion lies in constructing an effective transformation function to generate an optimized feature set .
The Feature Pyramid Network (FPN) pioneered a top-down lateral connection mechanism to enable hierarchical feature fusion, laying the groundwork for many modern object detectors. Building on this, the BiFPN introduced bottom-up pathways and assigned learnable weights to each input, facilitating adaptive, bidirectional feature interactions across scales. As illustrated in its architectural diagram, the fused outputs are formulated as follows:
In small tea shoot detection, while the high-resolution shallow-layer features preserve the geometric details of tea shoots (e.g., apex curvature and leaf margin demarcation), their limited semantic abstraction capability results in low inter-class discriminability and susceptibility to noise interference. Conversely, deeper features convey a richer semantic context due to hierarchical abstraction but at the cost of spatial resolution, often reducing small objects to minimal or ambiguous activations.
The core optimization of the Weight-FPN structure lies in the introduction of the fusion module, whose detailed architecture is illustrated in Figure 4. This module replaces traditional concatenation with a learnable fusion mechanism that integrates semantic and spatial information from different layers. Specifically, it accepts the feature map from the preceding fusion stage and supplementary features from other scales. Prior to fusion, convolutional layers are used for channel dimension alignment. This design enables the model to simultaneously integrate the semantic information from higher-level features and the spatial detail information from lower-level features, thereby significantly enhancing the model’s performance on multi-scale tea bud detection tasks.

Figure 4.
Fusion structure diagram.
2.2.3. Model Pruning
In the practical deployment of tea bud detection models, model lightweighting, inference efficiency optimization, and generalization performance enhancement constitute the core technical requirements. Given the computational and memory limitations of edge computing terminals (such as UAV-mounted vision systems, portable intelligent terminals, and distributed vision sensor nodes), we adopt an efficient structured pruning strategy to reduce model complexity. Pruning techniques address the parameter redundancy intrinsic to deep neural networks. This technique systematically prunes less contributive weights, channels, or neurons by establishing structured or unstructured importance evaluation criteria, thereby significantly reducing computational complexity and storage overhead while largely preserving model performance.
To train the network via pruning techniques in order to minimize the error (E), the optimization objective is defined as follows: given a parameter set W of a neural network and a dataset D, the inputs are x, and the outputs are y. Specifically, the optimization objective can be expressed as
Here, denotes the error over the entire dataset D, while represents the error of the output y given input x and network parameters W. By minimizing this error, we can effectively reduce the network’s complexity while largely preserving its performance.
Conventional pruning techniques typically rely on heuristic criteria such as weight magnitude, which may not reliably correlate with a neuron’s true contribution. Additionally, these methods often lack support for complex architectures like skip connections, which makes it difficult for them to accommodate the increasingly diverse architectural requirements of modern deep neural networks [32]. To address these issues, built upon the TeaBudNet model architecture, this study proposes a pruning algorithm based on Taylor expansion for importance estimation. This algorithm estimates importance by computing the first-order Taylor approximation of the loss function. Furthermore, by incorporating gating units after batch normalization layers, it achieves a unified quantization of importance scales across different network layers, thereby effectively overcoming the inherent drawbacks of traditional pruning methods.
To identify the neurons that contribute the least to the network, this study quantified each neuron. Mathematically, the importance of neuron is defined as the squared change in loss upon its removal:
Therefore, can be regarded as a function solely of , denoted by . In this case, for the univariate function , its second-order Taylor expansion in the vicinity of the expansion point can be approximately expressed as
Substituting this second-order expansion into Equation (3), we obtain
Since the second-order expansion retains only terms up to , all terms of the third order and higher are neglected. Through Taylor expansion approximation in the parameter neighborhood, an efficient computational formula is derived:
The gradient is directly utilized from the intermediate results of backpropagation, requiring no additional computation.
To address the scale inconsistency in cross-layer pruning (particularly with batch normalization layers and skip connections), we embed a gating variable . This variable is embedded at the output of the neurons targeted for pruning, making their importance directly equivalent to the group contribution:
This approach avoids layerwise sensitivity analysis and supports a globally consistent evaluation across layers, including those with skip connections.
Building on this principle, the proposed pruning algorithm employs a progressive removal strategy to maintain training stability. This strategy integrates gradient accumulation with stepwise pruning techniques, followed by dynamic fine-tuning after pruning. Consequently, it effectively achieves the model compression objective while preserving model accuracy. The specific pruning process is described in Figure 5.

Figure 5.
Group–Taylor policy flow diagram.
2.3. System Deployment
The Tea Bud Intelligent Monitoring System comprises the following core components: a Huawei Atlas 200 DK A2 (Huawei Technologies Co., Ltd., Shenzhen, China) development board serving as the master control unit for data processing and system coordination; a 12-megapixel color USB industrial high-definition camera for capturing images of tea leaves in the plantation; a 220V high-efficiency power supply system ensuring continuous and stable operation in outdoor environments; and a 5G outdoor network module enabling high-speed, stable data transmission. All components are integrated and mounted onto a robust vertical pole and horizontal arm steel structure designed to withstand outdoor environmental conditions (Figure 6).

Figure 6.
Schematic diagram of intelligent tea sprout monitoring equipment.
The monitoring device is installed on a 3 m high vertical pole with a horizontal arm supporting the camera at 2 m above the canopy. Cable routing is optimized with exit ports and universal joints for flexibility.
The base of the device is securely anchored using a robust steel ground cage and a heavy flange plate, ensuring safety and stability under adverse weather conditions. Key control equipment is protected in a stainless steel box at the base, ensuring electromagnetic isolation and environmental shielding.
Following successful validation through laboratory testing, this Tea Bud Intelligent Monitoring System has been deployed in a tea plantation located in a southwestern province of China. The systems are strategically positioned at multiple key monitoring points within the plantation, performing 24 h uninterrupted data acquisition. A total of three units have been deployed in this instance, with each unit covering an area of approximately 20 square meters.
3. Results
3.1. Configuration of Experimental Base Environment
All the experiments in this study are based on the Pytorch deep learning framework, which is used to build the models under the Python 3.11 development environment with the Pytorch 2.6.0 deep learning framework, CUDA version 12.6, and CUDNN version 9.0.5. The main configurations of the project machine are as follows: the CPU is Intel(R) Xeon(R) Platinum 8383C @ 2.70 GHZ (Intel Corporation, Santa Clara, CA, USA); the running memory is 128.0 GB RAM (Kingston Technology Corporation, Fountain Valley, CA, USA); the GPU is NVIDIA GeForce RTX4090 24 G (NVIDIA Corporation, Santa Clara, CA, USA); the operating system is Ubuntu22.04 64-bit (Canonical Ltd., London, UK); and the specific experimental parameter settings are shown in Table 2.
Table 2.
Experimental parameter settings.
3.2. Comparison with State-of-the-Art Models
This section presents a comprehensive comparison of the model performance of TeaBudNet and ten representative object detection models, including RT-DETR, the YOLOv5-v12 series, RTMDet- tiny, and D-FINE. All models were trained and tested on the same dataset to ensure the consistency of the evaluation. For this benchmark comparison, models with greater generalization capabilities and broader application scopes in recent years were selected. Additionally, since this paper focused on relatively lightweight models, larger variants like YOLO-World were not included, emphasizing the advantages of lightweight models in object detection. Furthermore, earlier object detection models such as Faster R-CNN and SSD were also excluded from the comparison, as their detection capabilities now struggle to meet the demands of current daily detection tasks.
As shown in Table 3, TeaBudNet outperforms the other models in multiple key metrics. Specifically, in terms of detection accuracy, it achieves a precision of 77.5% and a recall of 78.9%, exhibiting superior balance between recall and precision compared to the other models. TeaBudNet attains an mAP@0.5 of 84.6% (+5.0%), outperforming the 79.6% achieved by YOLOv12. In addition, the parameter count of TeaBudNet is reduced by 1.61 M compared to that of YOLOv12, representing a decrease of 62.9%. With a computational cost of merely 6.1 GFLOPs, TeaBudNet achieves an mAP@0.5:0.95 of 46.6%, significantly surpassing comparable models; this represents a 7% increase over that of YOLOv11 (39.6%) and a 4.5% increase over that of YOLOv12 (42.1%). Experimental results demonstrate that, by optimizing the network architecture and feature fusion mechanism, the model complexity is reduced, while detection performance is improved.
Table 3.
Comparison of the performance of different state-of-the-art models.
3.3. Ablation Study
3.3.1. Validation of the Validity of Model Improvements
(1) Quantitative Analysis
A quantitative analysis confirms the effectiveness of the P2 layer, Weight- FPN, and pruning module through systematic ablation experiments. As shown in Table 4, the model’s parameter count decreases from 2.56 M in the base model to 0.95 M, FLOPs are optimized from 6.3 G to 6.1 G, and mAP@0.5 progressively increases from 79.6% to 84.6%. The P2 layer significantly enhances the detailed representation capability of shallow features, effectively preserving the fine structural characteristics of tea bud tips and young leaves. This leads to a 1.7% increase in mAP@0.5 to 81.3% while simultaneously reducing the parameter count by 0.32 M. Its efficiency is manifested in reduced parameters while optimizing the channel dimensions of high-level features. After introducing Weight-FPN in the neck part, the model’s detection performance further improves, achieving an mAP@0.5 of 83.8% and reducing the parameter count to 1.71 M. Weight-FPN enhances the expressive power of multi-scale features, enabling the model to capture target features of different scales more accurately. Furthermore, by introducing the Group–Taylor pruning strategy and removing redundant model structures, the parameters are substantially reduced to 0.95 M, with an FLOPs of 6.1 G, which significantly lowers the model’s complexity and computational cost. Simultaneously, mAP@0.5 increases from 0.8% to 84.6%. This enhances the model’s lightweight nature while maintaining high accuracy, making it more suitable for deployment in resource-constrained outdoor environments.
Table 4.
Comparison with different modules.
(2) Qualitative Analysis
To delve into the model’s feature focusing mechanism and visualize its decision rationale, this study employs GradCAM (Gradient-Weighted Class Activation Mapping) for a qualitative analysis. The core principle of GradCAM lies in utilizing the gradients of the target class score with respect to the feature maps of the final convolutional layer. By calculating gradient weights and performing global average pooling, it generates class activation heatmaps that reflect the model’s regions of interest. Areas of high activation (typically denoted in red) within the heatmap intuitively identify the spatial locations in the input image that are most discriminative for the model’s current class prediction.
Based on a comparison of heatmaps generated by GradCAM (as shown in Figure 7), model performance is evaluated before and after improvements on representative tea bud detection samples. The heatmaps generated by the improved model exhibit a significantly enhanced thermal response intensity (i.e., denser red regions) over tea bud target areas and cover a noticeably increased number of objects of interest (Figure 7). This reveals an enhanced spatial focus on key features of individual tea bud targets (such as bud tips and young leaves), highlighting better local feature extraction and generalization. However, its activation regions have a broader coverage of multiple target instances present in the image, significantly expanding the model’s effective receptive field and recognition capability for multi-target detection in complex scenes.
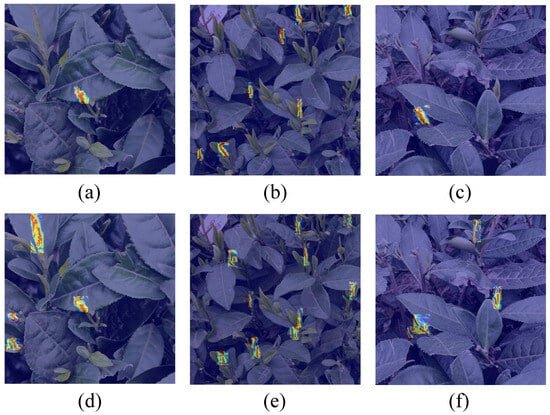
Figure 7.
Comparison of heatmaps before and after improvement. Subfigures (a–c) illustrate the heatmap effects before the improvement, while subfigures (d–f) show the effects after the improvement.
(3) Detection Performance Comparison: Before vs. After Enhancement
To evaluate the model’s robustness in complex natural environments, we conduct comparative experiments in typical extreme scenarios, including strong light (Figure 8a,e), blur (Figure 8b,f), dense targets (Figure 8c,g), and interleaved occlusion (Figure 8d,h). Figure 8 below visually compares the tea bud detection performance of the original and improved models under these scenarios. The visual results demonstrate that TeaBudNet exhibits substantial performance gains and enhanced stability under all extreme conditions: it significantly outperforms the original model in low signal-to-noise-ratio scenarios such as strong light and blur. Particularly noteworthy is its substantially improved ability to distinguish small targets (tea buds) in highly crowded scenes with interleaved occlusion. This effectively mitigates adhesion-induced false detections between adjacent targets and missed detections caused by partial occlusion, thereby validating its reliability and advancement in practical applications.

Figure 8.
Comparative visualization of detection results before and after model improvement under different environmental conditions. Subfigures (a–d) present the detection results before improvement, while subfigures (e–h) demonstrate the enhanced performance after modification.
3.3.2. Comparison of the Effectiveness of Different Fusion Structures
This subsection compares the performance of five different fusion modes within the BiFPN, with specific comparison results presented in Table 5. Among the five fusion structures, the weight mode achieves optimal performance across multiple key metrics, notably outperforming other modes with 78.7% precision and 82.9% mAP@0.5. This advantage primarily stems from its dynamic weight allocation mechanism, which adaptively adjusts the fusion weights for features at different scales, thereby more effectively balancing precision and recall. In contrast, while the adaptive mode achieves a higher recall (78.6%), its precision is lower (72.2%), indicating a higher false-positive rate during target detection. The default mode, due to its lack of weight optimization, exhibits mediocre performance. Furthermore, the weight mode also demonstrates excellent computational efficiency: its parameter count (1.59 M) and FLOPs (6.3 G) are only slightly higher than those of the default mode, yet it delivers significant performance gains. This indicates its efficient utilization of computational resources through the fast normalized fusion mechanism. Therefore, within this study, the weight mode represents the superior choice.
Table 5.
Comparison of results of different fusion modes within the BiFPN on the tea bud dataset.
From a theoretical perspective, the weight mode in the BiFPN employs fast normalized fusion. It dynamically emphasizes important features (such as detail information of small objects) through learnable weights while suppressing irrelevant or conflicting features. This mechanism not only avoids the computational overhead associated with softmax but also effectively reduces semantic discrepancies during the fusion of high-level and low-level features, consequently enhancing detection accuracy. By contrast, other modes (such as adaptive or SDI) lacking this adaptive optimization are prone to introducing noise or overlooking critical features, leading to performance degradation.
The quantitative results are presented in Table 6. This table displays the detection data for the three images shown in Figure 7. After the model improvement, both the IoU and NCC metrics show significant enhancements, with average increases exceeding 50% and 40%, respectively. The improvement in the IoU suggests more precise bounding box predictions. The increase in NCC indicates a higher degree of alignment between the activation patterns in the heatmap and the target regions. Collectively, these results demonstrate that the improved model not only performs well in extracting target features but also achieves effective improvements in bounding box regression.
Table 6.
Comparative quantitative analysis of detection heatmap metrics: model before vs. after enhancement.
3.3.3. Comparison of Different Pruning Methods
Six pruning strategies are compared in terms of model compression and key metrics (detailed in Table 7), covering strategies such as Basic (unpruned baseline), Random, Lamp, Group-Norm, Group–Hessian, and Group–Taylor strategies. An analysis reveals significant differences among the pruning strategies in balancing model efficiency (parameter count and FLOPs) and detection accuracy: pruning methods can compress the parameter count by approximately 44% and reduce FLOPs by about 52% on average (Table 7); however, their performance varies considerably, highlighting the importance of the pruning strategy for the model’s ability to retain crucial discriminative information. Among the various methods, the Group–Taylor method achieves the best overall performance: 84.6% mAP@0.5 (+0.8% over baseline), 77.5% precision (+3.2% over baseline), and 78.9% recall (Table 7). It balances compression and accuracy effectively, outperforming methods like Lamp and Group–Hessian (Table 7). This result strongly proves that Group–Taylor-based pruning not only efficiently compresses the model but also enhances overall detection performance by optimizing the model’s representational capacity through the removal of redundant parameters. The specific pruning process and effects are illustrated in Figure 9.
Table 7.
Comparison of the effects of different pruning methods.

Figure 9.
Model pruning process and effect display diagram.
3.3.4. Model Robustness Validation
To further verify the model’s generalization capability and robustness, this paper collected two open-source datasets, denoted as and , which contain 6242 and 1600 images, respectively. The performance of the model on these datasets could be used to evaluate its generalization. Additionally, this experiment primarily focused on evaluating the generalization capability of the TeaBudNet model under different data distributions. To this end, we selected representative mainstream object detection frameworks for comparison, including RT-DETR, RTMSet, D-FINE, and YOLOv12.
The experiment followed a standard training–validation procedure: all models were fully trained on both the and datasets and subsequently evaluated on their respective independent validation sets. As shown by the experimental data in Table 8, the TeaBudNet model demonstrated impressive accuracy and superior generalization capabilities, even when trained and validated solely on open-source datasets. TeaBudNet comprehensively outperformed all baseline models across all evaluation metrics. Specifically, it achieved mAP@0.5 scores of 71.7% and 76.1% on the and datasets, respectively, significantly outperforming the second-best model by margins of approximately 1.1 and 2.4 percentage points.
Table 8.
Validation of the effectiveness of the TeaBudNet model on public datasets.
3.3.5. Mathematical Statistical Analysis
In the process of optimizing deep learning models, evaluating the effectiveness of performance improvements is a crucial step. To thoroughly assess the enhancement of this paper’s model in identifying tea bud targets, a comprehensive mathematical statistical analysis method was employed. Additionally, 50 images were collected from outdoor tea gardens. These images contained varying numbers of tea buds to ensure sample diversity and representativeness. The insect counts within the images ranged from sparse to abundant, demonstrating an uneven yet highly representative distribution, with the overall count range spanning [0–40]. Manual identification of tea buds was meticulously performed on all images, ensuring the reliability of the ground-truth data.
The data presented in Figure 10 clearly demonstrate that the improved tea bud detection model exhibits significant efficacy and considerable application value in the quantitative recognition task. The model demonstrates excellent performance across the majority of samples, enabling the accurate identification of tea bud targets while maintaining a remarkably low false-positive rate. This robustly validates the effectiveness of the model’s core detection mechanism and affirms the correctness of the improvements implemented in feature learning and target localization. This achievement represents substantial progress towards the realization of automated, high-precision tea bud counting.

Figure 10.
Detection performance of improved model vs. ground truth. Among them, yellow represents the parts where values increase, and green represents the parts where values decrease.
Nevertheless, we observe specific scenarios where the model presents opportunities for optimization, primarily manifested as instances of missed detection in isolated samples. An in-depth analysis reveals that the primary challenges contributing to these omissions are as follows: (1) A high chromatic similarity between the target and the background: the coloration of some tea buds is extremely close to that of their immediate background, drastically increasing the difficulty of feature discrimination and causing the model to misclassify genuine targets as background. (2) Small targets and occlusion: minute tea buds or those subject to partial occlusion yield limited and easily perturbed visual features, posing significant challenges for the model in capturing comprehensive information about these targets. (3) Considerations for model lightweighting: To ensure efficient, real-time operation on outdoor edge computing devices and to meet stringent practical deployment requirements, we strategically streamlined the model architecture. While this lightweight design preserves robust performance in the majority of scenarios, it may impose constraints on the model’s overall robustness and the completeness of feature extraction when confronted with highly challenging complex samples, such as those exhibiting extreme background similarity, an extremely small size, or significant occlusion. This observation delineates a clear direction for expanding the model’s capability boundaries in future development.
Overall, the successful deployment of the current model and its demonstrated core detection capabilities provide a solid foundation. The identified instances of missed detection do not reflect a fundamental failure of the model but rather indicate a well-defined pathway for enhancing performance under specific, extreme conditions. Subsequent efforts will concentrate on overcoming these challenging aspects to continuously refine the model.
4. Discussion
In prior research on tea bud detection algorithms, to address the recognition challenges posed by complex tea plantation environments (such as background clutter, illumination variations, and tea bud diversity) and pursue a higher detection accuracy, researchers frequently opt for deeper convolutional neural networks (CNNs) as backbone architectures (e.g., ResNet and VGG) [46,47,48]. These models enhance feature extraction and recognition capabilities by increasing network depth or width or by employing more complex structures. While this approach helps improve detection accuracy to some extent, it significantly increases the model’s computational load and memory consumption. This study proposes TeaBudNet, a lightweight and high-precision tea bud detection framework. It achieves effective improvements for multi-scale small object detection in complex natural tea garden scenarios through the synergistic optimization of a dynamically weighted feature pyramid (Weight-FPN), a P2 high-resolution detection layer, and an innovative Group–Taylor pruning strategy. Compared to the baseline YOLOv12 (2.56 M parameters), the model parameter count is reduced by 62.9% to 0.95 M, and the computational cost is optimized to 6.1 G FLOPs, while the mAP@0.5 is significantly increased to 84.6% (an absolute gain of +5.0%). Specifically, the P2 layer fully leverages the rich detailed information in the shallow layers of the backbone network, enhancing spatial localization capabilities for tiny tea buds, resulting in an effective mAP@0.5 increase of +1.7%. Weight-FPN effectively mitigates the prevalent issues of information degradation and semantic gaps in traditional FPNs during multi-scale, small object fusion, thereby further boosting the mAP@0.5 to 83.8%. Furthermore, the Group–Taylor pruning strategy counterintuitively enhances thefinal accuracy (+0.8% mAP) and precision (+3.2%) through a “purification effect,” demonstrating that it optimizes feature discriminability by eliminating redundant noise and ineffective activations, providing a highly robust solution for edge deployment. Experiments show that TeaBudNet comprehensively surpasses existing SOTA models in both accuracy and lightweight metrics, offering a highly robust deployment solution for agricultural edge intelligent devices. Its dynamic feature fusion and pruning paradigm hold universal implications for the small object detection domain. The tea bud detection method proposed in this study still has limitations in practical applications: the partial occlusion of key morphological features of tea buds by branches and leaves in complex tea garden environments somewhat constrain the robustness and localization precision of the detection algorithm. To overcome these limitations, future work will focus on multi-modal information fusion technology. By integrating RGB data with depth information (acquired via depth cameras or stereo vision systems), we will construct 3D spatial representations of tea buds, thereby overcoming occlusion issues to achieve more complete 3D feature reconstruction. Furthermore, we will attempt to deploy lightweight models onto aerial mobile platforms such as drones, enabling the dynamic real-time acquisition of 3D tea garden scenes and full-dimensional monitoring, further advancing precision agriculture.
5. Conclusions
This study addresses the key technical challenge of multi-scale tea bud detection in tea gardens in embedded hardware resource-constrained environments. It proposes TeaBudNet, a quad-branch object detection architecture that integrates multi-scale features, along with an innovatively designed Group–Taylor pruning algorithm. To tackle the issues of small object feature loss and multi-scale detection difficulties, the model incorporates an enhanced Weighted Feature Pyramid Network (Weight-FPN) and introduces a P2 detection layer containing high-resolution detailed features. This enables multi-level feature fusion, achieving complementary advantages between deep semantic features and shallow texture features. Consequently, it effectively enhances the feature representation capability for small-scale buds. To further optimize deployment performance, the proposed Group–Taylor structured pruning algorithm achieves the collaborative compression of model parameters and computational costs through channel grouping and importance evaluations. This significantly improves the model’s real-time detection capability on mobile outdoor devices, offering a robust and scalable solution for intelligent tea garden management.
Author Contributions
Conceptualization, Y.L. (Yi Li), K.L., F.Y., and C.Y.; Data curation, Y.L. (Yi Li), Z.Z., J.Z., J.S., X.Z., and B.C.; Formal analysis, Y.L. (Yi Li), K.L., and C.Y.; Funding acquisition, K.L., F.Y., and C.Y.; Investigation, Y.L. (Yi Li), Z.Z., J.Z., J.S., X.Z., B.C., Y.L. (Yi Lan), Y.J., W.C., X.T., Z.L., H.P., D.T., and Y.Z.; Methodology, Y.L. (Yi Li), Z.Z., J.Z., X.Z., B.C., Y.J., D.T., Y.Z., and L.T.; Project administration, L.T., K.L., F.Y., and C.Y.; Resources, Y.L. (Yi Li), Z.Z., J.Z., J.S., Y.L. (Yi Lan), Y.J., W.C., H.P., D.T., and Y.Z.; Software, Y.L. (Yi Li), J.Z., and K.L.; Supervision, K.L., F.Y., and C.Y.; Validation, Z.Z., J.S., X.Z., B.C., Y.L. (Yi Lan), Y.J., X.T., Z.L., L.T., K.L., F.Y., and C.Y.; Visualization, Y.L. (Yi Li), J.Z., and K.L.; Writing—original draft, Y.L. (Yi Li); Writing—review editing, Y.L. (Yi Li), Z.Z., J.Z., J.S., Y.J., K.L., F.Y., and C.Y. All authors have read and agreed to the published version of the manuscript.
Funding
This study was funded by the Key Research and Development Program of the Ya’an Agriculture and Rural Bureau (Grant No. kczx2023-2025-10), Key Research and Development Program of the Ya’an Agriculture and Rural Bureau (Grant No. kczx2023-2025-09), National Undergraduate Training Program on Innovation and Entrepreneurship (No. 202310626042), Sichuan Science and Technology program (Grant No. 2025YFHZ0140), China Postdoctoral Science Foundation Funded Project (Grant No. 2024M762265), Sichuan TianFu Emei Talent program (No. 2617), and National Funds by FCT–Portuguese Foundation for Science and Technology under the projects UID/04033/2023: Centre for the Research and Technology of Agro-Environmental and Biological Sciences and LA/P/0126/2020 (https://doi.org/10.54499/LA/P/0126/2020, accessed on 15 August 2025).
Data Availability Statement
The data supporting the findings of this study are available from the corresponding author upon reasonable request.
Acknowledgments
The authors are grateful to the anonymous reviewers for their valuable comments and suggestions. Special thanks to the management of Mengding Mountain Tea Plantation in Ya’an for their help in data collection and analysis and to the Ya’an Agriculture and Rural Bureau for their technical and financial support.
Conflicts of Interest
All authors declare that the research was conducted in the absence of any commercial or financial relationships that could be construed as a potential conflict of interest.
References
- Xu, Q.; Zhou, Y.; Wu, L. Advancing tea detection with artificial intelligence: Strategies, progress, and future prospects. Trends Food Sci. Technol. 2024, 153, 104731. [Google Scholar] [CrossRef]
- Tan, H.R.; Zhou, W. Metabolomics for tea authentication and fraud detection: Recent applications and future directions. Trends Food Sci. Technol. 2024, 149, 104558. [Google Scholar] [CrossRef]
- Statista: The Statistics Portal. Available online: https://www.statista.com/ (accessed on 31 March 2025).
- Inttea | Home. Available online: https://inttea.com/ (accessed on 31 March 2025).
- Czernicka, M.; Zagula, G.; Bajcar, M.; Saletnik, B.; Puchalski, C. Study of nutritional value of dried tea leaves and infusions of black, green and white teas from Chinese plantations. Rocz. Państwow. Zakl. Hig. 2017, 68, 237–245. [Google Scholar]
- Samanta, S. Potential bioactive components and health promotional benefits of tea (Camellia sinensis). J. Am. Nutr. Assoc. 2022, 41, 65–93. [Google Scholar] [CrossRef]
- Xu, W.; Zhao, L.; Li, J.; Shang, S.; Ding, X.; Wang, T. Detection and classification of tea buds based on deep learning. Comput. Electron. Agric. 2022, 192, 106547. [Google Scholar] [CrossRef]
- Lin, G.; Xiong, J.; Zhao, R.; Li, X.; Hu, H.; Zhu, L.; Zhang, R. Efficient detection and picking sequence planning of tea buds in a high-density canopy. Comput. Electron. Agric. 2023, 213, 108213. [Google Scholar] [CrossRef]
- Chen, T.; Li, H.; Chen, J.; Zeng, Z.; Han, C.; Wu, W. Detection network for multi-size and multi-target tea bud leaves in the field of view via improved YOLOv7. Comput. Electron. Agric. 2024, 218, 108700. [Google Scholar] [CrossRef]
- Chen, Z.; Luo, Z. Management of Insect Pests on Tea Plantations: Safety, Sustainability, and Efficiency. Annu. Rev. Entomol. 2024, 70, 359–377. [Google Scholar] [CrossRef]
- Saha, D.; Bhue, C.; Singha, R. Rising wage theft in tea industry: Consequences of ineffective labor market institutions. Labor Hist. 2024, 65, 23–39. [Google Scholar] [CrossRef]
- Li, P.; Xian, Y.; Huang, X.; Wang, B.; Wang, X.; Xu, Y.; Yan, J.; Cui, J.; Chen, Y.; Gao, W. Optimizing Labor Intensity Improves Economic and Environmental Performances in Pu’er Tea Plantations in China. Ecosyst. Health Sustain. 2025, 11, 307. [Google Scholar] [CrossRef]
- Wang, J. Research on tea image segmentation algorithm combining color and regional growth. Tea Sci. 2011, 31, 72–77. [Google Scholar]
- Wu, X.; Tang, X.; Zhang, F.; Gu, J. Tea buds image identification based on lab color model and K-means clustering. J. Chin. Agric. Mech. 2015, 36, 161–164. [Google Scholar]
- Tang, Y.; Han, W.; Hu, A.; Wang, W. Design and experiment of intelligentized tea-plucking machine for human riding based on machine vision. Nongye Jixie Xuebao/Trans. Chin. Soc. Agric. Mach. 2016, 47, 15–20. [Google Scholar]
- Karunasena, G.; Priyankara, H. Tea bud leaf identification by using machine learning and image processing techniques. Int. J. Sci. Eng. Res. 2020, 11, 624–628. [Google Scholar] [CrossRef]
- Wang, G.; Wang, Z.; Zhao, Y.; Zhang, Y. Tea bud recognition based on machine learning. In Proceedings of the 2022 41st Chinese Control Conference (CCC), Hefei, China, 25–27 July 2022; pp. 6533–6537. [Google Scholar]
- Xie, S.; Sun, H. Tea-YOLOv8s: A tea bud detection model based on deep learning and computer vision. Sensors 2023, 23, 6576. [Google Scholar] [CrossRef]
- Liu, Z.; Zhuo, L.; Dong, C.; Li, J. YOLO-TBD: Tea Bud Detection with Triple-Branch Attention Mechanism and Self-Correction Group Convolution. Ind. Crop. Prod. 2025, 226, 120607. [Google Scholar] [CrossRef]
- Lu, J.; Luo, H.; Yu, C.; Liang, X.; Huang, J.; Wu, H.; Wang, L.; Yang, C. Tea bud DG: A lightweight tea bud detection model based on dynamic detection head and adaptive loss function. Comput. Electron. Agric. 2024, 227, 109522. [Google Scholar] [CrossRef]
- Chen, Y.; Guo, Y.; Li, J.; Zhou, B.; Chen, J.; Zhang, M.; Cui, Y.; Tang, J. RT-DETR-Tea: A Multi-Species Tea Bud Detection Model for Unstructured Environments. Agriculture 2024, 14, 2256. [Google Scholar] [CrossRef]
- Fan, P.; Zheng, C.; Sun, J.; Chen, D.; Lang, G.; Li, Y. Enhanced Real-Time Target Detection for Picking Robots Using Lightweight CenterNet in Complex Orchard Environments. Agriculture 2024, 14, 1059. [Google Scholar] [CrossRef]
- Xiao, X.; Wang, Y.; Zhou, B.; Jiang, Y. Flexible Hand Claw Picking Method for Citrus-Picking Robot Based on Target Fruit Recognition. Agriculture 2024, 14, 1227. [Google Scholar] [CrossRef]
- Liang, J.; Liang, R.; Wang, D. A novel lightweight model for tea disease classification based on feature reuse and channel focus attention mechanism. Eng. Sci. Technol. Int. J. 2025, 61, 101940. [Google Scholar] [CrossRef]
- Ye, R.; Shao, G.; Yang, Z.; Sun, Y.; Gao, Q.; Li, T. Detection Model of Tea Disease Severity under Low Light Intensity Based on YOLOv8 and EnlightenGAN. Plants 2024, 13, 1377. [Google Scholar] [CrossRef]
- Wang, J.; Li, X.; Yang, G.; Wang, F.; Men, S.; Xu, B.; Xu, Z.; Yang, H.; Yan, L. Research on tea trees germination density detection based on improved YOLOv5. Forests 2022, 13, 2091. [Google Scholar] [CrossRef]
- Gui, Z.; Chen, J.; Li, Y.; Chen, Z.; Wu, C.; Dong, C. A lightweight tea bud detection model based on Yolov5. Comput. Electron. Agric. 2023, 205, 107636. [Google Scholar] [CrossRef]
- Zheng, Z.; Zuo, G.; Zhang, W.; Zhang, C.; Zhang, J.; Rao, Y.; Jiang, Z. Learning lightweight tea detector with reconstructed feature and dual distillation. Sci. Rep. 2024, 14, 23669. [Google Scholar] [CrossRef]
- Jocher, G.; Stoken, A.; Borovec, J.; Changyu, L.; Hogan, A.; Diaconu, L.; Poznanski, J.; Yu, L.; Rai, P.; Ferriday, R.; et al. ultralytics/yolov5: V3.0; Zenodo: 2020. Available online: https://zenodo.org/records/3983579 (accessed on 1 July 2025).
- Khanam, R.; Hussain, M. Yolov11: An overview of the key architectural enhancements. arXiv 2024, arXiv:2410.17725. [Google Scholar] [CrossRef]
- Tian, Y.; Ye, Q.; Doermann, D. Yolov12: Attention-centric real-time object detectors. arXiv 2025, arXiv:2502.12524. [Google Scholar]
- Molchanov, P.; Mallya, A.; Tyree, S.; Frosio, I.; Kautz, J. Importance estimation for neural network pruning. In Proceedings of the IEEE/CVF Conference on Computer Vision and Pattern Recognition, Long Beach, CA, USA, 15–20 June 2019; pp. 11264–11272. [Google Scholar]
- Zhao, Y.; Lv, W.; Xu, S.; Wei, J.; Wang, G.; Dang, Q.; Liu, Y.; Chen, J. Detrs beat yolos on real-time object detection. In Proceedings of the IEEE/CVF Conference on Computer Vision and Pattern Recognition, Seattle, WA, USA, 16–22 June 2024; pp. 16965–16974. [Google Scholar]
- Lyu, C.; Zhang, W.; Huang, H.; Zhou, Y.; Wang, Y.; Liu, Y.; Zhang, S.; Chen, K. Rtmdet: An empirical study of designing real-time object detectors. arXiv 2022, arXiv:2212.07784. [Google Scholar] [CrossRef]
- Peng, Y.; Li, H.; Wu, P.; Zhang, Y.; Sun, X.; Wu, F. D-FINE: Redefine regression Task in DETRs as Fine-grained distribution refinement. arXiv 2024, arXiv:2410.13842. [Google Scholar]
- Wang, C.Y.; Bochkovskiy, A.; Liao, H.Y.M. YOLOv7: Trainable bag-of-freebies sets new state-of-the-art for real-time object detectors. In Proceedings of the IEEE/CVF Conference on Computer Vision and Pattern Recognition, Vancouver, BC, Canada, 17–24 June 2023; pp. 7464–7475. [Google Scholar]
- Wang, C.Y.; Yeh, I.H.; Mark Liao, H.Y. Yolov9: Learning what you want to learn using programmable gradient information. In Proceedings of the European Conference on Computer Vision, Milan, Italy, 29 September–4 October 2024; pp. 1–21. [Google Scholar]
- Wang, A.; Chen, H.; Liu, L.; Chen, K.; Lin, Z.; Han, J. Yolov10: Real-time end-to-end object detection. Adv. Neural Inf. Process. Syst. 2024, 37, 107984–108011. [Google Scholar]
- Tan, M.; Pang, R.; Le, Q.V. Efficientdet: Scalable and efficient object detection. In Proceedings of the IEEE/CVF Conference on Computer Vision and Pattern Recognition, Seattle, WA, USA, 13–19 June 2020; pp. 10781–10790. [Google Scholar]
- Xiao, J.; Zhao, T.; Yao, Y.; Yu, Q.; Chen, Y. Context augmentation and feature refinement network for tiny object detection. 2022; under review. [Google Scholar]
- Peng, Y.; Sonka, M.; Chen, D.Z. U-net v2: Rethinking the skip connections of u-net for medical image segmentation. arXiv 2023, arXiv:2311.17791. [Google Scholar]
- Filters’Importance, D. Pruning Filters for Efficient ConvNets. arXiv 2016, arXiv:1608.08710. [Google Scholar]
- Lee, J.; Park, S.; Mo, S.; Ahn, S.; Shin, J. Layer-adaptive sparsity for the magnitude-based pruning. arXiv 2020, arXiv:2010.07611. [Google Scholar]
- Fang, G.; Ma, X.; Song, M.; Mi, M.B.; Wang, X. Depgraph: Towards any structural pruning. In Proceedings of the IEEE/CVF Conference on Computer Vision and Pattern Recognition, Vancouver, BC, Canada, 17–24 June 2023; pp. 16091–16101. [Google Scholar]
- LeCun, Y.; Denker, J.; Solla, S. Optimal brain damage. Adv. Neural Inf. Process. Syst. 1989, 2, 598. [Google Scholar]
- Zhou, C.; Zhu, Y.; Zhang, J.; Ding, Z.; Jiang, W.; Zhang, K. The tea buds detection and yield estimation method based on optimized YOLOv8. Sci. Hortic. 2024, 338, 113730. [Google Scholar] [CrossRef]
- Yang, M.; Yuan, W.; Xu, G. Yolox target detection model can identify and classify several types of tea buds with similar characteristics. Sci. Rep. 2024, 14, 2855. [Google Scholar]
- Li, H.; Zeng, Y.; Yu, X.; Zhang, N.; Hu, Y.; Chen, X. Research on object detection algorithm of tea bud classification recognition based on YOLOv7. In Proceedings of the 5th International Conference on Artificial Intelligence and Computer Engineering, Wuhu, China, 8–10 November 2024; pp. 365–370. [Google Scholar]
Disclaimer/Publisher’s Note: The statements, opinions and data contained in all publications are solely those of the individual author(s) and contributor(s) and not of MDPI and/or the editor(s). MDPI and/or the editor(s) disclaim responsibility for any injury to people or property resulting from any ideas, methods, instructions or products referred to in the content. |
© 2025 by the authors. Licensee MDPI, Basel, Switzerland. This article is an open access article distributed under the terms and conditions of the Creative Commons Attribution (CC BY) license (https://creativecommons.org/licenses/by/4.0/).