Article

Assessment of Wind-Related Parameters and Erodibility Potential Under Winter Wheat Canopy in Reclaimed Tidal Flat Land

by
Kyosuk Lee
1,†,
Jaehan Lee
2,†,
Kwangseung Lee
3,
Hyunsuk Jo
3,
Woojung Choi
4,
Jinwoong Cho
5 and
Dougyoung Chung
1,*
1
Institute of Agriculture Science, Chungnam National University, Daejeon 34134, Republic of Korea
2
Chungcheongnam-do Agricultural Research and Extension Services, Yesan 61186, Republic of Korea
3
Reclaimed Land Agriculture Research Team, National Institute of Crop Science, Rural Development Administration, Wanju 55365, Republic of Korea
4
Department of Rural and Bio-Systems Engineering & Education and Research Unit for Climate-Smart Reclaimed-Tideland Agriculture (Brain Korea 21), Chonnam National University, Gwangju 61186, Republic of Korea
5
Department of Crop Science, College of Agricultural and Life Sciences, Chungnam National University, Daejeon 34134, Republic of Korea
*
Author to whom correspondence should be addressed.
These authors contributed equally to this work.
Agronomy 2025, 15(7), 1504; https://doi.org/10.3390/agronomy15071504
Submission received: 21 April 2025 / Revised: 17 June 2025 / Accepted: 19 June 2025 / Published: 20 June 2025
(This article belongs to the Section Agroecology Innovation: Achieving System Resilience)

Abstract

:
The aim of this study was to observe soil erosion by wind, depending on the soil physical properties, climatic conditions, and plant canopy, for three representative soil series in the reclaimed tidal flats. Soil samples were collected from the Ap horizon of three soil series to analyze soil physical properties and particle distribution. Precipitation and wind velocities were measured by the weather station installed at the filed. The particle distribution curves showed that the actual proportions of erodible soil particle were in the order of 74.7%(TH), 66.1%(PS), and 62%(JB). The instantaneous and daily maximum wind speeds exceeded the threshold friction velocity (5.78 m s−1) suggested by Chepil. However, the dynamic velocities, depending on the radius of 0.125 mm and 0.42 mm belonging to erodible particle size, were much lower than the threshold friction velocity suggested by Chepil. The wind profile increases logarithmically with height, just above the plant canopy. The vertical gradients of wind velocity for the winter wheat plot were smaller than that of the bare plot due to the relatively rough canopy, and U(Z)c of the bare plot was slightly higher than that of the winter wheat plot with a plant canopy for the given U(Z)m. Conclusively, the actual proportion of erodible particles was much less than that of the particle size limit.

1. Introduction

Reclaimed tidal flat land (RTFL) along Korea’s western coastline typically consist of sandy and silty loam soils that are susceptible to wind erosion, particularly during late autumn and early spring, because of seasonal wind patterns [1]. The contents of clay and silt in the surface horizon in RTFL areas are less than 10% and greater than 60%, respectively. The soils have very low organic matter content and limited surface vegetation, which is attributed to the chemical and physical properties of soils, as well as high salinity levels [2]. The deterioration of soil quality in RTFL is intensified by strong, turbulent winds acting upon smooth, bare, loose, dry, and fine massive soil surfaces [1], highlighting the urgent need for detailed soil erosion data to develop soil conservation strategies. However, research into the soil loss caused by wind and its influence on changes to soil properties has been limited in RTFL.
Wind-induced movement of soil particles, particularly clay, can significantly deteriorate soil quality, affecting both productivity and crop quality. Soil particle emission also significantly affects the nutrient levels of soils and soil water management. The threshold friction velocity (TFV) is essential for determining the onset of soil erosion, marking the minimum friction velocity needed to dislodge soil particles [3,4,5,6]. Woodruff [7] noted that the TFV for soil particle movement is determined by the pressure from moving air causing drag and lift. However, Lyles and Krauss [8] noted the scarcity of quantitative data on how velocity and pressure fluctuations affect the critical drag or velocity needed to start the movement of sand or soil particles. Chepil [9] identified the fact that particle sizes larger than 0.84 mm are non-erodible, while those smaller are erodible, noting that very fine particles (lower than 0.025 mm) and coarse sands (higher than 1.0 mm) are resistant to erosion due to cohesive and gravitational forces, respectively [10,11]. According to López [12] and Hevia et al. [13], the percentage of particles smaller than 0.84 mm can serve as an indicator of a soil’s susceptibility to wind erosion during the dry season. Conversely, Bisal and Nielsen [11] discovered that most particles under 0.5 mm in diameter could be removed, leaving larger particles on the surface.
The primary technology currently used for predicting wind erosion is based on variations of the revised wind erosion equation (RWEQ). RWEQ and WEPS are currently the most valuable models [14]. These prediction systems represent integrations over large fields with unchanging surface conditions and long time-scales, to produce average annual estimates of soil loss. To compute soil loss for seasonal variations in field surfaces, it requires not only complex interactions between the variables that control wind erosion in the WEQ calculation procedures, but also further modifications of the wind-erosion-model computation procedure to allow soil loss estimates to be simulated on a daily basis. The prediction technology should allow them to make low-cost simulation tests of various combinations of erosion control practices in a variety of climates. Wind erosion studies require accurate simulation and forecasting of short-term wind speeds in intricate subsurface environments [15]. The current technology represents a mature technology that is not easily adapted to untested conditions or climates far different than that of the region where the model was developed [16]. Also, statistical models will lose their effects, unless basic data are remeasured and model parameters are corrected [16,17]. Zhang et al., [18] stated that there is a need for an in-depth study on the effectiveness of WEPS in wind forecasting because there is little information available on the effectiveness of the WEPS in simulating wind speeds.
Quantitative studies on the effects of standing residue on soil erosion thresholds due to wind have been critical in developing management practices [19,20,21,22,23]. The strength and duration of erosive winds determine the magnitude of soil loss caused by wind erosion [4,23]. The wind velocity profile over an open, level, and relatively smooth soil surface can be described by a logarithmic equation, with velocity increasing from zero at the surface to a level where it is no longer affected by surface friction within the boundary layer. The wind velocity profile above any canopy is semi-logarithmic, with friction velocity remaining constant throughout this layer’s height. Below the top of the canopy, friction velocity decreases because of the canopy’s stem and leaf areas, each factored by their drag coefficients, until it matches the value at the soil surface [4,20,21,22,23,24,25]. Shao and Lu [4] discovered that a wind speed of approximately 5.78 m s−1, measured 30 cm above the soil, is necessary to initiate movement in loose sand [9].
The accurate estimation of wind erosion on a regional scale in RTFL remains an ongoing challenge to implement support actions to conserve soil against wind erosion in the RTFL areas. Prior to accurate investigation, including actual measurement and modeling of soil erosion by wind in RTFL area, this study aimed to observe and estimate soil erosion characteristics of three representative soil series according to soil particle size distribution and the status of plant growth under the given climatic conditions of wind distribution and precipitation for three years.

2. Materials and Methods

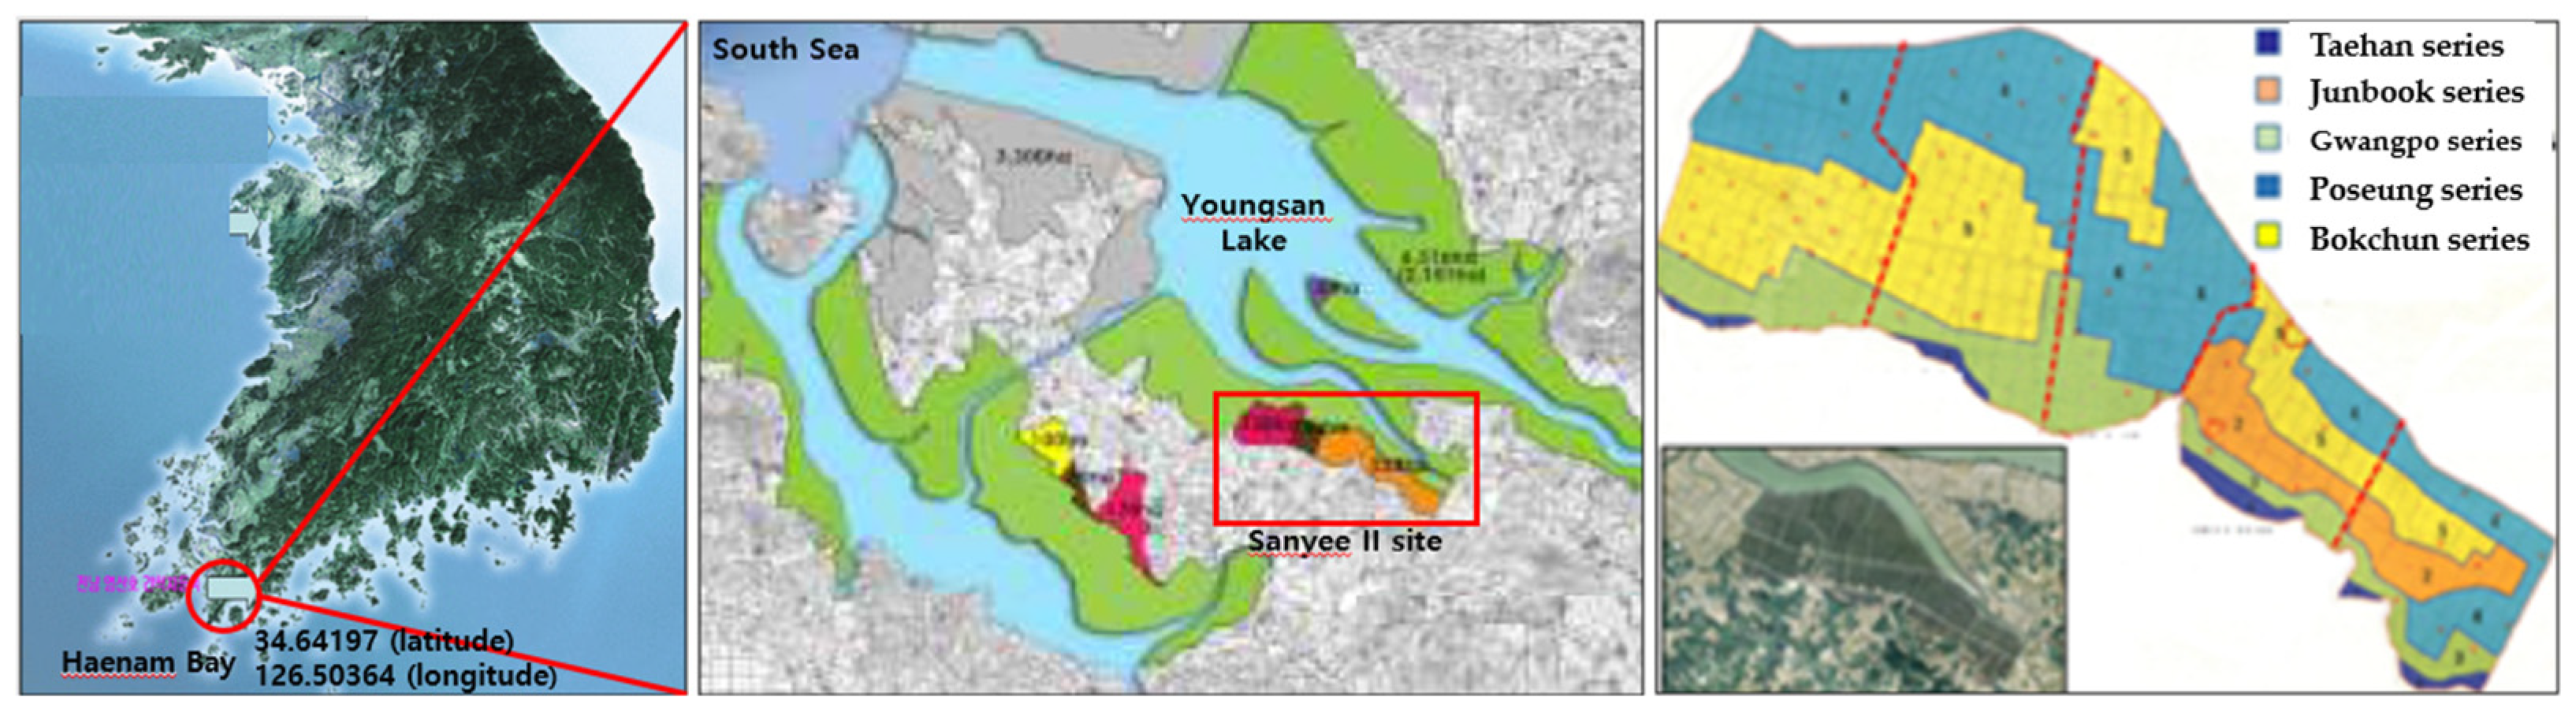
2.1. Experimental Field

The study was carried out at Sanyee II RTFL (713 hectares), developed in 2009, in Haenam Bay, southwest Korea, from October 2019 to June 2022. The coordinates of the study site are 34.64197 (latitude) and 126.50364 (longitude) (Figure 1). Since its development, Sanyee II RTFL has been used to grow rice (summer) and wheat (winter) using conventional management practices. The climate of the Haenam Bay area, including the experimental site, is typically temperate, with an average annual temperature and precipitation of 14.3 °C and 1380 mm. About 70% of precipitation is mainly distributed between June and August. The mean monthly wind speed ranges from 1.69 km h−1 to 2.52 km h−1, with late-December to mid-May being the period in which the wind speed is relatively higher than those of other periods [24].
Sanyee II RTFL, all situated on flat land, consists of five soil series: Taeahn (TH), Junbook (JB), Gwangpo (GP), Poseung (PS), and Bokchun (BC) [26]. Three typical soil series of TH, JB and PS were selected to conduct the experiment. For each soil series, two winter wheat cultivation plots and one bare plot were established. The size of each plot was 10 m (W) × 100 m (L).
Conventional tillage practices were carried out (2 m ridges and 30 cm high ridges) and the recommended fertilization according to the Rural Development Administration (RDA) was applied to each plot throughout three years of the experimental period. Winter wheat seed was sown in 12 cm × 24 cm into a seed zone below the soil surface at a density of 300 grains m−2 in a 2 m ridge in late October, using an opener-furrow drill. Weeds and diseases were chemically controlled and wheat straw was always removed from the field soon after harvest.

2.2. Climatic Conditions

For each soil series, climatic conditions, including precipitation and wind speed, were measured every 15 min throughout the study period using Vantage Pro2 weather stations (Davis, USA). These weather stations were installed at 20 m intervals, 10 m from the end of each plot and at a height of 150 cm above the soil surface. From these measurements, we obtained the days of precipitation per month, the monthly total and daily minimum and maximum precipitation (Table 1), maximum and instantaneous wind velocities, and the number of wind events per month (Table 2).

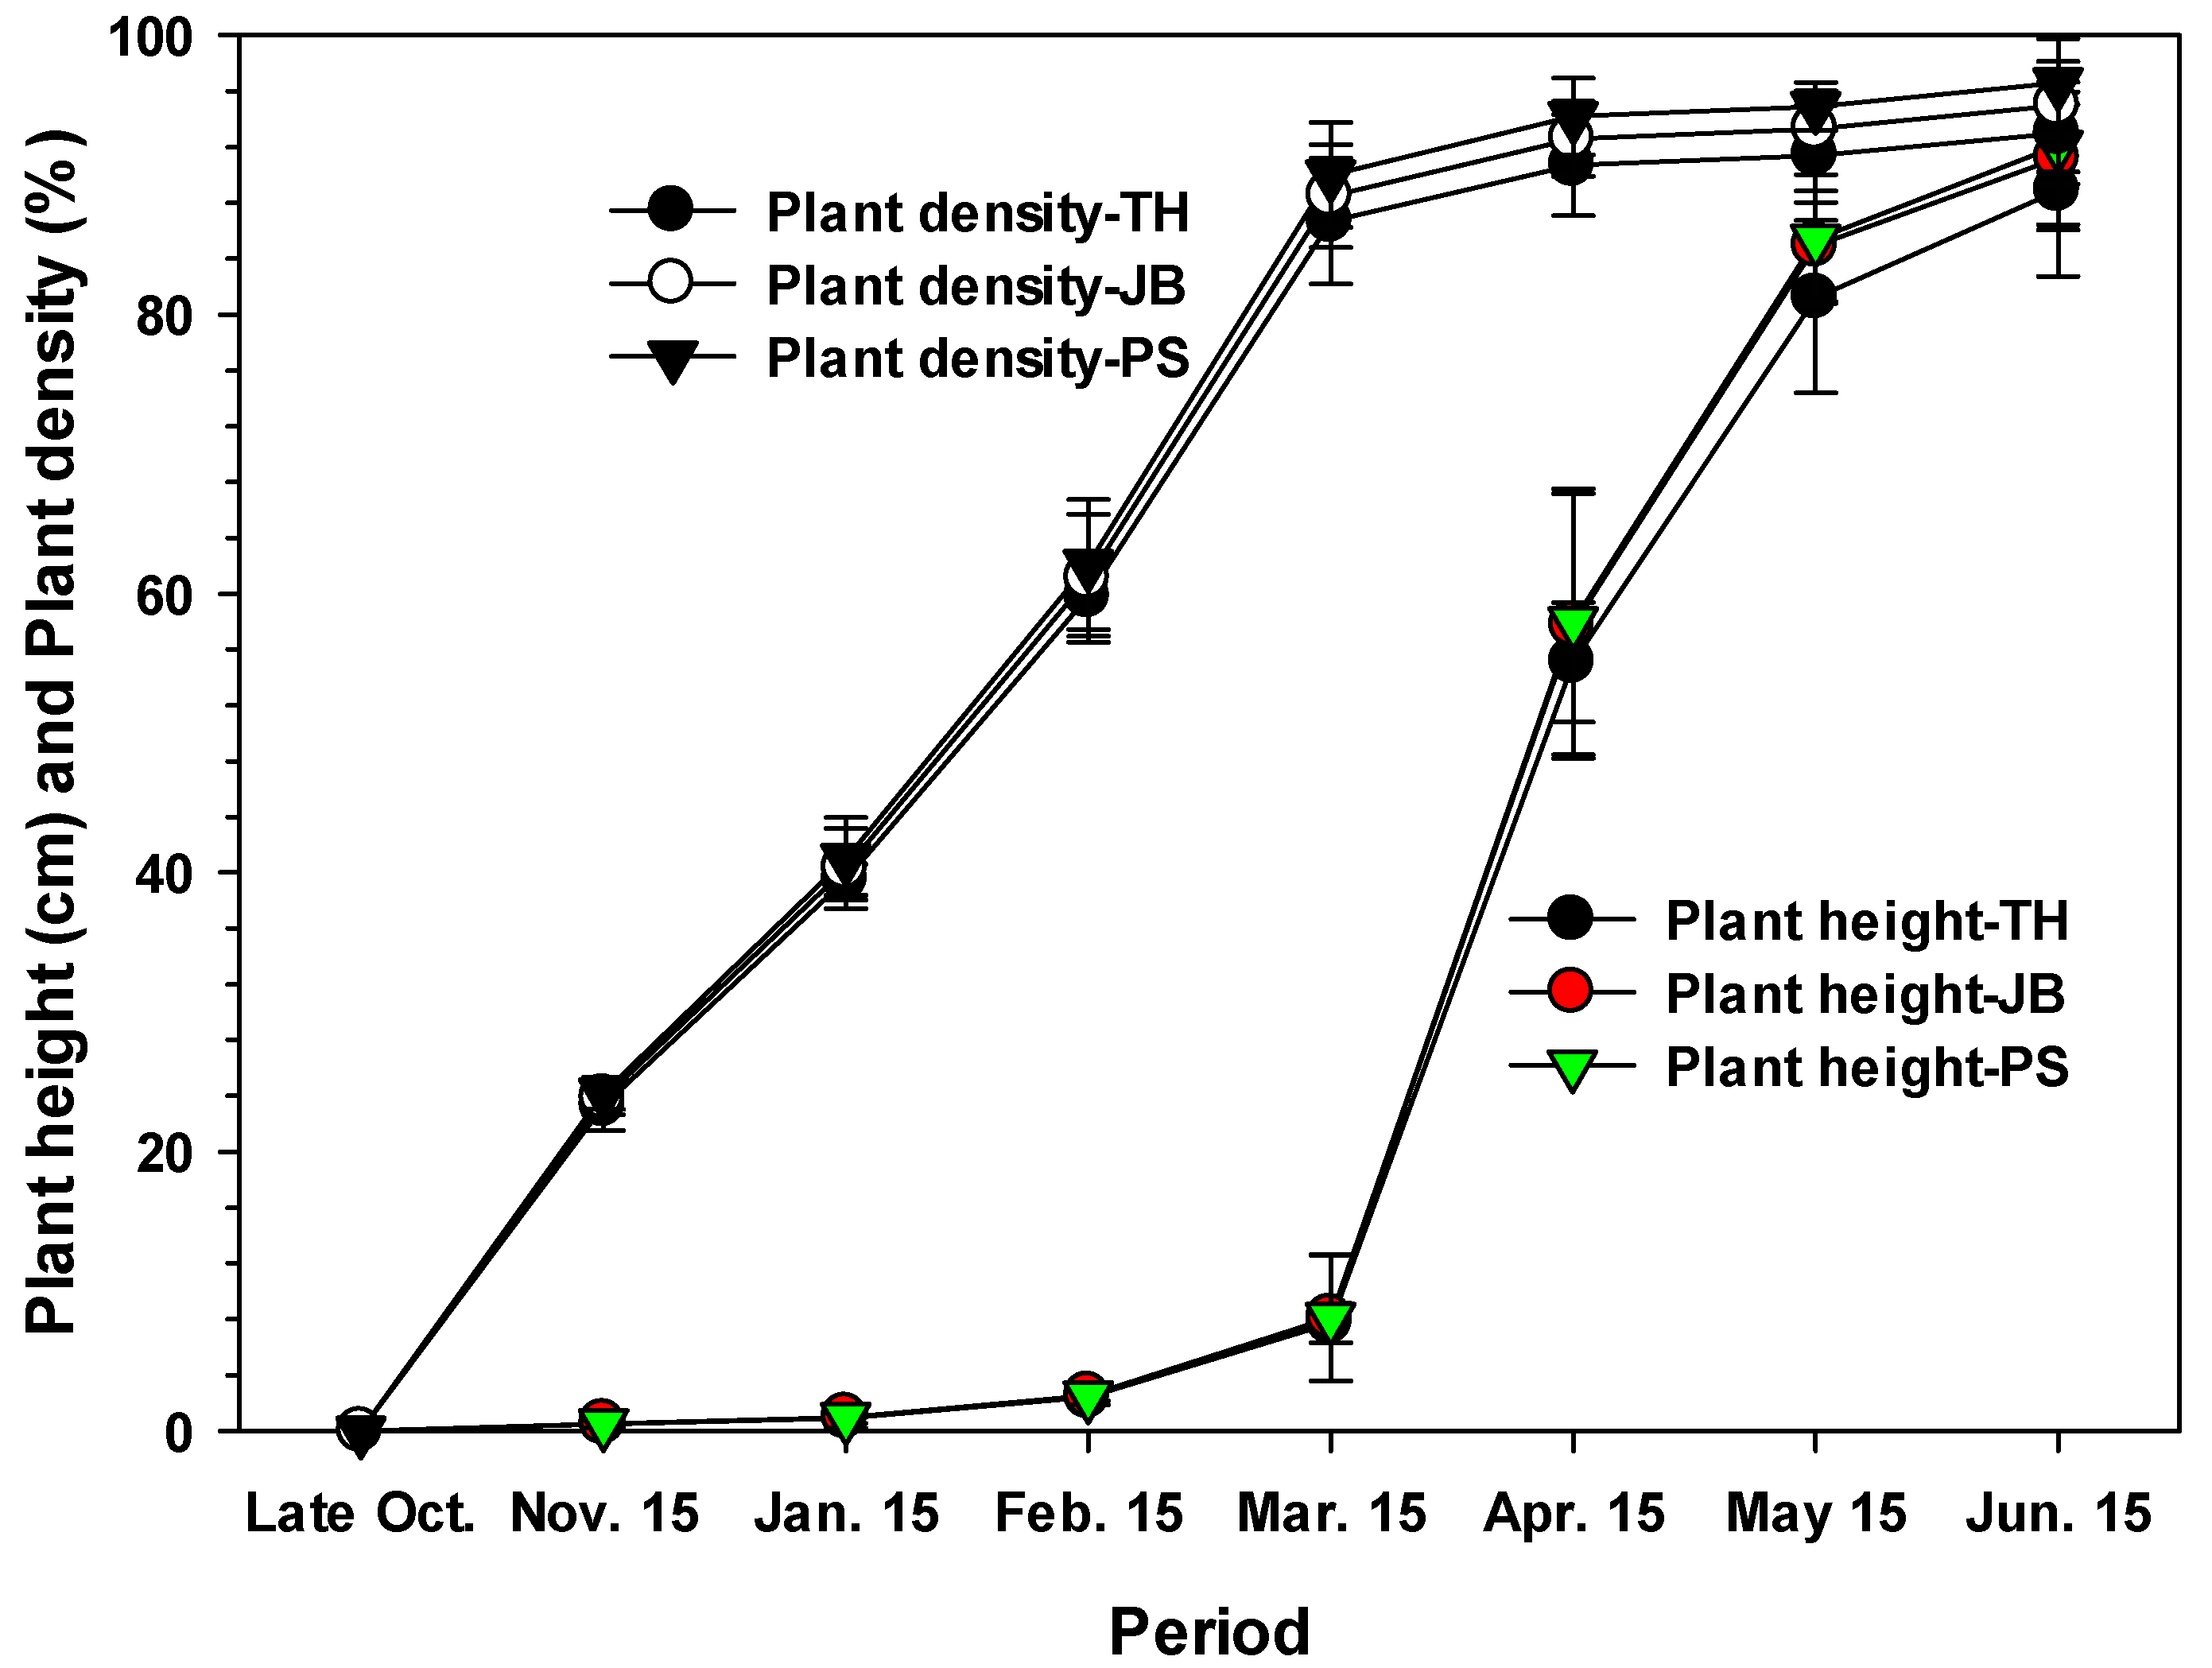
2.3. Plant Height and Canopy

The height and canopy of winter wheat were measured eight times from seed emergence to maturity in three 2 m × 2 m subplots in each plot. Twenty plant samples were randomly selected to measure plant height within each subplot. The height of the winter wheat was determined by measuring the height from the soil surface to the tip (or spike, excluding awns). The plant canopy was determined by counting the ratio of the number of emerged or growing plants to the winter wheat seed sown in each subplot and the ratio of green material present to the ground area it covered (GAI), respectively (Figure 2).

2.4. Soil Characteristics

Three representative soil series were selected at Sanyee II RTFL: Taehan (TH, coarse loamy, mixed, mesic Aquic Udorthents), Junbook (JB, fine, silty, mixed, nonacidic, mesic Typic Haplaquepts), and Poseung (PS, fine silty, mixed, nonacidic, mesic Typic Haplaquents). We compiled descriptions of the Ap horizons for the soil series samples from thirty undisturbed soil core samples. Each sample was collected from identifiable Ap horizons within each soil series. This collection followed the procedures outlined in Table 3 of the soil survey manual, as detailed by Kienast et al. (Table 3) [27]. Soil organic matter (OM) and soil particle distribution (SPD) were analyzed using the Walkley–Black method and hydrometer method, respectively. After drying the soil samples (105 °C for 48 h in a dry oven), soil bulk density was measured. Porosities were then calculated using the measured bulk density (BD) with a standard particle density (PD) of 2.65 g cm−3 (Table 4).

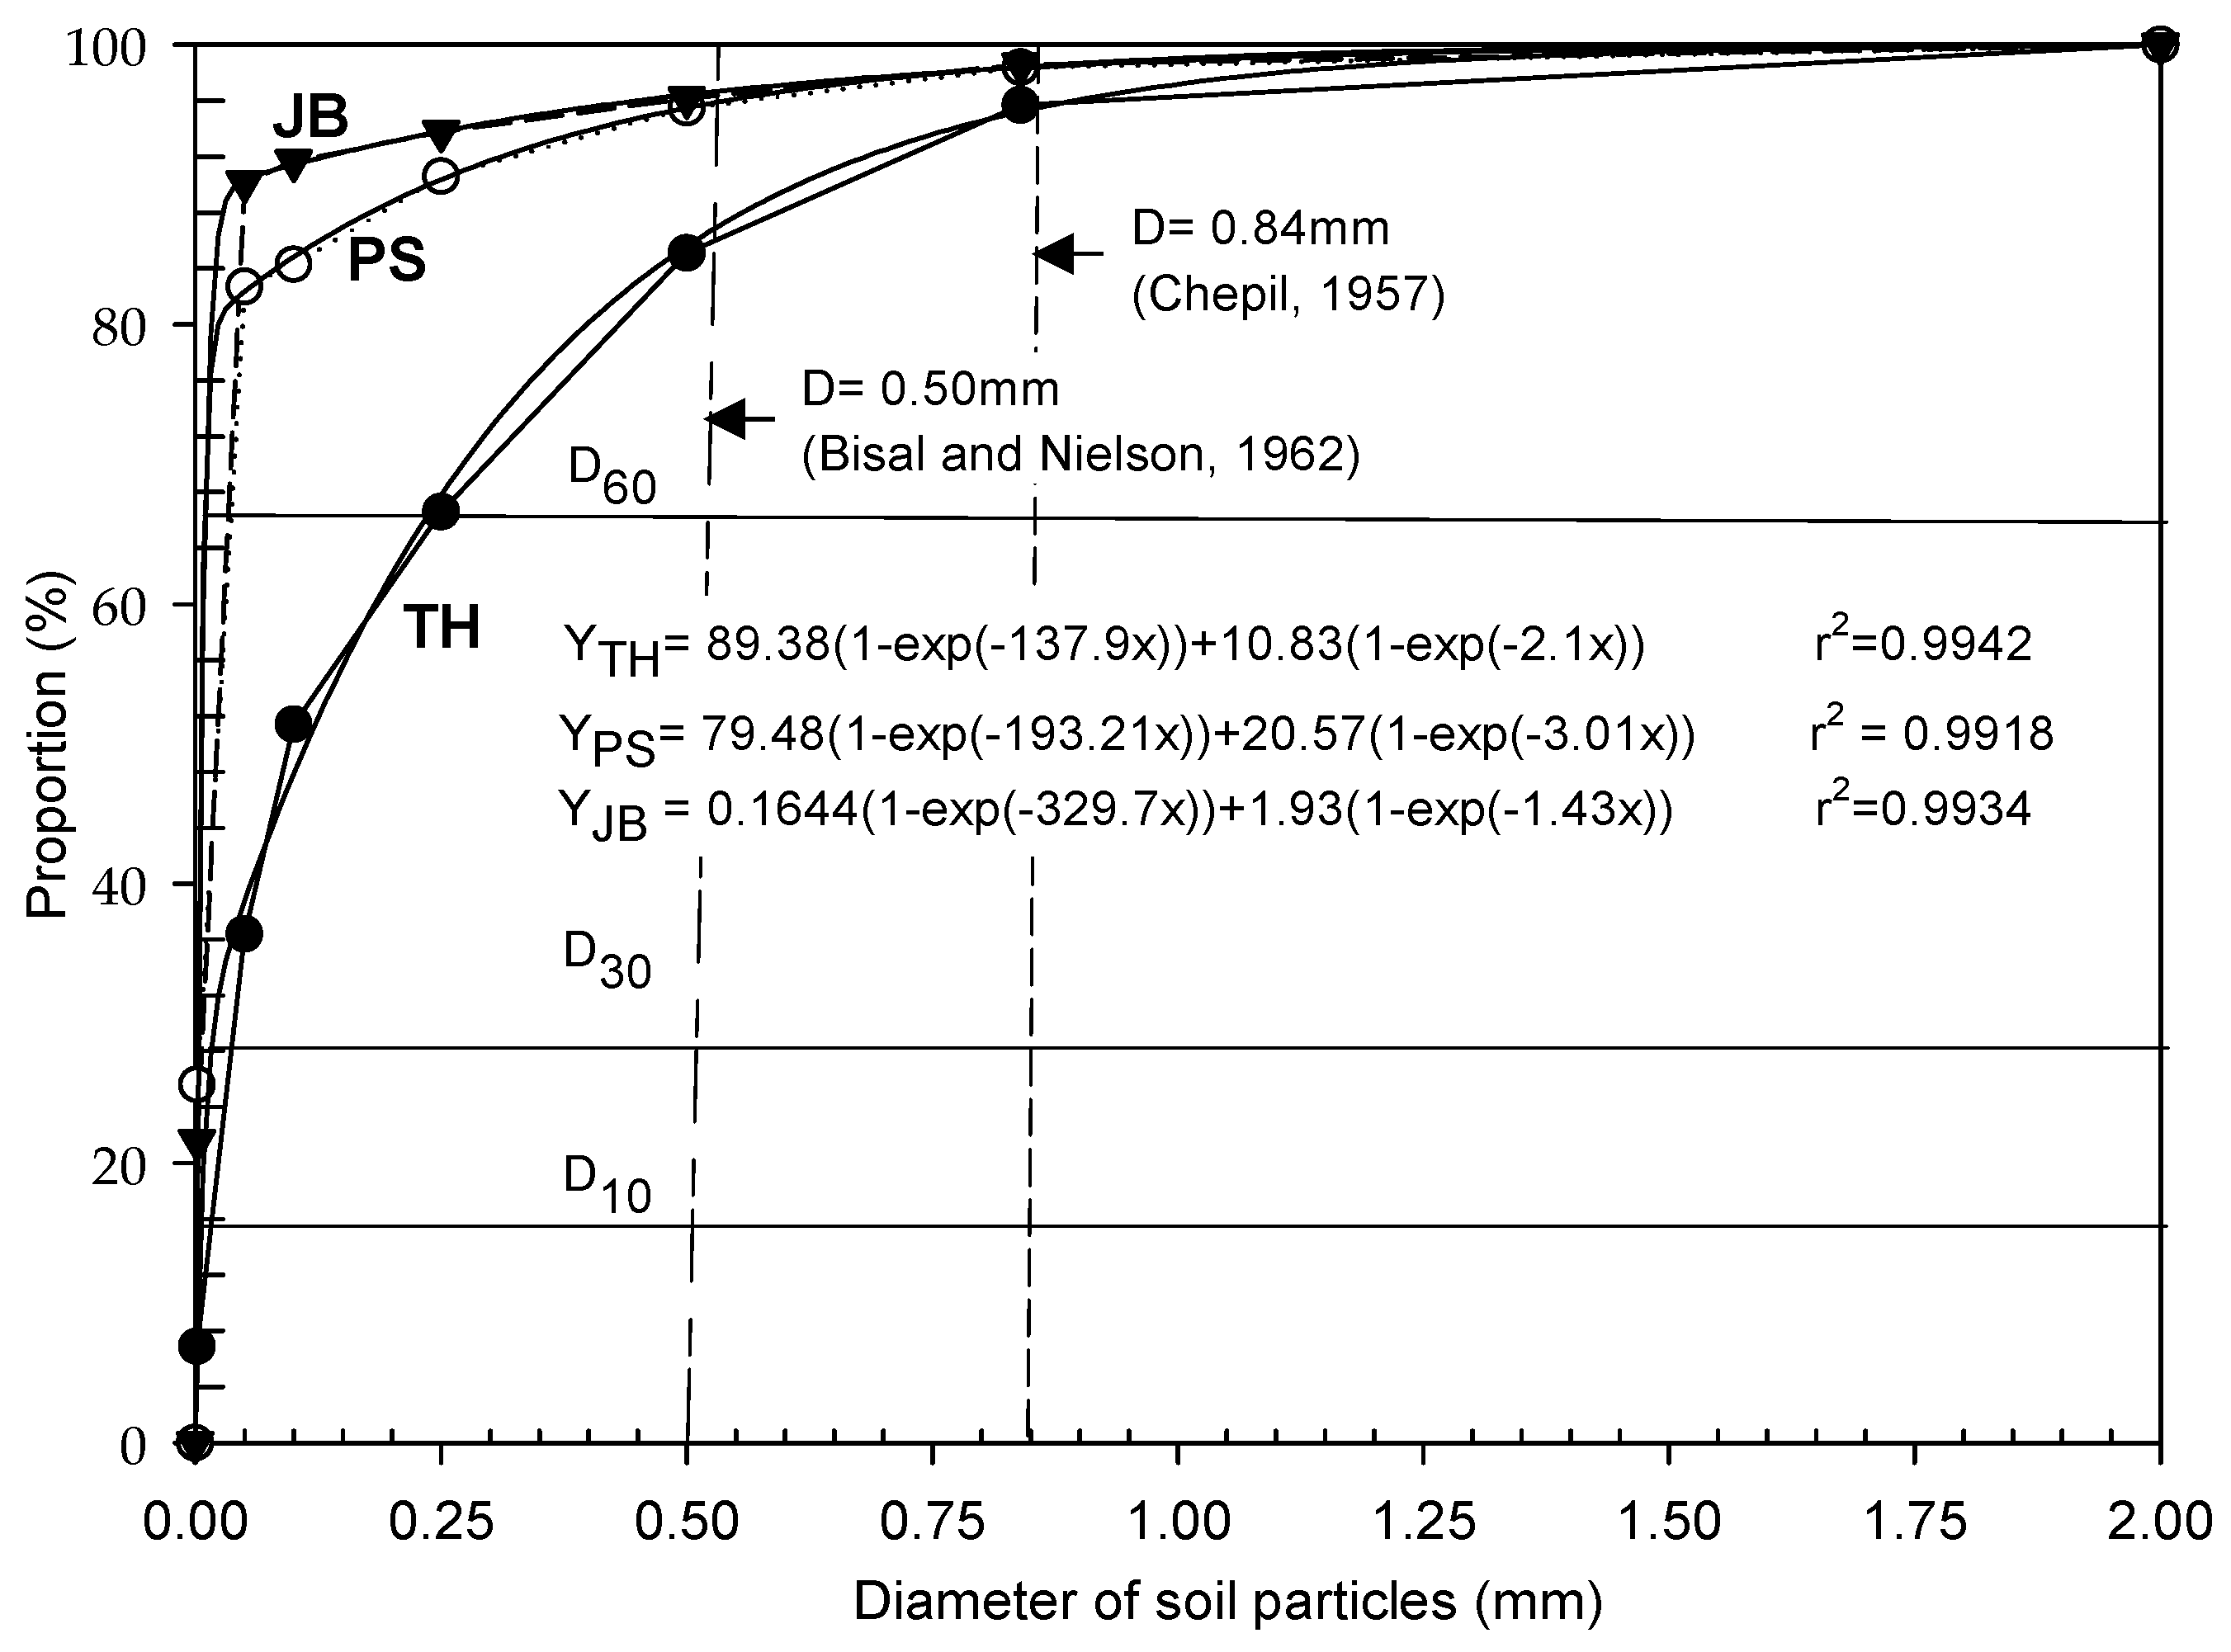
2.5. Soil Particle Distribution Curve

Ten 200 g soil samples from each Ap horizon of the three soil series were analyzed to determine their soil particle size distribution, using a dry sieving method using seven sets of ASTM standard sieves (#10, 14, 18, 35, 60, 140, and 270). The mass of soil particles retained on each sieve was recorded to calculate the proportion of the particle size distribution. These proportions were then normalized with respect to the total mass, to obtain the distribution (Figure 3). To calculate the proportion of the threshold particle size (0.84 mm) for each soil series, the best-fit curve equation for each series was determined using the dynamic curve-fitting method in Sigmaplot 12.

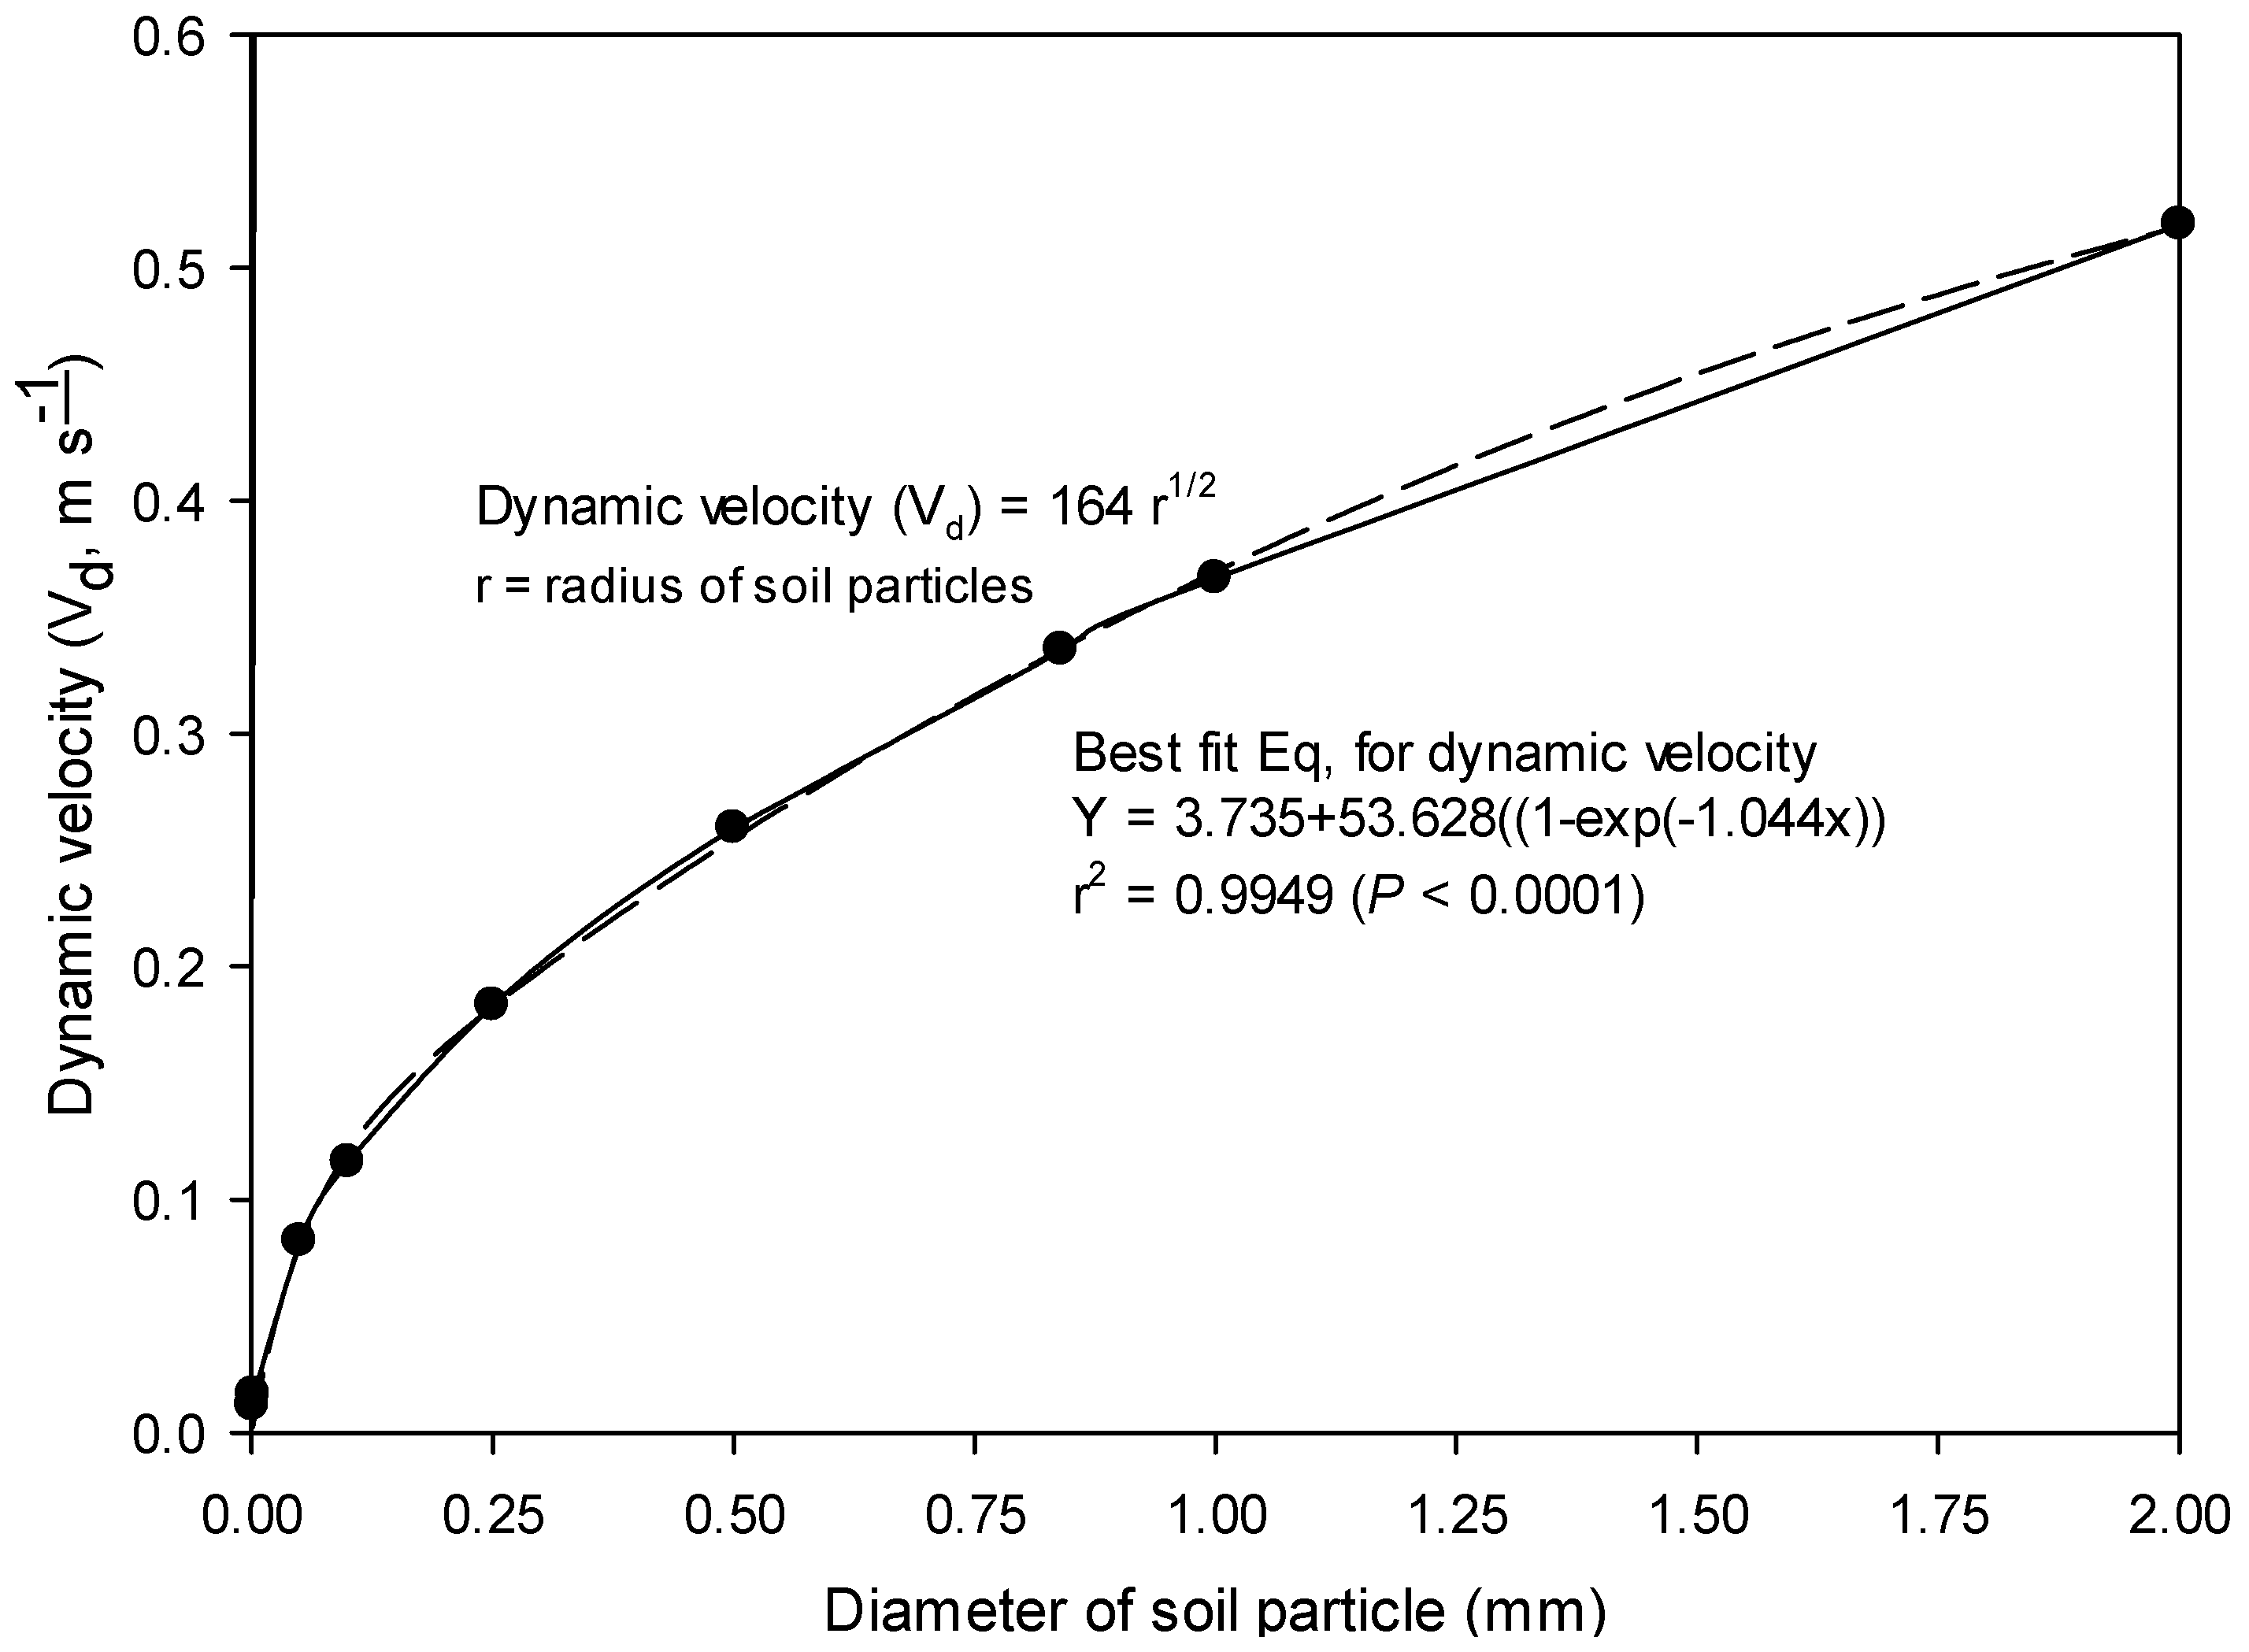
2.6. Estimation of Dynamic Velocity (Vd) and Wind Profile

In the context of soil particle movement on the soil surface, two types of velocities are recognized: dynamic and static. Dynamic velocity (Vd) refers to the speed at which particles move because of being bombarded by saltating and suspended particles. Conversely, static velocity, which is not relevant to wind erosion, describes the speed at which sand movement occurs solely due to fluid pressure. Therefore, the dynamic velocity, which facilitates the movement of soil particles on the soil surface due to wind, can be calculated as indicated in Equation (1a).
D y n a m i c   v e l o c i t y ( V d ) = 164 r   c m   s 1
where Vd is the critical friction velocity and r is the radius of the particle.
The wind speed profile [U(Z), in m s−1] above a crop canopy was determined using a log-linear function. This approach, derived from the first moment of eddy diffusion and the law of the wall as described by Marticorena et al. [28], assumed no wind-slowing obstacles were present in the winter wheat field throughout the study period. Within crop canopies of a specified height (h), wind speed had been quantified based on the wind speed at the canopy height (Uh, m s−1), according to studies by Landsberg and James [29], Thom [30], and Pereira and Shaw [31]. In the most straightforward scenario, characterized by statically neutral conditions without any obstacles that slow down the wind, the formula for mean wind speed becomes
U Z = U K I n Z d Z o Z h
Here, U(Z) represents the average wind velocity at a certain height Z above a reference point, U* denotes the friction velocity (m s−1), k stands for von Karman’s constant (0.41), Z is the height above the soil surface (m), Zo is the roughness length (in meters), and d refers to the effective height of surface roughness (m).
We calculated the apparent roughness length for wind profiles with the above roughness elements using Equations (2) and (3). The wind velocity profile over a site with an open, level and relatively very smooth soil surface can be described as a logarithmic Equation as in (1b) above. For wind speed profiles over rough surfaces such as crop canopies, a roughness length Zo and a zero-plane displacement d are needed to calculate the mean wind speed at height Z, U(Z) in Equation (1b). The roughness length Zo, which is a measure of the aerodynamic roughness of the surface, is determined by extrapolating measured U(Z) and lnZ to the point where U = O. The roughness parameter for crops is about an order of magnitude smaller than the crop height h. Szeicz et al. [32] summarized several studies and empirically related Zo to crop height h:
L o g 10 Z o = 0.997   l o g 10 h 0.883
According to Thom [30], the zero-plane displacement, denoted as d, represents the average height at which the plant community’s individual elements absorb momentum. Stanhill [33] fitted an expression giving zero plane displacement d as a function of crop height h for a wide range of crops:
L o g 10 d = 0.997   l o g 10 h 0.154
where h and d are in meters.
Within crop canopies of height, h, wind speed has been quantified as a function of wind speed at canopy height, Uh (m s−1):
U Z = U k 1 + a ( 1 Z h ) 2 Z < h
where the damping effect of crop canopy, α, is specified as
a = 2 1 d h × i n ( 1 d h ) ( Z o h ) 1 1
Consequently, by utilizing a known reference wind speed and incorporating the aerodynamic parameters such as displacement height (d) and roughness length (Zo), it is possible to derive wind speed profiles both over and within crop canopies, as demonstrated by Rosenberg et al. [34]. Wind profiles were characterized using hot-wire anemometers (Testo 425 Compact Thermal Anemometer with stated accuracy of 0.01 m s−1) at 0.40, 0.60, 0.80, 1.00, and 1.20 m heights above the ground. Wind speeds near the soil surface were measured using single-needle anemometers (AMOS 22, Ultrasonic Anemometer, with a stated accuracy of 0.2 m s−1), placed at heights of 0.07 and 0.20 m above the soil. Data on wind speeds were collected every minute by an onsite data logger (Campbell Scientific, Logan, UT, USA), which compiled these into 15 min averages. Thus, by using a baseline wind speed and accounting for essential aerodynamic parameters such as displacement height and roughness length, it is possible to accurately calculate wind speed profiles both above and within crop canopies.

2.7. Statistical Analysis

Calculations of standard deviation (SD) and standard error (SE) for Soil Particle Density (SPD), Bulk Density (BD), and porosity, as detailed in Table 5 for the various soil series, utilized Sigma Stat for the assessment of r2 and p-values aligned with the particle distribution curves. The PROC GLM function of the Statistical Analysis System (SAS Version 9.4M6; SAS Institute, 2000) facilitated the data analysis process. The determination of means and standard deviations was achieved through the PROC MEANS command in SAS. Furthermore, PROC MIXED was employed for conducting the analysis of variance (ANOVA), and Pearson’s linear correlation coefficients were derived via PROC CORR, setting the significance threshold at p < 0.05. For the visual depiction of this data, JMP Genomics (Version 10, SAS Institute Inc., Cary, NC, USA) was employed.

3. Results and Discussion

Experimental Field and Climatic Condition

During the three experimental periods at the experimental site from October of 2019 to September of 2022, the total precipitation and the number of precipitation events were 1478, 1314, and 852 mm and 96, 96, and 91 days for each experimental year, respectively (Table 1). Considering the annual precipitation days for three experimental periods, the proportion of total precipitation days between November and April ranged from about 41.8% to 46.2%, while the proportion of total precipitation amount for the same period ranged from 14.1% to 24.9%. Generally, the soil surface became wet after rain or snow, although the duration of soil surface wetness depended on the amount and duration of rainfall and snowfall and the growth stage of the winter wheat on the plot. It is well known that the amount of soil erosion decreased with the increase in the soil moisture content and that wet soils are very difficult to erode. We found that the soil surface was close to saturation for 3 to 5 days when the daily rainfall and snowfall exceeded 35 mm or about 25 mm at a temperature below −2 °C. The daily precipitation of more than 35 mm rain and 25 mm or more snow under a temperature below −2 °C per day was 6 days or less between June and September and 1 day or less between January and February during the three experimental periods, respectively. On the basis of these precipitation records, we could assume that the proportion of the annual wetting period of the soil surface ranged from 30.7% to 32.6% during the three experimental periods, while the proportion of the wetting period of the soil surface between November and April was less than 10%, indicating that the soil surface was almost all exposed to wind between November and April.
Wind erosion is significantly influenced by the interactive effects of wind speed, vegetation coverage, and soil moisture. Specifically, vegetation coverage acts as a dominant control by increasing surface roughness and reducing the wind velocity threshold for erosion. Furthermore, soil moisture content and wind speed play crucial roles, with wind erosion rates negatively correlated with soil moisture and positively correlated with wind speed [35]. Higher moisture levels generally reduce wind erosion by increasing soil cohesion and making it more difficult for particles to detach and be transported by wind. Conversely, dry soils are more susceptible to wind erosion. The soil particle flux driven by wind in both frozen and thawed soil conditions diminish as moisture levels increase on the soil surface, due to an increase in soil particle weight and enhanced bonding forces between particles [36,37]. Research indicates that there are critical soil moisture levels for different soil types, above which wind erosion is significantly reduced. For example, one study found a critical soil moisture content of around 2.61% for thawed soil to resist wind erosion [38]. Another study found that 6.5% moisture content was critical for sandy loam soil and 4.5% for sandy soil [39]. Wang et al. [36] also identified the fact that the optimal soil moisture levels to deter wind erosion stand at approximately 2.34% for frozen soil and 2.61% for thawed soil. Based on these soil moisture-content conditions, including precipitation and prolonged wetting period by rain and snow at the soil surface of the Ap horizons for the three soil series, wind erosion could not be observed for about 55.5% of the period from mid-May to early October and 29.7% of the year for three years of experimental periods.
The monthly mean wind velocity at the Sanyee II RTFL during the study period ranged from 1.66 to 2.73 m s−1 (first year), 1.47 to 2.87 m s−1 (second year), and 1.61 to 2.59 m s−1 (third year) with wind directions mainly from the north and northwest, except for the typhoon periods of July and August when the wind direction was from the south, showing that the monthly wind velocity was relatively high from February to May, except for the typhoon periods in July and August. However, the monthly maximum and instantaneous wind velocities were greater than 8.0 m s−1 during the three experimental periods, indicating the likely onset of soil erosion. Table 2 shows the number of wind events as a function of four levels of wind velocity from less than 0.4 m s−1 and to greater than 8.9 m s−1 during the three experimental periods. The total number of annual wind events was 276 (first year), 282 (second year), and 280 (third year), and the month with the most frequent wind events was March, with 40 (first year), 37 (second year), and 41 times (third year). The proportions of wind velocity less than 5.78 m s−1, which means no erosion by wind, as suggested by Chepil [4], and Fryrear et al. [25,26], were 63.2% (first year), 68.5% (secod year), and 61.3% (third year).
Figure 2 shows the changes in mean plant height and canopy of winter wheat growing in the three soil series of TH, JB and PS during the three experimental periods from late October 2019 to June 2022. Plant canopy, which consists of leaves, stems and height, can have a large influence on soil loss, due to TFV causing saltation. In the experimental site, actual vegetation cover was sparse from mid-June, following harvest, until late October, due to intermittent ploughing for weed control and the incorporation of animal manure prior to sowing for winter-wheat seed. The growth and development of winter wheat from sowing (late October) to harvest (mid-June of the following year) involves ten major growth stages from germination to maturity that the wheat plant goes through during its life cycle. The emergence of winter wheat took about 21–27 days after sowing in late October, followed by tillering, erect growth, visible leaf, heading, and ripening and maturation. Plant canopy and height of winter wheat measured at each growth stage did not show significant differences among the three soil series during the three experimental periods, although plant canopy and height of winter wheat were slightly higher in the PS and JB soil series than in the TB series, which had relatively high silt and clay content (Figure 4). For the changes in plant height of winter wheat, the largest increase in plant height occurred between the end of tillering (15 March) and mid-stem elongation (15 April). The mean plant height increased drastically from 7.97 ± 1.53 cm (15 March) to 57.1 ± 2.94 cm (15 April), which was 65.2% of the mean final plant height of winter wheat. The mean plant canopy of winter wheat measured on 15 November and 15 February, the canopy of emergence and tillering, was about 31.2% (GAI < 0.1) and 62.2% (green leaf area = 0.13) at tillering, increasing rapidly from 62.2% (stem elongation, GAI = 1.89) around 15 March to 96.4% at maturity around 15 June (GAI = 6.79). As observed in Table 1 and Table 2, the period between late Oct. and mid-March may be subject to soil erosion, due to low moisture content on the soil surface and relatively high wind speed, in addition to very low plant height and density; there was least soil erosion between mid-June and September, due to the rainy season and the very low wind speed throughout the year, although the soil surface was almost bare after harvest.
Soil texture and structure significantly impact soil erosion. Soil texture influences how easily water infiltrates and detaches particles, while structure impacts the stability of soil aggregates. Well-aggregated, stable soil structures are more resistant to wind erosion than loose, poorly structured soils. The depth of the Ap horizon varied among the three soil series. It ranged from 12 cm in the PS soil series, which had a structureless soil structure, to 27 cm in the TH soil series, which was characterized by a single-grained and platy structure (Table 3). The soil texture of the Ap horizon within the RTFL varied from sandy loam in the TH series, with a sand content greater than 60% and clay content less than 10%, to silty loam in the PS and JB series, which had relatively higher silt (>60%) and clay (>20%) content (Table 4). The PS and JB soil series had significantly higher silt and clay contents compared to the TH soil series. The mean organic-matter content across all soil series was less than 1%. Among the three soil series, the JB soil series, which is fine, fragile sandy loam, with a higher silt content and low organic matter content, can be highly susceptible to wind erosion. The mean saturated hydraulic conductivities (Ksat) of Ap horizon of the three soil series were 1.61 × 10⁻³ cm s−1 (TH), 1.08 × 10⁻³ cm s−1 (PS), and 9.57 × 10⁻⁴ cm s−1 (JB), respectively, showing that Ksat was influenced by silt and clay content (Table 4). However, the Ksat of the subsurface layer was drastically decreased to 4.52 × 10⁻⁵ cm s−1, resulting in a sharp decrease in infiltration rate when the precipitation was greater than 3.0 cm per day. Therefore, the wet period of the surface could be prolonged.
The proportions of sand, silt, and clay particles, as well as aggregate size and structure, play a crucial role in determining a soil’s susceptibility to wind erosion. The particle distribution curves (PDCs) showed that the proportion for the same size of particle increased with increasing particle size in the order of TH, PS, and JB (Figure 3). However, the PDCs of three soil series showed that the proportion of TH and PS rapidly increased to about 92% and 81.5% for the particle diameter less than 0.1 mm and then approached 100%, while that of JB gradually increased to 100%. This indicated that the increase in proportion was strongly influenced by the proportion of the smaller particle. The particle distribution curves, including D60, D30, and D10 and limit of non-erodible particle size (D > 0.84 mm) for each Ap horizon soil, showed that the particle sizes corresponding to D60, D30, and D10 were increased in the order of PS < JB < TH (Figure 3). The proportion of erodible particle size (0.84 mm) defined by Chepil was also in the order of TH, PS, and JB. From these results, we could assume that the proportion of the smaller particle size, including silt and clay (Table 3), determined the proportion of erodible particle.
The best-fit equations of particle distribution curves for TH, PS and JB were obtained by using the dynamic curve-fitting method of double rectangular with 4 parameters (PS and JB) and double with 4 parameters (TH). For these three equations, the r2 values were greater than 0.99, with a p-value less than 0.0001, demonstrating high accuracy in using these equations to calculate the accurate proportion corresponding to the specific soil-particle size. For the proportions of the erodible soil particles, according to Chepil (<0.84 mm) [9] and Bisal and Nielsen (0.5 mm) [11], from these equations, the erodible proportions of Chepil were 98.2% (JB), 96.3% (PS), and 94.7% (TH), while those of Bisal and Nielsen were 84.1%(TH), 94.3% (PS), and 96.1% (JB), indicating that the proportion of erodible soil particles according to Chepil was greater than that of Bisal and Nielsen; this indicates that a decrease in particle size reduces the erodible proportion of soil particles. Considering the radius of soil particles as less than 0.025 mm in relation to cohesive force between soil particles, according to Chepil, the calculated proportions of soil particles less than 0.025 mm using the equations (Figure 3) were 9.38% (TH), 28.2% (PS), and 34.1% (JB), resulting in the actual proportion of erodible soil particles being reduced from 94.7% to 74.7%(TH), 96.3% to 66.1% (PS), and 98.2% to 62% (JB). The results also showed that the reduction in soil erosion could be attributed to the clay content. Therefore, we could conclude that the proportion of erodible soil particles can be significantly reduced by increasing the proportion of soil particles smaller than 0.025 mm.
The proportions of non-erodible and erodible soil particles in the Ap horizon of each soil series were obtained by substituting the respective particle sizes into the best-fit equations, shown in Figure 3. Most of the soil particles of less than 0.5 mm in diameter could be removed from a soil surface by wind, and only soil particles larger than this remain on the soil surface [11]. Chepil [9] also suggested that soil particles with a radius less than 0.025 mm and sands with a radius greater than 0.5 mm hardly eroded at all, due to the attractive forces between the particles, and gravity. Further research found that soils erode most readily for particle sizes with a radius of between 0.05 and 0.07 mm, corresponding to a friction velocity between 3.6 and 4.0 m s−1, measured at a height of 15 cm. For the proportions of non-erodible soil particles of <0.025 mm and >0.84 mm, the results were 43.1%, 71.3%, and 74.4% for TH, PS, and JB soil series, respectively (Table 5). As seen in Table 4, for the JB soil series, the sum of silt and clay content was approximately 90.2%, while for the TH soil series, the sum of mean silt and clay contents was approximately 36.4%. From this, we could assume that the proportion of the erodible soil particles could be significantly influenced by the proportion of sand particle between 0.025 mm and 0.5 mm (or 0.84 mm) in diameter, regardless of threshold wind velocity. But the proportions of the erodible particle with > 0.84 mm were slightly lower than those of proportions with particle size > 0.5 mm. This indicates that the wind erosion is higher in the soil series containing higher sand content.
The dynamic velocity (Vd), expressing the threshold velocity at which soil particles are moved from the soil surface by wind, is plotted on the ordinate axis against the radius of the soil particle on the abscissa (Figure 4). The results show that Vd increased exponentially with r and approached 0.519 m s−1 for a particle size of 2.0 mm. Vd fell within the range of 0.183–0.336 m s−1 for erodible radius of soil particle sizes between 0.125 and 0.42 mm, as suggested by Chepil [9]. Bagnold’s simple expression for TFV describes well the behavior of TFV for particles larger than approximately 100 µm [4]. Compared with Bagnold’s results in the desert [40], the Vd for a particle size of 0.12 mm was 0.127 m s−1, which was almost half the threshold friction velocity of 0.23 m s−1 measured at a height of 10 cm above the soil surface. For a particle size of 0.84 mm (the maximum erodible particle size), Vd was 0.33 m s−1, much lower than the threshold friction velocity (TFV) of 5.78 m s−1 suggested by Chepil [9]. According to the daily wind velocities observed in the RTFL, the possibilities of soil loss by wind were always present, due to higher wind velocity than Vd measured by Equation (1a). However, we could say that the applicability of Vd for causing soil erosion in the RTFL requires further field investigation because the uncertainty in the prediction of TFV becomes larger as the particle becomes smaller.
The interaction between wind and plant canopies is complex and plays a critical role in wind erosion. Understanding the wind velocity profile within and above canopies is essential for developing effective strategies to mitigate wind erosion [35,41]. In Figure 5, the wind velocity profile within the height of five levels of plant canopy height (hc) of winter wheat, ranging from 0.2 m to 1.1 m, was quantified as a function of two wind speeds: 5.74 m s−1 and 8.0 m s−1 at the top of the canopy height, Uh (m s−1). Wind speed at canopy height is generally lower than wind speed at higher altitudes, due to the drag and friction caused by the canopy itself. Therefore, the specific wind speed will vary depending on the type and density of the canopy, the height above the ground, and the overall wind conditions [42]. A notable limitation of the model for wind velocities within-canopy, as delineated by Equation (5), was its inability to align with the anticipated baseline—namely, achieving a wind speed of zero at the soil surface. A least-squares fit of the constant α in Equation (5) yielded a value of 0.22 (RMSE = 0.00028). The wind profiles within the canopy at its height were described by an exponential function, and the wind velocity slowly decreased with increasing plant canopy height (hc) and converged to approximately 3.85 m s−1 and 5.37 m s−1 at a height of 0.07 cm above the ground for wind velocities of 5.78 m s−1 and 8.0 m s−1 at the top of the plant canopy. The r2 values and a p-values of the wind velocities were greater than 0.99 and less than 0.001, demonstrating high accuracy in using this equation to calculate the wind velocity. From these results, we found that wind velocity just above the plant canopy had to be greater than 8.0 m s−1, which is the TFV to cause soil erosion suggested by Chepil [9].
Using Equation (5), we compared the changes in the wind velocity converging at the above-soil-surface height of 0.07 m, which corresponded to the wind velocity at the reference height of 1.1 m within the different canopy heights (hcs) of winter wheat. We also examined how wind velocity changes, depending on height, from 0.08 m to 1.1 m for a given wind velocity of 8 m s−1 at the reference height of 1.1 m (Figure 6). The relative wind velocity converging at the near soil surface (0.07 m) decreased linearly with increasing canopy height (hc). The ratio of Uh/Uref was the same for the same Uref, regardless of the reference wind velocity at each reference point, and decreased with increasing hc from 1.0 (hc = 0.07 m) to 0.68 (hc = 1.1 m). This indicated that wind speeds within vegetative canopies were influenced by both the height above ground and the attenuation coefficient defining this relationship.
In Figure 7, the temporal pattern of winter wheat height (h), displacement height (d), and zero roughness length (Zo) was plotted over the whole growing season of winter wheat. To facilitate the comparison of data between vegetated and bare surfaces, we opted not to use a wind profile equation that accounts for displacement height. The calculated values of Zo and d corresponding to the height of winter wheat growth from 0.01 to 1.1 m with Equations (2) and (3) showed that Zo and d were between 1.3 × 10⁻³ and 0.144 m and 8 × 10⁻³ and 0.77 m, respectively (Figure 7). For the correlation coefficient, r equals 0.9999, with a linear relationship. The slopes of the linear relationship were 0.1308 and 0.6979 for Zo and d, showing that the slope of d was lower than that of Zo. For the values of Zo and d in a bare plot, assuming that crop canopy is 0.01 m, the calculated values of Zo and d were 0 m and 0.008 m. Some results collected by Stull [42] found Zo values between 0.2 and 0.5 m and 0.23 and 0.31 for many trees and edges and winter wheat, respectively. Zos were 1.2 × 10⁻³ m for a flat surface with almost no grass field and 3 × 10⁻² to 7 × 10⁻² m for a sand sheet with salt grass [30,31]. There is a one-to-one correspondence between those roughness elements and the aerodynamic roughness length. This roughness length remains constant, unaffected by changes in wind speed, stability, or stress. While it is not the same as the actual height of the roughness elements, it represents the theoretical height above the surface at which wind speed effectively drops to zero.
Figure 8 shows comparisons between measured and computed wind velocities, U(Z), under near-neutral conditions for both bare and winter wheat plots, where the surface is not isotropic. In these conditions, the wind velocity profile versus the logarithm of height is linear. Wind velocity is almost linearly increased within the plant canopy, while both U(Z)s were exponentially increased above the plant canopy. The slopes [U(Z)c/U(Z)m] for the bare plot and the winter wheat plot were approximately 1.025 and 1.309, respectively. This indicates that the computed wind velocity (U(Z)c) in the winter wheat plot was slightly higher than that in the bare field plot, demonstrating the influence of the plant canopy on wind velocity with increasing height from the soil surface. The characteristics of the wind profile between the winter wheat plot and the bare plot indicated that the vertical gradients of the winter wheat plot were smaller than that of the bare plot without a canopy; the wind velocity within the plant canopy decreased exponentially with distance downward from the canopy top, while that of the bare plot was influenced by the soil surface roughness instead of by the crop roughness, as observed by Campbell [43]. Therefore, the TFV causing soil particle movement on the surface of soil is dependent on the presence and height of the plant canopy in the winter wheat plot because wind erosion occurs only at relatively high wind speeds.

4. Conclusions

The soil textures of the Ap horizon for three representative soil series varied from sandy loam, with a sand content (>60%) and clay content (<10%), to silty loam with high silt content (>60%) and clay content (>20%). The calculated proportion of erodible particle could be significantly influenced by the particle size of between 0.025 mm and 0.84 mm in diameter of silt and coarse sand, while soil particles (<0.025 mm) are not susceptible, due to aggregate formation by cohesive force between soil particles. However, there was least aggregation of soil particles due to very low organic-matter content and high salinity in the RTFL area, resulting in a higher erodible proportion than the calculated one.
Considering the annual precipitation pattern, wind velocities, and the growth stages of winter wheat in the RTFL area, soil erosion could occur between late October and early April, due to the low moisture content of the soil surface, the height and density of the winter wheat, and the distribution of wind velocity. The big difference between Vd and TFV in initiating soil particle movement on the surface requires further research to verify the theoretical and actual wind velocity, to estimate soil loss in RTFL. The wind profiles within the canopy showed that the wind velocity exponentially decreased with increasing plant canopy height and converged to the soil surface with lower wind velocity than the reference wind velocity at the top of the plant canopy, resulting in the fact that the converged wind velocity below the critical TFV may not cause soil erosion.
Wind erosion in the RTFL area is significantly influenced by a combination of climate, soil properties, soil moisture, vegetation cover, and wind velocity. These factors interact to determine the extent and rate of soil loss. This study provided some insights into the relationship among the factors and a few issues, allowing a proper determination of soil erosion under field conditions.

Author Contributions

Conceptualization: K.L. (Kyosuk Lee) and D.C.; data curation: K.L. (Kwangseung Lee), J.L. and W.C.; formal analysis: K.L. (Kwangseung Lee), W.C. and H.J.; investigation: K.L. (Kwangseung Lee), J.C. and J.L.; methodology: K.L. (Kwangseung Lee) and D.C.; supervision: D.C.; validation: K.L. (Kwangseung Lee), J.L. and D.C.; roles/writing—original draft: K.L. (Kwangseung Lee); writing—review and editing: K.L. (Kwangseung Lee) and D.C. All authors have read and agreed to the published version of the manuscript.

Funding

This research study was conducted with support from a research grant awarded by the Cooperative Research Program for Agriculture Science & Technology Development of Rural Development Administration, Republic of Korea (Project No. RS-2023-00230831).

Data Availability Statement

The original contributions presented in this study are included in the article. Further inquiries can be directed to the corresponding author.

Conflicts of Interest

The authors declare no conflicts of interest.

References

  1. Chung, D.Y.; Kim, H.; Park, M.; Lee, S.E. Characteristics of a reclaimed tidal soil for effective resalization at Saemangum and Youngsan-River. Korean J. Soil Sci. Fertil. 2012, 45, 1222–1229. [Google Scholar] [CrossRef]
  2. Lee, K.S.; Seo, I.H.; Lee, S.P.; Jung, H.G.; Chung, D.Y. Simple assessment of wind erosion depending on the soil texture and threshold wind velocity in reclaimed tidal flat land. Korean J. Agric. Sci. 2021, 48, 843–853. [Google Scholar]
  3. Hagen, L.J.; Armbrust, D.V. Plant Canopy Effects on Wind Erosion Saltation. Trans. ASAE 1994, 37, 461–465. [Google Scholar]
  4. Shao, Y.; Lu, H.A. Simple expression for wind erosion threshold friction velocity. J. Geophys. Res. 2000, 105, 22437–22443. [Google Scholar] [CrossRef]
  5. Sharratt, B.S.; Vaddella, V.K. Threshold friction velocity of soils within the Columbia Plateau. Aeolian Res. 2012, 6, 13–20. [Google Scholar]
  6. Refahi, H.G. Wind Erosion and Conservation, 6th ed.; Tehran University Press: Tehran, Iran, 2012. [Google Scholar]
  7. Woodruff, N.P.; Siddoway, F.H. A wind erosion equation. Soil Sci. Soc. Am. J. 1965, 29, 602–608. [Google Scholar] [CrossRef]
  8. Lyles, L.; Krauss, R.K. Threshold Velocities and Initial Particle Motion as Influenced by Air Turbulence. Trans. ASAE 1971, 14, 563–566. [Google Scholar]
  9. Chepil, W.S. Soil Conditions that Influence Wind Erosion. USDA Technical Bulletin. 1958. Available online: https://www.agry.purdue.edu/soils_judging/new_manual/ch6-wind.html (accessed on 2 October 2023).
  10. Fuchs, N.A. The Mechanics of Aerosols; Pergamon Press: London, UK, 1964. [Google Scholar]
  11. Bisal, F.; Nielsen, K.F. Movement of soil particles in saltation Canadian. Can. J. Soil Sci. 1962, 42, 81–86. [Google Scholar] [CrossRef]
  12. López, M.V. Wind erosion in agricultural soils: An example of limited supply of particles available for erosion. Catena 1998, 33, 17–28. [Google Scholar] [CrossRef]
  13. Hevia, G.G.; Mendez, M.; Buschiazzo, D.E. Tillage affects soil aggregation parameters linked with wind erosion. Geoderma 2007, 140, 90–96. [Google Scholar] [CrossRef]
  14. Zou, X.Y.; Zhang, C.L.; Cheng, H.; Kang, L.Q.; Wu, Y.Q. Cogitation on developing a dynamic model of soil wind erosion. Sci. China Earth Sci. 2015, 58, 462–473. [Google Scholar]
  15. Zobeck, T.M.; Van Pelt, S.; Stout, J.E.; Popham, T.W. Validation of the Revised Wind Erosion Equation (RWEQ) for Single Events and Discrete Periods. In Soil Erosion; American Society of Agricultural and Biological Engineers: St Joseph, MI, USA, 2001. [Google Scholar] [CrossRef]
  16. Jarrah, M.; Mayel, S.; Tatarko, J.; Funk, R.; Kuka, K. A review of wind erosion models: Data requirements, processes, and validity. Catena 2020, 187, 104. [Google Scholar] [CrossRef]
  17. Feijóo, A.; Villanueva, D. Assessing wind speed simulation methods. Renew. Sustain. Energy Rev. 2016, 56, 473–483. [Google Scholar]
  18. Zhang, X.; Pi, H.; Wagner, L.E.; Fox, F.; Li, S. Evaluating the ability of the Wind Erosion Prediction System (WEPS) to simulate near-surface wind speeds in the Inland Pacific Northwest, USA. Sci. Rep. 2024, 14, 23712. Available online: http://creativecommons.org/licenses/by-nc-nd/4.0/ (accessed on 3 February 2025).
  19. Schnarr, C.; Schipanski, M.; Tatarko, J. Crop residue cover dynamics for wind erosion control in a dryland, no-till system. J. Soil Water Conserv. 2022, 77, 221–229. [Google Scholar]
  20. Hagen, L.J. Crop Residue Effects on Aerodynamic Processes and Wind Erosion. Theor. Appl. Climatol. 1996, 54, 39–46. [Google Scholar]
  21. Nielsen, D.C.; Aiken, R.M. Wind speed above and within sunflower stalks varying in height and population. J. Soils Water Conserv. 1998, 53, 347–352. [Google Scholar]
  22. Cheng, T.; Pan, Y.; Li, Y.; Wang, X. Spatial vegetation structure and its effect on wind erosion of Alxa dryland ecosystem” Environmental research letters. ERL 2023, 18, 044017. [Google Scholar]
  23. McMaster, G.S.; Aiken, R.M.; Nielsen, D.C. Optimizing wheat harvest cutting height for harvest efficiency and soil and water conservation. J. Agron. 2000, 92, 1104–1108. [Google Scholar]
  24. KMA. Current Weather of Korea. 2022. Available online: https://www.weather.go.kr/weather/observation/currentweather.jsp (accessed on 22 December 2024).
  25. Aiken, R.M.; Nielsen, D.C.; Ahuja, L.R. Scaling Effects of Standing Crop Residues on the Wind Profile. Agron. J. 2003, 95, 1041–1046. [Google Scholar]
  26. RDA (Rural Development Administration, Korea). Soil Series of a Reclaimed Tidal Soil. 2017. Available online: https://www.nongsaro.go.kr/portal/ps/psb/psbk/kidofcomdtyDtl.ps;jsessionid=Lc3cJtjh1sW6QdwMOvjgejWK0WLhvjXAOEPcSzAVZUarp3BcM6OFgxoebEBT74wD.nongsaro-web_servletengine1?menuId=PS00067&kidofcomdtyNo=20506 (accessed on 16 December 2024).
  27. Kienast-Brown, S.; Libohova, Z.; Boettinger, J. Digital soil mapping. Soil Surv. Man. 2017, 18, 295–354. [Google Scholar]
  28. Marticorena, B.; Bergametti, G.; Gillette, D.; Belnap, J. Factors controlling threshold friction velocity in semiarid and arid areas of the Unite States. J. Geophys. Res. 1997, 102, 23277–23287. [Google Scholar] [CrossRef]
  29. Landsberg, J.J.; James, G.B. Wind Profiles in Plant Canopies: Studies on an Analytical Model. J. Appl. Ecol. 1971, 8, 729–741. [Google Scholar] [CrossRef]
  30. Thom, A.S. Momentum absorption by vegetation. QJR Meteorol. Soc. 1971, 97, 414–428. [Google Scholar] [CrossRef]
  31. Pereira, A.R.; Shaw, R.H. A numerical experiment on the mean wind structure inside canopies of vegetation. J. Agric. 1980, 22, 303–318. [Google Scholar]
  32. Szeicz, G.; Endrodi, G.; Tajchman, S. Aerodynamic and surface factors in evaporation. Water Resour. Res. 1969, 5, 380–394. [Google Scholar]
  33. Stanhill, G. A Simple Instrument for the Field Measurement of Turbulent Diffusion Flux. J. Appl. Meteorol. Climatol. 1969, 8, 509–513. [Google Scholar]
  34. Rosenberg, N.J.; Blad, B.L.; Verma, S.B. Microclimate: The Biological Environment; Wiley-Interscience: New York, NY, USA, 1983. [Google Scholar]
  35. Meng, Z.; Dang, X.; Gao, Y.; Ren, X.; Ding, Y.; Wang, M. Interactive effects of wind speed, vegetation coverage and soil moisture in controlling wind erosion in a temperate desert steppe, Inner Mongolia of China. J. Arid. Land 2018, 10, 534–547. [Google Scholar] [CrossRef]
  36. Wang, L.; Shi, Z.H.; Wu, G.L.; Fang, N.F. Freeze/thaw and soil moisture effects on wind erosion. Geomorphology 2014, 207, 141–148. [Google Scholar] [CrossRef]
  37. Zhang, L.; Ren, F.; Li, H.; Cheng, D.; Sun, B. The Influence Mechanism of Freeze-Thaw on Soil Erosion: A Review. Water 2021, 13, 1010. [Google Scholar] [CrossRef]
  38. Liu, H.; Yang, Y.; Zhang, K.; Sun, C. Soil Erosion as Affected by Freeze-Thaw Regime and Initial Soil Moisture Content. Soil Sci. Soc. Am. J. 2017, 81, 459–467. [Google Scholar] [CrossRef]
  39. Chen, W.; Dong, Z.; Li, Z.; Yang, Z. Wind tunnel test of the influence of moisture on the erodibility of loessial sandy loam soils by wind. J. Arid. Environ. 1996, 34, 391–402. [Google Scholar] [CrossRef]
  40. Bagnold, R.A. Physics of Wind Blown Sand and Desert Dunes; Methuen and Co., Ltd.: London, UK, 1941. [Google Scholar]
  41. Jiang, N.; Cheng, H.; Liu, C.; Fang, Z.; Zou, X. A wind tunnel study of the effects of vegetation structural characteristics on the airflow field. Catena 2024, 242, 108064. [Google Scholar] [CrossRef]
  42. Stull, R.B. An Introduction to Boundary-Layer Meteorology; Kluwer Academic: New York, NY, USA, 1988; 382p. [Google Scholar]
  43. Campbell, G.S. An Introduction to Environmental Biophysics; Springer: New York, NY, USA, 1977. [Google Scholar]
Figure 1. Index map and locations of soil-profile investigation pits and soil sampling points for five soil series within the experimental site at the RTFL within the Haenam Bay. Numerous dendritic streams on the wide tidal flat and main tidal channel (maximum depth of 25 m) comprise the coastal embayment.
Agronomy 15 01504 g001
Figure 2. Changes in mean plant height and density of winter wheat growing in TH, JB and PS soil series during three experimental periods from late October 2019 to June 2022.
Agronomy 15 01504 g002
Figure 3. Particle-distribution curves and their respective best-fit equations for the Ap horizon soil of the three soil series.
Agronomy 15 01504 g003
Figure 4. Dynamic velocity as a threshold friction velocity according to radius of particle size using the Bagnold equation (Vd =164 r cm s−1).
Agronomy 15 01504 g004
Figure 5. Wind velocity profile (Uh, m s−1) within the plant canopy height (h), quantified as a function of two wind velocities at five levels of canopy height, from 0.2 m to 1.1 m.
Agronomy 15 01504 g005
Figure 6. Relative wind velocity at the soil surface (0.07 m) corresponding to the wind velocity at the reference height (1.1 m) within the various canopy heights of winter wheat, from 0.07 m to 1.1 m.
Agronomy 15 01504 g006
Figure 7. The relationship between zero plane displacement d and zero roughness length Zo with vegetation height of winter wheat h and bare ridged Ap horizon soil in RTFL.
Agronomy 15 01504 g007
Figure 8. Measured versus fitted wind velocities for bare and winter wheat plots.
Agronomy 15 01504 g008
Table 1. Number of precipitation events, total, and daily maximum and minimum precipitation measured on the experimental site from October 2019 to September 2022.
Month.October 2019–September 2020October 2020–September 2021October 2021–Sept. 2022
No.
(Day)
TotalDailyNo.
(Day)
TotalDailyNo.
(Day)
TotalDaily
MaxMinMaxMinMaxMin
(mm)(mm)(mm)
Oct.855.823.50.1427.427.10.1825.812.20.1
Nov.512.87.260.256.922.50.4677.923.50.2
Dec.637.321.80.1513.98.40.2516.712.20.1
Jan.645.826.20.1736.313.90.145.181.950.1
Feb.527.89.140.2631.716.41.243.971.460.1
Mar.627.19.720.1897.234.60.1883.729.60.4
Apr.556.717.31.2653.522.90.5724.518.10.1
May9188.159.40.18128.939.90.2555.213.30.1
Jun.10257.7100.20.47137.431.90.81170.750.60.1
Jul14319.681.80.413500.7297.30.113193.6108.50.2
Aug.10153.785.40.712172.329.10.312115.637.70.4
Sept.12295.7113.90.215108.236.50.1818022.50.2
Total961478.1 961314.4 91852.8
Indicates the number of rain events per month.
Table 2. Number of wind events depending on the wind velocity range on the Sanyee II RTFL during the study period.
MonthNumber of Wind Events
October 2019–September 2020October 2020–September 2021October 2021–September 2022
Velocity Range (m s−1)TotalVelocity Range (m s−1)TotalVelocity Range (m s−1)Total
<0.40.4~5.785.78~8.98.9<8.0<<0.40.4~5.785.78~8.98.9<8.0<<0.40.4~5.785.78~8.98.9<8.0<
Oct.632001174301148430215
Nov.61171325885012111950025
Dec.912813306107242514992434
Jan.8118353091113343681372430
Feb.12121137389121148361013104637
Mar.12121158406131268371214114741
Apr.915624321198353181163428
May562001384300157630016
June940001375000129400013
July651001257100135510011
Aug.442221266522194431212
Sep.9641220107512237542318
Total95101621834276929775213528210397621832280
Table 3. Description of soil characteristics of Ap horizon for three soil series in Haenam RTFL.
Soil SeriesDepth
(cm)
Soil TextureSoil StructureRemarks
TH0~27sandy loamsingle-grained, platytiny quartz particles
PS0~12silty loamstructureless-
JB0~19silty loamstructureless, massivemica
Table 4. Soil physical properties of Ap horizon soils for three soil series in RTFL.
Soil SeriesSandSiltClaySoilOMBDPorosityKsat
(%)Texture(%)(g cm−3)(%)(1×10⁻³ cm s−1)
THMin~Max.58.8~68.327.4~34.35.30~8.90Sandy loam0.39~0.571.42~1.5143.0~46.41.52~1.18
Mean63.629.56.870.481.4744.71.61
SD4.533.541.800.090.051.710.02
SE0.870.650.330.020.010.310.006
PSMin.~Max.13.8~21.252.9~62.921.1~29.1Silty loam0.71~1.231.34~1.4246.4~49.41.39–1.59
Mean16.857.125.60.971.3847.91.48
SD3.725.024.010.260.061.510.01
SE0.680.920.730.050.010.280.003
JBMin.~Max7.90~11.663.4~74.217.8~26.2Silty loam0.84~1.051.35~1.4445.7~49.11.48–1.69
Mean9.8968.621.60.951.447.41.53
SD1.855.404.210.110.051.720.01
SE0.340.990.770.020.010.310.004
Abbreviation: OM, organic matter; BD, bulk density; SD, standard deviation; SE, standard error; TH, Taehan series; PS, Poseung series; JB, Junbook series; Ksat, saturated hydraulic conductivity.
Table 5. Calculated proportions of non-erodible and erodible soil particles from Ap horizon soil of each soil series.
Soil
Series
Proportion of Non-ErodibleProportion of Erodible
Particle Size (mm)Sum
<0.025
(A)
0.025~0.5
(B)
>0.84
(C)
(A + B)(A + C)DE0.05~0.07 mm
(F)
TH32.514.910.647.443.152.656.911.5
PS68.44.482.9372.971.327.128.71.24
JB72.93.821.4576.774.423.325.71.09
D was obtained by subtraction of A + B from 100. E was obtained by subtraction of A + C from 100. F indicates the particle range which is easily erodible in the field.
Disclaimer/Publisher’s Note: The statements, opinions and data contained in all publications are solely those of the individual author(s) and contributor(s) and not of MDPI and/or the editor(s). MDPI and/or the editor(s) disclaim responsibility for any injury to people or property resulting from any ideas, methods, instructions or products referred to in the content.

