
Evaluation of Suitable Cultivation Regions in China for Siraitia grosvenorii Using a MaxEnt Model and Inductively Coupled Plasma Mass Spectrometry

Abstract
1. Introduction
2. Materials and Methods
2.1. Distribution Points of S. grosvenorii and Environmental Variables
2.2. Species Distribution Modeling
2.3. Potentially Suitable Area Partitions
2.4. Analysis of Suitable Area Change and Centroid Transfer in Different Periods
2.5. Chemical Information
2.6. Statistical Analysis
3. Results
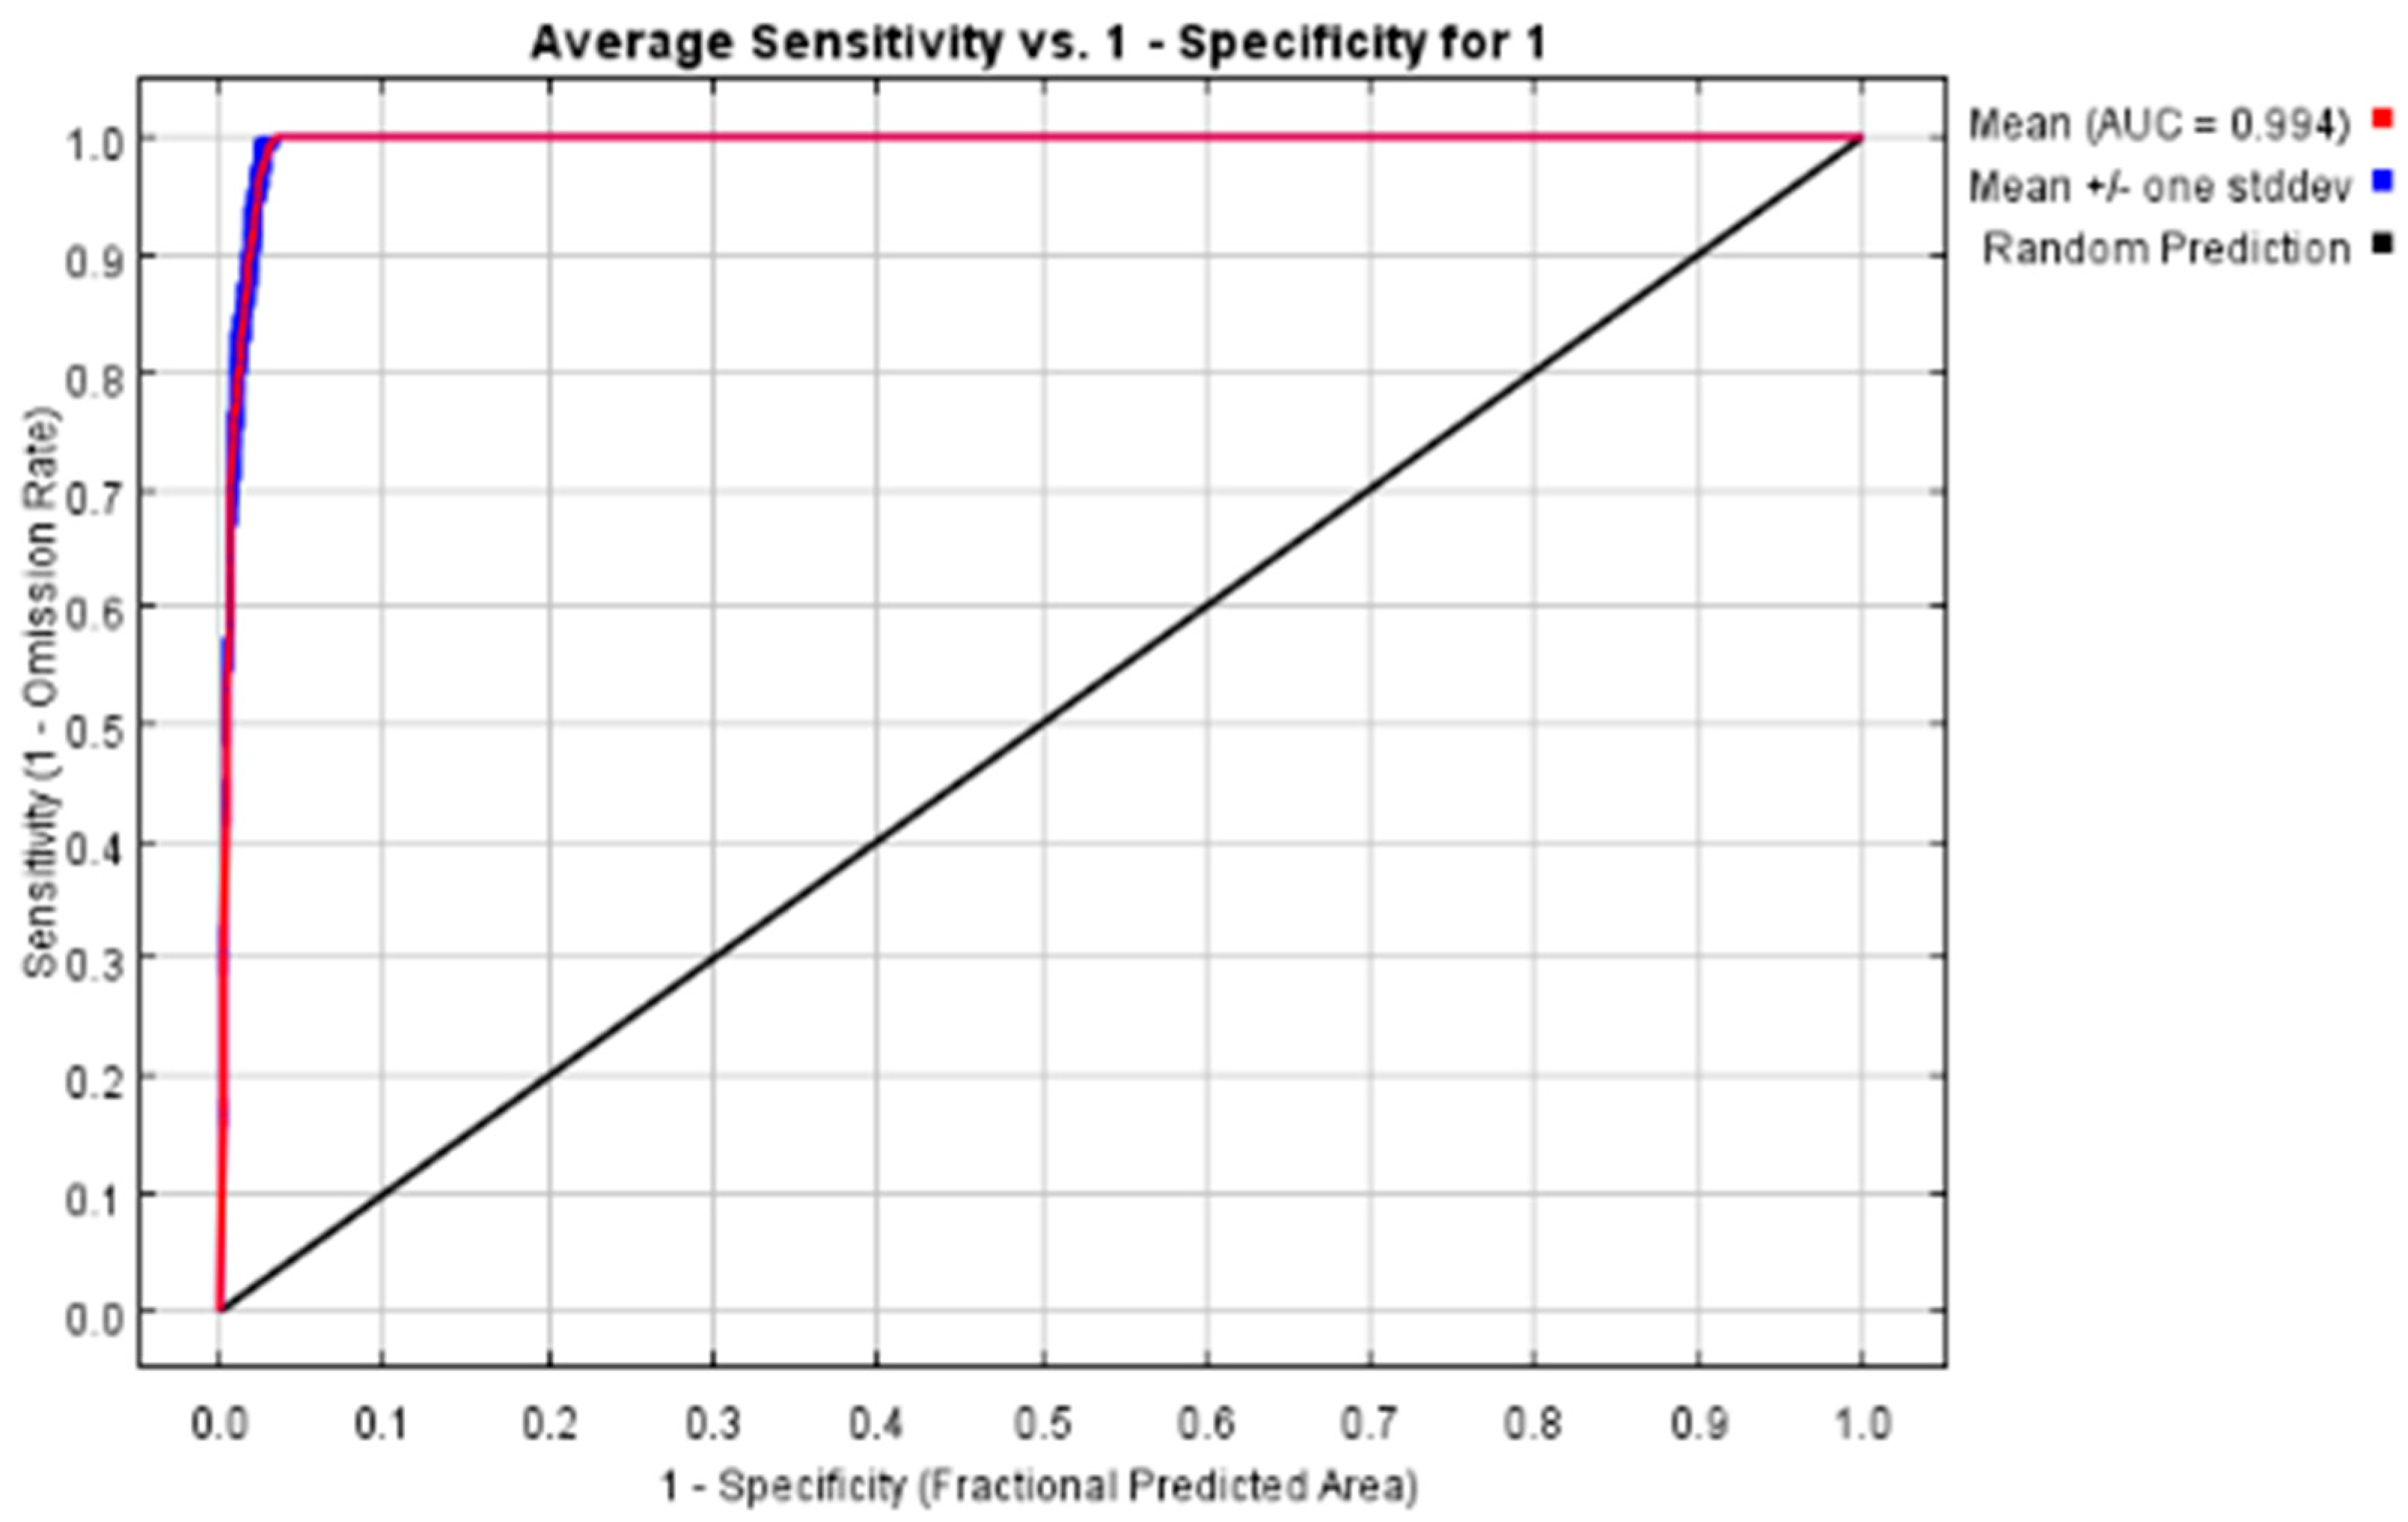
3.1. MaxEnt Model Accuracy Evaluation
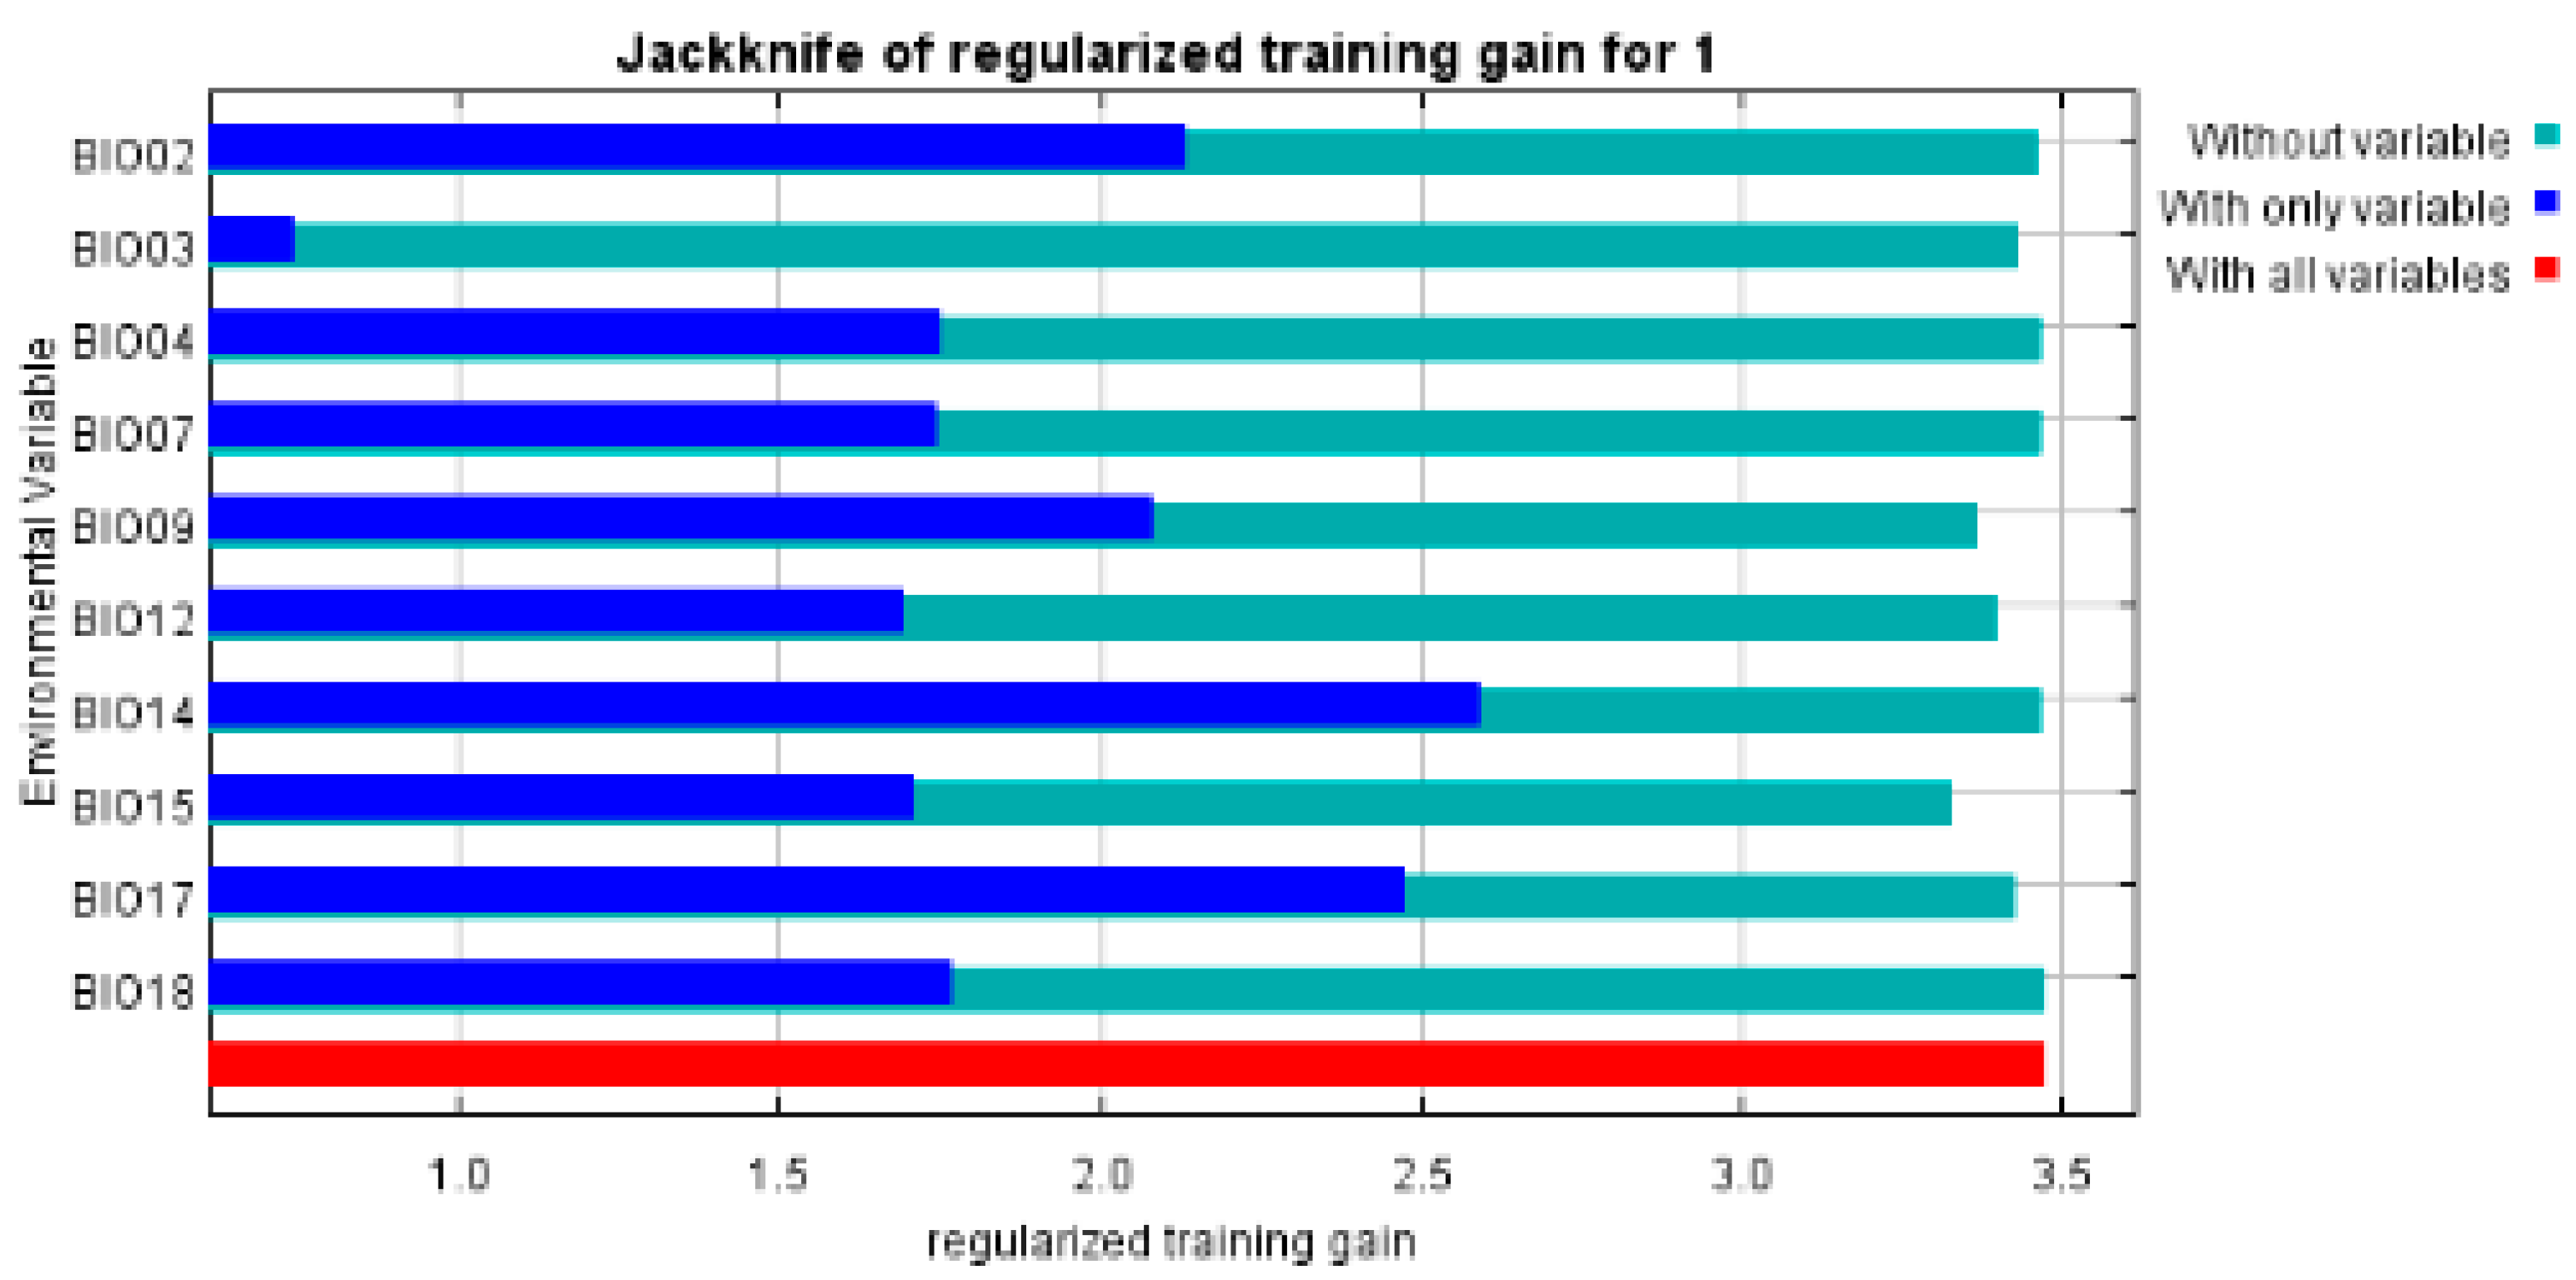
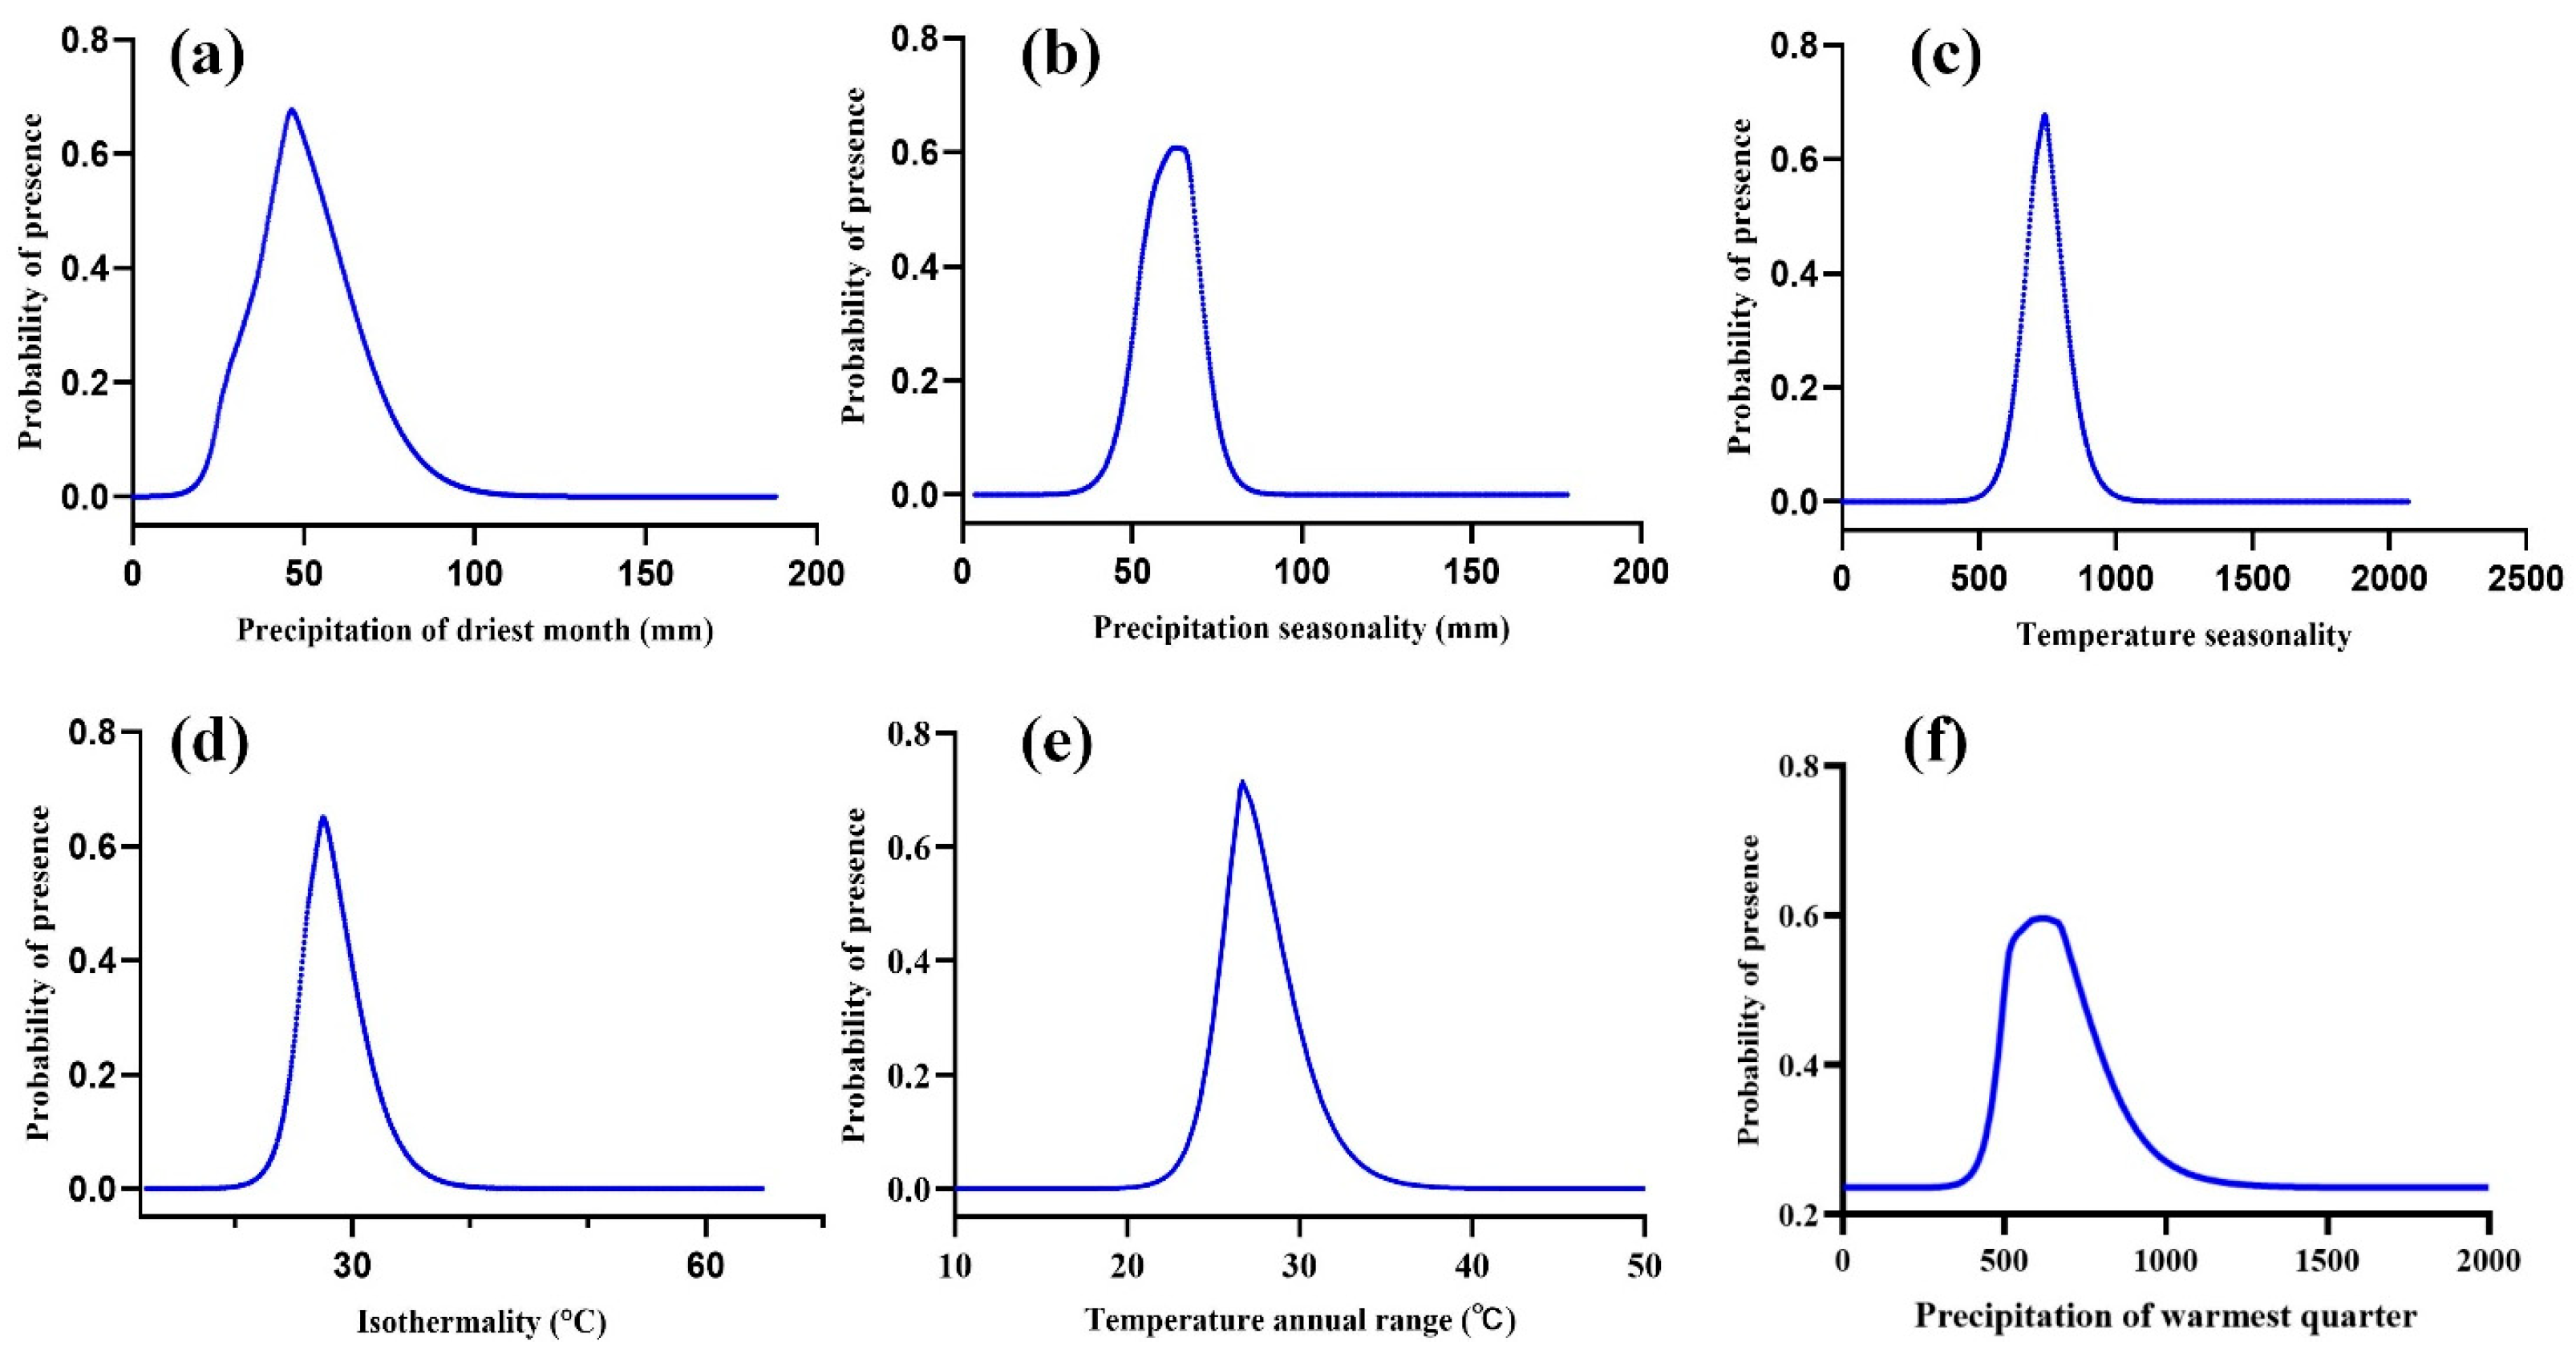
3.2. Evaluation of the Dominant Environmental Variables Affecting the Growth and Composition of S. grosvenorii
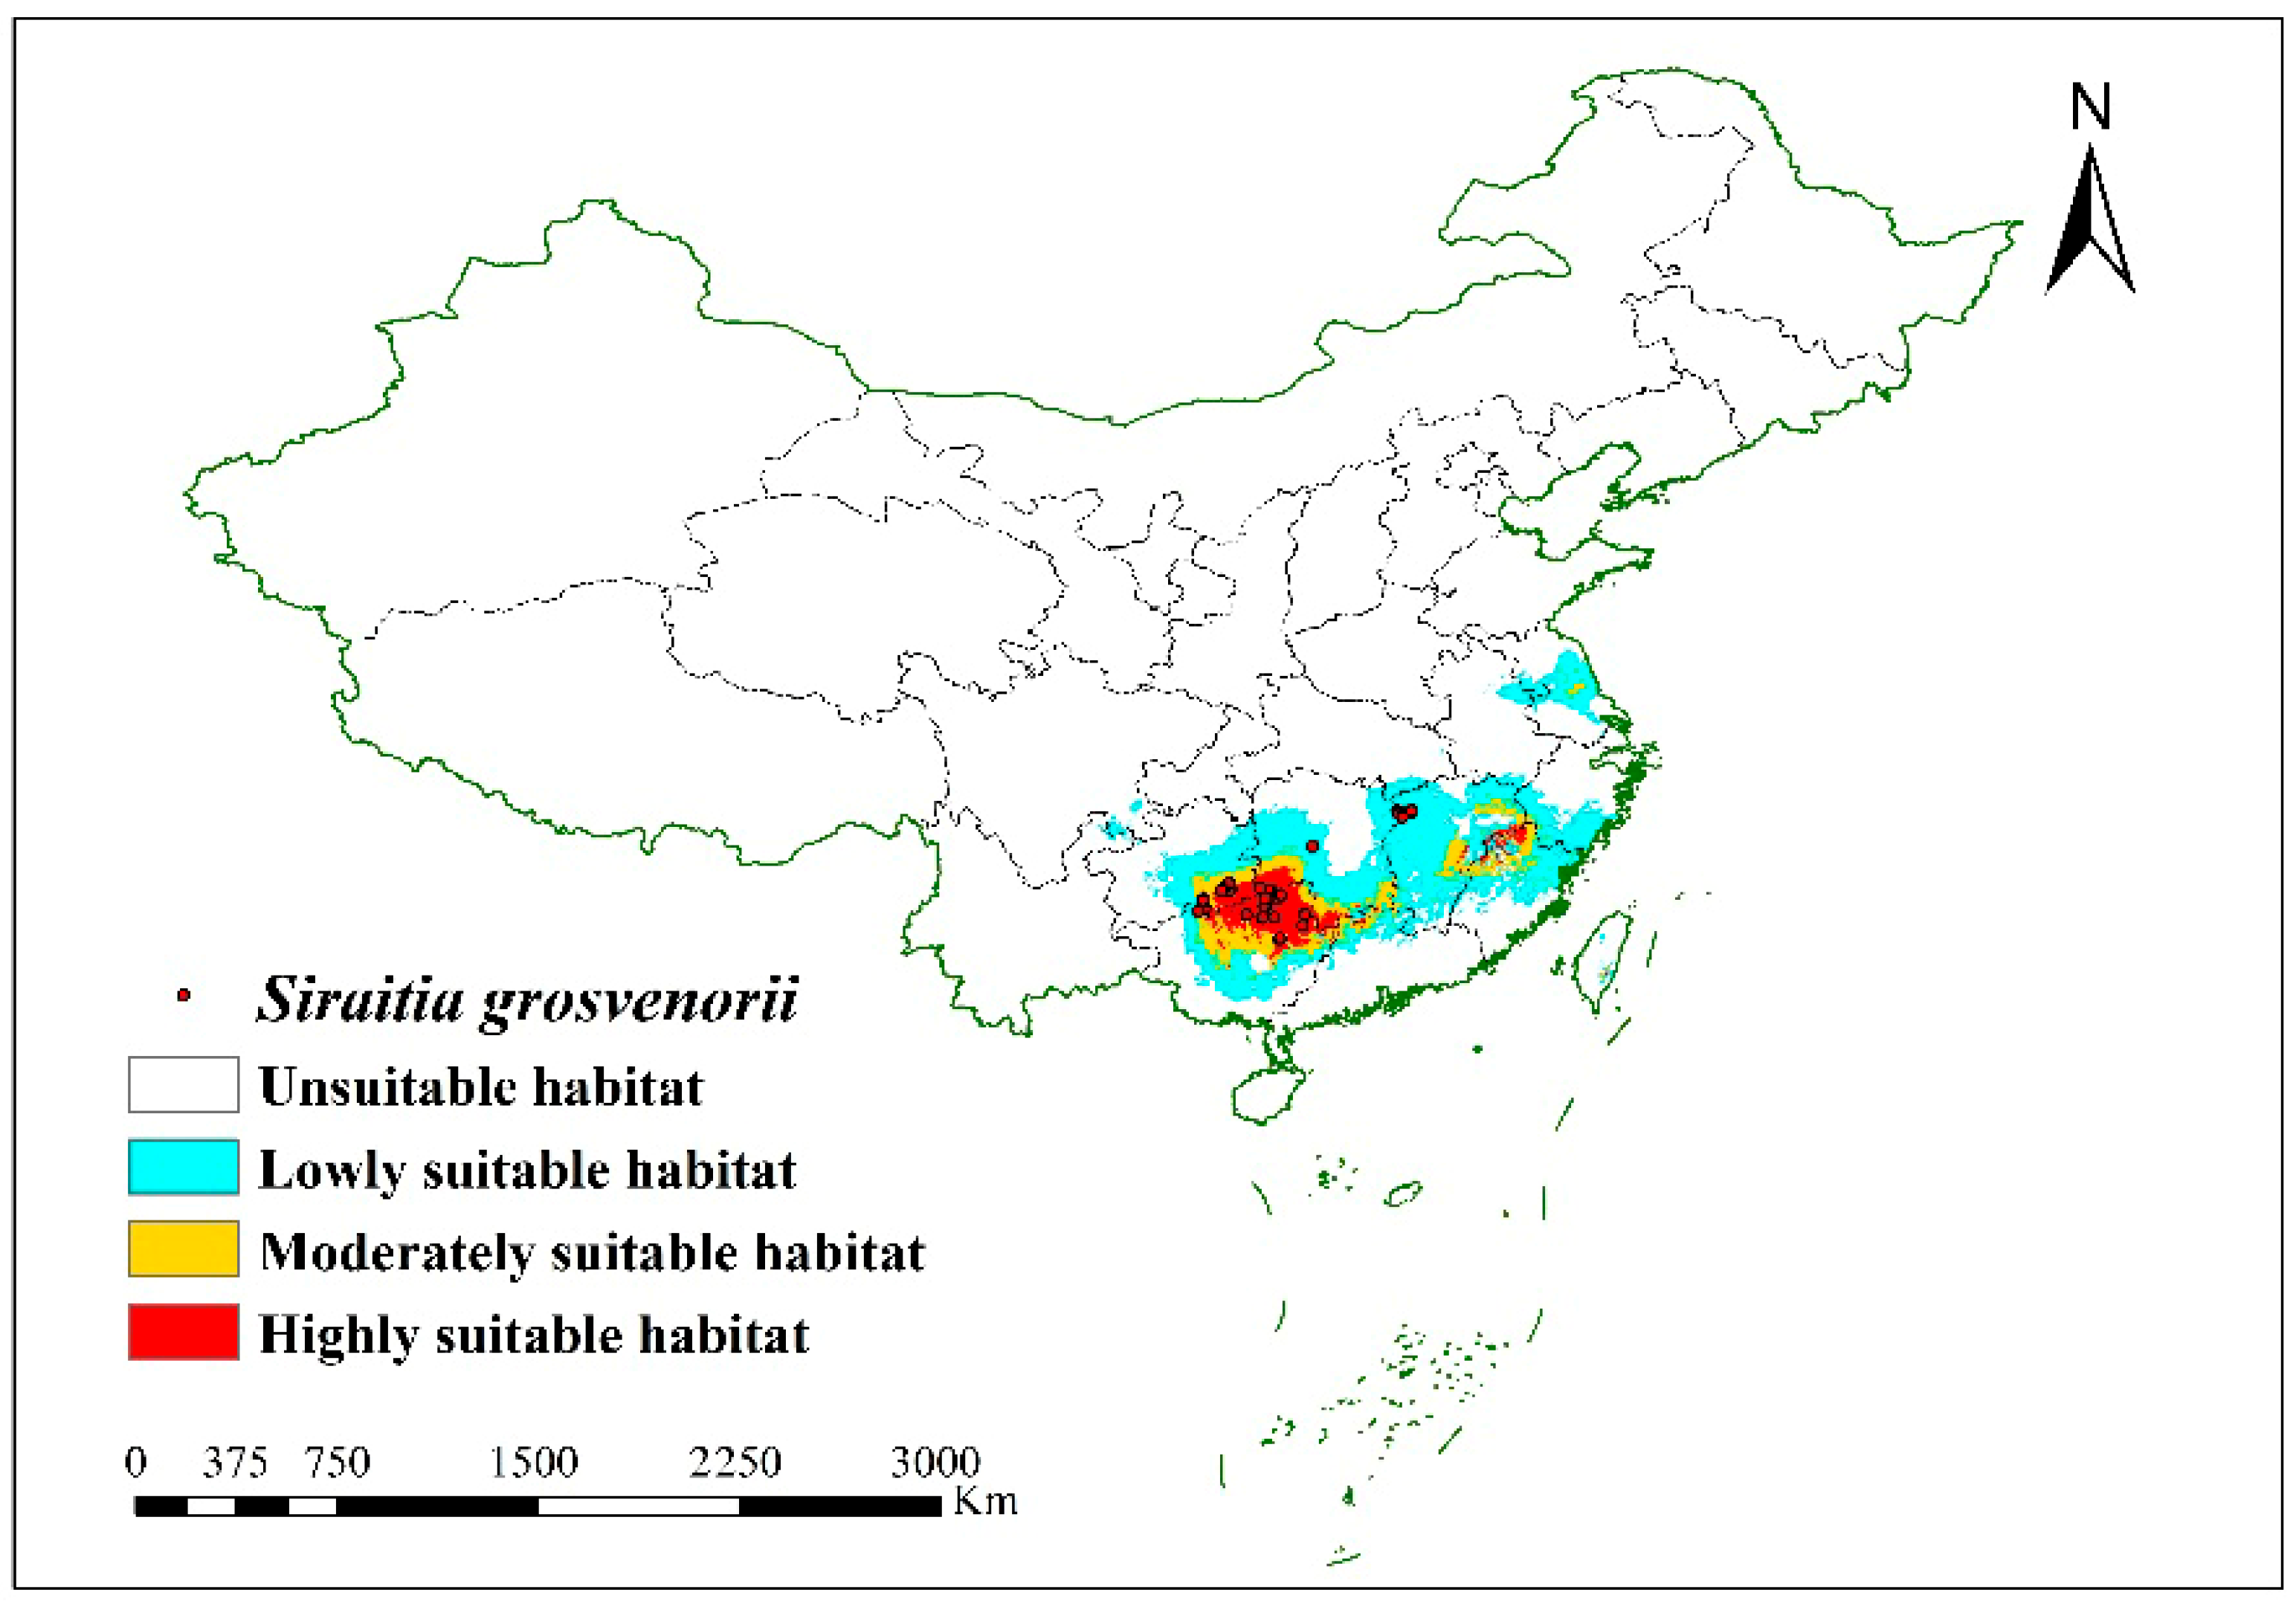
3.3. Suitable Regions in China for S. grosvenorii Cultivation in Current Climate Conditions
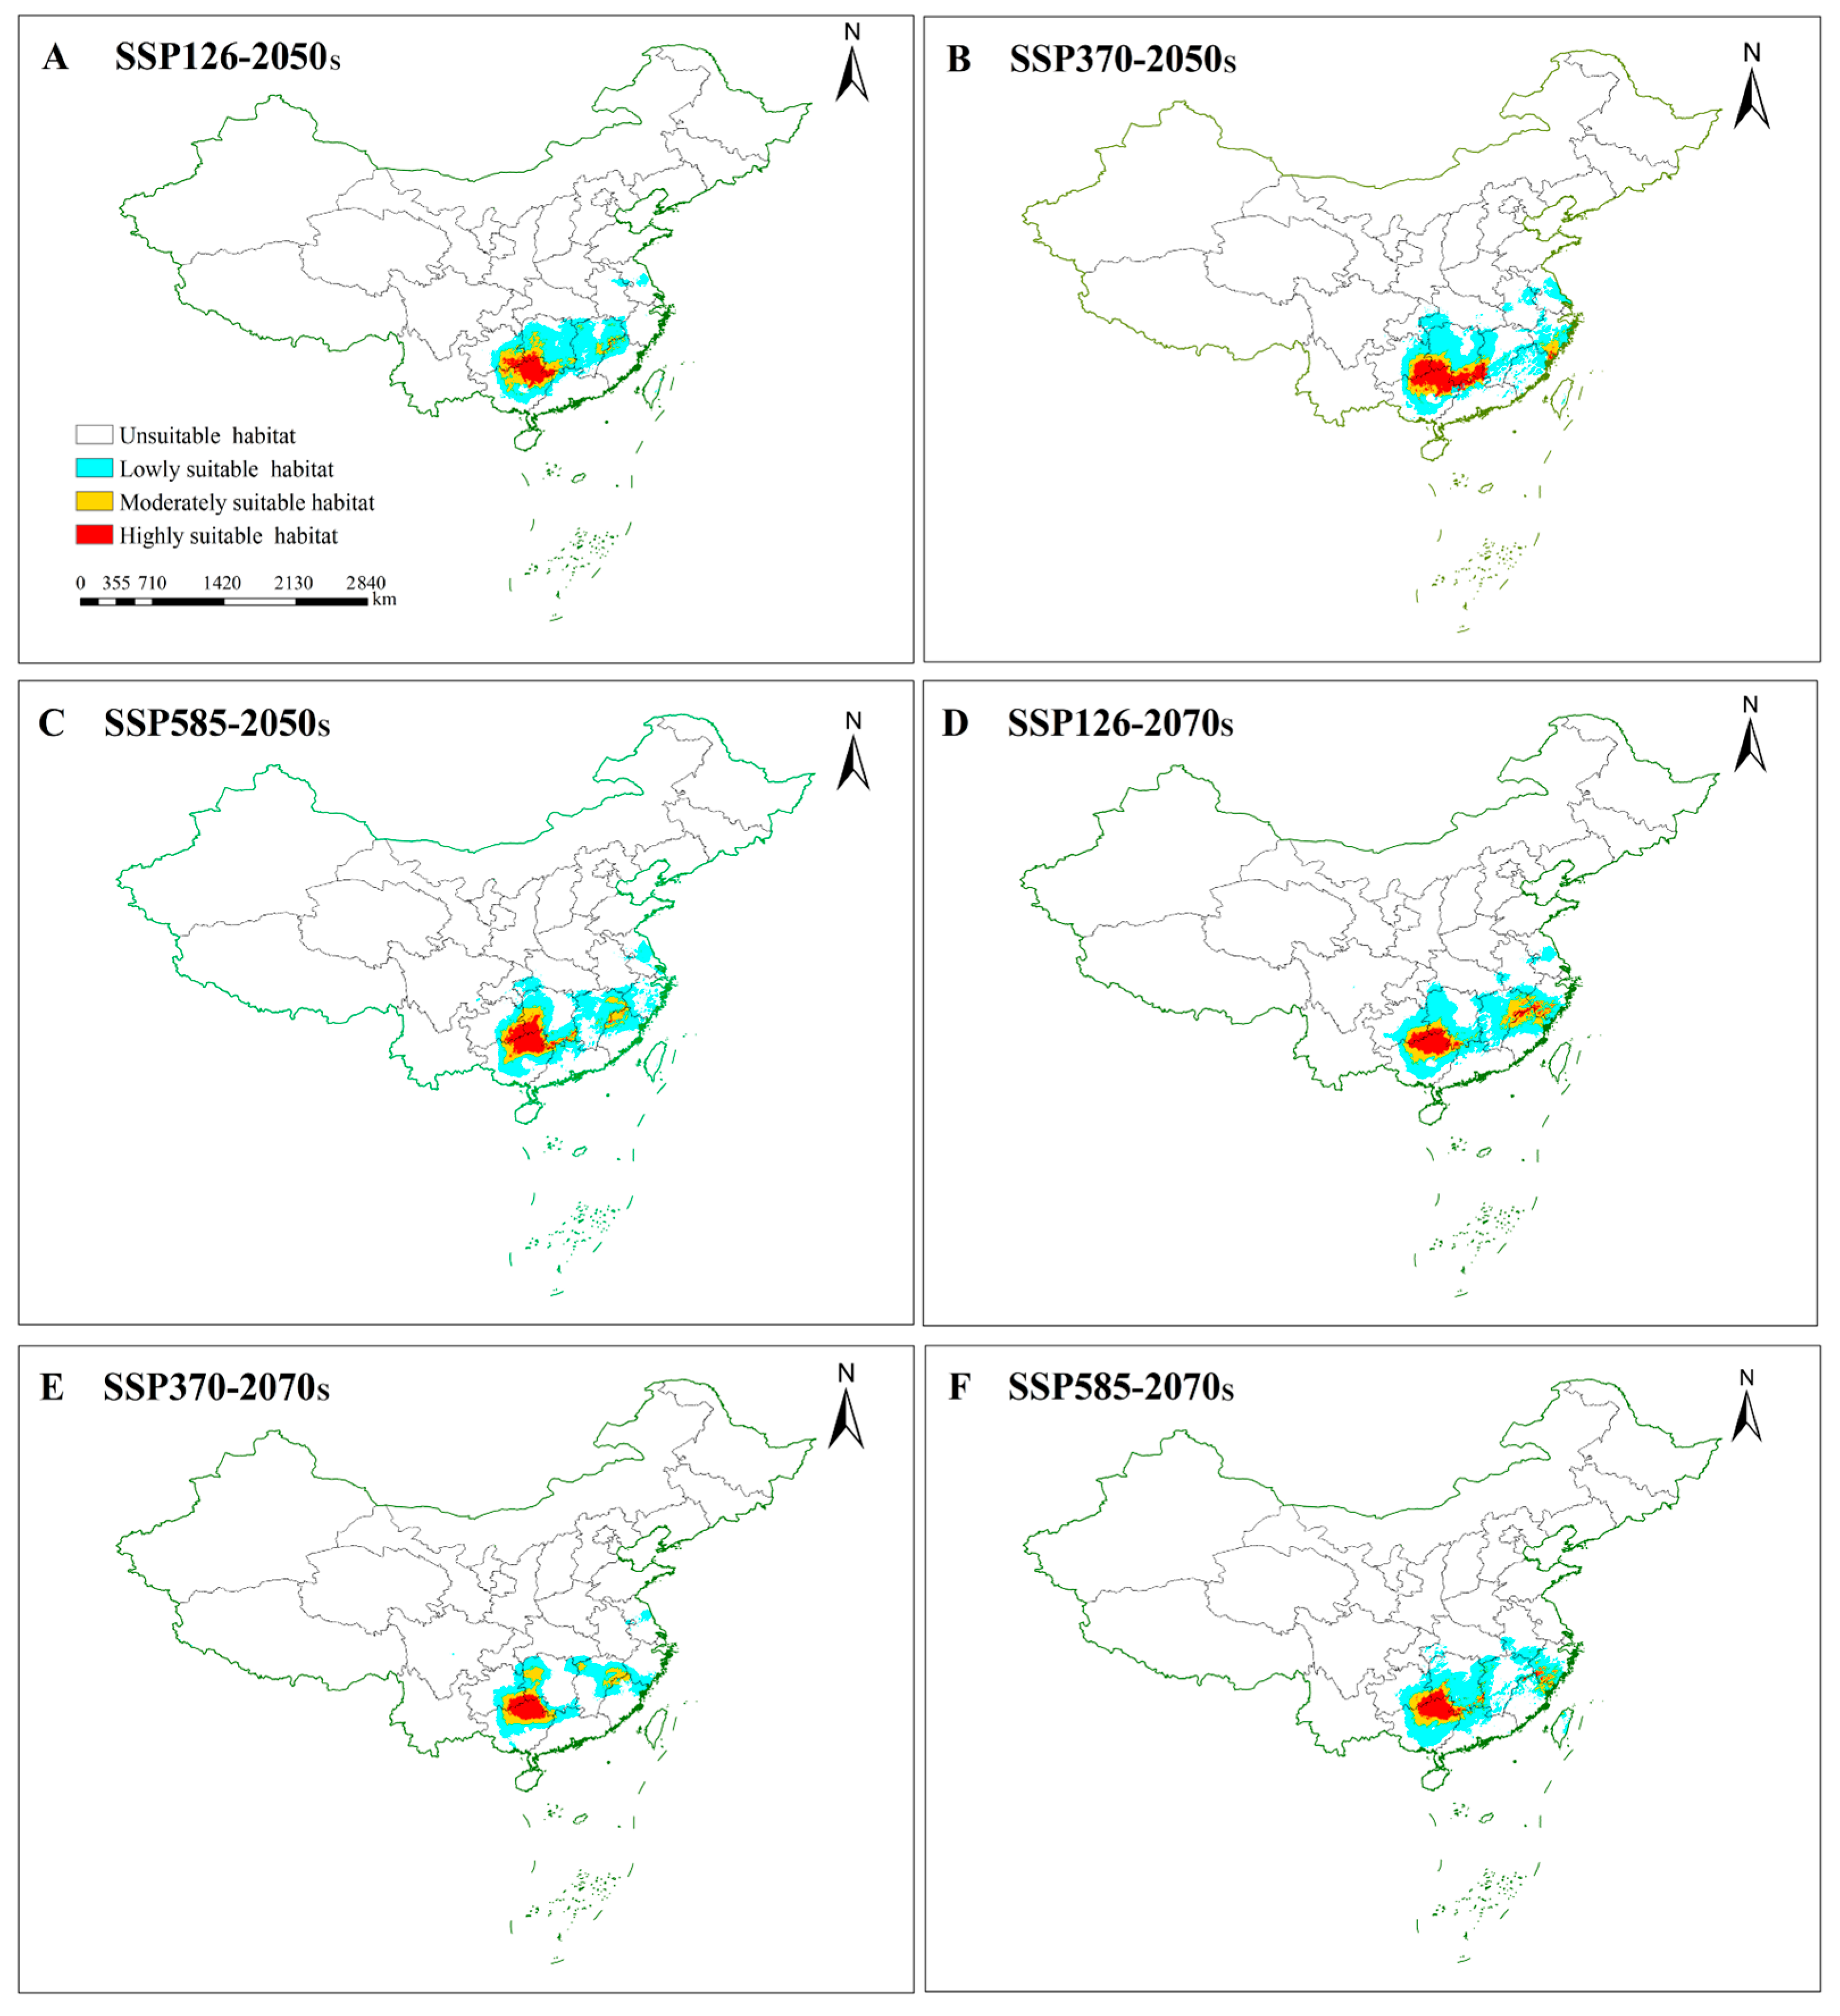
3.4. Potentially Suitable Areas for S. grosvenorii in Future Climate Conditions
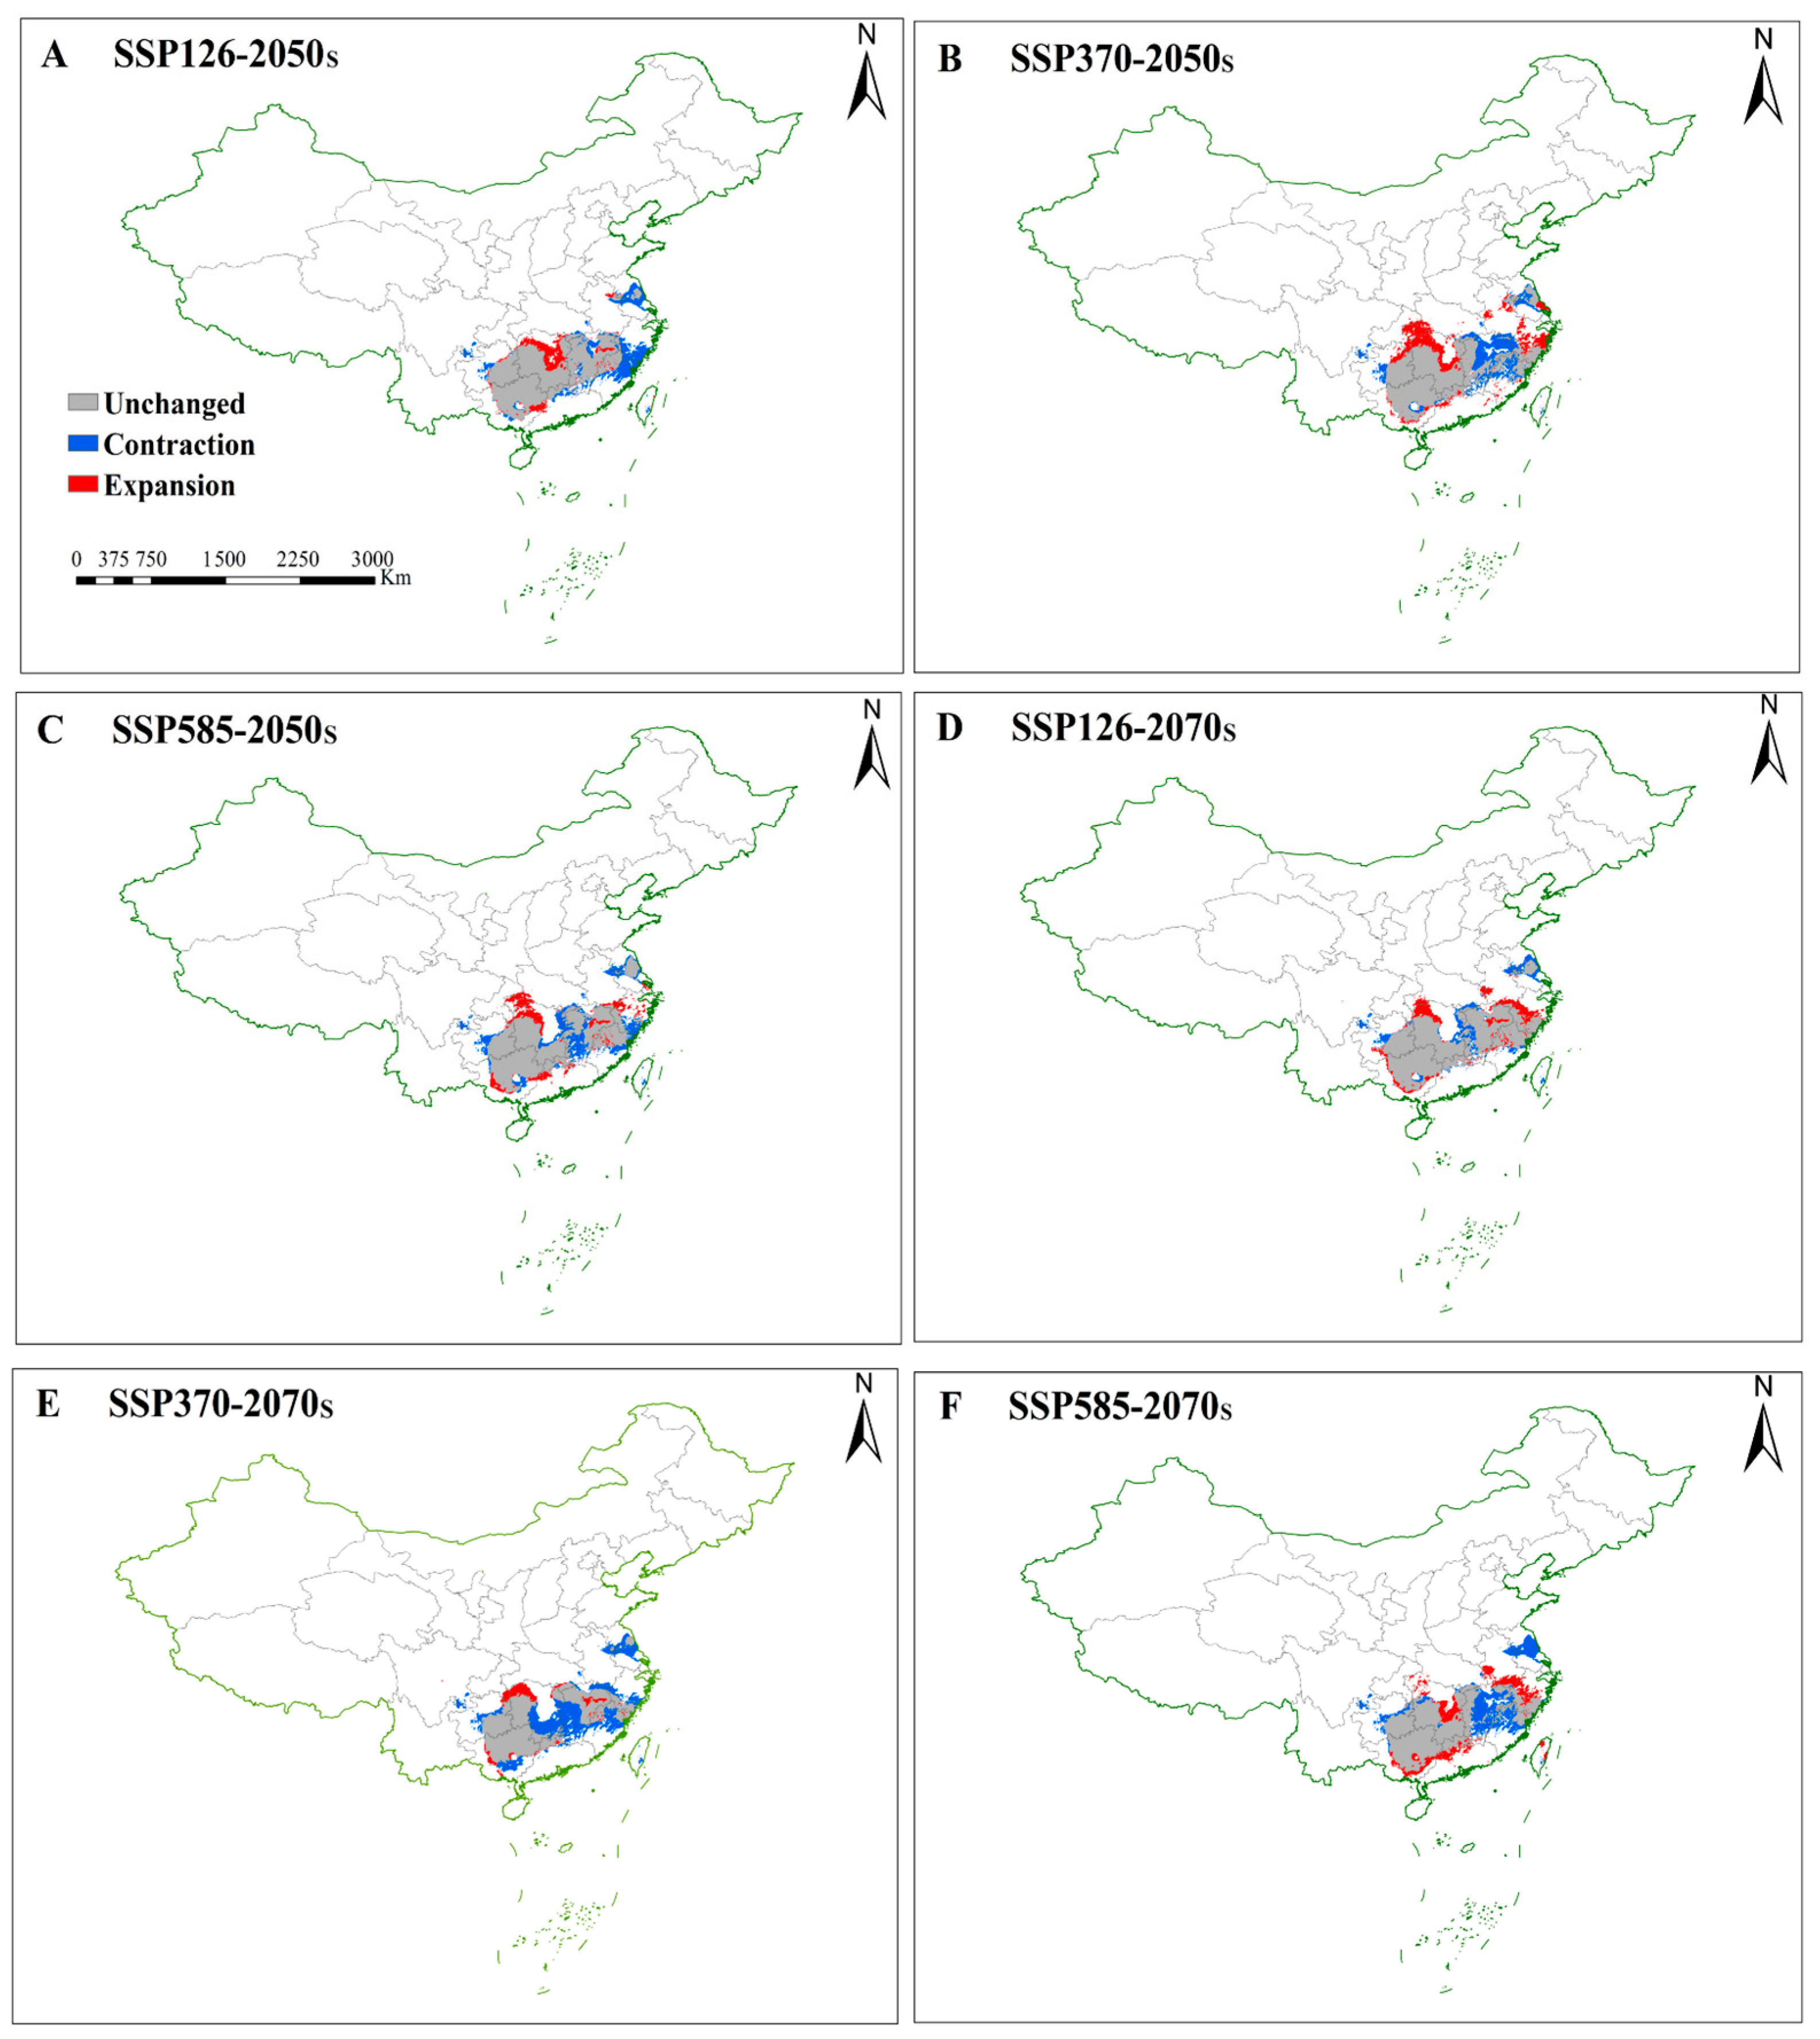
3.4.1. Future Changes in Suitable Habitats for S. grosvenorii
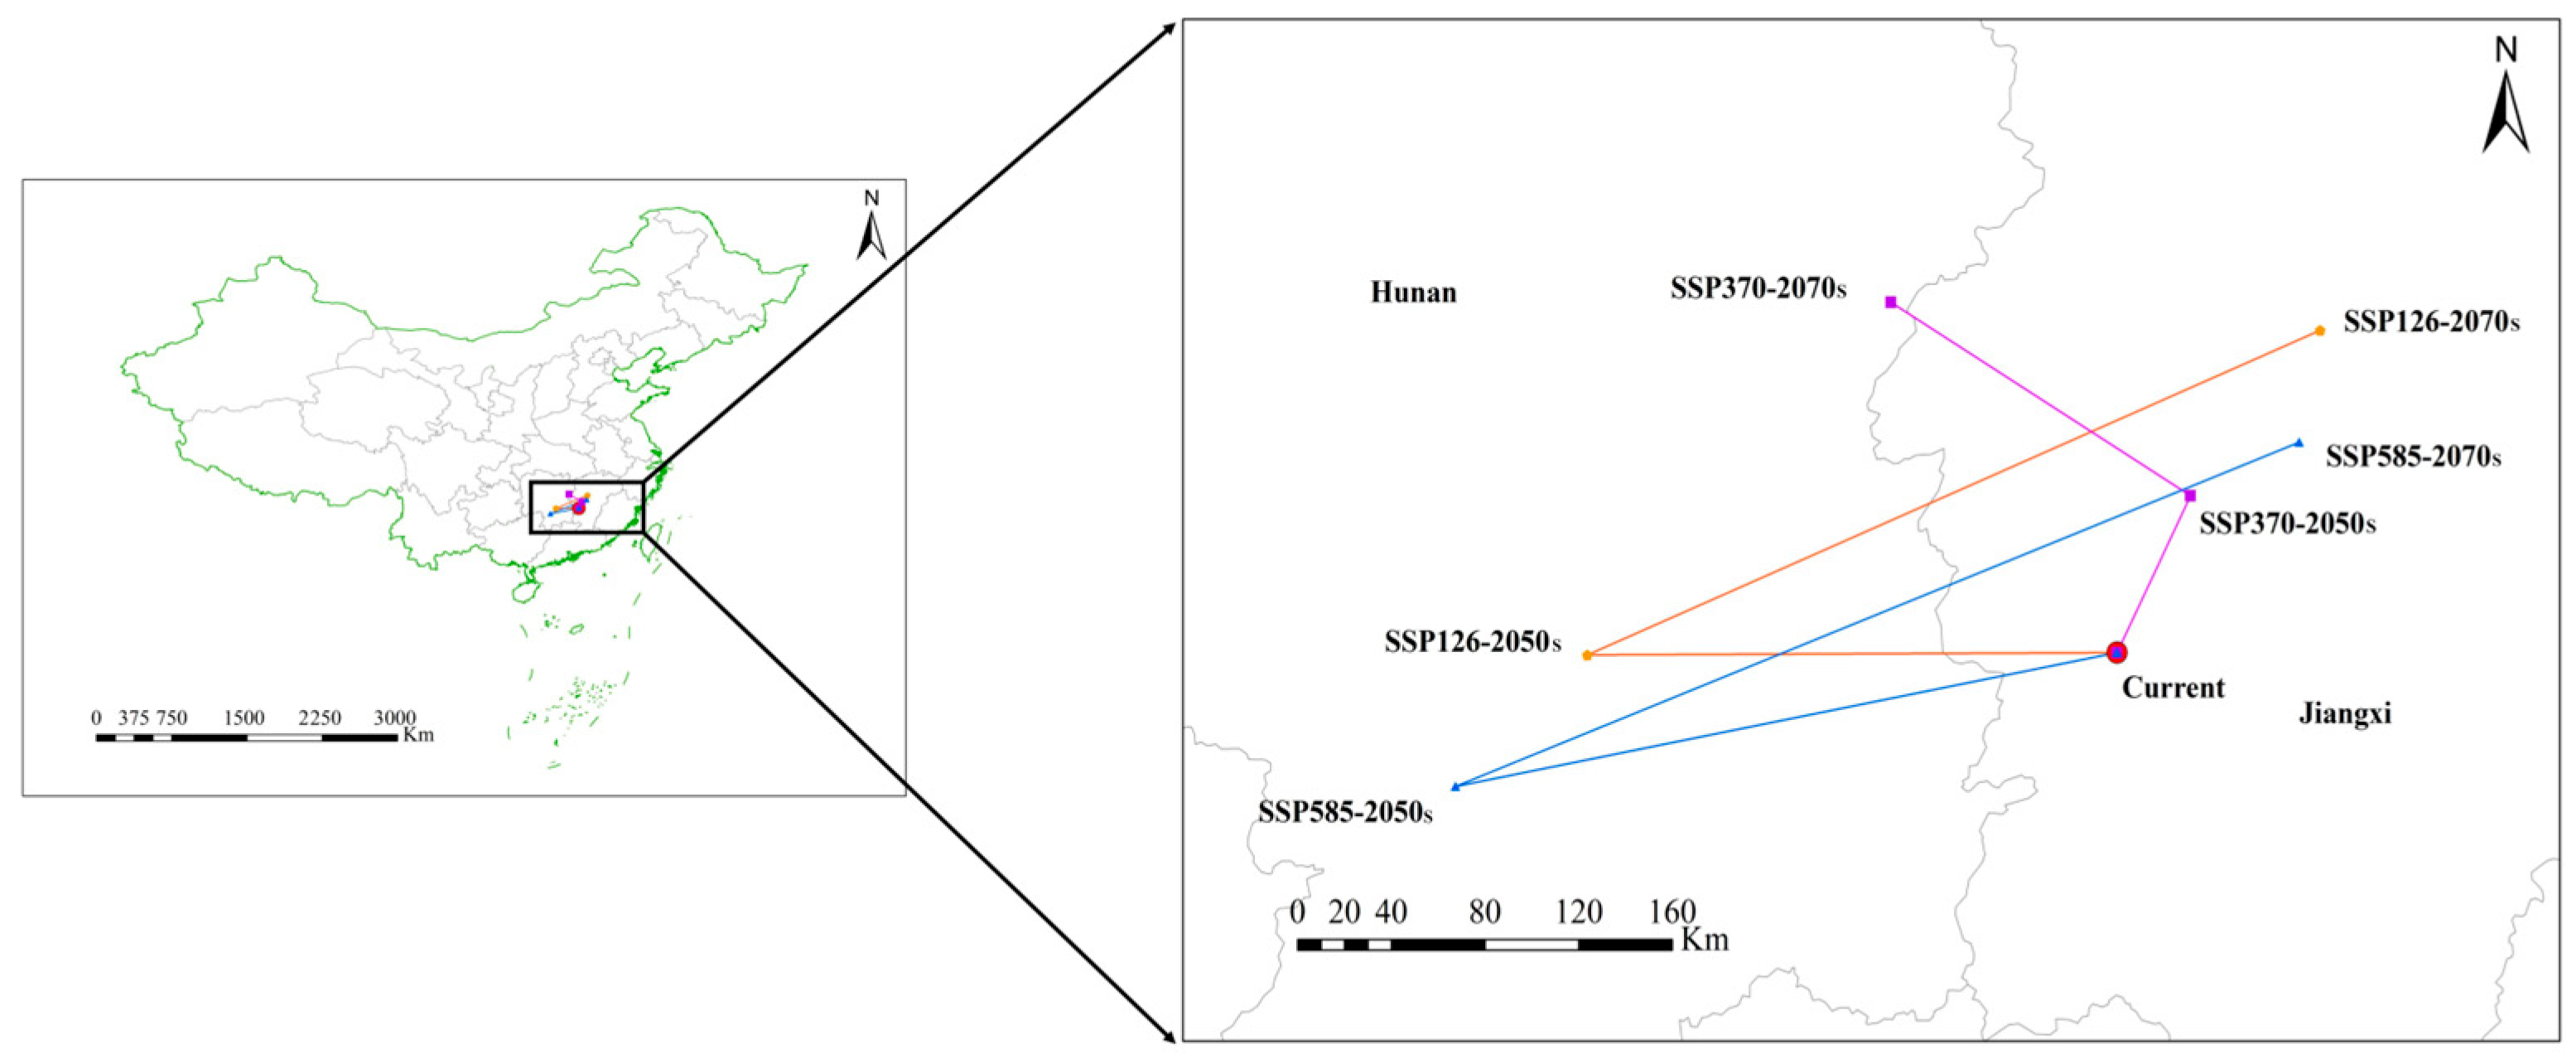
3.4.2. Changes in the Distribution Core of S. grosvenorii
3.5. Chemical Composition of S. grosvenorii
3.5.1. Element Contents of S. grosvenorii
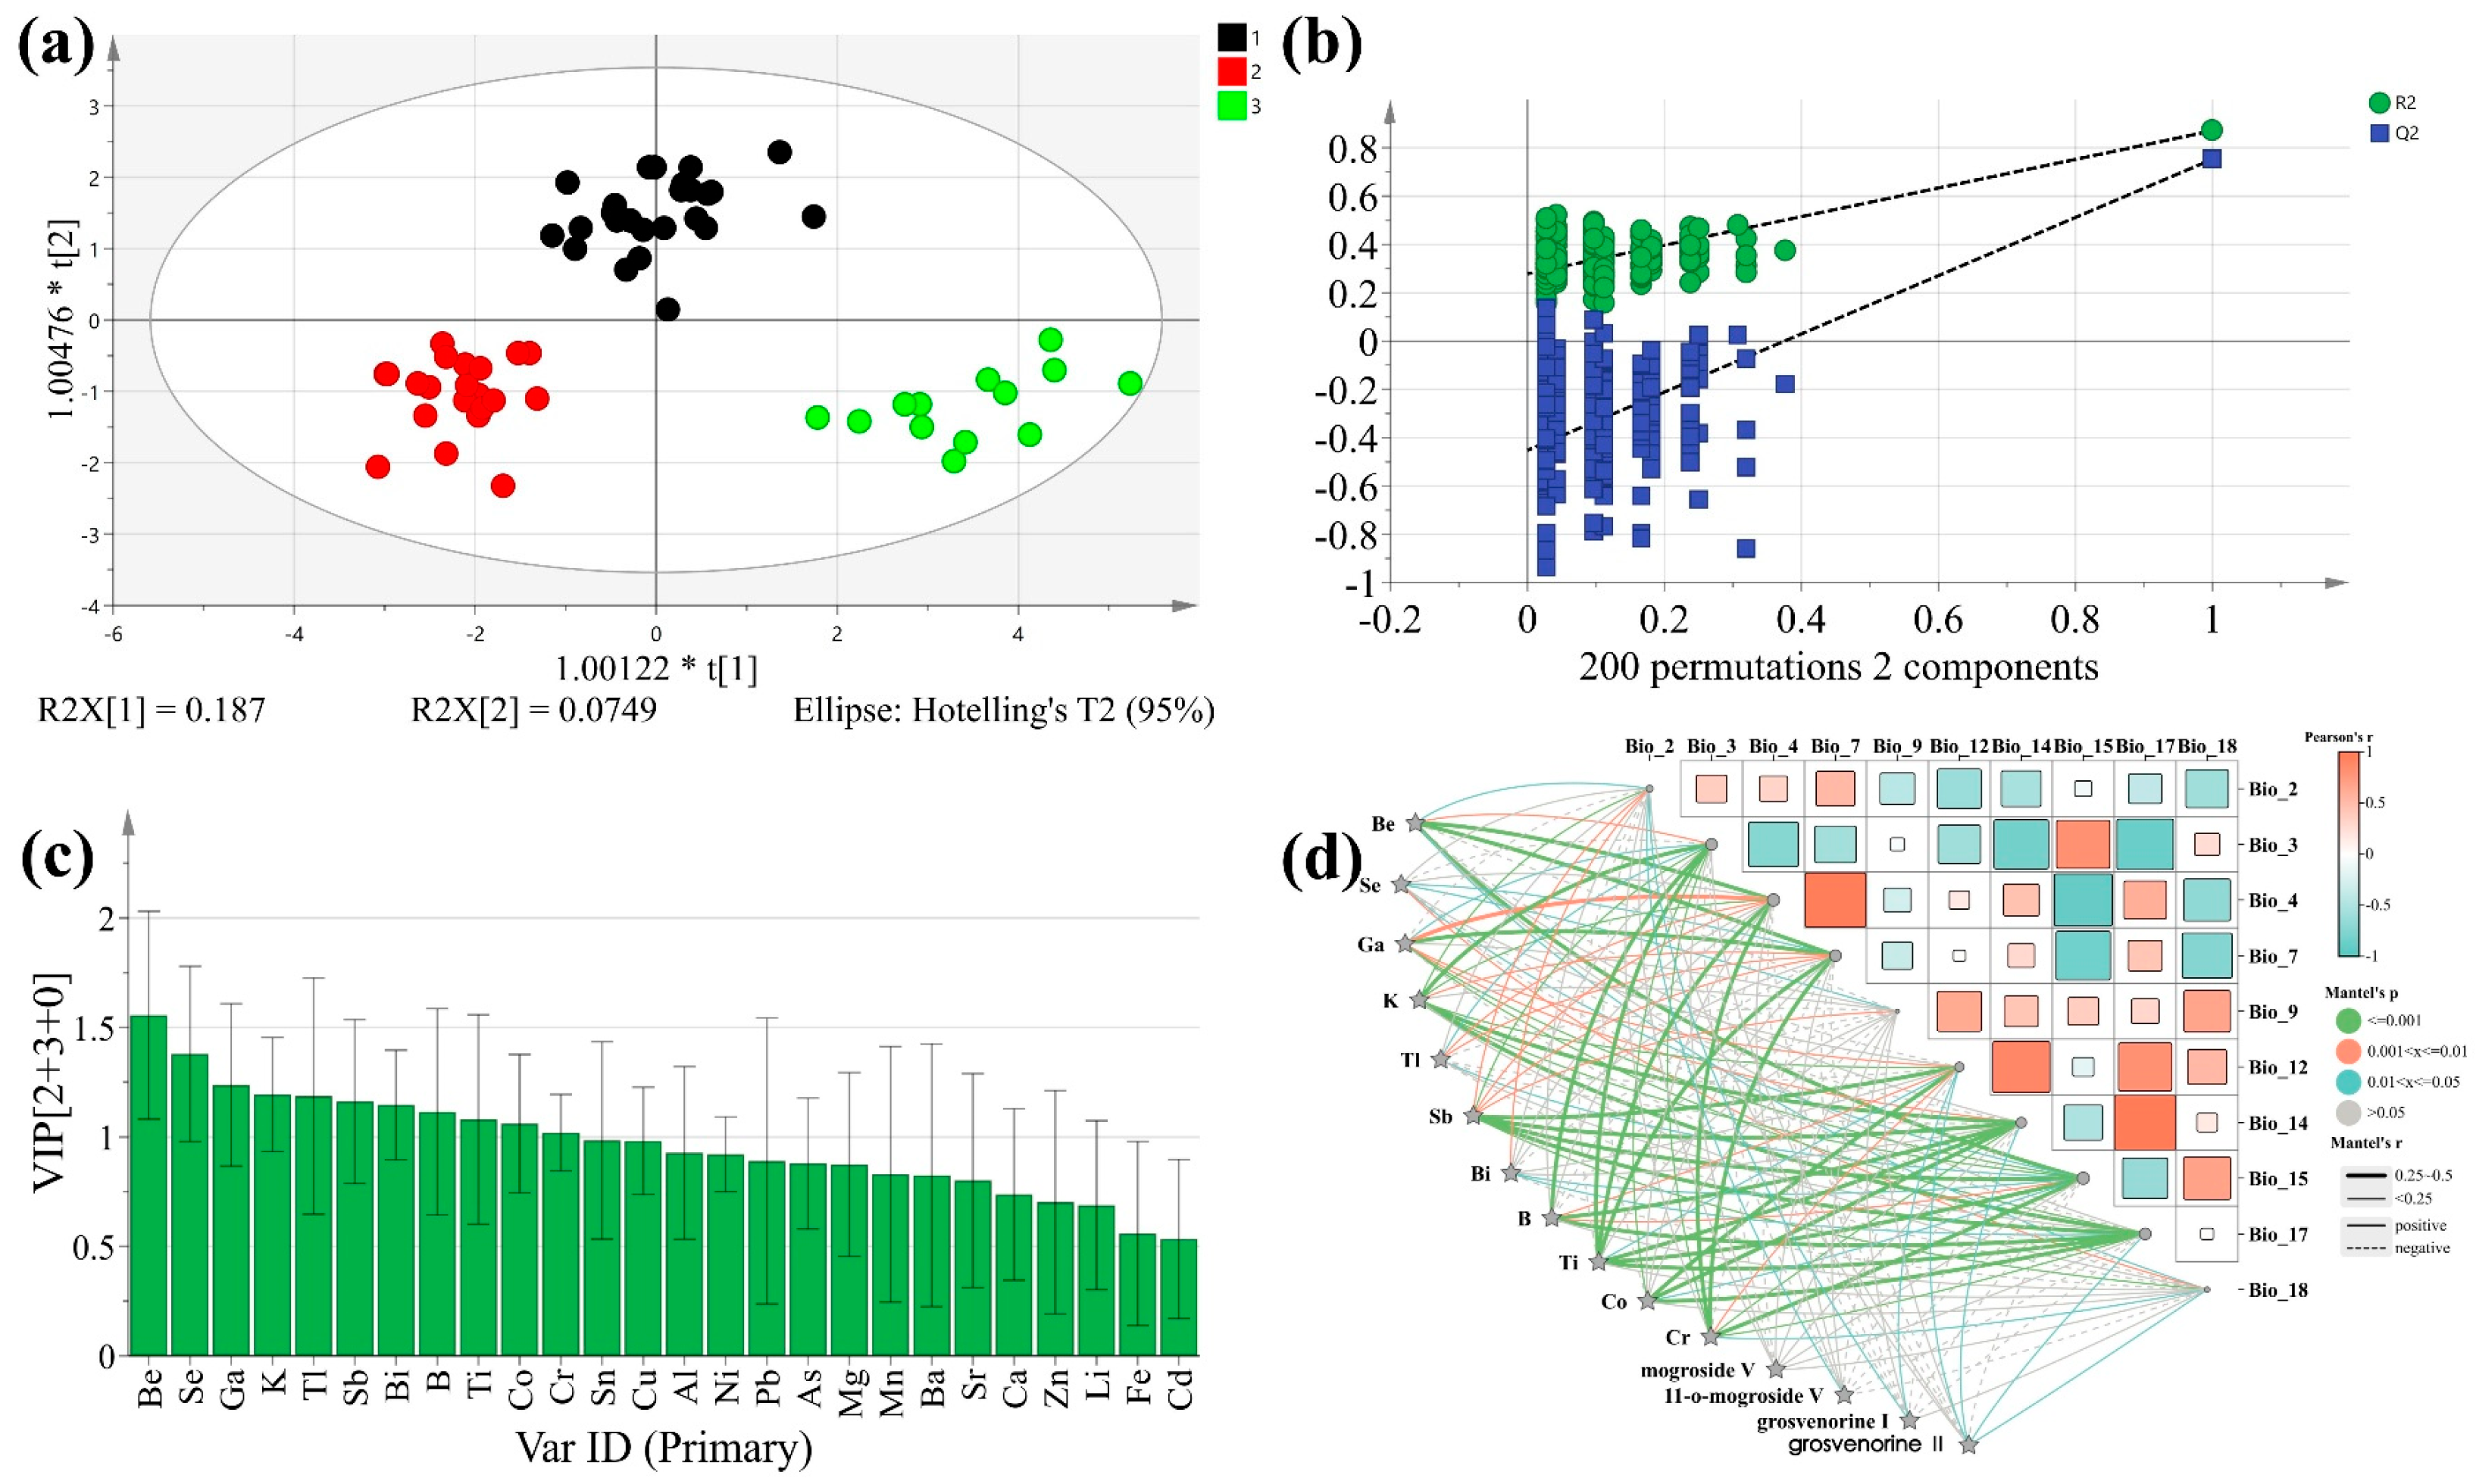
3.5.2. OPLS-DA
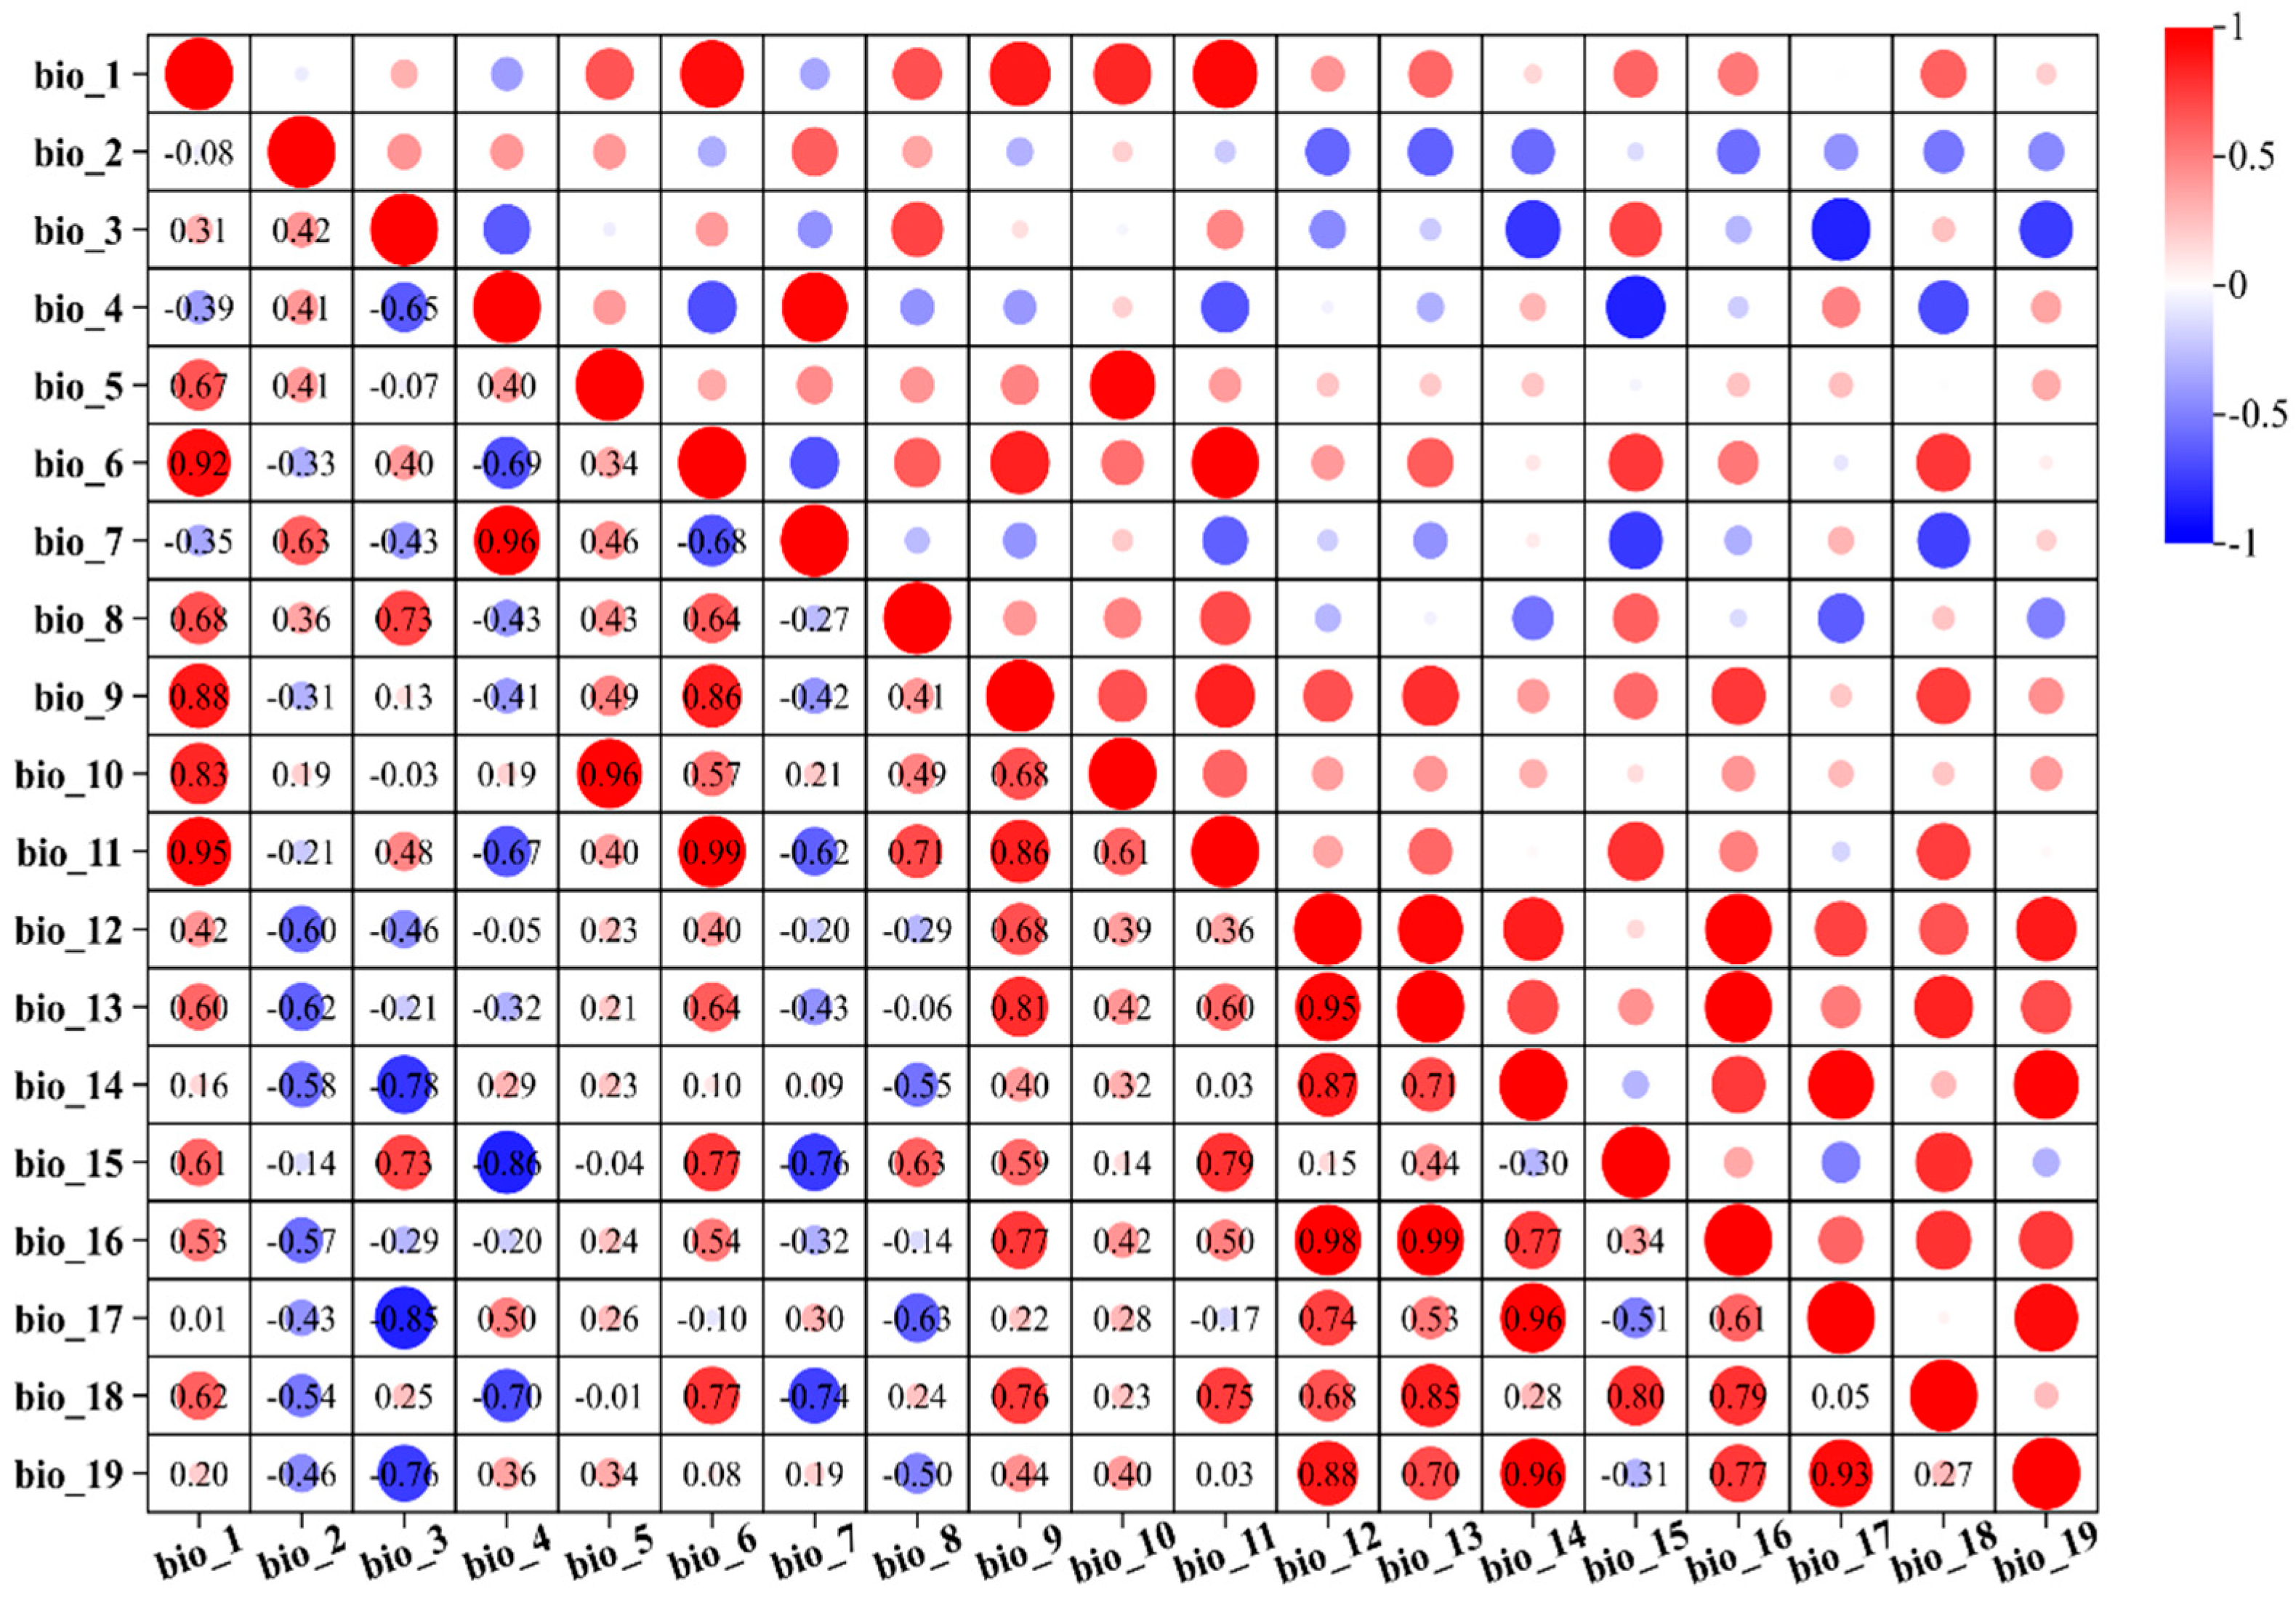
3.5.3. Correlation Analysis
4. Discussion
4.1. The Primary Environmental Factors Influencing the Distribution of S. grosvenorii
4.2. Correlation of Climatic Variables and Chemical Composition
4.3. Changes in S. grosvenorii Distribution in the Future
5. Conclusions
Author Contributions
Funding
Data Availability Statement
Conflicts of Interest
Appendix A

| Environment Variable | Interpretation |
|---|---|
| bio_1 | Annual mean temperature (°C) |
| bio_2 | Mean diurnal range (Mean of monthly (max temp–min temp)) (°C) |
| bio_3 | Isothermality (bio_2/bio_7) (×100) |
| bio_4 | Temperature seasonality (standard deviation ×100) |
| bio_5 | Max temperature of warmest month (°C) |
| bio_6 | Min temperature of coldest month (°C) |
| bio_7 | Temperature annual range (bio_5/bio_6) (°C) |
| bio_8 | Mean temperature of wettest quarter (°C) |
| bio_9 | Mean temperature of driest quarter (°C) |
| bio_10 | Mean temperature of warmest quarter (°C) |
| bio_11 | Mean temperature of coldest quarter (°C) |
| bio_12 | Annual precipitation (mm) |
| bio_13 | Precipitation of wettest month (mm) |
| bio_14 | Precipitation of driest month (mm) |
| bio_15 | Precipitation seasonality (Coefficient of variation) (mm) |
| bio_16 | Precipitation of wettest quarter (mm) |
| bio_17 | Precipitation of driest quarter (mm) |
| bio_18 | Precipitation of warmest quarter (mm) |
| bio_19 | Precipitation of coldest quarter (mm) |
| Chemical Constituents | bio_2 | bio_3 | bio_4 | bio_7 | bio_9 | bio_12 | bio_14 | bio_15 | bio_17 | bio_18 |
|---|---|---|---|---|---|---|---|---|---|---|
| Be | 0.436 ** | −0.461 ** | 0.778 ** | 0.813 ** | −0.219 | 0.101 | 0.233 | −0.628 ** | 0.344 ** | −0.486 ** |
| Se | −0.436 ** | 0.068 | −0.377 ** | −0.454 ** | 0.390 ** | 0.292 * | 0.162 | 0.372 ** | 0.057 | 0.517 ** |
| Ga | 0.154 | −0.416 ** | 0.532 ** | 0.530 ** | 0.170 | 0.456 ** | 0.442 ** | −0.370 ** | 0.493 ** | −0.026 |
| K | −0.327 * | −0.633 ** | 0.406 ** | 0.294 * | 0.111 | 0.526 ** | 0.611 ** | −0.506 ** | 0.644 ** | −0.058 |
| Tl | 0.380 ** | −0.033 | 0.307 * | 0.380 ** | −0.126 | −0.027 | −0.059 | −0.188 | 0.022 | −0.191 |
| Sb | −0.309 * | 0.165 | −0.378 ** | −0.418 ** | 0.538 ** | 0.338 ** | 0.135 | 0.467 ** | 0.026 | 0.633 ** |
| Bi | 0.294 * | 0.477 ** | −0.273 * | −0.175 | −0.024 | −0.372 ** | −0.496 ** | 0.437 ** | −0.531 ** | 0.098 |
| B | −0.438 ** | −0.501 ** | 0.185 | 0.068 | 0.204 | 0.447 ** | 0.528 ** | −0.361 ** | 0.510 ** | 0.015 |
| Ti | 0.101 | −0.563 ** | 0.633 ** | 0.599 ** | −0.004 | 0.286 * | 0.451 ** | −0.603 ** | 0.505 ** | −0.339 ** |
| Co | −0.193 | −0.439 ** | 0.311 * | 0.244 | 0.377 ** | 0.614 ** | 0.572 ** | −0.244 | 0.554 ** | 0.211 |
| Cr | −0.052 | 0.526 ** | −0.571 ** | −0.529 ** | 0.078 | −0.274 * | −0.428 ** | 0.632 ** | −0.515 ** | 0.345 ** |
| mogroside V | 0.261 * | 0.199 | −0.013 | 0.046 | −0.065 | −0.213 | −0.248 | 0.164 | −0.254 | −0.017 |
| 11-oxo-mogroside V | 0.351 ** | 0.019 | 0.224 | 0.296 * | −0.057 | −0.025 | −0.066 | −0.083 | −0.034 | −0.119 |
| grosvenorine I | 0.367 ** | 0.133 | 0.107 | 0.189 | −0.078 | −0.284 * | −0.238 | 0.010 | −0.234 | −0.260 * |
| grosvenorine II | 0.291 * | −0.010 | 0.212 | 0.264 * | −0.262 * | −0.199 | −0.148 | −0.122 | −0.115 | −0.275 * |
Appendix B

References
- Céline, B.; Cleo, B.; Paul, L.; Wilfried, T.; Franck, C. Impacts of climate change on the future of biodiversity. Ecol. Lett. 2012, 15, 365–377. [Google Scholar] [CrossRef]
- Shi, J.Y.; Xia, M.X.; He, G.Q.; Gonzalez, N.C.T.; Zhou, S.; Lan, K.; Ouyang, L.; Shen, X.B.; Jiang, X.L.; Cao, F.L.; et al. Predicting Quercus gilva distribution dynamics and its response to climate change induced by GHGs emission through MaxEnt modeling. J. Environ. Manag. 2024, 357, 120841. [Google Scholar] [CrossRef] [PubMed]
- Applequist, W.L.; Brinckmann, J.A.; Cunningham, A.B.; Hart, R.E.; Heinrich, M.; Katerere, D.R.; van Andel, T. Scientists’ warning on climate change and medicinal plants. Planta Med. 2020, 86, 10–18. [Google Scholar] [CrossRef]
- Lu, X.Y.; Jin, Y.Y.; Wang, Y.Z.; Chen, Y.L.; Fan, X.H. Multimodal integrated strategy for the discovery and identification of quality markers in traditional Chinese medicine. J. Pharm. Anal. 2022, 12, 701–710. [Google Scholar] [CrossRef]
- Varotsos, C.A.; Franzke, C.L.E.; Efstathiou, M.N.; Degermendzhi, A.G. Evidence for two abrupt warming events of SST in the last century. Theor. Appl. Climatol. 2014, 116, 51–60. [Google Scholar] [CrossRef]
- Yang, Y.; He, J.; Liu, Y.X.; Zeng, J.X.; Zeng, L.Q.; He, R.L.; Guiang, M.M.; Li, Y.Q.; Wu, H. Assessment of Chinese suitable habitats of Zanthoxylum nitidum in different climatic conditions by Maxent model, HPLC, and chemometric methods. Ind. Crops Prod. 2023, 196, 116515. [Google Scholar] [CrossRef]
- Zhao, Q.; Mi, Z.Y.; Lu, C.; Zhang, X.F.; Chen, L.J.; Wang, S.Q.; Niu, J.F.; Wang, Z.Z. Predicting potential distribution of Ziziphus spinosa (Bunge) H.H. Hu ex F.H. Chen in China under climate change scenarios. Ecol. Evol. 2022, 12, e8629. [Google Scholar] [CrossRef]
- Gong, P.; Guo, Y.X.; Chen, X.F.; Cui, D.D.; Wang, M.G.; Yang, W.J.; Chen, F.X. Structural characteristics, antioxidant and hypoglycemic activities of polysaccharide from Siraitia grosvenorii. Molecules 2022, 27, 4192. [Google Scholar] [CrossRef]
- Li, H.; Li, R.L.; Jiang, W.; Zhou, L.M. Research progress of pharmacological effects of Siraitia grosvenorii extract. J. Pharm. Pharmacol. 2022, 74, 953–960. [Google Scholar] [CrossRef]
- Liu, H.; Du, Y.; Liu, L.L.; Liu, Q.S.; Mao, H.H.; Cheng, Y. Anti-depression-like effect of Mogroside V is related to the inhibition of inflammatory and oxidative stress pathways. Eur. J. Pharmacol. 2023, 955, 175828. [Google Scholar] [CrossRef]
- Zhao, S.; Xiong, F.; Wang, L.; Wang, B.; Chen, K.; Chen, C.; Zhou, G. Study on the quality characteristics and geographical origin authentication of wild Rheum tanguticum in three authentic regions. J. Food Compos. Anal. 2023, 123, 105463. [Google Scholar] [CrossRef]
- Soilhi, Z.; Sayari, N.; Benalouache, N.; Mekki, M. Predicting current and future distributions of Mentha pulegium L. in Tunisia under climate change conditions, using the MaxEnt model. Ecol. Inform. 2022, 68, 101533. [Google Scholar] [CrossRef]
- Bai, J.Y.; Wang, H.C.; Hu, Y.K. Prediction of potential suitable distribution of Liriodendron chinense (Hemsl.) Sarg. in China based on future climate change using the optimized MaxEnt model. Forests 2024, 15, 988. [Google Scholar] [CrossRef]
- Liu, X.D.; Zhang, Y.; Wu, M.H.; Ma, Z.G.; Huang, Z.H.; Tian, F.; Dong, S.H.; Luo, S.M.; Zhou, Y.; Zhang, J.J.; et al. The scientific elucidation of Daodi medicinal materials. Chin. Med. 2020, 15, 86. [Google Scholar] [CrossRef] [PubMed]
- Fletcher, R.J.; Hefley, T.J.; Robertson, E.P.; Zuckerberg, B.; McCleery, R.A.; Dorazio, R.M. A practical guide for combining data to model species distributions. Ecology 2019, 100, e02710. [Google Scholar] [CrossRef]
- Phillips, S.J.; Anderson, R.P.; Schapire, R.E. Maximum entropy modeling of species geographic distributions. Ecol. Modell. 2006, 190, 231–259. [Google Scholar] [CrossRef]
- Hu, W.J.; Wang, Y.Y.; Dong, P.; Zhang, D.; Yu, W.W.; Ma, Z.Y.; Chen, G.C.; Liu, Z.H.; Du, J.G.; Chen, B.; et al. Predicting potential mangrove distributions at the global northern distribution margin using an ecological niche model: Determining conservation and reforestation involvement. For. Ecol. Manag. 2020, 478, 118517. [Google Scholar] [CrossRef]
- Moreno, R.; Zamora, R.; Molina, J.R.; Vasquez, A.; Herrera, M.Á. Predictive modeling of microhabitats for endemic birds in South Chilean temperate forests using Maximum entropy (Maxent). Ecol. Inform. 2011, 6, 364–370. [Google Scholar] [CrossRef]
- Li, Z.; Hu, Z.; Zhao, Y.; Yang, L.; Tang, H.; Li, J. Geographical variations in Polygonatum polysaccharides and saponins biosynthesis in Polygonatum species. Ind. Crops Prod. 2025, 227, 120814. [Google Scholar] [CrossRef]
- Zhan, P.; Wang, F.Y.; Xia, P.G.; Zhao, G.H.; Wei, M.T.; Wei, F.G.; Han, R.L. Assessment of suitable cultivation region for Panax notoginseng under different climatic conditions using MaxEnt model and high-performance liquid chromatography in China. Ind. Crops Prod. 2022, 176, 114416. [Google Scholar] [CrossRef]
- Wan, G.Z.; Guo, Z.H.; Xi, S.Y.; Jin, L.; Chen, J. Spatial variability and climate response characteristics of chemical components of Tussilago farfara L. Ind. Crops Prod. 2023, 204, 117352. [Google Scholar] [CrossRef]
- Wei, X.Q.; Lei, X.; He, W.J. Study on ecological suitability of Siraitia grosvenorii in producing areas in the world. Guizhou Agric. Sci. 2020, 48, 119–124. (In Chinese) [Google Scholar]
- Wang, S.; Chen, P.; Liu, Y.; Chen, C.; Tian, J.; Liu, Z.; Li, B.; Mei, X.; Chen, Y.; Zhang, Y.; et al. Geographical origin traceability of sweet cherry (Prunus avium (L.) Moench) in China using stable isotope and multi-element analysis with multivariate modeling. Food Chem. X. 2024, 23, 101477. [Google Scholar] [CrossRef] [PubMed]
- Huang, X.P.; Lei, L.; Lei, S.X.; Zhu, W.W.; Yan, J. Traceability of the geographical origin of Siraitia grosvenorii based on multielement contents coupled with chemometric techniques. Sci. Rep. 2021, 11, 21150. [Google Scholar] [CrossRef]
- Shi, X.D.; Wang, J.W.; Zhang, L.; Chen, S.X.; Zhao, A.L.; Ning, X.D.; Fan, G.R.; Wu, N.S.; Zhang, L.; Wang, Z.D. Prediction of the potentially suitable areas of Litsea cubeba in China based on future climate change using the optimized MaxEnt model. Ecol. Indic. 2023, 148, 110093. [Google Scholar] [CrossRef]
- Yang, Z.W.; Yang, X.J.; Huang, Y.H.; Zhang, Y.L.; Guo, Y.; Feng, M.C.; Qin, M.X.; Jin, N.; Amjad, M.; Wang, C.; et al. Potential impacts of climate change on the spatial distribution pattern of Naked oats in China. Agronomy 2025, 15, 362. [Google Scholar] [CrossRef]
- Jarnevich, C.S.; Stohlgren, T.J.; Kumar, S.; Morisette, J.T.; Holcombe, T.R. Caveats for correlative species distribution modeling. Ecol. Inform. 2015, 29, 6–15. [Google Scholar] [CrossRef]
- Li, J.; Fan, G.; He, Y. Predicting the current and future distribution of three Coptis herbs in China under climate change conditions, using the MaxEnt model and chemical analysis. Sci. Total Environ. 2020, 698, 134141. [Google Scholar] [CrossRef]
- Zhao, X.F.; Lei, M.; Wei, C.H.; Guo, X.X. Assessing the suitable regions and the key factors for three Cd-accumulating plants (Sedum alfredii, Phytolacca americana, and Hylotelephium spectabile) in China using MaxEnt model. Sci. Total Environ. 2022, 852, 158202. [Google Scholar] [CrossRef]
- Dong, F.; Song, J.R.; Fu, C.M.; Huang, X.Y.; Yang, X.R.; Lu, F.L.; Li, D.P. Spatial variability and climate response characteristics of the chemical components in Siraitia grosvenorii (Luo Han Guo). Ind. Crops Prod. 2025, 228, 120897. [Google Scholar] [CrossRef]
- Abolmaali, S.M.R.; Tarkesh, M.; Bashari, H. MaxEnt modeling for predicting suitable habitats and identifying the effects of climate change on a threatened species, Daphne mucronata, in central Iran. Ecol. Inform. 2018, 43, 116–123. [Google Scholar] [CrossRef]
- Qiu, H.H.; Han, H.R.; Cheng, X.Q.; Kang, F.F. Understanding sustainability of woody species suitability zones on the Loess Plateau for optimal creation zone selection in response to future climate change. J. Environ. Manag. 2025, 375, 124239. [Google Scholar] [CrossRef] [PubMed]
- Zhao, Y.; Deng, X.W.; Xiang, W.H.; Chen, L.; Ouyang, S. Predicting potential suitable habitats of Chinese fir under current and future climatic scenarios based on Maxent model. Ecol. Inform. 2021, 64, 101393. [Google Scholar] [CrossRef]
- Cao, B.; Bai, C.K.; Wu, K.Y.; Xue, Y.; Yang, J.J.; Gao, P.F.; Liang, H.; Li, G.S. Concentrated conservation and utilization: Four medicinal crops for diabetes treatment showed similar habitat distribution patterns in China. Ind. Crops Prod. 2020, 152, 112478. [Google Scholar] [CrossRef]
- Li, Y.X.; Shao, W.H.; Jiang, J.M. Predicting the potential global distribution of Sapindus mukorossi under climate change based on MaxEnt modelling. Environ. Sci. Pollut. Res. Int. 2022, 29, 21751–21768. [Google Scholar] [CrossRef] [PubMed]
- He, Y.L.; Ma, J.M.; Chen, G.S. Potential geographical distribution and its multi-factor analysis of Pinus massoniana in China based on the maxent model. Ecol. Indic. 2023, 154, 110790. [Google Scholar] [CrossRef]
- Zhang, Q.; Shen, X.B.; Jiang, X.L.; Fan, T.T.; Liang, X.C.; Yan, W.D. MaxEnt modeling for predicting suitable habitat for endangered tree Keteleeria davidiana (Pinaceae) in China. Forests 2023, 14, 394. [Google Scholar] [CrossRef]
- Xi, S.Y.; Guo, X.D.; Ma, X.H.; Jin, L. Impacts of climate change on the suitable habitat of Angelica sinensis and analysis of its drivers in China. Sci. Rep. 2025, 15, 3508. [Google Scholar] [CrossRef]
- Zhu, Q.Y.; Wang, F.M.; Yi, Q.X.; Zhang, X.Y.; Chen, S.T.; Zheng, J.Y.; Li, J.L.; Xu, T.Y.; Peng, D.L. Modeling soybean cultivation suitability in China and its future trends in climate change scenarios. J. Environ. Manag. 2023, 345, 118934. [Google Scholar] [CrossRef]
- Tesfay, G.; Zhao, Y.; Zhao, M.; Li, K.; Demelash, T.; Xu, Y. Assessing the Impacts of Climate Change on Geographical Distribution of Tea (Camellia sinensis L.) in Kenya with Maximum Entropy Model. Agronomy 2024, 14, 2080. [Google Scholar] [CrossRef]
- Guga, S.; Xu, J.; Riao, D.; Li, K.; Han, A.; Zhang, J. Combining MaxEnt model and landscape pattern theory for analyzing interdecadal variation of sugarcane climate suitability in Guangxi, China. Ecol. Indic. 2021, 131, 108152. [Google Scholar] [CrossRef]
- Chen, N.; Cao, W.C.; Yuan, Y.Y.; Wang, Y.H.; Zhang, X.J.; Chen, Y.J.; Yiasmin, M.N.; Tristanto, N.A.; Hua, X. Recent advancements in mogrosides: A review on biological activities, synthetic biology, and applications in the food industry. Food Chem. 2024, 449, 139277. [Google Scholar] [CrossRef] [PubMed]
- Huang, Z.; Xie, L.; Wang, H.; Zhong, J.; Li, Y.; Liu, J.; Ou, Z.; Liang, X.; Li, Y.; Huang, H.; et al. Geographic distribution and impacts of climate change on the suitable habitats of Zingiber species in China. Ind. Crops Prod. 2019, 138, 111429. [Google Scholar] [CrossRef]
- Shivani; Thakur, B.K.; Mallikarjun, C.P.; Mahajan, M.; Kapoor, P.; Malhotra, J.; Dhiman, R.; Kumar, D.; Kumar Pal, P.; Kumar, S. Introduction, adaptation and characterization of monk fruit (Siraitia grosvenorii): A non-caloric new natural sweetener. Sci. Rep. 2021, 11, 6250. [Google Scholar] [CrossRef]
- Zheng, T.; Sun, J.; Shi, X.; Liu, D.; Sun, B.; Deng, Y.; Zhang, D.; Liu, S. Evaluation of climate factors affecting the quality of red huajiao (Zanthoxylum bungeanum maxim.) Based on UPLC-MS/MS and MaxEnt model. Food Chem. X 2022, 16, 100522. [Google Scholar] [CrossRef]
- Rajkumar, M.; Prasad, M.N.V.; Swaminathan, S.; Freitas, H. Climate change driven plant–metal–microbe interactions. Environ. Int. 2013, 53, 74–86. [Google Scholar] [CrossRef]
- Cooper, R.B.; Blaser, R.E.; Brow, R.H. Potassium Nutrition effects on net photosynthesis and morphology of alfalfa. Soil Sci. Soc. Am. J. 1967, 31, 231–235. [Google Scholar] [CrossRef]
- Liu, Y.Q.; Yu, W.Q.; Bi, M.F.; Zhang, Y.T.; Guan, Y.; Jiang, T.M. Comprehensive nutrient profiling and untargeted metabolomic assessment of Siraitia grosvenorii from different regions and varying degrees of processing. Appl. Sci. 2025, 15, 1020. [Google Scholar] [CrossRef]
- Richardson, J.B.; Chase, J.K. Transfer of macronutrients, micronutrients, and toxic elements from soil to grapes to white wines in uncontaminated vineyards. Int. J. Environ. Res. Public Health 2021, 18, 13271. [Google Scholar] [CrossRef]
- Lai, B.W. Genetic Structure and Demographic History of Siraitia grosvenorii Based on Whole-Genome Resequencing. Master’s Thesis, Guangxi Normal University, Guilin, China, 2023. [Google Scholar]
- Prevéy, J.S.; Parker, L.E.; Harrington, C.A.; Lamb, C.T.; Proctor, M.F. Climate change shifts in habitat suitability and phenology of huckleberry (Vaccinium membranaceum). Agric. For. Meteorol. 2020, 280, 107803. [Google Scholar] [CrossRef]
- Varotsos, C.A.; Cracknell, A.P. Remote sensing letters contribution to the success of the sustainable development goals-UN 2030 agenda. Remote Sens. Lett. 2020, 11, 715–719. [Google Scholar] [CrossRef]
| Variables | Percent Contribution % | Permutation Importance (%) |
|---|---|---|
| bio_14 | 75.3 | 4.5 |
| bio_15 | 5.1 | 6.3 |
| bio_4 | 4.5 | 0.8 |
| bio_3 | 3.0 | 6.1 |
| bio_7 | 2.5 | 8.8 |
| bio_18 | 2.4 | 0.5 |
| bio_9 | 2.3 | 18 |
| bio_12 | 2.0 | 7.9 |
| bio_2 | 1.7 | 23.5 |
| bio_17 | 1.3 | 23.6 |
| Climate Scenario | SSP126 | SSP370 | SSP585 | |||
|---|---|---|---|---|---|---|
| Area (×104 km2) | Percent (%) | Area (×104 km2) | Percent (%) | Area (×104 km2) | Percent (%) | |
| 2050s | 51.93 | −11.52% | 59.79 | 1.88% | 53.71 | −8.49% |
| 2070s | 57.99 | −1.19% | 40.97 | −30.20% | 55.14 | −6.05% |
| Item | Area (×104 km2) | Area Proportion/% | |||||||
|---|---|---|---|---|---|---|---|---|---|
| Unchanged | Contraction | Expansion | Total | Unchanged | Contraction | Expansion | Total | ||
| SSP126 | 2050s | 45.71 | 13.16 | 6.95 | −6.21 | 88.03% | 25.34% | 13.38% | −11.96% |
| 2070s | 51.28 | 7.59 | 9.37 | 1.77 | 88.42% | 13.09% | 16.15% | 3.06% | |
| SSP370 | 2050s | 45.49 | 13.39 | 15.08 | 1.69 | 76.07% | 22.39% | 25.22% | 2.83% |
| 2070s | 36.25 | 22.63 | 4.89 | −17.74 | 88.47% | 55.23% | 11.93% | −43.31% | |
| SSP585 | 2050s | 45.82 | 13.05 | 9.24 | −3.81 | 85.32% | 24.31% | 17.20% | −7.10% |
| 2070s | 42.60 | 16.28 | 12.25 | −4.03 | 77.25% | 29.52% | 22.21% | −7.31% | |
| Elements | High-Suitable Habitats (n = 25) | Moderate Suitable Habitats (n = 21) | Low Suitable Habitats (n = 13) | Average |
|---|---|---|---|---|
| K | 17,978.21 ± 6075.25 b | 12,487.16 ± 733.93 c | 20,389.41 ± 2372.64 a | 16,555.05 ± 5175.21 |
| Ca | 424.04 ± 97.50 a | 367.44 ± 136.6 a | 418.58 ± 144.36 a | 421.58 ± 127.65 |
| Mg | 708.48 ± 126.35 ab | 785.04 ± 113.79 a | 662.67 ± 49.38 b | 718.73 ± 117.76 |
| Cu | 11.39 ± 3.55 a | 8.76 ± 2.55 b | 12.48 ± 2.42 a | 10.87 ± 3.31 |
| Fe | 35.70 ± 20.05 a | 26.6 ± 5.66 a | 37.89 ± 16.07 a | 33.40 ± 15.94 |
| Mn | 15.58 ± 5.10 a | 13.48 ± 4.62 a | 13.75 ± 4.14 a | 14.27 ± 4.89 |
| Se | 1.47 ± 0.50 a | 1.05 ± 0.39 bc | 0.78 ± 0.19 c | 1.10 ± 0.49 |
| Zn | 16.17 ± 9.07 a | 13.25 ± 4.58 a | 14.42 ± 8.72 a | 14.61 ± 7.45 |
| B | 22.93± 15.42 a | 8.26 ± 5.81 b | 20.15 ± 10.54 a | 17.11 ± 13.14 |
| Al | 16.41 ± 8.97 a | 8.79 ± 7.63 b | 18.94 ± 9.07 a | 14.71 ± 9.38 |
| Ba | 2.94 ± 1.80 b | 2.03 ± 1.31 b | 5.14 ± 4.30 a | 3.37 ± 2.67 |
| Sr | 3.12 ± 1.82 b | 2.68 ± 1.26 b | 4.68 ± 1.17 a | 3.49 ± 1.67 |
| Ti | 5.16 ± 1.02 b | 4.13 ± 1.44 b | 8.08 ± 3.24 a | 5.79 ± 2.35 |
| Cd | 0.02 ± 0.02 a | 0.02 ± 0.02 a | 0.02 ± 0.02 a | 0.02 ± 0.02 |
| Ni | 1.56 ± 0.95 a | 0.84 ± 0.62 b | 1.80 ± 0.67 a | 1.40 ± 0.87 |
| Tl | 0.005 ± 0.04 b | 0.01 ± 0.01 b | 0.02 ± 0.01 a | 0.01 ± 0.01 |
| Co | 0.16 ± 0.10 ab | 0.05 ± 0.03 c | 0.22 ± 0.11 a | 0.14 ± 0.10 |
| As | 0.05 ± 0.04 a | 0.05 ± 0.03 a | 0.02 ± 0.02 ab | 0.04 ± 0.03 |
| Li | 0.08 ± 0.09 ab | 0.08 ± 0.07 ab | 0.10 ± 0.15 ab | 0.09 ± 0.09 |
| Be | 0.001 ± 0.001 b | 0.001 ± 0.001 b | 0.006 ± 0.001 a | 0.003 ± 0.002 |
| Cr | 0.69 ± 0.51 ab | 0.97 ± 0.37 a | 0.15 ± 0.07 c | 0.60 ± 0.49 |
| Ga | 0.007 ± 0.003 b | 0.007 ± 0.002 b | 0.01 ± 0.003 a | 0.008 ± 0.004 |
| Sn | 0.11 ± 0.79 a | 0.09 ± 0.03 ab | 0.06 ± 0.04 b | 0.09 ± 0.06 |
| Sb | 0.70 ± 0.64 a | 0.26 ± 0.22 b | 0.08 ± 0.04 b | 0.35 ± 0.30 |
| Pb | 1.11 ± 0.10 ab | 0.54 ± 0.22 b | 1.49 ± 1.24 a | 1.05 ± 0.93 |
| Bi | 0.02 ± 0.02 b | 0.04 ± 0.01 a | 0.02 ± 0.01 b | 0.03 ± 0.01 |
Disclaimer/Publisher’s Note: The statements, opinions and data contained in all publications are solely those of the individual author(s) and contributor(s) and not of MDPI and/or the editor(s). MDPI and/or the editor(s) disclaim responsibility for any injury to people or property resulting from any ideas, methods, instructions or products referred to in the content. |
© 2025 by the authors. Licensee MDPI, Basel, Switzerland. This article is an open access article distributed under the terms and conditions of the Creative Commons Attribution (CC BY) license (https://creativecommons.org/licenses/by/4.0/).
Share and Cite
Dong, F.; Yan, X.; Song, J.; Huang, X.; Fu, C.; Lu, F.; Li, D. Evaluation of Suitable Cultivation Regions in China for Siraitia grosvenorii Using a MaxEnt Model and Inductively Coupled Plasma Mass Spectrometry. Agronomy 2025, 15, 1474. https://doi.org/10.3390/agronomy15061474
Dong F, Yan X, Song J, Huang X, Fu C, Lu F, Li D. Evaluation of Suitable Cultivation Regions in China for Siraitia grosvenorii Using a MaxEnt Model and Inductively Coupled Plasma Mass Spectrometry. Agronomy. 2025; 15(6):1474. https://doi.org/10.3390/agronomy15061474
Chicago/Turabian StyleDong, Fei, Xiaojie Yan, Jingru Song, Xiyang Huang, Chuanming Fu, Fenglai Lu, and Dianpeng Li. 2025. "Evaluation of Suitable Cultivation Regions in China for Siraitia grosvenorii Using a MaxEnt Model and Inductively Coupled Plasma Mass Spectrometry" Agronomy 15, no. 6: 1474. https://doi.org/10.3390/agronomy15061474
APA StyleDong, F., Yan, X., Song, J., Huang, X., Fu, C., Lu, F., & Li, D. (2025). Evaluation of Suitable Cultivation Regions in China for Siraitia grosvenorii Using a MaxEnt Model and Inductively Coupled Plasma Mass Spectrometry. Agronomy, 15(6), 1474. https://doi.org/10.3390/agronomy15061474