Article

Design and Evaluation of an Innovative Thermoelectric-Based Dehumidifier for Greenhouses

1
School of Agricultural Engineering, Jiangsu University, Zhenjiang 212013, China
2
Research Center of Intelligent Equipment, Beijing Academy of Agriculture and Forestry Sciences, Beijing 100097, China
3
Institute of Agricultural Economy and Information Technology, Ningxia Academy of Agriculture and Forestry Sciences, Yinchuan 750002, China
*
Authors to whom correspondence should be addressed.
Agronomy 2025, 15(5), 1194; https://doi.org/10.3390/agronomy15051194
Submission received: 20 March 2025 / Revised: 29 April 2025 / Accepted: 8 May 2025 / Published: 15 May 2025

Abstract

:
Crops in greenhouses located in cold climates are frequently affected by high relative humidity (RH). This study presents the design, testing, and analysis of a dehumidifier based on thermoelectric cooling. Thermoelectric dehumidifiers (TEDs) are capable of dehumidifying greenhouses in cold regions while recovering heat for indoor air heating. The design of a TED is based on the specific characteristics of thermoelectric coolers (TECs). A TED consists of a cabinet, four heat exchangers, a duct fan, a water pump, and auxiliary components. The TED performance was evaluated in a Chinese solar greenhouse (CSG) with a volume of approximately 160 m3. The input voltage of the TECs, fan airflow rate, and cold-side fin area affected the TED performance, with their influence varying in magnitude. The radar chart results show that the optimal operating parameters are as follows: a fan airflow rate of 300 m3/h, a TEC input voltage of 15 V, and a cold-side fin area of 0.15 m2. With the TED running for 120 min under the optimal parameters, the RH in the CSG decreased by 25.5%, while the air temperature increased by 3.4 °C. The installation of the TED at the bottom of the CSG improved the growing environment of the crops, particularly in the vertical range between 0.2 m and 1.5 m height inside the greenhouse. These findings provide a valuable reference for applying thermoelectric cooling technology in the greenhouse field.

1. Introduction

Enclosed or semi-enclosed greenhouse designs often lead to elevated RH, particularly in cold climates [1]. High RH reduces the transpiration rate of plants, which, in turn, affects their ability to absorb and transport inorganic elements [2,3]. Furthermore, high RH promotes proliferation, dispersion, germination, and invasion of fungal spores, thereby facilitating the spread of plant diseases and increasing the risk of infection [4,5,6]. Elevated water vapor concentrations can also attenuate solar radiation transmission, consequently reducing photosynthetic efficiency. Therefore, maintaining optimal RH is critical for minimizing the incidence of pests and diseases and ensuring high crop yields.
The dehumidification methods used in greenhouses during winter include ventilation, heating, desiccant-based dehumidification, and heat pump dehumidification [7]. Among these, ventilation is the most commonly used method for regulating indoor RH. Ventilation introduces comparatively dry outdoor air into greenhouses, thereby reducing indoor humidity. In cold climates, ventilation results in the loss of significant amounts of sensible heat to the outside, leading to a considerable drop in indoor air temperature [8]. Increasing the temperature of indoor air can enhance the retention of moisture, thereby lowering RH. Heating can mitigate the risk of frost damage to plants [9]. However, this method does not alter the absolute humidity of air. Desiccant dehumidification technologies, which rely on hygroscopic materials, are particularly effective in cold climates [10]. However, desiccant materials require periodic replacement or regeneration, which increases operational complexity and maintenance expenses. Heat pump dehumidifiers cool humid air below its dew point, causing water vapor to condense into liquid. The use of heat pump dehumidifiers in greenhouses reduces the overall water vapor content of air [11,12,13]. Heat pump dehumidifiers are efficient, energy-saving, and environmentally friendly, but they require a high initial capital investment and have ongoing maintenance costs [14]. Therefore, there are limitations to existing dehumidification technologies when dealing with the low-temperature and high-humidity environments.
TECs are characterized by cooling on one side and heating on the other. Compared to heat pumps, TECs offer advantages such as lower initial investment costs, compact design, and stable operation [15]. Most of the currently used TECs are assembled with P-type and N-type thermoelectric materials, metal electrodes, and ceramic substrates [16]. Typical thermoelectric materials employed in TECs are often based on bismuth telluride [17]. When electric currents flow through N-type and P-type semiconductors, the cold side absorbs heat, whereas the hot side releases it [18]. Owing to these characteristics, some researchers have attempted to use TECs for capturing water vapor in air. A typical atmospheric water generator consists of TECs, fans, heat sinks, cold side fins, a power supply, and a water collection vessel, as shown in Figure 1 [19]. The condensed water can then be recycled and reused for crop irrigation or drinking. Garcia et al. [20] employed TECs to develop a system that captured atmospheric water vapor by utilizing the resulting condensate for the irrigation of a small tree. Sanaye et al. [21] cooled the hot surfaces of the TEC with an innovative closed-loop water cooling system, thereby increasing energy efficiency. John et al. [22] explored the effect of air flow rate on the amount of condensate through the test, and determined an optimal air flow rate of 1 m/s. Casallas et al. [23] employed a TEC to collect water vapor condensation in a hydroponically cultivated green fodder setting to enhance water use efficiency in agriculture. Thermoelectric cooling offers an innovative approach to humidity regulation in greenhouses, demonstrating significant potential for cost-effective applications [24]. However, current atmospheric water generators primarily utilize the cooling function of TECs, with limited consideration given to waste heat recovery.
This study presents the design of a novel dehumidifier that uses TECs as core components. The TED efficiently recovers waste heat generated during dehumidification and utilizes it to provide heating for the greenhouse. The optimal operational parameters were determined through experimental investigation. The cold-side fin area, fan airflow rate, and TEC input voltage were identified as test variables. The dehumidification rate, heat recovery rate, and power consumption were considered the primary evaluation metrics. We evaluated the response and distribution of the indoor RH and temperature during the operation of TED in the CSG. Additionally, the economic cost of using a TED was also estimated.

2. Materials and Methods

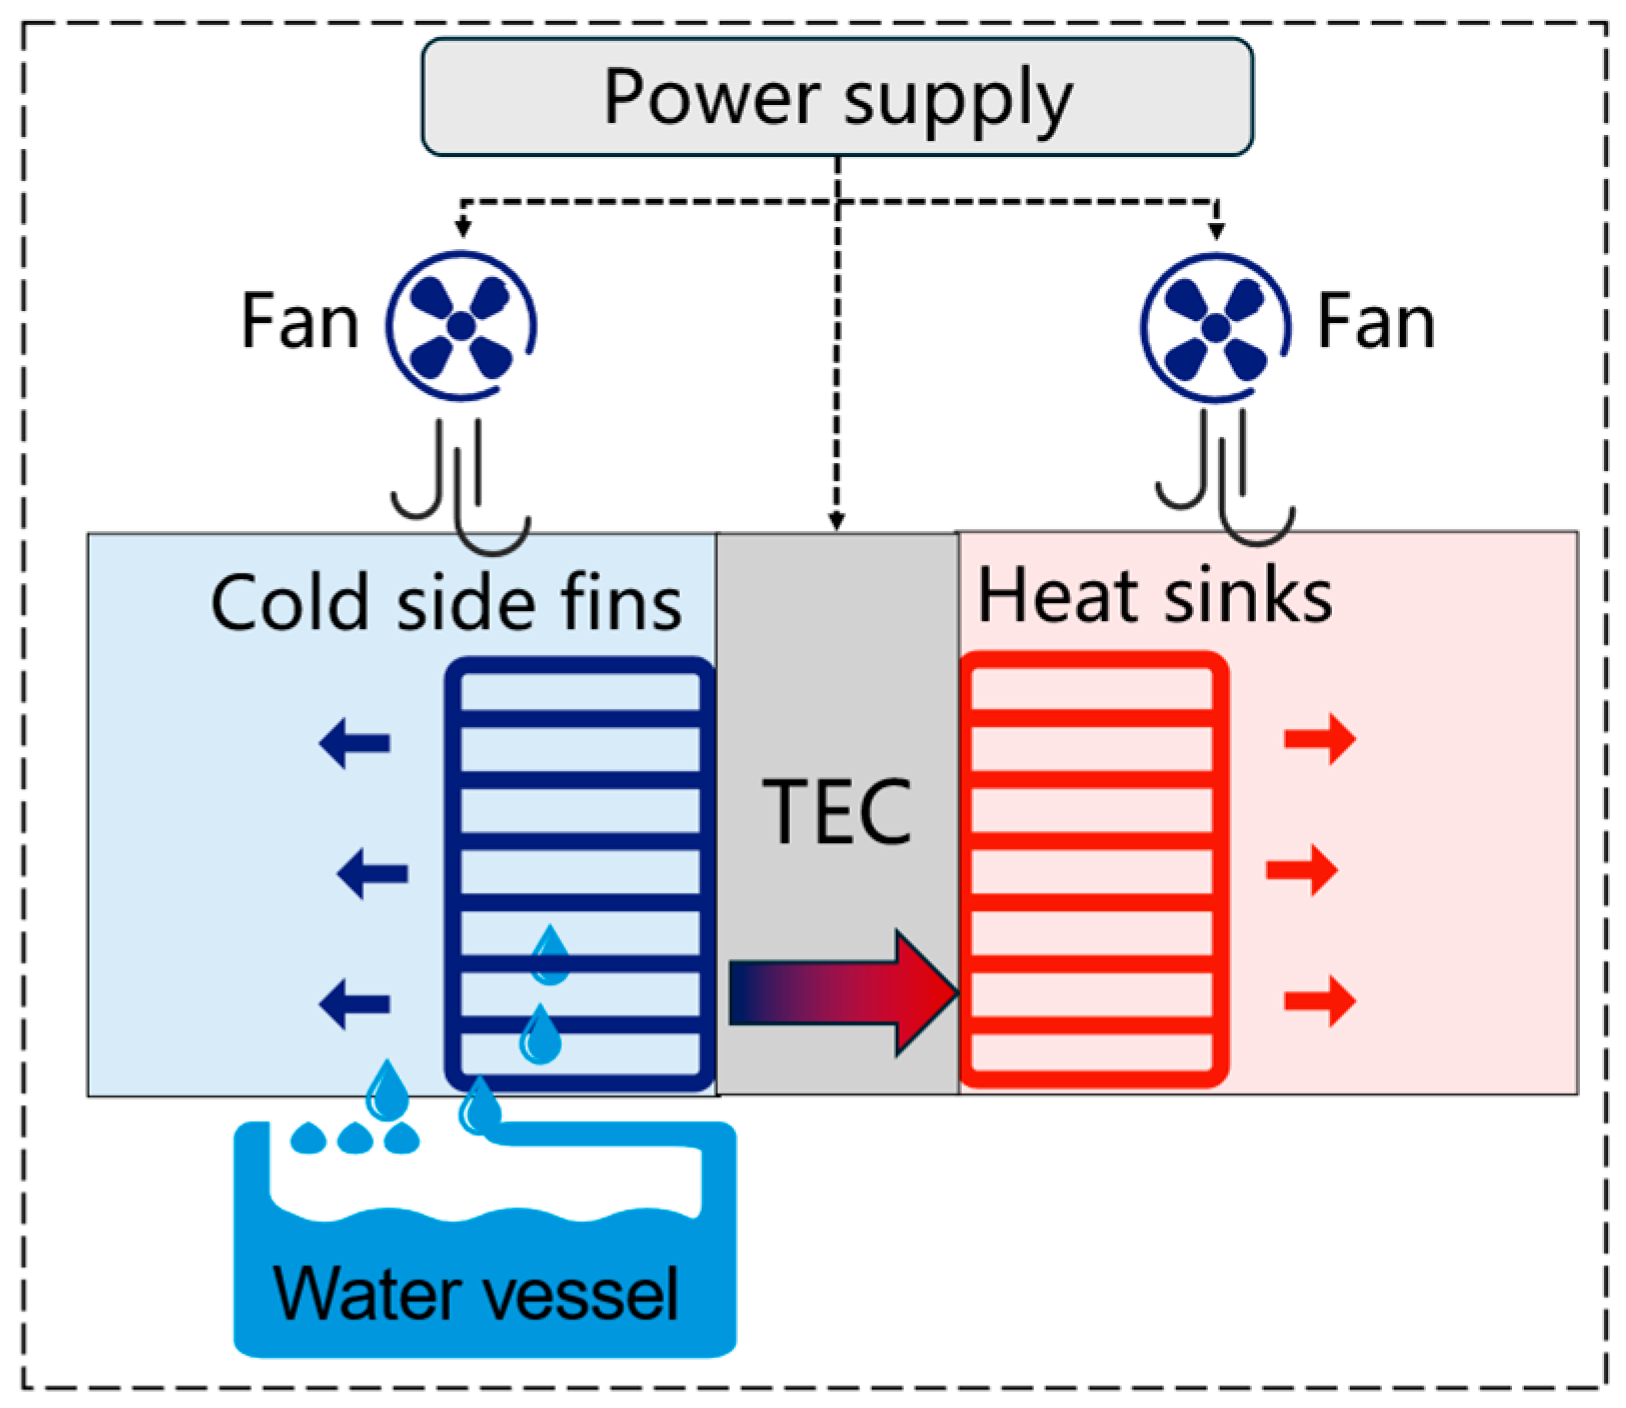
2.1. Structure and Working Principle of TED

2.1.1. Working Principle

The duct fan is a negative pressure fan that constantly renews the air in the TED. The direction of airflow is shown by the blue arrow in Figure 2. Humid air enters the unit through the air inlet. Upon entering the device, moist air is forced toward the cold-side fin of the heat exchangers. The surface temperature of the cold-side fin is maintained below the dew point of air, causing the vapor to liquefy and condense on the surface (point A in Figure 2). This process causes water vapor to condense into water droplets, thereby reducing the RH of air. Subsequently, cold and dry air flows toward the heat sink and absorbs heat (point B in Figure 2). The treated air, now dry and warm, is expelled into the greenhouse to enhance air circulation. Upon completion of the water collection process, the water pump expels the resulting liquid from the water collection tank into the irrigation system. This enhances the efficiency of irrigation water use in agriculture.

2.1.2. Heat Exchanger

A TED consists of 4 sets of heat exchangers that are linked in parallel. Each heat exchanger comprises a TEC, heat sink, cold-side fin, copper tube, fastening plate, heat transfer plate, and auxiliary components. TECs are the core functional components of the dehumidification system, and their performance directly affects the dehumidification efficiency and energy consumption level of the overall device. The proposed system employs TEC1-12706 (Shenzhen Yileng Technology Co., Shenzhen, China), with specifications presented in Table 1. The cold-side fins are fabricated from flat aluminum fins and thermally bonded to the cooling surface of the TEC via studs and thermally conductive silicone gel. Cold-side fins increase the heat transfer area and provide an ample surface for condensate adhesion. To accelerate condensation, the cold-side fins are covered with a hydrophobic material. The hot side of the TECs is connected to the heat transfer plate, which efficiently transfers heat to the copper tubes. Many heat sinks on the copper tube efficiently disperse heat, thereby enhancing the efficacy of heat transmission.

2.1.3. TED Cabinet

The heat exchanger integrates heating and cooling functions. Leveraging these features, the TED cabinet is designed with an S-shaped internal structure to optimize the drying airflow and enhance heat recovery efficiency. The dimensions of the cabinet are 0.27 m × 0.27 m × 0.55 m. The outer shell is made of a 1 mm thick stainless-steel plate to ensure robust construction. Four mounting holes are provided on the baffle, with an opening size of 85 mm × 85 mm, for securing the heat exchangers. The interior walls are insulated with 6 mm thick waterproof aerogel felt with a density of 180 kg/m3 to prevent undesired heat transfer. A water tank is placed at the bottom of each cabinet. The condensate is sent to the irrigation system via a side drain.

2.2. Experimental Setup and Process

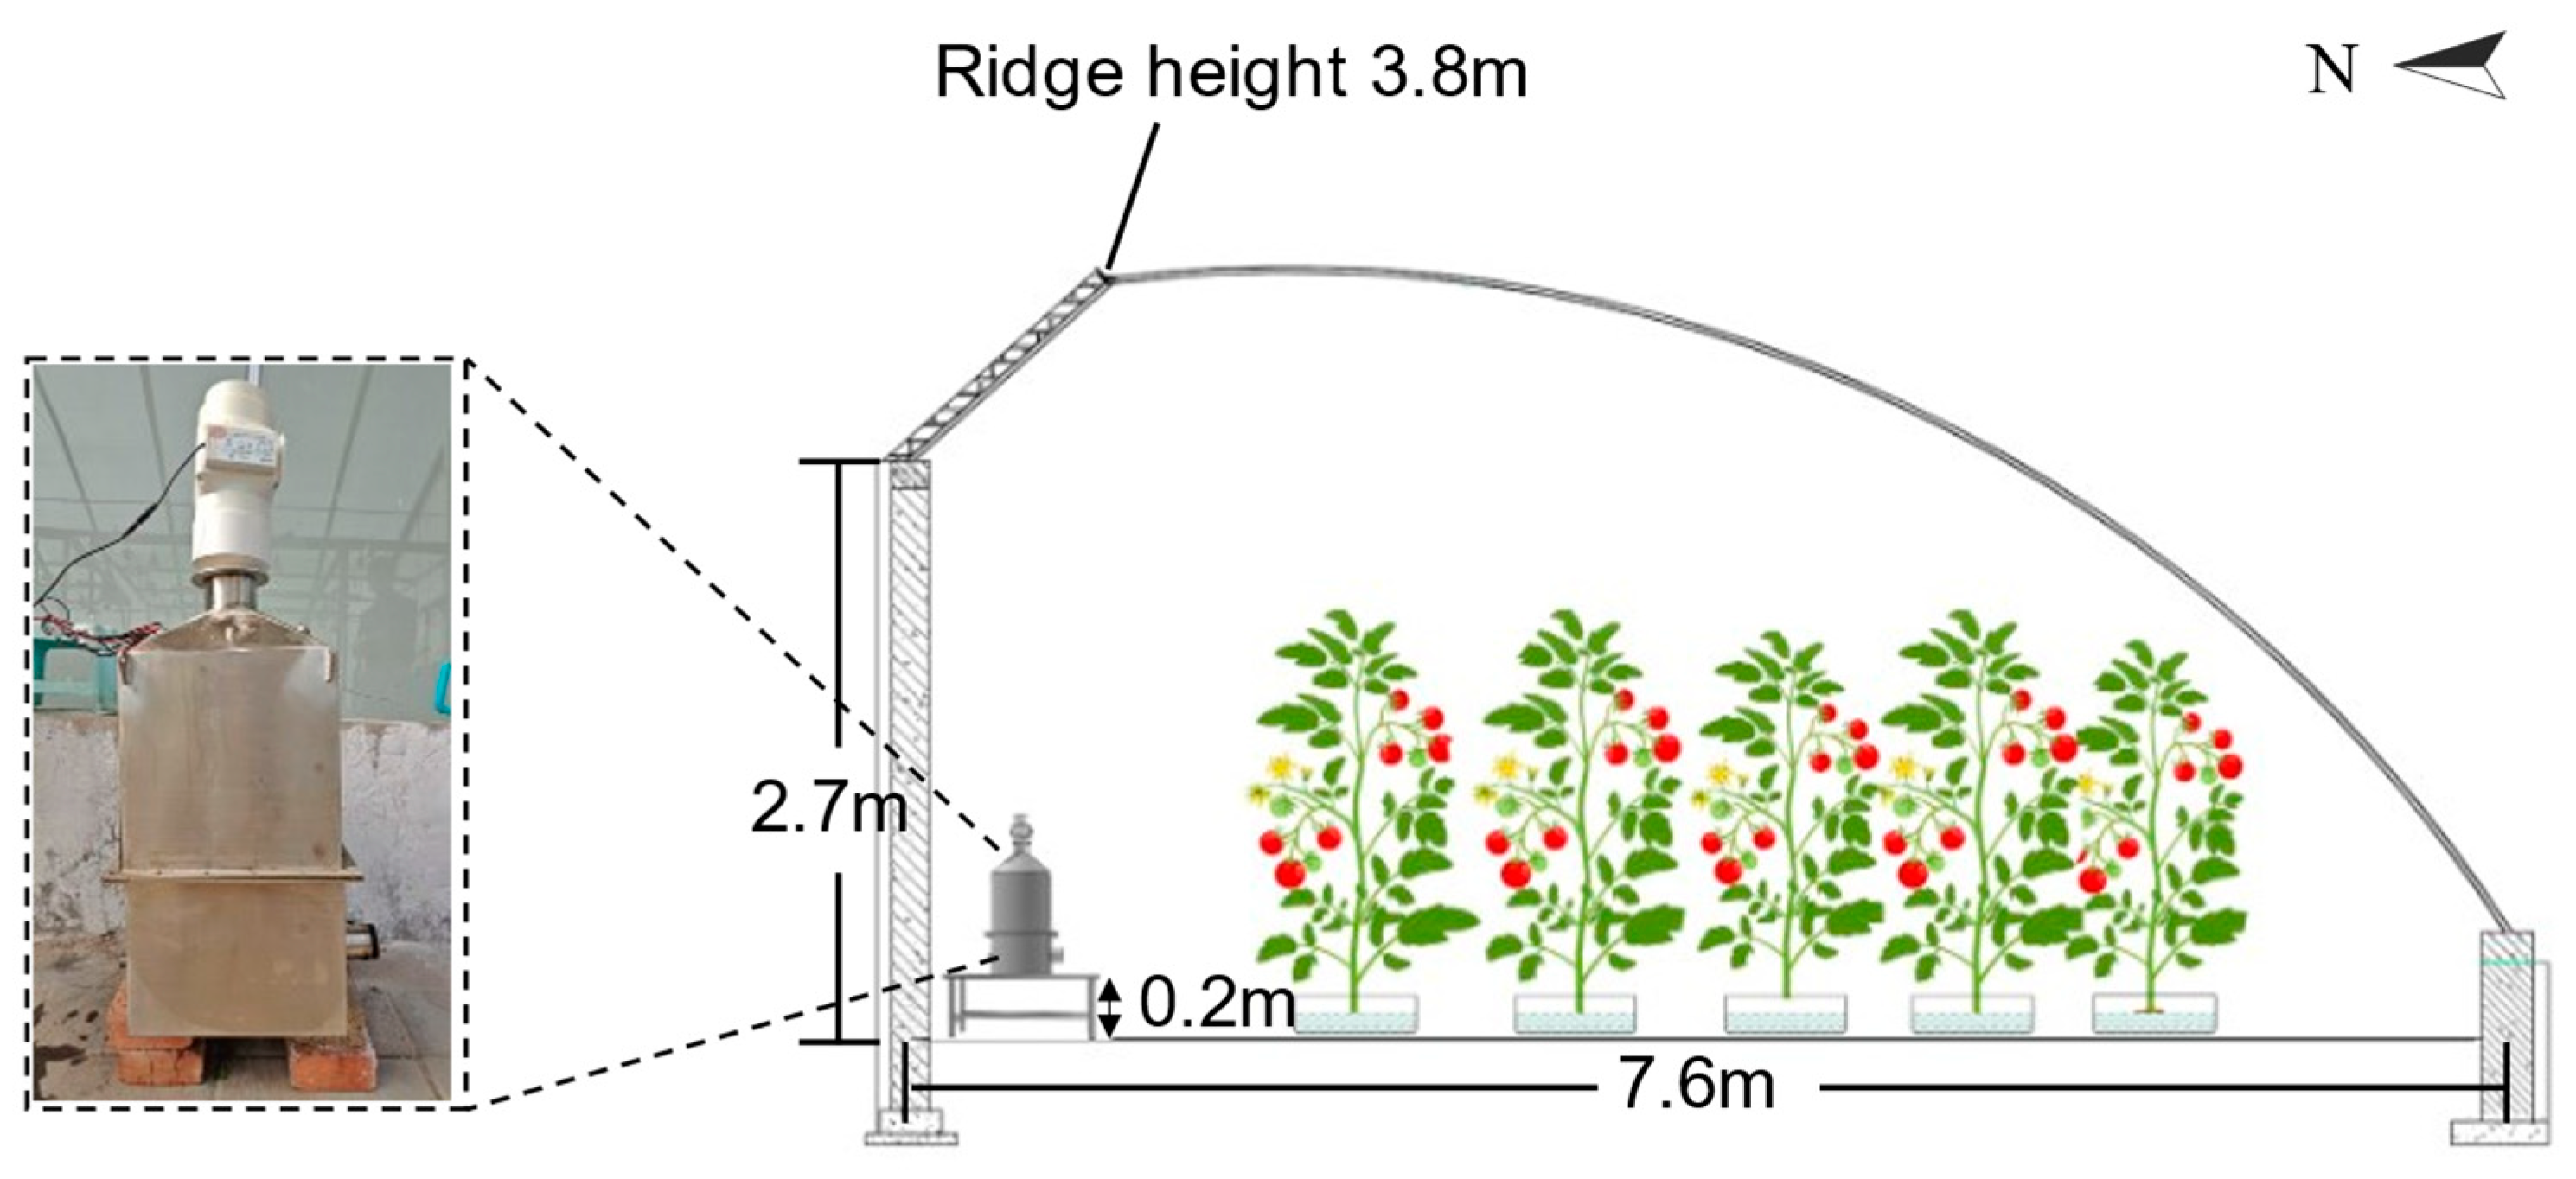
2.2.1. Greenhouse Facilities and Crop Management

These experiments were conducted in a CSG at the Beijing Academy of Agricultural and Forestry Sciences in Beijing, China (39°56′36.7″ N; 116°17′11.77″ E; altitude 60 m). The region has a typical temperate monsoon climate with low temperatures in winter. The CSG was oriented in a north–south direction, measuring 6.8 m in length and 7.6 m in width. It had a ridge height of 3.8 m and a rear wall height of 2.7 m, with an approximate total volume of 160 m3. The rear wall consisted of bricks, plastered with mortar. Polycarbonate sheets covered the south roof, which was a galvanized iron structure support. A thermal blanket insulated the south roof at night to reduce heat loss to the external environment. The TED was installed near the middle of the rear wall at a height of 0.2 m. The structure of the CSG and location of the TED are shown in Figure 3.
Throughout the experimental period, tomatoes (Lycopersicon esculentum L.; Jingcai No. 8.) were cultivated in a greenhouse. The planting density was 2.2 plants/m2. Tomato plants were planted in the cultivation tanks at a height of 0.2 m. Coir slabs were used as the cultivation substrate. Throughout the experimental period, the tomatoes were in the fruit expansion and ripening stages, and the average height of the plants was 1.6 m. The experiments were conducted between December 2023 and January 2024. In December 2023, the average maximum and minimum outdoor temperatures at the experimental site were 1 °C and −7 °C, respectively. In January 2024, the average maximum and minimum outdoor temperatures were 2 °C and −6 °C, respectively [25]. The greenhouse was not ventilated during experiments. To mitigate the temperature and RH fluctuations caused by direct sunlight, all tests were conducted at night, from 20:00 to 05:00 the following day. This time frame was selected due to the naturally higher RH during night-time. Furthermore, variations in CO2 concentration and light intensity were considered negligible during the testing period.

2.2.2. Experimental Design

Two experiments were conducted to fully assess the performance of TED. Exp. I focused on testing the effects of multiple factors on the TED performance to identify the optimal parameter combinations. Exp. II, based on these optimal parameters, examined the impact of the TED on the temperature and RH distributions within the CSG.
Exp. I TED performance evaluation and optimization
The cold-side fin area, fan airflow rate, and TECs’ input voltage were identified as the test variables. These were chosen after reviewing the literature on the influencing factors of atmospheric water generators [26,27,28]. The dehumidification rate, heat recovery rate and power consumption were considered the evaluation metrics. A total of 18 treatments were delivered, which combined two cold-side fin area levels (0.10 m2 and 0.15 m2), three fan airflow rate levels (200 m3/h, 300 m3/h and 400 m3/h), and three input voltage levels (5 V, 10 V and 15 V). Finally, the optimal operating parameter combination was determined based on the radar chart.
Exp. II TED effect on air temperature and RH in the CSG
The effects of the TED on the air temperature and RH distribution inside the CSG under the optimal operating parameters were evaluated. The TED was operated in the CSG, during which changes in the RH and air temperature throughout the different zones were continuously recorded. The test was performed thrice to verify the reliability of the results.

2.2.3. Data Acquisition and Processing

In Exp. I and Exp. II, real-time changes in the air temperature and RH within the greenhouse were monitored. In these experiments, 24 weatherproof data loggers (HOBO U23 Series Pro v2, Onset Computer Corp, Bourne, MA, USA) were employed to measure the RH and temperature. The loggers operate within the air temperature range of −40 °C to 70 °C and air RH range of 0% to 100%. The accuracies are ±0.21 °C (from 0 °C to 50 °C) and ±2.5% RH (from 10% to 90%). The loggers recorded data at 1 min intervals. The data loggers were installed at 24 locations inside the greenhouse (9 loggers at a height of 0.2 m, 9 loggers at 1.5 m, and 6 loggers at 2.8 m) to ensure comprehensive monitoring of temperature and humidity fluctuations. Figure 4 illustrates the locations of the loggers. The weight of the collected condensate was measured after each TED run. An electronic scale, with an accuracy of 0.01 g, was used to measure the volume of water collected during each experiment. The electricity consumption, with an accuracy of 0.01 kWh, was monitored using an energy meter.

2.2.4. Main Performance Evaluation Index

In Exp. I, dehumidification and recovery heat rates were used to evaluate the performance of TED. In Exp. II, the vapor pressure deficit (VPD) was calculated to assess the effect of TED on the greenhouse environment. In addition, the specific moisture extraction rate (SMER) was calculated for comparison with other atmospheric water generators.
(1)
A higher dehumidification rate indicates enhanced dehumidification effectiveness. The dehumidification rate Vd (g/h) is calculated as follows:
v d = m w , d t
where mw,d (g) is the mass of the condensed water vapor; t (h) is the time at which the TED was in operation.
(2)
Heat recovery is indirectly deduced by monitoring the volume and temperature changes of the air and calculating the amount of heat required to heat the air. Heat recovery Qheat (kJ) is calculated as follows [29]:
Q h e a t = V a i r × ρ a i r × c p , a i r × T 1000
where Vair (m3) is the volume of air; ρair (kg/m3) is the density of air, which is usually approximately 1.225 kg/m3; cp,air (J/(kg·°C)) is the specific heat capacity of air, which is usually approximately 1005 J/(kg·°C); ΔT (°C) is the change in the temperature of the air.
The heat recovery rate is the quantity of heat reclaimed per unit time and is often regarded as more advantageous when its value is higher. The heat recovery rate VQ (kJ/h) is calculated as follows:
V Q = Q h e a t t
(3)
When the VPD value is low, the transpiration of crops is weak, which affects the rate at which plants absorb inorganic elements [30]. The VPD requirements vary across crops and growth stages. However, maintaining the VPD in the growing environment above 0.5 kPa meets the growth requirements of most crops [31]. The VPD (kPa) is calculated as follows [32]:
V P D = 0.6108 × e 17.27 × T a T a + 237.3 × 1 H R
where Ta (°C) is the air temperature; HR (%) is the RH.
(4)
The SMER represents the ratio of the mass of water removed to the energy consumed during the entire drying process, which reflects the overall performance of the TED. The higher the dehumidification capacity per unit energy consumption of the TED, the greater its energy efficiency. The subsequent assumptions are established for the test: humid air is consistent and comprises two components: dry air and water vapor; the fouling coefficient remains unchanged throughout the test. The SMER (kg/kWh) is calculated using the following equation [12]:
S M E R = m w , d 1000 × W d
where Wd (kWh) is the overall power consumption of the TED.

2.2.5. Data Analysis

In Exp. I, the results of each experiment were plotted on a radar chart, with the three axes representing the three indicators. Among these, higher dehumidification and heat recovery rates indicated a better performance; therefore, positive normalization was applied, as shown in Equation (6) [33]. By contrast, a lower power consumption value was preferred; therefore, negative normalization was applied, as shown in Equation (7).
R j = r j m i n r j m a x r j m i n r j
N j = m a x n j n j m a x n j m i n n j
where Rj and Nj are the normalized values; rj and nj are the experimental results; maxrj and maxnj are the maximum experimental results; minrj and minnj are the minimum experimental results.
The higher the value of the combined evaluation function, the better the TED’s overall performance. The combined evaluation function Y of the metrics displayed in the radar chart is presented in Equation (8) [34].
Y = S j × L j
where Sj is the area of the graph in the radargram; Lj is the perimeter of the radar graph.
The data collected were statistically analyzed using Microsoft Office Excel 2021 (Microsoft Corporation, Redmond, WA, USA). Based on these data, plots were generated using Origin 2021 (OriginLab Corporation, Northampton, MA, USA) and MATLAB R2023b (MathWorks, Natick, MA, USA). Continuous data surfaces were generated from discrete data through inverse distance weighting interpolation, which enhanced the visualization of the results and facilitated subsequent data analysis and comparison.

3. Results and Discussion

3.1. TED Performance Validation and Optimization in Exp. I

The efficiency of TECs in condensing water vapor is closely related to both the air temperature and RH. When the RH decreases, the quantity of water vapor in the air decreases, resulting in a reduced dehumidification rate [34,35]. When the TED was operated for 0 min, the air temperature inside the greenhouse was between 20 °C and 25 °C, and the RH was between 85% and 95%. Pre-experiments were conducted prior to formal experiments. The results of pre-experiments showed that the TED could reduce the RH to below 70% after 120 min of operation, which satisfied the growing requirements of tomato plants [7]. Therefore, 120 min was selected as the end time for each test in the CSG.

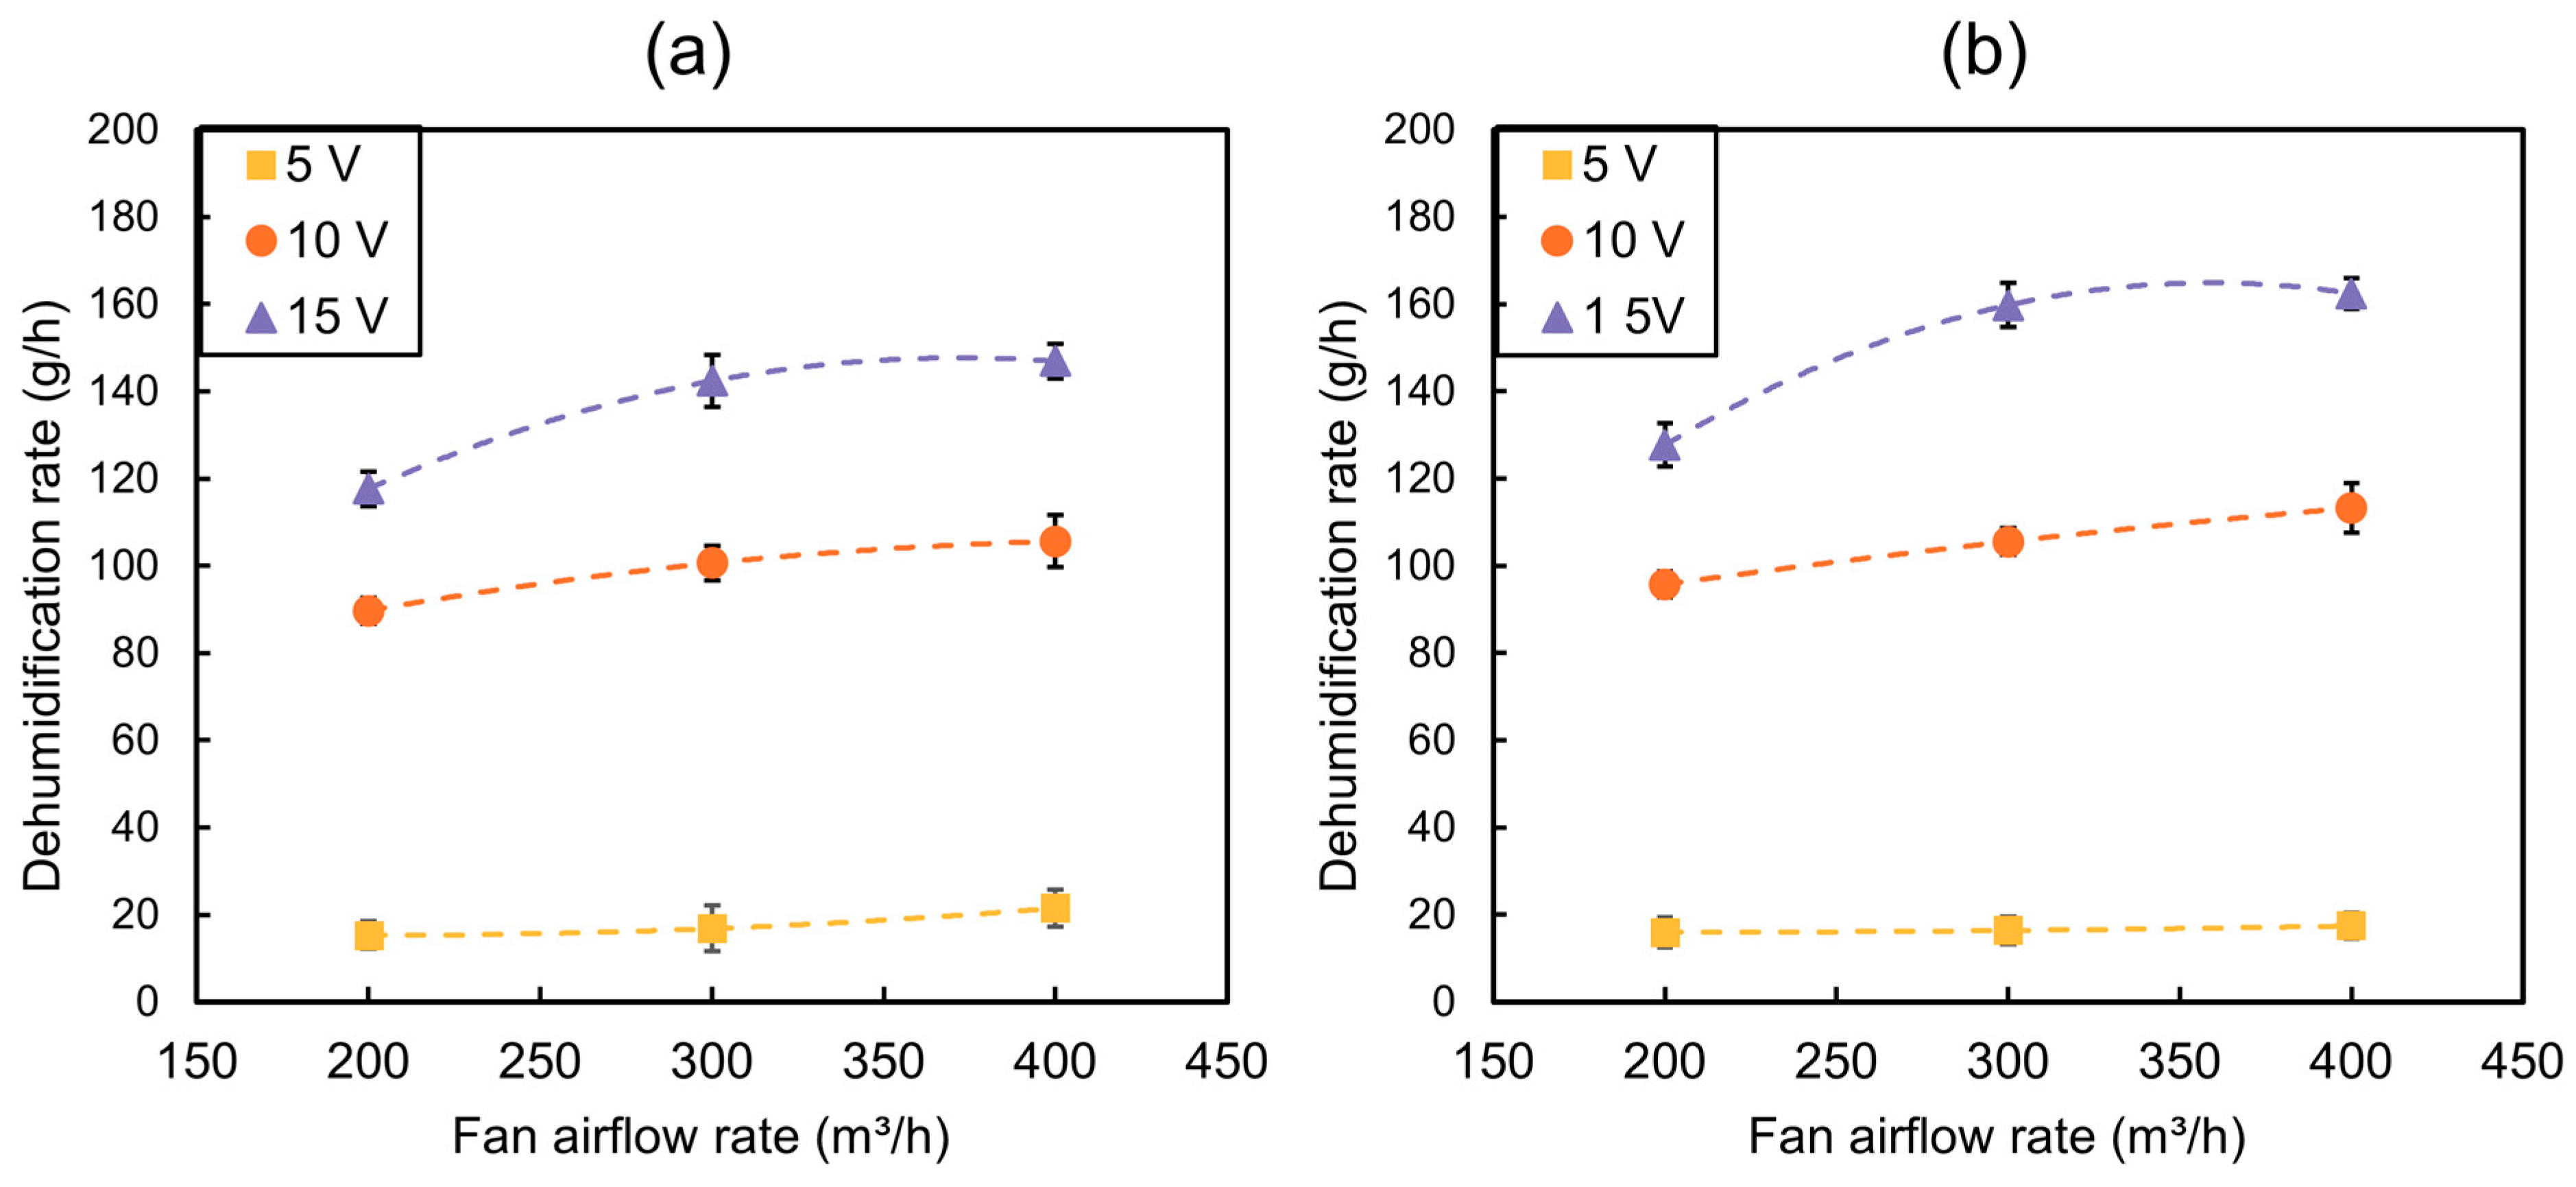
3.1.1. Analysis of Factors Affecting Dehumidification Rate

Figure 5 shows the relationship among the input voltage of the TECs, air intake velocity, and the dehumidification rate across different cold-side fin areas (0.10 m2 and 0.15 m2). As the input voltage of the TECs increased, the dehumidification rate increased considerably. This increase in the dehumidification performance could be attributed to the enhanced temperature differential within the TECs, which was a direct consequence of the elevated input voltage. A large temperature gradient resulted in an improved cooling capacity, which caused the surface temperature of the cold-side fin to decrease. This led to a more efficient condensation of water vapor and consequently enhanced the dehumidification performance. With identical input voltage, elevated fan air velocities of 400 m3/h and 300 m3/h lead to enhanced dehumidification rates. The dehumidification rate was notably low at a fan air velocity of 200 m3/h. Increasing the airflow enhanced thermal exchange efficiency between the cold-side fin and the air. However, increasing the air flow had a limit, beyond which further performance improvements were minimal. For instance, when the fan airflow velocity was increased from 300 m3/h to 400 m3/h, the dehumidification rate did not show improvement. A comparison of Figure 5a,b indicates that the dehumidification rate rose as the cold-side fin area increased from 0.10 m2 to 0.15 m2. Expanding the area of the cold-side fin enhanced the accessibility of the surface for heat exchange. This reduced the oversaturation of specific regions on the cooling surface. The condensation of water vapor occurred at an increased rate per unit time. However, for the same input voltage, the impact of increasing the heat-exchange area had an upper limit. For instance, with an input voltage of 5 V, augmenting the heat exchange area resulted in an increase of 0.64 g/h in the dehumidification rate.

3.1.2. Analysis of Factors Affecting Heat Recovery Rate

Figure 6 illustrates the relationship among the TECs’ input voltage, fan airflow rate, and heat recovery rate across varying cold-side fin areas (0.10 m2 and 0.15 m2). The difference between the recovered waste heat used for heating and the theoretical value is mainly due to heat loss. This occurs because the greenhouse is not fully insulated. In winter, the low ambient temperature further increases heat loss. With an increase in the input voltage of the TECs from 5 V to 15 V, a distinct upward trend existed in the heat recovery rate. Elevating the input voltage markedly improved the heating capacity of the TECs, thereby enhancing the overall heat recovery performance of the TED. At a constant input voltage, the heat recovery rate increased markedly as the inlet air velocity increased from 200 m3/h to 400 m3/h. An increase in the inlet air velocity improved the convective heat transfer between the heat sinks and air, thus expediting the heat release and recovery processes. The influence of inlet air velocity was more pronounced at high input voltages. Under these circumstances, the efficiency of heat conveys increasingly relied on convective heat dissipation. Moderate increases in air intake velocity could enhance the heat recovery rate. However, overall power consumption should also have been considered when selecting fan speed. A comparison of Figure 6a,b indicates that changes in the cold-side fin areas had a minimal effect on the heat recovery performance. The variation in heat recovery across different cold-side fin areas was negligible.

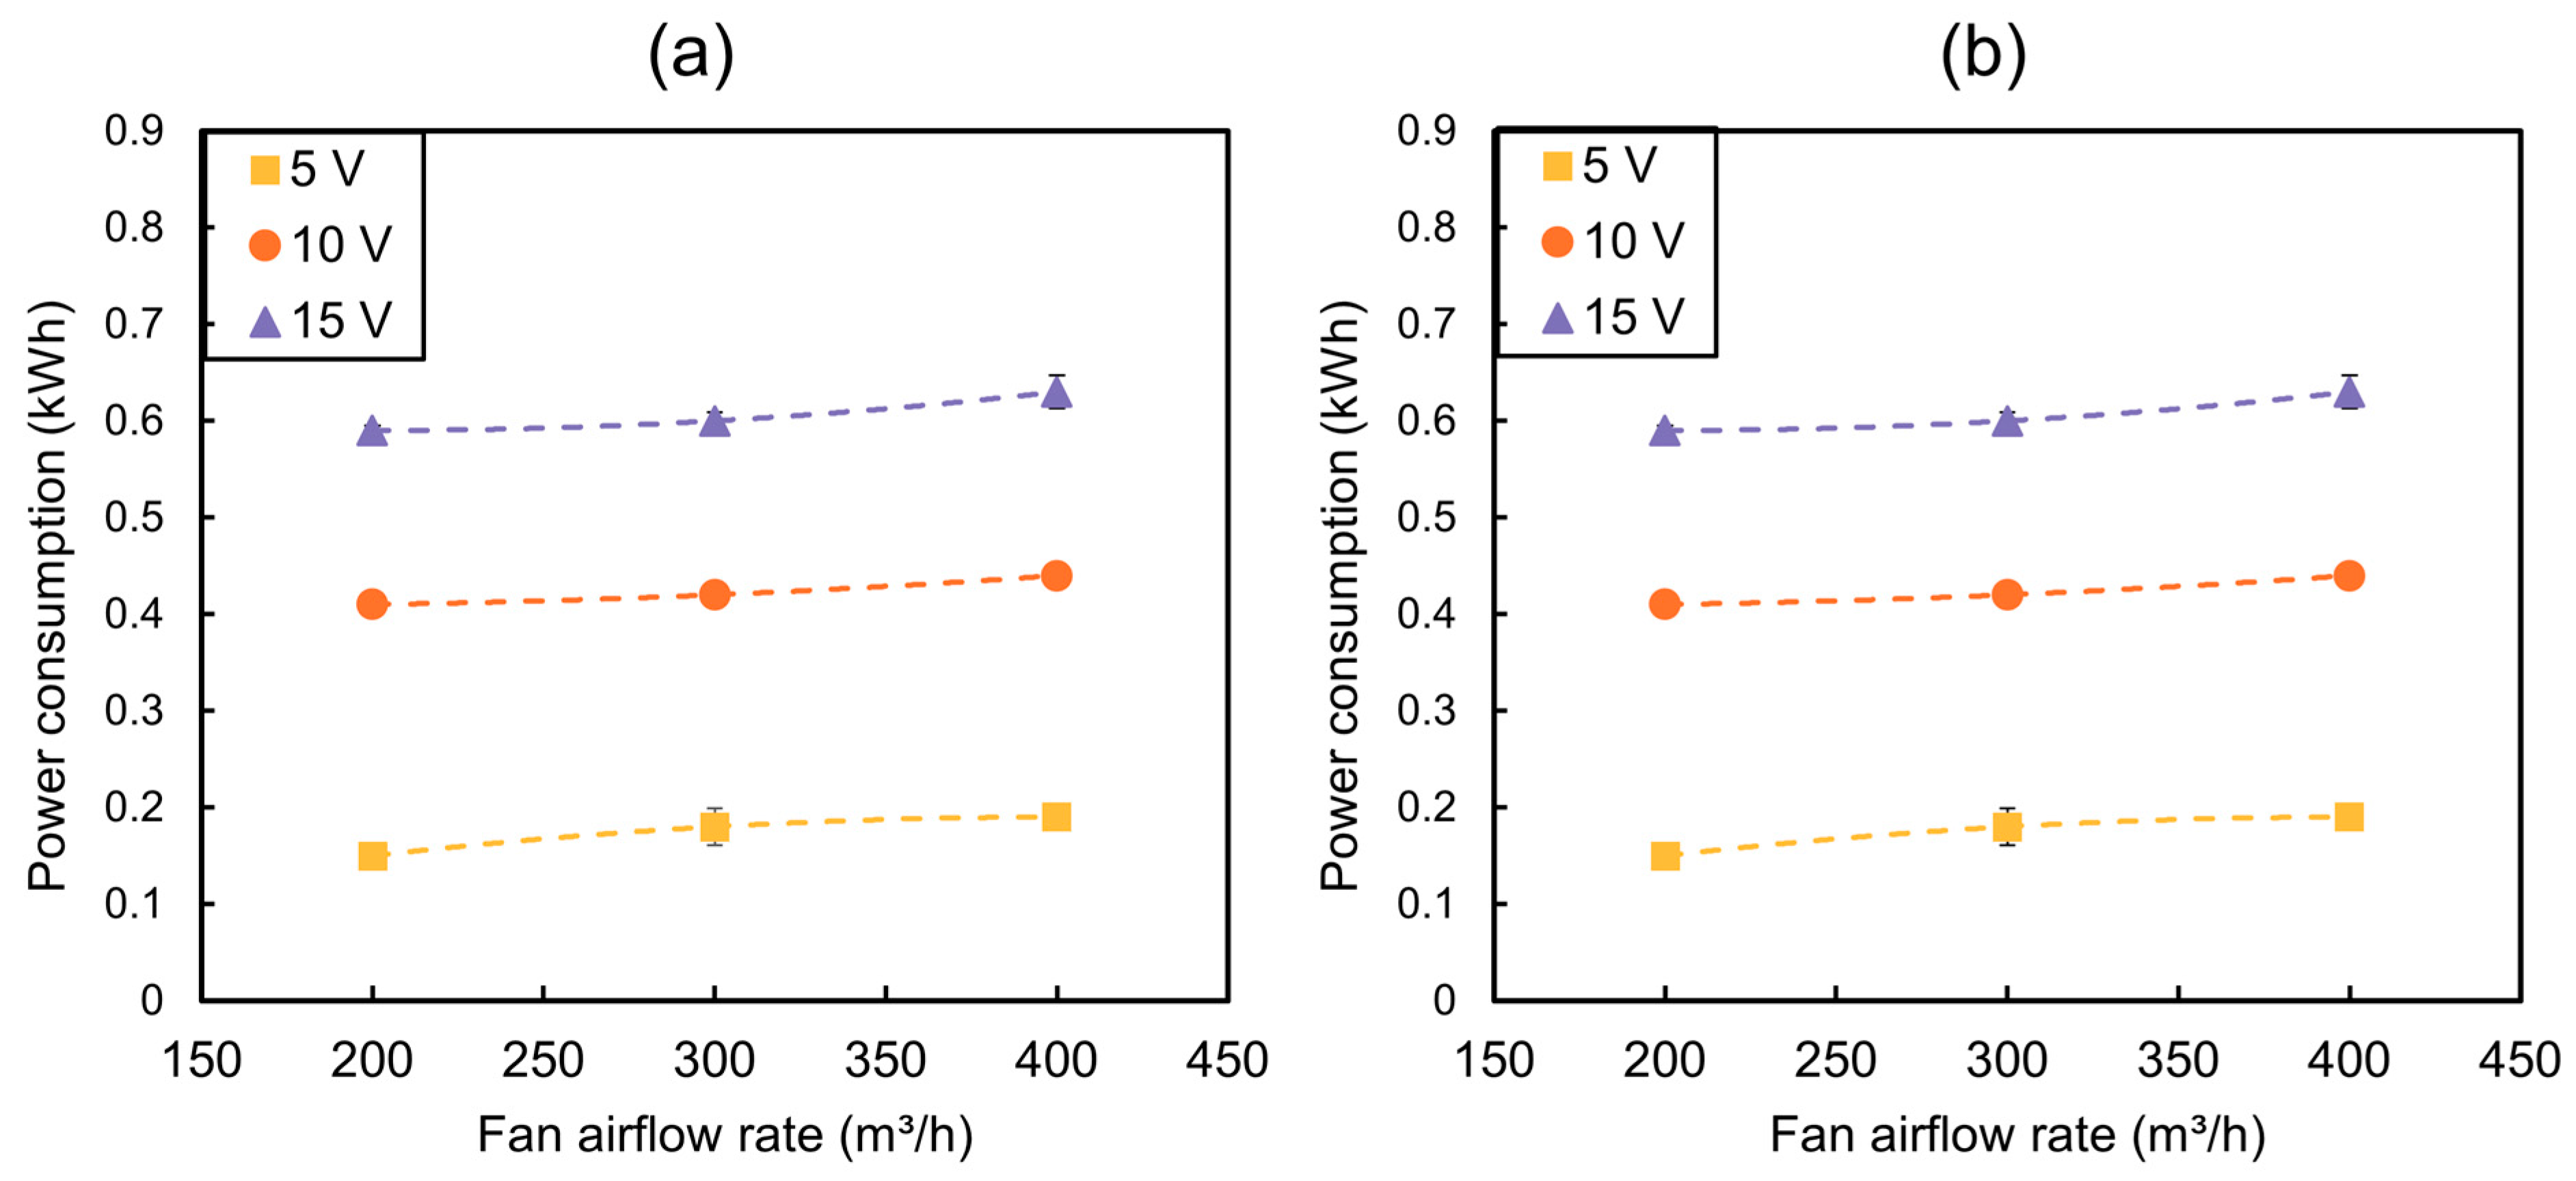
3.1.3. Analysis of Factors Affecting Power Consumption

Figure 7 illustrates the relationship among the TECs’ input voltage, fan airflow rate, and power consumption across varying cold-side fin areas (0.10 m2 and 0.15 m2). The figure shows that power consumption increased as the input voltage increased. At higher voltages, the workload of the TEC increased, requiring more power to sustain its operation. In addition, an increase in the airflow rate led to higher energy consumption. By comparing Figure 7a,b, it was evident that the area of the cold-side fins did not affect power consumption. Energy consumption was primarily attributed to the TECs, fans, and control systems. Therefore, selecting the optimal airflow rate and input voltage was essential for optimizing the energy efficiency of TECs.

3.1.4. Comprehensive Evaluation of TED Performance

The radar chart was constructed based on the mean values of each indicator without considering standard deviations. The test results were standardized before performing the radar chart analysis. The heat recovery and dehumidification rates were positively normalized using Equation (6), whereas power consumption was negatively normalized using Equation (7). A radar chart was used to comprehensively assess the effects of the different treatments on the dehumidification rate, heat recovery rate, and power consumption, as shown in Figure 8. The combined evaluation function was calculated using Equation (8). The optimal parameter combination, which yielded the highest value of the combined evaluation function, was a fan speed of 300 m3/h, a TEC input voltage of 15 V, and a cold-side fin area of 0.15 m2. Therefore, this combination was selected as the optimal combination to achieve balanced performance.

3.2. TED Effect on Temperature and RH in the CSG During Exp. II

The potential of the TED for climate control was assessed by installing it at the bottom of the CSG. Air temperature and RH data were collected from locations within the greenhouse. The operating parameters used included a fan airflow rate of 300 m3/h, an input voltage of 15 V for the TECs, and a cold-side fin area of 0.15 m2. The TED was operated for 120 min in the CSG.

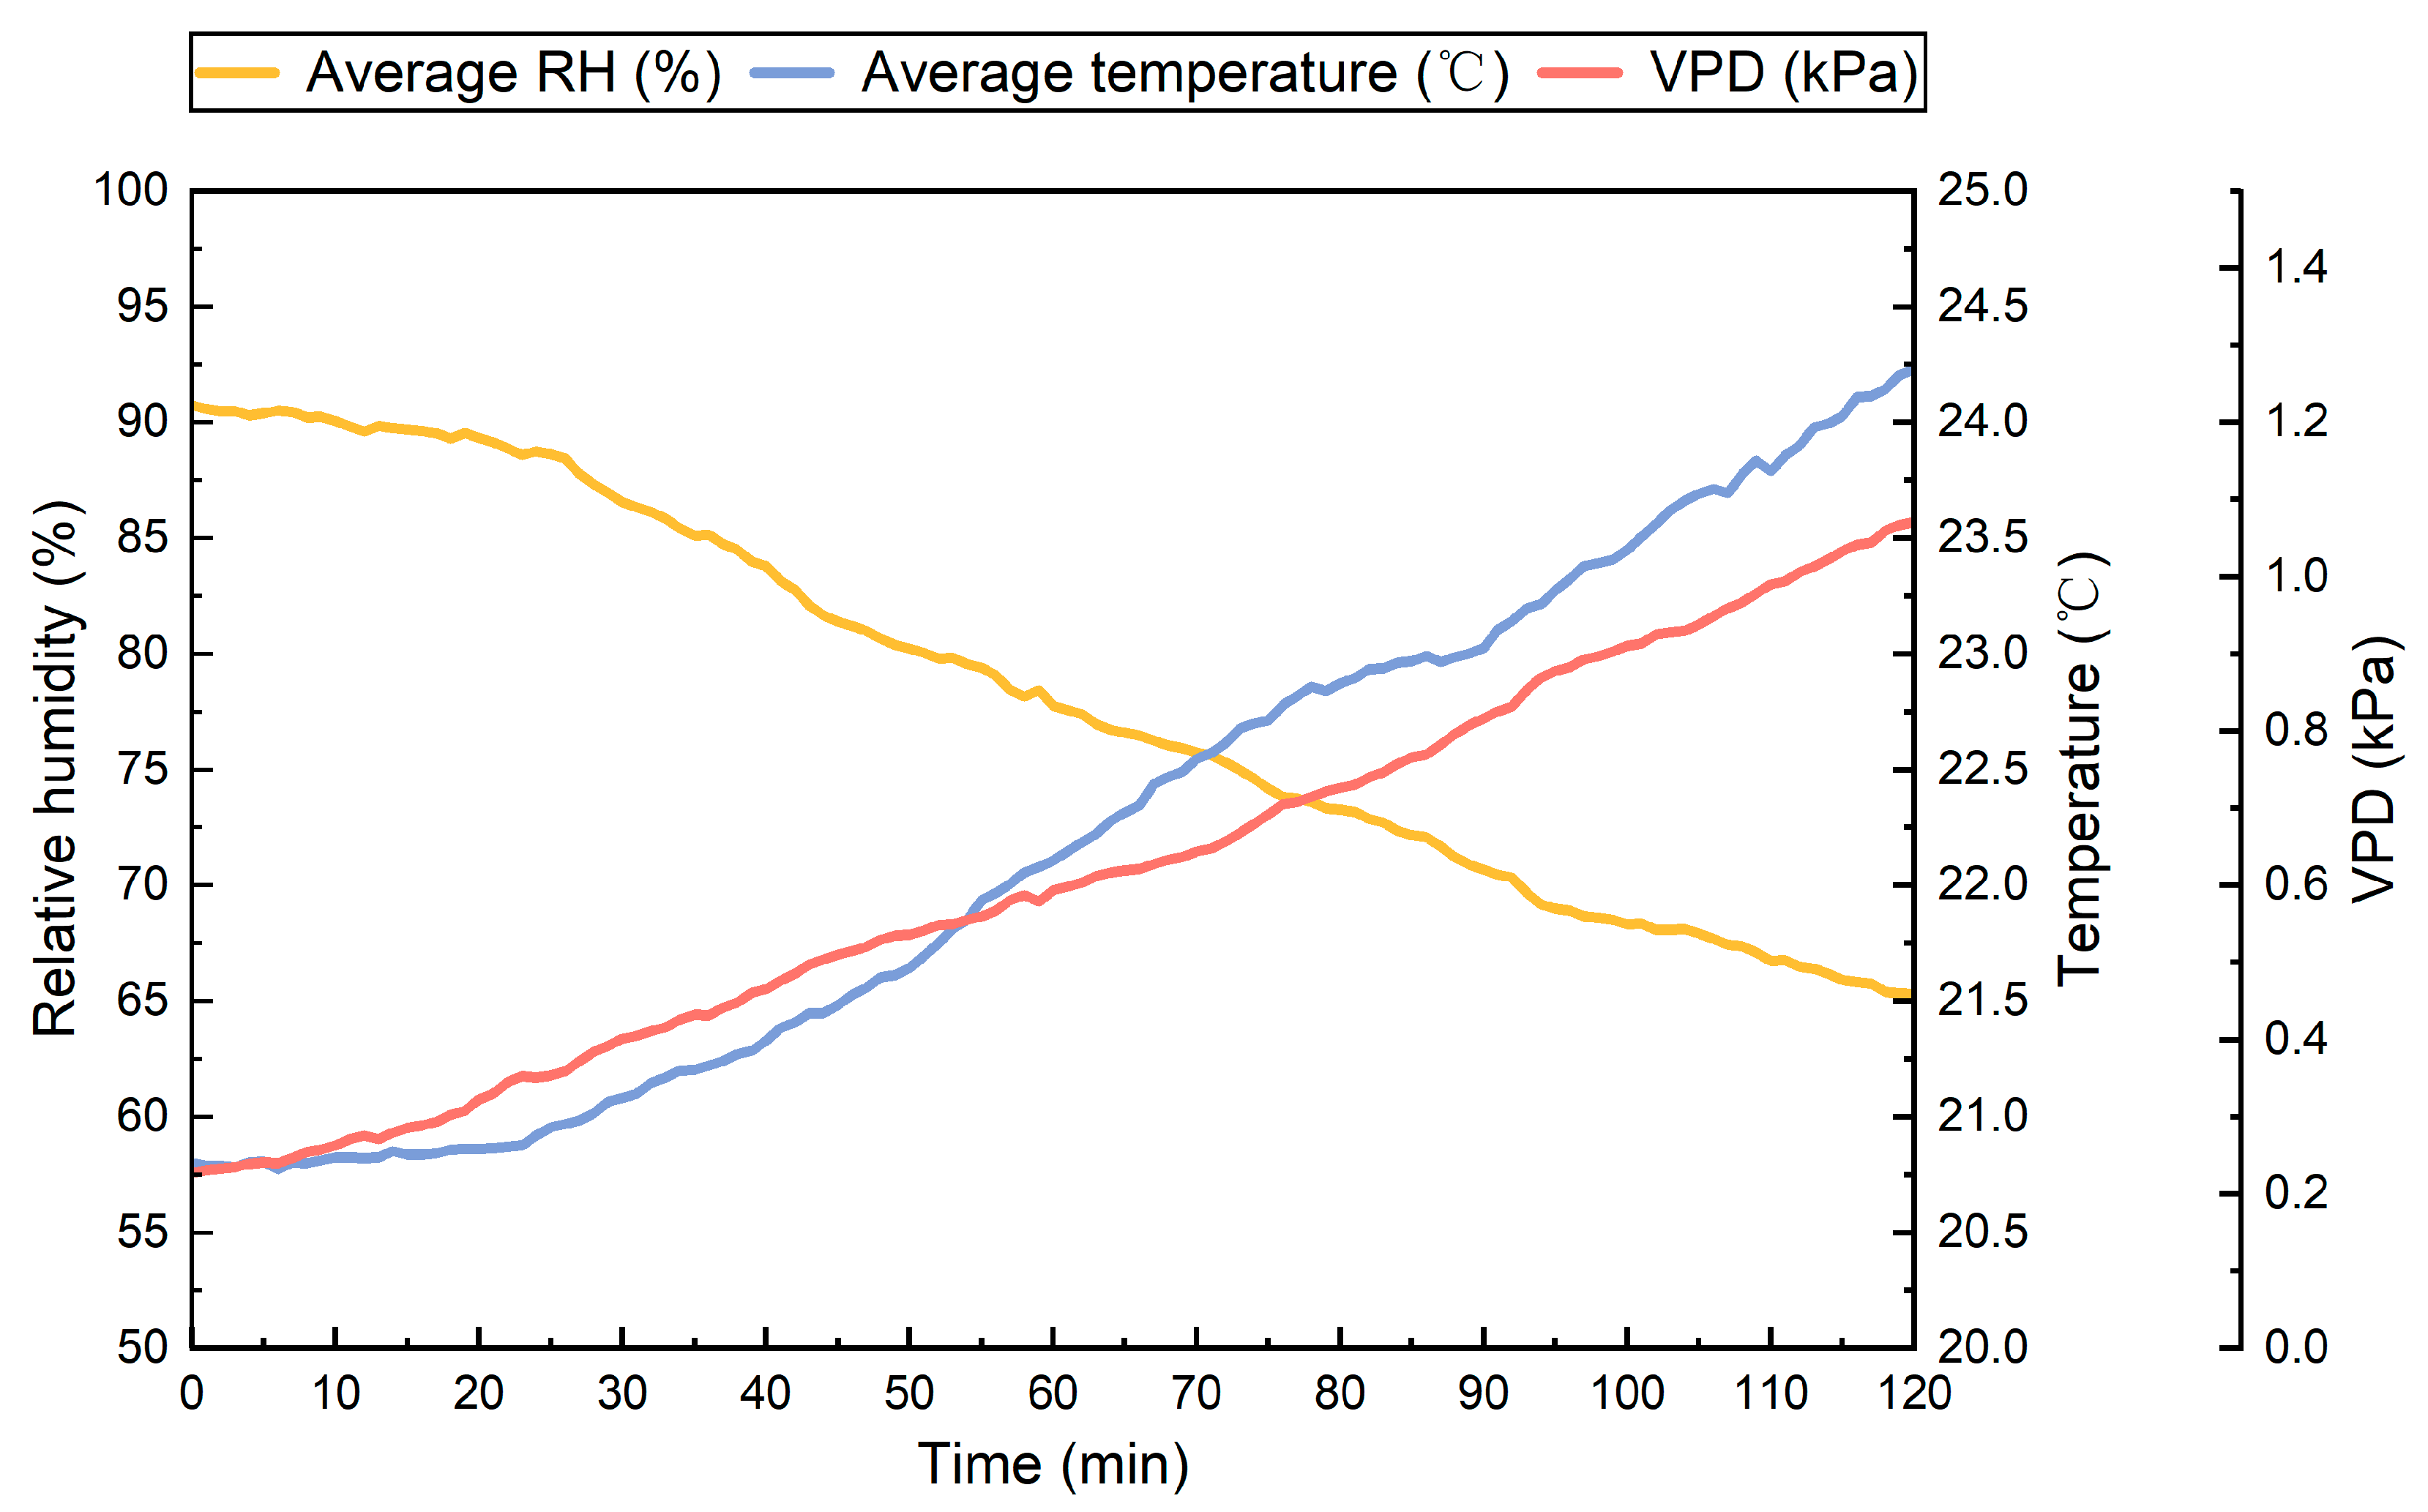
3.2.1. RH, Temperature, and VPD Variations in the CSG

Figure 9 shows the variations in average RH, average air temperature, and VPD within the CSG. After 120 min of TED operation, the average RH decreased by 25.5%, whereas the average air temperature increased by 3.4 °C. The TECs effectively recovered and transferred heat to the greenhouse via air convection, increasing the overall temperature. At the outset of experiments, the greenhouse exhibited a minimal saturated VPD, which consequently suppressed crop transpiration and potentially impaired water and nutrient transport processes. The increase in temperature and decrease in humidity resulted in a rise in the VPD within the greenhouse, from 0.2 kPa to 1.1 kPa. This shift established a more conducive environment for plant transpiration, thereby enhancing plant growth.

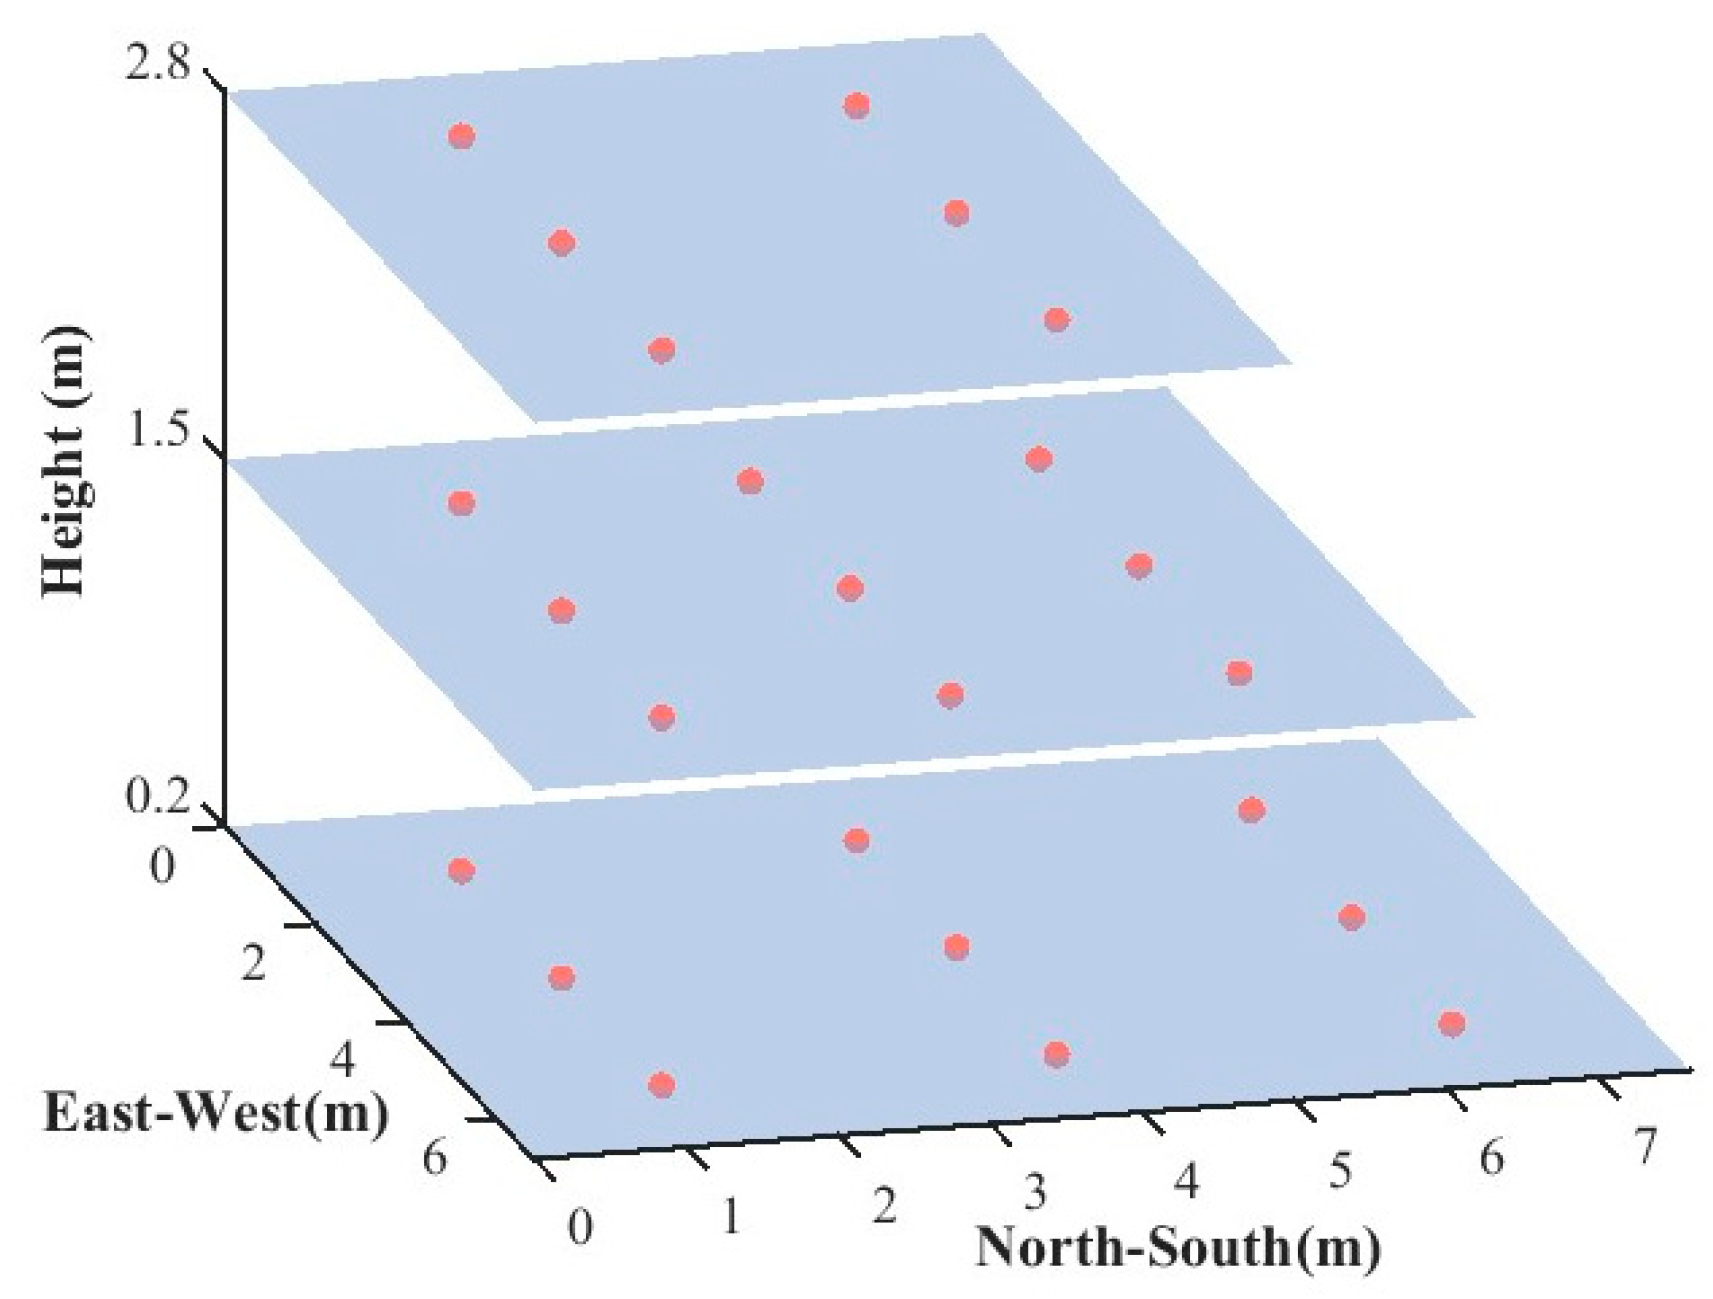
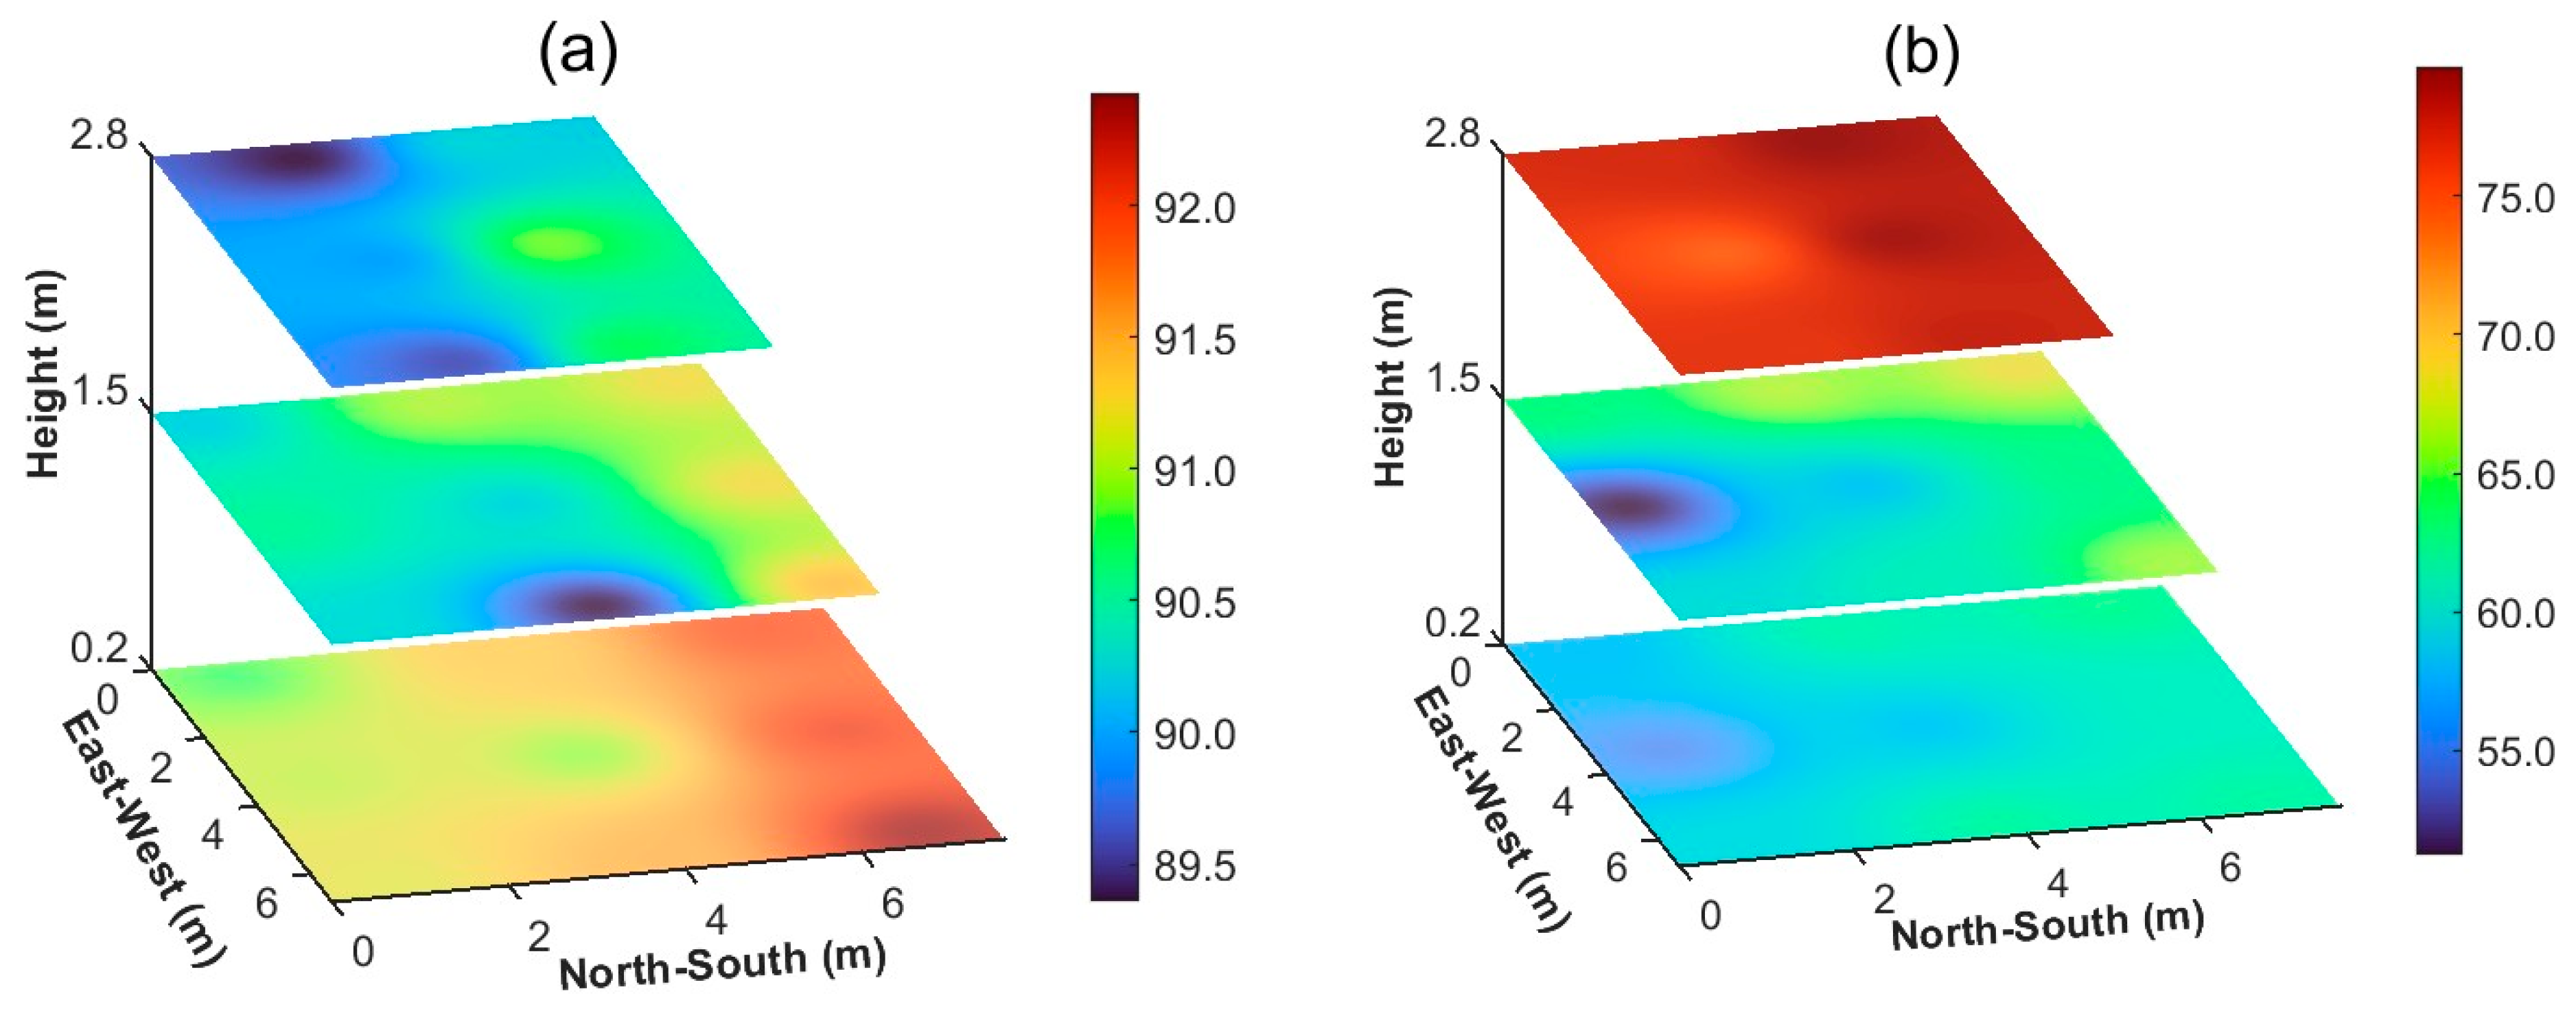
3.2.2. Spatial Variation in RH in the Greenhouse

Table 2 presents the changes in the mean RH and standard deviation at different heights within the greenhouse after 0 min, 60 min, and 120 min of TED operation. Before TED operation, the greenhouse exhibited high humidity levels, with an average RH at a height of 0.2 m reaching 91.5%. the RH values were high near the ground because of its proximity to the soil, which was influenced by soil evaporation. As the TED was operated, the RH at all measured heights gradually decreased, although the magnitude of the decrease varied at different heights. After 60 min of operation, the average RH at heights of 0.2 m, 1.5 m, and 2.8 m decreased by 18.0%, 15.5%, and 4.3%, respectively. After 120 min, the RH at the specified heights decreased by 31.2%, 28.5%, and 12.5%, respectively. At the 120 min mark, the RH at all heights, except for the topmost measurement point (2.8 m), dropped below 65%.
Table 2 shows that the standard deviation of RH within the greenhouse increased during TED operation, reaching values of 0.8, 6.5, and 8.2 at 0 min, 60 min, and 120 min, respectively. This indicates that, with TED operation, the humidity distribution within the greenhouse became increasingly non-uniform. Figure 10 illustrates the spatial distribution of RH within the greenhouse before and after 120 min of TED operation. Figure 10a shows a relatively uniform initial distribution of RH, ranging from 89.5% to 92.5%, characterized by minimal humidity gradients across various regions. As shown in Figure 10b, after 120 min of operation, the RH varied between 50.0% and 80.0%, indicating regional disparities. Notably, the RH near the floor and back wall of the greenhouse decreased substantially. The lowest RH values were recorded at coordinates (3.4 m, 1.2 m, 1.5 m). The RH at the top of the greenhouse was relatively high, with peak values observed at the coordinates 3.4 m, 3.8 m, 2.8 m. Variations in RH distribution may be affected by factors such as airflow obstruction caused by tomato plants and the location of the TED.
The functioning of the TED markedly improved the overall conditions of humidity within the greenhouse, particularly in the vertical range between 0.2 m and 1.5 m. This range is crucial because it corresponds to the primary growth zones of most crops. Maintaining RH within the optimal range in this zone is essential for promoting healthy plant development. It affects key physiological processes such as transpiration, nutrient uptake, and overall metabolic activity.

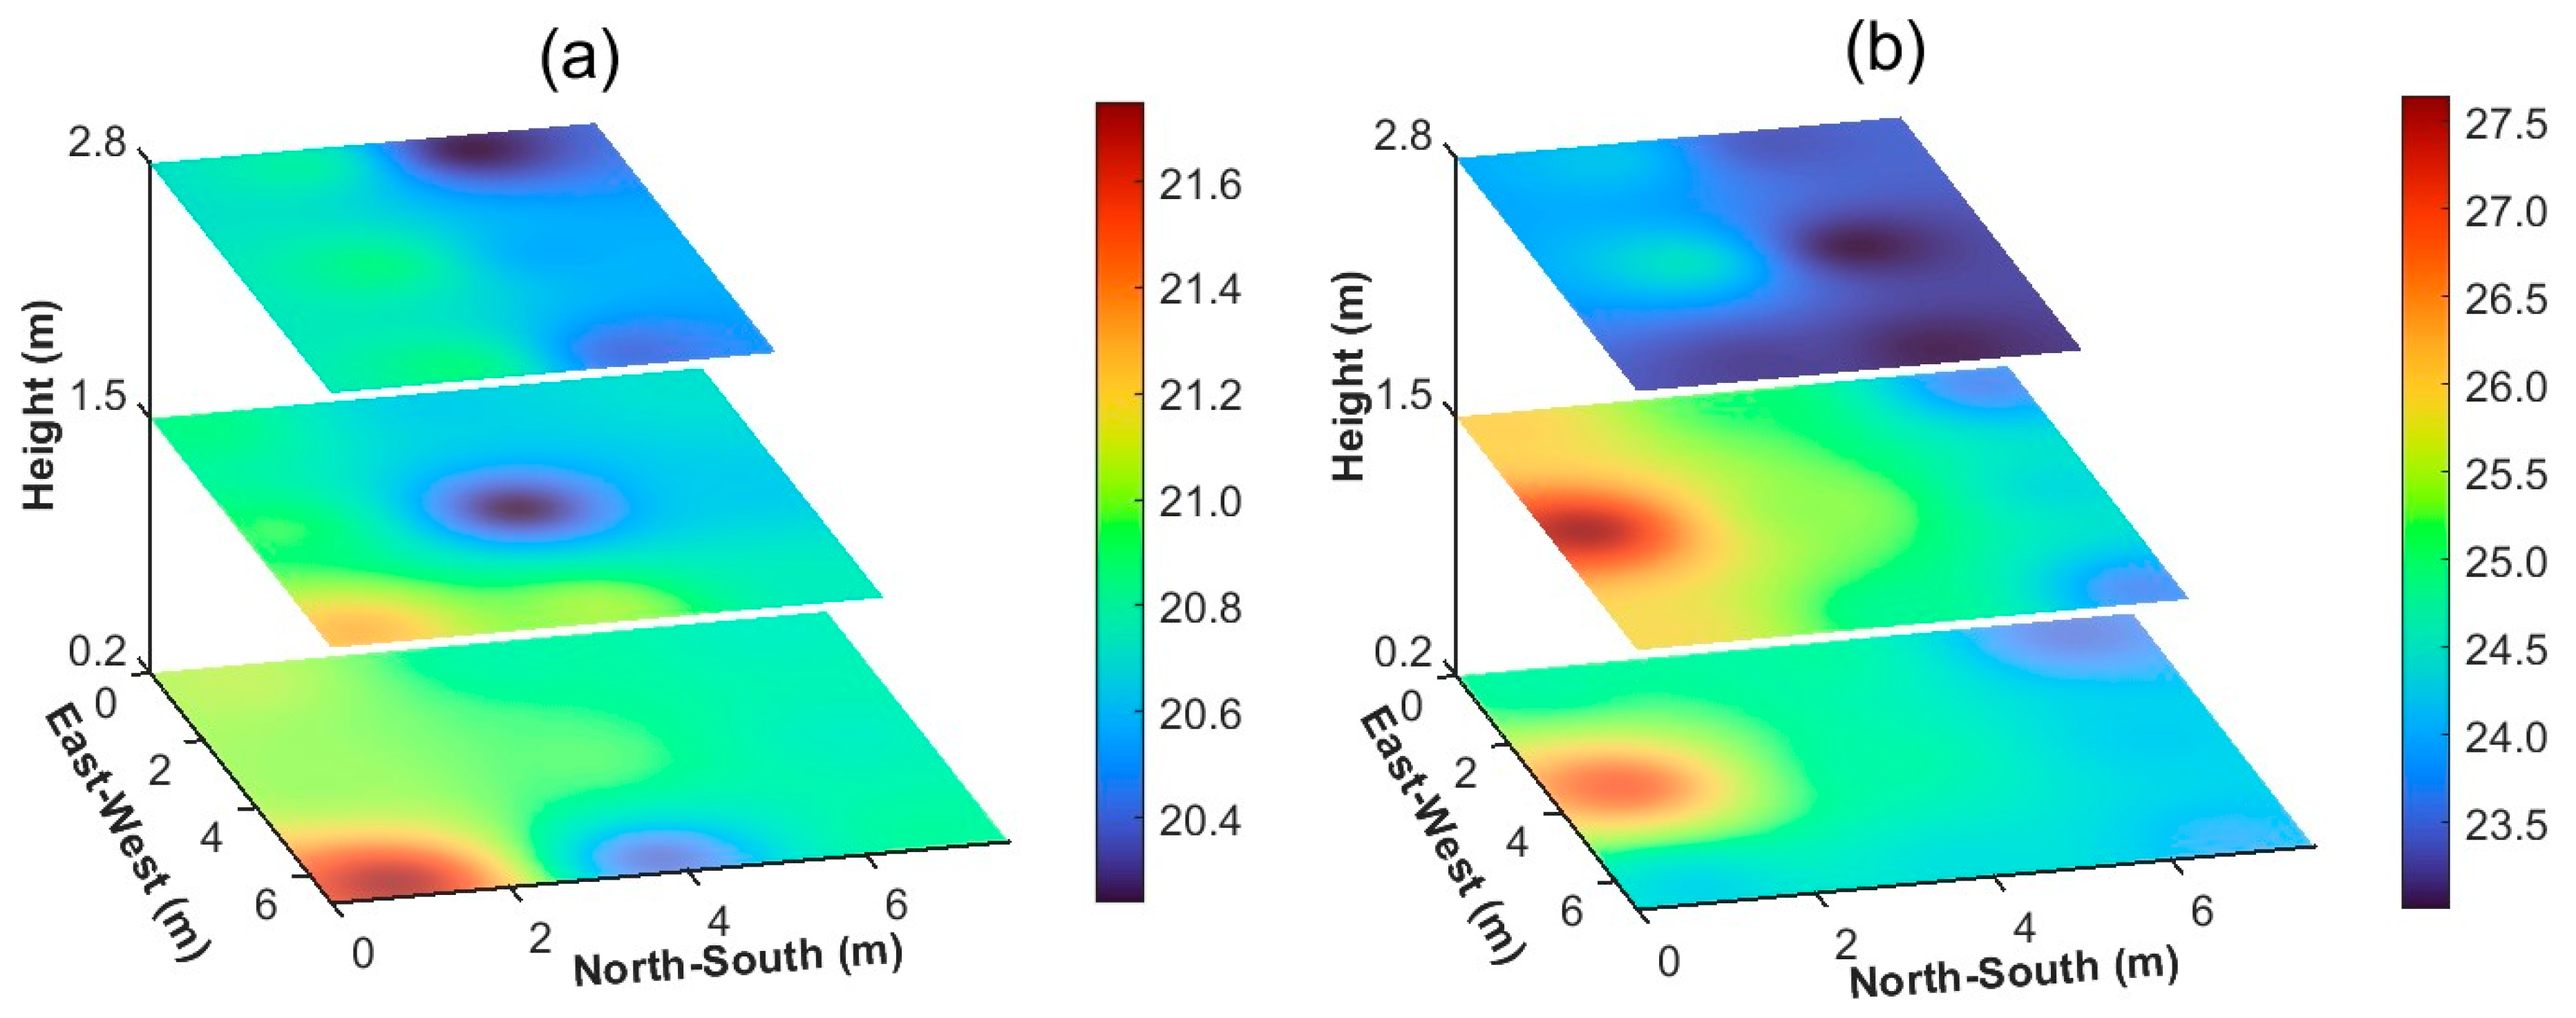
3.2.3. Spatial Variation in Temperature in the Greenhouse

Table 3 presents the variations in the average temperature and standard deviation at different heights within the CSG after 0 min, 60 min, and 120 min of TED operation. The TECs effectively recovered heat and transferred it to the greenhouse via air convection, thereby increasing the overall temperature. The operation of the TED led to a steady increase in temperature, with varying rates of temperature increase at different heights. Following 60 min of operation, the average temperature increases recorded at heights of 0.2 m, 1.5 m, and 2.8 m were 0.9 °C, 1.3 °C, and 0.9 °C, respectively. After 120 min, the average temperatures at these heights rose by 4.4 °C, 3.7 °C, and 2.9 °C, respectively. The temperature increase in the upper region (2.8 m height) was smaller than that observed at the bottom. This can be attributed to the location of the TED and heat diffusion process, which was influenced by air convection.
Table 3 also indicates that before the TED was operated, the standard deviation of the air temperature across various regions was minimal, reflecting a uniform air temperature distribution in the greenhouse under the initial conditions. After 120 min of operation, the standard deviation of the air temperature increased to 1.2, indicating the emergence of temperature inhomogeneity within the greenhouse. At a height of 1.5 m, the air temperature gradient was most pronounced. Figure 11a presents the initial temperature distribution within the CSG, ranging from 20.4 °C to 21.8 °C, with reduced temperatures noted in proximity to the polycarbonate sheets. This effect may be attributed to the inadequate sealing of the polycarbonate sheets, leading to heat loss. Figure 11b shows the temperature distribution after 120 min of TED operation: at heights of 0.2 m and 1.5 m, temperatures ranged from 24.0 °C to 27.5 °C, whereas at 2.8 m, the range was 23.0 °C to 24.5 °C. The maximum temperature was recorded at coordinates (3.4 m, 1.2 m, 1.5 m), whereas the minimum temperatures were observed at (3.4 m, 3.8 m, 2.8 m). A notable increase in the temperature was observed adjacent to the bottom and rear walls of the greenhouse. The TED enhanced the temperature conditions within the greenhouse, particularly in the lower, middle, and rear areas.
The TED system was particularly effective at increasing temperatures in the lower and middle sections of the greenhouse, where plants are typically situated. Maintaining optimal temperatures in cold climates is essential to promote crop growth. It was essential to foster crop growth by improving photosynthetic efficiency, encouraging root development, and mitigating cold-induced damage. TECs generated heat as a by-product of the dehumidification process, which was often dissipated or wasted in conventional systems. The TED system markedly enhanced overall energy efficiency by recycling waste heat for heating.

3.3. SMER and Economic Analysis of the TED

3.3.1. SMER Analysis of the TED

The TED used 0.61 kWh of power on average when operated for 120 min. The average amount of water collected during the three tests was 313.5 g. The SMER, calculated using Equation (5), was 0.52 kg/kWh. Table 4 demonstrates that the proposed TED outperforms previous TECs-based atmospheric water generators in terms of water-harvesting performance. Higher SMER values indicated that the TED was more energy-efficient in extracting moisture from the air compared to other devices. This suggested that TEDs required less energy to produce more water, thereby improving overall energy efficiency. The primary reason for this improvement was that the design of the cold air flowing through the radiator could effectively accelerate the heat dissipation process of the TECs. Improving the heat dissipation of TECs enhanced their cooling capacity. The collected water could be repurposed for irrigation, further enhancing the efficiency of water use in greenhouses. By integrating dehumidification, heating, and water collection, the TED system provided substantial advantages for crop growth and contributed to the broader objective of sustainable, environmentally friendly agriculture.

3.3.2. Economic Analysis of the TED

The initial investment in the equipment included components such as heat exchangers, ducted fans, pumps, enclosures, and auxiliary parts. The TECs were designed for a minimum service life of 10 years [38]. TECs serve as the core functional components of the dehumidification system, with their performance exerting a direct influence on the long-term operational stability and system reliability of the TED system. Previous studies have demonstrated that TECs possess high durability and reliability. For instance, under standard operating conditions, the failure threshold of TECs can reach up to 45,000 thermal cycles [39]. The TED system, based on TECs, is expected to exhibit good long-term performance [40]. Due to the characteristic performance degradation over time, a 5-year replacement strategy was implemented to ensure sustained energy efficiency. Table 5 presents the input costs for the TED. Additional experiments were conducted in the greenhouse to assess the full-day operational performance of the TED. During these experiments, the TED operated intermittently for 6 h per day to maintain the relative humidity below 70%. Considering the tomato growth cycle and regional climate characteristics, the equipment operated for approximately 90 days per year. Table 6 shows the annual electricity consumption costs of the TED.
Equipment depreciation was calculated using the straight-line method. TECs are widely recognized for their reliability and durability, resulting in relatively low maintenance costs. The total annual cost, including equipment depreciation, electricity consumption, and maintenance expenses, amounted to USD 33.23, as shown in Table 7. An economic analysis showed that the use of a TED increased the cost per square meter by USD 0.68. Future research will involve prolonged operation tests to assess system durability, TEC degradation, and maintenance requirements under practical greenhouse conditions.

3.3.3. Comparative Analysis of TED and Conventional Dehumidification Methods

The TED was compared with other commonly used greenhouse dehumidification methods in cold climates, including ventilation, heating, desiccant-based dehumidification, and heat pump systems. Table 8 summarizes the advantages and disadvantages of each method. Compared to ventilation and heating, which often cause significant heat loss or fail to remove absolute moisture, the TED system provides both dehumidification and heat recovery. This creates more favorable environmental conditions for crop growth. Compared to desiccant and heat pump dehumidifiers, the TED system has a lower initial cost and simpler maintenance. However, its dehumidification capacity is relatively lower than that of heat pump systems. Overall, the TED system is particularly suitable for small to medium-sized greenhouses where moderate dehumidification, heating, and cost effectiveness are simultaneously required.

4. Conclusions

This study presents the design of a novel dehumidifier based on thermoelectric cooling. The TED consists of a cabinet, four heat exchangers, a duct fan, a water pump, and other components. The structure of the TED is developed based on the characteristics of TECs. A TED system integrates three primary functions: dehumidification, heating, and water collection.
The input voltage of the TECs, fan airflow rate, and cold-side fin area affected the dehumidification rate, heat recovery rate, and power consumption. The radar chart results showed that the optimal operating parameters for TED performance were a fan airflow rate of 300 m3/h, an input voltage of 15 V for the TECs, and a cold-side fin area of 0.15 m2. Under these conditions, when the TED operated for 120 min, the average RH in the CSG decreased by 25.5%, whereas the average air temperature in the CSG increased by 3.4 °C. Additionally, the VPD rose from 0.2 kPa to 1.1 kPa, thereby improving the environmental conditions for crop transpiration. The operation of the TED enhanced crop growth environments, particularly in the vertical range between 0.2 m and 1.5 m within the greenhouse, which corresponds to the primary growth zone of most crops. The SMER for TED was 0.52 kg/kWh, with an additional cost of 0.68 USD/m2 per year. The TED system is particularly well suited for small to medium-sized greenhouses where moderate dehumidification, integrated heating, and cost effectiveness are concurrently desired.
TED offers notable advantages for improving crop growth environments and supporting the broader goal of sustainable agriculture. This study provides theoretical insights and practical recommendations for the application of thermoelectric cooling technology in greenhouse environments. Although the TED system demonstrated effective dehumidification and heat recovery performance, this study mainly focused on short-term experimental evaluation. Comprehensive energy efficiency metrics, long-term operational stability, and system reliability were not fully assessed and will be investigated in future research. Additionally, environmental parameters such as CO2 concentration and light intensity were not monitored during the experiments, which may introduce indirect effects. Future work will incorporate these factors to provide a more complete evaluation of the TED system’s practical applicability.

Author Contributions

Conceptualization, X.H. and W.G.; methodology, X.H. and T.L.; software, X.H.; validation, X.H.; formal analysis, X.H. and T.L.; investigation, X.H., Y.C. and T.L.; resources, X.H. and X.W.; data curation, D.W. and T.L.; writing—original draft preparation, X.H.; writing—review and editing, X.H. and T.L.; visualization, X.H. and Y.C.; supervision, R.S.; project administration, W.G. and Y.H.; funding acquisition, W.G. and Y.H. All authors have read and agreed to the published version of the manuscript.

Funding

This research was funded by the Ningxia Hui Autonomous Region Key R&D Program, grant number 2023BCF01047, the Beijing Postdoctoral Research Foundation, grant number 2024-ZZ-083, and the National Key R&D Program, grant number 2024YFD1700302.

Data Availability Statement

The datasets analyzed during the current study are available from the corresponding author upon reasonable request.

Acknowledgments

We would also like to express our sincere gratitude to Yongchao Shan of China Agricultural University, who provided invaluable assistance in writing this article.

Conflicts of Interest

The authors declare no conflicts of interest.

References

  1. Rahman, M.S.; Guo, H.; Han, J. Dehumidification requirement modeling and control strategy for greenhouses in cold regions. Comput. Electron. Agric. 2021, 187, 106264. [Google Scholar] [CrossRef]
  2. Mortensen, L.M. Effects of air humidity on growth, flowering, keeping quality and water relations of four short-day greenhouse species. Sci. Hortic. 2000, 86, 299–310. [Google Scholar] [CrossRef]
  3. Ding, J.; Jiao, X.; Bai, P.; Hu, Y.; Zhang, J.; Li, J. Effect of vapor pressure deficit on the photosynthesis, growth, and nutrient absorption of tomato seedlings. Sci. Hortic. 2022, 293, 110736. [Google Scholar] [CrossRef]
  4. Mahmoud, M.; BenRejeb, I.; Punja, Z.K.; Buirs, L.; Jabaji, S. Understanding bud rot development, caused by Botrytis cinerea, on cannabis (Cannabis sativa L.) plants grown under greenhouse conditions. Botany 2023, 101, 200–231. [Google Scholar] [CrossRef]
  5. Pokhrel, A. Role of individual components of disease triangle in disease development: A review. Plant Pathol. Microbiol. 2021, 12, 573. [Google Scholar]
  6. Dash, S.P.; Dipankar, P.; Burange, P.S.; Rouse, B.T.; Sarangi, P.P. Climate change: How it impacts the emergence, transmission, resistance and consequences of viral infections in animals and plants. Crit. Rev. Microbiol. 2021, 47, 307–322. [Google Scholar] [CrossRef]
  7. Amani, M.; Foroushani, S.; Sultan, M.; Bahrami, M. Comprehensive review on dehumidification strategies for agricultural greenhouse applications. Appl. Therm. Eng. 2020, 181, 115979. [Google Scholar] [CrossRef]
  8. Ghaderi, M.; Reddick, C.; Sorin, M. A systematic heat recovery approach for designing integrated heating, cooling, and ventilation systems for greenhouses. Energies 2023, 16, 5493. [Google Scholar] [CrossRef]
  9. Bazgaou, A.; Fatnassi, H.; Bouharroud, R.; Ezzaeri, K.; Gourdo, L.; Wifaya, A.; Demrati, H.; Elame, F.; Carreño-Ortega, Á.; Bekkaoui, A.; et al. Effect of active solar heating system on microclimate, development, yield and fruit quality in greenhouse tomato production. Renew. Energy 2021, 165, 237–250. [Google Scholar] [CrossRef]
  10. Sultan, M.; El-Sharkawy, I.I.; Miyazaki, T.; Saha, B.B.; Koyama, S. An overview of solid desiccant dehumidification and air conditioning systems. Renew. Sustain. Energy Rev. 2015, 46, 16–29. [Google Scholar] [CrossRef]
  11. Chasseriaux, G.; Travers, A.; Ternoy, M. Heat pumps for reducing humidity in plastics greenhouses. Plasticulture 1987, 73, 29–40. [Google Scholar]
  12. Cámara-Zapata, J.M.; Sánchez-Molina, J.A.; Rodríguez, F.; López, J.C. Evaluation of a dehumidifier in a mild weather greenhouse. Appl. Therm. Eng. 2019, 146, 92–103. [Google Scholar] [CrossRef]
  13. Islam, M.N.; Iqbal, M.Z.; Ali, M.; Gulandaz, M.A.; Kabir, M.S.N.; Jang, S.H.; Chung, S.O. Evaluation of a 0.7 kw suspension-type dehumidifier module in a closed chamber and in a small greenhouse. Sustainability 2023, 15, 5236. [Google Scholar] [CrossRef]
  14. Jani, D.B.; Mishra, M.; Sahoo, P.K. Solid desiccant air conditioning—A state of the art review. Renew. Sustain. Energy Rev. 2016, 60, 1451–1469. [Google Scholar] [CrossRef]
  15. Liang, K.; Li, Z.; Chen, M.; Jiang, H. Comparisons between heat pipe, thermoelectric system, and vapour compression refrigeration system for electronics cooling. Appl. Therm. Eng. 2019, 146, 260–267. [Google Scholar] [CrossRef]
  16. Wang, L.; Chu, T.; Yuan, S. Advances and future perspectives in thermoelectric cooling technology. Energy Convers. Manag. 2025, 332, 119621. [Google Scholar] [CrossRef]
  17. Liu, W.D.; Yin, L.C.; Li, L. Grain boundary re-crystallization and sub-nano regions leading to high plateau figure of merit for Bi2Te3 nanoflakes. Energy Environ. Sci. 2023, 16, 5123–5135. [Google Scholar] [CrossRef]
  18. Zaferani, S.H.; Sams, M.W.; Ghomashchi, R.; Chen, Z.G. Thermoelectric coolers as thermal management systems for medical applications: Design, optimization, and advancement. Nano Energy 2021, 90, 106572. [Google Scholar] [CrossRef]
  19. Casallas, I.; Pérez, M.; Fajardo, A. Experimental parameter tuning of a portable water generator system based on a thermoelectric cooler. Electronics 2021, 10, 141. [Google Scholar] [CrossRef]
  20. Muñoz-García, M.A.; Moreda, G.P.; Raga-Arroyo, M.P.; Marín-González, O. Water harvesting for young trees using Peltier modules powered by photovoltaic solar energy. Comput. Electron. Agric. 2013, 93, 60–67. [Google Scholar] [CrossRef]
  21. Sanaye, S.; Shourabi, A.; Borzuei, D. Sustainable water production with an innovative thermoelectric-based atmospheric water harvesting system. Energy Rep. 2023, 10, 1339–1355. [Google Scholar] [CrossRef]
  22. John, J.; Zafar, H.R.; Francis, J.; James, A.; Tharian, M.G.; Mathew, M.J. Design and optimization of an atmospheric water generator using thermoelectric cooling modules. Mater. Today Proc. 2022, 56, 2563–2567. [Google Scholar] [CrossRef]
  23. Casallas, I.; Fajardo, A.; Paez-Rueda, C.I. Towards indoor hydroponic fodder sustainability with a low-cost atmospheric water generator. Comput. Electron. Agric. 2024, 218, 108666. [Google Scholar] [CrossRef]
  24. Wang, M.; Liu, E.; Jin, T.; Zafar, S.U.; Mei, X.; Fauconnier, M.L.; De Clerck, C. Towards a better understanding of atmospheric water harvesting (AWH) technology. Water Res. 2024, 250, 121052. [Google Scholar] [CrossRef]
  25. Historical Weather in Beijing in December 2023. Available online: https://tianqi.eastday.com/lishi/beijing/202312 (accessed on 5 January 2025).
  26. Yu, S.; Guo, Y.; Li, H.; Bai, L.; Piao, X.; Lian, M. Selection of nutrient solution concentration for ex vitro rooting of Spathiphyllum kochii in hydroponic cultivation based on radar chart analysis. Agric. Sci. J. Yanbian Univ. 2023, 45, 18–24. [Google Scholar]
  27. Eltaweel, M.; Heggy, A.H.; Yaseen, Z.M.; Alawi, O.A.; Falah, M.W.; Hussein, O.A.; Abdelrazek, A.H. Application of the ANOVA method in the optimization of a thermoelectric cooler-based dehumidification. Energy Rep. 2022, 8, 10533–10545. [Google Scholar] [CrossRef]
  28. Seo, Y.M.; Ha, M.Y.; Park, S.H.; Lee, G.H.; Kim, Y.S.; Park, Y.G. A numerical study on the performance of the thermoelectric module with different heat sink shapes. Appl. Therm. Eng. 2018, 128, 1082–1094. [Google Scholar] [CrossRef]
  29. Jouhara, H.; Khordehgah, N.; Almahmoud, S.; Delpech, B.; Chauhan, A.; Tassou, S.A. Waste heat recovery technologies and applications. Therm. Sci. Eng. Prog. 2018, 6, 268–289. [Google Scholar] [CrossRef]
  30. Noh, H.; Lee, J. The effect of vapor pressure deficit regulation on the growth of tomato plants grown in different planting environments. Appl. Sci. 2022, 12, 3667. [Google Scholar] [CrossRef]
  31. Balliu, A.; Zheng, Y.; Sallaku, G.; Fernández, J.A.; Gruda, N.S.; Tuzel, Y. Environmental and cultivation factors affect the morphology, architecture and performance of root systems in soilless grown plants. Horticulturae 2021, 7, 243. [Google Scholar] [CrossRef]
  32. Yuan, R.R.; Huang, X.L.; Hao, L. Spatio–temporal variation of vapor pressure deficit and impact factors in China in the past 40 years. Clim. Environ. Res. 2021, 26, 413–424. [Google Scholar]
  33. Wang, S.; Hou, L.; Lee, J.; Bu, X. Evaluating wheel loader operating conditions based on radar chart. Autom. Constr. 2017, 84, 42–49. [Google Scholar]
  34. Shourideh, A.H.; Ajram, W.B.; Al Lami, J.; Haggag, S.; Mansouri, A. A comprehensive study of an atmospheric water generator using Peltier effect. Therm. Sci. Eng. Prog. 2018, 6, 14–26. [Google Scholar] [CrossRef]
  35. Shahrokhi, F.; Esmaeili, A. Optimizing relative humidity based on the heat transfer terms of the thermoelectric atmospheric water generator (AWG). Innov. Des. Alex. Eng. J. 2023, 67, 143–152. [Google Scholar] [CrossRef]
  36. Enescu, D.; Virjoghe, E.O. A review on thermoelectric cooling parameters and performance. Renew. Sustain. Energy Rev. 2014, 38, 903–916. [Google Scholar] [CrossRef]
  37. Heggy, A.H.; Abdel-Rehim, A.A. Optimization of a thermoelectric cooler-based system for dehumidification applications in terms of heat dissipation and water collection. Energy Convers. Manag. 2022, 258, 115550. [Google Scholar] [CrossRef]
  38. Reliability of Thermoelectric Cooling Modules. Available online: https://thermal.ferrotec.com/technology/thermoelectric-reference-guide/thermalref10/ (accessed on 5 January 2025).
  39. Barako, M.T.; Park, W.; Marconnet, A.M.; Asheghi, M.; Goodson, K.E. Thermal Cycling, Mechanical Degradation, and the Effective Figure of Merit of a Thermoelectric Module. J. Electron. Mater. 2013, 42, 372–381. [Google Scholar] [CrossRef]
  40. Zheng, Y.; Tan, X.Y.; Wan, X. Thermal stability and mechanical response of Bi2Te3-based materials for thermoelectric applications. ACS Appl. Energy Mater. 2019, 3, 2078–2089. [Google Scholar] [CrossRef]
Figure 1. Sketch of the structure of a typical atmospheric water generator [19].
Agronomy 15 01194 g001
Figure 2. Overall structure of the TED.
Agronomy 15 01194 g002
Figure 3. Structure of CSG and location of the TED.
Agronomy 15 01194 g003
Figure 4. Locations of loggers at various heights within the CSG.
Agronomy 15 01194 g004
Figure 5. Impact of TECs’ input voltage and fan airflow velocity on the dehumidification rate. (a) Cold-side fin area of 0.10 m2; (b) cold-side fin area of 0.15 m2.
Agronomy 15 01194 g005
Figure 6. Impact of TECs’ input voltage and fan airflow velocity on the heat recovery rate. (a) Cold-side fin area of 0.10 m2; (b) cold-side fin area of 0.15 m2.
Agronomy 15 01194 g006
Figure 7. Impact of TECs’ input voltage and fan airflow velocity on power consumption. (a) Cold-side fin area of 0.10 m2; (b) cold-side fin area of 0.15 m2.
Agronomy 15 01194 g007
Figure 8. Comprehensive evaluation of the effects of fan airflow velocity, input voltage of TECs, and cold-side fin area on the dehumidification rate, heat recovery rate, and power consumption.
Agronomy 15 01194 g008
Figure 9. Variations in average RH, average temperature, and VPD within the greenhouse.
Agronomy 15 01194 g009
Figure 10. Spatial variation in RH in the CSG with TED operation for (a) 0 min; (b) 120 min.
Agronomy 15 01194 g010
Figure 11. Spatial variation in temperature in the CSG with TED operation for (a) 0 min; (b) 120 min.
Agronomy 15 01194 g011
Table 1. Fundamental parameters of the employed TECs.
TypeMaximum CurrentMaximum VoltageDimensionsMaximum Temperature Difference
TEC1-127066 A15.4 V40 mm × 40 mm66 °C
Table 2. RH (%) variations at different heights in the CSG.
HeightMean ± Standard Deviation
0 min60 min120 min
0.2 m91.5 ± 0.6 a73.5 ± 3.8 b60.3 ± 2.8 b
1.5 m90.6 ± 0.7 b75.1 ± 5.1 b62.1 ± 5.3 b
2.8 m90.1 ± 0.6 b85.8 ± 3.0 a77.6 ± 2.0 a
Average90.8 ± 0.878.1 ± 6.565.3 ± 8.2
Different letters in columns indicate significant differences among different heights at the 5% probability level using one-way analysis of variance.
Table 3. Temperature (°C) variations at different heights in the CSG.
HeightMean ± Standard Deviation
0 min60 min120 min
0.2 m20.9 ± 0.4 a21.9 ± 1.1 a24.7 ± 1.0 a
1.5 m20.8 ± 0.3 a22.1 ± 1.3 a25.2 ± 1.3 a
2.8 m20.6 ± 0.3 a21.0 ± 0.5 a23.6 ± 0.6 b
Average20.8 ± 0.321.7 ± 1.124.6 ± 1.2
Different letters in columns indicate significant differences among different heights at the 5% probability level using one-way analysis of variance.
Table 4. Comparisons of TED with those reported in the literature for other TECs.
ReferenceDimensions
(m × m × m)
Number of
TECs
Produced Water
Rate (g/h)
SMER
(kg/kWh)
Enescu et al. (2014) [36]0.18 × 0.10 × 0.02124.58unknown
Shourideh et al. (2018) [34]0.44 × 0.34 × 0.17430.000.50
Heggy et al. (2022) [37]unknown1896unknown
Casallas et al. (2024) [23]0.10 × 0.07 × 0.0713.010.31
Our device (2025)0.27 × 0.27 × 0.554156.70.52
Table 5. The total investment cost of the TED.
ComponentLifetime (Year)Cost (USD/each)QuantityCost for 10 Years (USD)
Heat exchanger (Excluding TECs)158.23432.92
TECs101.65813.2
Duct fan1016.02116.02
Pump102.6812.68
Cabinet2041.25141.25
Auxiliary components106.886.88
Total112.95
Table 6. Annual cost of electricity consumption for the TED.
Power Consumption (kW)Days of Operation Per Year (d)Hours of Operation Per Day (h/d)Price of Electricity (USD/kWh)Total Electricity Cost (USD)
0.3059060.085814.13
Table 7. Results of economic analysis of the TED.
ContentCost (USD/Year)
Annual electricity consumption14.13
Annual depreciation expense12.30
Annual fixed cost6.8
Total annual operating cost33.23
Table 8. Comparison of different greenhouse dehumidification methods in cold climates.
MethodAdvantagesDisadvantages
VentilationSimple, low-cost, easy to operateSignificant heat loss in winter; causes temperature drop
HeatingPrevents frost damage; increases air temperatureNo absolute moisture removal; high energy consumption
DesiccantHigh dehumidification efficiency at low temperaturesNeeds frequent material regeneration; additional maintenance required
Heat PumpHigh dehumidification efficiency; energy-savingHigh initial investment; complex maintenance
TEDCombines dehumidification and heating; compact and low-costLower dehumidification capacity compared to heat pumps
Disclaimer/Publisher’s Note: The statements, opinions and data contained in all publications are solely those of the individual author(s) and contributor(s) and not of MDPI and/or the editor(s). MDPI and/or the editor(s) disclaim responsibility for any injury to people or property resulting from any ideas, methods, instructions or products referred to in the content.

