Article

In Vitro Propagation of Endangered Vanda coerulea Griff. ex Lindl.: Asymbiotic Seed Germination, Genetic Homogeneity Assessment, and Micro-Morpho-Anatomical Analysis for Effective Conservation

by
Leimapokpam Tikendra
1,
Asem Robinson Singh
1,
Wagner Aparecido Vendrame
2 and
Potshangbam Nongdam
1,*
1
Department of Biotechnology, Manipur University, Canchipur, Imphal 795003, Manipur, India
2
Environmental Horticulture Department, Institute of Food and Agricultural Sciences, University of Florida, Gainesville, FL 32611, USA
*
Author to whom correspondence should be addressed.
Agronomy 2025, 15(5), 1195; https://doi.org/10.3390/agronomy15051195
Submission received: 28 March 2025 / Revised: 12 May 2025 / Accepted: 14 May 2025 / Published: 15 May 2025
(This article belongs to the Special Issue Seeds for Future: Conservation and Utilization of Germplasm Resources)

Abstract

:
In nature, orchid seed germination is extremely low, making in vitro asymbiotic seed germination essential for the propagation and conservation of endangered Vanda coerulea. This study optimized a micropropagation protocol and evaluated the genetic homogeneity of regenerated orchids. The synergistic effect of kinetin (KN) with auxins in the Mitra (M) medium best supported protocorm formation and seedling development. The highest shoot multiplication (5.62 ± 0.09) was achieved with 1.2 mg L−1 KN and 0.6 mg L−1 IBA (indole-3-butyric acid) in the medium. Enhanced leaf production (4.81 ± 0.37) was observed when 3.2 mg L−1 KN was combined with 1.8 mg L−1 IAA (indole-3-acetic acid), while root development was superior when 3.2 mg L−1 KN together with 2.4 mg L−1 IAA was incorporated in the medium. Anatomical sections confirmed well-developed leaf and root structures. Genetic fidelity assessment using random amplified polymorphic DNA (RAPD), inter-simple sequence repeat (ISSR), inter-primer binding site (iPBS), and start codon targeted (SCoT) markers revealed 97.17% monomorphism (240/247 bands) and low Nei’s genetic distances (0.000–0.039), indicating high similarity among the regenerants. Dendrogram clustering was supported by a high cophenetic correlation coefficient (CCC = 0.806) and strong resolution in Principal Coordinate Analysis (PCoA) (44.03% and 67.36% variation on the first two axes). The Mantel test revealed a significant correlation between both ISSR and SCoT markers with the pooled marker data. Flow cytometry confirmed the genome stability among the in vitro-propagated orchids, with consistently low CV (FL2-A) values (4.37–4.94%). This study demonstrated the establishment of a reliable in vitro protocol for rapidly propagating genetically identical V. coerulea via asymbiotic seed germination.

1. Introduction

Vanda coerulea Griff. ex Lindl., commonly known as the Blue Vanda, is a rare and endangered orchid species renowned for its striking bluish-purple flowers [1]. First discovered in 1837 in the oak and pine forests of the Khasia Hills, eastern India, it was formally described by William Griffith in 1847. This epiphytic orchid exhibits monopodial growth with a single stem and strap-like leaves arranged distichously. Owing to its large, flat, vivid blue, and long-lasting blooms, V. coerulea is highly valued in the floricultural market. It is also widely utilized in hybridization programs to develop deep blue and purple Vanda hybrids, making it especially prized by orchid growers and breeders [1]. Its natural distribution spans the Himalayan regions, extending from India’s northeastern states of Assam, Arunachal Pradesh, Manipur, Mizoram, Meghalaya, and Nagaland through Myanmar and Thailand, reaching into southern China, typically at altitudes between 1000 and 1500 m [2,3]. Beyond its ornamental significance, V. coerulea holds considerable ethnobotanical value, as it has long been utilized in traditional medicine. This is primarily attributed to its rich composition of bioactive compounds, including flavidin, imbricatin, coelonin, methoxycoelonin, gigantol, and phytosterol [4]. In folk medicine, extracts from its leaves are commonly used to treat aging and ailments such as diarrhea, dysentery, and various skin disorders [5]. Decoctions made from its flowers are believed to effectively manage eye conditions like glaucoma, cataracts, and even blindness [6,7].
Despite this orchid being protected under the Convention on International Trade in Endangered Species of Wild Fauna and Flora (CITES), the growing recognition of its medicinal benefits and significant role in the floriculture industry has sharply increased the demand for the orchid, highlighting its conservation significance [7]. Moreover, increased unregulated collection and alarming habitat destruction have also contributed to the rapid population decline of this important orchid [8]. Apart from this, V. coerulea also faces significant reproductive challenges, primarily due to its tendency for self-pollination within the same inflorescence, which typically results in the formation of only one single seed pod [9]. This self-pollination is often regarded as an “evolutionary dead-end” because it limits genetic diversity and reduces the ability of the plant to adapt to changing environments [9]. The seed pod also takes nearly a year to mature fully, further constraining the natural propagation potential of the plant [1]. The orchid species also produces tiny, non-endospermic seeds that rely entirely on a specific symbiotic relationship with mycorrhizal fungi to obtain the nutrients necessary for germination and early seedling development [10]. This dependency poses a significant barrier to successful germination in the wild, as the likelihood of encountering a compatible fungal partner is extremely low, estimated to be less than 1% [11,12,13,14]. Besides extremely poor seed germination in nature, the traditional laborious and time-consuming vegetative method of propagation through cutting and division cannot produce orchids rapidly on a large scale [3,15,16]. Amid these challenges, micropropagation through asymbiotic seed germination has emerged as an essential conservation strategy for V. coerulea. The in vitro propagation technique bypasses the dependence on mycorrhizal fungi for germination, enabling the large-scale production of plantlets under controlled conditions [3,17,18]. While micropropagation offers a promising solution for the rapid multiplication of this species, tissue-cultured plants are constantly confronted with stress conditions in vitro, which may lead to the emergence of somaclonal variation. While somaclonal variation can serve as a valuable source of novel traits such as higher yield, enhanced quality, and improved disease resistance [19,20,21], it may pose a significant challenge when the primary objective is the production of true-to-type regenerants for the commercialization and conservation of elite genotypes [16,22]. Therefore, rigorous genetic homogeneity assessment is crucial to ensure that the in vitro-raised plantlets retain the genetic characteristics of the mother plant.
Several PCR-based molecular markers, including RAPD, ISSR, iPBS, and SCoT, have been effectively used to evaluate genetic uniformity across a variety of micropropagated orchids [16,23,24,25]. While conventional markers like RAPD and ISSR have limitations due to their random amplification of specific genomic regions, iPBS and SCoT markers offer a distinct advantage by targeting conserved regions flanking the start codon (ATG) of functional genes, thereby providing more reliable insights into genetic stability [26,27,28,29]. Using a multiple marker system for genetic fidelity assessment is essential to obtain reliable results, as the findings from one marker can be complemented and validated by those from others [29,30,31]. Combinations of different markers have been previously utilized to evaluate the genetic stability testing of many micropropagated orchids [32,33]. Flow cytometry analysis may also be incorporated in addition to marker studies to ascertain the accurate genetic fidelity of the in vitro clones [34,35]. Several studies showed the application of flow cytometry analysis to detect the genetic stability of many micropropagated plants [36,37,38,39]. In vitro-propagated plants may also develop morpho-anatomical abnormalities due to the unique physicochemical conditions present during tissue culture. These abnormalities often reduce the ability of regenerants to adapt to ex vitro and in vivo environments, leading to high mortality rates [40]. Therefore, beyond assessing genetic homogeneity, conducting micromorphological analysis of tissue culture-raised plants is also crucial to evaluate their structural readiness and potential for survival outside the lab. Earlier reports showed microanatomical studies being performed for several micropropagated plants to check their normal structural abilities [41,42,43].
Previous studies have explored the micropropagation of V. coerulea using various explants [3,44]. However, a comprehensive investigation has not been undertaken yet to assess the genetic stability of the in vitro-raised V. coerulea through asymbiotic seed culture, employing multiple molecular markers and flow cytometry. As part of an important conservation initiative for the endangered V. coerulea, the present study aims to rapidly propagate genetically uniform and morpho-anatomically normal plants via in vitro seed germination by integrating molecular marker and flow cytometry-based genetic homogeneity assessment and detailed micro-anatomical evaluations of the micropropagated orchids.

2. Materials and Methods

2.1. Micropropagation

2.1.1. In Vitro Culture Establishment and Propagation

A 38-week-old mature capsule (Figure 1a) that bears singly in V. coerulea grown in the natural population of the state orchidarium, Khonghampat, Manipur, India, was collected prior to dehiscence on 1st December 2019. The seeds derived from the capsule were used as explants to start in vitro culture in February 2020. Before initiating tissue culture, the capsule was washed thoroughly with running tap water to remove adhered dust and soil particles. The follow-up step included treatment with 10% (v/v) Tween-20 for 10 min and 0.4% (w/v) mercuric chloride for 6–7 min. Every treatment step was followed by washing (4–5 times) with sterile ultra-pure water. Before splitting longitudinally for inoculation, the capsule was finally flamed for 2–4 s after dipping in absolute alcohol. Seeds scooped out from the sterilized capsule were inoculated in basal Mitra medium [45] supplemented with 3% (w/v) sucrose as a carbohydrate source and solidified with 0.9% agar. The pH of the medium was adjusted to be 5.8 using 1 N NaOH before autoclaving at 15 lb inch−2 and 121 °C for 15 min. Seeds at the initial germination stage, characterized by the swollen embryos and ruptured testa, were transferred to freshly prepared media incorporated with plant growth regulators. The synergistic effect of BAP (6-Benzylaminopurine) or KN (Kinetin) with different auxins—IAA (Indole-3-acetic acid), IBA (Indole-3-butyric acid), and NAA (Naphthalene acetic acid)—at varied concentrations and combinations were tested to assess the hormonal effects on protocorm formation and overall plant growth and development. Each treatment had ten replicates, and the experiments were implemented thrice. All the cultures were maintained at 25 ± 2 °C with proper light illumination at 60 μmolm−2 s−1 for 16 h daily using white fluorescent tubes.

2.1.2. Acclimatization and Transplantation

At monthly intervals, seedlings with well-developed shoots and roots were randomly selected across the eighteen different PGR (plant growth regulator) treatments, acclimatized on the culture medium without growth regulators, and subsequently transferred to a medium lacking both sucrose and vitamins. The surviving seedlings were removed from culture vessels, washed with warm water to remove agar, and transplanted into perforated plastic pots containing equal ratios of coconut husk, brick, and charcoal pieces as potting mixture. The transplanted plants were sprayed with Mitra salt solution incorporated with 1 mLL−1 Dhanzyme gold (Dhanuka Agritech Limited, Ahmedabad, Gujarat, India), an organic extract from seaweed. The potted plants were initially kept 3–4 weeks in the glass house for further acclimatization and finally exposed to normal daylight in the greenhouse.

2.1.3. Culture Data Recording and Statistical Analysis

All the experiments were performed with a purely random approach. The culture responses regarding the development of protocorms, shoots, and roots were recorded at regular fortnightly intervals. The results were analyzed using analysis of variance (ANOVA, p ≤ 0.05), and the mean values of different treatments were compared using Duncan’s Multiple Range Test (DMRT) at (p ≤ 0.05). All statistical analyses were performed using the SPSS (Version 16.0; SPSS Inc., Chicago, IL, USA).

2.2. Anatomical Study

Thin transverse sections of leaves and roots were carefully performed from successfully acclimatized in vitro-grown V. coerulea using a sharp razor blade. The sections were stained with safranin and mounted on clean glass slides for microscopic examination. Observations were made under a light microscope (Motic, New Delhi, India) at 400× magnification, and images were captured for documentation.

2.3. Genetic Stability Assessment

2.3.1. DNA Extraction

A statistically meaningful and phenotypically representative subset of nine successfully acclimatized in vitro-raised plants was randomly selected for effective evaluation of genetic stability. Genomic DNA was extracted from the leaves of these 11-month-old in vitro-propagated plants, along with the mother plant, using the modified CTAB (cetyltrimethylammonium bromide) method [46]. The quantity and quality of the isolated DNA samples were evaluated by using spectrophotometry (Perkin-Elmer Lambda 35, ABI Perkin-Elmer, Harrison, OH, USA) at 260 and 280 nm, respectively. The purity and integrity of the amplified DNA were further assessed by performing 0.8% agarose gel electrophoresis and comparing the intensity of the resultant bands against 1 kb DNA ladder (HiMedia, Mumbai, India). The DNA samples were finally diluted to 50 ng/µL and stored at −20 °C for further use.

2.3.2. PCR Amplification

A preliminary screening of 25 decamer RAPD (Eurofins, Bangalore, India), 14 ISSR (16–18 mer), 20 iPBS (12–18 mer), and 19 SCoT (18 mer) primers from Integrated DNA Technology, Banglore, India, was performed to determine the primers that generated scorable bands. PCR amplification of the extracted genomic DNA was carried out following the protocol of Tikendra et al. [47]. A 25 μL PCR reaction mixture consisted of 20 ng of genomic DNA, 2.5 μL of 10 X PCR buffer containing 15 mM MgCl2, 0.02 mM dNTPs, 1 unit/µL Taq polymerase (GeNei, Bangalore, India), and 20 ng RAPD, ISSR, iPBS or SCoT primers, with the final volume adjusted using molecular-grade ultra-pure water. All the amplification reactions were carried out using Thermal Cycler (Eppendorf, Hamburg, Germany) as follows: initial DNA denaturation at 94 °C for 4 min, followed by 45 cycles of 1 min, denaturation at 94 °C; annealing (4 °C < Tm) for 1 min, set at varying temperatures for different marker systems; and primer extension at 72 °C for 1 min, followed by a final extension at 72 °C for 10 min. The amplified DNA fragments were separated using 2% agarose gel electrophoresis dissolved in 1× Tris-acetate EDTA buffer, stained with 0.5 μgL−1 ethidium bromide. The gel was visualized and photographed using the Gel Documentation system (Syngene, Cambridge, UK). The band size of the amplified DNA was determined by running a DNA ladder (1 kb, Himedia, Mumbai, India) alongside the agarose gels.

2.3.3. Data Analysis

The banding patterns of clear, consistent, and reproducible bands produced by RAPD, ISSR, iPBS, and SCoT primers were documented by scoring the selected visible bands into a binary matrix as 1 (presence) and 0 (absence) across the individuals. The genetic identity matrices between the mother plant and in vitro-regenerated plants were estimated according to Nei [48]. The identity coefficients thus obtained were used to construct UPGMA (unweighted pair-group method with arithmetic mean)-based dendrograms using GenAlEx 6.5 software [49]. Principle Coordinate Analysis (PCoA) was performed with GenAlEx 6.5 to spatially represent the relative genetic distances among the in vitro-regenerated plants and mother plant and to detect the differentiation consistency between them as defined by the cluster analysis. The fitness between genetic similarity matrices and the respective dendrograms of the four markers under study were determined from the Cophenetic Correlation Coefficient (CCC) estimated using Multidendrograms 5.2.1 [50]. A Mantel test was performed using Nei’s genetic distance matrices to analyze the correlation between genetic distances obtained from different molecular markers. Pairwise comparisons were conducted between the respective marker systems—RAPD, ISSR, iPBS, and SCoT—and the genetic distance derived from the combined dataset (RAPD + ISSR + iPBS + SCoT). The Mantel test was performed using GenAlEx 6.5, employing 999 permutations to test the significance of correlations (p < 0.05).

2.3.4. Flow Cytometry (FCM) Analysis

Fresh young leaves from the mother plant and in vitro-raised plants were collected. Sample preparation and analysis for determining nuclear DNA content were performed following the Galbraith method [51]. Using a pre-chilled plate and a sharp steel razor blade, approximately 50 mg of clean leaf were finely chopped in 1.5 mL of Galbraith buffer (45 mM MgCl2, 30 mM sodium citrate, 20 mM MOPS, and 0.1% (w/v) Triton X-100) at pH 7.0. Chopping was performed for 2–3 min, and the homogenate was filtrated through a nylon filter (100 µm) and collected in a 1.5 mL centrifuge tube. A total of 500 µL of the filtered homogenate was transferred to a new labeled tube that contained 2.5 µL of RNase A (10 mg mL−1) and incubated on ice for 10 min. The suspension was stained with propidium iodide (50 µg/mL), incubated on ice for 30 min in the dark, and analyzed in BD Accuri C5 Flow Cytometer (BD Biosciences, San Jose, CA, USA). Each run had at least 5000 nuclei, and each experiment was repeated thrice.

3. Results

In the present study, seeds measuring approximately 37,023 µm2 in area and 886.22 µm in perimeter were successfully germinated in basal Mitra media (Figure 1b–d). Within 4–5 weeks from the day of inoculation, the seeds exhibited swelling, indicating successful germination due to nutrient absorption, leading to the rupture of longitudinal testa cells (Figure 1e,f).

3.1. Development of Protocorm and Shoot Apical Meristem

Subculturing the germinated seeds onto the basal medium and medium supplemented with eighteen different combinations of plant growth regulators (PGRs) facilitated protocorm formation (Table 1; Figure 1g). The culture media augmented with KN in combination with auxins (IAA, IBA, and NAA) significantly enhanced the early protocorm formation, multiplication, and development of shoot apical meristem (SAM) (Figure 1h; Table 1). All the tested PGR combinations were effective in inducing protocorm formation, with success rates ranging from 81.66% in media enriched with 1.2 mgL−1 BAP and 0.6 mgL−1 IBA to 91.37% in media containing 3.2 mgL−1 KN and 2.4 mgL−1 IAA (Figure 2). While differences among treatments were not statistically significant, protocorm formation was generally more efficient in media containing KN.
The earliest formation of shoot apices was recorded after 26.35 ± 0.86 days and 26.69 ± 0.99 days, following the first subculture of the germinated seeds, in media supplemented with 3.2 mgL−1 KN and 1.8 mgL−1 IBA and 1.2 mgL−1 KN with 0.6 mgL−1 IAA, respectively. However, the same morphological development was delayed (41.35 ± 1.16 days) in the medium augmented with 3.2 mgL−1 BAP and 2.4 mgL−1 IAA (Table 1).

3.2. Shoot Induction and Leaf Formation

The extent of shoot proliferation and elongation varied among the treatments. KN, combined with auxins, exhibited superior shoot growth and multiplication compared to BAP with auxins. The highest number of shoots (5.62 ± 0.09) was observed in medium with 1.2 mgL−1 KN and 0.6 mgL−1 IBA, followed by the combination of 3.2 mgL−1 KN and 1.8 mgL−1 IBA (5.13 ± 0.11). Among the BAP-containing media, 3.2 mgL−1 BAP with 1.8 mgL−1 IBA recorded the highest shoot proliferation (4.72 ± 0.11). Shoot induction was lowest in the basal medium (1.16 ± 0.32 shoots) compared to other treatments. Notably, the shoot multiplication declined with an increase in the concentrations of cytokinin and auxin, except in the medium that contained 3.2 mgL−1 BAP with 2.4 mgL−1 IAA, and 3.2 mgL−1 KN with 2.4 mgL−1 NAA (Figure 3). Shoot length ranged from the lowest value, 0.38 ± 0.23 cm, in basal medium to 1.83 ± 0.30 cm in the medium appended with 3.2 mgL−1 KN and 2.4 mgL−1 IBA. The BAP-containing medium produced shorter shoots, with lengths ranging from 0.42 ± 0.14 cm in the medium with 3.2 mgL−1 BAP and 2.4 mgL−1 IAA to 0.76 ± 0.08 cm in the medium incorporated with 3.2 mgL−1 BAP and 1.8 mgL−1 IBA, compared to the medium supplemented with KN combined with auxins (Table 2).
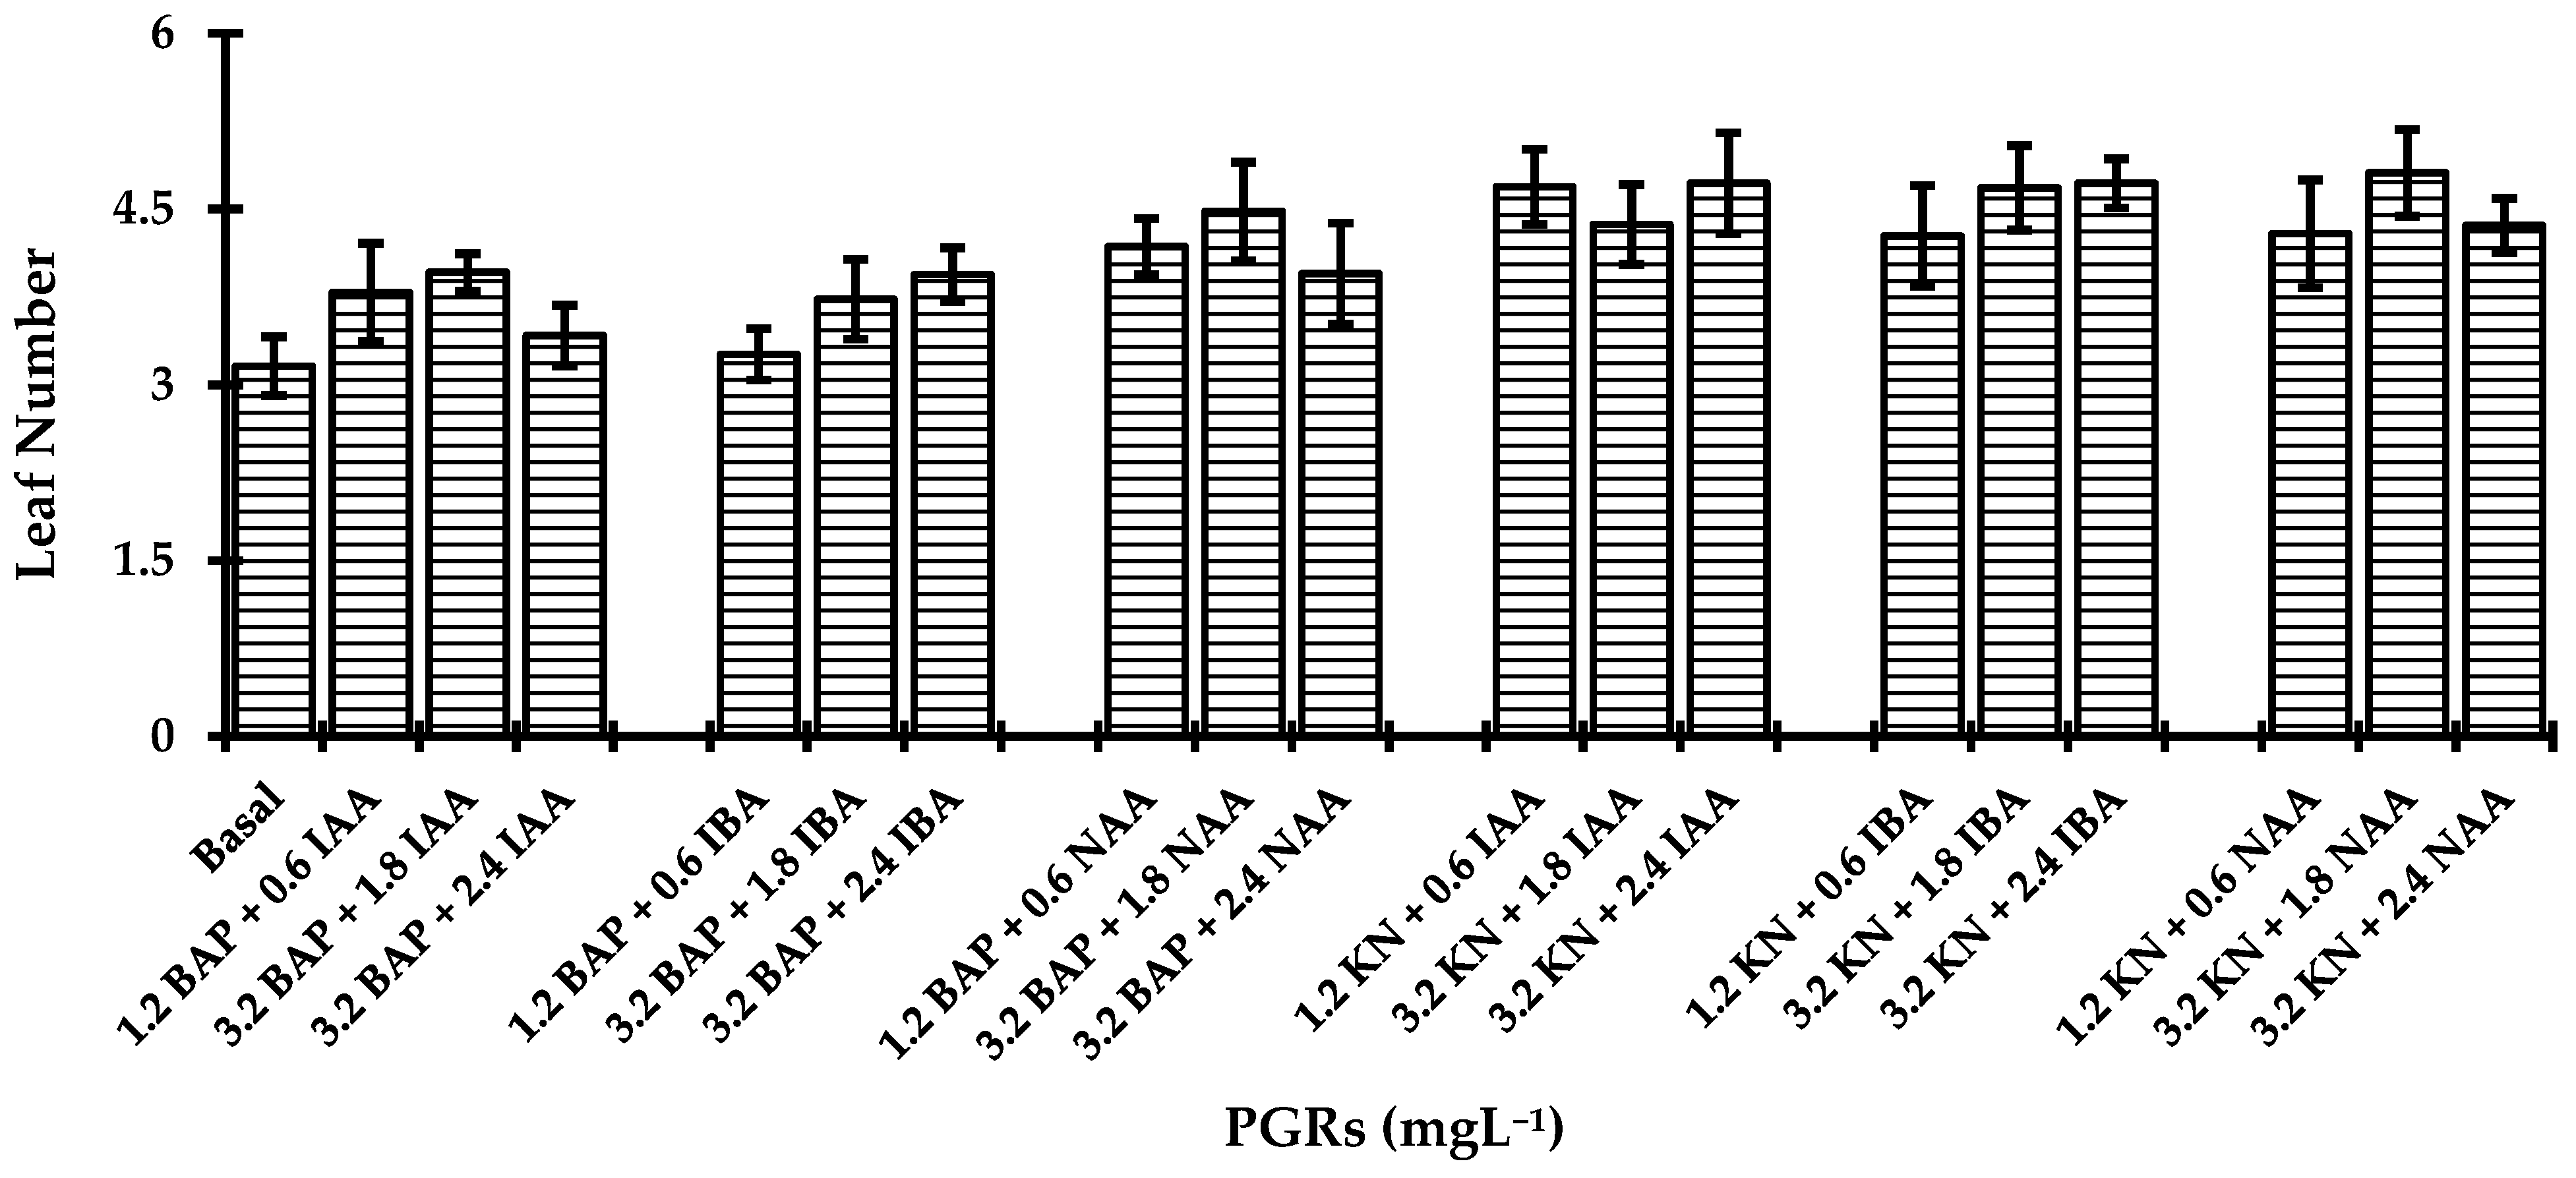
A strong leafy growth pattern in immature seedlings was noticed, which appeared to suppress shoot elongation. The number of leaves formed in V. coerulea plantlets was recorded up to the 18th week of culture. Although the differences were not statistically significant among treatments, a relatively higher number of mean leaves per plantlet was observed in the medium supplemented with 3.2 mgL−1 KN and 1.8 mgL−1 IAA (4.81 ± 0.37). In contrast, the lower mean leaf formation was observed in the basal medium (3.16 ± 0.25), medium appended with 3.2 mgL−1 BAP and 2.4 mgL−1 IAA (3.42 ± 0.26), and medium infused with 1.2 mgL−1 BAP and 0.6 mgL−1 IBA (3.26 ± 0.22) (Figure 4). The leaf length was shortest (1.95 ± 0.04 cm) in the medium enriched with 3.2 mgL−1 BAP and 2.4 mgL−1 IAA, while the medium fortified with 3.2 mgL−1 KN + 1.8 mgL−1 IAA exhibited the longest leaf length (4.37 ± 0.21 cm) (Table 2).

3.3. Rooting and Hardening of Regenerated Plantlets

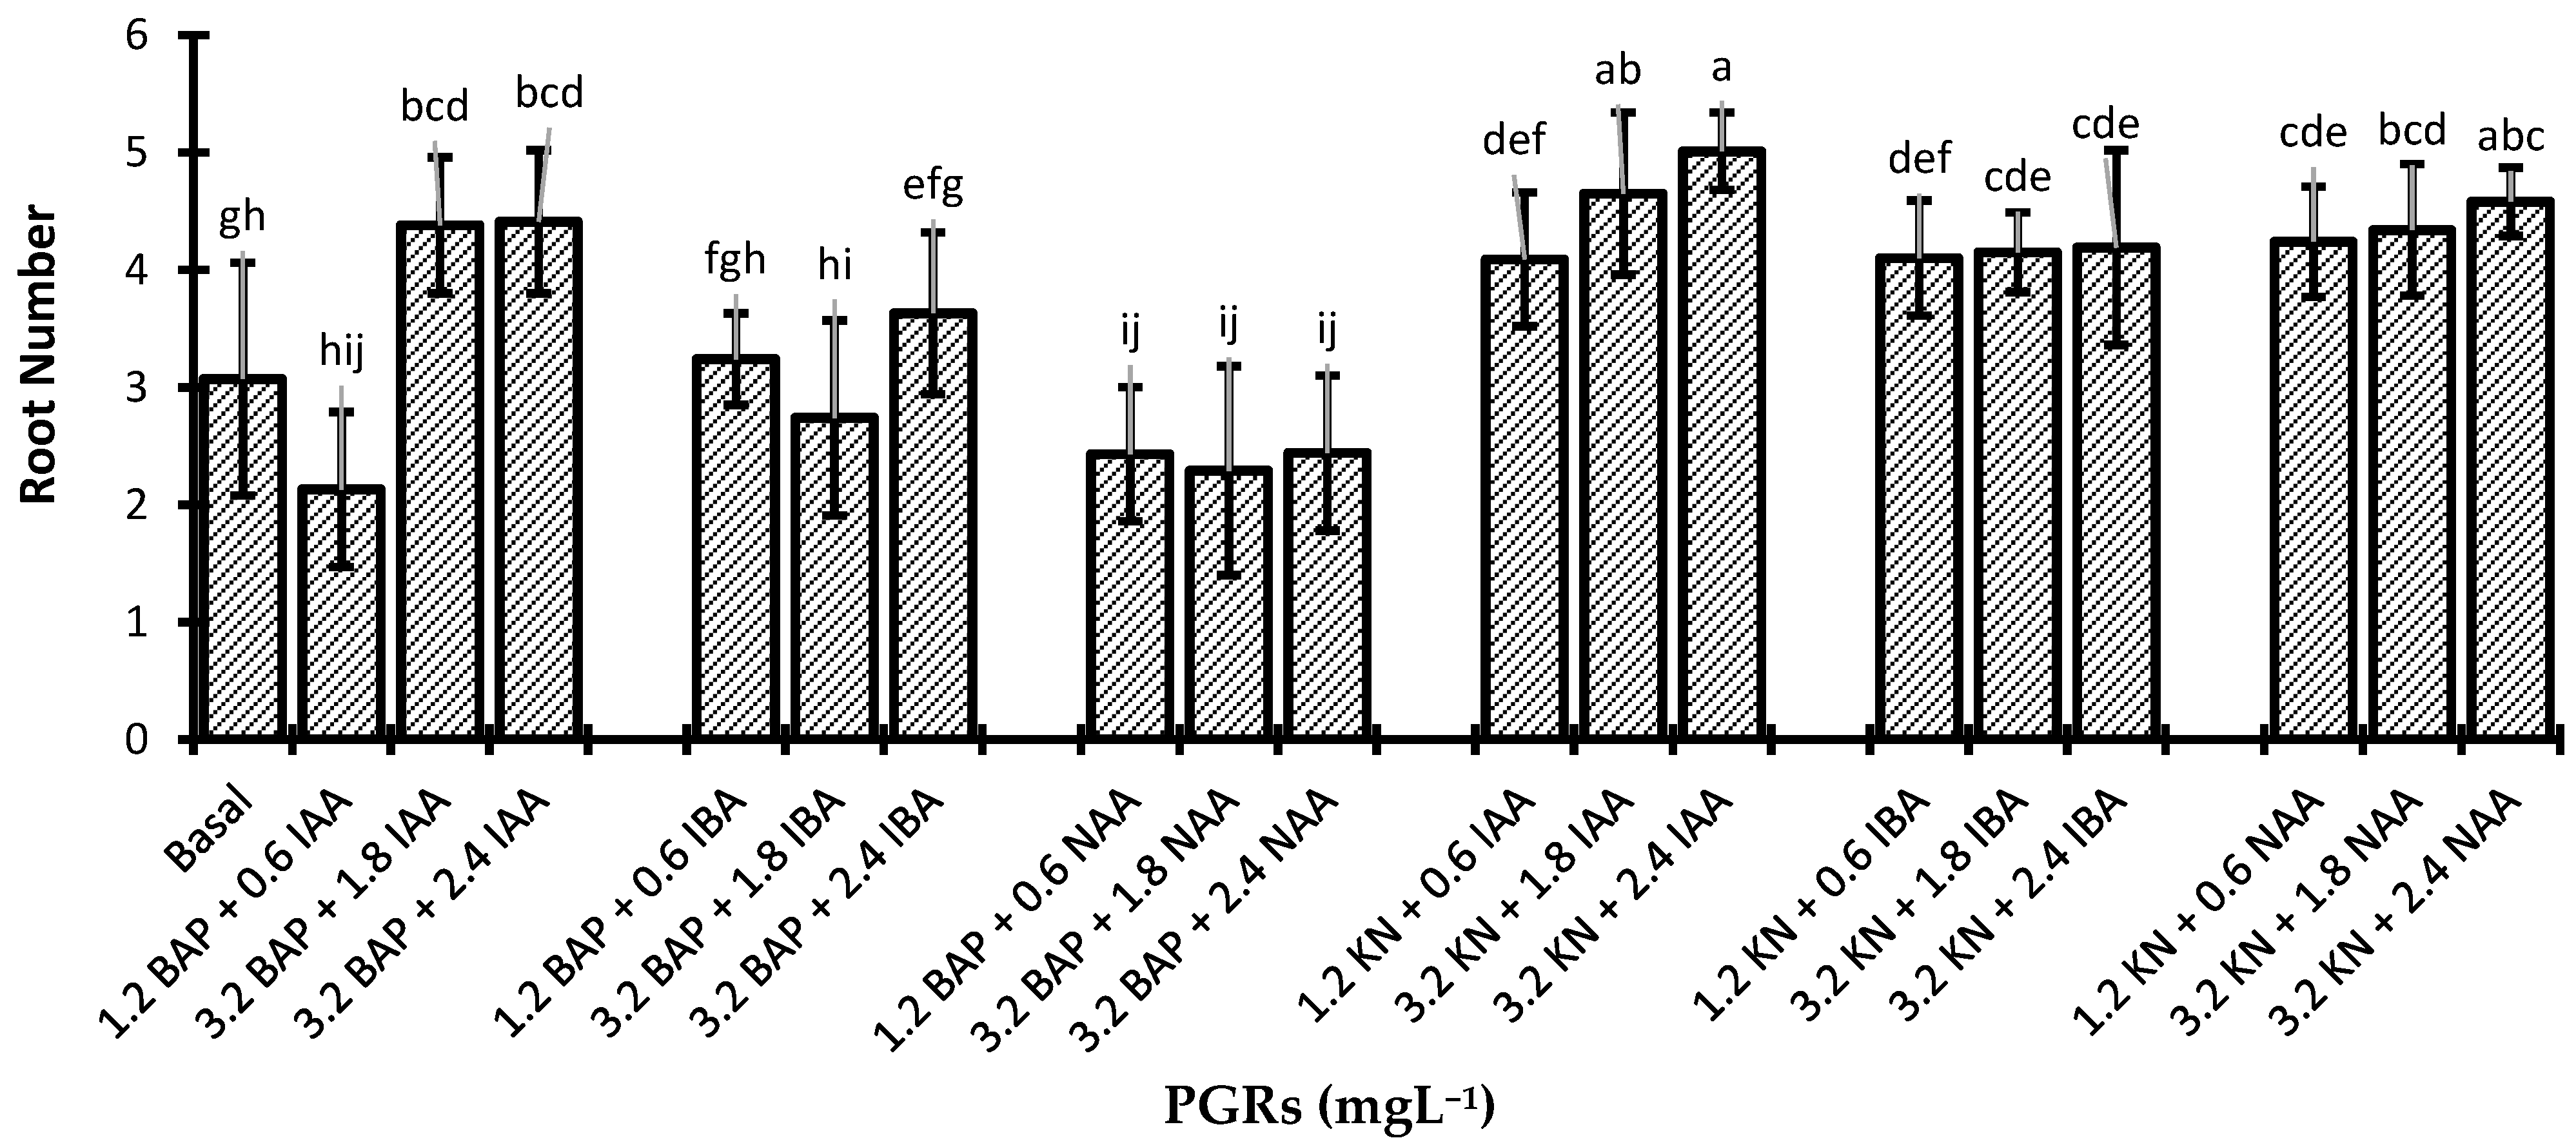
Roots were successfully induced in all treatments with significant variations in root numbers, indicating differential responses to PGRs. Among the tested treatments, media supplemented with KN and auxins (IAA, IBA, and NAA) exhibited higher root numbers than those with BAP and auxins. The highest mean root number (5.01 ± 0.33) was observed in the medium enriched with 3.2 mgL−1 KN and 2.4 mgL−1 IAA (Figure 1j and Figure 5).
The basal medium recorded a significantly higher number of roots (3.07 ± 0.99) than those enriched with BAP and NAA (Table 2). The root length was highest in the medium containing KN with auxin, ranging from 2.64 ± 0.35 cm in the medium augmented with 1.2 mgL−1 KN and 0.6 mgL−1 IBA to 4.41 ± 0.56 cm in the medium supplemented with 3.2 mgL−1 KN and 2.4 mgL−1 IAA. In contrast, root length was significantly lower in media appended with BAP and auxins, varying from 1.11 ± 0.09 cm in the medium fortified with 3.2 mgL−1 BAP and 1.8 mgL−1 IAA to 2.35 ± 0.32 cm in the media incorporated with 3.2 mgL−1 BAP and 2.4 mgL−1 IAA (Table 2). The regenerated seedlings that developed healthy roots and leaves were successfully acclimatized and hardened with an 86% survival rate (Figure 1k).

3.4. Morpho-Anatomical Characterization of Micropropagated Plants

3.4.1. Seed Germination, Shoot, and Root Morphology

The microscopic examination of V. coerulea seeds after inoculation on in vitro culture media revealed distinct developmental stages. Initially, the seeds displayed an intact testa, indicating their viability (Figure 1f). The presence of a translucent embryo within the seed coat suggested successful hydration and imbibition, crucial for germination initiation (Figure 1g). Following seed germination (Figure 1e), the testa began to rupture, allowing the embryo to expand. The emergence of a swollen, globular embryo was observed, signifying early protocorm formation (Figure 1h). The protocorm gradually developed, exhibiting a greenish hue, which further differentiated it, leading to the emergence of initial shoot meristem and rhizoids. The in vitro-regenerated V. coerulea exhibited well-developed shoots and roots, characteristic of successful propagation via asymbiotic seed germination. The shoots comprised 3–5 linear leaves with vibrant green coloration, indicating active chlorophyll synthesis. The thick and fleshy roots displayed a whitish to yellowish coloration, suggesting functional velamen tissue development essential for water and nutrient absorption (Figure 1i).

3.4.2. Anatomy of the Acclimatized In Vitro-Propagated Plants

The leaf transverse section (TS) of V. coerulea from in vitro-raised plants revealed well-differentiated anatomical structures. The midveins observed were prominent, with vascular bundles embedded within parenchymatous ground tissue. The upper and lower epidermis were distinctly visible, along with the cuticle (Figure 6a,b). Beneath the epidermis, the hypodermis, which was composed of thick-walled cells, and the cortex, which had loosely arranged parenchymatous cells, were distinctly visible (Figure 6c). Sclerenchymatous cells were seen around the vascular bundle (Figure 6a,b). The leaf lamina portrayed multiple vascular bundles, homogenous mesophyll cells, and raphides (Figure 6b). Collateral vascular bundles were well organized, exhibiting xylem and phloem differentiation (Figure 6d). Stomata development was observed on the abaxial leaf surface (Figure 6e).
The TS of V. coerulea roots from in vitro regenerants exhibited well-defined root structures essential for nutrient uptake and adaptation (Figure 7). The exo-velamen and endo-velamen layers were clearly visible, consisting of multiple layers of dead cells (Figure 7a,b). Beneath the velamen, the exodermis was arranged in a ring composed of thick-walled cells. The cortical region showed parenchymatous cells with large intercellular spaces (Figure 7a). The endodermis, pith, and vascular cylinder, consisting of the xylem and phloem, were well organized (Figure 7c). Further insights into the stele revealed the presence of a pericycle located just beneath the endodermis, which was composed of compact parenchymatous cells. The xylem consisted of thick-walled cells responsible for water conduction, while the phloem appeared as a cluster of thin-walled cells facilitating nutrient transport. Furthermore, sclerenchymatous tissue was prominently seen surrounding the vascular bundles (Figure 7d).

3.5. Genetic Stability Assessment of In Vitro-Propagated Plants

Ensuring the genetic fidelity of the micropropagated plants becomes essential when the primary regenerants are intended as the end product for commercial and conservational purposes. In the present study, four different marker systems—RAPD, ISSR, iPBS, and SCoT—and flow cytometry were employed to assess the genetic homogeneity between in vitro-raised V. coerulea and the mother plant.

3.5.1. RAPD, ISSR, iPBS, and SCoT Markers’ Profiles and Molecular Polymorphism

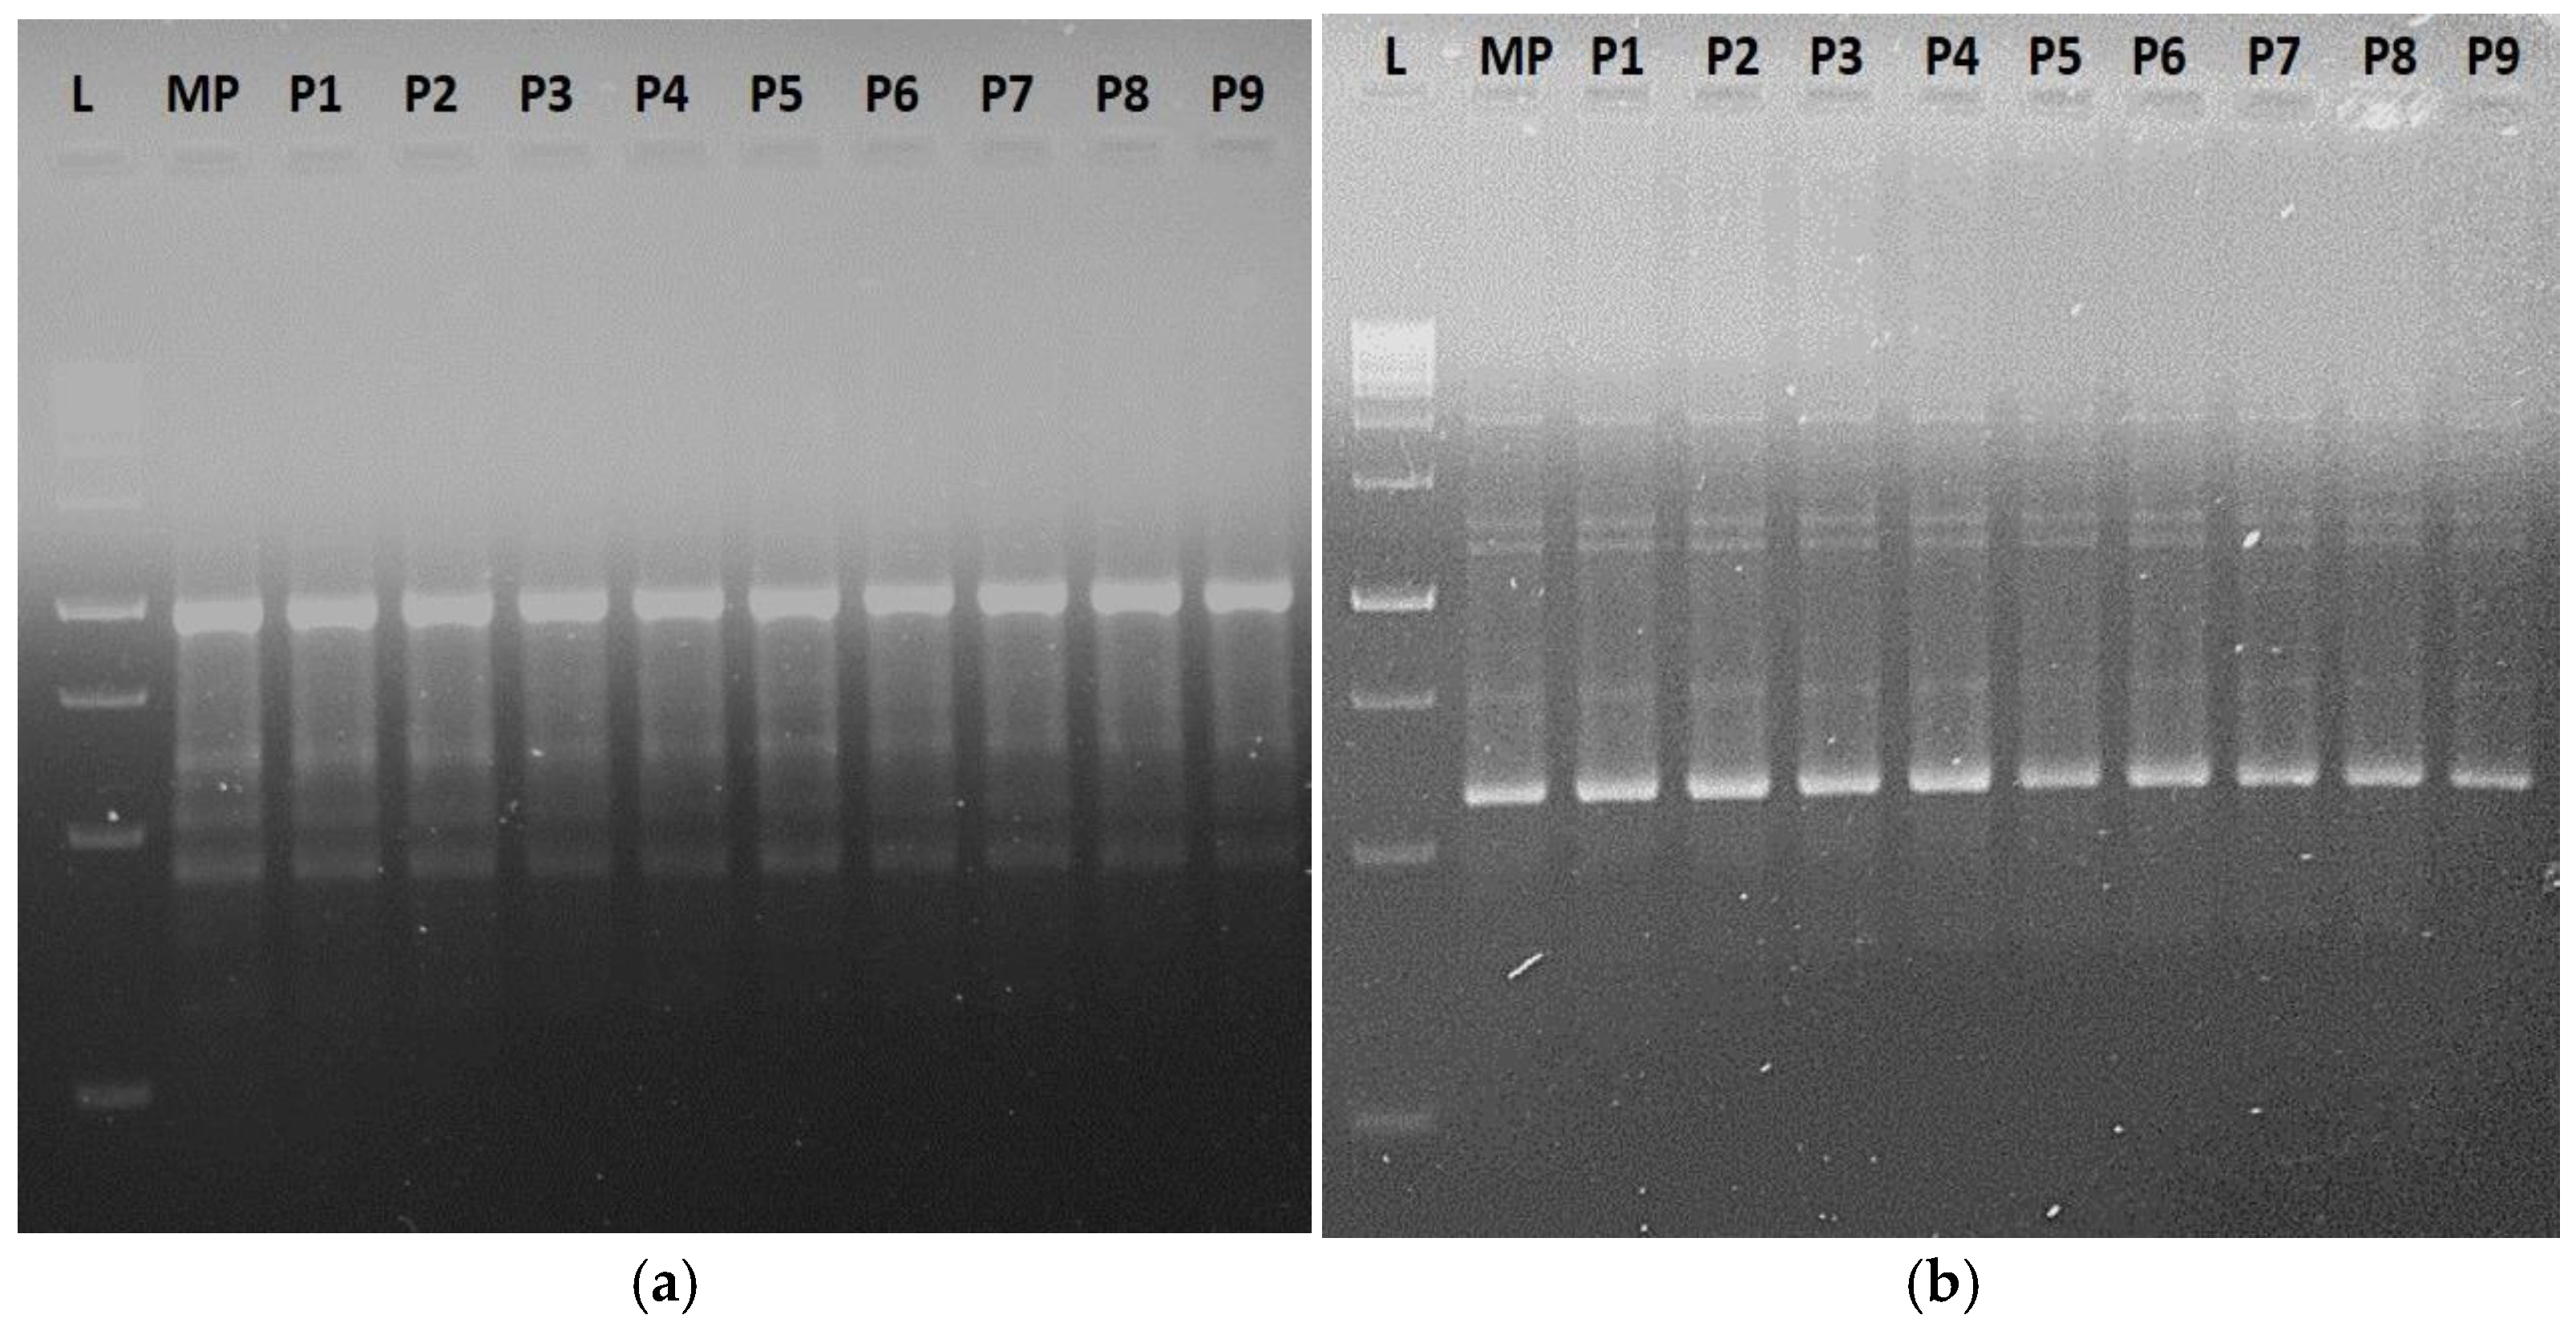
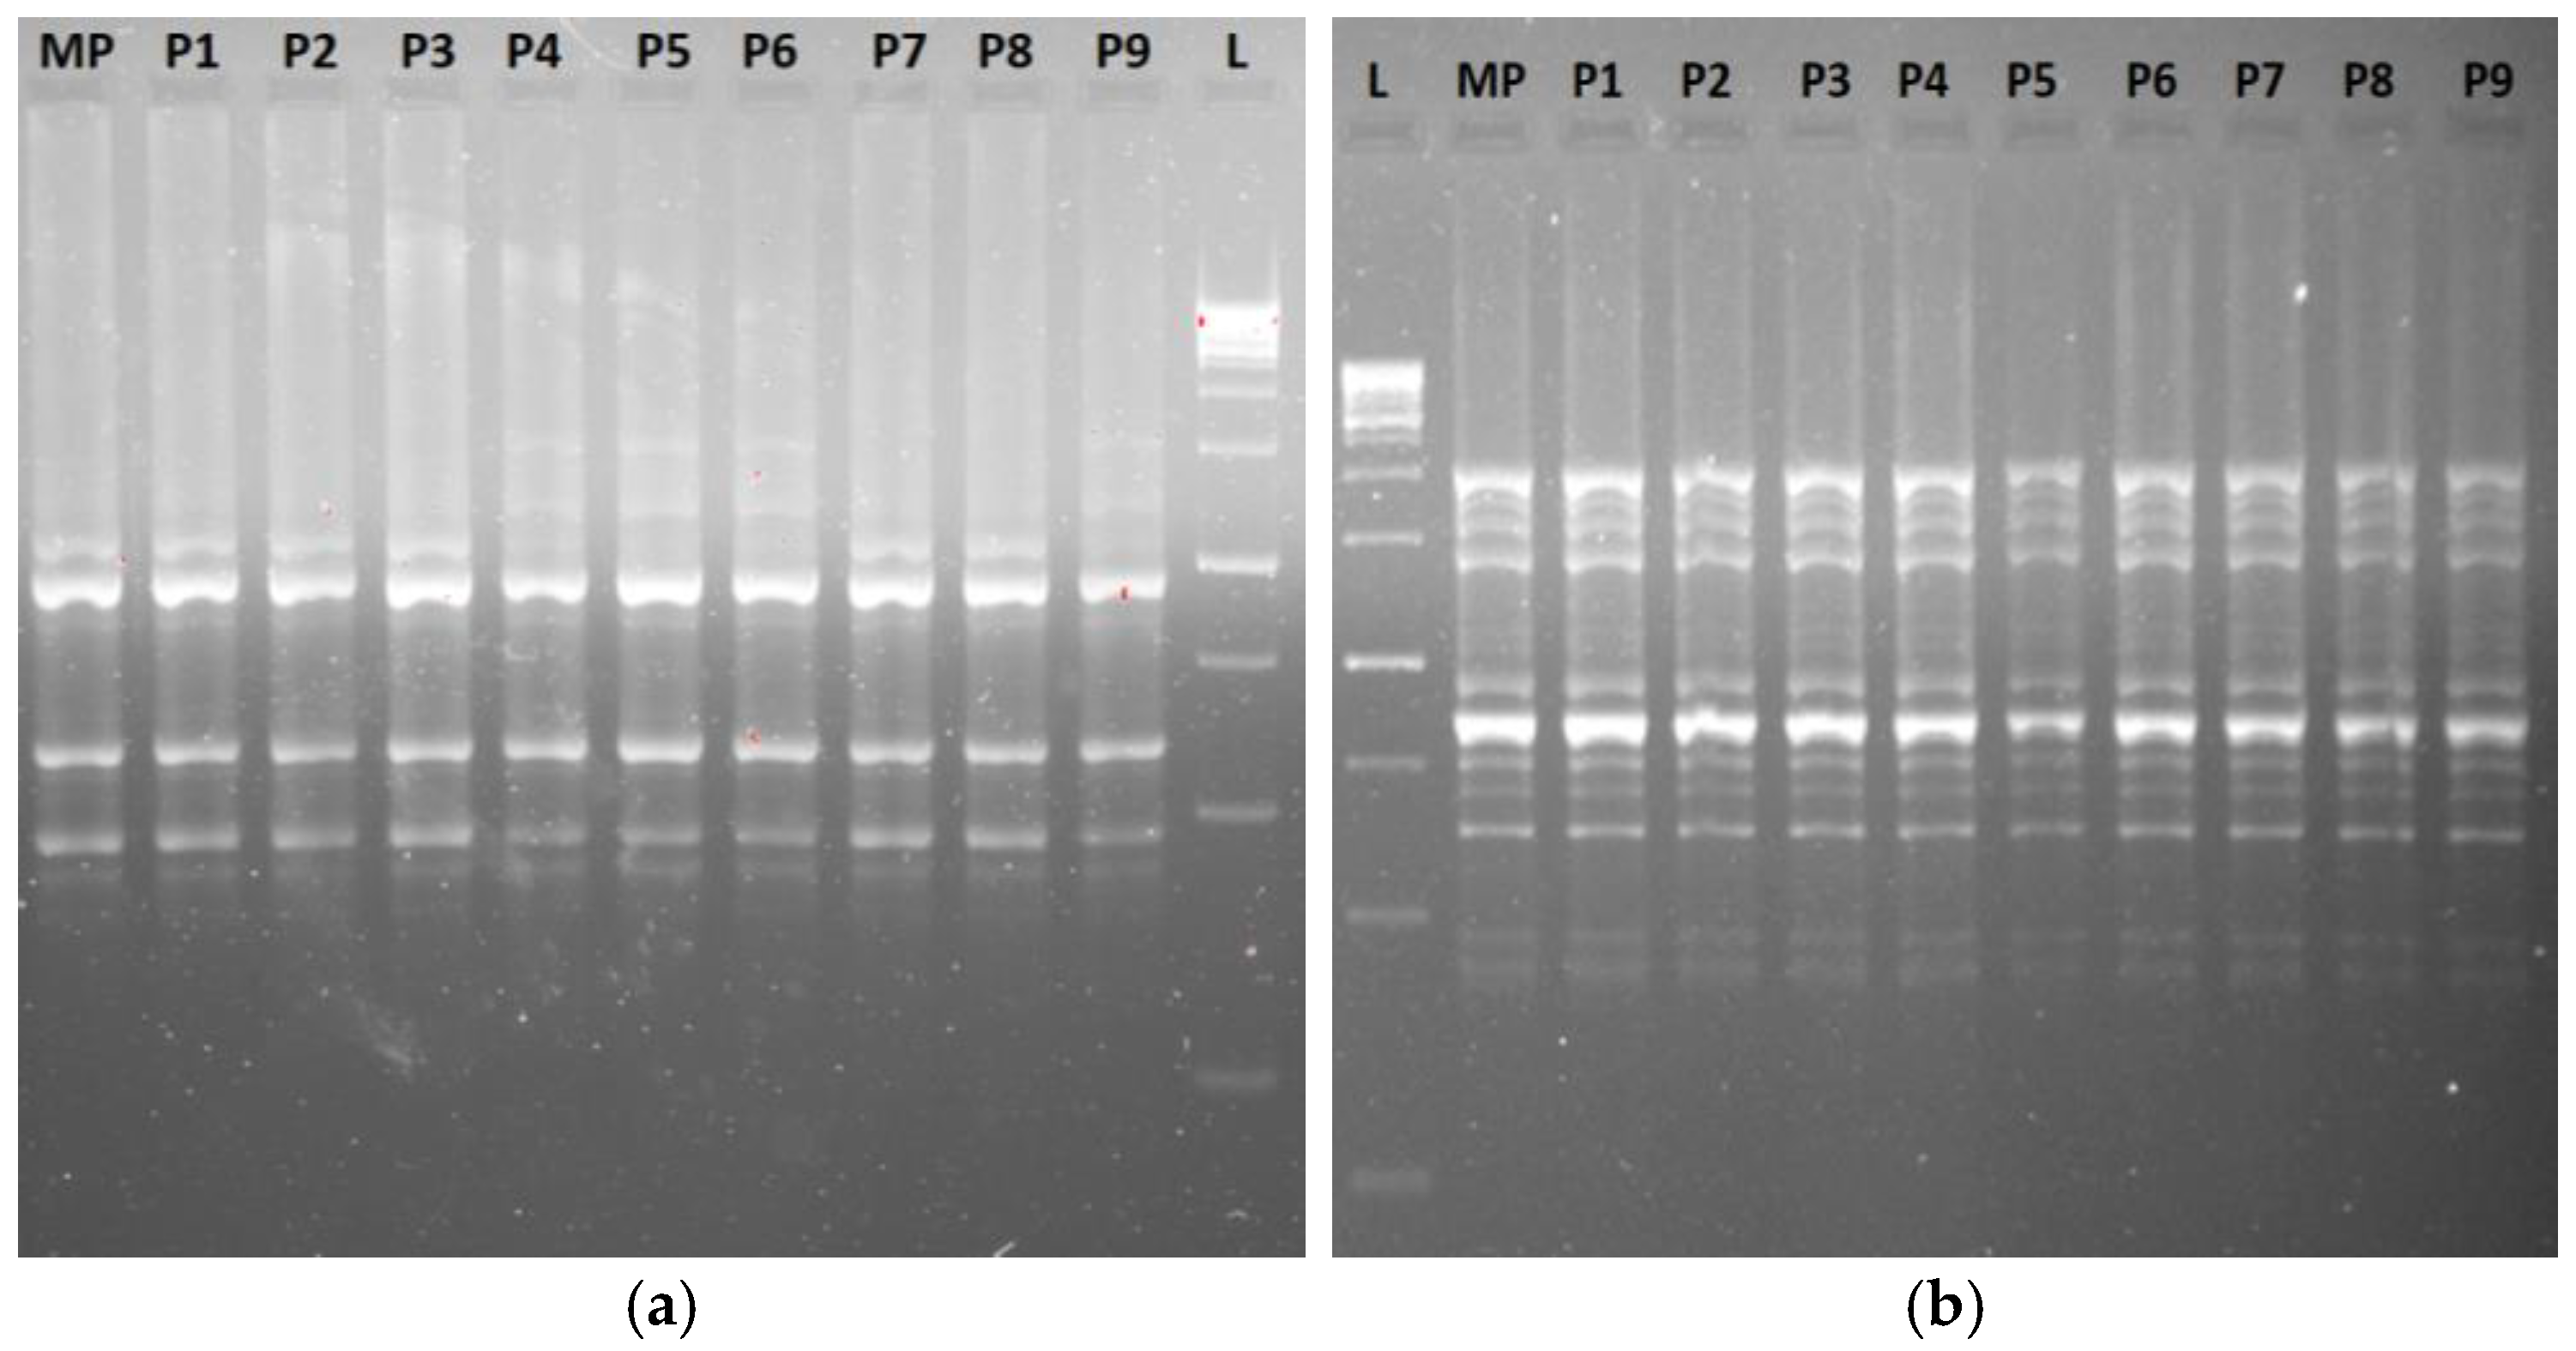
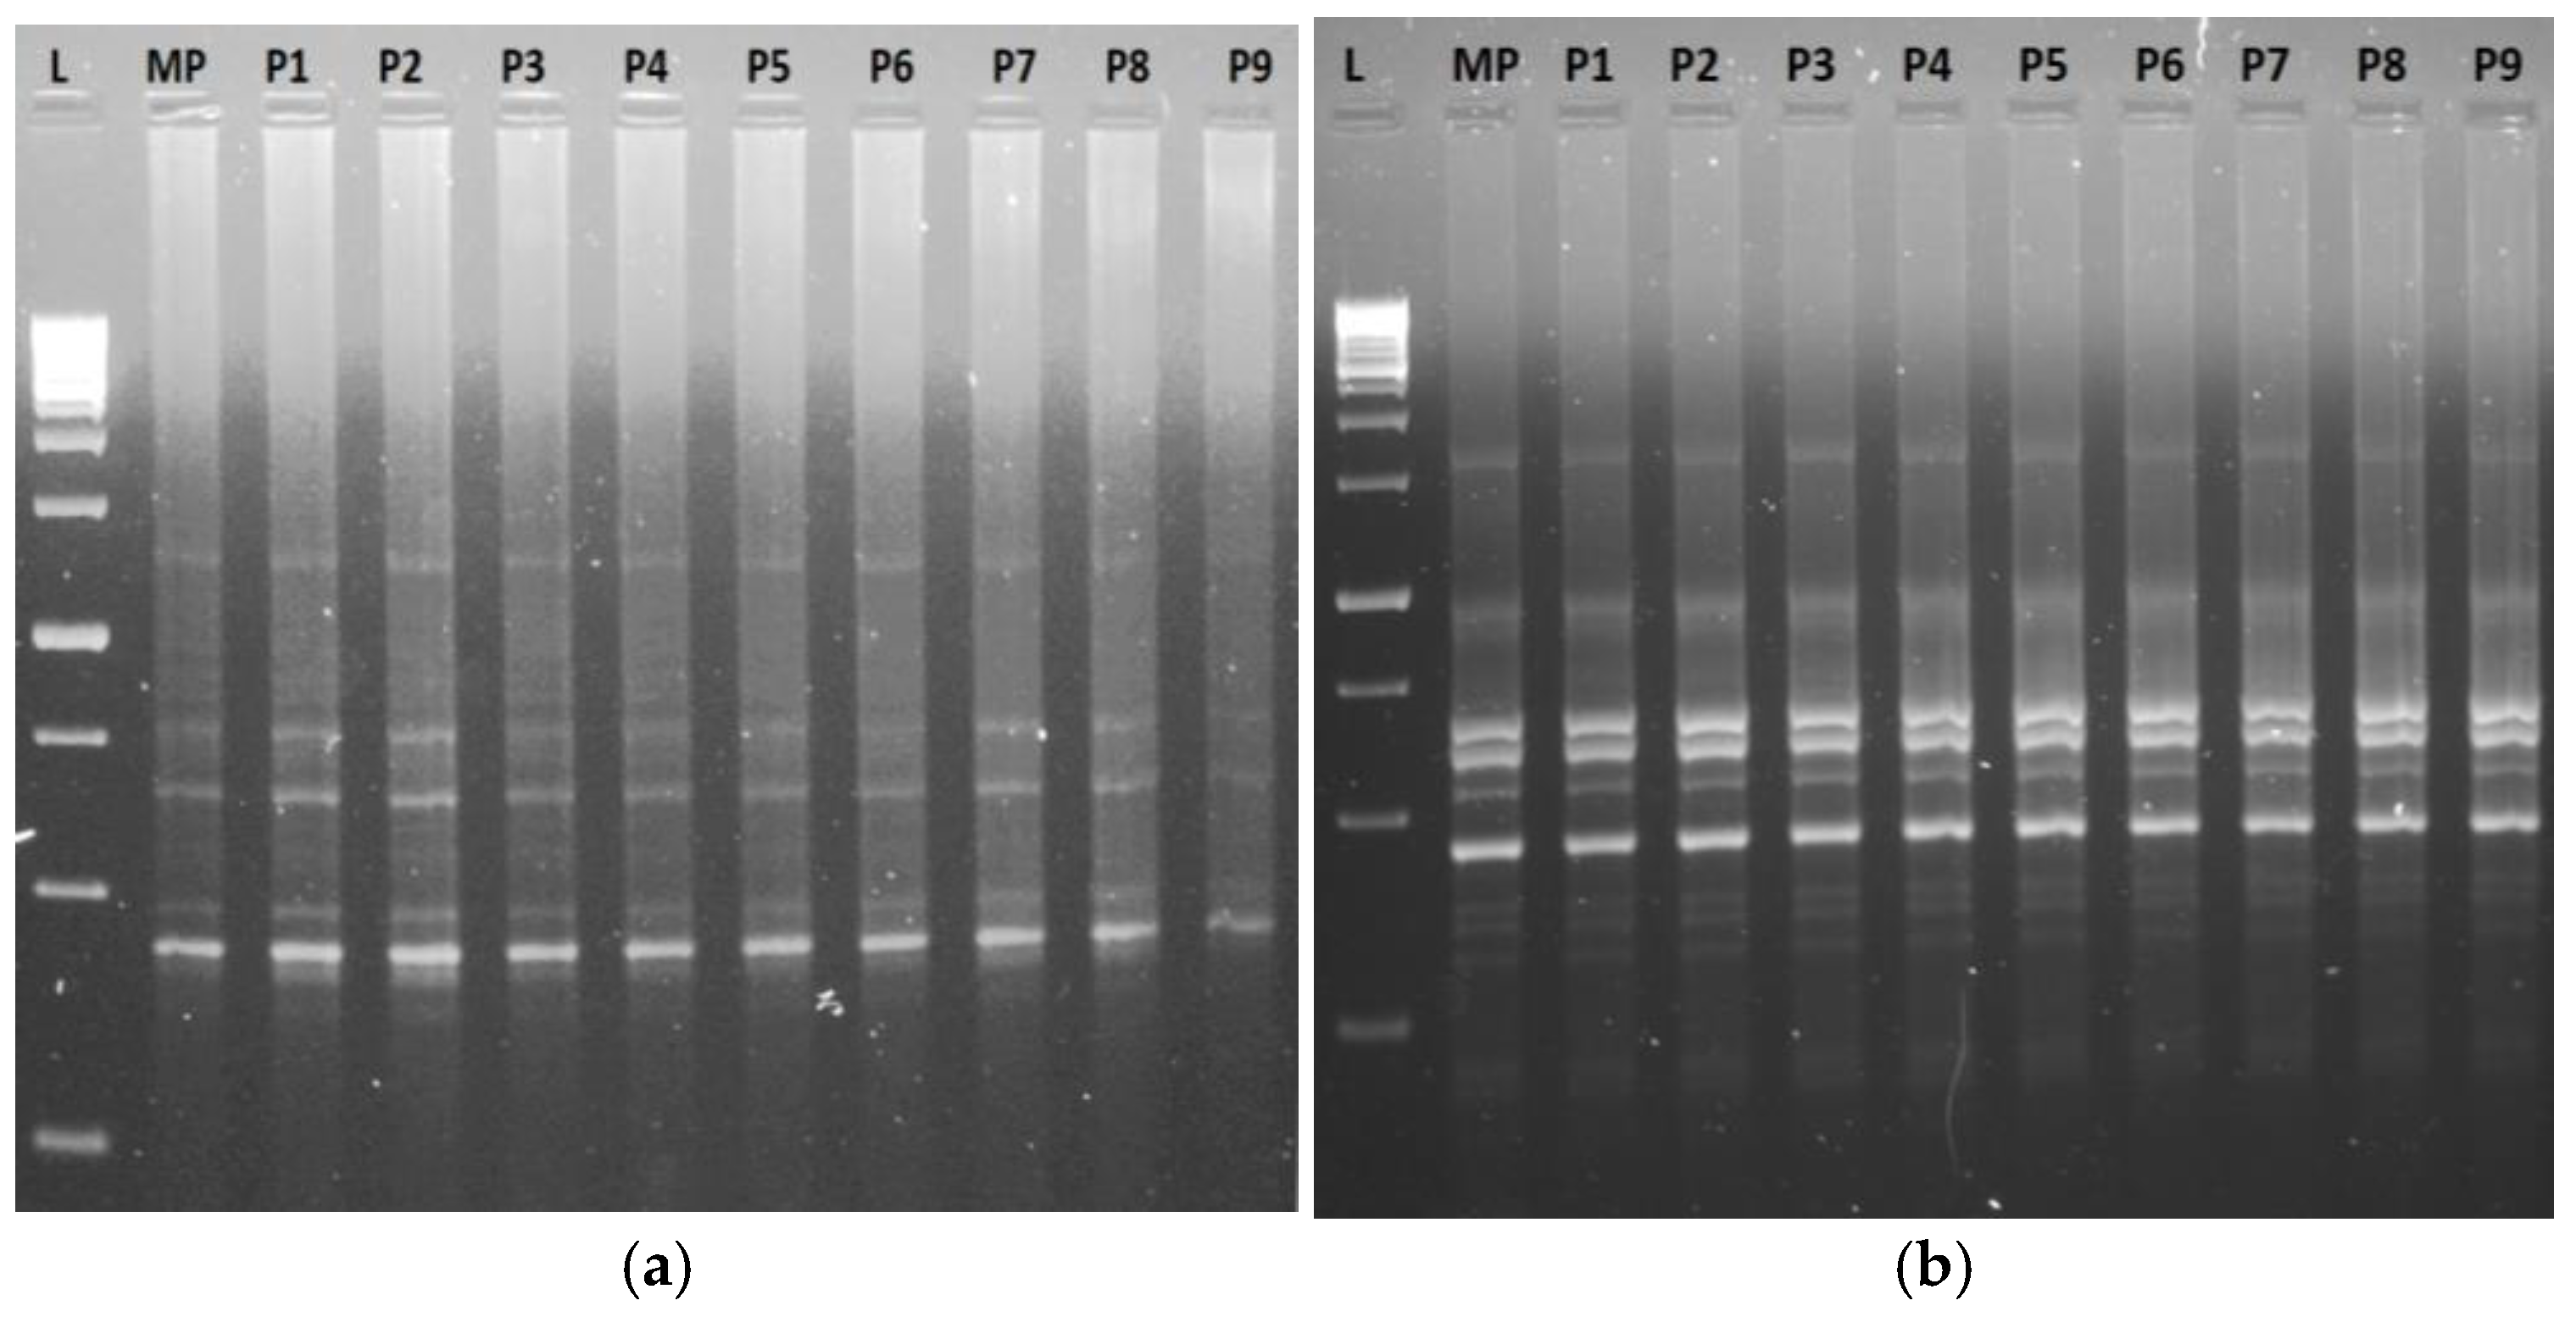
The banding profiles generated by RAPD, ISSR, iPBS, and SCoT markers provided valuable insights into the genetic stability of micropropagated orchids. The low polymorphism rate recorded by the four marker systems indicated a high level of genetic uniformity among the clones. The ten selected RAPD primers produced 51 bands, producing an average of 5.1 bands per primer. Of the total bands, fifty bands were monomorphic, resulting in a monomorphism of 97.50%. Except for OPA-05, which recorded one polymorphic band, the other nine RAPD primers revealed 100% monomorphism (Table 3, Figure 8). The sizes of the amplified bands ranged between 250 and 2000 bp.
Amplification using ten screened ISSR primers generated 65 distinct bands, yielding an average of 6.5 bands per primer. Of the sixty-five bands, sixty-two were monomorphic, leading to a monomorphism of 97.27% (Table 4). UBC-824 produced the highest number of scorable bands (11) and identified three polymorphic bands (Table 4). All other ISSR primers resulted in 100% monomorphism (Table 4; Figure 9). The amplified ISSR bands varied in size, ranging from 200 to 2000 bp.
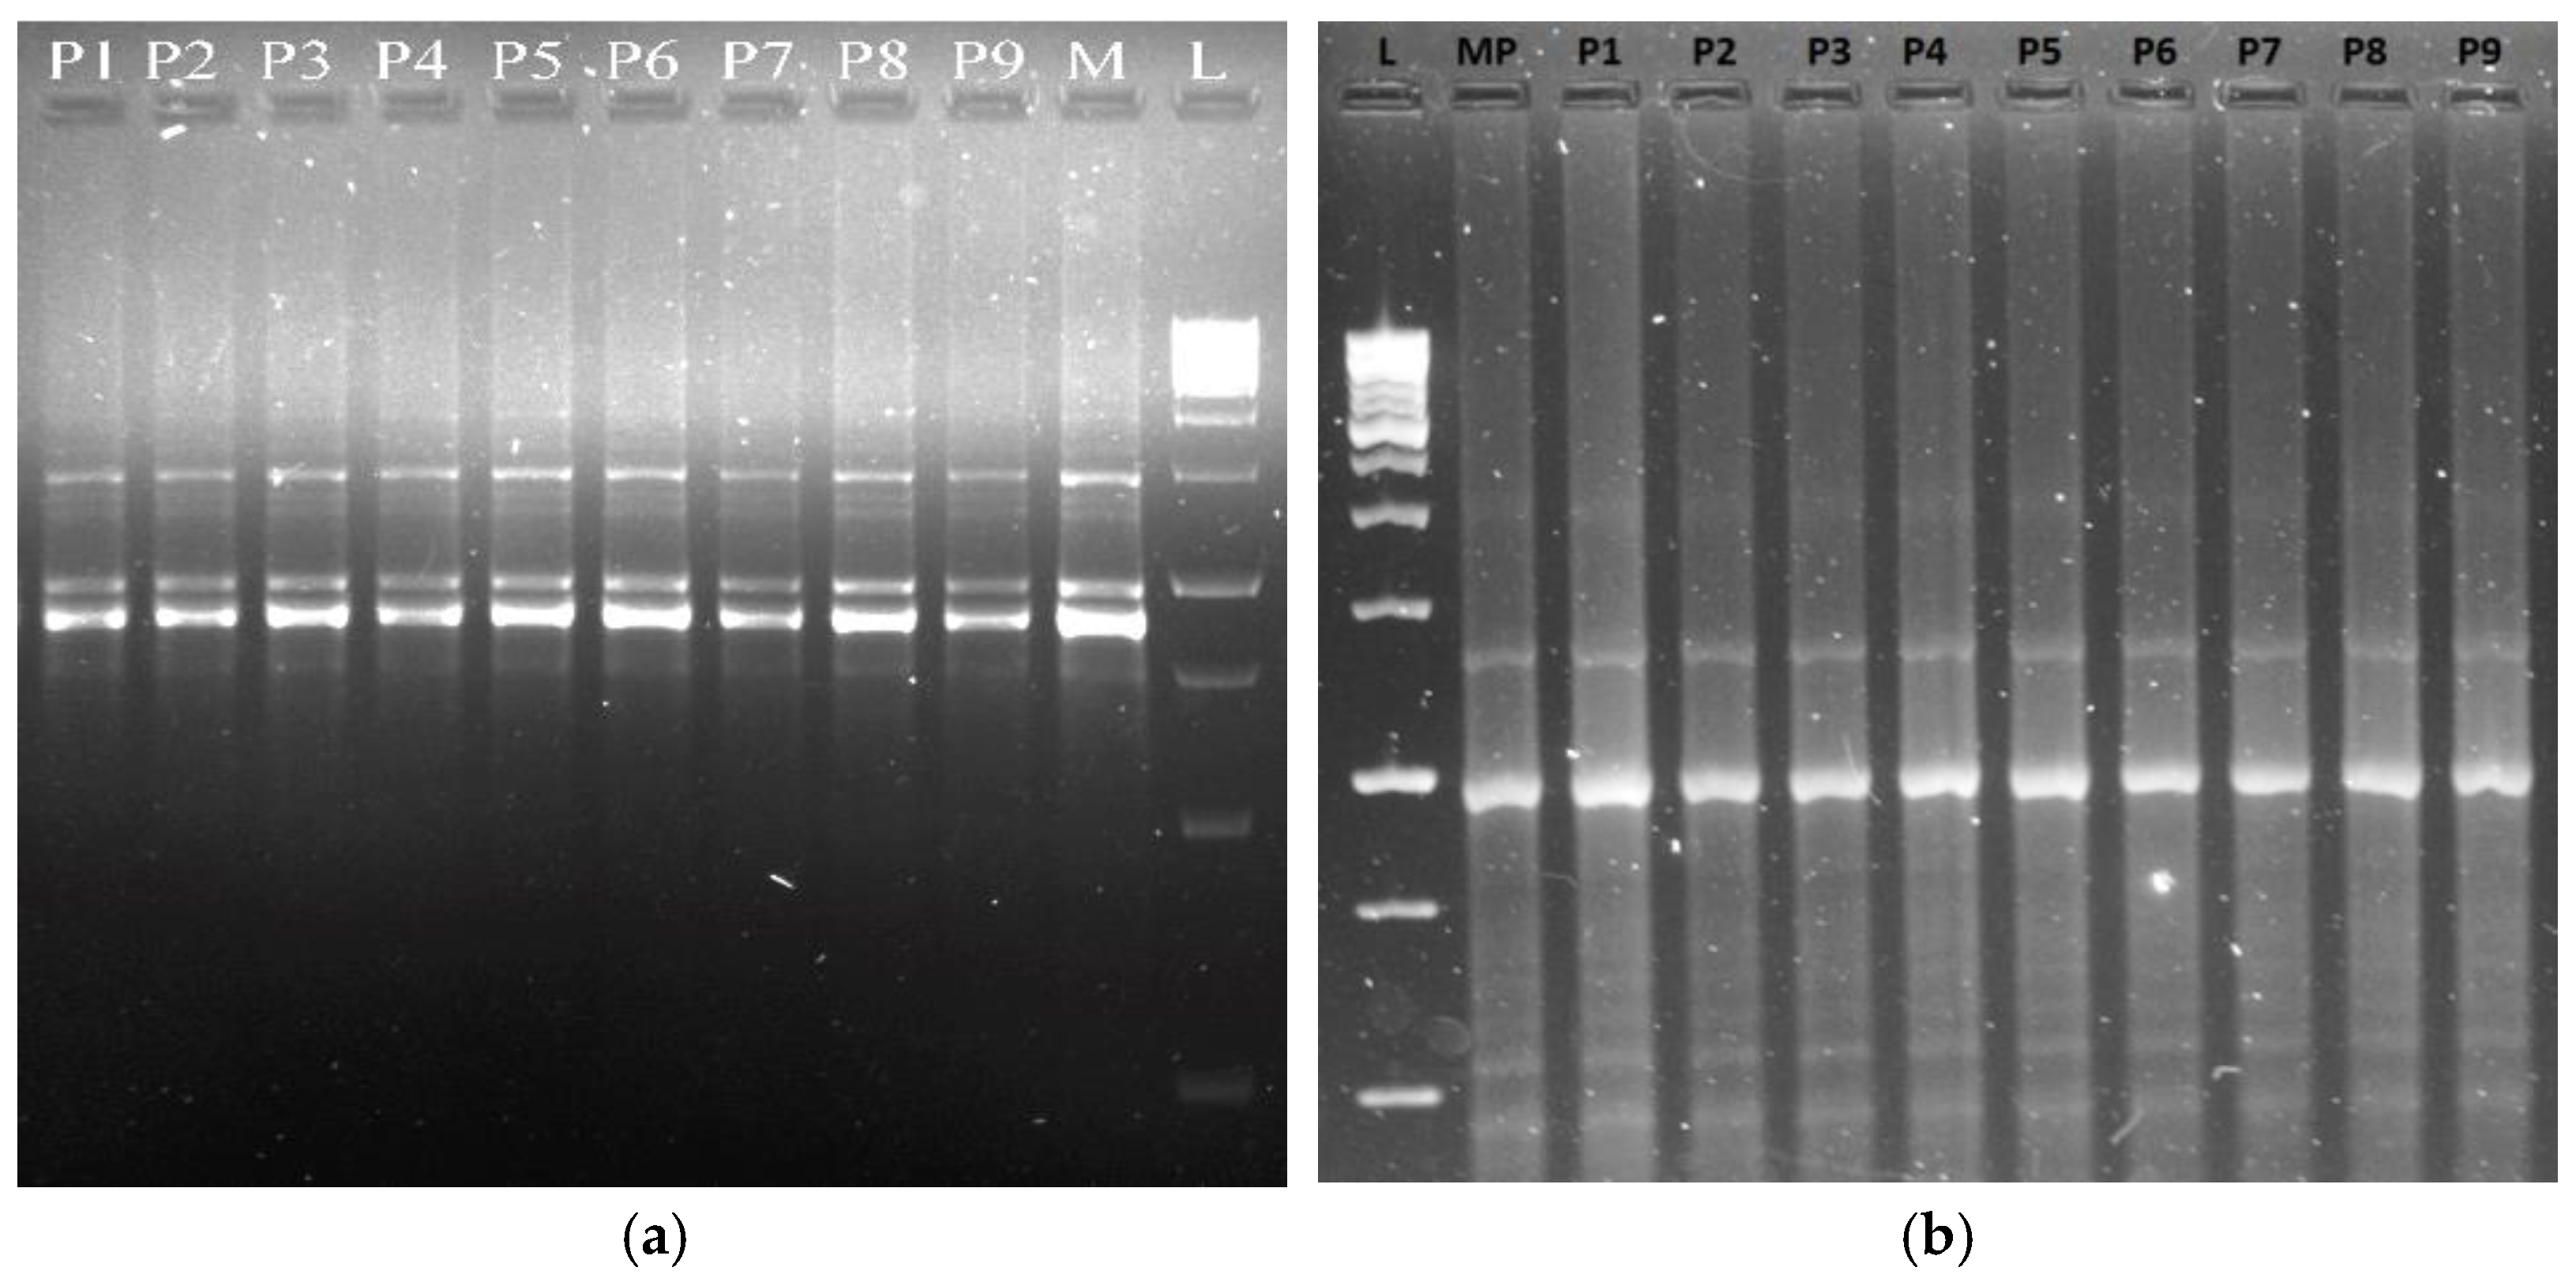
The eleven selected iPBS primers amplified 73 bands, yielding about 6.6 average bands per primer. Of the total amplified fragments, seventy-two bands were monomorphic, reflecting a high monomorphism of 98.86% (Table 5). Amplification by iPBS-2077 detected one polymorphic band out of the eight amplified fragments, while the highest number of amplified bands, totaling thirteen, with 100% monomorphism, was detected by iPBS-2392 (Table 5; Figure 10). Amongst the iPBS primers, iPBS-2392 produced the lowest number of amplified bands, totaling three. All the amplified bands exhibited a size range of 250 to 2000 bp.
The amplification of the genomic DNA using eleven chosen SCoT primers generated 58 bands, scoring an average of 5.3 bands per primer. Of the total amplified bands, fifty-six bands were monomorphic, resulting in a monomorphism of 97.73% (Table 6). SCoT-S5 produced two polymorphic bands with 75% monomorphism, while the remaining ten SCoT primers produced 100% monomorphism (Table 6; Figure 11). The size of amplified bands ranged between 250 and 2000 bp of the DNA ladder.

3.5.2. Genetic Distance and Cluster Analysis

The genetic distance among the mother plant (MP) and in vitro-regenerated plants (P1–P9) of V. coerulea was analyzed using a pooled RAPD, ISSR, iPBS, and SCoT markers dataset. Nei’s genetic distance matrix among the MP and regenerated plants was consistently low, with values ranging from 0.000 to 0.039, indicating a high degree of genetic similarity among the samples (Supplementary Table S1). The smallest genetic divergence was noticed between the MP and P1 (0.004). Conversely, P9 showed the highest genetic distance (0.039) from the MP. Moreover, the MP displayed high genetic similarity (0.962–0.996) with the regenerated plantlets (P1–P9). The highest (0.996) similarity was observed between the MP and P1 while the lowest (0.962) was seen between the MP and P9 (Supplementary Table S1). The overall low genetic variation confirmed the effectiveness of in vitro propagation in maintaining genetic homogeneity.
The dendrograms constructed using UPGMA clustering based on Nei’s genetic distance offered valuable information into the genetic relationships among the propagated plants (P1–P9) and the mother plant (MP) of V. coerulea. The dendrogram from RAPD analysis exhibited high genetic similarity among the samples. The clustering pattern revealed that all regenerated plantlets (P1–P9) formed a distinct clade closely associated with the mother plant (MP), with minimal genetic distance (Supplementary Figure S1a). Furthermore, the cophenetic correlation coefficient (CCC) of 0.999 for RAPD confirmed a nearly perfect correlation between the genetic distance matrix and hierarchical clustering. The UPGMA dendrogram generated from ISSR analysis showed the in vitro regenerants (P1–P9) grouped into two primary clusters. One of the main clusters consisted of two sub-clusters, one consisting of the MP and P1 and the other comprising P4 and P5. On the other hand, the remaining plantlets (P2, P3, P6, P7, P8, and P9) formed the other main cluster (Supplementary Figure S1b). A high CCC (0.999) of ISSR analysis showed great accuracy in clustering and minimal or no distortion from the actual genetic distances. The dendrogram created using iPBS markers separated the clones (P1–P9) and the MP into two distinct groups. One cluster included the MP, P1, P2, P3, and P4, while the other remaining clones (P5, P6, P7, P8 and P9) were gathered in another cluster (Supplementary Figure S1c). The CCC (0.892) for iPBS also revealed the highly precise clustering and accurate representation of the genetic distance matrix. Furthermore, the SCoT-based UPGMA dendrogram generated two major clusters. One cluster comprised the MP, P1, P2, P3, P7, and P8, while the other cluster contained P4, P5, P6, and P9 (Supplementary Figure S1d). Similarly to the other three marker systems, the existence of a high CCC (0.892) for SCoT suggested exact and precise clustering, reflecting a closed genetic distance matrix. The dendrogram obtained from the pooled (RAPD + ISSR + iPBS + SCoT) data revealed two primary clusters with one grouping P1, P2, P3, P4, and the MP together, whereas the other cluster consisted of P5, P6, P7, P8, and P9. The closer bifurcating nodes (below 0.006 scale value) (Figure 12) reinforced the high genetic stability of regenerants and MP. The high CCC (0.806) further reflected that the dendrogram preserved the original genetic distances obtained from the pooled data.
The 2-dimensional PCoA based on the eigenvalue of the pooled data from the RAPD, ISSR, iPBS, and SCoT markers effectively visualized the genetic relationships among the micropropagated plantlets (P1–P9) and the MP in the two coordinates—Coord. 1(44.03%) and Coord. 2 (67.35%) (Supplementary Figure S2). The distribution of the in vitro clones and the MP in the PCoA plot aligned with the clustering pattern depicted by the UPGMA dendrogram obtained from pooled marker data.
The scatter plots representing the Mantel test result compared the genetic distance matrices of individual marker systems (RAPD, ISSR, iPBS, and SCoT) against the pooled data (RAPD + ISSR + iPBS + SCoT). A non-significant correlation of R2 = 0.0826 (p = 0.112) was observed between RAPD and the combined data (Supplementary Figure S3a). Conversely, correlation analysis between the ISSR and pooled data yielded an R2 value of 0.5314 (p = 0.001) (Supplementary Figure S3b). iPBS, on the other hand, manifested a weak, non-significant correlation (R2 = 0.0523; p = 0.155) with the combined data (Supplementary Figure S3c). Similarly to ISSR, the Mantel test between the SCoT marker and pooled (RAPD + ISSR + iPBS + SCoT) data displayed a significant correlation (R2 = 0.375; p = 0.001) (Supplementary Figure S3d).

3.5.3. Flow Cytometry Analysis of the Micropropagated Plants and the Mother Plant

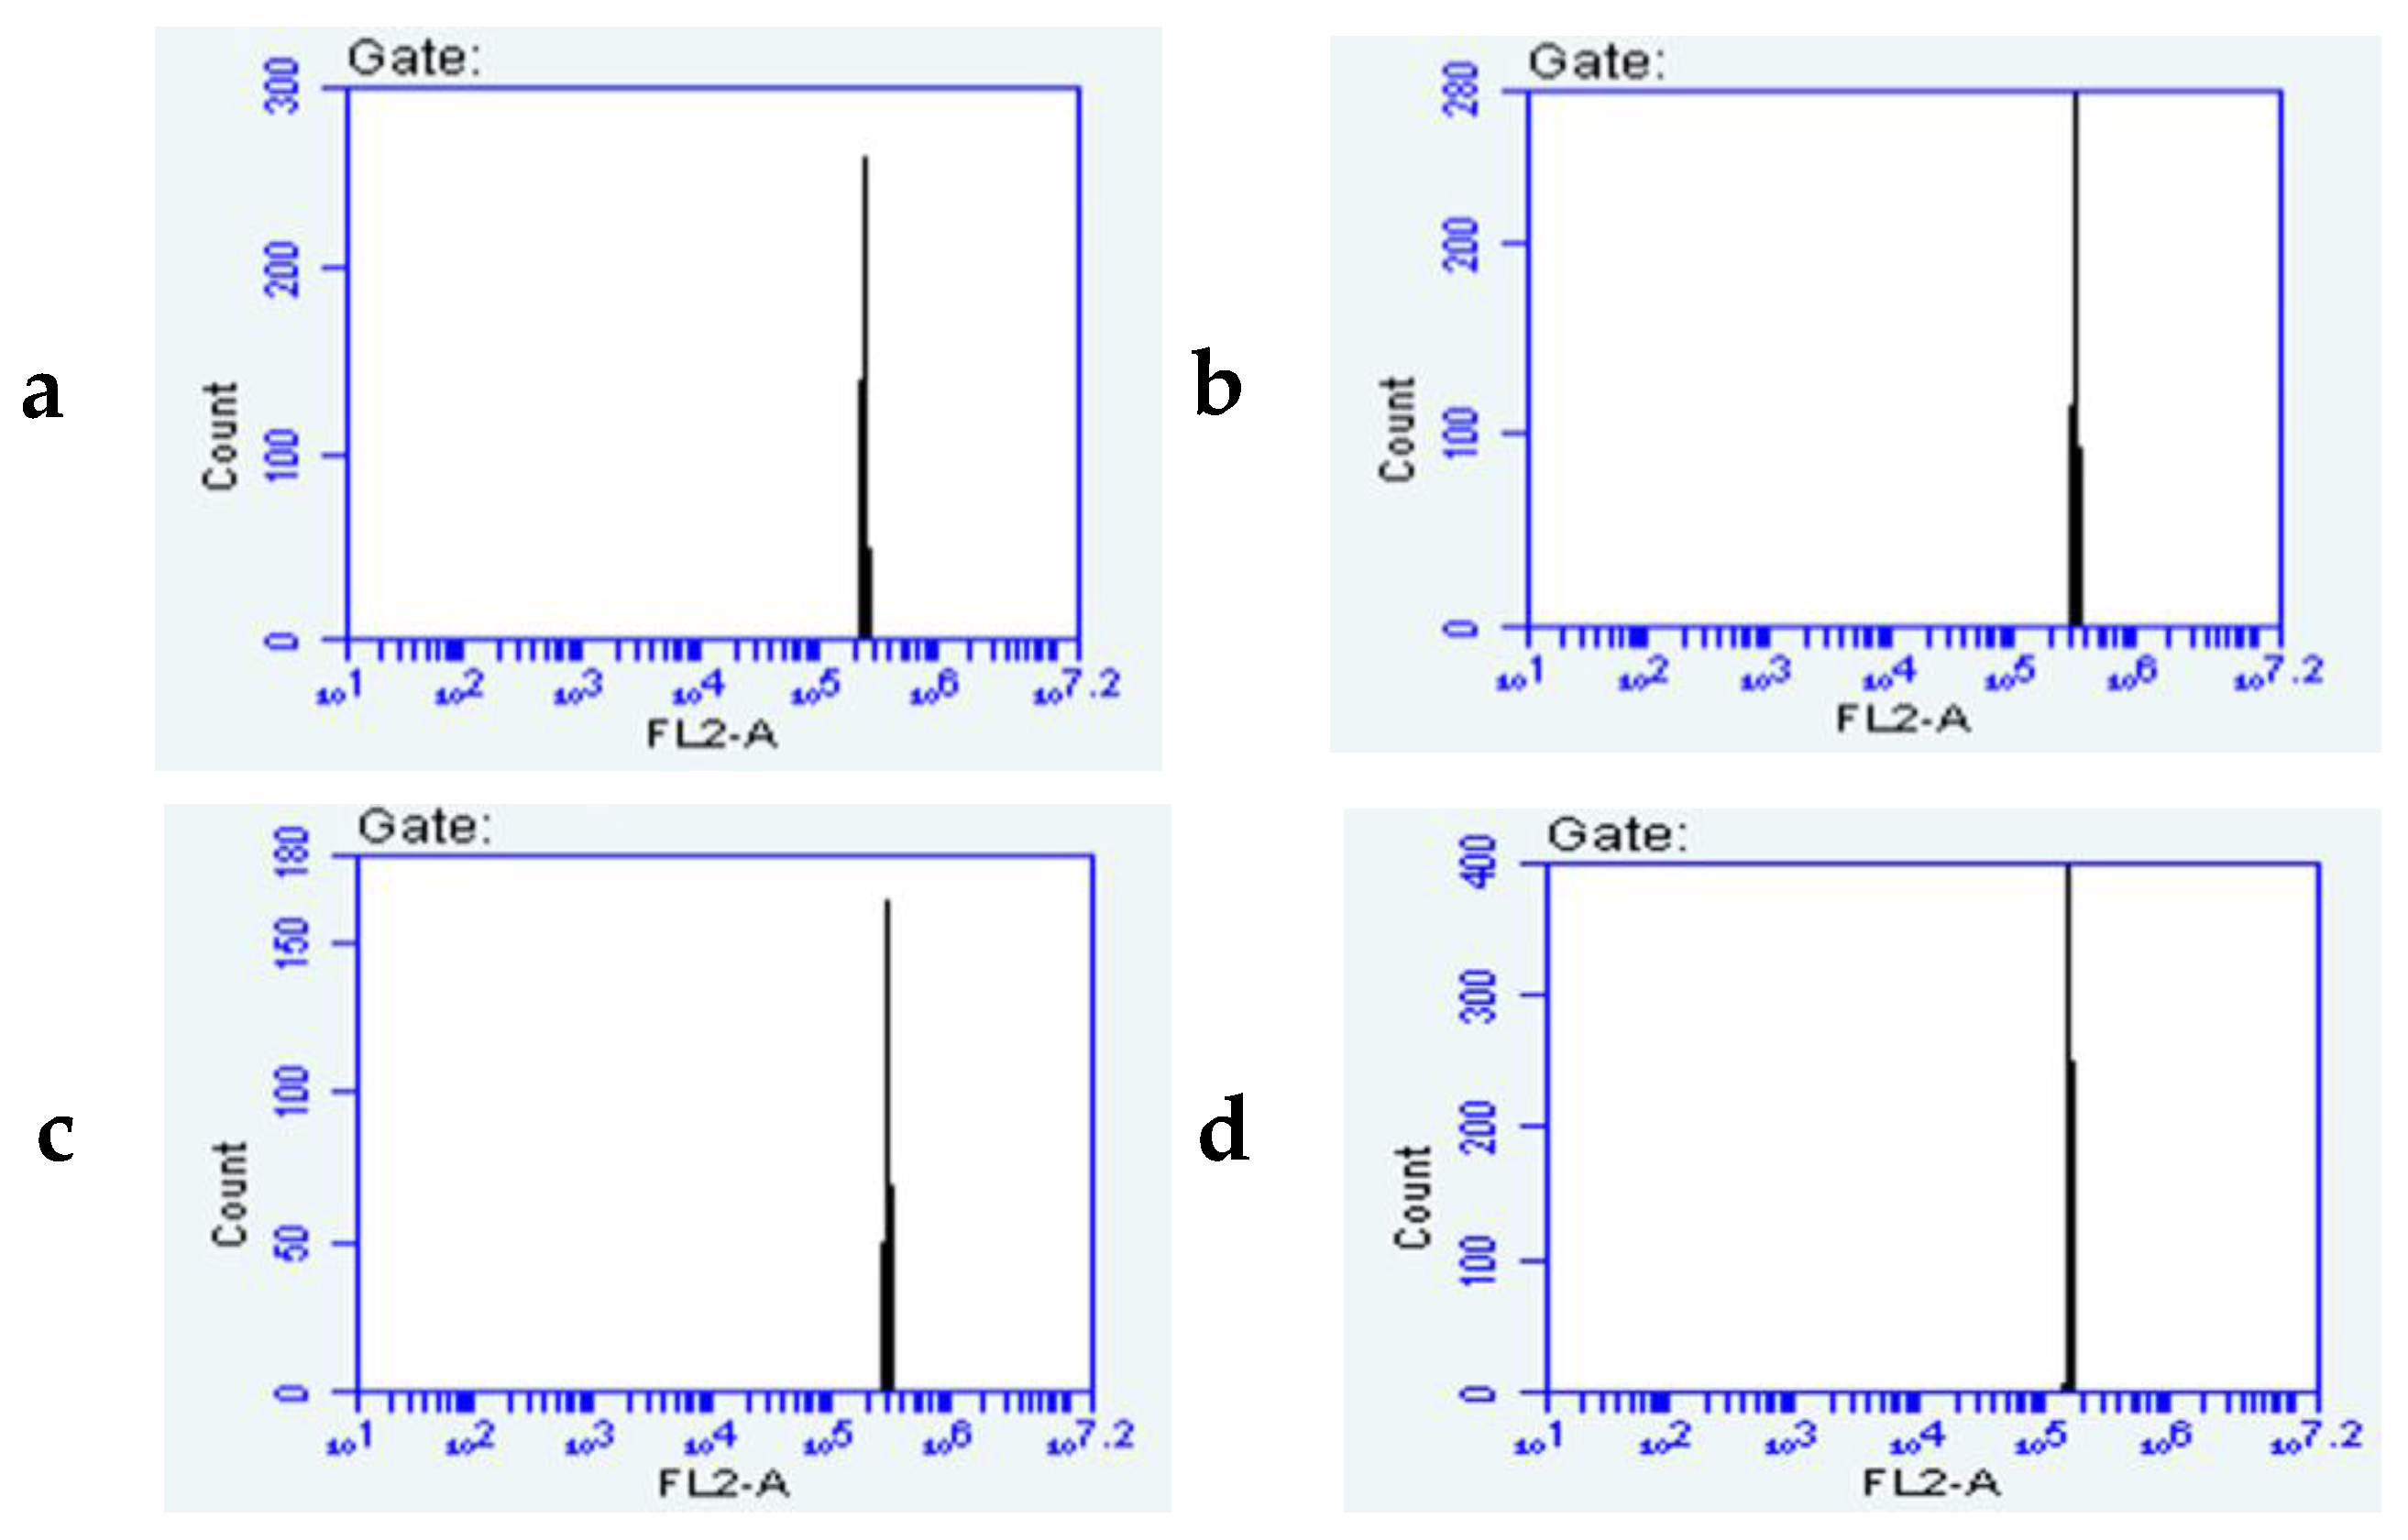
Flow cytometry analysis was conducted to evaluate the genetic stability of the MP and three randomly selected in vitro-regenerated plants (R1–R3). The observed mean fluorescence intensity (FL2-A) of the MP represented the reference for comparison (Supplementary Table S2). The regenerated plants revealed minor fluorescence differences, indicating overall genetic stability. R1 displayed the highest FL2-A value, while R2 showed a moderately increased FL2-A. In contrast, R3 exhibited a lower FL2-A than the MP (Supplementary Table S2). The coefficient of variation (CV FL2-A) remained low across the MP and the in vitro regenerants (4.37–4.94%).
The histogram peaks for all the regenerated plants and the MP were recorded between 105 and 106 in the FL2-A (X-axis) (Figure 13a–d). The flow cytometric profiles presented a single, well-defined peak corresponding to the G1 phase (Figure 13).

4. Discussion

4.1. In Vitro Propagation of V. coerulea

The present investigation showed successful asymbiotic seed germination on basal Mitra medium without growth hormones. Many suitable basal media have been used earlier for the in vitro seed germination of V. coerulea, showing varied germination responses [44]. While Murashige and Skoog (MS) medium produced the highest germination rate compared to B5 and Knudson C (KC) media [2], other studies reported that B5 and Phytamax media give the highest seed germination rate [3,18]. Although MS media are widely used for the in vitro propagation of varied categories of plants, the high level of ammonium ions (1650 mgL−1 as NH4NO3 in standard MS media) causes toxicity and helps elevate the ethylene levels, which further causes hyperhydricity, reducing shoot and root induction [52]. The high ammonium concentration also causes toxicity and stunted growth in the culture [52,53]. Additionally, the rich nitrogen in the MS medium was reported to play a less significant role in the seed germination process when compared to other nutrients present in the Mitra medium [54]. While the Mitra medium, specially designed for orchid propagation, uses a lower concentration of ammonium ions (100 mgL−1 as NH4SO4) [45], the inclusion of riboflavin, biotin, and folic acid in it provides extra stimulation to seed germination [55,56]. Mitra medium, characterized by a relatively high level of phosphate ions, was shown to positively influence the germination of asymbiotically grown orchid seeds [54].
In the present study, protocorm was induced in the basal medium, but the transition from seeds to protocorms was delayed. However, the incorporation of PGRs in the medium enhanced protocorm formation and development in the culture. Earlier studies on the in vitro propagation of V. coerulea also reported the importance of growth hormones on protocorm multiplication and the development of protocorm-like bodies (PLBs) [2,3,17]. While the exogenous supply of cytokinins to the single protocorm cultured in B5 medium stimulated the formation of PLBs, the basal medium devoid of cytokinin failed to develop PLBs. Superior protocorm formation in different types of media appended with the combination of BAP or KN with auxins (IAA, IBA, and NAA) was also reported [3,57,58]. Using undehisced capsules as the source of explants, the phytamax medium incorporated with NAA (5.36 μM) and BAP (3.80 μM) proved to be the most effective for maximum PLB regeneration [3]. The pronounced effect of PGRs at different stages of protocorm development in the in vitro propagation of Dendrobium fimbriatum may act in a manner similar to endophytic fungi [57]. Novak and Whitehouse [58] also discussed the importance of auxins in protocorm formation by inhibiting polar auxin transport in Spathoglottis plicata during embryo development. Similar findings have been reported in other orchid species, where cytokinin–auxin interactions influence protocorm induction and subsequent shoot regeneration [59].
The current study demonstrated delayed shoot apex formation and low shoot multiplication in the basal medium compared to other treatments, highlighting the importance of exogenous PGRs in promoting efficient shoot induction. The failure to induce shoots in half-strength basal MS medium and the medium supplemented with 8.88 μM BAP and 4.70 μM KN underscored the critical role of selecting appropriate concentrations and combinations of PGRs [60]. In agreement with our observations, earlier work on V. coerulea demonstrated that high concentrations of PGRs negatively affected protocorm and shoot apex development [2]. Consistent with our findings, previous studies in other orchid species have also shown the suppression of shoot formation under excessive auxin levels [47,61]. In Vanda tessellata, the average shoot multiplication rate decreased from 13.19 shoots per explant (SPE) on a medium augmented with 1.0 mg L−1 BAP and 1.5 mg L−1 NAA to 3.30 SPE when both BAP and NAA were applied at higher concentrations (2.0 mg L−1 each) [62]. A similar trend was noticed in our study when elevated concentrations of KN combined with NAA, KN, or IAA were tested.
A short shoot length followed by a leafy growth pattern could be attributed to the strong apical dominance exhibited by monopodial orchids like Vanda, which is crucial for their growth [63]. A higher mean number of leaves per plantlet was formed in the medium fortified with 3.2 mgL−1 KN and 1.8 mgL−1 IAA. The positive effect of KN on shoot and leaf growth and their multiplication in V. pumila had also been previously described [64]. Also, the formation of the highest average leaf length (5.03 cm/explant) in the medium supplemented with KN and auxin was seen in Phalaenopsis circus [65]. The non-significant differences in leaf length growth among the various treatments could be ascribed to the positive combined effect of cytokinins and auxins, which are essential for leaf formation and organogenesis. Several studies have also reported the synergistic effect of cytokinins and auxins in leaf tissues and organ development [66,67].
The superior rooting response observed with IAA in the present investigation may be attributed to its primary role in regulating cell elongation and differentiation during the early stages of root development [68]. A previous study on D. thyrsiflorum showed the highest root formation (4.85 ± 0.75) in KN- and IAA-enriched medium [69]. Similarly, an IAA-containing medium generated the highest root number in V. pumila [64]. NAA, however, showed variable effects depending on its combination with either BAP or KN, suggesting that its efficiency in root induction depended on the concentration and types of cytokinin. The adverse impact of NAA on root formation in the BAP- and KN-enriched medium was also noted in Ansellia africana [70]. Since cytokinin and auxin interact both synergistically and antagonistically during plant development, exogenously supplied cytokinin can inhibit the growth of primary roots in some plants [71,72,73,74,75]. The reduction in root elongation in BAP- and auxin-containing medium in the present study could also be ascribed to the inhibitory effect of BAP. Functionally, cytokinin negatively regulates the quiescence center—a group of dividing cells that promote the stem cell status in the root, thereby reducing cell number in the meristem [76,77,78]. The enhanced growth and development of shoots, leaves, and roots in KN-incorporated media highlighted its effectiveness in plantlet establishment, making it a preferred choice for optimizing the in vitro propagation of V. coerulea.

4.2. Morpho-Anatomical Characterization of Micropropagated Plants

The morphological progression observed during the germination of V.coerulea aligned with established patterns in orchid seed development. Swelling of the seed coat due to hydration and imbibition was also observed in the seeds of V. coerulea [2,3], and V. dearei [79]. This stage is critical, marking the transition from seed dormancy to active development [80]. The appearance of greenish protocorms in this study reflected the onset of autotrophic capability, a tightly regulated process that significantly contributed to seed survival [81]. These structures serve as the foundation for shoot and root formation [82,83].
Despite the widespread application of tissue culture techniques, low survival rates in vitro-raised plants remain a significant challenge. These limitations are primarily attributed to the unique growth conditions of in vitro cultures, which include an aseptic environment, a nutrient-rich medium with abundant sugars, and elevated humidity levels [47]. Under such conditions, many physiological functions are either not fully developed or are considerably diminished, rendering the plants poorly adapted to standard environmental conditions and necessitating a critical acclimatization phase [84]. In vitro-derived plants often exhibit reduced stomatal functionality, inadequate epicuticular wax deposition, and impaired water transport systems [85], all contributing to rapid turgor loss and desiccation upon transfer to ex vitro conditions. However, these challenges can be mitigated through preparatory treatments that enhance acclimatization and minimize plant stress responses [86,87]. Anatomical characterization aids in understanding the physiological processes of plant species [88]. The prominent epidermal layer in the leaf TS of V. coerulea (Figure 6) indicated that the leaf had developed an outer protective barrier [89]. Furthermore, the development of important anatomical features—mid veins, collateral vascular bundles, homogeneous mesophyll cells, and stomata—was consistent with the leaf characteristics reported in the anatomical studies of wild Vanda orchids—V. spathulata (L.) Spreng., V. tessellata (Roxb.) Hook. ex G.Don, V. testacea (Lindl.) Rchb.f., and V. wightii Rchb.f. [90]. The leaf structural organization observed in the propagated V. coerulea corresponded with previous reports on leaf anatomical adaptations that facilitate physiological processes such as water transport, mechanical support, and gas exchange [91,92].
The well-developed root anatomical structures, evidenced in the present study, are in parallel with those of the roots of wild V. tricolor and V. flabellata [90,93]. The presence of velamen indicates the root’s ability to absorb and retain water, a characteristic feature of epiphytic orchids [94]. The thick-walled exodermis ring and well-spaced parenchymatous cells indicated the ability of the in vitro clones to develop root protection and selective water absorption, facilitate gas exchange, and enable water movement [95,96]. Furthermore, the well-organized endodermis, pith, and vascular cylinder (Figure 7c), along with the prominent sclerenchymatous tissue surrounding the vascular bundles, suggested efficient water and nutrient transport as well as the enhanced mechanical strength of the root structure [97,98]. In agreement with the observations reported in the morpho-anatomical study of micropropagated V. tessellata [92], the anatomical features of leaves and roots elucidated the successful transition of in vitro-raised V. coerulea to ex vitro conditions.

4.3. Genetic Stability Assessment

The occurrence of somaclonal variation during micropropagation is a major concern if genetically true-to-type plants are the desired end product [99]. The present study employed diverse marker systems—RAPD, ISSR, iPBS, and SCoT—to identify variations in different genome regions, both in the well-acclimatized V. coerulea and the MP. While the conventional molecular markers—RAPD and ISSR—target random regions in the genome, SCoT markers focus on the short, conserved region surrounding the initiation codon (ATG) of the gene [26,27,100,101]. The iPBS marker system, on the other hand, is known for its versatility in identifying polymorphism based on the reverse transcription transposon sequences [102,103]. So far, there are no reports on the application of multiple markers and flow cytometry in detecting genetic variability that may arise in micropropagated V. coerulea. However, a study has reported the genetic stability assessment of cryopreserved PLBs of V. coerulea employing only the RAPD and trnL (UAA) noncoding region of the chloroplast DNA [104].
In the RAPD analysis, the ten selected primers exhibited a total monomorphism of 97.5%. RAPD markers have also been previously employed for the genetic stability assessments of several micropropagated plants [16,33,47,105]. Consistent with the findings of high monomorphism (95.38%) from ISSR marker analysis, an earlier report on micropropagated Vanda cristata also showed 97.27% genetic monomorphism [106]. The ability of ISSR to detect genetic homogeneity was also previously reported in other Dendrobium orchid species [16,99,107]. The genetic stability analysis of D. transparens using RAPD and ISSR markers also showed a high monomorphism rate (100%) [33].
The degree of genetic variability detected by a marker system must be validated by another marker targeting a different region in the genome [31]. For instance, while RAPD can perform the rapid evaluation of genetic fidelity, it sometimes fails to detect changes in the repetitive genomic region of some species [32,108]. The iPBS markers that identify diverse LTR (long terminal repeats) sequences were utilized to substantiate the findings made by RAPD and ISSR. The selected eleven iPBS primers produced a high monomorphism of 98.86%. Although applying these marker targeting retrotransposon sequences is rare in orchids, there are few reports on the clonal fidelity assessment in different plants using iPBS markers [109,110]. The predominance of monomorphic bands in the present study suggested that no significant transposon activity occurred during the in vitro propagation process of V. coerulea, indicating high genetic stability. Additionally, SCoT markers, which generated 97.73% monomorphism, corroborated the RAPD, ISSR, and iPBS assessment that no significant genetic variation occurred at the functional gene level. Similar observations were also made in micropropagated D. fimbriatum and D. heterocarpum [47,111]. Hence, integrating the RAPD, ISSR, iPBS, and SCoT markers enhanced the reliability and effectiveness of the genetic fidelity assessments of micropropagated orchids [112].
Although the electrophoretic analysis of the amplified fragments generated by the four different marker systems revealed high genetic uniformity among the acclimatized in vitro regenerants and the MP, the minor polymorphisms detected with certain primers warranted the estimation of genetic distance to provide a quantitative assessment of genetic stability. The dendrograms generated based on the RAPD, ISSR, iPBS, and SCoT markers revealed a minimal genetic divergence between the regenerants and MP, indicating high genetic stability. Such close clustering patterns were also displayed in other micropropagated orchids [16,99,101,113]. The observation of Nei’s genetic distances close to zero further reinforced the conclusion that the Mitra medium fortified with BAP or KN with IAA, IBA, or NAA at varied concentrations can rapidly propagate genetically stable V. coerulea. This homogeneity is crucial for conservation and maintaining the true-to-type characteristics of the mother plant [114]. The high CCC values (0.892 for SCoT and iPBS, and 0.999 for RAPD and ISSR) further reflected that the dendrograms preserved the original genetic distances attained from the pooled data [115]. A CCC value approaching one indicates the extent to which a dendrogram accurately retains the pairwise distances of the original data points [115,116]. Such high CCC values (0.844 for ISSR and 0.899 for SSR) were also observed in the clonal fidelity assessment of Hancornia speciosa [117].
The tree-like branching structure of dendrograms, constructed using hierarchical clustering algorithms (UPGMA), may not fully capture the subtle, non-hierarchical genetic relationships among closely related genotypes [118]. In contrast, PCoA, which is based on eigenvalues, projects genetic distances into a low-dimensional Euclidean space, enabling the visualization of continuous variation and overlapping genotypes that might be compressed or misrepresented in a dendrogram [119]. For instance, in the present study, the dendrogram displayed regenerants P2 and P3 interposed by P4 (Figure 12). In PCoA, these regenerants, P2 and P3, were revealed as an overlap, represented by a single dot (•), suggesting a closer genetic relationship than the hierarchical clustering in the dendrogram implied. The high percentage accounted for by the first two coordinate axes (44.03% and 67.35%) suggested that the PCoA plot accurately represented the relationships between micropropagated plants and the MP. Similar observations have been reported in other micropropagation studies where both dendrogram and PCoA were used for the genetic fidelity assessment [47,120,121]. These findings strengthen the value of complementary analytical approaches to gain a more nuanced understanding of intra-clonal variation and genetic stability.
Mantel correlation test for ISSR and SCoT with the pooled data (RAPD + ISSR + iPBS + SCoT) revealed a significant relationship, suggesting the meaningful contribution of ISSR and SCoT markers to the entire genetic pattern, as opposed to RAPD and iPBS. Earlier studies also reported the effectiveness of SCoT markers in detecting genetic variability [26,28,122]. The weak, non-significant correlation of iPBS with the combined data could be attributed to the high genetic stability and non-occurrence of identifiable genetic variation or the lack of instances of epigenetic changes among the micropropagated V. coerulea plantlets. A genetic variability study in Helianthus annuus using retrotransposon-based markers also reported a low prevalence of retrotransposon activity in domesticated plants [108]. Additionally, the small genome size of genus Vanda (minimum = 2.1 pg, maximum = 4.4 pg, and mean genome size of 3.25 pg) might contribute to the low manifestation of retrotransposons [123,124].
Flow cytometry has emerged as a powerful tool for assessing genetic stability at the ploidy level of micropropagated plants and identifying potential somaclonal variations [37]. Furthermore, flow cytometry enables the advanced spotting of mixoploidy, essential for maintaining the uniformity of ornamental plants with a high commercial value [125]. In the present study, the observed minor variation in fluorescence and the low coefficient of variation (CV FL2-A) across the MP and regenerants indicated high genetic homogeneity and reliable fluorescence consistency. Flow cytometry analysis of in vitro-propagated Clinacanthus nutans compared with field-grown plants also reported low CV values with minor FL2-A variations, confirming the genetic stability [126]. A CV value of ≤5% is considered reliable for genome size estimation. Values above 5% indicate that the extracted nuclei are not concentrated, leading to larger DNA content deviations [127]. The consistency of 1 event/μL throughout the samples further supports the uniformity in particle detection, ruling out significant technical inconsistencies (Supplementary Table S2). The single peak corresponding to the G1 phase showed no evidence of aneuploidy or ploidy shifts, indicating the absence of possible genomic alterations during the micropropagation process (Figure 13). FL2-A, the fluorescence intensity in flow cytometry reflects the nuclear DNA content of the analyzed samples, making it a crucial indicator of genome stability [125]. Similarly, genome stability was maintained between the wild and leaf explant derived in vitro-propagated goldenseal [128]. Consistent genome sizes were also reported in Pongamia pinnata [129]. These results reinforce the genetic fidelity of the in vitro-regenerated V. coerulea, demonstrating the reliability of the tissue culture protocol in maintaining genetic integrity. The findings also underscore the importance of flow cytometry as a robust and reliable technique for genetic homogeneity assessment in both the conservation and commercial propagation of the self-compatible V. coerulea using seed explants.

5. Conclusions

The present investigation highlights the potential of in vitro seed germination as an efficient and sustainable approach for propagating and conserving the endangered V. coerulea. The study also offers a viable method for rapidly propagating genetically identical plants, reducing pressure on wild populations and contributing to its effective conservation. Furthermore, for the first time, the assessment of genetic homogeneity through molecular markers and flow cytometry ensures the genetic stability of micropropagated V. coerulea, underpinning the reliability of tissue culture methods for ex situ conservation. The combination of asymbiotic seed germination with the molecular characterization of the regenerants provides a comprehensive framework for the propagation, conservation, and potential reintroduction of V. coerulea into its natural habitat.

Supplementary Materials

The following supporting information can be downloaded at: https://www.mdpi.com/article/10.3390/agronomy15051195/s1.

Author Contributions

Conceptualization, L.T. and P.N.; methodology, L.T., A.R.S. and P.N.; validation, L.T.; formal analysis, L.T.; investigation, L.T.; data curation, L.T.; writing—original draft preparation, L.T.; writing—review and editing, L.T., P.N. and W.A.V.; visualization, L.T.; supervision, W.A.V. and P.N.; project administration, P.N.; funding acquisition, P.N. All authors have read and agreed to the published version of the manuscript.

Funding

The research work is funded by SERB (EMR/2017/000706), New Delhi, India.

Data Availability Statement

The data are available upon request from the authors.

Acknowledgments

The authors would like to thank the State Orchidarium, Khonghampat, Forest Department, Government of Manipur, Sanjenthong, Manipur, India, for providing the mature capsule of Vanda coerulea.

Conflicts of Interest

The authors declare no conflicts of interest.

References

  1. Sripotar, D. (Ed.) Non-detrimental finding of Vanda coerulea. In NDF Workshop Case Studies WG 4- Geophytes and Epiphytes Case Study 4, Vanda coerulea; CITES: Bangkok, Thailand, 2008; pp. 1–8. [Google Scholar]
  2. Manners, V.; Kumaria, S.; Tandon, P. Propagation of Vanda coerulea via in vitro asymbiotic seed germination. Seed Tech. 2011, 33, 79–87. [Google Scholar]
  3. Roy, A.R.; Patel, R.S.; Patel, V.V.; Sajeev, S.; Deka, B.C. Asymbiotic seed germination, mass propagation and seedling development of Vanda coerulea Griff ex. Lindl. (Blue Vanda): An in vitro protocol for an endangered orchid. Sci. Hortic. 2011, 128, 325–331. [Google Scholar] [CrossRef]
  4. Simmler, C.; Antheaume, C.; Lobstein, A. Antioxidant biomarkers from Vanda coerulea stems reduce irradiated HaCaT PGE-2 production as a result of COX-2 inhibition. PLoS ONE 2010, 5, e13713. [Google Scholar] [CrossRef]
  5. Medhi, R.P.; Chakrabarti, S. Traditional knowledge of NE people on conservation of wild orchids. Indian J. Trad. Knowl. 2009, 8, 11–16. [Google Scholar]
  6. Hadi, H.; Razali, S.N.S.; Awadh, A.I. A comprehensive review of the cosmeceutical benefits of Vanda species (Orchidaceae). Nat. Prod. Commun. 2015, 10, 1934578X1501000842. [Google Scholar] [CrossRef]
  7. India Code. Available online: https://www.indiacode.nic.in/bitstream/123456789/1726/1/a1972-53.pdf (accessed on 17 March 2025).
  8. Khan, H.; Marya; Belwal, T.; Tariq, M.; Atanasov, A.G.; Devkota, H.P. Genus Vanda: A review on traditional uses, bioactive chemical constituents and pharmacological activities. J. Ethnopharmacol. 2019, 229, 46–53. [Google Scholar] [CrossRef]
  9. De, L.C. Morphological diversity in orchids. Int. J. Bot. Stud. 2020, 5, 229–238. [Google Scholar]
  10. Yang, Q.; Xu, L.; Xia, W.; Liand, L.; Bai, X.; Li, L.; Xu, L.; Liu, L. Mycorrhizal compatibility and germination-promoting activity of Tulasnella species in two species of orchid (Cymbidium mannii and Epidendrum radicans). Horticulturae 2021, 7, 472. [Google Scholar] [CrossRef]
  11. Rasmussen, H.N. Terrestrialo Orchids, from Seed to Mycotrophic Plant; Cambridge University Press: Cambridge, UK, 1995. [Google Scholar] [CrossRef]
  12. Merckx, V.; Bidartondo, M.I.; Hynson, N.A. Myco-heterotrophy: When fungi host plants. Ann. Bot. 2009, 104, 1255–1261. [Google Scholar] [CrossRef]
  13. Těšitelová, T.; Těšitel, J.; Jersáková, J.; Říhová, G.; Selosse, M.A. Symbiotic germination capability of four Epipactis species (Orchidaceae) is broader than expected from adult ecology. Am. J. Bot. 2012, 99, 1020–1032. [Google Scholar] [CrossRef]
  14. Davis, B.J.; Phillips, R.D.; Wright, M.; Linde, C.C.; Dixon, K.W. Continent-wide distribution in mycorrhizal fungi: Implications for the biogeography of specialized orchids. Ann. Bot. 2015, 116, 413–421. [Google Scholar] [CrossRef] [PubMed]
  15. Zeng, S.; Huang, W.; Wu, K.; Zhang, J.; da Silva, J.A.T.; Duan, J. In vitro propagation of Paphiopedilum orchids. Crit. Rev. Biotechnol. 2015, 36, 521–534. [Google Scholar] [CrossRef]
  16. Tikendra, L.; Amom, T.; Nongdam, P. Molecular genetic homogeneity assessment of micropropagated Dendrobium moschatum Sw.-a rare medicinal orchid, using RAPD and ISSR markers. Plant Gene 2019, 19, 100196. [Google Scholar] [CrossRef]
  17. Rasmussen, H.N.; Rasmussen, F.N. Seedling mycorrhiza: A discussion of origin and evolution in orchidaceae. Bot. J. Linn. Soc. 2014, 175, 313–327. [Google Scholar] [CrossRef]
  18. Nag, S.; Kumaria, S. In vitro propagation of medicinally threatened orchid Vanda coerulea: An improved method for the production of phytochemicals, antioxidants and phenylalanine ammonia lyase activity. J. Pharmacogn. Phytochem. 2018, 7, 2973–2982. [Google Scholar]
  19. Mehta, Y.R.; Angra, D.C. Somaclonal variation for disease resistance in wheat and production of dihaploids through wheat x maize hybrids. Genet. Mol. Biol. 2000, 23, 617–622. [Google Scholar] [CrossRef]
  20. Predieri, S. Induced mutation and tissue culture in fruits. Plant Cell Tissue Organ Cult. 2001, 64, 185–210. [Google Scholar] [CrossRef]
  21. Unai, E.; Iselen, T.; de Garcia, E. Comparison of characteristics of bananas (Musa sp.) from the somaclone CIEN BTA-03 and its parental clone Williams. Fruits 2004, 59, 257–263. [Google Scholar] [CrossRef]
  22. Krishna, H.; Singh, D. Micropropagation of lasora (Cordia myxa Roxb.). Indian J. Hortic. 2013, 70, 323–327. [Google Scholar]
  23. Antony, J.J.J.; Shamshir, R.A.; Poobathy, R.; Chew, B.L.; Subramaniam, S. Somaclonal variations were not induced by the cryopreservation: Levels of somaclonal variations of in vitro and thawed protocorms of Dendrobium Bobby Messina analysed by SCoT and TRAP DNA markers. S. Afr. J. Bot. 2015, 100, 148–157. [Google Scholar] [CrossRef]
  24. Rathore, M.S.; Mastan, S.G.; Yadav, P.; Bhatt, V.D.; Shekhawat, N.S.; Chikara, J. Shoot regeneration from leaf explants of Withania coagulans (stocks) Dunal and genetic stability evaluation of regenerates with RAPD and ISSR markers. S. Afr. J. Bot. 2016, 102, 12–17. [Google Scholar] [CrossRef]
  25. Al-Qurainy, F.; Nadeem, M.; Khan, S.; Alansi, S.; Tarroum, M.; Al-Ameri, A.A.; Gaafar, A.R.Z.; Alshameri, A. Rapid plant regeneration, validation of genetic integrity by ISSR markers and conservation of Reseda pentagyna an endemic plant growing in Saudi Arabia. Saudi J. Biol. Sci. 2018, 25, 111–116. [Google Scholar] [CrossRef]
  26. Collard, B.C.Y.; Mackill, D.J. Start Codon Targeted (SCoT) Polymorphism: A simple, novel DNA marker technique for generating gene-targeted markers in plants. Plant Mol. Biol. Rep. 2009, 27, 86–93. [Google Scholar] [CrossRef]
  27. Amom, T.; Nongdam, P. The use of molecular marker methods in plants: A review. Int. J. Cur. Res. Rev. 2017, 9, 1–7. [Google Scholar]
  28. Amom, T.; Tikendra, L.; Nandeibam, A.; Goutam, M.; Paonam, S.; Koijam, A.S.; Potshangbam, A.M.; Hamidu, R.; Nongdam, P. Efficiency of RAPD, ISSR, iPBS, SCoT and phytochemical markers in the genetic relationship study of five native and economical important bamboos of North-East India. Phytochem. 2020, 174, 112330. [Google Scholar] [CrossRef]
  29. Tikendra, L.; Rahaman, H.; Dey, A.; Sahoo, M.R.; Nongdam, P. Applicability of molecular markers in ascertaining genetic diversity and relationship between five edible bamboos of North-East India. In Molecular Marker Techniques; Kumar, N., Ed.; Springer: Singapore, 2023. [Google Scholar] [CrossRef]
  30. Tikendra, L.; Dey, A.; Jamir, I.; Sahoo, M.R.; Nongdam, P. Cytokinin influence on in vitro shoot induction and genetic stability assessment of Dendrocalamus latiflorus Munro: A commercially important bamboo in Manipur, North East India. Vegetos 2022, 35, 1085–1095. [Google Scholar] [CrossRef]
  31. Goto, S.; Thakur, R.C.; Ishii, K. Determination of genetic stability in long-term micropropagated shoots of Pinus thunbergii Parl. using RAPD markers. Plant Cell Rep. 1998, 18, 193–197. [Google Scholar] [CrossRef]
  32. Palombi, M.; Damiano, C. Comparison between RAPD and SSR molecular markers in detecting genetic variation in kiwifruit (Actinidia deliciosa A. Chev). Plant Cell Rep. 2002, 20, 1061–1066. [Google Scholar] [CrossRef]
  33. Joshi, P.R.; Pandey, S.; Maharjan, L.; Pant, B. Micropropagation and assessment of genetic stability of Dendrobium transparens Wall. Ex Lindl. using RAPD and ISSR markers. Front. Conserv. Sci. 2023, 3, 1083933. [Google Scholar] [CrossRef]
  34. Novikova, T.I.; Asbaganov, S.V.; Ambros, E.V.; Zaytseva, Y.G. TDZ-induced axillary shoot proliferation of Rhododendron mucronulatum Turcz and assessment of clonal fidelity using DNA-based markers and flow cytometry. Vitr. Cell. Dev. Biol. Plant 2020, 56, 307–317. [Google Scholar] [CrossRef]
  35. Mamgain, J.; Mujib, A.; Ejaz, B.; Gulzar, B.; Malik, M.Q.; Syeed, R. Flow cytometry and start codon targeted (SCoT) genetic fidelity assessment of regenerated plantlets in Tylophora indica (Burm. f.) Merrill. Plant Cell Tissue Organ Cult. 2022, 150, 129–140. [Google Scholar] [CrossRef] [PubMed]
  36. Franco, M.C.; Marques, D.D.A.; Siqueira, W.J.; Latado, R.R. Micropropagation of Jatropha curcas superior genotypes and evaluation of clonal fidelity by target region amplification polymorphism (TRAP) molecular marker and flow cytometry. Afr. J. Biotechnol. 2014, 13, 3872–3880. [Google Scholar] [CrossRef]
  37. Nabi, N.; Saffeullah, P.; Singh, S. Micropropagation using direct and indirect organogenesis in Artemisia maritima L.: Scanning electron microscopy of somatic embryos and genome size analysis by flow cytometry. Vitr. Cell. Dev. Biol.-Plant 2022, 58, 1012–1024. [Google Scholar] [CrossRef]
  38. Tikendra, L.; Dey, A.; Sahoo, M.R.; Nongdam, P. Genetic stability in micropropagated orchids: Assessment by molecular markers and flow cytometry. In Genome Size and Genetic Homogeneity of Regenerated Plants: Methods and Applications; Mujib, A., Ed.; Bentham Science Publishers: Sharjah, United Arab Emirates, 2023; pp. 180–231. [Google Scholar]
  39. Mohapatra, P.; Ray, A.; Sandeep, I.S.; Parida, R.; Mohanty, S. Genetic and biochemical stability of in vitro raised and conventionally propagated Centella asiatica-a valuable medicinal herb. S. Afr. J. Bot. 2021, 140, 444–453. [Google Scholar] [CrossRef]
  40. Hazarika, B.N. Morpho-physiological disorders in in vitro culture of plants. Sci. Hortic. 2006, 108, 105–120. [Google Scholar] [CrossRef]
  41. Sandhya, D.; Jogam, P.; Manokari, M.; Shekhawat, M.S.; Jadaun, J.S.; Allini, V.R.; Abbagani, S. High-frequency in vitro propagation and assessment of genetic uniformity and micro-morphological characterization of Origanum majorana L.—A highly traded aromatic herb. Biocatal. Agric. Biotechnol. 2021, 34, 102024. [Google Scholar] [CrossRef]
  42. Mood, K.; Jogam, P.; Sirikonda, A.; Sekhawat, M.S.; Rohela, G.K.; Manokari, M.; Allini, V.R. Micropropagation, morpho-anatomical characterization, and genetic stability studies in Lippia javanica (Burm.f.) Spreng: A multipurpose medicinal plant. Plant Cell Tissue Organ Cult. 2022, 150, 427–437. [Google Scholar] [CrossRef]
  43. Manokari, M.; Cokulraj, M.; Faisal, M.; Alatar, A.A.; Alok, A.; Dey, A.; Shekhawat, M.S. Polyethylene-glycol modulated foliar anatomical and histochemical traits in Coccoloba uvifera (L.) L.: A salt and drought tolerant tree species. S. Afr. J. Bot. 2023, 153, 28–36. [Google Scholar] [CrossRef]
  44. Rachna, S.; Natasha, S.; Nirmala, C. Propagation methods for conserving Vanda coerulea griff. ex Lindl., an endangered and commercially important orchid. Plant Cell Biotechnol. Mol. Biol. 2013, 14, 147–157. [Google Scholar]
  45. Mitra, G.C.; Prasad, R.N.; Roychowdhury, A. Inorganic salts and differentiation of protocorms in seed callus of orchid and correlative changes in its free aminoacid content. Indian J. Exp. Biol. 1976, 14, 350–351. [Google Scholar]
  46. Doyle, J.J.; Doyle, J.L. Isolation of plant DNA from fresh tissue. Focus 1990, 12, 13–15. [Google Scholar]
  47. Tikendra, L.; Potshangbam, A.M.; Dey, A.; Devi, T.R.; Sahoo, M.R.; Nongdam, P. RAPD, ISSR, and SCoT markers based genetic stability assessment of micropropagated Dendrobium fimbriatum Lindl. var. oculatum Hk. f.-an important endangered orchid. Physiol. Mol. Biol. Plants 2021, 27, 341–357. [Google Scholar] [CrossRef] [PubMed]
  48. Nei, M. Estimation of average heterozygosity and genetic distance from a small number of individuals. Genetics 1978, 89, 583–590. [Google Scholar] [CrossRef] [PubMed]
  49. Peakall, R.; Smouse, P. GenAlEx 6.5: Genetic analysis in excel. Population genetic software for teaching and research—An update. Bioinformatics 2012, 28, 2537–2539. [Google Scholar] [CrossRef]
  50. Fernández, A.; Gómez, S. Solving non-uniqueness in agglomerative hierarchical clustering using multidendrograms. J. Classif. 2009, 25, 43–46. [Google Scholar] [CrossRef]
  51. Galbraith, D.W.; Harkins, K.R.; Maddox, J.M.; Ayres, N.M.; Sharma, D.P.; Firoozabady, E. Rapid flow cytometric analysis of the cell cycle in intact plant tissues. Science 1983, 220, 1049–1051. [Google Scholar] [CrossRef]
  52. George, E.F.; Klerk, G.J. The components of plant tissue culture media I: Macro- and micro-nutrients. In Plant Propagation by Tissue Culture, 3rd ed.; George, E.F., Hall, M.A., Klerk, G.J.D., Eds.; Springer: Dordrecht, The Netherlands, 2008; pp. 65–113. [Google Scholar]
  53. Na, L.; Li, Z.; Xiangxiang, M.; Ara, N. Effect of nitrate/ammonium ratios on growth, root morphology and nutrient elements uptake of watermelon (Citrullus lanatus) Seedlings. J. Plant Nutr. 2014, 37, 1859–1872. [Google Scholar] [CrossRef]
  54. Dutra, D.; Johnson, T.R.; Kauth, P.J.; Stewart, S.L.; Kane, M.E.; Richardson, L. Asymbiotic seed germination, in vitro seedling development, and greenhouse acclimatization of the threatened terrestrial orchid Bletia purpurea. Plant Cell Tissue Organ Cult. 2008, 94, 11–21. [Google Scholar] [CrossRef]
  55. Balilashaki, K.; Martinez-Montero, M.E.; Vahedi, M.; Cardoso, J.C.; Silva Agurto, C.L.; Leiva-Mora, M.; Feizi, F.; Musharof Hossain, M. Medicinal use, flower trade, preservation and mass propagation techniques of Cymbidium orchids—An overview. Horticulturae 2023, 9, 690. [Google Scholar] [CrossRef]
  56. Noggle, G.R.; Wynd, F.L. Effects of vitamins on germination and growth of orchids. Bot. Gaz. 1943, 104, 455–459. [Google Scholar] [CrossRef]
  57. Kumaria, S. In vitro propagation of Dendrobium fimbriatum var. oculatum Hk. F.: Some functional and biochemical aspects of its growth. In Biotechnological Approaches in Ex Situ Conservation of Plant Genetic Resources of Northeast India; Kumaria, S., Choudhury, H., Das, M.C., Eds.; Excel India Publishers: New Delhi, India, 2015; pp. 1–16. [Google Scholar]
  58. Novak, S.D.; Whitehouse, G.A. Auxin regulates first leaf development and promotes the formation of protocorm trichomes and rhizome-like structures in developing seedlings of Spathoglottis plicata (Orchidaceae). AoB Plants 2013, 5, pls053. [Google Scholar] [CrossRef]
  59. Hossain, M.M.; Sharma, M.; Pathak, P. In vitro propagation of Dendrobium aphyllum (Orchidaceae)—Seed germination to flowering. J. Plant Biochem. Biotechnol. 2013, 22, 157–167. [Google Scholar] [CrossRef]
  60. Hrahsel, L.; Thangjam, R. Asymbiotic in vitro seed germination and regeneration of Vanda coerulea Giff. Ex. Lindl., an endangered orchid from Northeast India. J. Plant Sci. Res. 2015, 2, 1–5. [Google Scholar]
  61. Asghar, S.; Ahmad, T.; Hafiz, I.A.; Yaseen, M. In vitro propagation of orchid (Dendrobium nobile) var. Emma white. Afr. J. Biotechnol. 2011, 10, 3097–3103. [Google Scholar]
  62. Rahman, M.S.; Hasan, M.F.; Das, R.; Hossain, M.S.; Rahman, M. In vitro micropropagation of orchid (Vanda tessellata L.) from shoot tip explant. J. Bio-Sci. 2009, 17, 139–144. [Google Scholar] [CrossRef]
  63. Setiaji, A.; Annisa, R.R.R.; Santoso, A.D.; Kinasih, A.; Riyadi, A.D.R. In vitro propagation of Vanda orchid: A review. Com. Sci. 2021, 12, e3427. [Google Scholar]
  64. Maharjan, S.; Pradhan, S.; Thapa, B.B.; Pant, B. In vitro propagation of endangered orchid, Vanda pumila hook.f. through protocorms culture. Am. J. Plant Sci. 2019, 10, 1220–1232. [Google Scholar] [CrossRef]
  65. Kiaheirati, H.; Hashemabadi, D.; Kaviani, B. In vitro propagation of the orchid Phalaenopsis circus via organogenesis and somatic embryogenesis using protocorm and thin cell layer explants. Ital. Bot. 2024, 18, 29–50. [Google Scholar] [CrossRef]
  66. Schaller, G.E.; Bishopp, A.; Kieber, J.J. The yin-yang of hormones: Cytokinin and auxin interactions in plant development. Plant Cell 2015, 27, 44–63. [Google Scholar] [CrossRef]
  67. El-Showk, S.; Ruonala, R.; Helariutta, Y. Crossing paths: Cytokinin signalling and crosstalk. Development 2013, 140, 1373–1383. [Google Scholar] [CrossRef]
  68. Davies, P.J. (Ed.) Regulatory factors in hormone action: Level, location and signal transduction. In Plant Hormones: Biosynthesis, Signal Transduction, Action, 3rd ed.; Cornell University: Ithaca, NY, USA, 2010; pp. 16–35. [Google Scholar] [CrossRef]
  69. Tikendra, L.; Amom, T.; Nongdam, P. Effect of phytohormones on rapid in vitro propagation of Dendrobium thyrsiflorum Rchb.f.: An endangered medicinal orchid. Phcog. Mag. 2018, 14, 495–500. [Google Scholar] [CrossRef]
  70. Martins, C.M.; Nhacaa, F.J.; Bilaa, C.; Cossab, M.; Fernandesb, S.; Macieb, R.; Diasb, A.; Guilundoa, S.V.; Victorinoa, I.; Pinhoa, M.; et al. The effect of different concentrations of NAA and BAP in promoting in vitro regeneration and the acclimatization of the leopard orchid (Ansellia africana lindl). Front. Agric. Food Technol. 2022, 10, 01–08. [Google Scholar]
  71. Laplaze, L.; Benkova, E.; Casimiro, I.; Maes, L.; Vanneste, S.; Swarup, R.; Weijers, D.; Calvo, V.; Parizot, B.; Herrera-Rodriguez, M.B.; et al. Cytokinins act directly on lateral root founder cells to inhibit root initiation. Plant Cell. 2007, 19, 3889–3900. [Google Scholar] [CrossRef] [PubMed]
  72. Kudo, T.; Makita, N.; Kojima, M.; Tokunaga, H.; Sakakibara, H. Cytokinin activity of cis-zeatin and phenotypic alterations induced by overexpression of putative cis-zeatin-O-glucosyltransferase in rice. Plant Physiol. 2012, 160, 319–331. [Google Scholar] [CrossRef]
  73. Šimášková, M.; O’Brien, J.A.; Khan, M.; Van Noorden, G.; Ötvös, K.; Vieten, A.; De Clercq, I.; Van Haperen, J.M.A.; Cuesta, C.; Hoyerová, K.; et al. Cytokinin response factors regulate PIN-FORMED auxin transporters. Nat. Commun. 2015, 6, 8717. [Google Scholar] [CrossRef]
  74. Márquez, G. Cytokinin inhibits lateral root development at the earliest stages of lateral root primordium initiation in maize primary root. J. Plant Growth Regu. 2019, 38, 83–92. [Google Scholar] [CrossRef]
  75. Waidmann, S.; Michel, R.R.; Schöller, M.; Sarkel, E.; Lindner, H.; LaRue, T.; Petřík, I.; Dünser, K.; Martopawiro, S.; Sasidharan, R.; et al. Cytokinin functions as an asymmetric and anti-gravitropic signal in lateral roots. Nat. Commun. 2019, 10, 3540. [Google Scholar] [CrossRef]
  76. van denBerg, C.; Willemsen, V.; Hendriks, G.; Weisbeek, P.; Scheres, B. Short-range control of cell differentiation in the Arabidopsis root meristem. Nature 1997, 390, 287–289. [Google Scholar] [CrossRef]
  77. Zhang, W.; Swarup, R.; Bennett, M.; Schaller, G.E.; Kieber, J.J. Cytokinin induces cell division in the quiescent center of the Arabidopsis root apical meristem. Curr. Biol. 2013, 23, 1979–1989. [Google Scholar] [CrossRef]
  78. Drisch, R.C.; Stahl, Y. Function and regulation of transcription factors involved in root apical meristem and stem cell maintenance. Front. Plant Sci. 2015, 6, 505. [Google Scholar] [CrossRef]
  79. Azlan, G.J.; David, D.; Marbawi, H.; Jawan, R. Asymbiotic seed germination and seedling development of Vanda dearei. Malays. Appl. Biol. 2014, 43, 25–33. [Google Scholar]
  80. Arditti, J.; Ernst, R. Physiology of germinating orchid seeds. In Orchidbiology, Reviews and Perspectives III; Arditti, J., Ed.; Cornell University Press: Ithaca, NY, USA, 1984; pp. 177–222. [Google Scholar]
  81. Gao, X.; Wang, Y.; Deng, D.; Luo, Y.; Shao, S.; Luo, Y. Morphogenesis Changes in protocorm development during symbiotic seed germination of Dendrobium chrysotoxum (Orchidaceae) with its mycobiont, Tulasnella sp. Horticulturae 2023, 9, 531. [Google Scholar] [CrossRef]
  82. Yeung, E.C. A perspective on orchid seed and protocorm development. Bot. Stud. 2017, 58, 33. [Google Scholar] [CrossRef] [PubMed]
  83. Yeung, E.C.; Li, Y.-Y.; Lee, Y.-I. Understanding seed and protocorm development in orchids. In Orchid Propagation: From Laboratories to Greenhouses—Methods and Protocols; Lee, Y.I., Yeung, E.C., Eds.; Springer: New York, NY, USA, 2018; pp. 3–26. [Google Scholar]
  84. Hazarika, B.N.; Teixeira da Silva, J.A.; Talukdar, A. Effective acclimatization of in vitro cultured plants: Methods, physiology and genetics. Floricult. Ornament. Plant Biotechnol. 2006, 2, 427–438. [Google Scholar]
  85. Yokota, S.; Karim, M.Z.; Azad, M.A.K.; Rahman, M.M.; Eizawa, J.; Saito, Y.; Yshiguri, F.; Iizuka, K.; Yahara, S.; Yoshizawa, N. Histological observation of changes in leaf structure during successive micropropagation stages in Aralia elata and Phellodendron Amurense. Plant Biotechnol. 2007, 24, 221–226. [Google Scholar] [CrossRef]
  86. Hazarika, B.N. Acclimatization of tissue-cultured plants. Curr. Sci. 2003, 85, 1704–1712. [Google Scholar]
  87. Hronková, M.; Zahradníčková, H.; Šimková, M.; Šimek, P.; Heydová, A. The role of abscisic acid in acclimation of plants cultivated in vitro to ex vitro conditions. Biol. Plant. 2003, 46, 535–541. [Google Scholar] [CrossRef]
  88. Liu, W.; Zhu, X. Leaf epidermal characters and taxonomic revision of Schizophragma and Pileostegia (Hydrangeaceae). Bot. J. Linn. Soc. 2011, 165, 285–314. [Google Scholar] [CrossRef]
  89. Yang, S.J.; Sun, M.; Yang, Q.Y.; Ma, R.Y.; Zhang, J.L.; Zhang, S.B. Two strategies by epiphytic orchids for maintaining water balance: Thick cuticles in leaves and water storage in pseudobulbs. AoB Plants 2016, 8, plw046. [Google Scholar] [CrossRef]
  90. Kowsalya, A.; Rojamala, K.; Muthukumar, T. Comparative vegetative anatomy of South Indian Vandas (Orchidaceae). Flora 2017, 235, 59–75. [Google Scholar] [CrossRef]
  91. Thangavelu, M.; Muthu, S. Vegetative anatomical adaptations of Epidendrum radicans (Epidendroideae, Orchidaceae) to epiphytic conditions of growth. Mod. Phytomorphol. 2017, 11, 117–130. [Google Scholar]
  92. Mani, M.; Rasangam, L.; Selvam, P.; Shekhawat, M.S. Micro-morpho-anatomical mechanisms involve in epiphytic adaptation of micropropagated plants of Vanda tessellata (Roxb.) Hook. ex G. Don. Microsc. Res. Tech. 2020, 84, 712–722. [Google Scholar] [CrossRef] [PubMed]
  93. Olivera, V.D.C.; Sajo, M.D.G. Anatomia foliar de espécies epífitas de Orchidaceae. Brazilian J. Bot. 1999, 22, 365–374. [Google Scholar] [CrossRef]
  94. Dycus, A.M.; Knudson, L. The role of the velamen of the aerial roots of orchids. Bot. Gaz. 1957, 119, 78–87. [Google Scholar] [CrossRef]
  95. Pridgeon, A.M.; Arditti, J. Orchid Biology: Reviews and Perspectives; Cornell University Press: Ithaca, NY, USA, 1987; pp. 139–192. [Google Scholar]
  96. Porembski, S.; Barthlott, W. Velamen radicum micromorphology and classification of orchidaceae. Nord. J. Bot. 1988, 8, 117–137. [Google Scholar] [CrossRef]
  97. Moreira, A.S.F.P.; dos Santos Isaias, R.M. Comparative anatomy of the absorption roots of terrestrial and epiphytic orchids. Braz. Arch. Biol. Technol. 2008, 51, 83–93. [Google Scholar] [CrossRef]
  98. Balachandar, M.; Ravi, R.K.; Nagaraj, K.; Muthukumar, T. Vegetative anatomy and mycorrhizal morphology of Schoenorchis nivea (Lindl.) Schltr., (Orchidaceae) and their adaptive significance. Acta Biol. Szeged. 2019, 63, 1–13. [Google Scholar] [CrossRef]
  99. Tikendra, L.; Koijam, A.S.; Nongdam, P. Molecular markers based genetic fidelity assessment of micropropagated Dendrobium chrysotoxum Lindl. Meta Gene 2019, 20, 100562. [Google Scholar] [CrossRef]
  100. Bhattacharyya, P.; Kumar, V.; Staden, J.V. Assessment of genetic stability amongst micropropagated Ansellia africana, a vulnerable medicinal orchid species of Africa using SCoT markers. S. Afr. J. Bot. 2017, 108, 294–302. [Google Scholar] [CrossRef]
  101. Bhattacharyya, P.; Kumaria, S.; Diengdoh, R.; Tandon, P. Genetic stability and phytochemical analysis of the in vitro regenerated plants of Dendrobium nobile Lindl., an endangered medicinal orchid. Meta Gene 2014, 2, 489–504. [Google Scholar] [CrossRef]
  102. Zhang, X.; Chen, W.; Yang, Z.; Luo, C.; Zhang, W.; Xu, F.; Ye, J.; Liao, Y. Genetic diversity analysis and DNA fingerprint construction of Zanthoxylum species based on SSR and iPBS markers. BMC Plant Biol. 2024, 24, 843. [Google Scholar] [CrossRef]
  103. Bidyananda, N.; Jamir, I.; Nowakowska, K.; Varte, V.; Vendrame, W.A.; Devi, R.S.; Nongdam, P. Plant genetic diversity studies: Insights from DNA marker analyses. Int. J. Plant Biol. 2024, 15, 607–640. [Google Scholar] [CrossRef]
  104. Jitsopakul, N.; Thammasiri, K.; Ishikawa, K. Cryopreservation of Vanda coerulea protocorm-like bodies by droplet-vitrification. Acta Hortic. 2011, 908, 207–213. [Google Scholar] [CrossRef]
  105. Kishor, R.; Devi, H.S. Induction of multiple shoots in a monopodial orchid hybrid (Aerides vandarum Reichb.f × Vanda stangeana Reichb.f) using thidiazuron and analysis of their genetic stability. Plant Cell Tissue Organ Cult. 2009, 97, 121–129. [Google Scholar] [CrossRef]
  106. Pathak, P.; Anamika, K.; Chandler, B.D.; Zettler, L.W. In vitro propagation and phytochemical analysis of Vanda cristata Exll. ex Lianl.: An endangered medicinal orchid of biopharmaceutical importance. S. Afr. J. Bot. 2023, 153, 109–123. [Google Scholar] [CrossRef]
  107. Lal, A.; Pant, M.; Pant, G.; Palni, L.M.S.; Kumar, A.; Kumar, G. ISSR marker assisted genetic diversity assessment in natural populations of two endemic orchids Aerides multiflora and Rhynchostylis retusa from Uttarakhand, India. S. Afr. J. Bot. 2023, 157, 151–158. [Google Scholar] [CrossRef]
  108. Vukich, M.; Schulman, A.H.; Giordani, T.; Natali, L.; Kalendar, R.; Cavallini, A. Genetic variability in sunflower (Helianthus annuus L.) and in the Helianthus genus as assessed by retrotransposon-based molecular markers. Theor. Appl. Genet. 2009, 119, 1027–1038. [Google Scholar] [CrossRef]
  109. Çetin, B. Plant regeneration from hypocotyls of black carrot via direct somatic embryogenesis and determination of its genetic stability by RAPD and iPBS methods. Indian J. Genet. Plant Breed. 2018, 78, 373–377. [Google Scholar] [CrossRef]
  110. Siringam, T.; Vanijajiva, O. The effect of plant growth regulators on micropropagation of Melientha suavis Pierre. and assessment of genetic fidelity of regenerants based on iPBS and SRAP markers. Biodiversitas 2023, 24, 4628–4634. [Google Scholar] [CrossRef]
  111. Longchar, T.B.; Deb, C.R. Optimization of in vitro propagation protocol of Dendrobium heterocarpum Wall. ex. Lindl. and clonal genetic fidelity assessment of the regenerates: An orchid of horticultural and medicinal importance. S. Afr. J. Bot. 2022, 149, 67–78. [Google Scholar] [CrossRef]
  112. Sonia, P.; Apana, N.; Tikendra, L.; Dey, A.; Jamir, I.; Nongdam, P. Molecular clonal fidelity assessment of micropropagated orchids using DNA markers. In Biotechnology and Crop Improvement: Tissue Culture and Transgenic Approaches; Kumar, N., Ed.; CRC Press: Boca Raton, FL, USA, 2022; pp. 143–179. [Google Scholar] [CrossRef]
  113. Khoddamzadeh, A.A.; Sinniah, U.R.; Kadir, M.A.; Kadzimin, S.B.; Mahmood, M.; Sreeramanan, S. Detection of somaclonal variation by random amplified polymorphic DNA analysis during micropropagation of Phalaenopsis bellina (Rchb. f.) Christenson. Afr. J. Biotechnol. 2010, 9, 6632–6639. [Google Scholar]
  114. Ioannidis, K.; Tomprou, I.; Mitsis, V.; Koropouli, P. Genetic evaluation of in vitro micropropagated and regenerated plants of Cannabis sativa L. using SSR molecular markers. Plants 2022, 11, 2569. [Google Scholar] [CrossRef]
  115. Sokal, R.R.; Rohlf, F.J. The comparison of dendrograms by objective methods. Taxon 1962, 11, 33–40. [Google Scholar] [CrossRef]
  116. Saraçli, S.; Doğan, N.; Doğan, İ. Comparison of hierarchical cluster analysis methods by cophenetic correlation. J. Inequal. Appl. 2013, 2013, 203. [Google Scholar] [CrossRef]
  117. Costa, G.F.d.; Cabral, P.D.S.; Silva, F.G.; Rubio Neto, A.; Mendonça, M.A.C. Clonal fidelity and genetic diversity of micropropagated Hancornia speciosa Gomes (Apocynaceae) as evaluated by molecular markers. Forests 2022, 13, 1645. [Google Scholar] [CrossRef]
  118. Sneath, P.H.A.; Sokal, R.R. Numerical Taxonomy: The Principles and Practice of Numerical Classification; W.H. Freeman: New York, NY, USA, 1973. [Google Scholar]
  119. Legendre, P.; Legendre, L. (Eds.) Ordination in reduced space. In Numerical Ecology; Elsevier: Dordrecht, The Netherlands, 2012; pp. 425–520. [Google Scholar]
  120. Sarmast, M.K.; Salehi, H.; Ramezani, A.; Abolomoghadam, A.A.; Niazi, A.; Khui, M.K. RAPD Fingerprint to appraise the genetic fidelity of in vitro propagated Araucaria excelsa R. Br. var. glauca plantlets. Mol. Biotechnol. 2012, 50, 181–188. [Google Scholar] [CrossRef] [PubMed]
  121. Tiwari, J.K.; Chandel, P.; Gupta, S.; Gopal, J.; Singh, B.P.; Bhardwaj, V. Analysis of genetic stability of in vitro propagated potato microtubers using DNA markers. Physiol. Mol. Biol. Plants. 2013, 19, 587–595. [Google Scholar] [CrossRef]
  122. Nandeibam, A.; Amom, T.; Tikendra, L.; Potshangbam, A.M.; Dey, A.; Nongdam, P. Genetic diversity and population structure of Clerodendrum serratum (L.) Moon using CBDP, iPBS and SCoT markers. J. App. Res. Med. Arom. Plants 2021, 25, 100349. [Google Scholar] [CrossRef]
  123. Leitch, I.J.; Kahandawala, I.; Suda, J.; Hanson, L.; Ingrouille, M.J.; Chase, M.W.; Fay, M.F. Genome size diversity in orchids: Consequences and evolution. Ann. Bot. 2009, 104, 469–481. [Google Scholar] [CrossRef]
  124. Gozukirmizi, N.; Yilmaz, S.; Marakli, S.; Temel, A. Retrotransposon-based molecular markers; tools for variation analysis in plants. In Applications of Molecular Markers in Plant Genome Analysis and Breeding; Ajduković, K.T., Ed.; Research Signpost: Kerala, India, 2015; pp. 19–45. [Google Scholar]
  125. Doležel, J.; Greilhuber, J.; Suda, J. Estimation of nuclear DNA content in plants using flow cytometry. Nat. Protoc. 2007, 2, 2233–2244. [Google Scholar] [CrossRef]
  126. Kandaiah, V.; Singaram, N.; Kandasamy, K.I. Optimized flow cytometric protocol and genome size estimation of Sabah snake grass (Clinacanthus nutans). J. Med. Plants Res. 2021, 15, 531–539. [Google Scholar] [CrossRef]
  127. Cao, B.; Zhang, L.L.; Bai, C. Estimation of nuclear DNA content in tannin-rich medicinal plant Cornus officinalis by flow cytometry. Chin. Herb. Med. 2014, 6, 152–158. [Google Scholar] [CrossRef]
  128. Obae, S.G.; West, T.P. Nuclear DNA content of Hydrastis canadensis L. and genome size stability of in vitro regenerated plantlets. Plant Cell Tissue Organ Cult. 2010, 102, 259–263. [Google Scholar] [CrossRef]
  129. Choudury, R.R.; Basak, S.; Ramesh, A.M.; Rangan, L. Nuclear DNA content of Pongamia pinnata L. and genome size stability of in vitro regenerated plantlets. Protoplasma 2013, 215, 703–709. [Google Scholar] [CrossRef] [PubMed]
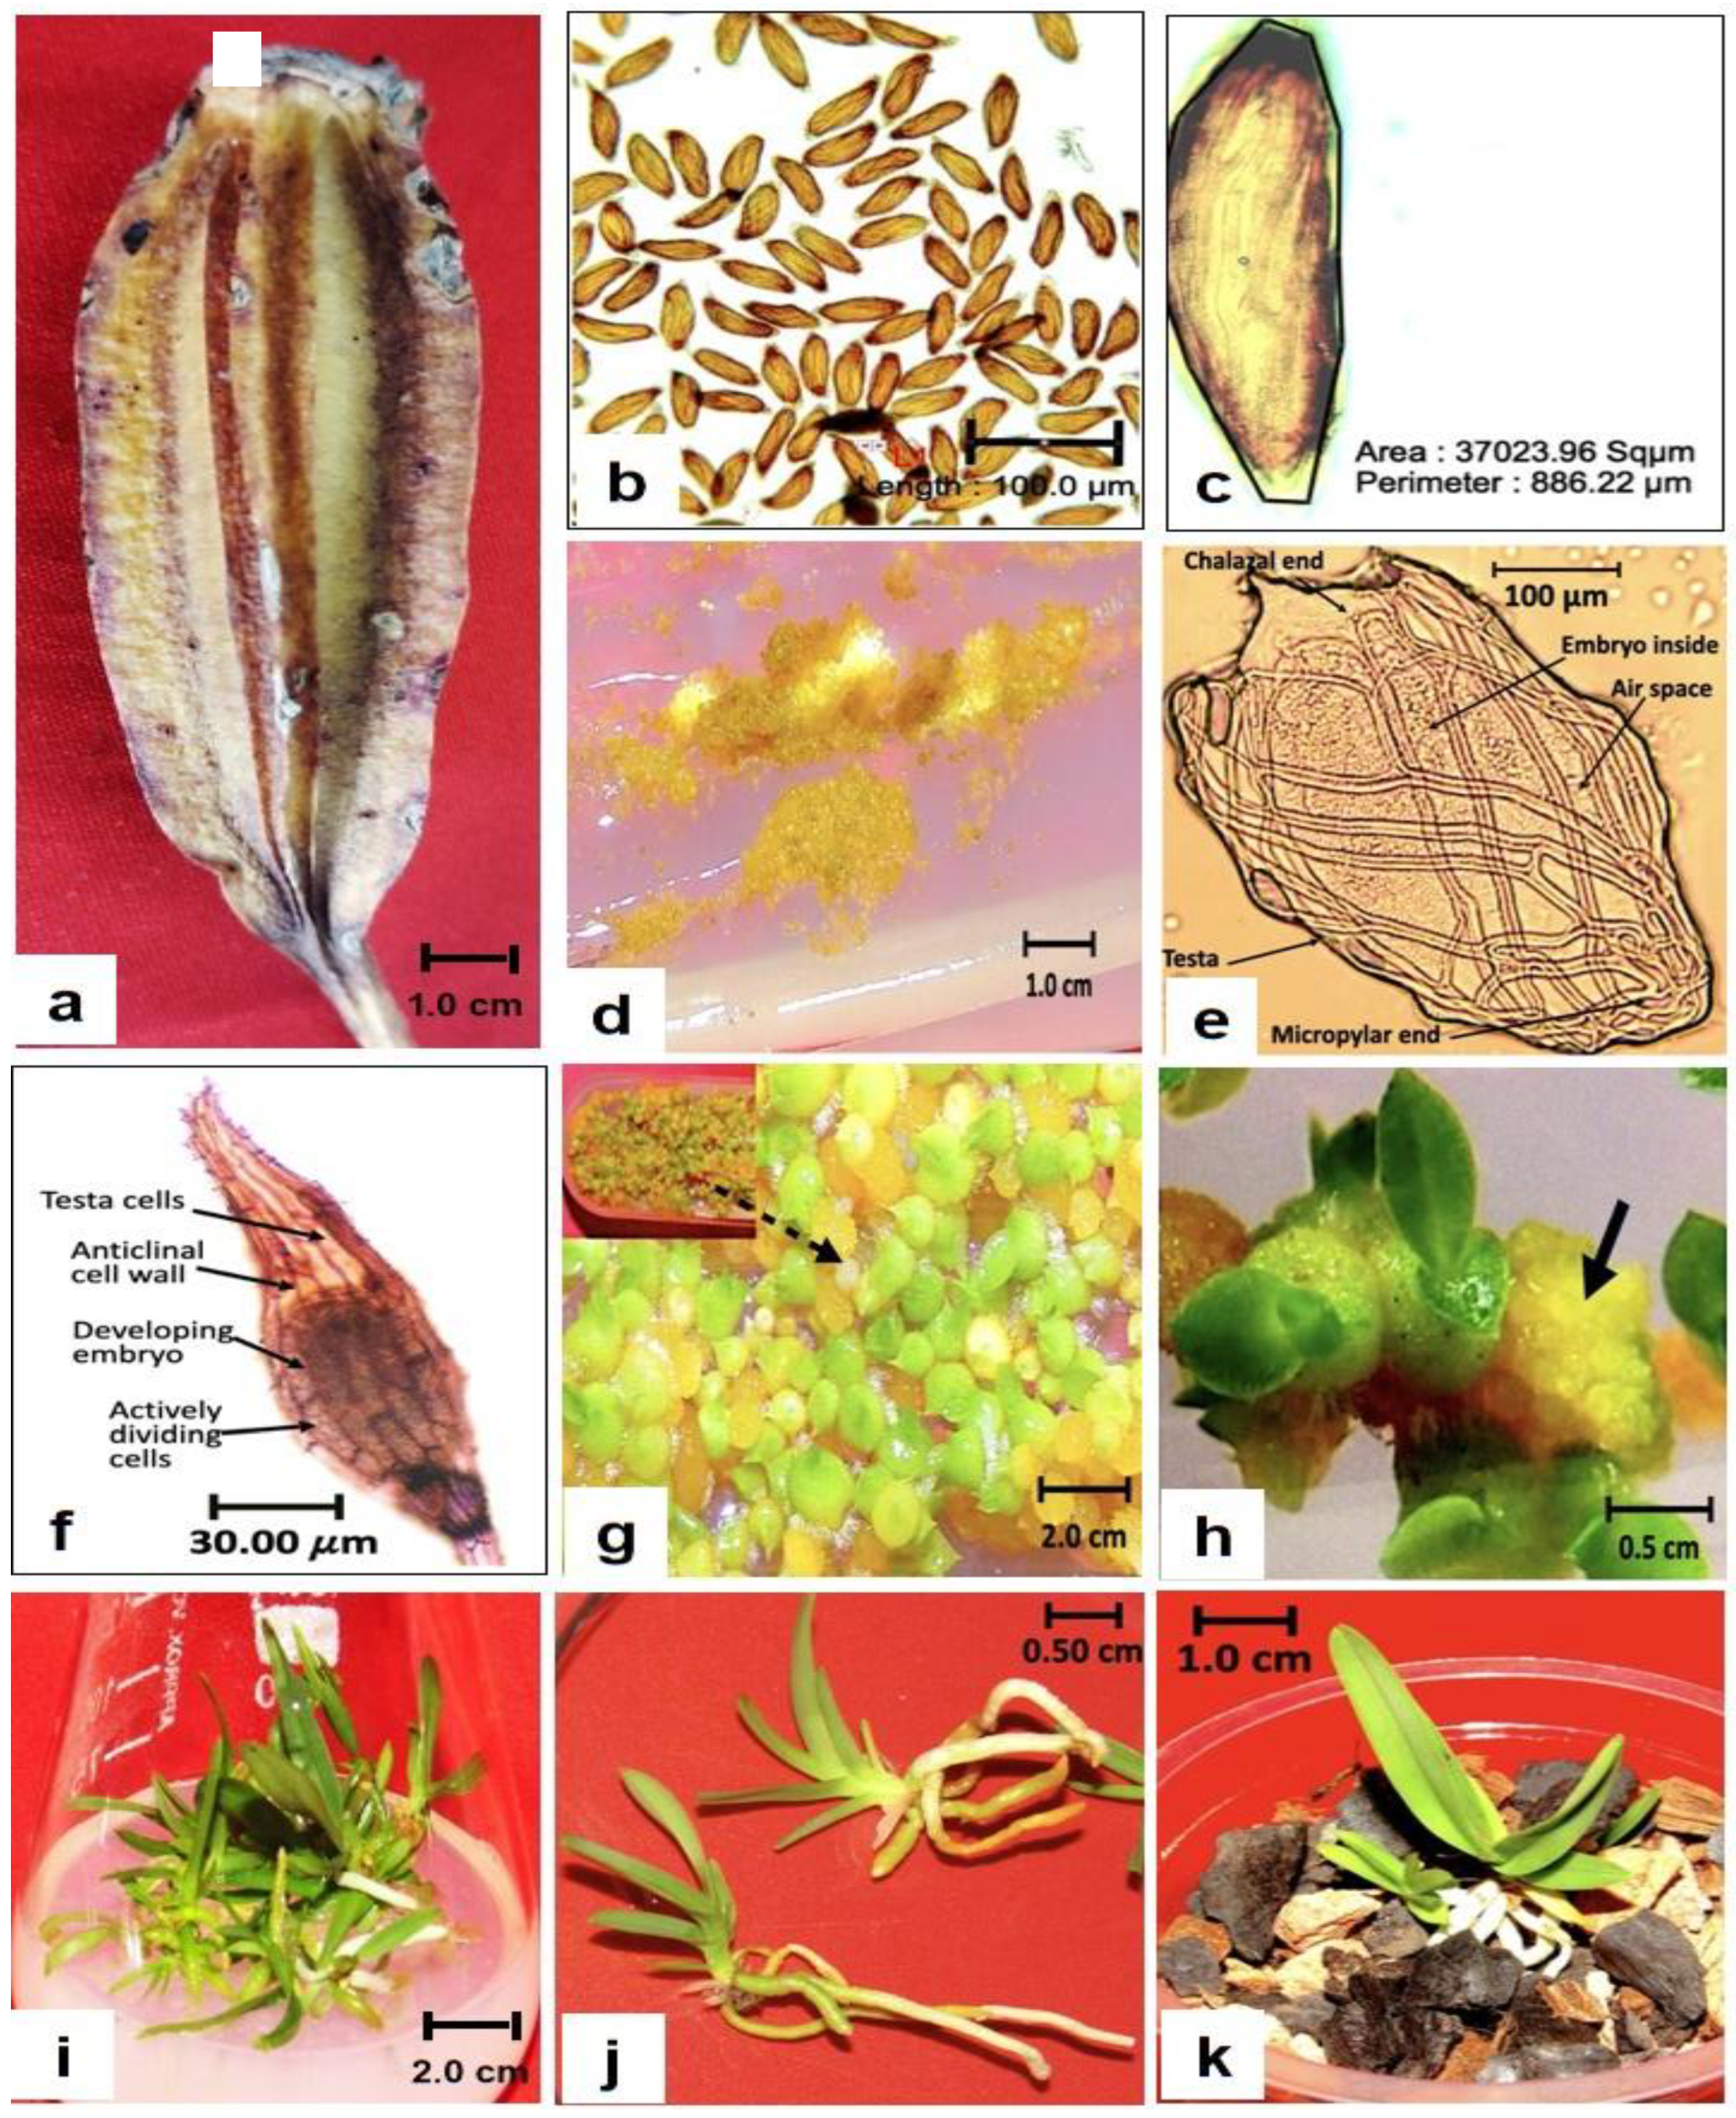
Figure 1. Asymbiotic seed germination and in vitro propagation of V. coerulea. (a) Mature capsule; (b) abundance of minuscule non-endospermic seeds; (c) measured dimension of a lightweight seed; (d) successful seed germination in basal medium; (e,f) microscope image of the germinated seeds (400×); (g) protocorm with first leaf primordium in M + 1.2 mgL−1 KN + 0.6 mgL−1 IBA; (h) protocorm multiplication (black arrow) in M + 1.2 mgL−1 KN + 0.6 mgL−1 NAA; (i) leaf development on M + 3.2 mgL−1 KN + 1.8 mgL−1 IAA; (j) root multiplication and elongation in M + 3.2 mgL−1 KN + 2.4 mgL−1 IAA; (k) hardening of in vitro-raised mature plant in plastic pot containing coconut husk, charcoal and bricks (1:1:1). Plastic pot size: capacity = 250 mL; top diameter = 3 inches; bottom diameter = 2 inches; height 3.5 inches.
Agronomy 15 01195 g001
Figure 2. Effect of different combinations and concentrations of auxins and cytokinins on protocorm formation (%) after the successful germination of seeds in basal medium. The mean values ± SD are based on ten replicates per treatment in three independent experiments.
Agronomy 15 01195 g002
Figure 3. Combined effect of cytokinins (BAP or KN) and auxins (IAA, IBA, or NAA) on the shoot formation of V. coerulea after 18 weeks of culture. The mean values ± SD bar labeled by the same letter are not significantly different according to the Duncan Multiple Range Test (p < 0.05).
Agronomy 15 01195 g003
Figure 4. Combined effect of cytokinins (BAP or KN) and auxins (IAA, IBA or NAA) on the leaf formation of V. coerulea after 18 weeks of culture.
Agronomy 15 01195 g004
Figure 5. Combined effect of BAP or KN with auxins on the root multiplication of V. coerulea after 18 weeks of culture. Mean values ± SD bar labeled by the same letter are not significantly different according to the Duncan Multiple Range Test (p < 0.05).
Agronomy 15 01195 g005
Figure 6. Transverse section (TS) leaf of V. coerulea: (a) portion of leaf showing major component- upper (UE) and lower (LE) epidermis, midvein (MV), cuticle (CU), vascular bundles (VB); (b) arrangement of homogenous mesophyll cells (HMC) across the leaf embedding vascular bundles (VB), sclerenchymatous cells (SCL) on both sides of the epidermis, and raphides (RP)—thin pointed gray lines; (c) enlarged view of epidermal component showing cuticle (CU) epidermis (EP), hypodermis (HY), cortex (CO); (d) vascular bundle with xylem (XY), phloem (PH), sclerenchymatous cells (SCLs), and water storage cells (WSCs); and (e) abaxial leaf surface showing the arrangement of epidermal cells (EPs) and stomata with guard cells (GCs) at 400×.
Agronomy 15 01195 g006
Figure 7. Transverse section (TS) root of V. coerulea: (a) the component of roots’ exovalamen (EXV), endovalamen (ENV), exodermis (EXO), corticle (COR) and endodermis (END); (b) enlarged view of the exoderm (400×); (c) magnified view (400×) of the endoderm and pith; and (d) enlarged view (400×) of the pith showing the xylem (XY), phloem (PH), and pericycle (PCY) embedded in sclerenchymatous tissue (SCL).
Agronomy 15 01195 g007
Figure 8. RAPD banding profiles obtained from in vitro-raised plants of V. coerulea. (a) OPC-07 and (b) OPA-13. L: 1 kb DNA ladder; MP: mother plant; P1–P9: randomly selected in vitro-regenerated plants.
Agronomy 15 01195 g008
Figure 9. ISSR banding profiles obtained from in vitro-raised plants of V. coerulea. (a) UBC-810 and (b) UBC-830. L: 1 kb DNA ladder; MP: mother plant; P1–P9: randomly selected in vitro-regenerated plants.
Agronomy 15 01195 g009
Figure 10. iPBS banding profiles obtained from in vitro-raised plants of V. coerulea. (a) 2077 and (b) 2392. L: 1 kb DNA ladder; MP: mother plant; P1–P9: randomly selected in vitro-regenerated plants.
Agronomy 15 01195 g010
Figure 11. SCoT banding profiles obtained from in vitro-raised plants of V. coerulea. (a) S6 and (b) S35. L: 1 kb DNA ladder; MP: mother plant; P1–P9: randomly selected in vitro-regenerated plants.
Agronomy 15 01195 g011
Figure 12. UPGMA dendrogram derived from the pooled data (RAPD + ISSR + iPBS + SCoT) showing the genetic relationship between the mother plant (MP) and randomly selected in vitro regenerants (P1 to P9) of V. coerulea.
Agronomy 15 01195 g012
Figure 13. Histogram of the flow cytometry analysis of the mother plant, MP, (a) and randomly selected in vitro-raised plantlets R1–R3 (bd) of V. coerulea.
Agronomy 15 01195 g013
Table 1. Effect of different plant growth regulators on protocorm formation and the development of the shoot meristem of V. coerulea.
Mitra Medium (M) + PGRs (mgL−1)Time Taken in Days for the Formation of
BAPKNIAAIBANAAProtocormShoot Apical Meristem
0000027.53 ± 0.98 ab38.44 ± 1.12 ab
1.2 0.6 26.69 ± 1.46 abc36.43 ± 0.79 bc
3.2 1.8 24.40 ± 1.43 bcd36.66 ± 1.21 bc
3.2 2.4 27.48 ± 1.01 ab36.32 ± 0.89 bc
1.2 0.6 26.42 ± 0.21 abc40.45 ± 1.32 ab
3.2 1.8 26.57 ± 0.76 abc39.30 ± 0.99 ab
3.2 2.4 24.67 ± 1.19 bcd36.53 ± 0.93 bc
1.2 0.616.39 ± 0.77 fg29.23 ± 0.62 b
3.2 1.823.59 ± 0.91 cd36.43 ± 0.81 de
3.2 2.428.39 ± 0.82 a41.35 ± 1.16 a
1.20.6 16.49 ± 1.23 fg26.69 ± 0.99 e
3.21.8 18.40 ± 0.85 ef32.63 ± 1.12 cd
3.22.4 16.43 ± 0.86 fg30.54 ± 1.01 de
1.2 0.6 21.67 ± 1.02 de35.29 ± 0.59 cd
3.2 1.8 17.63 ± 1.32 fg32.31 ± 0.63 de
3.2 2.4 16.38 ± 0.92 fg29.38 ± 0.76 de
1.2 0.616.53 ± 1.18 fg28.42 ± 0.91 de
3.2 1.814.42 ± 1.17 g26.35 ± 0.86 e
3.2 2.419.39 ± 1.01 ef31.47 ± 1.17 d
Mean values (±SD) within a column followed by the same letter are not significantly different according to the Duncan Multiple Range Test (p < 0.05). Values are based on ten replicates per treatment in three independent experiments.
Table 2. Effects of different plant growth regulators on shoot, leaf, and root length development of V. coerulea.
PGRs (mgL−1)Shoot Length (cm)Leaf Length (cm)Root Length (cm)
BAPKNIAAIBANAA
000000.38 ± 0.23 ik2.14 ± 0.26 ef1.24 ± 0.61 ef
1.2 0.6 0.48 ± 0.07 k2.01 ± 0.32 ef1.38 ± 0.32 ef
3.2 1.8 0.57 ± 0.12 ik2.22 ± 0.83 bcdef1.11 ± 0.09 f
3.2 2.4 0.42 ± 0.14 k1.95 ± 0.04 f2.35 ± 0.32 bcd
1.2 0.6 0.68 ± 0.07 dhi2.14 ± 0.68 bcdef1.41 ± 0.25 ef
3.2 1.8 0.76 ± 0.08 d2.21 ± 0.59 bcdef1.82 ± 0.27 de
3.2 2.4 0.71 ± 0.13 dhi2.30 ± 0.31 def2.11 ± 0.47 bcde
1.2 0.60.55 ± 0.13 ghik2.78 ± 0.85 bcdef1.99 ± 0.35 cde
3.2 1.80.53 ± 0.08 ik2.77 ± 0.16 bcde1.76 ± 0.18 e
3.2 2.40.48 ± 0.10 k2.76 ± 0.87 bcdef1.31 ± 0.14 f
1.20.6 1.27 ± 0.23 af2.97 ± 0.53 bcd3.21 ± 0.65 ab
3.21.8 1.62 ± 0.30 ab4.37 ± 0.21 a3.96 ± 0.29 a
3.22.4 1.18 ± 0.28 bcfg2.92 ± 0.31 bcde4.41 ± 0.56 a
1.2 0.6 1.38 ± 0.21 ac2.42 ± 0.63 bcdef2.64 ± 0.35 bc
3.2 1.8 1.34 ± 0.20 ae2.39 ± 0.15 def3.36 ± 0.61 ab
3.2 2.4 1.83 ± 0.30 a2.81 ± 0.31 bcd3.87 ± 0.28 a
1.2 0.60.73 ± 0.32 dfghijk2.68 ± 0.43 bcde3.71 ± 0.35 a
3.2 1.80.90 ± 0.22 cdefgh3.17 ± 0.51 b4.08 ± 0.56 a
3.2 2.41.36 ± 0.61 ad2.73 ± 0.61 bcde4.28 ± 0.52 a
The mean values (±SD) within a column followed by the same letter are not significantly different according to the Duncan Multiple Range Test (p < 0.05). Values are based on ten replicates per treatment in three independent experiments.
Table 3. RAPD primer details and banding profiles for assessing the genetic stability of V. coerulea.
RAPD Primer Sequence
(5′→3′)
Tm (°C)No. of Scorable BandsNo. of BandsPercentage ofBand Size
(bp)
MonomorphicPolymorphicMonomorphismPolymorphism
OPA-015′-CAG2C3T2C-3′34.00404-100-1500–500
OPA-045′-A2TCG3CTG-3′32.00505-100-2000–250
OPA-055′-AG4TCT2G-3′32.004030175251500–250
OPA-115′-CA2TCGC2GT-3′32.00505-100-2000–250
OPA-135′-CAGCAC3AC-3′34.00505-100-2000–500
OPB-025′-TGATC3TG2-3′32.00404-100-1500–250
OPC-075′-GTC3GACGA-3′34.00404-100-1000–250
OPD-015′-AC2GCGA2CG-3′34.00606-100-1500–250
OPE-075′-AGATGCAGC2-3′32.00808-100-2000–500
OPF-145′-TGC2AG2T-3′32.00606-100-2000–250
Total 51500197.502.5-
Table 4. ISSR primer details and banding profile for assessing the genetic stability of V. coerulea.
ISSR Primer Sequence
(5′→3′)
Tm
(°C)
No. of Scorable BandsNo. of BandsPercentage Degree ofBand Size
(bp)
MonomorphicPolymorphic MonomorphismPolymorphism
UBC-8075′-(AG)8T-3′47.00505-100-2000–250
UBC-8105′-(GA)8T-3′45.40303-100-1500–750
UBC-8155′-(CT)8G-3′46.80404-100-1500–250
UBC-8245′-(TC)8G-3′48.511080372.7327.271500–250
UBC-8275′-(AC)9G-3′53.00808-100-2000–250
UBC-8305′-(TG)8G-3′52.70606-100-1000–200
UBC-8355′-(AG)8YC-3′50.20505-100-1500–250
UBC-8485′-(CA)7CRG-3′52.60505-100-2000–500
UBC-8605′-(TG)8RA-3′53.10707-100-2000–250
UBC-8685′-(TG)8RA-3′43.21111-100-2000–250
Total 65620397.27%2.73%
Table 5. iPBS primer details and banding profiles for assessing the genetic stability of V. coerulea.
iPBSPrimer Sequence
(5′→3′)
Tm (°C)No. of Scorable BandsNo. of BandsPercentage ofBand Size
(bp)
MonomorphicPolymorphicMonomorphismPolymorphism
20775′-CTCACGATGCCA-3′42.50807187.512.51500–250
20835′-CTTCTAGCGCCA-3′42.00505-100-2000–500
22205′-ACCTGGCTC(ATG)2CCA-3′56.80606-100-1000–250
22495′-AACCGACCTCTGATACCA-3′52.40505-100-2000–500
22715′-GGCTCGGATGCCA-3′51.20505-100-2000–250
23925′-TAGATGGTGCCA-3′45.41313-100-1500–500
23985′-(CAA)2TGGCTACCACCG-3′45.40404-100-2000–500
23995′-(A)3CTGGCAACGGCGCCA-3′45.40606-100-1500–250
24025′-TCTAAGCTCTTGATACCA-3′45.40707-100-1500–250
24085′-(CAA)2TGGCTACCACGT-3′45.40909-100-2000–250
24155′-CATCGTAGGTG3CGCCA-3′60.50505-100-1500–250
Total 73720198.861.14
Table 6. SCoT primer details and banding profiles for assessing the genetic stability of V. coerulea.
SCOT
Primer
Primer Sequence
(5′→3′)
Tm
(°C)
No. of Scorable BandsNo. of BandsPercentage ofBand Size
(bp)
MonomorphicPolymorphic MonomorphismPolymorphism
S15′-(CAA)2TGGCTA(CCA)2-3′52.60303-100-2000–500
S35′-(CAA)2TGGCTACCACCG-3′53.90404-100-1500–250
S55′-(CAA)2TGGCTACCACGA-3′52.608060275.0251500–250
S65′-(CCA)2TGGCTACCACGC-3′54.40505-100-1500–250
S105′-(CCA)2TGGCTACCAGCC-3′53.90707-100-2000–250
S125′-ACGACATGGCGACCAACG-3′58.40404-100-2000–250
S175′-ACCATGGCT(ACC)2GAG-3′57.10404-100-2000–500
S185′-ACCATGGCT(ACC)2GCC-3′60.70505-100-2000–500
S285′-CCATGGCTACCACCGCCA-3′60.70505-100-2000–250
S305′-CCATGGCTACCACCGGCG-3′61.80404-100-1500–250
S355′-CATGGCTACCAC3GC3-3′61.70909-100-2000–250
Total 58560297.732.27
Disclaimer/Publisher’s Note: The statements, opinions and data contained in all publications are solely those of the individual author(s) and contributor(s) and not of MDPI and/or the editor(s). MDPI and/or the editor(s) disclaim responsibility for any injury to people or property resulting from any ideas, methods, instructions or products referred to in the content.