Article

Optimizing Maize Agronomic Performance Through Adaptive Management Systems in the Mid-Atlantic United States

1
Tidewater Agricultural Research and Extension Center, Virginia Tech, Suffolk, VA 23437, USA
2
Oklahoma State University, Stillwater, OK 74078, USA
3
Eastern Shore Agricultural Research and Extension Center, Virginia Tech, 33446 Research Drive, Painter, VA 23420, USA
*
Author to whom correspondence should be addressed.
Agronomy 2025, 15(5), 1059; https://doi.org/10.3390/agronomy15051059
Submission received: 9 April 2025 / Revised: 25 April 2025 / Accepted: 25 April 2025 / Published: 27 April 2025

Abstract

:
Maize (corn) (Zea mays L.) yield is influenced by complex factors, including abiotic and biotic stress and inconsistent nutrient use efficiency, which challenge optimal yield. Standard management recommendations often fall short, prompting interest in intensive management strategies within an Adaptive Maize Management System (ACMS). To investigate this, we employed an addition/omission technique within a randomized complete block design (RCBD) to compare standard maize management recommendations with an intensive management protocol aimed at identifying yield-limiting factors. Our intensive management approach combined early-season biostimulant applications with mid-season supplementation of phosphorus (P), potassium (K), and nitrogen (N) at the V7 stage, followed by foliar fungicides and additional foliar N at the R1 stage. Field trials spanned five Virginia locations over 2022 and 2023 under both irrigated and non-irrigated conditions, yielding ten site-years of data. Analysis via ANOVA in JMP® Version 18 with Dunnett’s test revealed that the intensive management approach significantly increased grain yield in 3 of 10 experiments. Under non-irrigated conditions, the intensive management practices averaged 5.9% higher yield than the standard management check. We observed a higher response to irrigation in standard management check (34%) than in intensive management check (8.9%). Site-specific irrigation impacts ranged from 14% to 61%. Results emphasize site-specific input recommendations for yield enhancement.

1. Introduction

With the global population projected to exceed 9.8 billion by 2050, agricultural production and efficiency needs to increase to meet the demand for food and fuel [1,2,3]. Two main strategies have historically been employed to increase productivity and efficiency: intensification boosting yield per unit area through increased inputs, particularly fertilizers, irrigating drylands, and novel technologies and extensification involving cultivating more land [3,4,5,6,7]. The latter is less sustainable and is characterized by environmental footprints and is less resilient against pressure of increasing population on land [5,7]. Recent research interests have increasingly focused on intensification as a sustainable strategy, with an emphasis on identifying and addressing yield gaps and yield-limiting factors, especially in grain crops of maize (Zea mays L), wheat (Triticum aestivum), and rice (Oryza sativa) [4,5,8,9]. Maize is one of the intensively managed crops in the United States, covering an approximately 39.1 million hectares, supporting food, fuels, and other industrial purposes. However, the yield of maize is highly variable due to input inefficiencies and weather-related factors leaving a significant gap between its actual and potential yields [8,10]. This gap is particularly pronounced in Virginia, where the average maize yield of 6.8 tons ha−1 is well below the record yield of 15.91 tons ha−1 achieved in the 2023, National Corn Growers Association yield contest [11]. Research indicates that yield variability is primarily driven by environmental factors, as well as static recommendations that do not account for changes in the environment [8,9,10,12].
In Virginia, especially on the east coast of VA, where soil is largely sandy with lower CEC, the applied N, P, K, and sulfur (S) fertilizers are susceptible to losses into the environment especially with increasing precipitation [12]. Among these nutrients, N is the number one yield-limiting factor for maize, which is demanded in the greatest quantity throughout the maize plant growth cycle and is a severely limiting nutrient in the U.S. Maize Belt [13,14,15]. Weather impacts reduce the available nutrients, and according to Reiter, et al. [12], up to 11 to 36 kg ha−1 of the principally applied pre-plant or side dressing rates may be lost in incidents when heavy rain coincides with nutrient applications. Frame [16], in a farmer communication bulletin, suggested that supplementing with a few doses of about 11 to 35 kg ha−1 of N, K, and S during such periods in the season can replace the lost nutrients. Consistent with [8,9,17], this research suggests that synchronizing nutrient availability with the crop demand achievable through split applications via several side dressing and foliar applications can correct seasonal deficiency.
Beyond nitrogen, phosphorus is indispensable in maize production, as it achieves the highest harvest index among all nutrients yet remains the least available in soils [18,19,20]. Phosphorus is the most yield-limiting nutrient, especially in cold soils early in the season, that is necessary for early growth [18]. Although most soils in VA (approximately 58%) test high for P, many sites observe early season deficiencies, and some sites respond to P applications [21,22,23]. Other secondary nutrients such as sulfur also play pivotal roles in maize yield. Sulfur deficiency has been increasingly reported in the U.S. Maize Belt due to reduced atmospheric deposition, higher maize grain yields, diminished tillage intensity, and increased adoption of sustainable agriculture [24,25]. Seasonal sulfur depletion due to weather events can be corrected by timely supplementation to protect yields from losses [12,16].
Apart from nutrient limitations, maize is vulnerable to several foliar fungal diseases such as gray leaf spot (Cercospora zeae-maydis), northern leaf blight (Exserohilum turcicum), southern rust (Puccinia polysora), and eyespot (Aureobasidium zeae) [26,27,28]. These diseases compromise yield, especially in high rainfall regions like Virginia, by reducing the plant’s photosynthetic area and weakening stalk strength, leading to lodging and reduced harvestability [26]. In the past, systemic foliar fungicide application in maize has been given attention, especially quinone-outside inhibitors (strobilurin fungicides), due to their additional physiological impacts on maize. These fungicides not only control a broad spectrum of fungal pathogens [28,29] but have also been shown to boost yields even when disease symptoms are not apparent, possibly by enhancing photosynthetic capacity and reducing grain development [28,29,30].
In the United States, standard maize management typically involves applying approximately one-third of the total nitrogen required for the season at or near planting, with the remainder often applied at a fixed predetermined rate during side dressing normally at about V4–V6 maize growth stages [8,12,31]. This static approach assumes normal growing season conditions and does not account for any deviations from the known normal, and there are limited additional tools to guide in-season management to counteract yield losses. Although adaptive practices such as irrigation, fungicides, biostimulants, and supplementation of nutrients during the season to correct deficiency can advance yield, their adoption remains low. Morris, et al. [31] described this static yield-driven recommendation as a trial-and-error approach to crop management. Moreover, recent research aimed at identifying factors often examines these variables in isolation, overlooking the combined effects that arise when multiple factors are applied together. Consequently, farmers lack the necessary insights to effectively implement intensive management practices and enhance their operations within ACMS.
To address these challenges, we employed a randomized block design utilizing an omission technique, [32] comparing two management approaches: a “standard” management approach based on standard extension recommendations such as the Virginia Cooperative Extension (VCE) for the case of Virginia, and an “intensive” approach incorporating comprehensive management suggestions hypothesized to advance yield. Five distinct treatments were evaluated under each of these strategies, serving as either “additions” when individual treatments are added singly at each level to standard management protocol, or “omissions”: when individual treatments are omitted from the intensive management protocol at each level. This methodology facilitated the evaluation of both individual and combined effects of treatments under standard management approach and intensification approach, allowing for a comparison between standard and intensive management strategies. This study aimed to assess the effectiveness of both practices in improving maize yields and identifying yield-limiting factors crucial for advancing yield in a new management suggestion under ACMS.

2. Materials and Methods

2.1. Study Site Characterization

Over the 2022 and 2023 growing seasons, ten investigations were executed across diverse Virginia sites. In 2022, experiments took place at Blacksburg (37°11′23″ N 80°34′35″ W), New Kent (37°31′ N 77°00′ W), and Mt. Holly (38.1573° N, 77.9297° W); in 2023, research continued at Mt. Holly and expanded to Suffolk at Tidewater Agricultural Research and Extension Center (TAREC) (36.68106 N−76.76801 W). Before planting, composite soil samples were collected by combining fifteen cores taken from a 15 cm depth across the site. These composite soil samples were analyzed for routine parameters pH (1:1), cation exchange capacity (CEC), and extractable nutrients via the Mehlich-1 method (Table 1). The soil analysis was conducted by Virginia Tech soil Analytical Laboratory, located in Blacksburg, Virginia on the main campus. Details of the laboratory can be found at https://www.soiltest.vt.edu/ (accessed on 19 April 2025). The soil types at the experimental sites varied and were delineated as follows: At the Blacksburg site, soils were classified as Braddock and Unison silt loams (fine, mixed, semiactive, mesic Typic Hapludalt). At the Mt. Holly site, soils were described as State fine sandy loam (fine-loamy, mixed, semiactive, thermic Typic Hapludult). At the New Kent site, soils comprised Teetotums loam and the Nervarc–Remlik complex, while at the TAREC site, soils were characterized as loamy sand (fine-loamy, siliceous, semiactive, thermic Typic Hapludult). For soil classification details on the study sites visit https://websoilsurvey.nrcs.usda.gov/app/WebSoilSurvey.aspx (accessed on 19 April 2015). These sites also varied in tillage practices as well as cropping rotations. The three sites, New Kent, Mt. Holly, and Blacksburg, were managed without tillage, while TAREC was managed by strip-tillage. In terms of rotation, New Kent maize followed soybeans and had a mixed cover crop of rye and hairy vetch terminated before planting. The Blacksburg site was managed with continuous maize with barley cover crops terminated before planting, while the Mt. Holly and TAREC sites reestablished fields on the previous season’s soybean and cotton stubble, respectively.

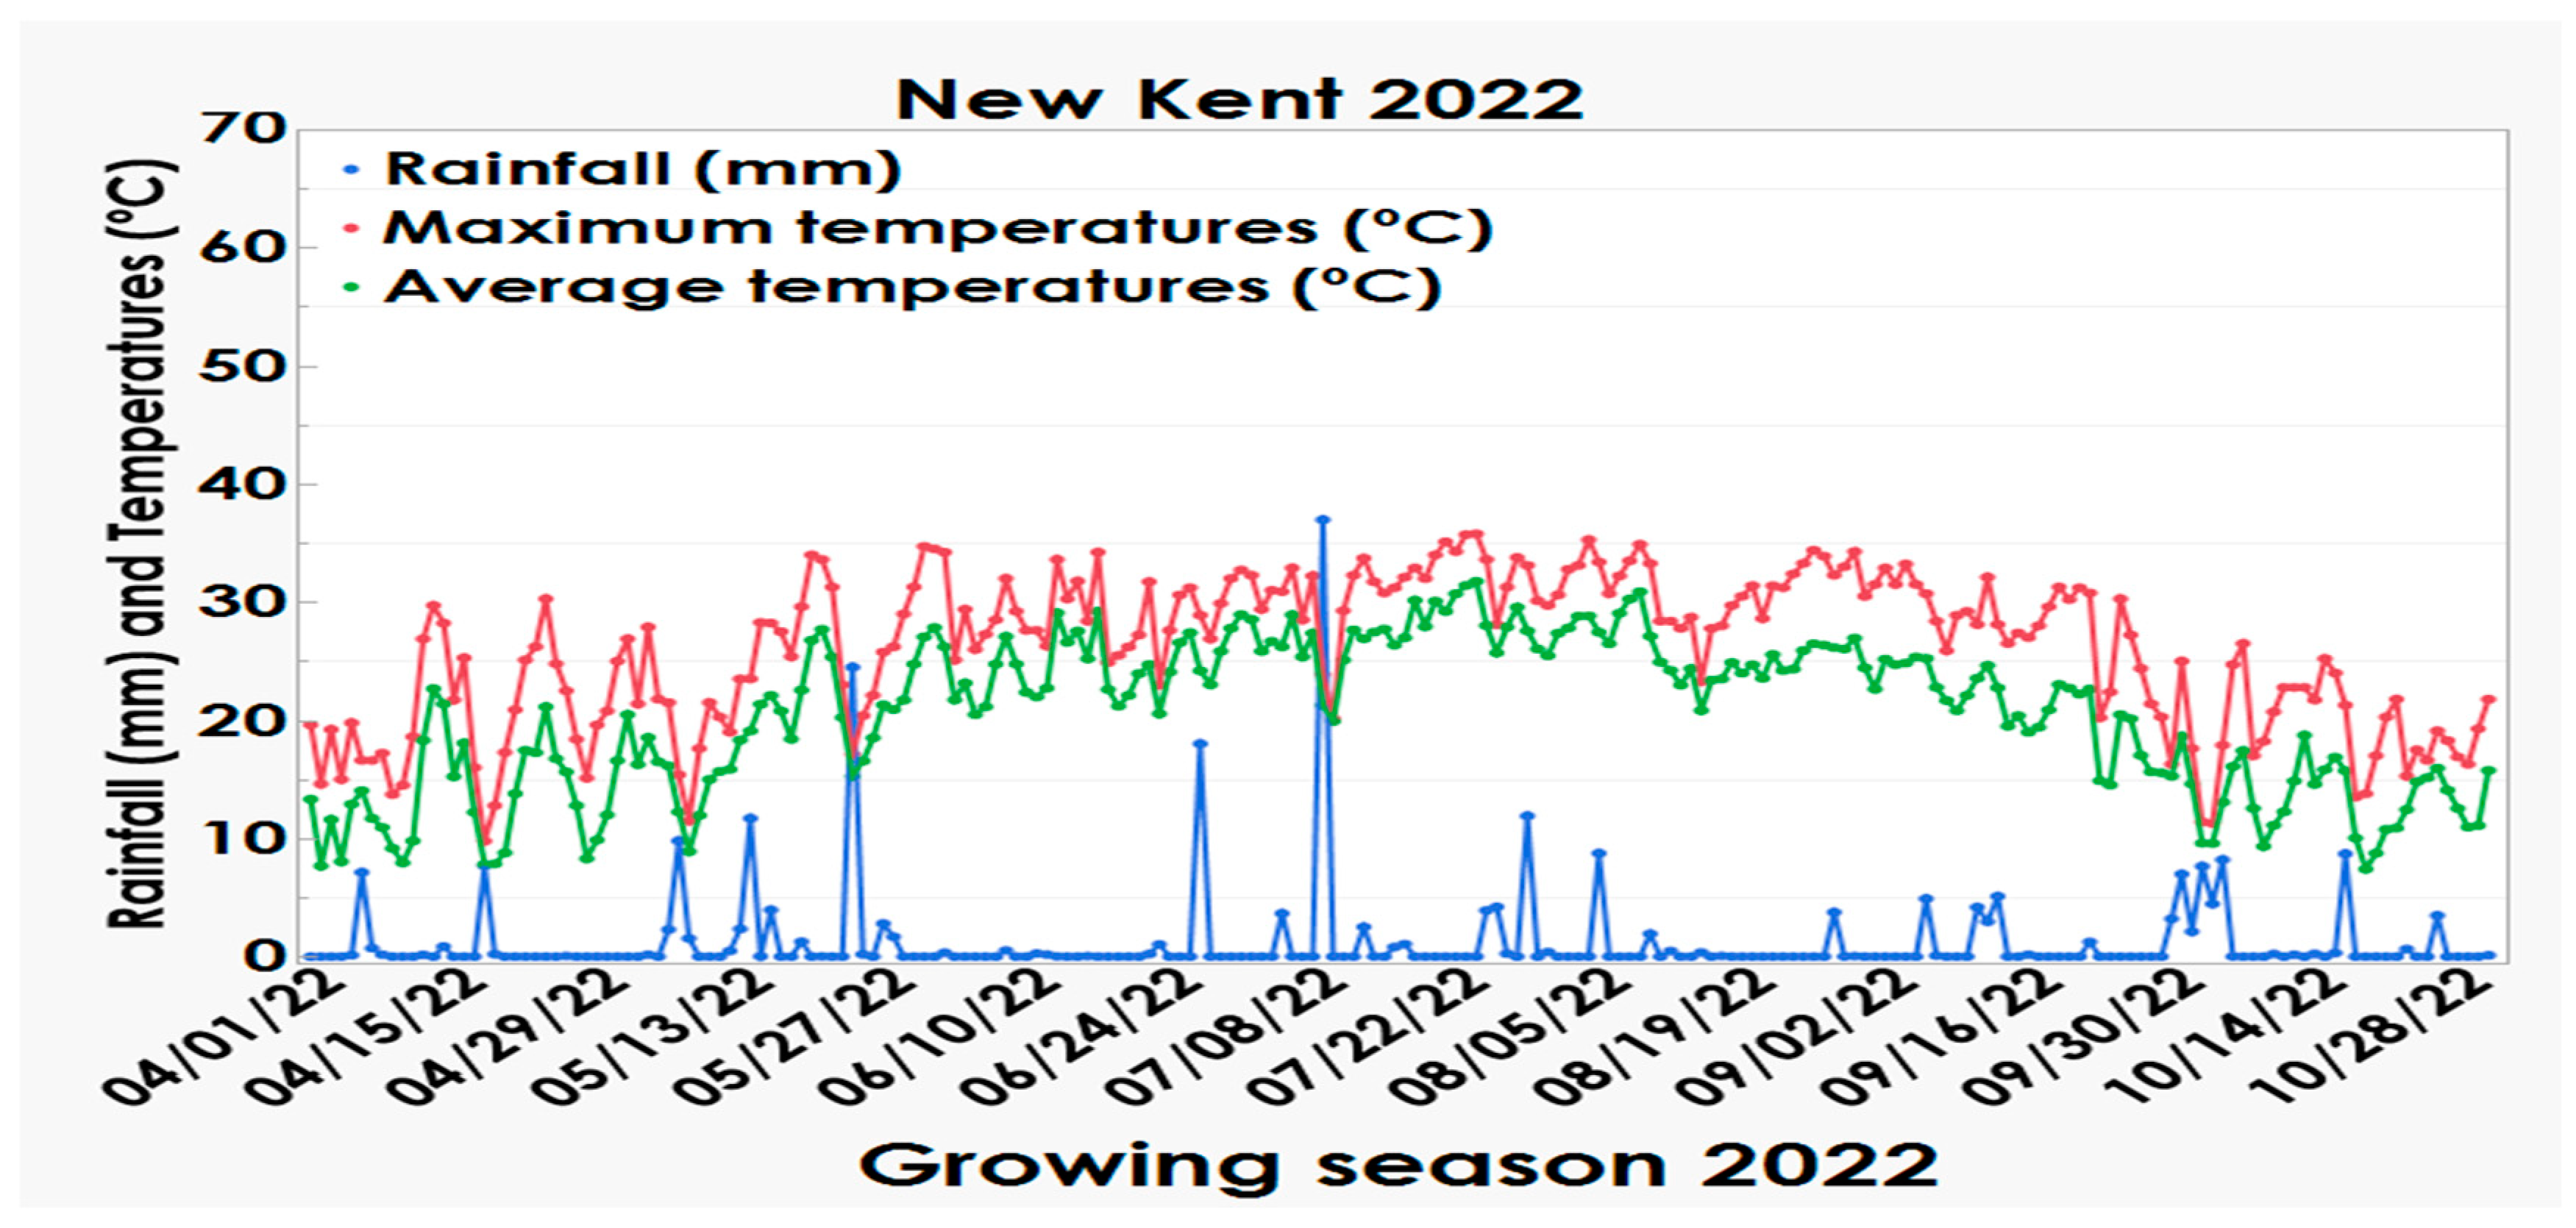
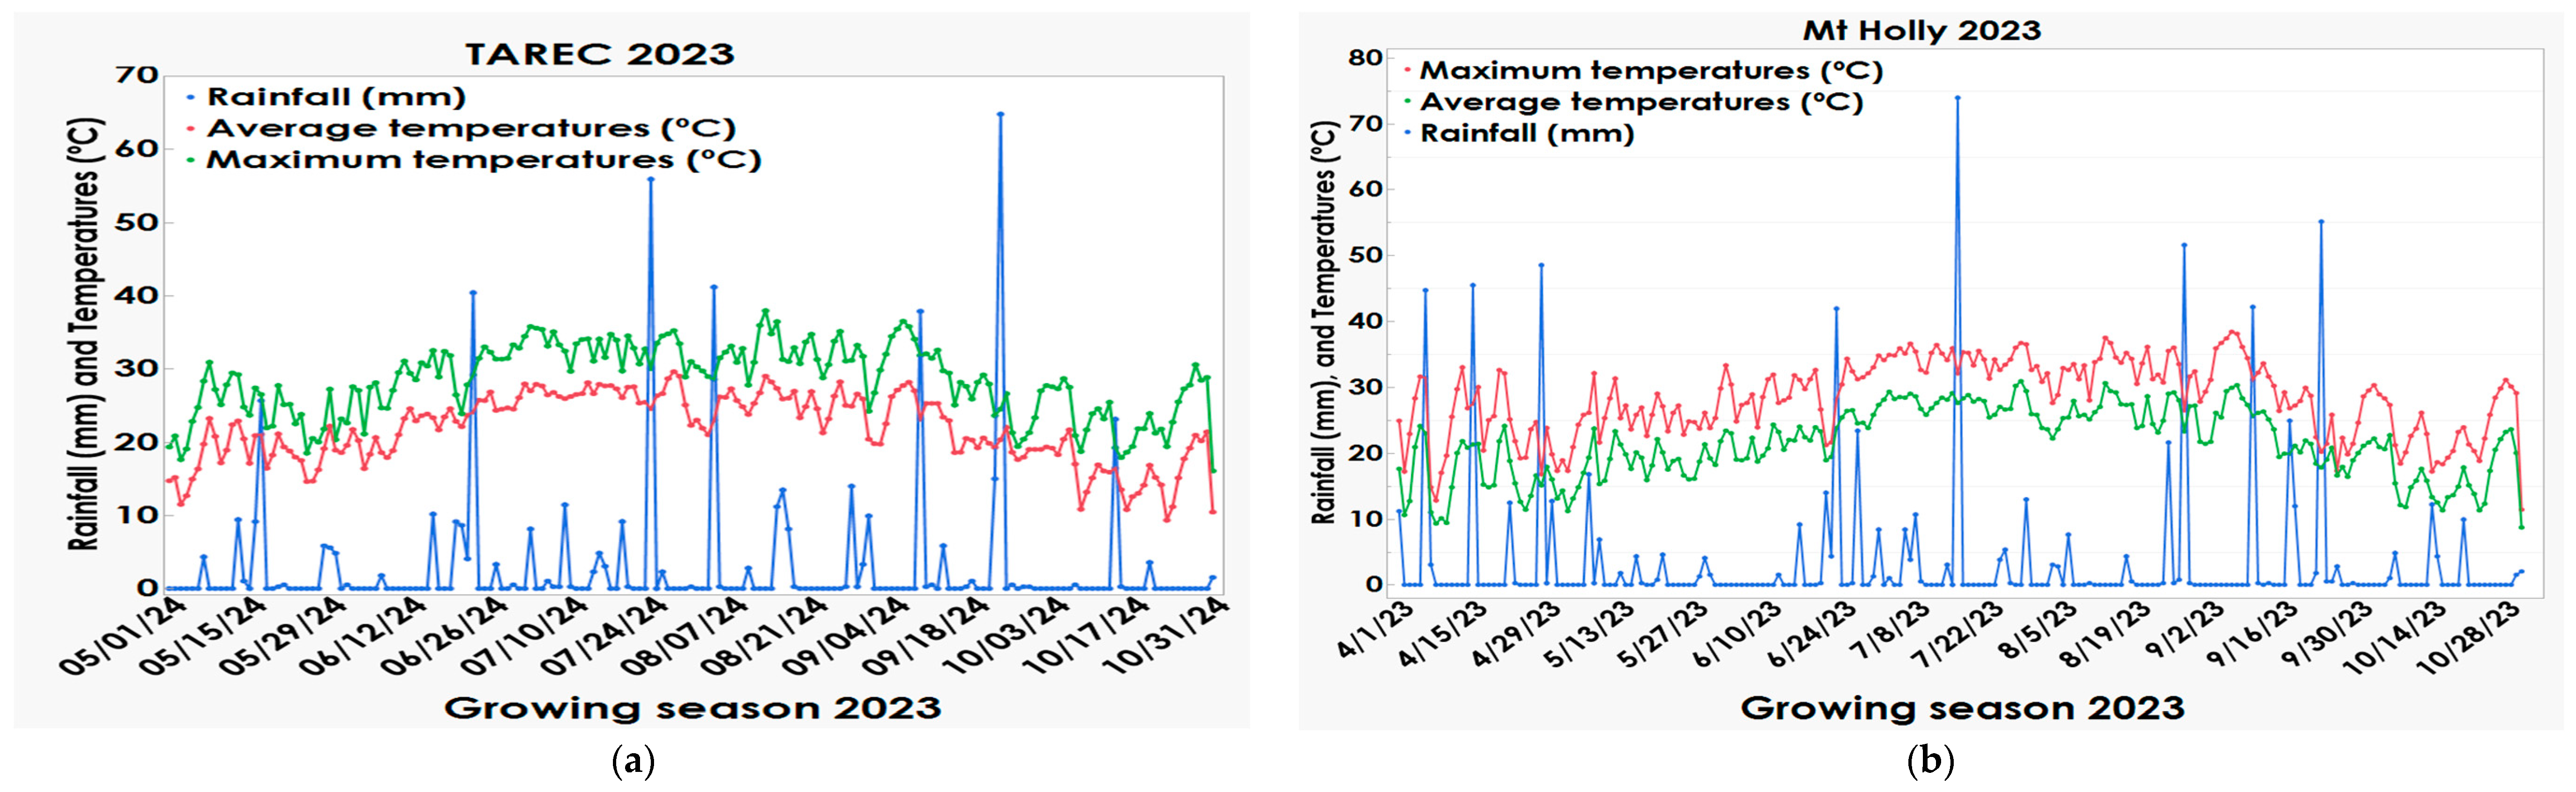
2.2. Weather Conditions

Weather during the growing season varied across the studied years (2022–2023). Specifically, the weather at the Blacksburg site was characterized by consistently lower daily rainfall (0–10 mm) for the largest part of the growing season, except the notable peaks exceeding 50 mm from late September to October (Figure 1a). The Mt. Holly site in 2022 experienced more erratic rainfall patterns, with substantial spikes above 100 mm of daily rainfall occurring from May to June, which were periods wherein fertilizer application saw increasing susceptibility to nutrient losses. July to August had consistently lower but uniform peaks of daily average precipitation throughout the season (Figure 1b). Like the Blacksburg site, the New Kent site in 2022 received consistently moderate rainfall, rarely surpassing 20 mm of daily rainfall but regular, with only two peaks at 40 to 50 mm during May and July, which are critical periods for nutrient uptake (Figure 2). At the TAREC location, the period from the end of April to May 5 was had no rainfall, as well as the 24 May to 29 May and 29 May to 12 June periods. The site also experienced 3 heavy peaks of daily rainfall between 50 and 60 mm in June, which was the period for additional fertilizer applications, and July, which was the period for supplemental foliar nitrogen applications. Mt. Holly in 2023 also received heavy rainfall events, exceeding 50 mm in April, June, and July, which coincided with nutrient application which according to [1], may have reduced the availability of applied nutrients (Figure 3b).
Temperature patterns were also distinctive across these sites. Blacksburg in 2022 experienced maximum temperatures reaching 30 °C, with a relatively moderate range during the season, potentially reducing extreme heat stress but still impacting nutrient uptake (Figure 1a). Mt. Holly in 2022 showed greater fluctuation, with temperatures varying between 25 °C and 35 °C (Figure 1b). New Kent in 2022 had similar temperature ranges, between 25 °C and 35 °C, but combined with lower daily average rainfall, which likely exacerbated water and nutrient stress (Figure 2). Mt. Holly in 2023, like the TAREC site in the same year, experienced maximum temperatures consistently hovering between 30 °C and 35 °C, with some days clocking above 35 °C, which likely increased heat stress risks, and high evapotranspiration, affecting nutrient availability, uptake efficiency, and biostimulant efficacy (Figure 3a, b).

2.3. Experimental Details

Experimental plots were established at a uniform width of 3.05 m, each containing four maize rows of 0.91 m. At the Suffolk location, plots were 10.7 m in length, whereas plots at other sites were 9.14 m long. In eight trials, the corn hybrid Progeny 9714® (Progeny Ag Products, Wynne, AR 72396, USA), a 114-day maturing maize hybrid, was planted, while two experiments in 2023 at Suffolk used the 115-day maturity DeKalb 65-20® hybrid (Bayer Crop Science, Research Triangle Park, NC 27709, USA). Planting was timed based on optimal weather and soil conditions: in 2022, planting occurred on 5 May (Blacksburg), 21 April (Mt. Holly in 2022), and 4 May (New Kent), and in 2023 on 18 April (Suffolk) and 21 April (Mt. Holly in 2023).

2.4. Experimental Design and Treatments

The experiment was implemented using an addition/omission technique in RCBD to compare the intensive approach, following standard grower practice in the region [32]. For specific information on the maize standard input recommendations in Virginia, visit the detailed Virginia Agronomy Handbook, which is updated regularly [33,34]. The standard management approach involved planting high-yield hybrid cultivars at seeding rates of 65,000–75,000 seeds ha−1, customized to each site’s yield potential. Then, standard rates for N, P, K, and other nutrients were applied according to the site-specific yield goal (considering site’s yield potential, soil types, and soil test results). Specifically, nitrogen (N) was split into two parts: one-third at planting and the remaining two-thirds at the V4–V6 growth stages [35]. For other nutrients (P, K, and S), these were applied pre-plant, which marked the standard management approach for all the study sites, which functioned as a foundation for this study. Standard nutrient application rates varied by sites and environmental conditions as well as the site-specific yield goals. At Blacksburg, both irrigated and non-irrigated plots received 211 kg ha−1 of nitrogen (N), 109 kg ha−1 of phosphorus (P), and 109 kg ha−1 of potassium (K). At Mt. Holly, N was consistently applied at 211 kg ha−1 across both irrigation regimes; however, P and K rates varied by irrigation status, with non-irrigated plots receiving 78 kg ha−1 of P and 111 kg ha−1 of K, while irrigated plots received lower fertilizer rates at 67 kg ha−1 of P and 39 kg ha−1 of K. At the New Kent site, N was applied at 185 kg ha−1, while both P and K were applied at 44 kg ha−1 for both irrigated and non-irrigated plots.
Following the implementation of standard recommendations described above, which functioned as the “standard management check”, standard management treatments were applied as indicated in Table 2. Specifically, each of the five (5) strategies were added singly to the standard management check at each level, resulting in five treatment combinations comparable to the standard management protocol (Table 2). Intensive management incorporated all five inputs together. Each of the five strategies was removed (omission”) singly at each level, resulting in five treatment combinations different by one treatment, all being comparable to intensive management (Table 2).
These treatments were added as follows: The early season biostimulants (+Biologicals) were applied from a branded product (Biopath®) sourced from Response Inc (Raleigh, NC, USA). The biostimulants were mixed at a rate of 1235 mL ha−1 and applied foliar at V4. To supplement nutrient availability, additional nitrogen (+Side-dress N) at 45 kg ha−1 and additional P and K (+P and K) at 56 kg ha−1 were applied from granular sources of urea, monoammonium phosphate, and muriate of potash for N, P, and K, respectively, by broadcasting at V6 maize stage. This was followed by application of additional foliar nitrogen (+CoRon®) late in the season from a branded nitrogen product “CoRon®.” This was mixed at a rate of 2.5 L ha−1 to supply 22.5 kg ha−1. During this time, a foliar fungicide (Headline®) (+Headline®), which is a quinone-outside inhibitor (strobilurin fungicides), was applied in a separate tank at 251 mL of a product ha−1 to protect the crop from any possible fungal diseases.
Each of these arrangements at each location featured both irrigated and non-irrigated experiments. Each of the irrigated and non-irrigated studies were established side-by-side at 3 locations, except at the Mt. Holly location where the irrigated and non-irrigated studies were at a separate location due to the logistics involved in installation of irrigation system. At all sites, meteorological data were sourced from the nearby Weather Stem stations managed by the College of Agriculture and Life Sciences, Virginia Tech (https://vt-arec.weatherstem.com/data), accessed on 29 October 2024. The site’s meteorological characteristics guided the irrigation scheduling.

2.5. Data Collection and Analysis

Grain yield was determined by harvesting the two central rows of each experimental plot using a Massey Ferguson 8XP combine (Massey Ferguson Corporation, Duluth, GA, USA) equipped with a HarvestMaster Classic Graingauge (HarvestMaster, Logan, UT, USA). The raw yield data were standardized to 15.5% moisture and expressed in kg ha−1. Initially, data from all site-years across various locations were pooled and analyzed using analysis of variance (ANOVA) in JMP® Version 18 (SAS Institute Inc., Cary, NC, USA). Dunnett’s test was employed to compare each treatment against its respective control [36]. In this analysis, year and location were treated as random effects, while treatments and environment (irrigation status) were considered fixed factors, capturing both main effects and interactions. Due to significant variability observed across years and locations, a final analysis was conducted separately for each environment (irrigation status) to better elucidate treatment effects within each management level (standard and intensive). For treatment comparisons, separate ANOVAs followed by Dunnett’s test at a 90% confidence level were performed. Specifically, standard management treatments were compared to the standard management check, and intensive management treatments were compared to the intensive management check.

3. Results

Effect of Irrigation, Management Levels, and Treatments on Grain Yield

Averaged across all sites and years, irrigation consistently enhanced yields relative to non-irrigated conditions, although the magnitude varied by management strategy (Table 3 and Table 4). Under the intensive management check, irrigation boosted yields ranging from −6 at Blacksburg to 38% at Mt. Holly in the 2022 growing season, averaging 8.9%. For standard management check, irrigation response was higher with grain yield enhancement, ranging from 14% at Mt. Holly in 2023 to 61% at TAREC averaging 34% (Table 3). These findings highlight the critical benefits of tailoring management strategies to site-specific challenges. Given that TAREC had an early drought that coincided with early season nutrient application, irrigation during that critical period increased nutrient uptake and enhanced plant cooling and photosynthesis, resulting in greater yield compared to that of the non-irrigated plot.
A comparison of standard and intensive management check treatments revealed that statistically significant differences were infrequently observed, occurring in only three out of ten experiments. Specifically, two of these significant findings emerged from non-irrigated intensive management checks, while only one was observed under the standard irrigated check. On average, the intensification strategy (intensive management check) produced a 5.9% yield gain compared to standard management checks in non-irrigated conditions; however, this advantage was rarely detected under irrigated conditions (Table 3 and Table 4).
Under the standard management, the addition of supplemental nitrogen (+Side-dress N) through side-dress exhibited a significant influence at three of the ten sites, with two of them showing lower yields compared to standard check (†Standard management check) while the other two treatments (+Headline®, +P and K) each had positively significant impact at 2 of 10 sites, with only one showing higher yield than the standard management check. The +Biological treatment was effective only at the Suffolk non-irrigated site, where it raised yield from 8685 kg ha−1 in the standard check to 14,238 kg ha−1, while the addition of +P and K and +Side-dress N at TAREC under non-irrigated conditions in 2023 enhanced yield from 8685 kg ha−1 to 15,545 and 13,659 kg ha−1, respectively. Additionally, when fungicides (+Headline) were added into the irrigated conditions at TAREC, yield increased from 13,692 to 16,122 kg ha−1 (Table 3). The lower yields observed with additional nitrogen may be attributed to nutrient imbalances that compromise grain development, a finding consistent with Subedi and Ma [37], confirming yield variation due to nitrogen imbalance that enhances vegetative growth at the expense of yield.
Under intensive management strategies, fewer statistically significant treatment effects emerged, with the exception of phosphorus and potassium (-P and K), which when removed from intensive protocols diminished yields at the Blacksburg non-irrigated site, yet was not limiting to yields under irrigation at Suffolk. The rest of the biological (-Biological) and sidelining side-dress nitrogen (-Side-dress N) when removed from the intensive management checks resulted in notable yield improvements at Suffolk. Notably, yields increased from 14,645 to 16,226 kg ha−1 and from 12,810 to 16,337 kg ha−1 when the biological and -Side-dress N inputs were excluded. Pre-plant soil analyses (Table 2) revealed high baseline nutrient levels at some sites, indicating limited responsiveness to further nutrient additions [38,39]. Biological amendments, recognized for alleviating physiological stress and boosting nutrient uptake [39,40], may account for the increased yields under non-irrigated conditions with biological application and the improvements observed when such inputs were omitted under irrigated conditions at Suffolk in 2023.
Averaged across sites (Table 4), yield improvements ranged from 71%—observed when side-dress N was omitted from irrigated intensive treatments at Blacksburg—to 179%, when +Side-dress N was added to standard non-irrigated strategies at Suffolk in 2023. The effects of treatments averaged across site-years under irrigated conditions, the effects of addition of treatments from standard management check ranged from an average of 91% when +P and K was added to 99% when +Biological was added. Conversely, under the intensive management strategies, the impact ranged from 95% when extra side-dress N (-Side-dress N) was removed to 102% when the biological products (-Biological) were removed. In non-irrigated settings, average treatment effects spanned from 102% with foliar N (+CoRon) application to 119% with extra side-dress N (+Side-dress N) under standard management, while under the intensive management approach, the effect ranged from 95% with phosphorus and potassium (-P and K) to 103% with biological (-Biological) when they were omitted (Table 4). These results indicate the critical importance of accurately identifying yield-limiting factors and tailoring management strategies accordingly.

4. Discussion

The findings of this study underscore the critical role of irrigation in enhancing maize yields across various agricultural landscapes, particularly under ACMS. The findings also highlight the need for site specific management rather than a static recommendation. The consistent yield improvements linked to irrigation—but with great variability by site, with impacts ranging from −6 to 61%, with the greatest impacts observed under standard management practices—highlight the significance of site-specific water management in optimizing crop production [14]. This is due to the variability in the environmental and soil conditions that required different management to improve nutrient availability, alleviate stress, and improve growth [10], illustrating the necessity of irrigation for maintaining agricultural sustainability, especially in areas prone to drought. These results are consistent with other studies that have found a significant yield to advancements with irrigation under variable nitrogen rates [41,42,43]. Site-specific irrigation response was also reported by Derby, et al. [43], indicating a need for tailored irrigation practices to advance corn yield. Additionally, this study revealed that the effects of management strategies such as standard versus intensive significantly influenced yield outcomes variably, with 5.9% more yield under intensive than standard, further showing the power of intensification in increasing food and fuels. Subedi and Ma [37] observed similar context-specific benefits of foliar fungicides and biostimulants only under episodic drought, attributing gains to antioxidative stress mitigation and enhanced carbon partitioning to kernels. The intensification strategy enhanced nutrient availability by correcting deficiencies that happen in the season from nutrient losses, which is common in sandy soil under heavy rainfall conditions, as explained in [12]. In this context, the standard management strategy yielded a more substantial response to irrigation, which aligns with findings from Mahoney, et al. [44] that show conventional practices outperform more intensive strategies in certain environments. Although yield advantages were observed frequently, with intensification in several site-years, certain intensive treatments even reduced yield, likely due to nutrient imbalances in inherently high-fertility zones. Similar scenarios were observed by Mahoney, et al. [44] under conventional corn management, where lower-cost practices outperformed high-input regimes when soils already tested high for P and K, explaining the site-to-site variability in treatment response. These patterns affirm that intensive protocols must be guided by up-to-date soil and tissue diagnostics, and that blanket intensification risks diminishing returns or economic inefficiency. This disparity suggests that intensive management, though involving a wider range of treatments and costs, has the potential to enhance yield when aligned with specific environmental conditions and crop needs, reinforcing the importance of site-specific strategies.
The importance of tailored nutrient management strategies is further illuminated by the results. Notably, the variable impact of supplemental nitrogen and fungicides emphasizes the need for site-specific applications. Excessive nitrogen can lead to imbalances that detract from reproductive growth [37] due to shifts in growth dynamics toward vegetation at the expense of grain development. This study’s observation of inconsistent treatment effects across different sites also speaks to the complexity of agricultural ecosystems. Factors such as soil nutrient levels, weather variability, and local farming practices can significantly influence treatment efficacy, and the variability across environmental conditions involved in this experiment explains the variability observed in treatments [14,45]. For example, the variability in weather noted in Figure 1a and Figure 3a, b explains the response of treatments such as fungicides and biostimulants during the period of early droughts at TAREC and influence of moisture on disease development in irrigated studies.

5. Conclusions

This study evaluated standard and intensive management approaches within an Adaptive Maize Management System (ACMS) across five Virginia locations over two seasons using an addition/omission technique. Our key findings revealed site-specific treatment effects and indicated that irrigation is the most reliable lever for closing maize yield gaps, delivering an average 34% boost under standard protocols, and still providing an 8.9% gain under intensive regimes. These results have important implications for on-farm decision-making. The effects of individual treatment strategies were infrequently observed, with specific site responses uncovering limitations in the current static standard management guidelines. Notably, no treatment combination exhibited reliable consistent synergistic effects across all experimental locations. These results demonstrate that static, one-size-fits-all recommendations fail to capitalize on field-to-field variability in terms of soil fertility, moisture dynamics, and environmental stressors. Instead, growers will achieve the greatest return by coupling timely irrigation with site-specific input adjustments to align nutrient delivery and crop protection with in-season demands. Our findings show that efforts to advance yield must prioritize irrigation where it matters most and tailor input to each field’s unique conditions.

Author Contributions

Conceptualization, U.A. and W.H.F.; Methodology, W.T.; Software, U.A.; Validation, W.H.F.; Formal analysis, U.A.; Investigation, U.A., W.T., and W.H.F.; Resources, W.T. and W.H.F.; Data curation, W.T.; Writing—original draft, U.A.; Writing—review and editing, U.A.; Supervision, W.T., M.S.R., and D.L.; Project administration, and supervision, W.T. and W.H.F.; Funding acquisition, W.T. All authors have read and agreed to the published version of the manuscript.

Funding

This research was funded by USDA’s National Institute of Food and Agriculture (NIFA) under the Sustainable Agricultural Systems, grant number: 2019-68012-29904, project accession number: 1019799.

Data Availability Statement

All data and supporting materials for this study are provided within this paper, including references to the materials and methods used in the conducted studies.

Conflicts of Interest

No conflicts of interest. This research was conducted following the established research ethical standards, and there are no funders or industry or collaborative relationships that could affect the outcomes of this study.

Abbreviations

The following abbreviations are used in this manuscript:
ACMSAdaptive Maize Management System
CECcation exchange capacity
VCEVirginia Cooperative Extension
TARECTidewater Agricultural Research and Extension Center

References

  1. UNESCO. World Population Prospects; United Nations: New York, NY, USA, 2024; Available online: https://population.un.org/wpp/ (accessed on 4 March 2025).
  2. Hemathilake, D.M.K.S.; Gunathilake, D.M.C.C. Agricultural productivity and food supply to meet increased demands. In Future Foods; Academic Press: Cambridge, MA, USA, 2022; pp. 539–553. [Google Scholar]
  3. Burney, J.A.; Davis, S.J.; Lobell, D.B. Greenhouse gas mitigation by agricultural intensification. Proc. Natl. Acad. Sci. USA 2010, 107, 12052–12057. [Google Scholar] [CrossRef] [PubMed]
  4. Pretty, J.; Bharucha, Z.P. Sustainable intensification in agricultural systems. Ann. Bot. 2014, 114, 1571–1596. [Google Scholar] [CrossRef] [PubMed]
  5. Cassman, K.G. Ecological intensification of cereal production systems: Yield potential, soil quality, and precision agriculture. Proc. Natl. Acad. Sci. USA 1999, 96, 5952–5959. [Google Scholar] [CrossRef] [PubMed]
  6. Cassman, K.G.; Dobermann, A.; Walters, D.T. Agroecosystems, nitrogen-use efficiency, and nitrogen management. AMBIO J. Hum. Environ. 2002, 31, 132–140. [Google Scholar] [CrossRef]
  7. Foley, J.A.; Ramankutty, N.; Brauman, K.A.; Cassidy, E.S.; Gerber, D.K.; West, P.C. Solutions for a cultivated planet. Nature 2011, 478, 337–342. [Google Scholar] [CrossRef]
  8. Ruffo, M.L.; Gentry, L.F.; Henninger, A.S.; Seebauer, J.R.; Below, F.E. Evaluating management factor contributions to reduce corn yield gaps. Agron. J. 2015, 107, 495–505. [Google Scholar] [CrossRef]
  9. Mueller, N.D.; Gerber, J.S.; Johnston, M.; Ray, D.K.; Ramankutty, N.; Foley, J.A. Closing yield gaps through nutrient and water management. Nature 2012, 490, 254–257. [Google Scholar] [CrossRef]
  10. Rathore, L.S.; Kumar, M.; McNider, R.T.; Magliocca, N.; Ellenburg, W. Contrasting corn acreage trends in the Midwest and Southeast: The role of yield, climate, economics, and irrigation. J. Agric. Food Res. 2024, 18, 101373. [Google Scholar] [CrossRef]
  11. NCGA. The 60th Annual Yield Contest. Available online: https://www.ncga.com/ (accessed on 26 April 2025).
  12. Reiter, M.S.; Frame, W.H.; Thomason, W.E. Consider Your Whole System: Nitrogen and Sulfur Leaching Potential in Virginia; Virginia Polytechnic Institute and State University: Blacksburg, VA, USA, 2018. [Google Scholar]
  13. Ciampitti, I.A.; Vyn, T.J. Physiological perspectives of changes over time in maize yield dependency on nitrogen uptake and associated nitrogen efficiencies: A review. Field Crops Res. 2012, 133, 48–67. [Google Scholar] [CrossRef]
  14. Ransom, C.J.; Kitchen, N.R.; Sawyer, J.E.; Camberato, J.J.; Carter, P.R.; Ferguson, R.B.; Fernández, F.G.; Franzen, D.W.; Laboski, C.A.; Myers, D.B.; et al. Improving publicly available corn nitrogen rate recommendation tools with soil and weather measurements. Agron. J. 2021, 113, 2068–2090. [Google Scholar] [CrossRef]
  15. Barker, D.; Sawyer, J. Variable rate nitrogen management in corn: Response in two crop rotations. J. Soil Water Conserv. 2017, 72, 183–190. [Google Scholar] [CrossRef]
  16. Frame, W.H. Excess Rains and Leaching of Nitrogen, Potassium and Sulfur. 2024. Available online: https://blogs.ext.vt.edu/ag-pest-advisory/files/2015/07/Excess-rains-and-leaching-of-nitrogen.pdf (accessed on 20 October 2024).
  17. Fageria, N.K.; Baligar, V.C. Enhancing nitrogen use efficiency in crop plants. Adv. Agron. 2005, 88, 97–185. [Google Scholar]
  18. Holford, I. Soil phosphorus: Its measurement, and its uptake by plants. Soil Res. 1997, 35, 227–240. [Google Scholar] [CrossRef]
  19. Kovar, J.L.; Claassen, N. Soil-root interactions and phosphorus nutrition of plants. Phosphorus Agric. Environ. 2005, 46, 379–414. [Google Scholar]
  20. Truog, E. The determination of the readily available phosphorus of soils 1. Agron. J. 1930, 22, 874–882. [Google Scholar] [CrossRef]
  21. Sharpley, A.N. Dependence of Runoff Phosphorus on Extractable Soil Phosphorus; Wiley Online Library: Hoboken, NJ, USA, 1995. [Google Scholar]
  22. Donohue, S.; Heckendorn, S. Soil test recommendations for Virginia. Va. Coop. Ext. Serv. Publ 1994, 834, 23–27. [Google Scholar]
  23. Alley, M.M.; Martz, M.E.; Davis, P.H.; Hammons, J. Nitrogen and Phosphorus Fertilization of Corn; Virginia Polytechnic Institute and State University: Blacksburg, VA, USA, 2009. [Google Scholar]
  24. Camberato, J.; Casteel, S.; Steinke, K. Sulfur Deficiency in Corn, Soybean, Alfalfa, and Wheat; Purdue University Extension: West Lafayette, IN, USA, 2022; Available online: https://www.extension.purdue.edu/extmedia/AY (accessed on 20 October 2024).
  25. Steinke, K.; Rutan, J.; Thurgood, L. Corn response to nitrogen at multiple sulfur rates. Agron. J. 2015, 107, 1347–1354. [Google Scholar] [CrossRef]
  26. Mueller, D.S.; Wise, K.A.; Sisson, A.J.; Allen, T.W.; Bergstrom, G.C.; Bissonnette, K.M.; Bradley, C.A.; Byamukama, E.; Chilvers, M.I.; Collins, A.A.; et al. Corn yield loss estimates due to diseases in the United States and Ontario, Canada, from 2016 to 2019. Plant Health Prog. 2020, 21, 238–247. [Google Scholar] [CrossRef]
  27. Ward, J.M.; Stromberg, E.L.; Nowell, D.C.; Nutter, F.W., Jr. Gray leaf spot: A disease of global importance in maize production. Plant Dis. 1999, 83, 884–895. [Google Scholar] [CrossRef]
  28. Wise, K.A.; Smith, D.; Freije, A.; Mueller, D.S.; Kandel, Y.; Allen, T.; Bradley, C.A.; Byamukama, E.; Chilvers, M.; Faske, T.; et al. Meta-analysis of yield response of foliar fungicide-treated hybrid corn in the United States and Ontario, Canada. PLoS ONE 2019, 14, e0217510. [Google Scholar] [CrossRef]
  29. Wise, K.; Mueller, D. Are fungicides no longer just for fungi? An analysis of foliar fungicide use in corn. APSnet Features 2011, 10. [Google Scholar] [CrossRef]
  30. Wise, K. Fungicide efficacy for control of corn diseases. In Crop Prot Network; University of Kentucky: Lexington, KY, USA, 2018. [Google Scholar]
  31. Morris, T.F.; Murrell, T.S.; Beegle, D.B.; Camberato, J.J.; Ferguson, R.B.; Grove, J.; Ketterings, Q.; Kyveryga, P.M.; Laboski, C.A.; McGrath, J.M.; et al. Strengths and limitations of nitrogen rate recommendations for corn and opportunities for improvement. Agron. J. 2018, 110, 1–37. [Google Scholar] [CrossRef]
  32. Ades, A.; Welton, N.; Lu, G. Introduction to Mixed Treatment Comparisons; MRC Health Services Research Collaboration: Bristol, UK, 2007.
  33. Abaye, A.; Bendfeldt, E.; Brann, D.; Evanylo, G.; Fike, J.; Hardiman, T. Virginia Cooperative Extension Agronomy Handbook 2023; Virginia Tech Publishing: Blacksburg, VA, USA, 2023. [Google Scholar]
  34. Bendfeldt, E. Agronomy Handbook 2023: Part VII. Soil Health Management; Virginia Tech: Blacksburg, VA, USA, 2023. [Google Scholar]
  35. McWilliams, D.; Berglund, D.; Endres, G. Corn Growth and Management Quick Guide, A-1173; North Dakota State University: Fargo, ND, USA; USDA: Fargo, ND, USA, 1999.
  36. Klasson, K.T. A Non-Iterative Approximation for Critical Value for Dunnett’s Test. ARS USDA, Southern Re-Gional Research Center. 2023. Available online: https://www.ars.usda.gov/ARSUserFiles/60540520/CriticalValuesForDunnett.pdf (accessed on 20 October 2024).
  37. Subedi, K.; Ma, B. Assessment of some major yield-limiting factors on maize production in a humid temperate environment. Field Crops Res. 2009, 110, 21–26. [Google Scholar] [CrossRef]
  38. Franzen, D.; Camberato, J.; Nafziger, E.; Kaiser, D.; Nelson, K.; Singh, G. Performance of Selected Commercially Available Asymbiotic N-Fixing Products in the North Central Region; North Dakota State University: Fargo, ND, USA, 2024. [Google Scholar]
  39. Bano, H.N.A. Role of plant growth-promoting rhizobacteria and their exopolysaccharide in drought tolerance of maize. J. Plant Interact. 2014, 9, 689–701. [Google Scholar]
  40. Sible, C.; Below, F. Role of Biologicals in Enhancing Nutrient Efficiency in Corn and Soybean. Crops Soils 2023, 56, 13–19. [Google Scholar] [CrossRef]
  41. Al-Kaisi, M.M.; Yin, X. Effects of nitrogen rate, irrigation rate, and plant population on corn yield and water use efficiency. Agron. J. 2003, 95, 1475–1482. [Google Scholar] [CrossRef]
  42. Di Paolo, E.; Rinaldi, M. Yield response of corn to irrigation and nitrogen fertilization in a Mediterranean environment. Field Crops Res. 2008, 105, 202–210. [Google Scholar] [CrossRef]
  43. Derby, N.E.; Steele, D.D.; Terpstra, J.; Knighton, R.E.; Casey, F.X. Interactions of nitrogen, weather, soil, and irrigation on corn yield. Agron. J. 2005, 97, 1342–1351. [Google Scholar] [CrossRef]
  44. Mahoney, K.J.; Klapwyk, J.H.; Stewart, G.A.; Jay, W.S.; Hooker, D.C. Agronomic management strategies to reduce the yield loss associated with spring harvested corn in Ontario. Am. J. Plant Sci. 2015, 6, 372. [Google Scholar] [CrossRef]
  45. Bradley, C.; Ames, K. Effect of foliar fungicides on corn with simulated hail damage. Plant Dis. 2010, 94, 83–86. [Google Scholar] [CrossRef]
Figure 1. Monthly rainfall totals (mm) and temperatures (°C) recorded during the field trial period: (a) minimum and maximum daily temperatures and average daily precipitation at Blacksburg site; (b) minimum and maximum daily temperatures and average daily precipitation at Mt. Holly site.
Agronomy 15 01059 g001
Figure 2. Monthly rainfall totals (mm) and temperatures (°C) recorded during the field trial period: minimum and maximum daily temperatures and average daily precipitation at New Kent site.
Agronomy 15 01059 g002
Figure 3. Monthly rainfall totals (mm) and average temperatures (°C) recorded during the field trial periods: (a) minimum and maximum daily temperatures and average daily precipitation at TAREC site; (b) minimum and maximum daily temperatures and average daily precipitation at Mt. Holly site.
Agronomy 15 01059 g003
Table 1. Soil chemical characteristics of experimental sites at Blacksburg, Mt. Holly, New Kent, and Suffolk VA, irrigated and non-irrigated studies in 2022 to 2023.
LocationYearPKCaMgpH Est CEC
kg ha−11:1meq/100 g
Blacksburg irrigated and non-irrigated20226928912833126.16.0
Mt. Holly non-irrigated20227214911293016.83.9
New Kent irrigated2022381297311335.53.6
New Kent non-irrigated2022611218671695.64.1
Mt. Holly irrigated2022741645631075.04.3
Mt. Holly non-irrigated2023582146961736.33.0
Mt. Holly irrigated20235416110312176.33.7
Suffolk irrigated and non-irrigated20235682665746.61.9
Cation exchange capacity. Soil pH measure from the 1:1 water to soil.
Table 2. Overview of omission treatments in standard and intensive management approaches implemented at all study sites 2022–2023.
Treatments+P and K+Side-dress N+CoRon®+Headline®+Biological
Management levelStandard management
† Standard management checkNONONONONO
+P and KNONONONO
+Side-dress NNONONONO
+CoRon®NONONONO
+Headline®NONONONO
+BiologicalNONONONO
Intensive management
‡ Intensive management check
-P and KNO
-Side-dress NNO
-CoRon®NO
-Headline®NO
-BiologicalNO
Symbols: † = standard management check; ‡ = intensive management check; NO = the treatment not added. = treatment was added. Treatment key: +P and K = additional 56 kg ha−1 P and K; +Side-dress N = additional side-dress with N 45 kg ha−1 applied at V6; +CoRon® = foliar N from a branded nitrogen product CoRon® at 22.5 kg ha−1 applied at R1 maize stage; +Headline® = foliar fungicides (Headline®) applied at label rate at R1 maize growth stage. Standard management check = VCE maize management recommendations applied before the other standard management treatments tested. Intensive management check = a management package that includes all hypothesized factors to advance maize yield.
Table 3. Effect of intensive management input and omission on maize grain yield at Blacksburg, New Kent, and Mt. Holly in 2022 and Mt. Holly and Tidewater in 2023.
Year20222023
LocationBlacksburgNew KentMt. HollyMt. HollySuffolk
Irrigation StatusIrrigatedNon-IrrigatedIrrigatedNon-IrrigatedIrrigatedNon-IrrigatedIrrigatedNon-IrrigatedIrrigatedNon-Irrigated
Standard management compared to the †Standard management check
Management levelGrain yield, kg ha−1
+Biological10,35411,11119,18815,23313,201975015,47211,52715,45414,238 *
+CoRon®8755 *790017,83416,90214,194944115,45513,79014,26210,109
+Headline®10,113793618,44516,26313,847966614,300 *11,78616,122 *11,692
+P and K9374972916,31718,02212,696984514,144 *12,69314,65113,659 *
+Sidedress N8233 *916618,92316,85513,46410,28514,718*13,24514,20415,545 *
† Standard management check11,195814918,20215,75113,789983216,62414,52913,9628685
Intensive management Compared to the ‡ Intensive management check
Management levelGrain yield, kg ha−1
-Biological920711,51318,77016,08613,66510,14513,41112,70616,226 *12,810
-CoRon®10,76811,24017,96316,67513,542858413,26612,71115,53112,839
-Headline®10,115916118,21216,39812,82610,34512,80013,09315,52211,610
-P and K94617702 *17,74417,28712,488913113,18213,31116,337 *12,071
-Side-dress N73379031187431585912570971113186135691602314639 *
‡ Intensive management check10,28610,94418,13818,74313,029943713,37313,17914,64512,810
Management level
‡ Intensive management check10,28610,94418,13818,74313,029943713,37313,17914,64512,810
† Standard management check11,195814918,20215,75113,789983216,62414,52913,9628685
p-value0.6080.0510.9440.0040.3430.6940.0410.2330.3340.357
Irrigation impact, %
Intensive management check−6%−3%38%1.5%14%
Standard management check37%16%40%14%61%
Symbols: = standard management check; ‡ = intensive management check; + = standard treatments; - = intensive treatments. * mean statistically significant at p ≤ 0.10.
Table 4. Relative yield of standard and intensive management practices at Blacksburg (2022), New Kent (2022), Mt. Holly (2022), Mt. Holly (2023), and Tidewater (2023).
IrrigationIrrigatedNon-Irrigated
Year20222023 20222023
SiteBlacksburgNew KentMt. HollyMt. HollyTidewaterAvgBlacksburgNew KentMt. HollyMt. HollyTidewaterAvg
Standard management compared to the Standard management check, %
+Biological92105969310498136979979164115
+CoRon®78981039310295971079695116102
+Headline®901011008611599971039881135103
+P and K849092851059111911410087157116
+Side-dress N7410498891029311210710591179119
Mean 95 111
Intensive management compared to Intensive management check %
-Biological90981051001111011058610896120103
-CoRon®1059410499106102103899196120100
-Headline®989598961069984871109910898
-P and K929396991129870929710111395
-Side-dress N71989699109958385103103137102
Mean 99 100
Comparison of the standard management check with “standard management” and intensive management check with “intensive management”. Mean relative impact of treatments and their check were calculated by dividing the treatment mean by the highest means multiplied by 100%. Abbreviations: Avg = average.
Disclaimer/Publisher’s Note: The statements, opinions and data contained in all publications are solely those of the individual author(s) and contributor(s) and not of MDPI and/or the editor(s). MDPI and/or the editor(s) disclaim responsibility for any injury to people or property resulting from any ideas, methods, instructions or products referred to in the content.

