Article

Neural-Network-Based Prediction of Non-Burial Overwintering Material Covering Height for Wine Grapes

1
Agricultural College, Shihezi University, Shihezi 832003, China
2
Key Laboratory of Special Fruits & Vegetables Cultivation Physiology and Germplasm Resources Utilization of Xinjiang Production and Construction Corps, Shihezi 832003, China
3
Food College, Shihezi University, Shihezi 832000, China
*
Author to whom correspondence should be addressed.
Agronomy 2025, 15(5), 1060; https://doi.org/10.3390/agronomy15051060
Submission received: 20 March 2025 / Revised: 16 April 2025 / Accepted: 25 April 2025 / Published: 27 April 2025
(This article belongs to the Section Precision and Digital Agriculture)

Abstract

:
Grapevines in cold regions are prone to frost damage in winter. Due to its adverse effects on soil structure, plant damage, high operational costs, and limited mechanization feasibility, buried soil overwintering has been gradually replaced by no-burial overwintering techniques, which are now the primary focus for mitigating frost damage in wine grapes. While current research focuses on the selection of thermal insulation materials, less attention has been paid to the insulation mechanism of covering materials and covering methods. In this study, we investigated the insulation performance of two covering materials (tarpaulin and insulation blanket) combined with six height treatments (5–30 cm) to analyze the effect of insulation space volume on no-buried-soil overwintering. The results show that the thermal insulation performance of the insulation blanket is significantly better than that of the tarpaulin. The 5 cm height treatment under the tarpaulin cover and the 25 cm height treatment under the insulation blanket cover exhibited the best thermal insulation performance. Using a neural network machine learning approach, we constructed a model related to the height of the insulation material and facilitate the model’s accurate predictions, in which tarpaulin R2branches = 0.92, R220 cm = 0.99, and R240 cm = 0.99 and insulation blanket R2branches = 0.89, R220 cm = 0.98, and R240 cm = 0.99. The model predicted optimal insulation heights of 6 cm for the tarpaulin and 22 cm for the insulation blanket. Factors like solar radiation within the insulation space, ground radiation, airflow, and material thermal conductivity affect the optimal insulation height for different materials. This study used a neural network model to predict the optimal insulation heights for different materials, providing systematic theoretical guidance for the overwintering cultivation of wine grapes and aiding the safe development of the wine grape industry in cold regions.

1. Introduction

Overwintering frost damage to wine grapes is prevalent in high-latitude cold wine-growing regions [1,2]. Initially, high-latitude cold wine-growing regions employed buried-soil overwintering to combat frost damage. However, this method damages the soil structure and is not amenable to mechanization [3]. Therefore, insulating materials predominantly enable no-burial overwintering, with thermal performance critically depending on region-specific material selection [4,5,6]. Nonetheless, this no-buried-soil method faces annual instability in frost protection and still risks frost damage during winters with late or scanty snowfall or extreme low temperatures [7,8]. To mitigate frost damage risks to wine grapes, existing no-buried-soil overwintering methods need enhancement and optimization.
In production, directly covering with insulating materials causes heat conduction between grape branches and materials. When the external temperature drops, the rate of branch temperature decrease is related to the material’s thermal conductivity. If there is an insulating space between the covering material and the branches, the heat loss from the branches changes to conduction and convection through an air layer. Air has poor thermal conductivity (only 0.024 W/m·K), and convective heat transfer is closely related to fluid movement speed. In this space, only natural convection from rising hot air and falling cold air occurs. Thus, the heat loss rate of grape branches is lower than with direct insulation material coverage [9,10,11]. The insulating space enhances the thermal insulation of covering materials. The insulating space size, determined by its height with a fixed width (the planting furrow width), also impacts thermal insulation. During overwintering, heat is absorbed via solar radiation. Tian et al. found that higher spaces absorb more solar radiation, increase thermal inertia, and improve insulation [12]. However, in no-buried-soil overwintering, heat loss includes radiation and convection. Increased height raises the contact area between the insulating space and the external environment, boosting heat loss [13,14,15]. Therefore, in no-buried-soil overwintering cultivation of wine grapes, setting different cover heights creates a reasonable insulation space, maximizing thermal insulation and ensuring grapevine survival.
Machine learning can predict environmental changes, identify crop disease occurrences, forecast fruit quality in orchards, and optimize fertilizer and pesticide use, boosting agricultural productivity while reducing resource consumption [16,17,18,19,20,21,22,23]. Neural networks (NNs) excel at handling complex nonlinear problems. In the context of temperature within an insulating space being influenced by multiple factors, multilayer perceptrons (MLP) can capture complex interactions between variables and automatically learn which of the variables more significantly impacts the temperature, demonstrating strong suitability for temperature prediction in insulation facilities. Shamshirband et al. used an MLP model to predict soil temperature and achieved precise results [3,24,25]. Compared to traditional linear models, neural networks better capture nonlinear relationships between environmental factors. Previous studies on NN applications in facility agriculture have primarily focused on greenhouse microenvironment prediction, while traditional wine grape overwintering research has often neglected the relationship between insulation space and thermal performance. Building on greenhouse studies demonstrating significant impacts of insulation space parameters on thermal performance, this study specifically investigates the complex relationships between the height of the insulated space, the thermal conductivity of the covering material, and the internal temperature of the insulated space, enabling more accurate predictions of temperature and humidity in agricultural microenvironments [26,27,28,29,30].
This study focuses on the northern foothills of the Tianshan Mountains in Xinjiang, China, investigating the relationship between the volume of thermal insulation facilities formed by insulation materials and the ground and their thermal insulation performance. With height as the variable for spatial volume, we set up 12 no-buried-soil overwintering treatments combining two covering materials with six different heights. We compared temperature trends across these treatments and used MLP neural network learning with time series, ambient temperature, insulation space height, and their interaction terms as input features and the internal temperature of the insulation space as the output feature to predict the thermal insulation performance of the two cover materials at different facility heights. Finally, we obtained the optimal thermal insulation heights for each material. This study offers a new perspective on researching the thermal insulation of overwintering wine grapes without burying. Unlike previous studies predominantly focused on material selection, we extend the traditional greenhouse space–thermal performance research framework to investigate insulation space parameters’ impacts during wine grape overwintering, predicting optimal heights for different materials using machine learning from the insulation space perspective. Our findings innovatively demonstrate the following: (1) a significant influence of insulation space parameters on thermal performance; (2) material-dependent variation of these impacts; and (3) complex nonlinear relationships between insulation space and thermal performance across materials. It refines the overwintering cultivation system for wine grapes, giving significant theoretical and practical guidance for their efficient, simple, and safe overwintering, while establishing new research paradigms for winter protection studies.

2. Materials and Methods

2.1. Test Materials

The experimental site was selected in the vineyard of Baron Zhangyu Babao Winery in Shihezi City, Xinjiang Uygur Autonomous Region (latitude 44°18′ N, longitude 85°41′ E), and the experimental materials were selected from 7-year-old Cabernet Sauvignon grapes with consistent growth conditions in the experimental site.
In this study, two types of thermal insulation coverings were used: 85 g/m2 laminated polyethylene woven fabric (hereafter referred to as tarpaulin) and a new type of insulation blanket composed of double-layered tarpaulin sandwiched with 25 kg/m3 pearl cotton (polyethylene foam). The tarpaulin is a commonly used soil-free overwintering cover in the northern foothills of the Tianshan Mountains, which has the advantages of abrasion resistance, moisture retention, easy mechanization, etc. The new type of insulation blanket was customized for the present study, and it adopted a three-layer structure of double-layered tarpaulin sandwiched with pearl cotton, which combines the abrasion resistance and moisture retention of tarpaulin with the heat retention of pearl cotton [24].

2.2. Test Treatments

In this study, height represented the volume of the insulated space at a constant width. We controlled the insulated space height with customized brackets. By combining two insulation materials with these brackets, we set up 12 treatments (2 cover materials × 6 heights), which served as mutual controls (Table 1).
Before overwintering, grapevine branches were laid flat along the planting furrow. Then, insulating brackets were nailed into the furrow at 50 cm intervals. Next, the covering material was placed over the brackets and compacted with soil on both sides to ensure airtightness and prevent cold air from seeping in (Figure 1).

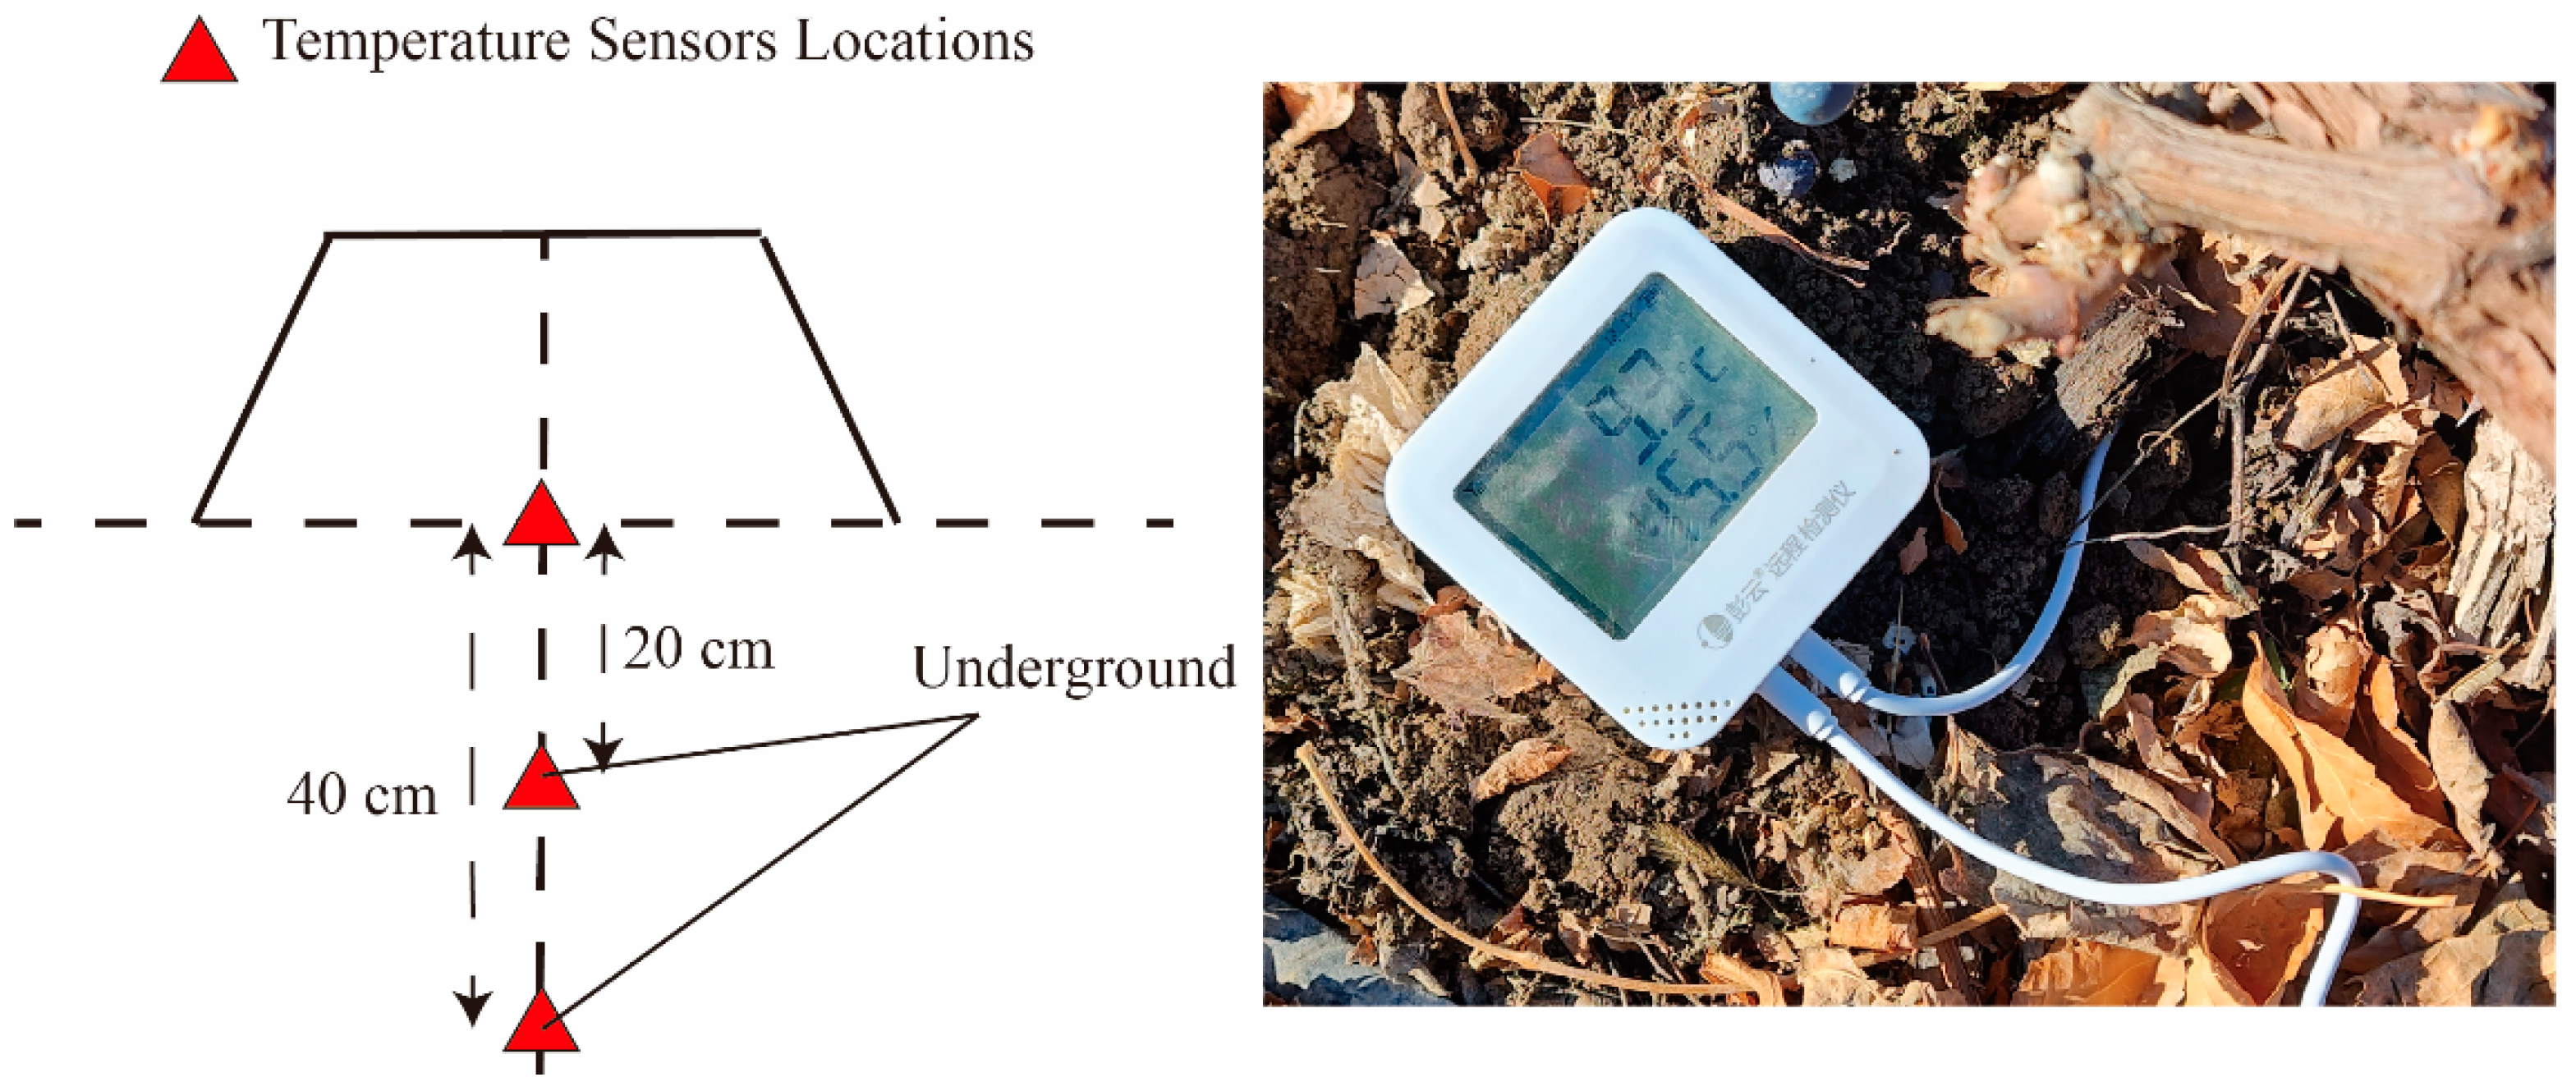
2.3. Data Observation

The temperature was monitored using a 21A agro-environmental soil temperature and humidity logger (Peng Yun IOT Co., Ltd., Xuzhou, Jiangsu, China) calibrated by the manufacturer during the experiment. As the root system of Cabernet Sauvignon is mainly distributed in the 0–40 cm soil layer [25], the monitoring sites included the grapevine branches, the 20 cm deep soil layer, and the 40 cm deep soil layer (Figure 2). Data collection spanned from overwintering cover installation (18 November 2023) to spring vine re-training (7 March 2024). During this period, the equipment was set to record temperature data at the beginning of each hour, with 1 h intervals. The comprehensive metadata of microenvironment monitoring data, including sensor specifications and measurement ranges, are systematically presented in Table 2.

2.4. Data Analysis

Data were analyzed using Excel 2016 (preliminary cleaning, outlier removal, interpolation processing, and daily minimum temperature calculation), Origin 2024 (visualization and graphical representation), and PyCharm 2024 (model construction and predictive analysis), ensuring reliable and accurate data analytics.

2.5. Construction of Temperature Prediction Machine Learning Model

2.5.1. Data Preprocessing

The performance of machine learning models relies on data quantity and quality. Robust prediction capability requires scientific data preprocessing. Data preprocessing is needed before training. This study statistically analyzed the overwintering temperature data of three points from the environmental soil temperature logger, starting with raw time series data (temporal resolution: 1 h). The preprocessing workflow included the normalization of all input features; time was encoded as cumulative days since overwintering initiation (18 November 2023) and scaled to [0, 1] to represent continuous temporal progression, avoiding seasonal bias from calendar dates. Ambient temperature and insulation height were independently normalized to [0, 1] using Min–Max scaling. Interaction terms (ambient temperature × height) were generated by first multiplying the original values of temperature and height and then normalizing the resulting product to ensure their range remained within [0, 1]. This explicit daily time encoding, combined with temperature–height interactions, allowed the MLP to capture seasonal trends and material-specific thermal dynamics, as validated by ablation tests (Section 3.4). The Min–Max normalization formula is defined as
x = x min x max x min x
where x is the original data, min (x) and max (x) are the minimum and maximum values in the feature column, respectively, and x′ is the normalized result. This scaling ensures that all data fall within the [0, 1] interval, facilitating subsequent analysis and modeling [31], resulting in a final dataset of 665 samples.

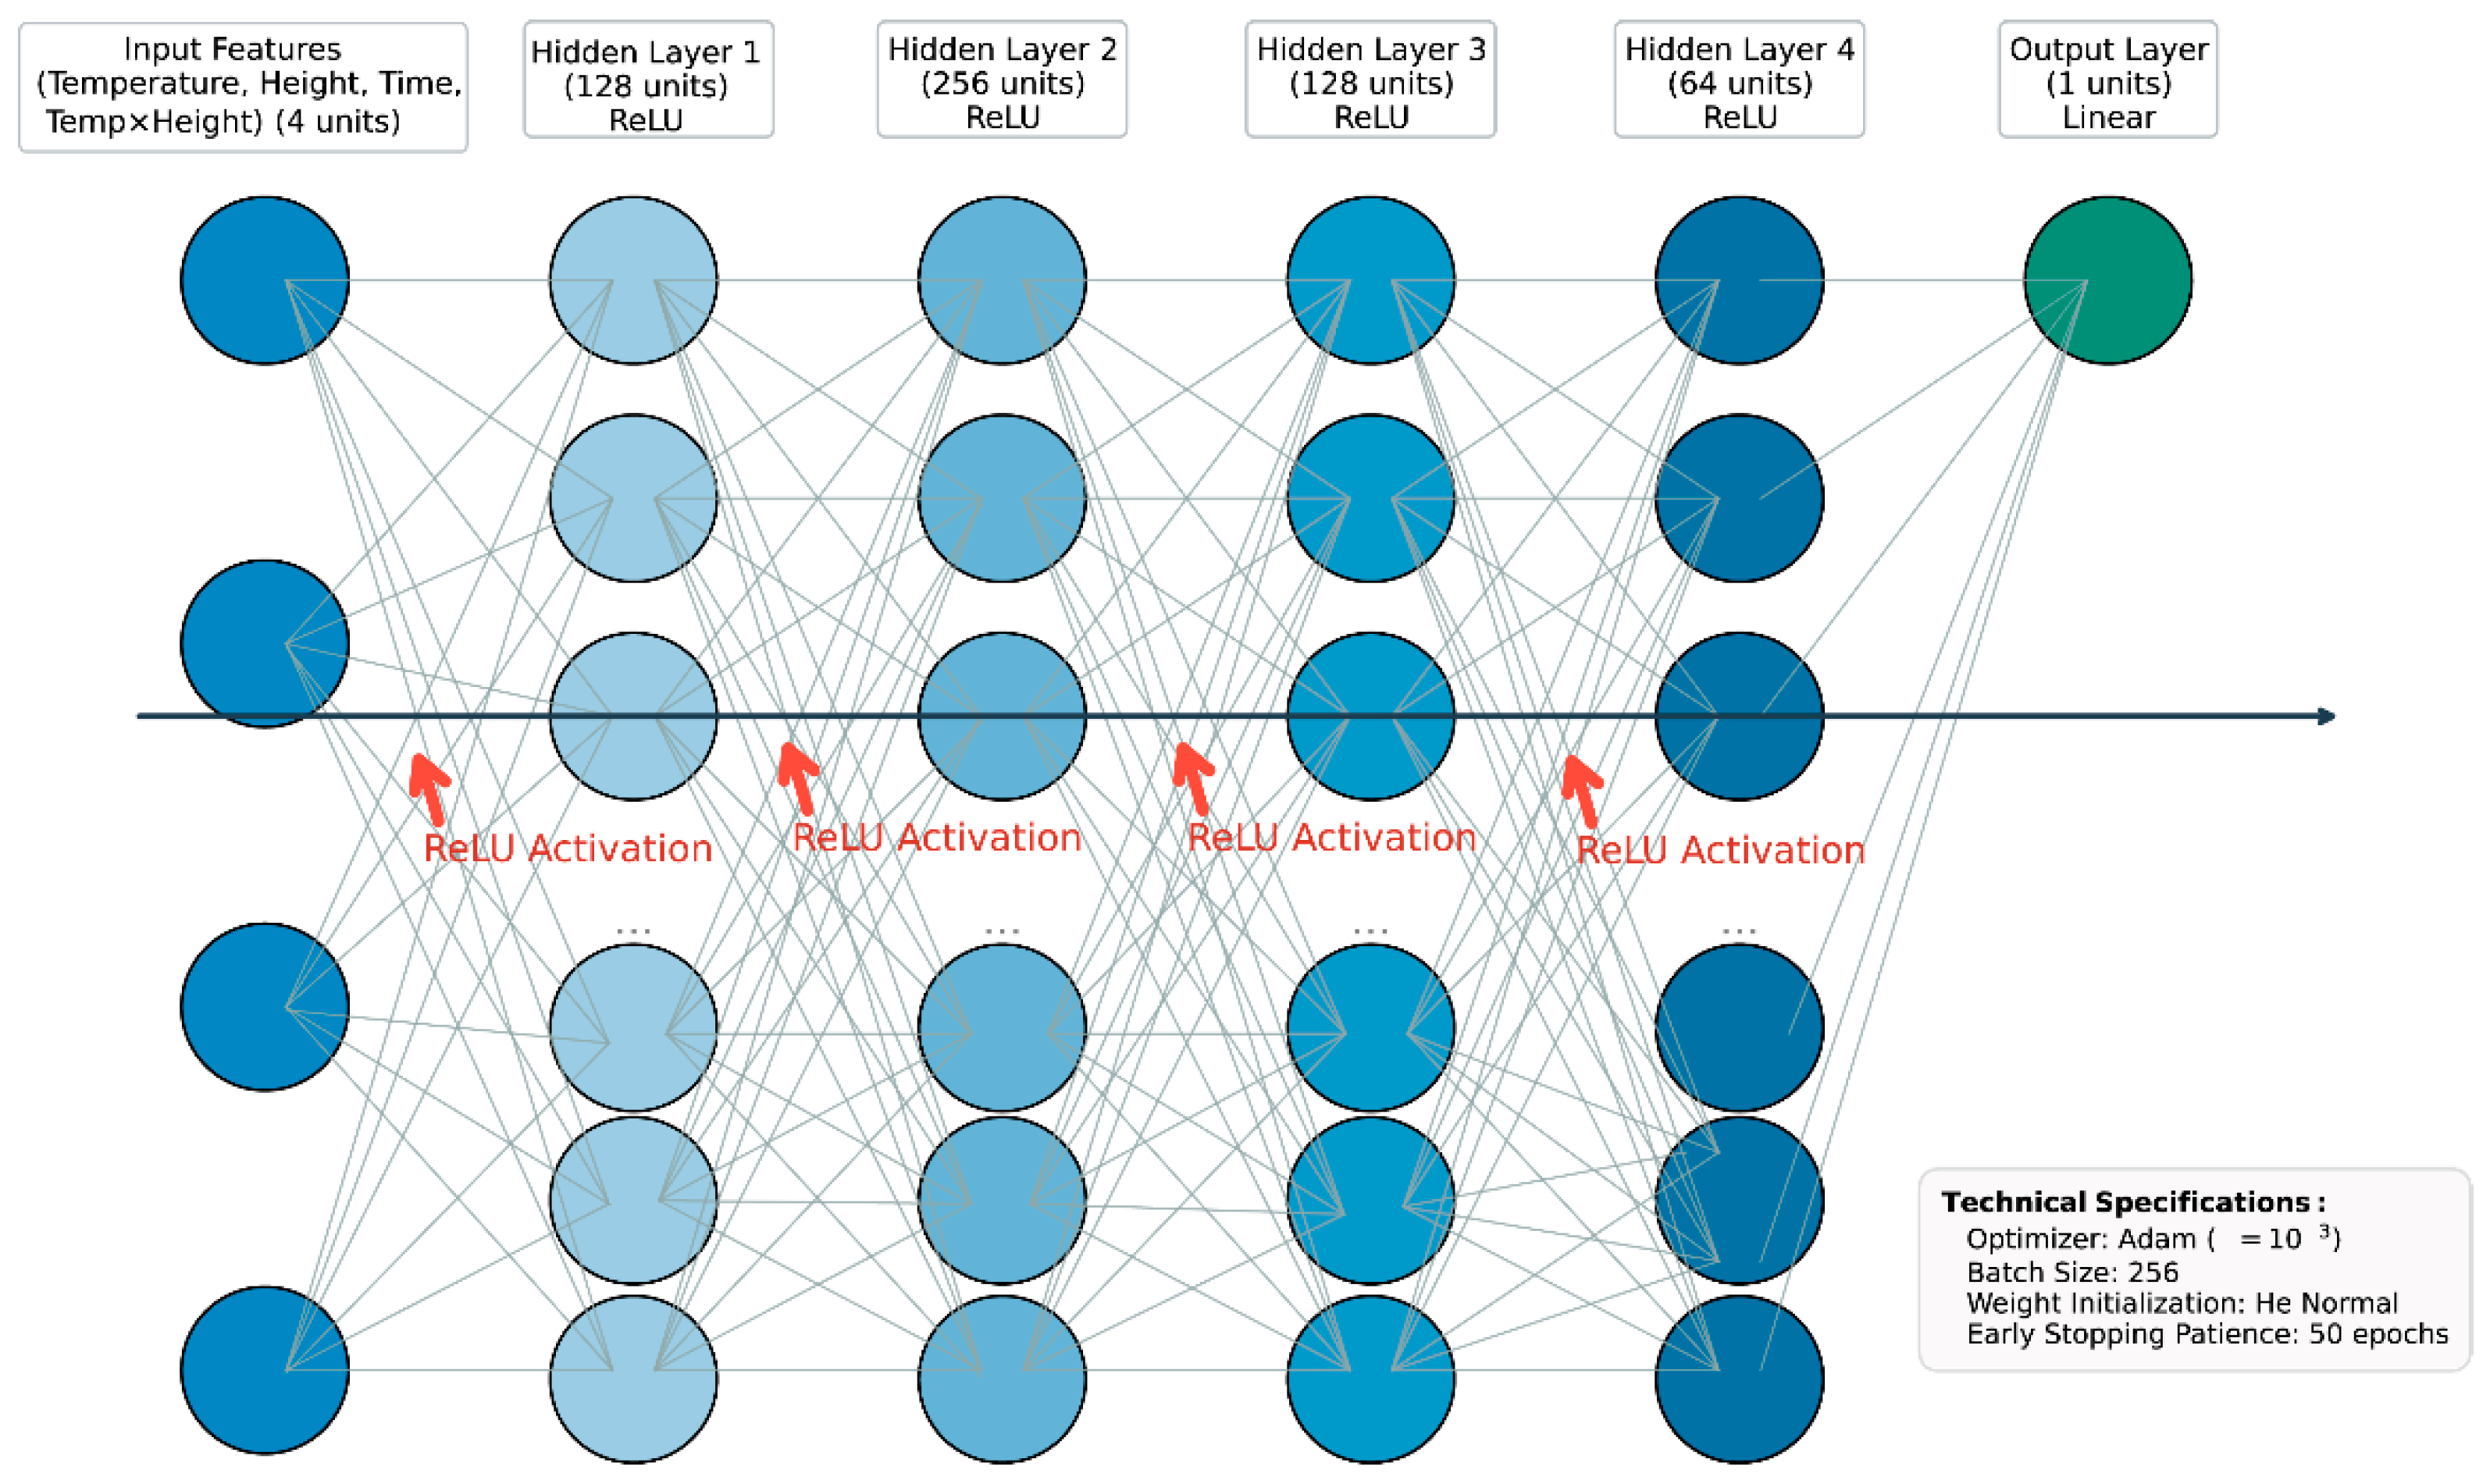
2.5.2. Model Construction and Evaluation

In this study, a predictive model is built using regression analysis within a supervised learning framework. Machine learning models in supervised learning are trained by establishing mapping relationships between input features and target outputs. Here, a MLP regression model [32] is constructed with the following architecture (Figure 3). The MLP was selected based on its unique advantages: (1) nonlinear activation functions of the Rectified Linear Unit (ReLU) effectively capture complex interactions in agricultural microenvironments; (2) the shallower architecture provides better gradient interpretability for analyzing parameter impacts; and (3) superior small-sample performance compared to LSTM.
The model’s hidden layer configuration (128-256-128-64 neurons) and dataset splitting ratio followed methodologies from Petrakis et al. [25,33]. Input features included cumulative days since overwintering initiation (continuous temporal encoding), ambient temperature, insulation height, and their interaction terms (ambient temperature × height). Although MLP lacks inherent sequential memory, the explicit temporal feature (cumulative days) and its interactions with temperature/height enabled the model to learn time-dependent patterns through nonlinear mappings, rather than data order dependency. The hidden layers used ReLU activation [34], as shown in Figure 3, with He normal initialization for accelerated convergence. This deep architecture provides robust feature abstraction capabilities to effectively model complex nonlinear relationships between inputs and targets. Data splitting adopted 8:2 (test) and 3:1 (train:validation) ratios, with the χ2-test ensuring height group (5–30 cm) distribution consistency (p > 0.05). Training employed the Adam optimizer (β1 = 0.9, β2 = 0.999) with a 0.0001 learning rate, 256 batch size, and early stopping (patience = 50 epochs) for monitoring the validation MSE for parameter optimization [35]. Performance evaluation was conducted using comprehensive quantitative metrics (R2, MAE, RMSE) and visual analysis. Scatter plots of predicted versus actual values, overlaid with the ideal fit line (y = x), were used to intuitively reflect regression accuracy. The performance of the MLP model developed in this study was compared with that of traditional Support Vector Regression (SVR) and polynomial regression to assess the performance of the constructed temperature prediction model.

3. Results

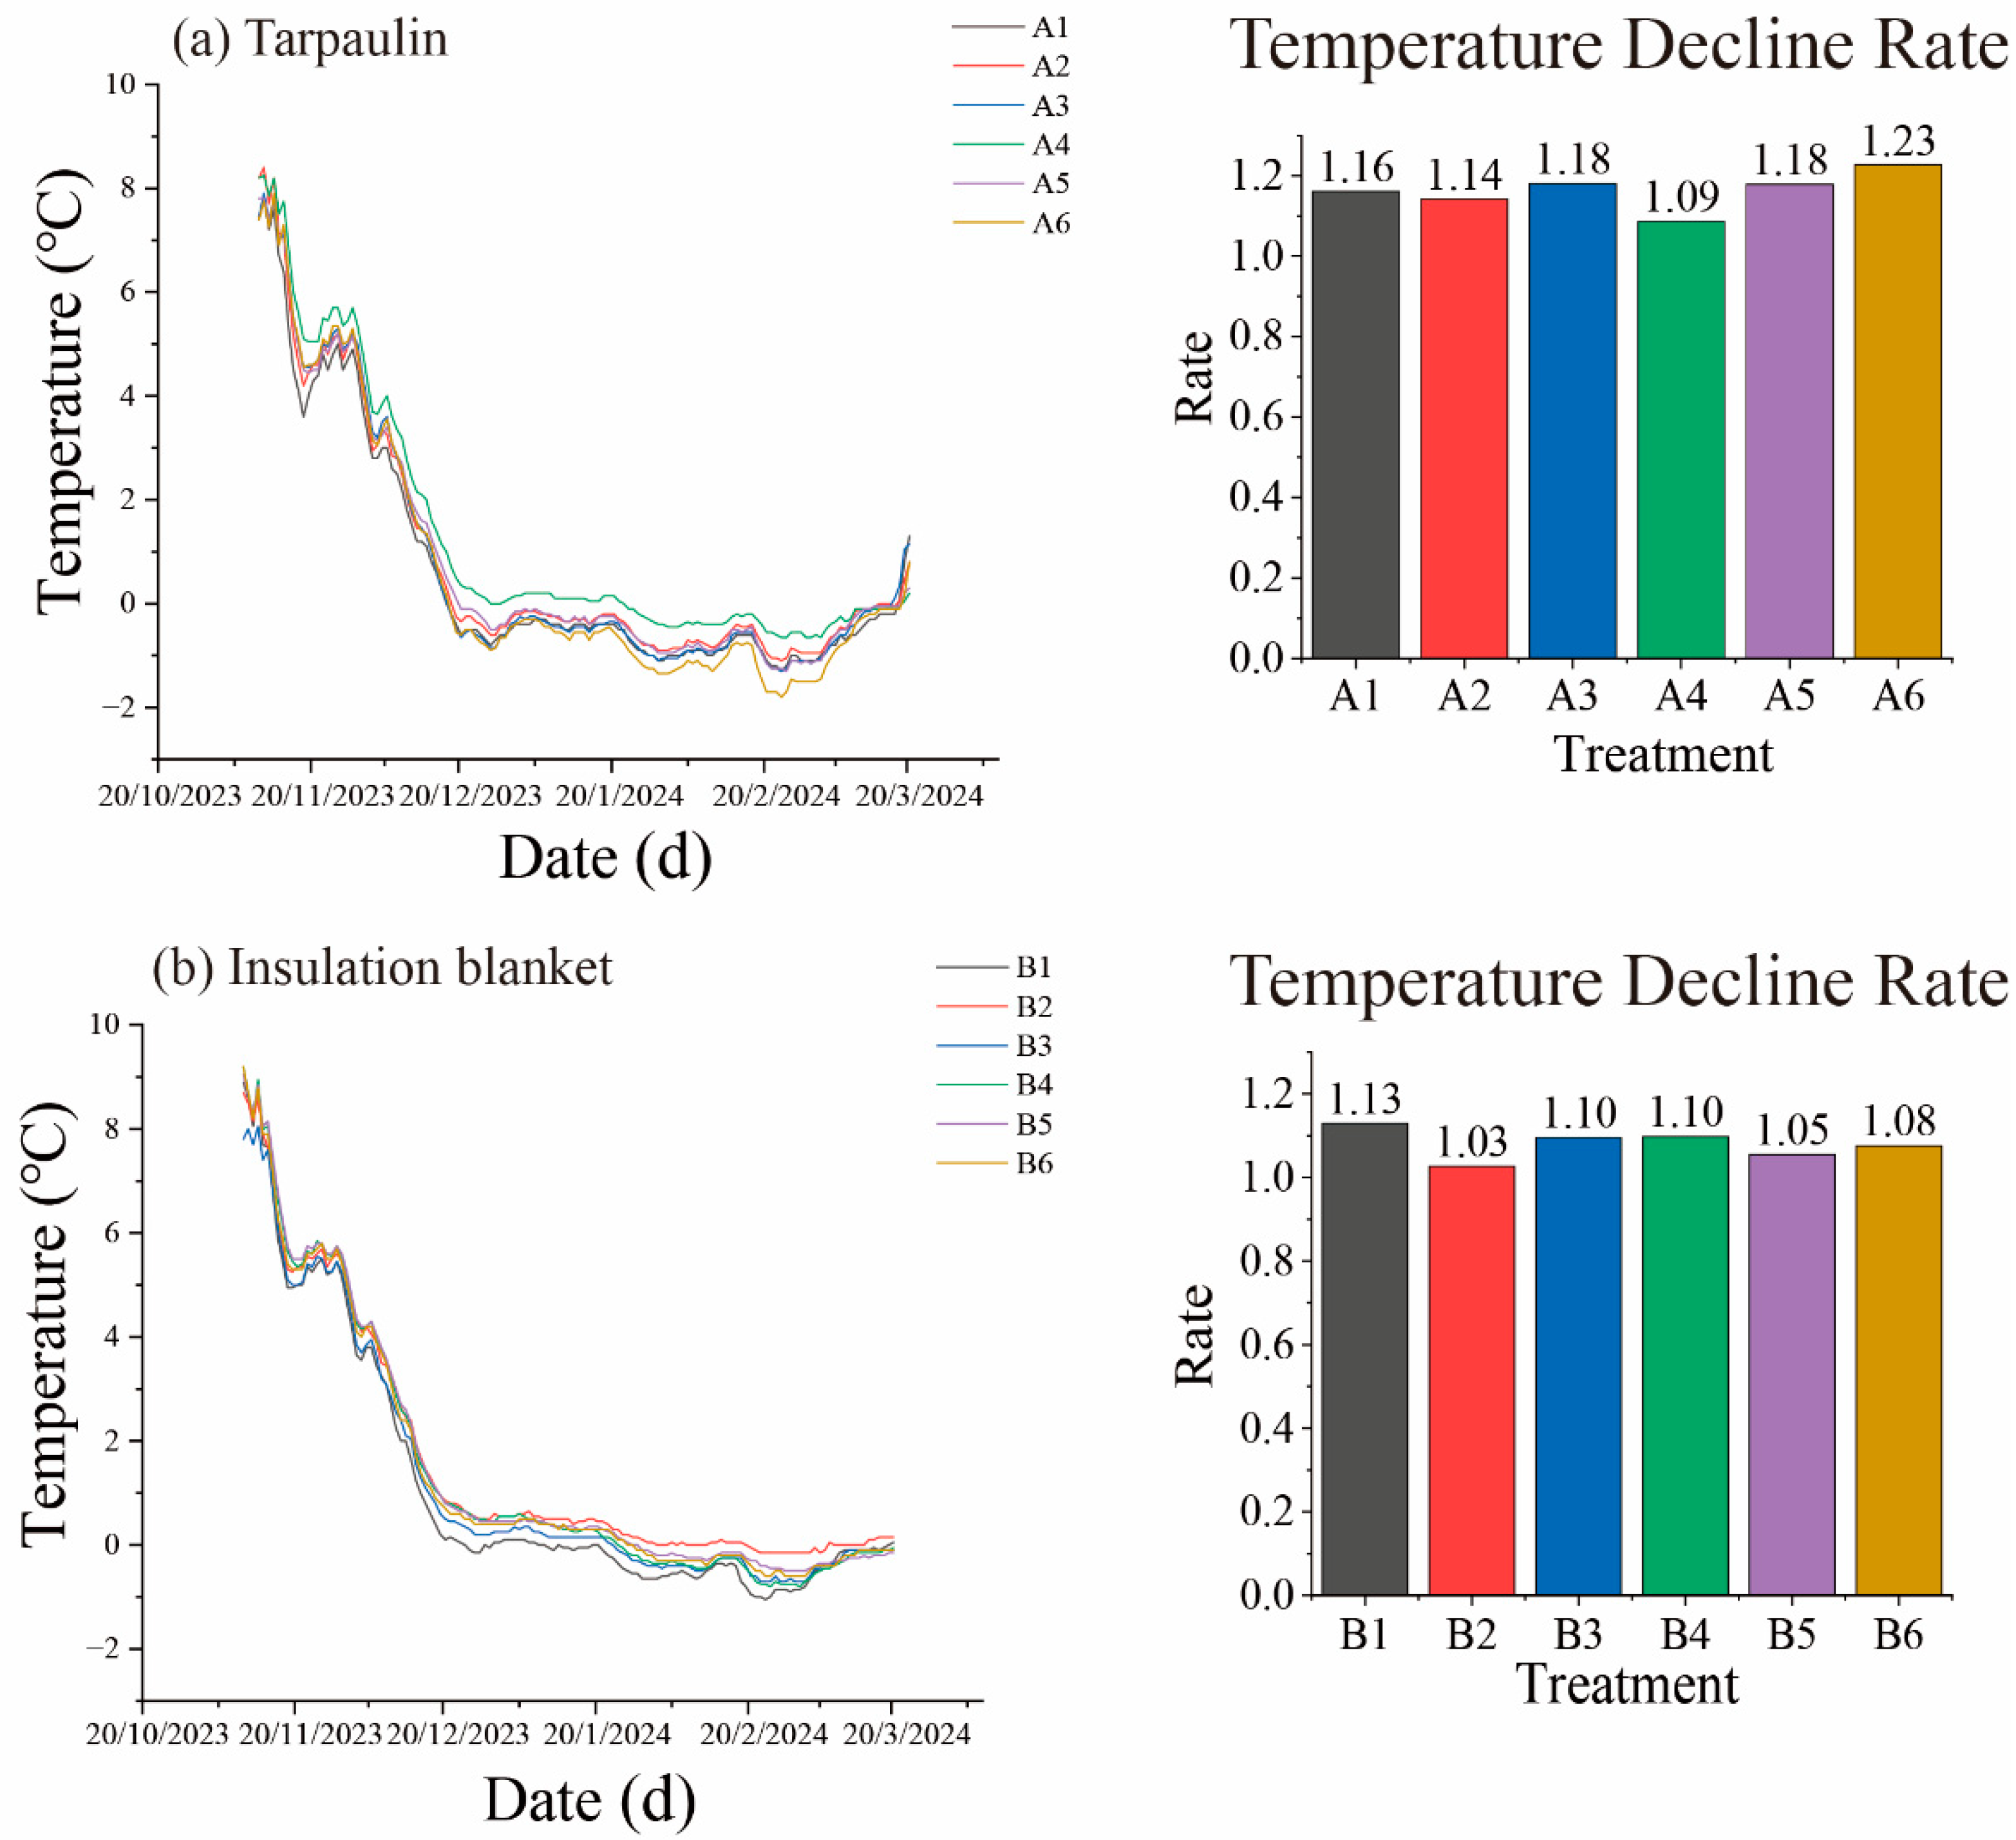
3.1. Temperature Variation Trends in Grapevine Branches During Overwintering

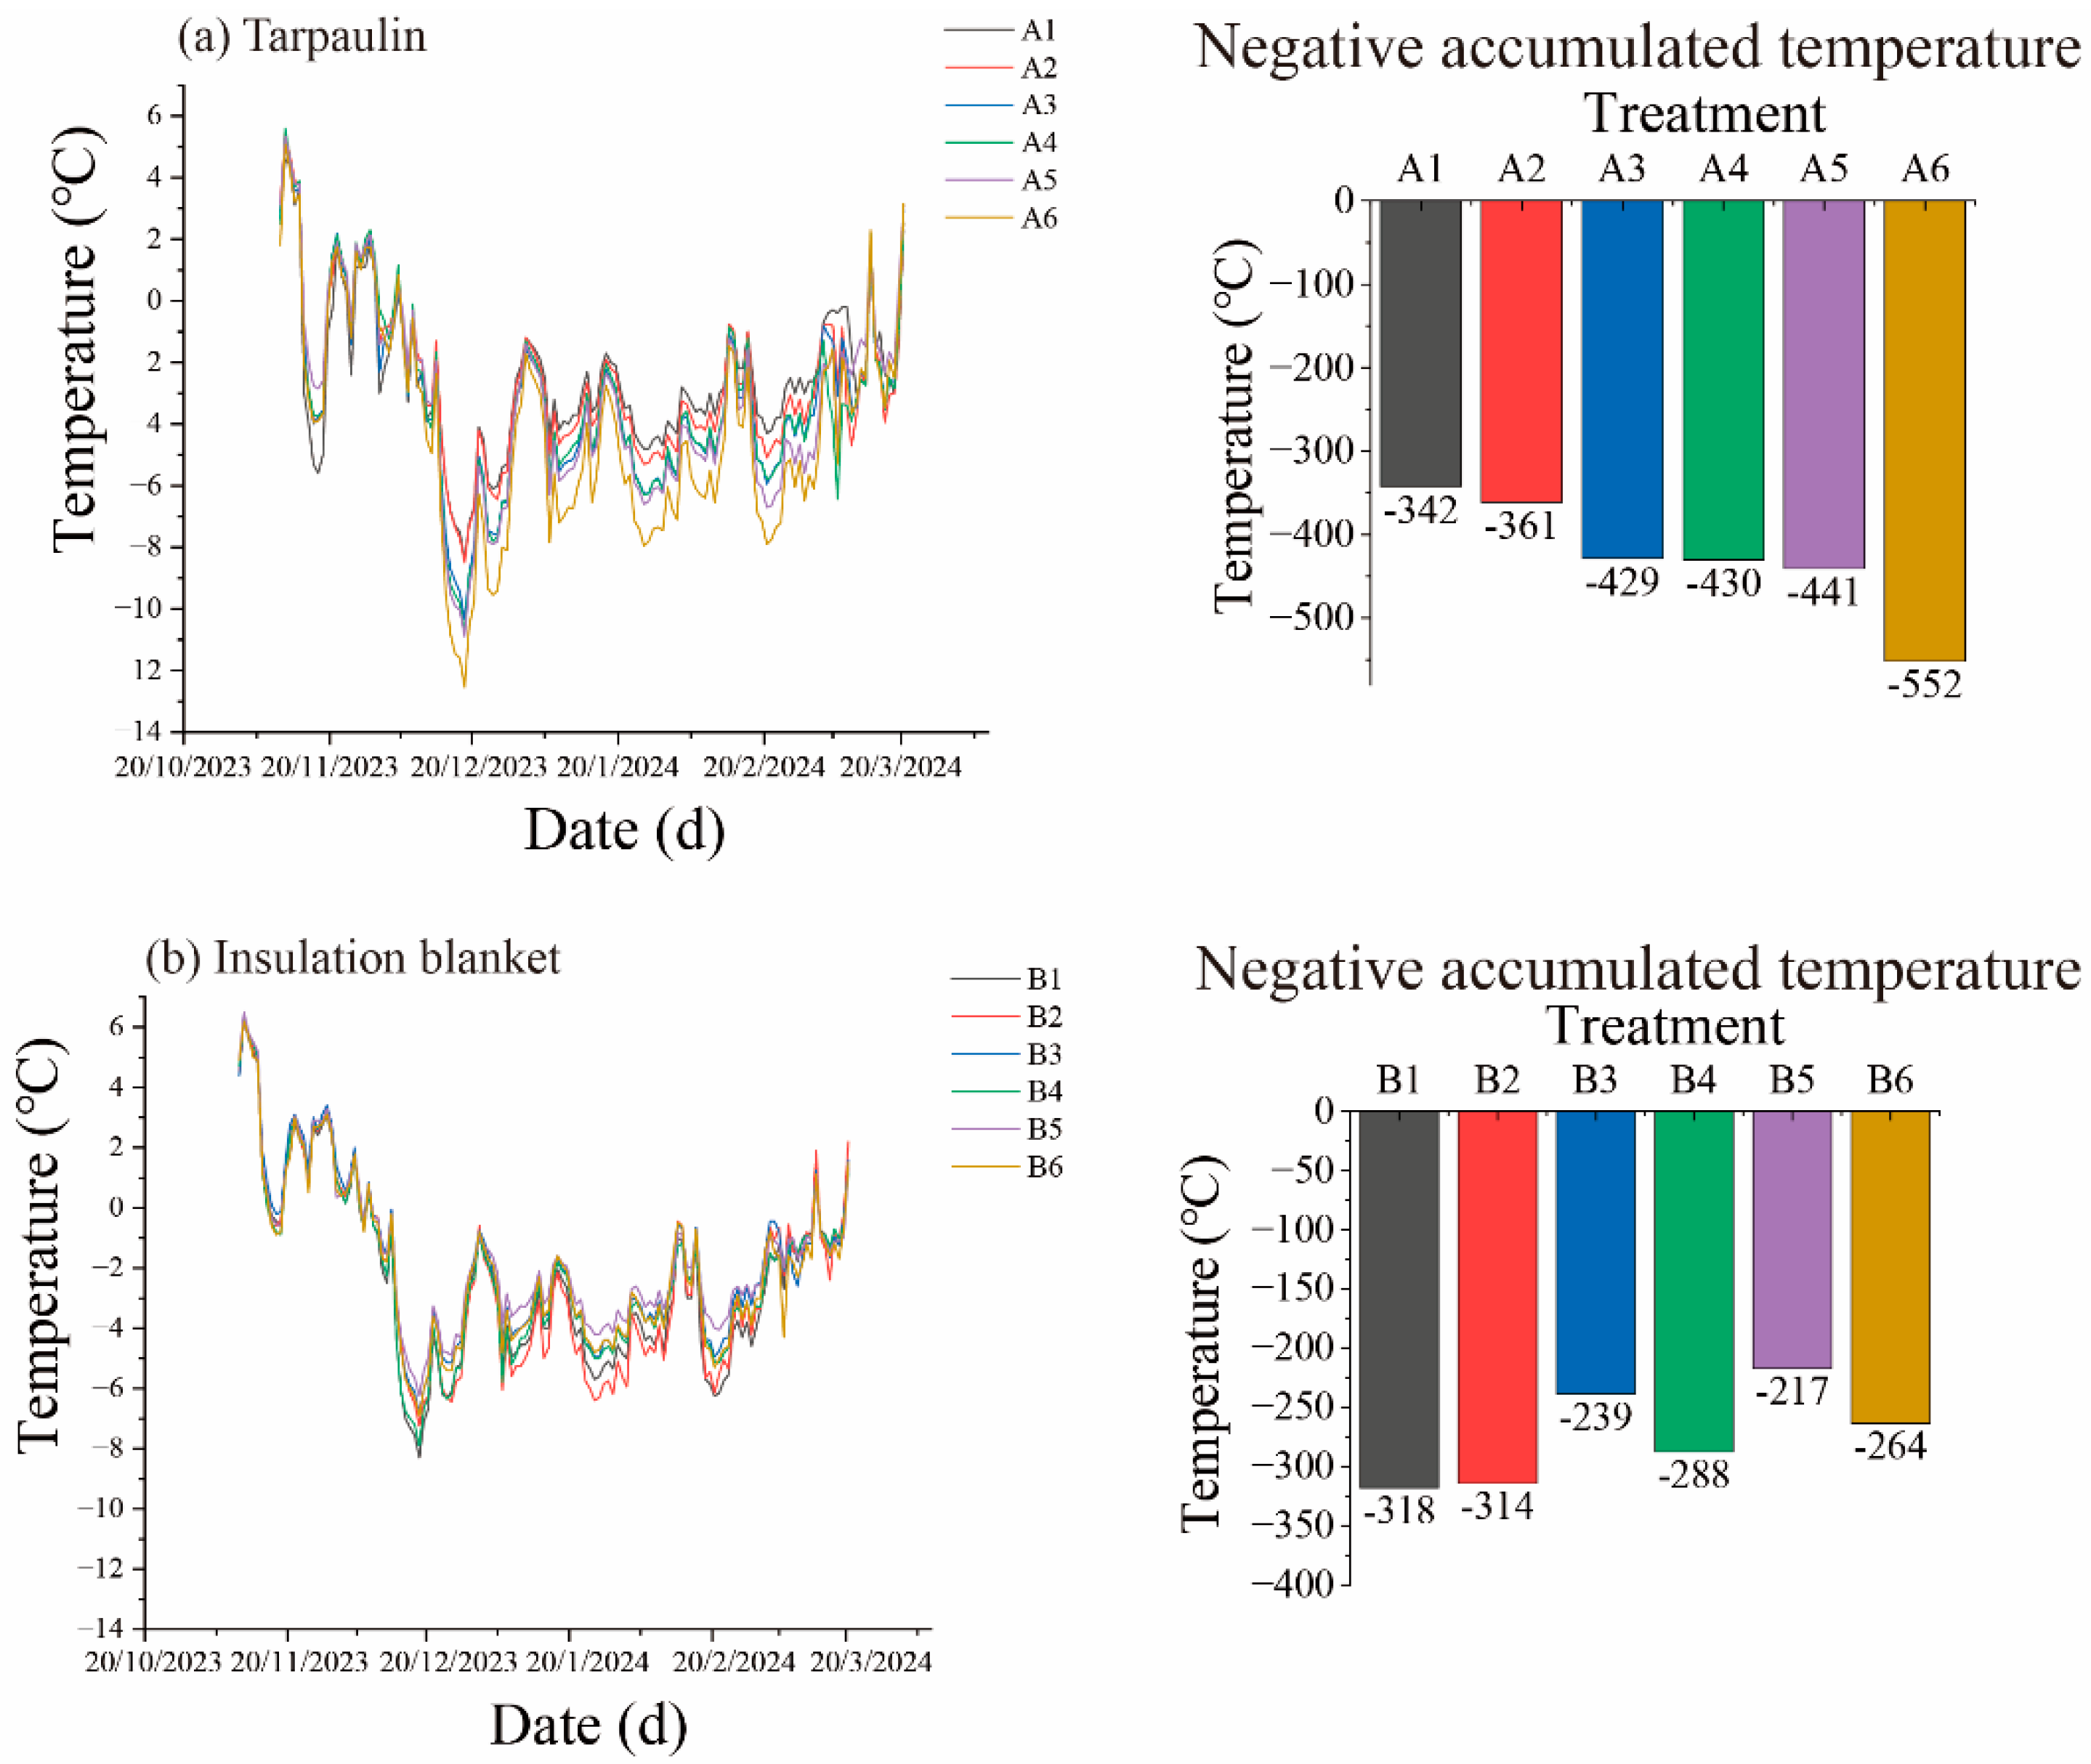
3.1.1. Temperature Variation Characteristics at Branch Sites Under Different Heights of the Same Cover Material

Under the cover of tarpaulin, the daily minimum temperatures of branches at different heights showed the same trend but varied in magnitude during overwintering. After December 10, the differences in daily minimum temperatures among different heights increased, with the lowest at 30 cm and the highest at 5 cm. The cumulative temperature decreased as the insulation space height increased, indicating that a higher insulation facility led to poorer insulation performance (Figure 4a).
Under insulation blanket cover, the daily minimum temperatures of branches at different heights also changed along the same trend, with smaller differences among heights compared to the tarpaulin, possibly due to its better insulation effect. The cumulative temperature results showed that the lowest height treatment had the worst insulation effect, while the 25 cm height treatment had the best effect (Figure 4b).

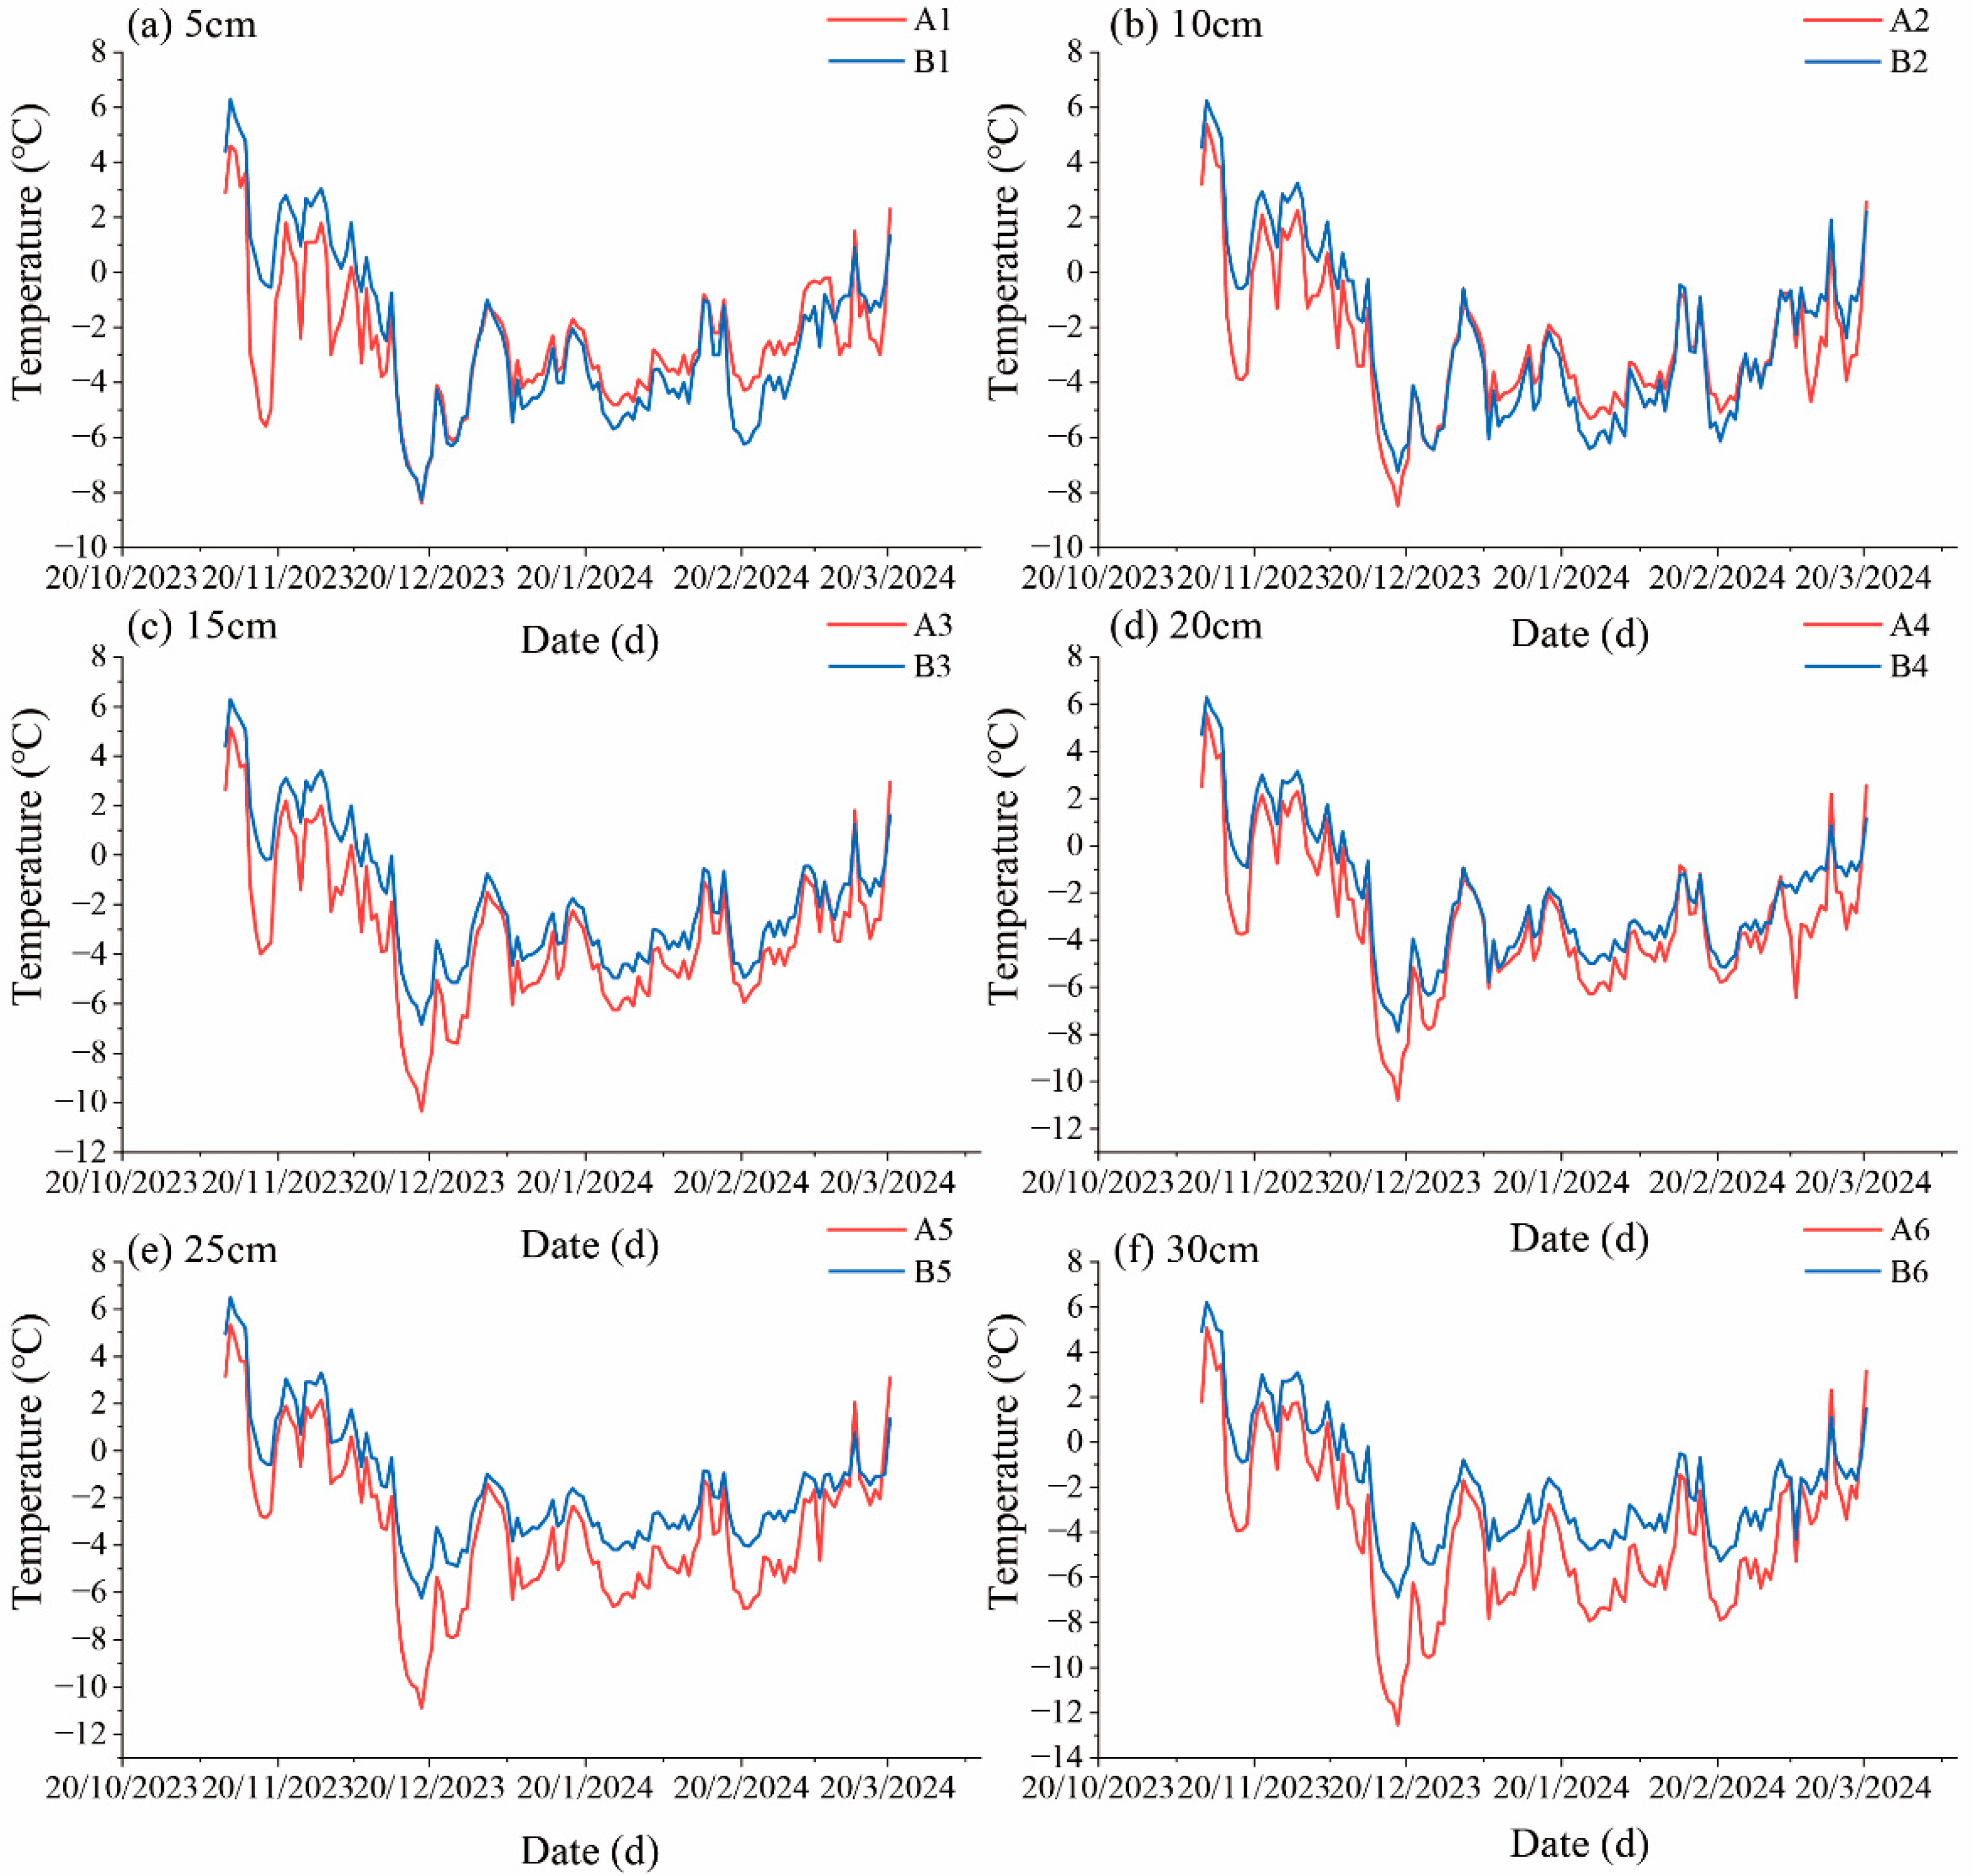
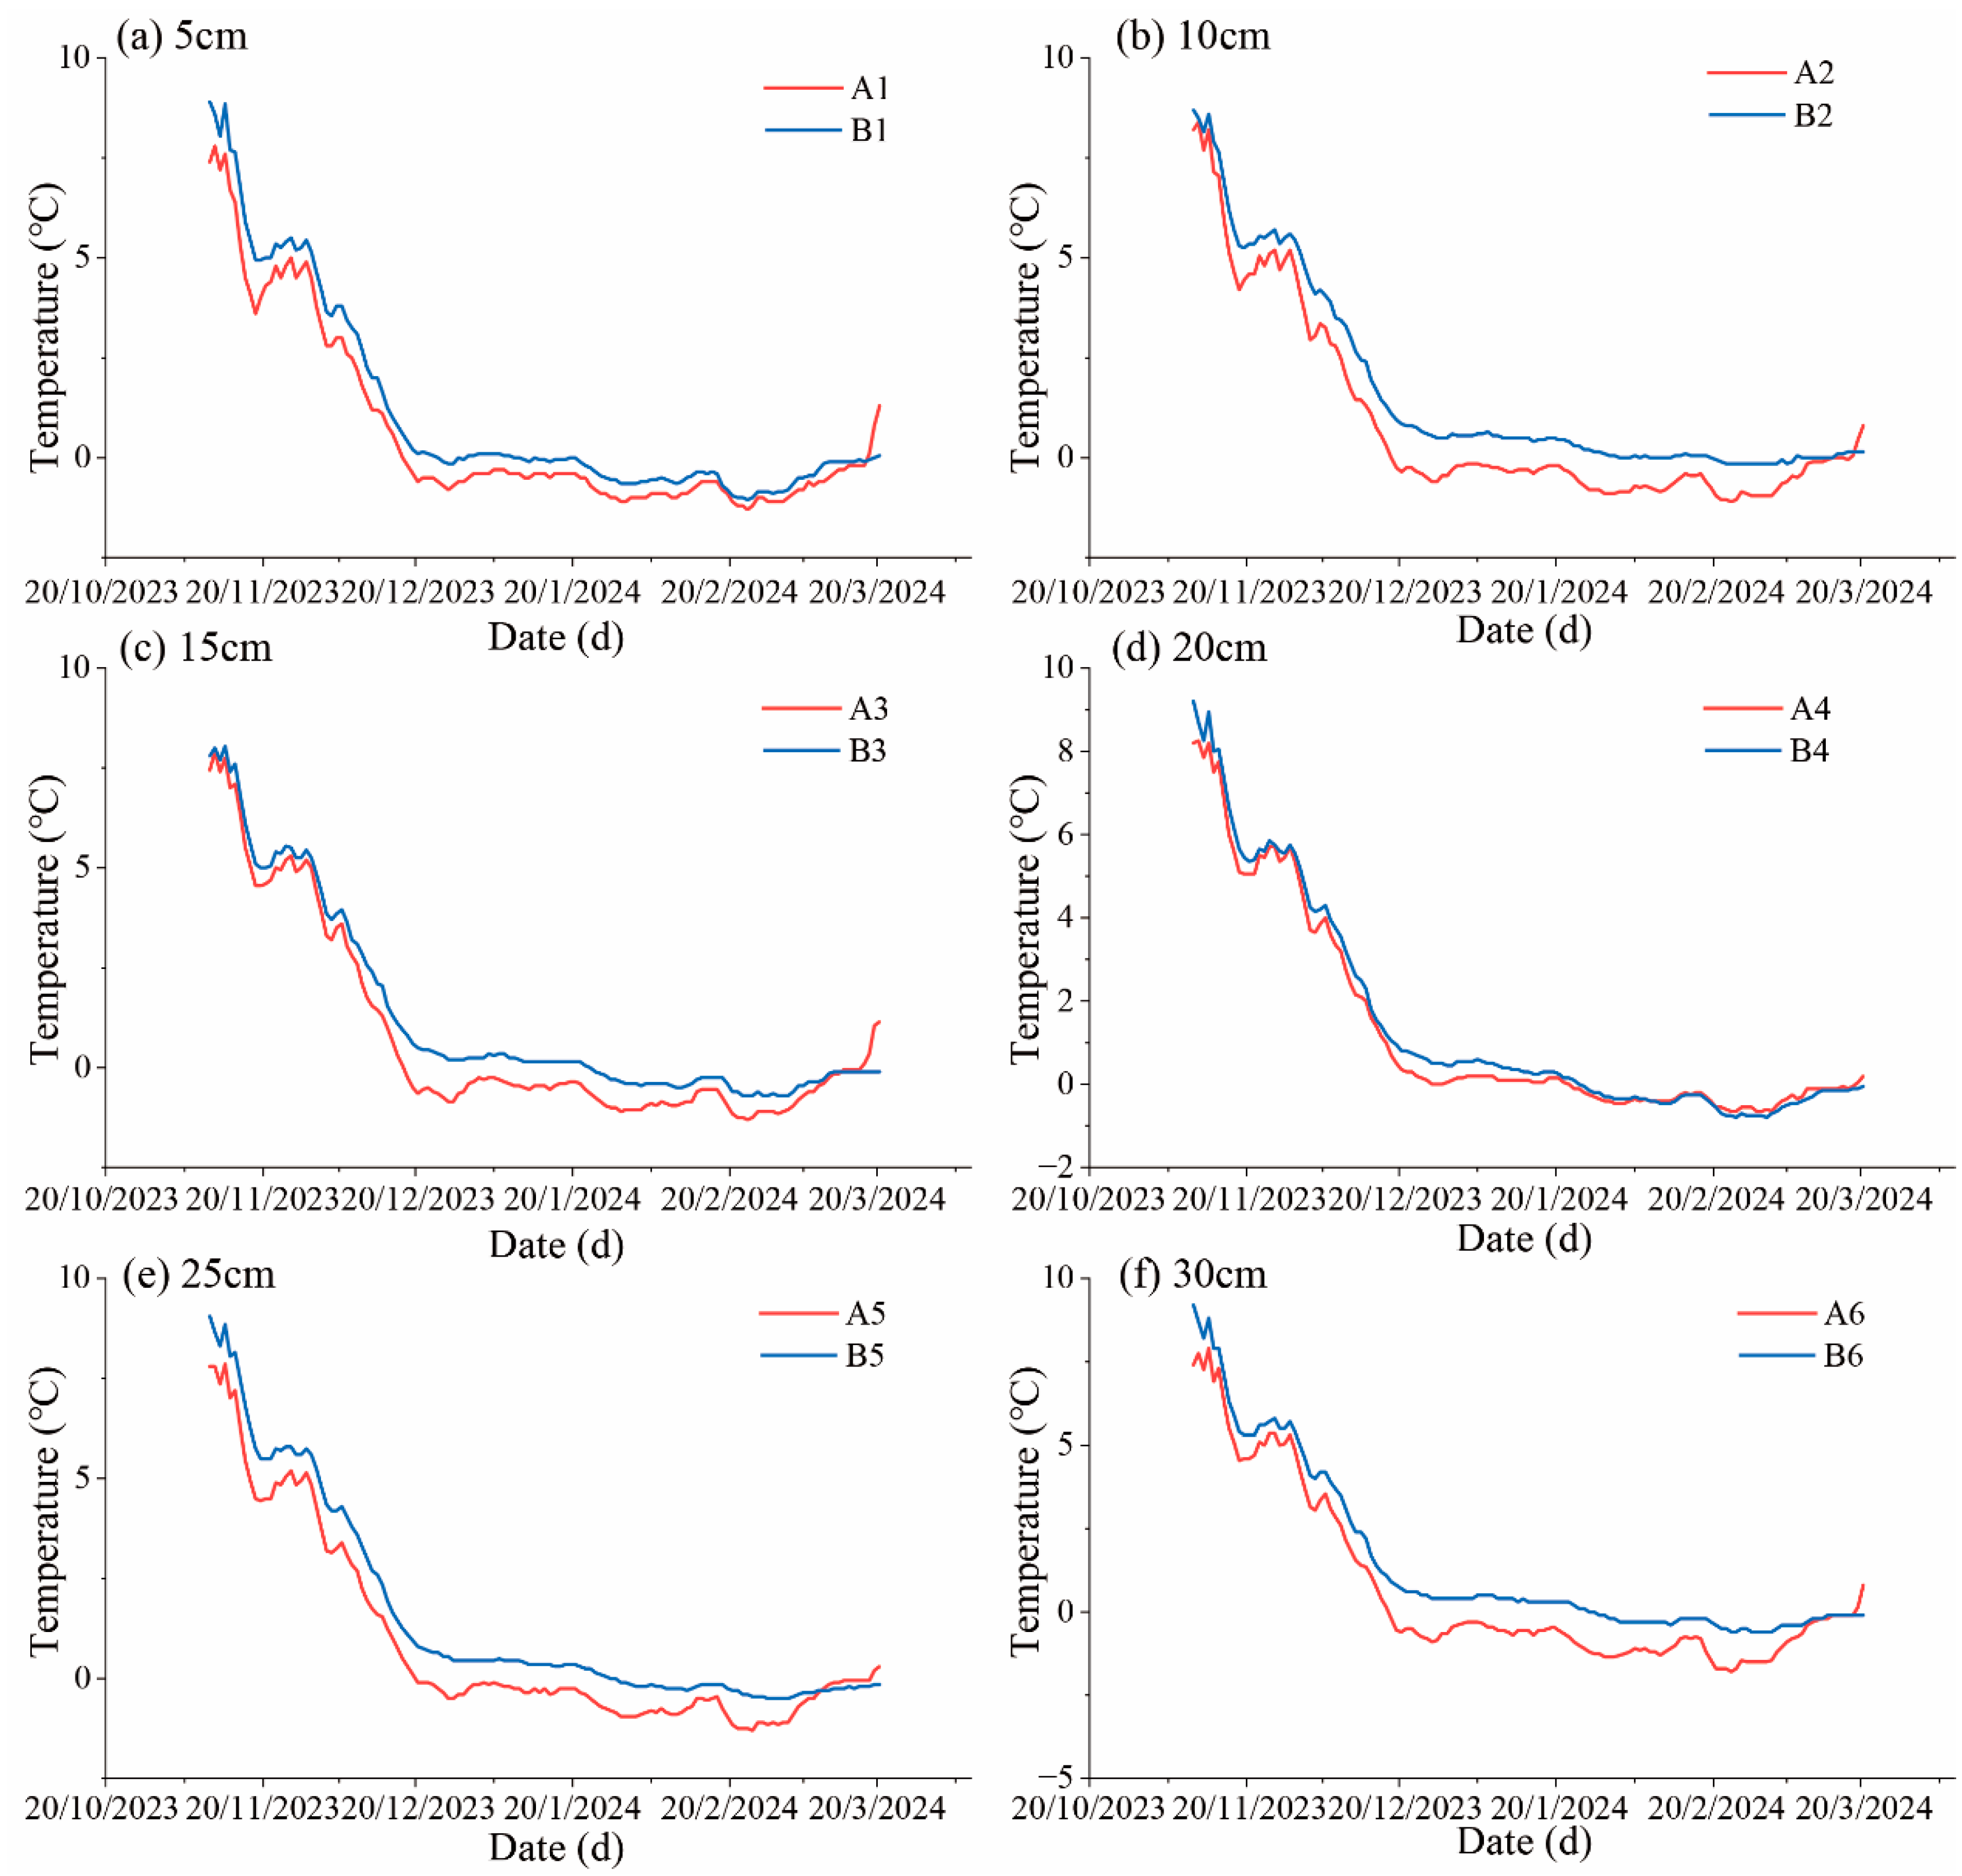
3.1.2. Temperature Variation Characteristics at Branch Sites of Different Cover Materials at the Same Height

At the 5 cm height, the temperature changes of the two materials differed during overwintering. From the start to 20 December, the insulation blanket treatment was warmer than the tarpaulin. After 20 December until overwintering ended, the tarpaulin was slightly warmer. This is because the low-height treatment resulted in smaller air volume in the insulation facility. Air is a poor conductor of heat, so less air volume means lower thermal inertia. The tarpaulin treatment has better light transmission, making it more susceptible to solar radiation and external temperatures. Thus, during warming phases, the low-height tarpaulin treatment was warmer than the insulation blanket. At the 10 cm height, the temperature trends of the two materials were similar to those at 5 cm, but the differences were smaller. When the insulation height exceeded 10 cm, the insulation blanket treatment was warmer than the tarpaulin, with the difference increasing with height. Above 10 cm, the insulation blanket treatment was significantly warmer, and the difference between the two materials tended to increase with height. This is likely related to the different insulation trends of the two materials as height increases (Figure 5).

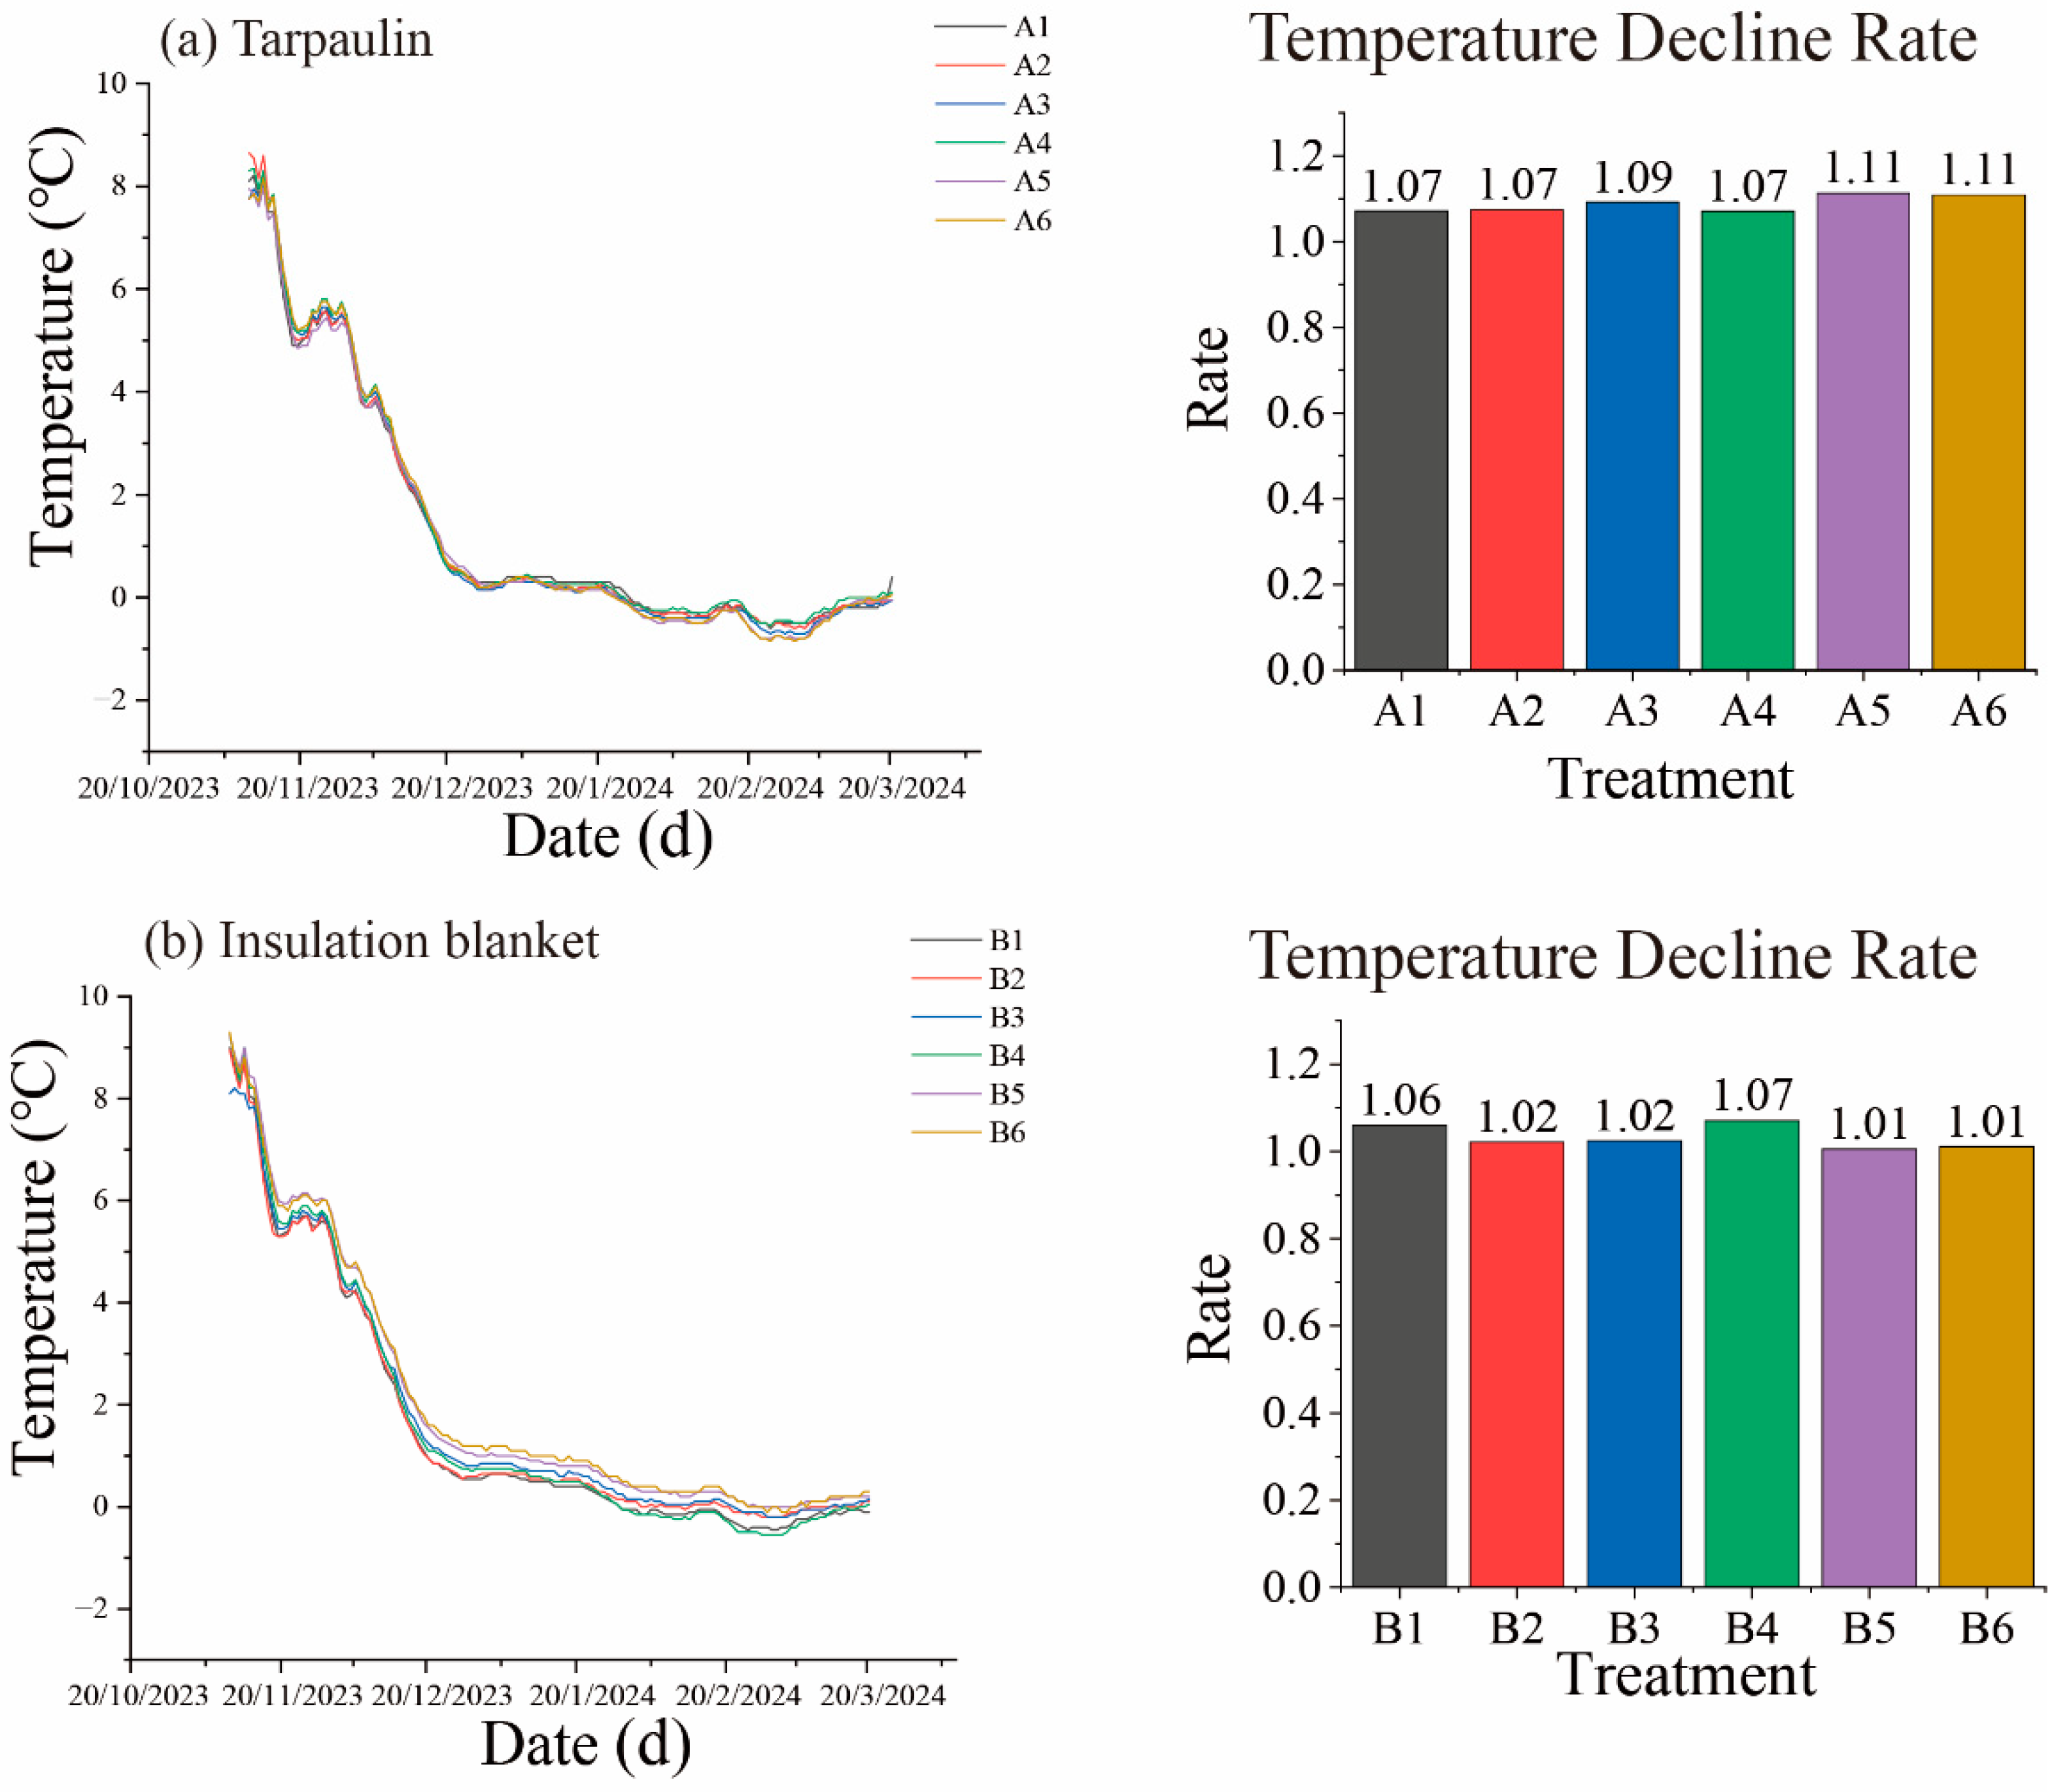
3.2. Temperature Variation Trends in the 20 cm Subsoil Layer During Overwintering

3.2.1. Comparison of Temperature in the 20 cm Subsoil Layer Under Different Heights of the Same Cover Material

During overwintering, the daily minimum temperature at 20 cm underground in all treatments consistently decreased, with an upward trend only at the end. To better compare the temperature drop across different heights under the same material, the temperature decline rate during overwintering was calculated. Under color-strip covers, all heights showed the same trend, but with varying amplitudes. The 20 cm height had the highest temperature, while the 30 cm height had the lowest, with no significant differences among other heights (Figure 6a). Under insulation blanket covers, the temperature changes were smaller and more consistent. The 10 cm height had the lowest temperature drop rate and the best insulation among all heights (Figure 6b).

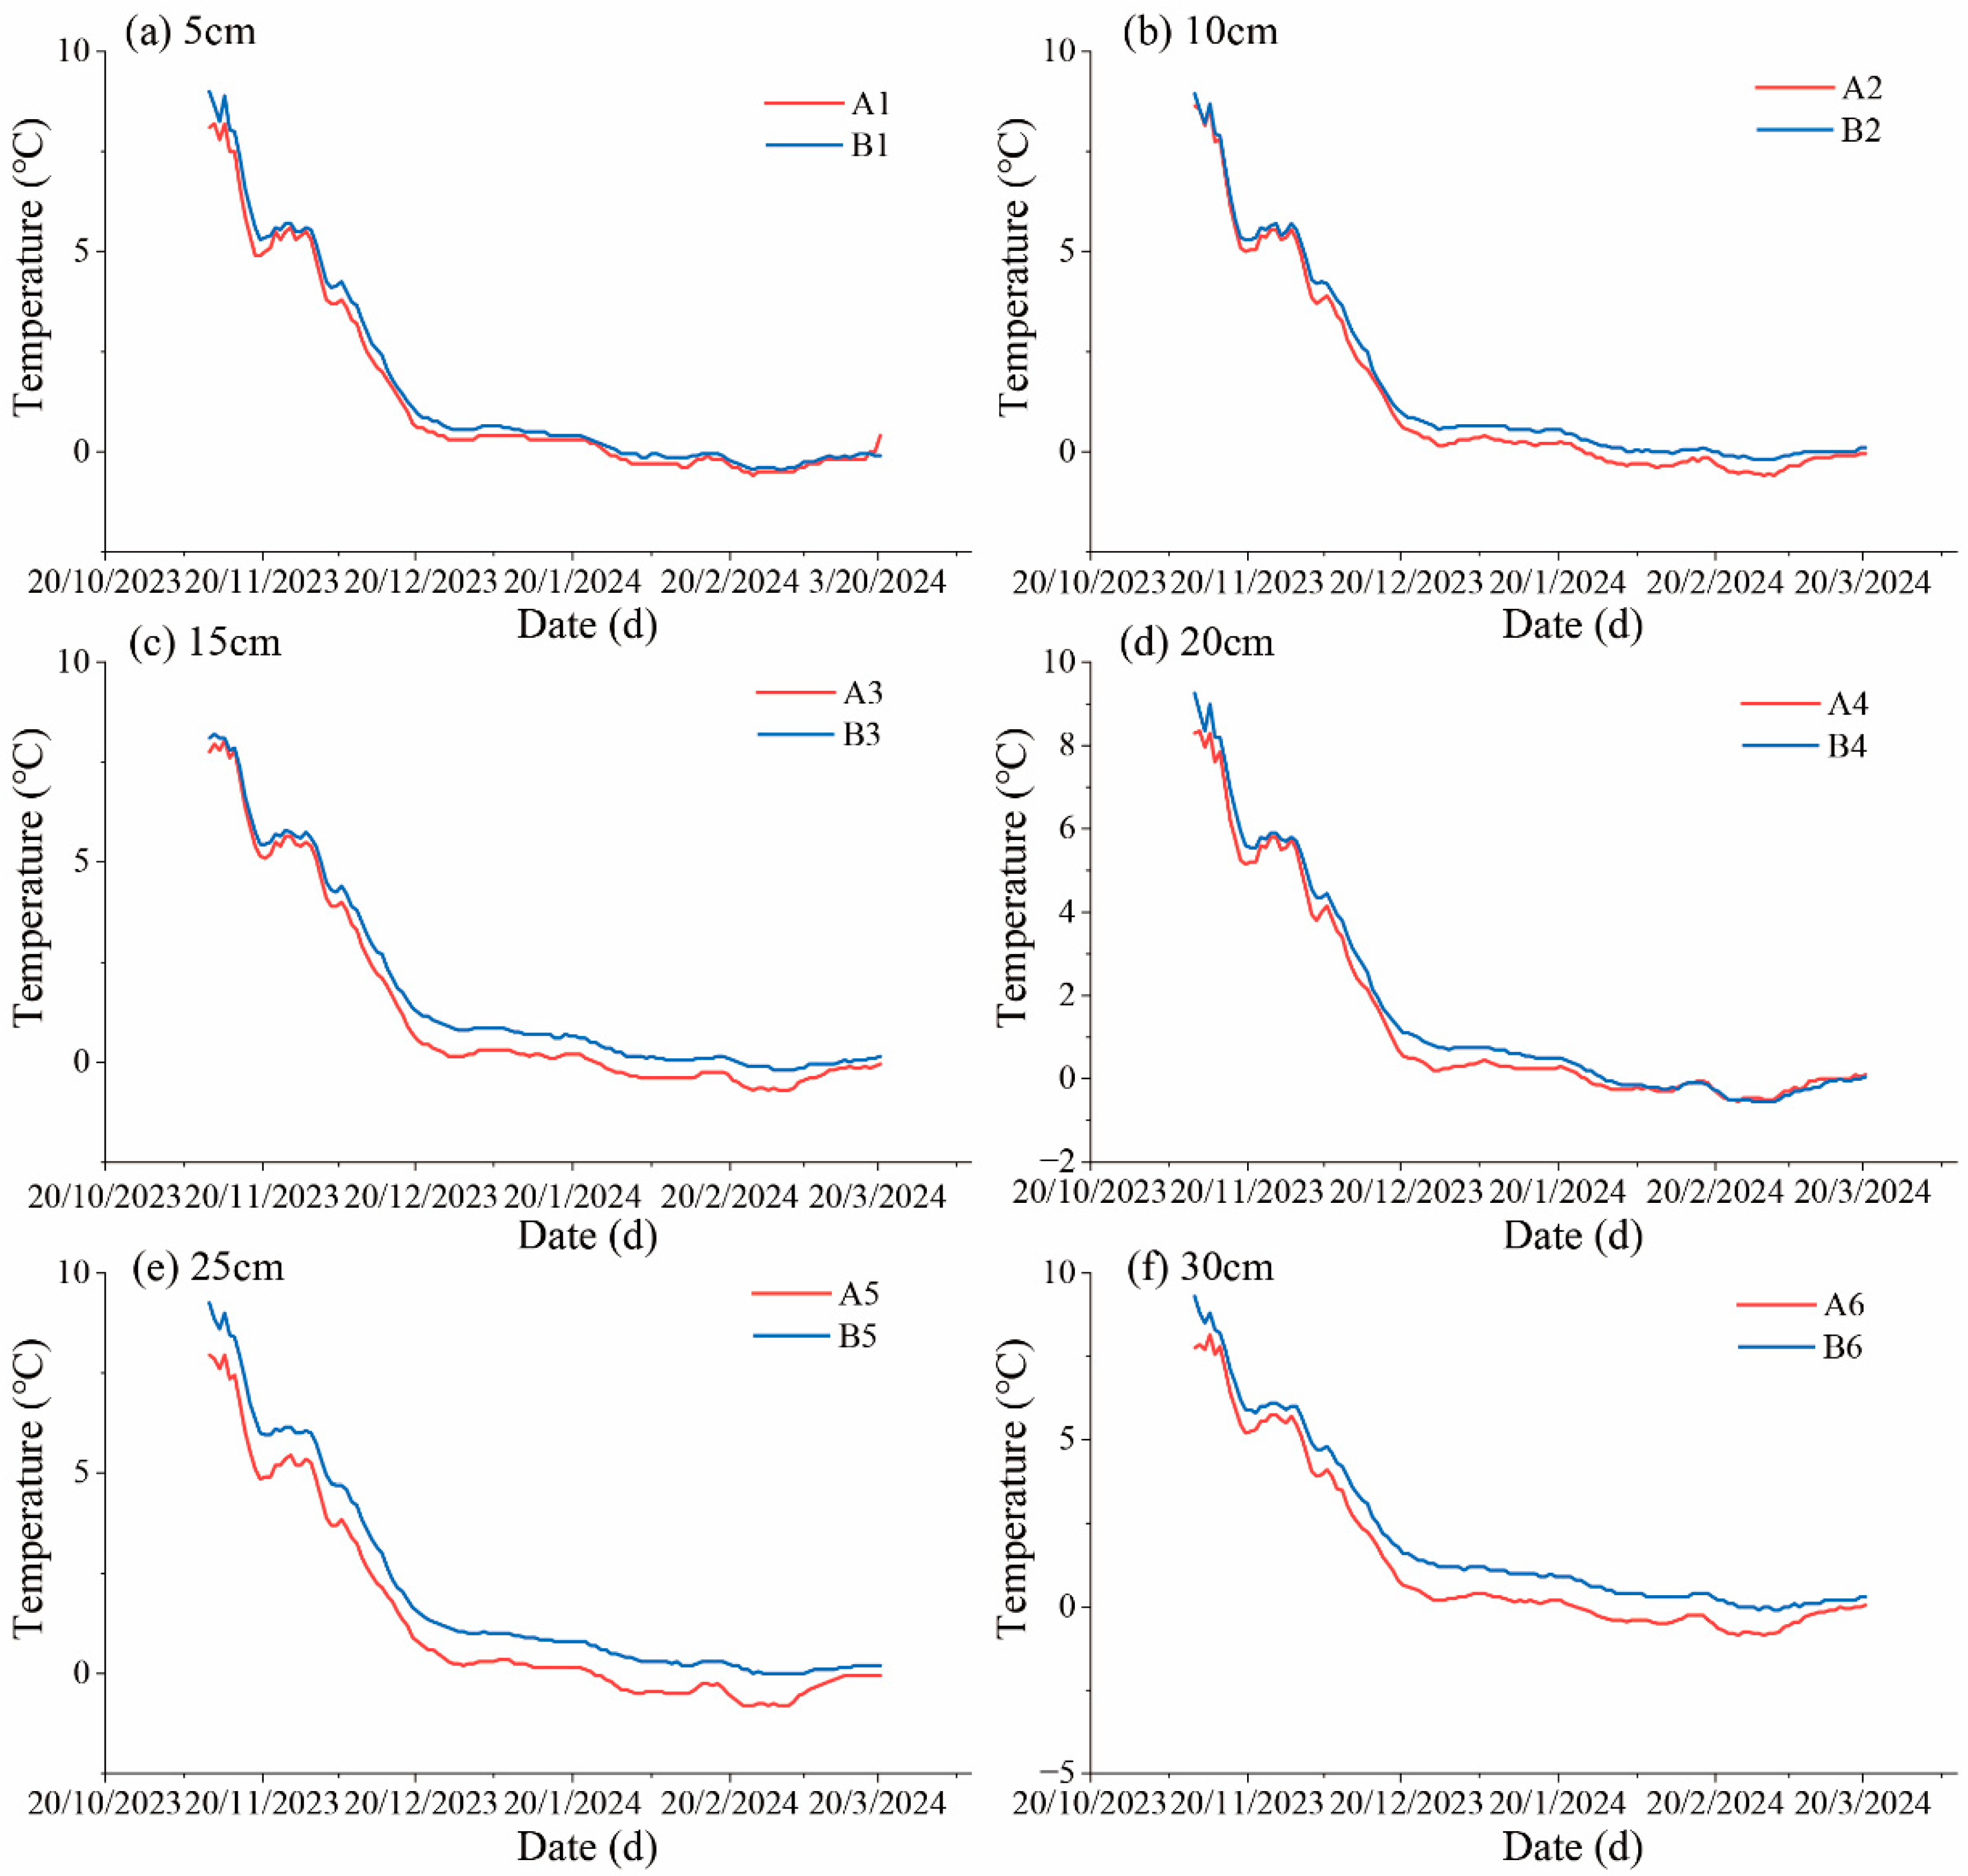
3.2.2. Comparison of 20 cm Subsoil Temperature for Different Cover Materials at the Same Height

Upon comparing the daily minimum temperature trends of the 20 cm subsoil layer under different cover materials at the same height, it was found that the insulation blanket treatment had higher temperatures than the tarpaulin treatment at all six heights tested. The temperature difference between the two materials varied with height. At 5 cm and 20 cm, temperatures were similar for both materials, indicating comparable insulation effects at this height for the 20 cm subsoil layer. At other heights, the insulation blanket showed a more pronounced insulation effect (Figure 7).

3.3. Temperature Variation Trends in the 40 cm Subsoil Layer During Overwintering

3.3.1. Comparison of 40 cm Subsoil Temperature for Different Heights of the Same Cover Material

In the soil layer 40 cm below ground, the daily minimum temperatures for the different height treatments of the tarpaulin were very similar, with no significant differences in insulation performance between treatments, which decreased with increasing height (Figure 8a). Under the insulation blanket cover, the differences between height treatments were more pronounced, with insulation performance tending to increase with height (Figure 8b). At this depth, soil temperature is less affected by solar radiation, so the impact of different treatments is weaker, leading to insignificant differences between treatments.

3.3.2. Temperature Comparison at the 40 cm Subsoil Layer for Different Cover Materials at the Same Height

Temperatures under the insulation blanket were consistently higher than those under the tarpaulin at 40 cm underground. The difference was more pronounced at 25 cm and 30 cm heights. Overall, the temperature difference between the two materials at 40 cm was smaller than at 20 cm. This is because the temperature at greater soil depths is more influenced by subsoil heat transfer and less influenced by solar radiation and external temperature (Figure 9).

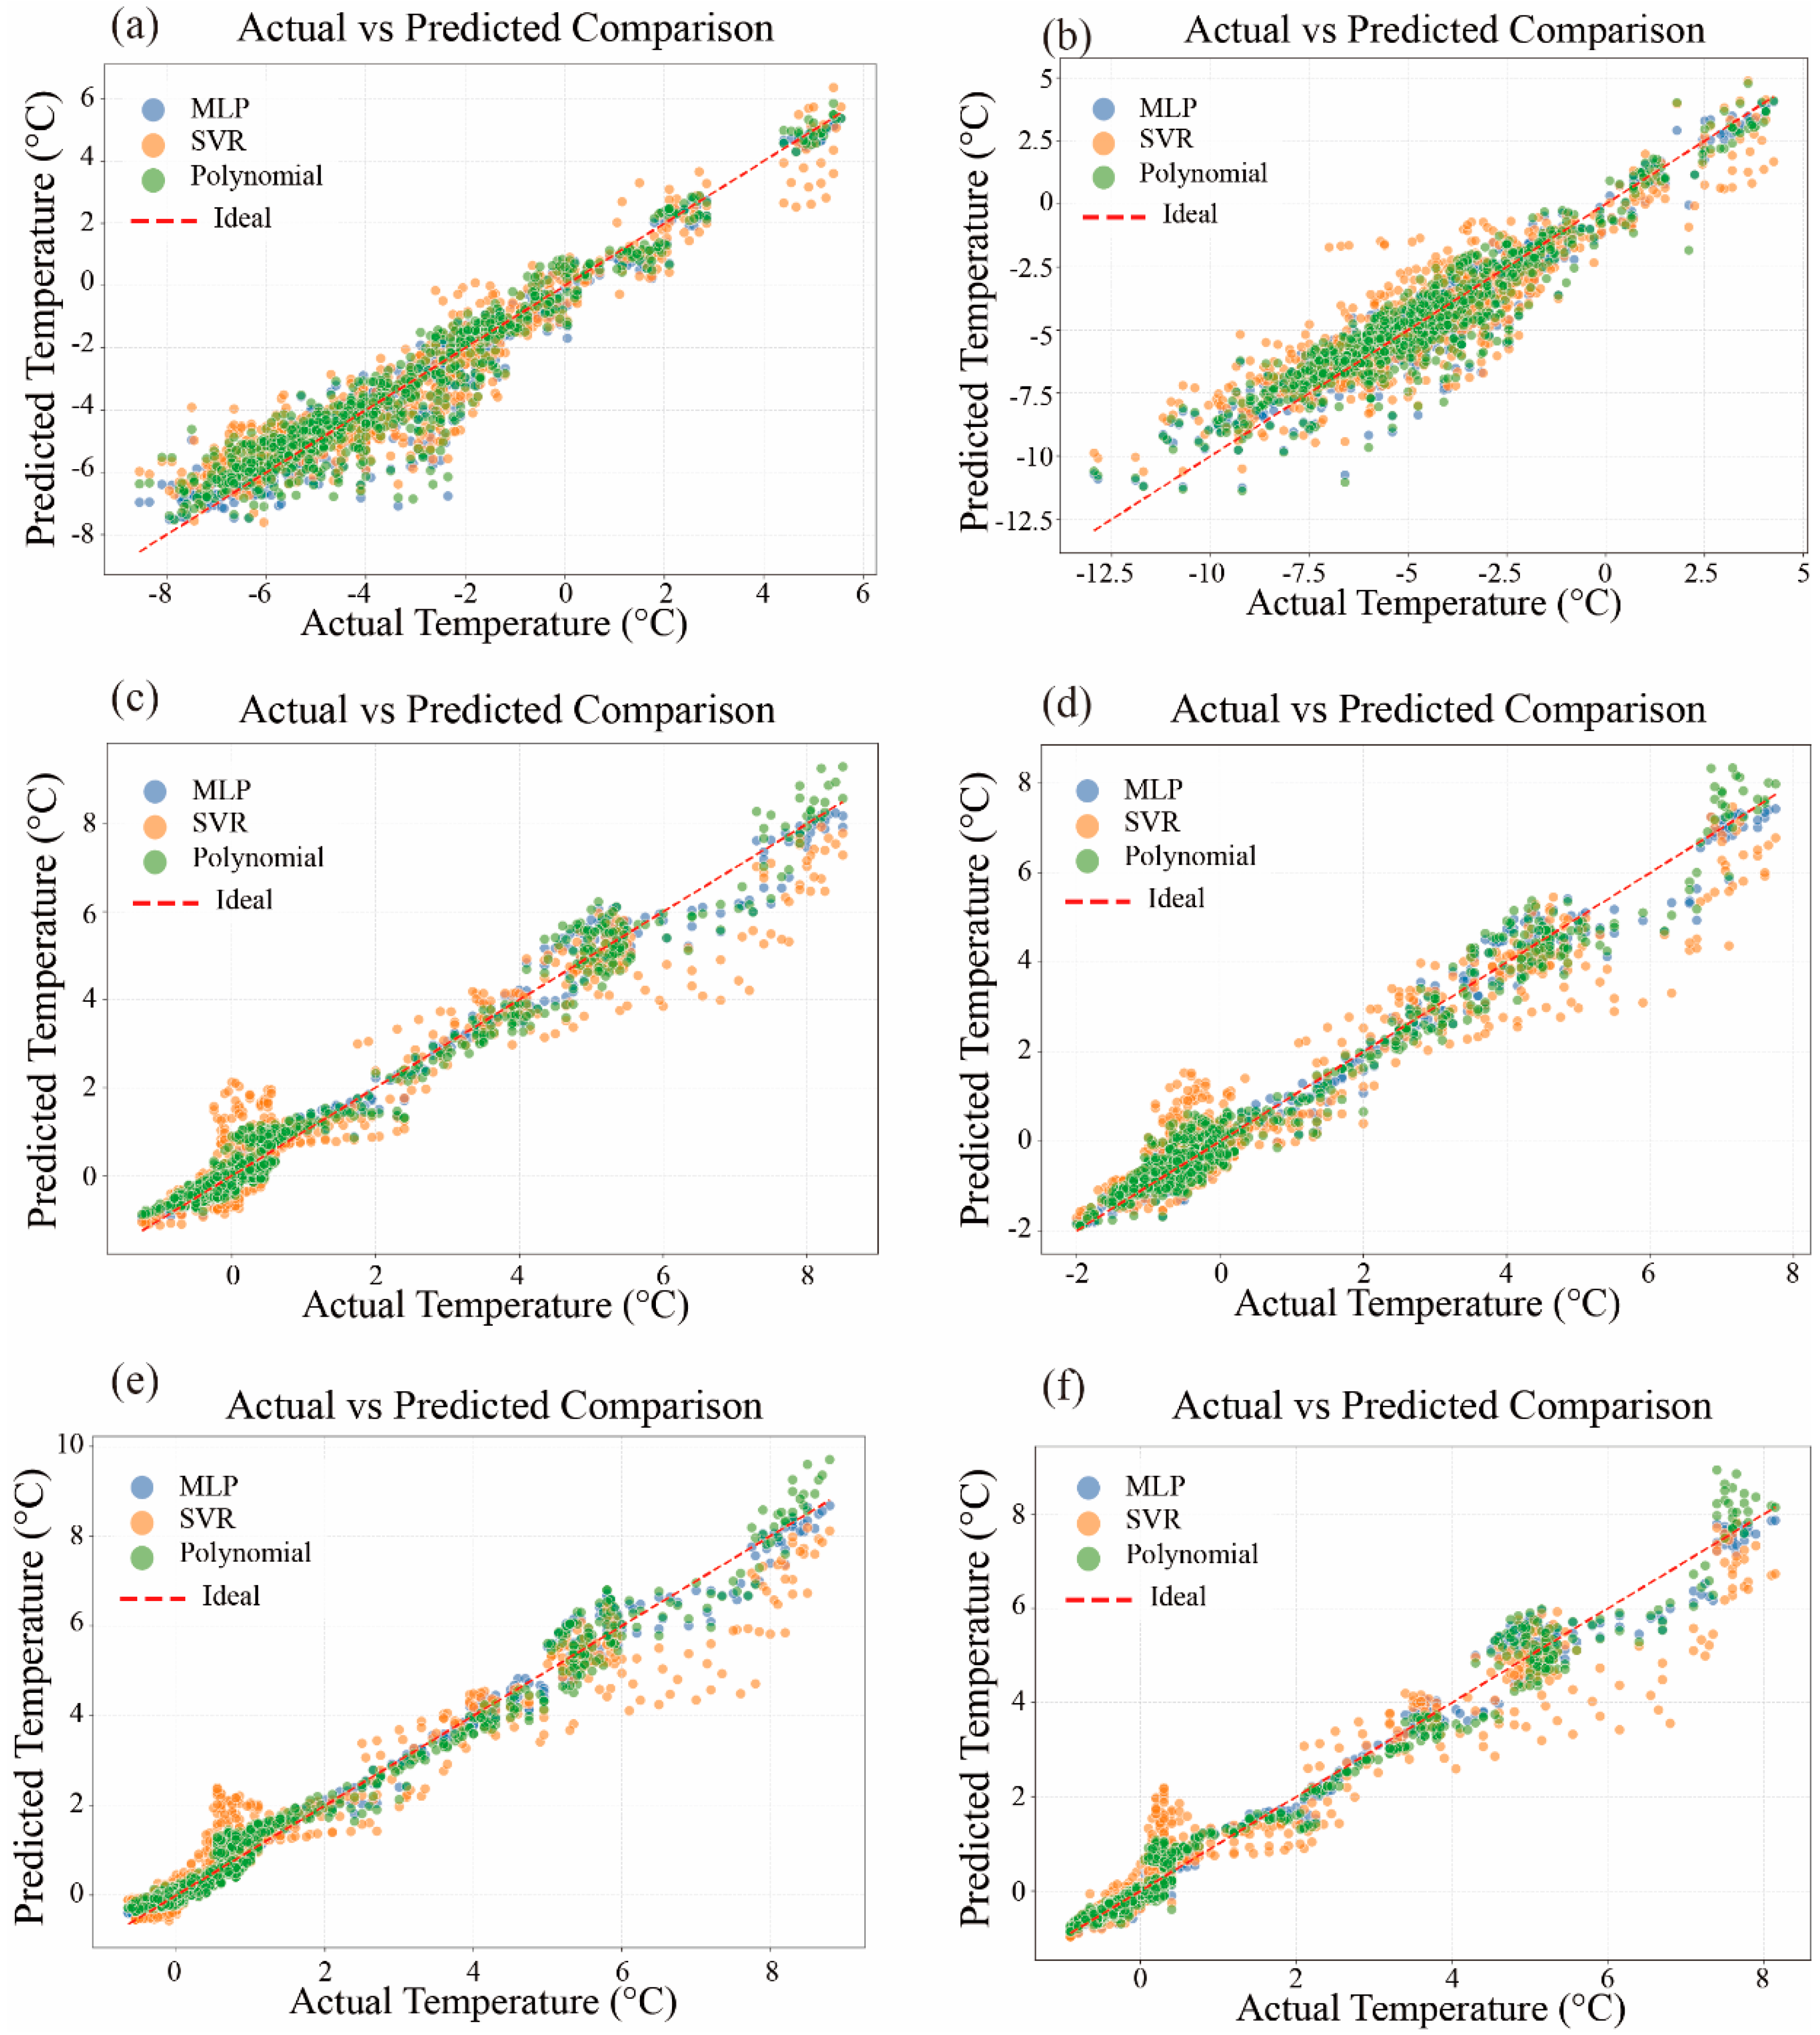
3.4. Prediction of Optimal Thermal Insulation Heights for Different Cover Materials Using Artificial Neural Networks

In this study, six MLP temperature prediction models were developed to forecast the daily minimum temperatures at three locations, grapevine branches, 20 cm underground, and 40 cm underground, for two covering materials. For comparative analysis, SVR and polynomial regression models were also constructed. The R2 values of the two MLP models for branch temperature prediction were 0.92 and 0.89. Scatter plots comparing predicted vs. observed values across all models (Figure 10) indicated a good fit, effectively capturing temperature change trends at different heights (Figure 10a,b). The four subsoil temperature prediction models had R2 values exceeding 0.98, with comprehensive evaluation metrics (MAE/RMSE) detailed in Table 3. Comparative results demonstrate the MLP’s superior performance across all materials and measurement positions.
However, scatter plots revealed that these models clustered closer to the ideal fit line in low-temperature ranges, particularly below 5 °C. Given the overall downward trend in subsoil temperatures during overwintering, this suggests higher sensitivity to temporal features in low-temperature intervals, as evidenced by the concentration of prediction points along the temperature decline phase. Consequently, prediction accuracy for subsoil temperatures using external temperature and insulation height as features may decrease (Figure 10c–f)
In this study, the cumulative daily minimum temperature during overwintering was used to compare the temperature effects of different heights under the same cover material and location, assessing the thermal insulation performance of these heights.
Under the tarpaulin cover, the branch temperature rose from 1 to 6 cm height, peaking at 6 cm, and then declined with height (Figure 11a). Under the insulation blanket, temperature rose significantly from 1 to 14 cm, stabilized at 14–25 cm, and dropped significantly above 25 cm (Figure 11d).
At 20 cm soil depth under tarpaulin, temperature rose significantly until 30 cm height and then declined slowly (Figure 11b). At 40 cm depth, it rose until 36 cm height and then decreased (Figure 11c). Under the insulation blanket, 20 cm soil temperature peaked at 30 cm height and then declined (Figure 11e). At 40 cm depth, the temperature dropped at 2–5 cm and 16–23 cm heights, but it followed the 20 cm trend elsewhere, peaking at 38 cm height.
Model-predicted branch temperatures matched experimental data, but subsoil predictions were less accurate. This may be due to the model’s high dependence on time features, which were included in the input characteristics. As a result, the model may not be sensitive enough to the height–temperature relationship needed for this study, causing temperature prediction distortions. Optimal insulation heights were 6 cm for tarpaulin and 18 cm for the insulation blanket based on branch insulation performance.

4. Discussion

Changes in cover materials significantly impact the thermal insulation performance in no-buried-soil overwintering cultivation of wine grapes [2]. In this study, comparing the temperature trends of different materials of treatments at the same height shows that the insulation blanket treatment outperforms the tarpaulin treatment in thermal insulation at the branches, in the 20 cm underground soil layer, and in the 40 cm underground soil layer. Tarpaulin offers advantages like wear resistance, water-proofing, long life, and low cost. The insulation blanket used here consists of double-layered tarpaulin with pearl cotton between. Pearl cotton, a common insulating material, features good insulation, low thermal conductivity, and low density. Combining it with tarpaulin maximizes the advantages of both, achieving superior thermal insulation compared to either material alone [36,37,38].
This study developed six temperature prediction models using MLP neural networks, with model reliability assessed through R2 coefficients and scatter plots of predicted versus actual values. All models demonstrated strong predictive capability, achieving R2 values exceeding 0.87, while scatter plot analysis confirmed close alignment between predictions and measurements within acceptable error thresholds. In greenhouse microclimate research, traditional statistical methods often struggle to address complex nonlinear interactions between light and thermal factors, whereas nonlinear MLP models excel at handling systems with incomplete information and uncertain boundaries, as evidenced by prior applications [39,40]. For instance, Abid et al. predicted vertical temperature profiles in greenhouses using CFD simulations [13], while Oh et al. employed neural networks for indoor temperature forecasting [26]. Notably, four subsurface temperature models exhibited deviations from experimental trends, primarily due to the reduced influence of external solar radiation on underground thermal regimes and artificial linear correlations induced by temporal input features during model training, which led to overfitting [41]. To enhance prediction accuracy, future studies should prioritize incorporating subsurface thermal parameters as model inputs while maintaining MLP’s advantage in capturing nonlinear relationships. This approach addresses current limitations while preserving the methodology’s strengths in microenvironment prediction.
In this study, under the same mulch material treatment, different heights of insulated space significantly affected the internal temperature, but this effect was mainly reflected in the temperature at the branches. In the subsoil layer of the height of the treatments, although there were differences in temperature, the overall trend remained consistent, and the differences between treatments were not significant. This is mainly because with the increase in soil depth, the effect of external temperature and solar radiation on soil temperature was further reduced [42]. The influence of outside temperature, solar radiation, and ground radiation on the temperature at the branches was more sensitive to the height of the insulation facility [43]. Under the cover of tarpaulin, the experimental data showed that the temperature at the branches decreased with the increase in height of the facility. The 5 cm height treatment had the best insulation effect. The model-simulated data indicated that the thermal insulation performance of the tarpaulin treatment at the branches peaked at 6 cm and then gradually declined with increasing height. Further analysis of the experimental data revealed that after December 19, the lowest temperature point during overwintering, the branch temperature of all treatments showed an upward trend. Under the tarpaulin cover, the 5 cm treatment’s temperature consistently stayed above the others’. This resulted from the low-height treatment’s smaller thermal inertia and the tarpaulin’s less-than-ideal insulation. Consequently, the 5 cm tarpaulin treatment accumulated more heat during the heat absorption phase. During the cooling phase, this treatment retained the most heat, had the smallest insulation space, and benefited from hot air convection, which brought warm air closer to the branches in low-height setups [44]. Thus, the 5 cm height treatment under tarpaulin cover provided the best insulation during overwintering. For the insulation blanket cover, experimental data pointed to 25 cm as the optimal height for insulation, while model simulations showed good insulation between 14 and 25 cm, with little height-related variation.
Our comparison revealed a nonlinear relationship between insulation height and thermal performance in no-burial overwintering systems, with polyethylene tarpaulin and insulation blanket exhibiting distinct patterns. The temperature inside of the insulation facility is a complex system involving heat absorption and dissipation. In the heat absorption stage, a higher height enhances solar radiation capture, accelerating temperature rise [45]; in the heat dissipation stage, increased height expands air volume (greater thermal inertia) but causes heat stratification—warmer air accumulates in the upper space, reducing branch-level temperatures while ground radiation efficiency decreases. Although larger volumes increase the heat exchange area, this accelerates heat loss in taller facilities [46,47]. Both spatial configuration and material properties jointly influence thermal dynamics, resulting in material-specific optimal heights for wine grape overwintering [48]. Machine learning enables precise prediction of these optimal heights across materials, refining cultivation strategies. This study innovatively explores microenvironmental temperature variations in non-burial systems through height modulation, integrating material and spatial effects. The artificial neural network effectively identifies height–material synergy for optimal insulation. Current limitations include restricted input features neglecting microclimate parameters, limited material types hindering comprehensive interaction analysis, and regional specificity requiring broader validation across diverse wine-producing areas. Future research should incorporate microenvironment variables, such as solar radiation, soil moisture, and wind speed, to enhance prediction accuracy, test diverse materials with varying thermal properties to elucidate material–space–performance interactions, validate models across different wine regions for adaptive management strategies, and optimize economic efficiency by balancing insulation performance with facility costs.

5. Conclusions

This study investigated the effects of different covering materials and insulation space heights on thermal insulation performance during non-burial overwintering of wine grapes. Experimental results demonstrated that the insulation blanket exhibited superior thermal insulation compared to the tarpaulin throughout the overwintering period. Specifically, under tarpaulin coverage, the 5 cm height treatment provided the best insulation performance, while under insulation blanket coverage, the 25 cm height treatment showed optimal results. An artificial neural network model was trained on experimental data to develop six temperature prediction models for different covering materials and monitoring points. All models achieved high fitting accuracy, with R2 coefficients exceeding 0.89, indicating reliable simulation of temperature trends. Further predictions using the model revealed optimal insulation heights of 6 cm for the tarpaulin and 22 cm for the insulation blanket. This study is the first to identify a significant correlation between insulation facility height and thermal performance, demonstrating that this relationship is influenced by solar radiation, material thermal conductivity, and material-specific patterns. These findings provide a novel perspective for non-burial overwintering cultivation of wine grapes and establish a theoretical foundation for optimizing insulation facility designs. They highlight that adjusting insulation space parameters—in addition to replacing materials—can enhance winter protection cost-effectively, thereby supporting the sustainable development of the wine grape industry in cold regions. Notably, for practical applications in the northern foothills of the Tianshan Mountains, we recommend using a 6 cm height for tarpaulin coverage and 22 cm for insulation blanket coverage during overwintering.

Author Contributions

Y.M.: writing—review and editing, writing—original draft, software, methodology, investigation, formal analysis, data curation. J.Y.: writing—review and editing, validation, data curation. Y.C.: software, visualization, Validation, formal analysis. P.W.: writing—original draft, visualization, data curation. Q.S.: writing—review and editing, supervision, funding acquisition, conceptualization. All authors have read and agreed to the published version of the manuscript.

Funding

Science and Technology Program of XPCC: (Grant No. 2024AB042); Science and Technology Research and Development Project in Key Areas of Shihezi City, the Eighth Division of XPCC: (Grant No. 2023NY02-1).

Data Availability Statement

The raw data supporting the conclusions of this article will be made available by the authors upon request.

Acknowledgments

The authors gratefully acknowledge Guoli Cheng for his intellectual guidance and Baron Baobao Winery for providing critical experimental site support.

Conflicts of Interest

The authors declare no conflicts of interest.

Abbreviations

ANNartificial neural network
CFDcomputational fluid dynamics
MLPmultilayer perceptron

References

  1. Svyantek, A.; Köse, B.; Stenger, J.; Auwarter, C.; Hatterman-Valenti, H. Cold-Hardy Grape Cultivar Winter Injury and Trunk Re-Establishment Following Severe Weather Events in North Dakota. Horticulturae 2020, 6, 75. [Google Scholar] [CrossRef]
  2. Wan, N.; Yang, B.; Yin, D.; Ma, T.; Fang, Y.; Sun, X. Overwintering covered with soil or avoiding burial of wine grapes under cold stress: Chinese wine industry’s past and future, challenges and opportunities. Stress Biol. 2023, 3, 40. [Google Scholar] [CrossRef]
  3. Huang, S.; Liu, Q.; Wu, Y.; Chen, M.; Yin, H.; Zhao, J. Edible Mushroom Greenhouse Environment Prediction Model Based on Attention CNN-LSTM. Agronomy 2024, 14, 473. [Google Scholar] [CrossRef]
  4. Ambroise, V.; Legay, S.; Guerriero, G.; Hausman, J.-F.; Cuypers, A.; Sergeant, K. The Roots of Plant Frost Hardiness and Tolerance. Plant Cell Physiol. 2020, 61, 3–20. [Google Scholar] [CrossRef] [PubMed]
  5. Zhang, L.; Zhu, W.; Xu, G.; Zhang, L.; Liu, G.; Li, R.; Wang, Z.; Yang, F.; Wang, H.; Cheng, C.; et al. Effects of Winter Thermal Blanket Coverage on the Overwintering Physiological Metabolism of Grapevine Plants in the Eastern Foothills of Helan Mountain. J. China Agric. Univ. 2024, 29, 68–78. (In Chinese) [Google Scholar]
  6. Qin, Y.; Lu, H.; Xiao, L.; Yang, R.; Dong, C.; Hu, X. Study on Overwintering Covering of Field-Grown “Honey-Juice” Grape in Harbin Area. North. Hortic. 2019, 8, 47–52. (In Chinese) [Google Scholar]
  7. Davenport, J.R.; Keller, M.; Mills, L.J. How Cold Can You Go? Frost and Winter Protection for Grape. HortScience Horts 2008, 43, 1966–1969. [Google Scholar] [CrossRef]
  8. Li, Y.; Pan, B.; Adili, W.; Shen, L.; Fang, G.; Li, Q.; Ma, H.; Li, X. Influence of Snowfall on the North Slope of Tianshan Mountains on the Overwintering of Grapes with Different Mulching Effects. J. Arid. Zone Resour. Environ. 2015, 29, 132–137. (In Chinese) [Google Scholar] [CrossRef]
  9. Abdel-Ghany, A.M.; Kozai, T. On the determination of the overall heat transmission coefficient and soil heat flux for a fog cooled, naturally ventilated greenhouse: Analysis of radiation and convection heat transfer. Energy Convers Manag. 2006, 47, 2612–2628. [Google Scholar] [CrossRef]
  10. Jain, D.; Tiwari, G.N. Effect of greenhouse on crop drying under natural and forced convection II. Thermal modeling and experimental validation. Energy Convers Manag. 2004, 45, 2777–2793. [Google Scholar] [CrossRef]
  11. Murad, R.I.; Abdel-Wahed, M.H.; Hassan, M.F.; Raslan, M.A. Performance of Low Agricultural Tunnels for Vegetables Production. Misr J. Agric. Eng. 2020, 35, 641–656. [Google Scholar] [CrossRef]
  12. Tian, D.; Li, Y.; Zhao, S.; Wu, Q.; Ma, C.; Song, W. An Analysis of the Influence of Construct Parameters on the Solar Radiation Input in an Insulated Plastic Greenhouse. Agronomy 2024, 14, 510. [Google Scholar] [CrossRef]
  13. Abid, H.; Ketata, A.; Lajnef, M.; Chiboub, H.; Driss, Z. Impact of greenhouse roof height on microclimate and agricultural practices: CFD and experimental investigations. J. Therm. Anal. Calorim. 2024, 149, 5483–5495. [Google Scholar] [CrossRef]
  14. El-Maghlany, W.M.; Teamah, M.A.; Tanaka, H. Optimum design and orientation of the greenhouses for maximum capture of solar energy in North Tropical Region. Energy Convers. Manag. 2015, 105, 1096–1104. [Google Scholar] [CrossRef]
  15. Guo, Z.Y.; Li, D.Y.; Wang, B.X. A novel concept for convective heat transfer enhancement. Int. J. Heat Mass Transf. 1998, 41, 2221–2225. [Google Scholar] [CrossRef]
  16. Bai, Y.; Xiong, Y.; Huang, J.; Zhou, J.; Zhang, B. Accurate prediction of soluble solid content of apples from multiple geographical regions by combining deep learning with spectral fingerprint features. Postharvest Biol. Technol. 2019, 156, 110943. [Google Scholar] [CrossRef]
  17. Bedi, P.; Gole, P. Plant disease detection using hybrid model based on convolutional autoencoder and convolutional neural network. Artif. Intell. Agric. 2021, 5, 90–101. [Google Scholar] [CrossRef]
  18. Cui, R.; Li, J.; Wang, Y.; Fang, S.; Yu, K.; Zhao, Y. Hyperspectral imaging coupled with dual-channel convolutional neural network for early detection of apple valsa canker. Comput. Electron. Agric. 2022, 202, 107411. [Google Scholar] [CrossRef]
  19. Daza, K.; Hernandez, J.; Florez, H. Hardware and software system for hydric estimation and crop irrigation scheduling. In Lecture Notes in Computer Science; Misra, S., Gervasi, O., Murgante, B., Stankova, E., Korkhov, V., Torre, C., Eds.; Springer International Publishing: Cham, Switzerland, 2019; pp. 150–165. [Google Scholar]
  20. Dong, C.; Zhang, Z.; Yue, J.; Zhou, L. Automatic recognition of strawberry diseases and pests using convolutional neural network. Smart Agric. Technol. 2021, 1, 100009. [Google Scholar] [CrossRef]
  21. Machado, R.M.A.; Oliveira, M.D.R.G. Tomato root distribution, yield and fruit quality under different subsurface drip irrigation regimes and depths. Irrig. Sci. 2005, 24, 15–24. [Google Scholar] [CrossRef]
  22. Ji, M.; Zhang, L.; Wu, Q. Automatic grape leaf diseases identification via UnitedModel based on multiple convolutional neural networks. Inf. Process. Agric. 2020, 7, 418–426. [Google Scholar] [CrossRef]
  23. Yang, M.; Xu, D.; Chen, S.; Li, H.; Shi, Z. Evaluation of machine learning approaches to predict soil organic matter and pH using vis-NIR spectra. Sensors 2019, 19, 263. [Google Scholar] [CrossRef] [PubMed]
  24. Sharma, A.; Jain, A.; Gupta, P.; Chowdary, V. Machine Learning Applications for Precision Agriculture: A Comprehensive Review. IEEE Access 2021, 9, 4843–4873. [Google Scholar] [CrossRef]
  25. Shamshirband, S.; Esmaeilbeiki, F.; Zarehaghi, D.; Neyshabouri, M.; Samadianfard, S.; Ghorbani, M.A.; Mosavi, A.; Nabipour, N.; Chau, K.-W. Comparative analysis of hybrid models of firefly optimization algorithm with support vector machines and multilayer perceptron for predicting soil temperature at different depths. Eng. Appl. Comp. Fluid 2020, 14, 939–953. [Google Scholar] [CrossRef]
  26. Oh, K.C.; Park, S.; Kim, S.J.; Cho, L.H.; Lee, C.G.; Kim, D.H. Data-Driven Optimization Method for Recurrent Neural Network Algorithm: Greenhouse Internal Temperature Prediction Model. Agronomy 2024, 14, 2545. [Google Scholar] [CrossRef]
  27. Jung, D.-H.; Kim, H.S.; Jhin, C.; Kim, H.-J.; Park, S.H. Time-serial analysis of deep neural network models for prediction of climatic conditions inside a greenhouse. Comput. Electron. Agric. 2020, 173, 105402. [Google Scholar] [CrossRef]
  28. Ferreira, P.M.; Faria, E.A.; Ruano, A.E. Neural network models in greenhouse air temperature prediction. Neurocomputing 2002, 43, 51–75. [Google Scholar] [CrossRef]
  29. Dong, W.; Li, X.; Li, X.; Zhou, Z.; Lan, L.; Qu, W.; Liang, Q. Design and Application of Thermal Insulation Systems in Multi-span Greenhouses. Agric. Eng. 2024, 14, 61–64. (In Chinese) [Google Scholar] [CrossRef]
  30. Mao, J.; Chen, B.; Cao, J.; Wang, L.; Wang, H.; Wang, Y. Effects of different drip irrigation modes on root distribution of wine grape ‘Cabernet Sauvignon’ in desert area of Northwest China. Ying Yong Sheng Tai Xue Bao = J. Appl. Ecol. 2013, 24, 3084–3090. (In Chinese) [Google Scholar]
  31. Gabriel, K.R. The biplot graphic display of matrices with application to principal component analysis. Biometrika 1971, 58, 453–467. [Google Scholar] [CrossRef]
  32. Lightbody, G.; Irwin, G.W. Multi-layer perceptron based modelling of nonlinear systems. Fuzzy Set Syst. 1996, 79, 93–112. [Google Scholar] [CrossRef]
  33. Petrakis, T.; Kavga, A.; Thomopoulos, V.; Argiriou, A.A. Neural network model for greenhouse microclimate predictions. Agriculture 2022, 12, 780. [Google Scholar] [CrossRef]
  34. Naskath, J.; Sivakamasundari, G.; Begum, A.A.S. A Study on Different Deep Learning Algorithms Used in Deep Neural Nets: MLP SOM and DBN. Wirel. Pers. Commun. 2023, 128, 2913–2936. [Google Scholar] [CrossRef]
  35. Jaihuni, M.; Basak, J.K.; Khan, F.; Okyere, F.G.; Sihalath, T.; Bhujel, A.; Park, J.; Lee, D.H.; Kim, H.T. A novel recurrent neural network approach in forecasting short term solar irradiance. ISA Trans. 2022, 121, 63–74. [Google Scholar] [CrossRef]
  36. Horiuchi, R.; Arakawa, K.; Kasuga, J.; Suzuki, T.; Jitsuyama, Y. Freezing resistance and behavior of winter buds and canes of wine grapes cultivated in northern Japan. Cryobiology 2021, 101, 44–51. [Google Scholar] [CrossRef]
  37. Li, H.; Duan, X.; Xu, H.; Yang, Y.; Zhu, N.; Yang, K.; Zhang, X.; Zhang, L. Comparison of the Effects of Overwintering Covering Cold-Protection Measures for Wine-making Grapes on Both Sides of Helan Mountain. Chin. Agric. Meteorol. 2022, 43, 575–586. (In Chinese) [Google Scholar]
  38. Semenov, V.; Kozlov, S.; Zhukov, A.; Ter-Zakaryan, K.; Zinovieva, E.; Fomina, E. Insulation systems for buildings and structures based on expanded polyethylene. In 6th International Scientific Conference on Integration, Partnership and Innovation in Construction Science and Education (IPICSE); Volkov, A., Pustovgar, A., Adamtsevich, A., Eds.; EDP Sciences: Les Ulis, France, 2018; Volume 251. [Google Scholar]
  39. Mobtaker, H.G.; Ajabshirchi, Y.; Ranjbar, S.F.; Matloobi, M. Simulation of thermal performance of solar greenhouse in north-west of Iran: An experimental validation. Renew. Energ. 2019, 135, 88–97. [Google Scholar] [CrossRef]
  40. Sun, Q.; Song, Y.; Yang, Z.; Liu, X.; Cui, S. Analysis of the light performance of Chinese solar greenhouse with internal insulation based on a solar radiation model. Front. Energy Res. 2023, 11, 1247153. [Google Scholar] [CrossRef]
  41. Barrera-Animas, A.Y.; Oyedele, L.O.; Bilal, M.; Akinosho, T.D.; Delgado, J.M.D.; Akanbi, L.A. Rainfall prediction: A comparative analysis of modern machine learning algorithms for time-series forecasting. Mach. Learn. Appl. 2022, 7, 100204. [Google Scholar] [CrossRef]
  42. Illston, B.G.; Fiebrich, C.A. Horizontal and vertical variability of observed soil temperatures. Geosci. Data J. 2017, 4, 40–46. [Google Scholar] [CrossRef]
  43. Tong, G.; Christopher, D.M.; Li, T.; Wang, T. Passive solar energy utilization: A review of cross-section building parameter selection for Chinese solar greenhouses. Renew. Sustain. Energy Rev. 2013, 26, 540–548. [Google Scholar] [CrossRef]
  44. Tong, G.; Christopher, D.M.; Li, B. Numerical modelling of temperature variations in a Chinese solar greenhouse. Comput. Electron. Agric. 2009, 68, 129–139. [Google Scholar] [CrossRef]
  45. Zhang, X.; Lv, J.; Xie, J.; Yu, J.; Zhang, J.; Tang, C.; Li, J.; He, Z.; Wang, C. Solar Radiation Allocation and Spatial Distribution in Chinese Solar Greenhouses: Model Development and Application. Energies 2020, 13, 1108. [Google Scholar] [CrossRef]
  46. Çakır, U.; Şahin, E. Using solar greenhouses in cold climates and evaluating optimum type according to sizing, position and location: A case study. Comput. Electron. Agric. 2015, 117, 245–257. [Google Scholar] [CrossRef]
  47. Ma, J.; Du, X.; Meng, S.; Ding, J.; Gu, X.; Zhang, Y.; Li, T.; Wang, R. Simulation of Thermal Performance in a Typical Chinese Solar Greenhouse. Agronomy 2022, 12, 2255. [Google Scholar] [CrossRef]
  48. Xu, F.; Li, S.; Ma, C.; Zhao, S.; Han, J.; Liu, Y.; Hu, B.; Wang, S. Thermal environment of chinese solar greenhouses: Analysis and simulation. Appl. Eng. Agric. 2013, 29, 991–997. [Google Scholar]
Figure 1. Schematic and photos of insulation support and treatments at different heights.
Agronomy 15 01060 g001
Figure 2. Schematic and photos of thermometer measurement points.
Agronomy 15 01060 g002
Figure 3. Structure of the MLP model.
Agronomy 15 01060 g003
Figure 4. Negative accumulated temperature and daily minimum temperature variation during overwintering process at branches: same material with different heights (A1–A6: tarpaulin at 5, 10, 15, 20, 25, 30 cm; B1–B6: insulation blanket at 5, 10, 15, 20, 25, 30 cm). (a) Tarpaulin-covered treatment, (b) Insulation blanket-covered treatment.
Agronomy 15 01060 g004
Figure 5. Overwintering trends of daily minimum temperature at branches with different materials under the same height (A1–A6: tarpaulin at 5, 10, 15, 20, 25, 30 cm; B1–B6: insulation blanket at 5, 10, 15, 20, 25, 30 cm). (a) 5 cm treatment, (b) 10 cm treatment, (c) 15 cm treatment, (d) 20 cm treatment, (e) 25 cm treatment, (f) 30 cm treatment.
Agronomy 15 01060 g005
Figure 6. Rate of temperature decline and daily minimum temperature trends at 20 cm soil depth: overwintering period under same material with variable heights (A1–A6: tarpaulin at 5, 10, 15, 20, 25, 30 cm; B1–B6: insulation blanket at 5, 10, 15, 20, 25, 30 cm). (a) Tarpaulin-covered treatment, (b) Insulation blanket-covered treatment.
Agronomy 15 01060 g006
Figure 7. Overwintering trends of daily minimum temperature at 20 cm soil depth: different materials under consistent height conditions (A1–A6: tarpaulin at 5, 10, 15, 20, 25, 30 cm; B1–B6: insulation blanket at 5, 10, 15, 20, 25, 30 cm). (a) 5 cm treatment, (b) 10 cm treatment, (c) 15 cm treatment, (d) 20 cm treatment, (e) 25 cm treatment, (f) 30 cm treatment.
Agronomy 15 01060 g007
Figure 8. Rate of temperature decline and daily minimum temperature trends at 40 cm soil depth: overwintering period under the same material with variable heights (A1–A6: tarpaulin at 5, 10, 15, 20, 25, 30 cm; B1–B6: insulation blanket at 5, 10, 15, 20, 25, 30 cm). (a) Tarpaulin-covered treatment, (b) Insulation blanket-covered treatment.
Agronomy 15 01060 g008
Figure 9. Overwintering trends of daily minimum temperature at 40 cm soil depth: different materials under consistent height conditions (A1–A6: tarpaulin at 5, 10, 15, 20, 25, 30 cm; B1–B6: insulation blanket at 5, 10, 15, 20, 25, 30 cm). (a) 5 cm treatment, (b) 10 cm treatment, (c) 15 cm treatment, (d) 20 cm treatment, (e) 25 cm treatment, (f) 30 cm treatment.
Agronomy 15 01060 g009
Figure 10. Validation of temperature prediction models: actual vs. predicted values. (af) MLP/SVR/polynomial regression comparisons grouped by material and depth. Tarpaulin: shoot level (a), 20 cm soil depth (c), 40 cm soil depth (e). Insulation blanket: shoot level (b), 20 cm soil depth (d), 40 cm soil depth (f).
Agronomy 15 01060 g010
Figure 11. Predicted insulation performance at different heights.
Agronomy 15 01060 g011
Table 1. Experimental treatments in this study.
Covering MaterialsHeight
5 cm10 cm15 cm20 cm25 cm30 cm
TarpaulinA1A2A3A4A5A6
Insulation BlanketB1B2B3B4B5B6
Table 2. Metadata characteristics of experimental monitoring data.
Variable DescriptionSensor TypeUnitSpatial LocationRaw Data RangeTotal
Observations
Tarpaulin-covered system (5 to 30 cm)Air temperaturePengyun 21A°CAboveground (branch level)32.7 to −12.9557,456
Soil temperature (20 cm depth)Pengyun 21A°CSubsoil9.1 to −257,456
Soil temperature (40 cm depth)Pengyun 21A°CSubsoil11.2 to −0.957,456
Insulation-blanket-covered system (5 to 30 cm)Air temperaturePengyun 21A°CAboveground (branch level)25.75 to −8.5557,456
Soil temperature (20 cm depth)Pengyun 21A°CSubsoil9.1 to −0.2557,456
Soil temperature (40 cm depth)Pengyun 21A°CSubsoil9.25 to −0.257,456
External environmentAmbient temperaturePengyun 21A°CAboveground (open field)25.7 to −32.557,456
Cumulative days since overwinteringPengyun 21Ad-0 to 133133
Insulation heightManual measurementcmAboveground5 to 306
Interaction term (Temp × Height)Derived--102 to −978788
Notes: All sensors maintained hourly sampling frequency throughout the overwintering period (November–March). Temperature ranges represent preprocessed measurements, excluding sensor malfunction events (<0.1% data loss). Vertical positioning accuracy: ±1 cm for aboveground sensors, ±2 cm for underground sensors.
Table 3. Comparative performance of temperature prediction models under different insulation materials.
Insulation SystemMeasurement PositionModel TypeR2MAE (°C)RMSE (°C)
TarpaulinBranch levelMLP0.920.620.87
SVR0.900.771.00
Polynomial regression0.910.660.92
Subsoil (20 cm depth)MLP0.990.200.31
SVR0.920.480.71
Polynomial regression0.970.310.40
Subsoil (40 cm depth)MLP0.990.170.26
SVR0.930.420.65
Polynomial regression0.980.250.34
Insulation blanketBranch levelMLP0.890.700.99
SVR0.850.901.17
Polynomial regression0.880.751.05
Subsoil (20 cm depth)MLP0.980.230.35
SVR0.910.490.71
Polynomial regression0.970.320.43
Subsoil (40 cm depth)MLP0.990.180.28
SVR0.930.410.66
Polynomial regression0.980.260.37
Notes: MLP: multilayer perceptron with optimized architecture (128-256-128-64 neurons). SVR: Support Vector Regression with RBF kernel (γ = 0.1, C = 10). Polynomial regression: 3rd-degree polynomial with L2 regularization (α = 0.01). Performance metrics calculated via 5-fold cross-validation.
Disclaimer/Publisher’s Note: The statements, opinions and data contained in all publications are solely those of the individual author(s) and contributor(s) and not of MDPI and/or the editor(s). MDPI and/or the editor(s) disclaim responsibility for any injury to people or property resulting from any ideas, methods, instructions or products referred to in the content.

