Article

Efficient Strategy for Water and Nutrient Management to Economically Enhance Mombasa Grass Productivity

1
Department of Environment and Natural Resources, College of Agriculture and Food, Qassim University, Burydah 51452, Saudi Arabia
2
Department of Plant Production, College of Agriculture and Food, Qassim University, Burydah 51452, Saudi Arabia
3
Department of Agricultural and Biosystems Engineering, College of Agriculture and Food, Qassim University, Burydah 51452, Saudi Arabia
*
Author to whom correspondence should be addressed.
Agronomy 2025, 15(6), 1274; https://doi.org/10.3390/agronomy15061274
Submission received: 14 April 2025 / Revised: 7 May 2025 / Accepted: 20 May 2025 / Published: 22 May 2025

Abstract

:
This study investigates the optimal water and nitrogen fertilization levels to enhance the productivity and quality of Mombasa grass (Panicum maximum cv. Mombasa) under drought-prone conditions. Four irrigation treatments were applied based on irrigation depth: high irrigation (I1 = 691.2 mm), control irrigation (I2 = 575.0 mm), moderate stress (I3 = 460.8 mm), and severe stress (I4 = 345.6 mm). Two nitrogen fertilization levels were tested: full fertilization (F1 = 300 kg N·ha−1) and half fertilization (F2 = 150 kg N·ha−1). Severe water stress (I4) significantly reduced growth parameters, with fresh weight (FW) decreasing by 21.9% and dry weight (DW) decreasing by 20.3% compared to the control. In contrast, higher irrigation levels (I1 and I2) notably improved FW and DW. Full nitrogen application (F1) enhanced FW, DW, and plant height, whereas the half dose (F2) resulted in lower growth performance. Water productivity (WP) was highest under moderate stress (I3) combined with F1, and under severe stress (I4) combined with F2, it was the worst. Protein percentage per irrigation water unit (PPW) increased with greater water deficits, while total protein production per irrigation water unit (TPW) peaked under higher irrigation levels. These findings indicate a trade-off between forage quality (PPW) and quantity (TPW), where PPW is more critical for marketing purposes and TPW is better suited for on-farm feeding. Economically, treatment I3F1 proved to be the most efficient option under moderate water availability. It combined reduced irrigation with a high fertilizer rate, resulting in a strong net return and the second-highest benefit-cost ratio among all treatments. This indicates its potential as a cost-effective and resource-efficient strategy in water-limited environments.

1. Introduction

Panicum Guinea grass (Panicum maximum CV Mombasa) is a perennial feed crop that remains in the soil for a period of no less than 10 years. It is well cultivated in most types of soil and tolerates high temperatures and high salinity of up to 10,000 parts per million [1]. Panicum grass is characterized by its high protein content, reaching 8 to 12% when fresh, and doubles to 24% when dried. This grass is characterized by its abundance of production. Panicum is considered a leafy crop that has no stems. Production per hectare reaches 33 tons per cutting [2]. Panicum Guinea grass is characterized by its high palatability and does not cause diseases. It does not cause diarrhea or bloating when fed on it, and it is green. It also increases milk production. Higher productivity and more food availability for the animals are results of pasture management practices that include proper management of soil fertility and understanding of Panicum maximum’s nutritional requirements [3,4].
Although it does not require a lot of water for irrigation, Panicum can tolerate droughts and will grow more swiftly in the presence of water. It uses half as much water and yields twice as much as alfalfa. It can be cultivated using any type of irrigation technique, such as spray, drip, submersion, or surface irrigation [5]. Nonetheless, due to photosynthetic stomatal and metabolic limitations, water stress has been shown to decrease biomass production in P. maxima by as much as 44% [6]. Water stress often decreases the amount of nitrogen that fodder roots take in from the soil [7,8]. As a result, plant tissues have less N and P, which raises the C: N and C: P ratios and decreases biomass production. A complicated set of physiological reactions that plants use to maintain growth in the absence of sufficient soil moisture is known as drought tolerance. Plant resistance to drought has been effectively indicated by mass-based water usage efficiency (mWUE), which is a ratio of water input, to dry matter output [9,10]. However, because to changes in soil type, topography, stand densities, and soil water content, measurements of whole stand mWUE in field research are difficult. By creating a controlled microenvironment, instantaneous measurements of water use efficiency (iWUE) can be obtained in real-time through gas exchange analysis, directly assessing photosynthesis and transpiration rates at the leaf level [9]. Field-based measurements of iWUE under ambient conditions can also serve as a valuable tool for identifying forage species with enhanced drought tolerance. While previous studies have utilized iWUE to infer drought resilience in forage crops, none have investigated the specific species examined in this experiment. For instance, Anyia and Herzog [11] conducted a greenhouse study on cowpea (Vigna unguiculata) under drought conditions and revealed varietal differences in WUE, highlighting that iWUE and mWUE are not necessarily correlated. Similarly, Ghannoum et al. [12] assessed drought tolerance in Australian C4 grasses under greenhouse conditions using mWUE and found that drought stress led to an increase in mWUE. Jongen et al. [10] and Hussain et al. [13] explored the drought responses of mixed grasslands, employing both iWUE and mWUE in the former, and only mWUE in the latter. Both studies reported that WUE improved with increased evapotranspiration rates. For this study, mWUE was selected as the primary metric for evaluation due to its relevance to the focus on biomass production and its alignment with the experimental design. Therefore, the present study aims to evaluate both the quantitative and qualitative traits of Panicum maximum cv. Mombasa under deficit irrigation and varying nitrogen levels, with the objective of identifying an optimal water management strategy through the assessment of water productivity (WP).

2. Materials and Methods

This study was conducted at the Agricultural Research Station of Qassim University (Al-Melida, Al-Qassim, Saudi Arabia; located at 26°18′28″ N, 43°46′ E) from August 2022 to July 2024. The experimental site is characterized by an arid climate, with hot summers and mild winters. The mean annual temperature is approximately 27 °C, with average summer highs reaching 42 °C. Annual rainfall is low. Soil samples were extracted from a 0–25 cm depth and analyzed for their physical attributes, such as texture, as well as their chemical properties, including pH, electrical conductivity (EC), organic matter content, total nitrogen, available phosphorus, potassium, selenium, and zinc. All analyses were performed following the methodology outlined by Carter and Gregorich [14], with selected soil properties presented in Table 1.
The seeds of Panicum maximum coefficient of variation (CV) Mombasa were sown in the beginning of August directly in the experimental units then the plant remained in the field for two consecutive seasons (2022/2023 and 2023/2024). The CropWat 8.0 software, developed by the Food and Agriculture Organization (FAO), was employed to estimate the crop water requirements in the study area [15]. Four irrigation treatments, based on these estimated requirements (according to FAO Penman-Monteith method [15]), were implemented as main plots: I1 (120% of the estimated requirement, equivalent to 691.2 mm), I2 (100%, or 575.0 mm), I3 (80%, or 460.8 mm), and I4 (60%, or 345.6 mm). Two nitrogen fertilization levels were assigned to th e subplots: F1, corresponding to the full recommended nitrogen rate (300 kg·ha−1), and F2, representing 50% of that rate. Diammonium phosphate and potassium sulphate at rates of 92 kg P2O2·ha−1 and 57 kg K2O·ha−1, respectively, were applied to all treatments. The experiment followed a split-plot design with irrigation levels as the main plots and nitrogen levels as the subplots. Each main plot (irrigation treatment) consisted of rows spaced 25 cm apart with the subplot (fertilization level) randomly distributed in the main plot resulting in four replications of each treatment combination. The total number of experimental units was 32 experimental units with an area of 8 × 8 m each. The irrigation was done using two sprinklers 1/2″ Plastic Impact Sprinklers with a discharge10.2 lpm when operating at 1 bar operating pressure and a wetting radius 8.8 m. the two sprinklers were placed at opposite corners of the experimental unit with a circling angle of 90° to give double coverage for the experimental unit. A 3 × 3 m blank area was left between the experimental unites.

2.1. Measurements and Calculation

During the two growing seasons, plants were harvested eight times per season, and data were collected on key agronomic traits, including fresh and dry biomass, plant height, number of shoots and leaves, and the protein content in the foliage. The total fresh yield from each plot was measured and then extrapolated to a per-hectare basis to facilitate treatment comparisons. Water productivity (WP) was determined by dividing the total yield (Y, in kg) by the total amount of irrigation water applied (IRR, in m3·ha−1), following the Formula (1):
W P = Y I R R
with the resulting units expressed in kg·m−3.
Additionally, five plants were randomly selected from each treatment to assess plant height and the tillers number of plant.
Leaf protein content was analyzed using the Kjeldahl method with a Buchi B-324 distillation unit. In this procedure, nitrogen in proteins is converted into ammonium sulfate through digestion with concentrated sulfuric acid. During the distillation phase, the ammonium ion is released as ammonia gas, which is captured in a boric acid solution and titrated with a standard acid until a stable violet endpoint is achieved.
To evaluate the efficiency of protein production in relation to irrigation water use, two indicators were calculated. The first, protein percentage per unit of irrigation water (PPW), was computed using Equation (2).
P P W = P P D I R R
where PPW is expressed in %·m−3 and PPD refers to the protein percentage in dry matter. The second indicator, total protein yield per unit of water (TPW), was calculated using Equation (3).
T P W = P P D   X   D W I R R
where TPW is in kg·m−3 and DW represents the dry biomass per hectare.
These calculations allowed for a comprehensive assessment of both biomass productivity and protein use efficiency under varying irrigation regimes.

2.2. Economic Evaluation

To evaluate the economic feasibility of the various irrigation treatments, the economic return was calculated based on dry biomass yield and the irrigation water applied. The following indicators were used:
The gross return (GR), which represents the total income from forage production, was estimated by multiplying the dry yield (y), ton·ha−1, by the market price (mP), $ per ton. This indicator is calculated from Equation (4).
G R = y × m P
The total costs (TC) include the irrigation cost (CI) and fertilization cost (CF). The TC was calculated from Equation (5).
T C = I R R × c 1 + ( F Q × c 2 )
where TC represents the total costs, $·ha−1; IRR is the total amount of irrigation applied, m3·ha−1; c1 is the cost per cubic meter of water, $·m−3; FQ is the fertilization quantity per hectare, kg·ha−1; and c2 is the cost per kilogram of fertilizer, $·kg−1.
The net return (NR), representing the profit after accounting for the irrigation expense, was obtained by subtracting the total cost (TC) from the gross return (GR) as given in Equation (6).
N R = G R T C
The benefit-cost ratio (BCR) was computed by dividing the gross return by the total cost. A BCR greater than 1 indicates a profitable investment. The ratio is calculated as shown in Equation (7).
B C R = G R T C
These parameters were chosen to reflect the typical operational costs of groundwater extraction in central Saudi Arabia [16,17].

2.3. Statistical Analysis

A factorial experiment within a split plot design was used to assess the main and interaction effects of irrigation levels and fertilization treatments on various parameters. The data collected were subjected to statistical analysis using analysis of variance (ANOVA) to determine the differences in fresh and dry biomass, plant height, number of shoots and leaves, and the protein content. When significant differences were detected, mean comparisons were carried out using Duncan’s multiple range test at a significant level of p < 0.05.

3. Results

3.1. Irrigation and Fertilization Effects on Mombasa Grass Traits

Water stress (I4) led to a notable reduction in both fresh and dry biomass of Mombasa grass, as presented in Table 2. In contrast, plants grown under higher irrigation treatments (I1 and I2) exhibited significantly greater biomass accumulation, both in fresh and dry matter, in comparison to reduced water availability treatments. Furthermore, the dry weight recorded under the highest irrigation level (I1) was significantly different from that observed in the control treatment (I2). However, under moderate and severe water stress (I3 and I4), the differences in dry weight compared to the control were not statistically significant.
The same trends were found in season II. For plant height the water shortage decreased the plant height as the shortage increased. Plants in irrigation treatments control (I2) and I3 had significantly shorter plants than high irrigation (I1) but not significantly different than each other. Plants under I4 irrigation treatments had the shortest plants and were significantly different from plants in all the other irrigation treatments. Both seasons I and II had the same trends. The number of tillers did not differ significantly between the high irrigation (I1) and the control (I2) but it had significant differences with plant in treatment I3.
Both I2 and I3 had no significant differences between them in the number of tillers and all I1, I2 and I3 had significant differences between them and plants in treatment I4 in the number of tillers. Application of the recommended nitrogen rate (F1) led to a significant improvement in both fresh and dry biomass production of Panicum maximum cv. Mombasa (Table 2). In contrast, plants subjected to the reduced nitrogen level (F2) demonstrated a substantial decline in biomass yield, underscoring the importance of sufficient nitrogen availability for optimal growth. Nitrogen plays a central role in cellular function, being integral to protein synthesis and chlorophyll formation, both of which are essential for efficient photosynthesis and biomass accumulation.
Under conditions of water stress—particularly the lowest irrigation level (I4)—plant growth was further suppressed, consistent with established evidence that limited water availability restricts physiological processes such as stomatal conductance, nutrient uptake, and carbon assimilation. A significant interaction between irrigation and nitrogen (I × F) was observed for fresh weight, dry weight, and plant height (Table 3), indicating that the positive effect of nitrogen is more pronounced when adequate water is available. The combination of the highest irrigation level (I1) with high nitrogen input (F1) consistently produced superior results across all measured parameters, including the highest fresh weight (92.2 ton·ha−1), dry weight (21.3 ton·ha−1), plant height (153.1 cm), and number of tillers (25.5). As irrigation levels declined, the effectiveness of nitrogen diminished notably; for instance, while F1 outperformed F2 at each irrigation level, the gap narrowed under water-limited conditions (e.g., I3F1: 62.3 ton·ha−1 FW vs. I3F2: 49.3 ton·ha−1). Conversely, under high irrigation (I1), the absence of sufficient nitrogen (F2) still led to significant declines in all traits. The lowest performing treatment, I4F2, resulted in severely stressed plants with only 40.1 ton·ha−1 FW, 13.6 ton·ha−1 DW, 99.4 cm height, and 14.5 tillers, highlighting the compounded stress effects of limited water and nutrients. These results emphasize the importance of managing both irrigation and fertilization jointly rather than in isolation.

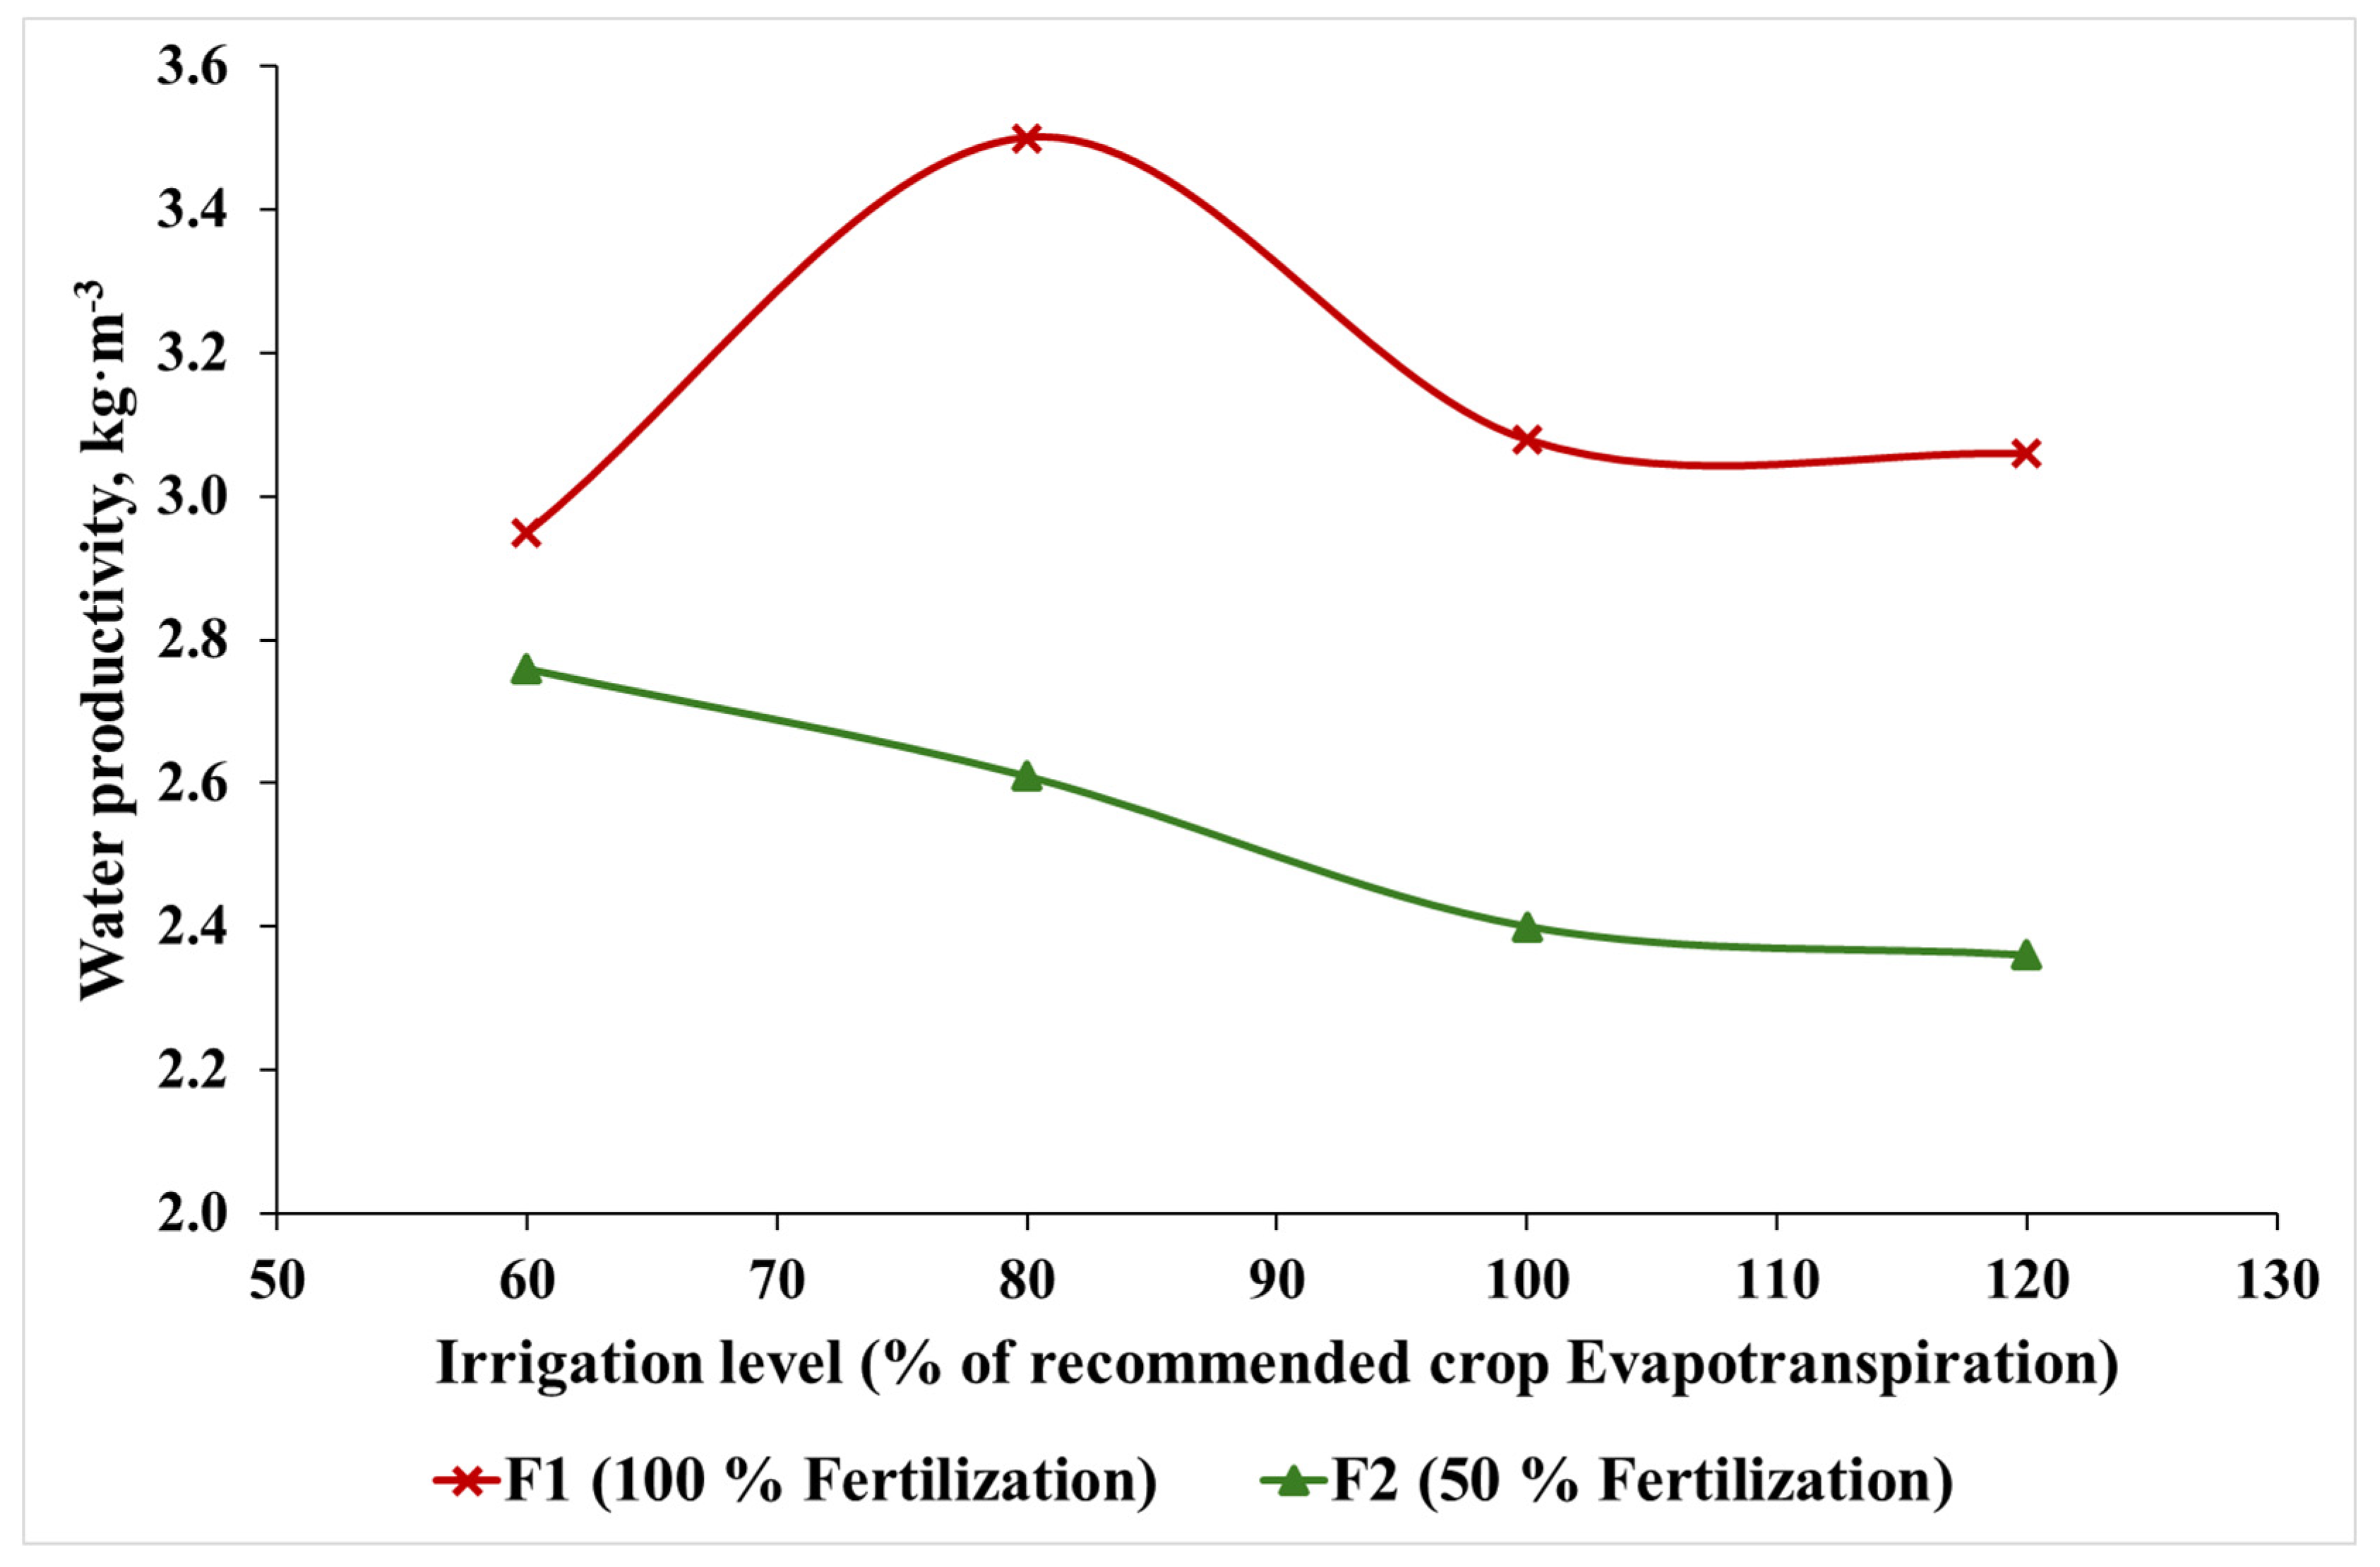
3.2. Effect of Irrigation and Fertilization Levels on Water Productivity

The water productivity (WP) values showed different trends at different levels of fertilization. At the recommended nitrogen fertilization level F1 the WP value increased as the level of the water deficit increased until the irrigation treatment I3 (80%) then the values of the WP decreased. For 80% of the recommended nitrogen fertilization level F2 the values of the WP increased as the water deficit increased (Figure 1). The result shows that at F1 the increasing of the irrigation level from 100% to 120% did not change the DW content of the plants proportionally and that the added amount of irrigation went most of it to improving the plant water status and thus it increased the fresh weight significantly as seen from Table 2 and therefor the WP of I1 and I2 at F1 fertilization was almost the same (Figure 1).
For irrigation levels I2 and I3, both fresh and dry weights remained statistically similar. However, the reduced water supply in I3 resulted in an increased WP. The improvement in WP at I3 highlights the potential for water-saving irrigation strategies without significant trade-offs in biomass yield. under suboptimal nitrogen fertilization (F2), plant growth was hindered, especially at higher irrigation levels. On the other hand, lower irrigation levels (I3) at F2 showed higher WP because water inputs were more efficiently utilized for the limited growth observed.

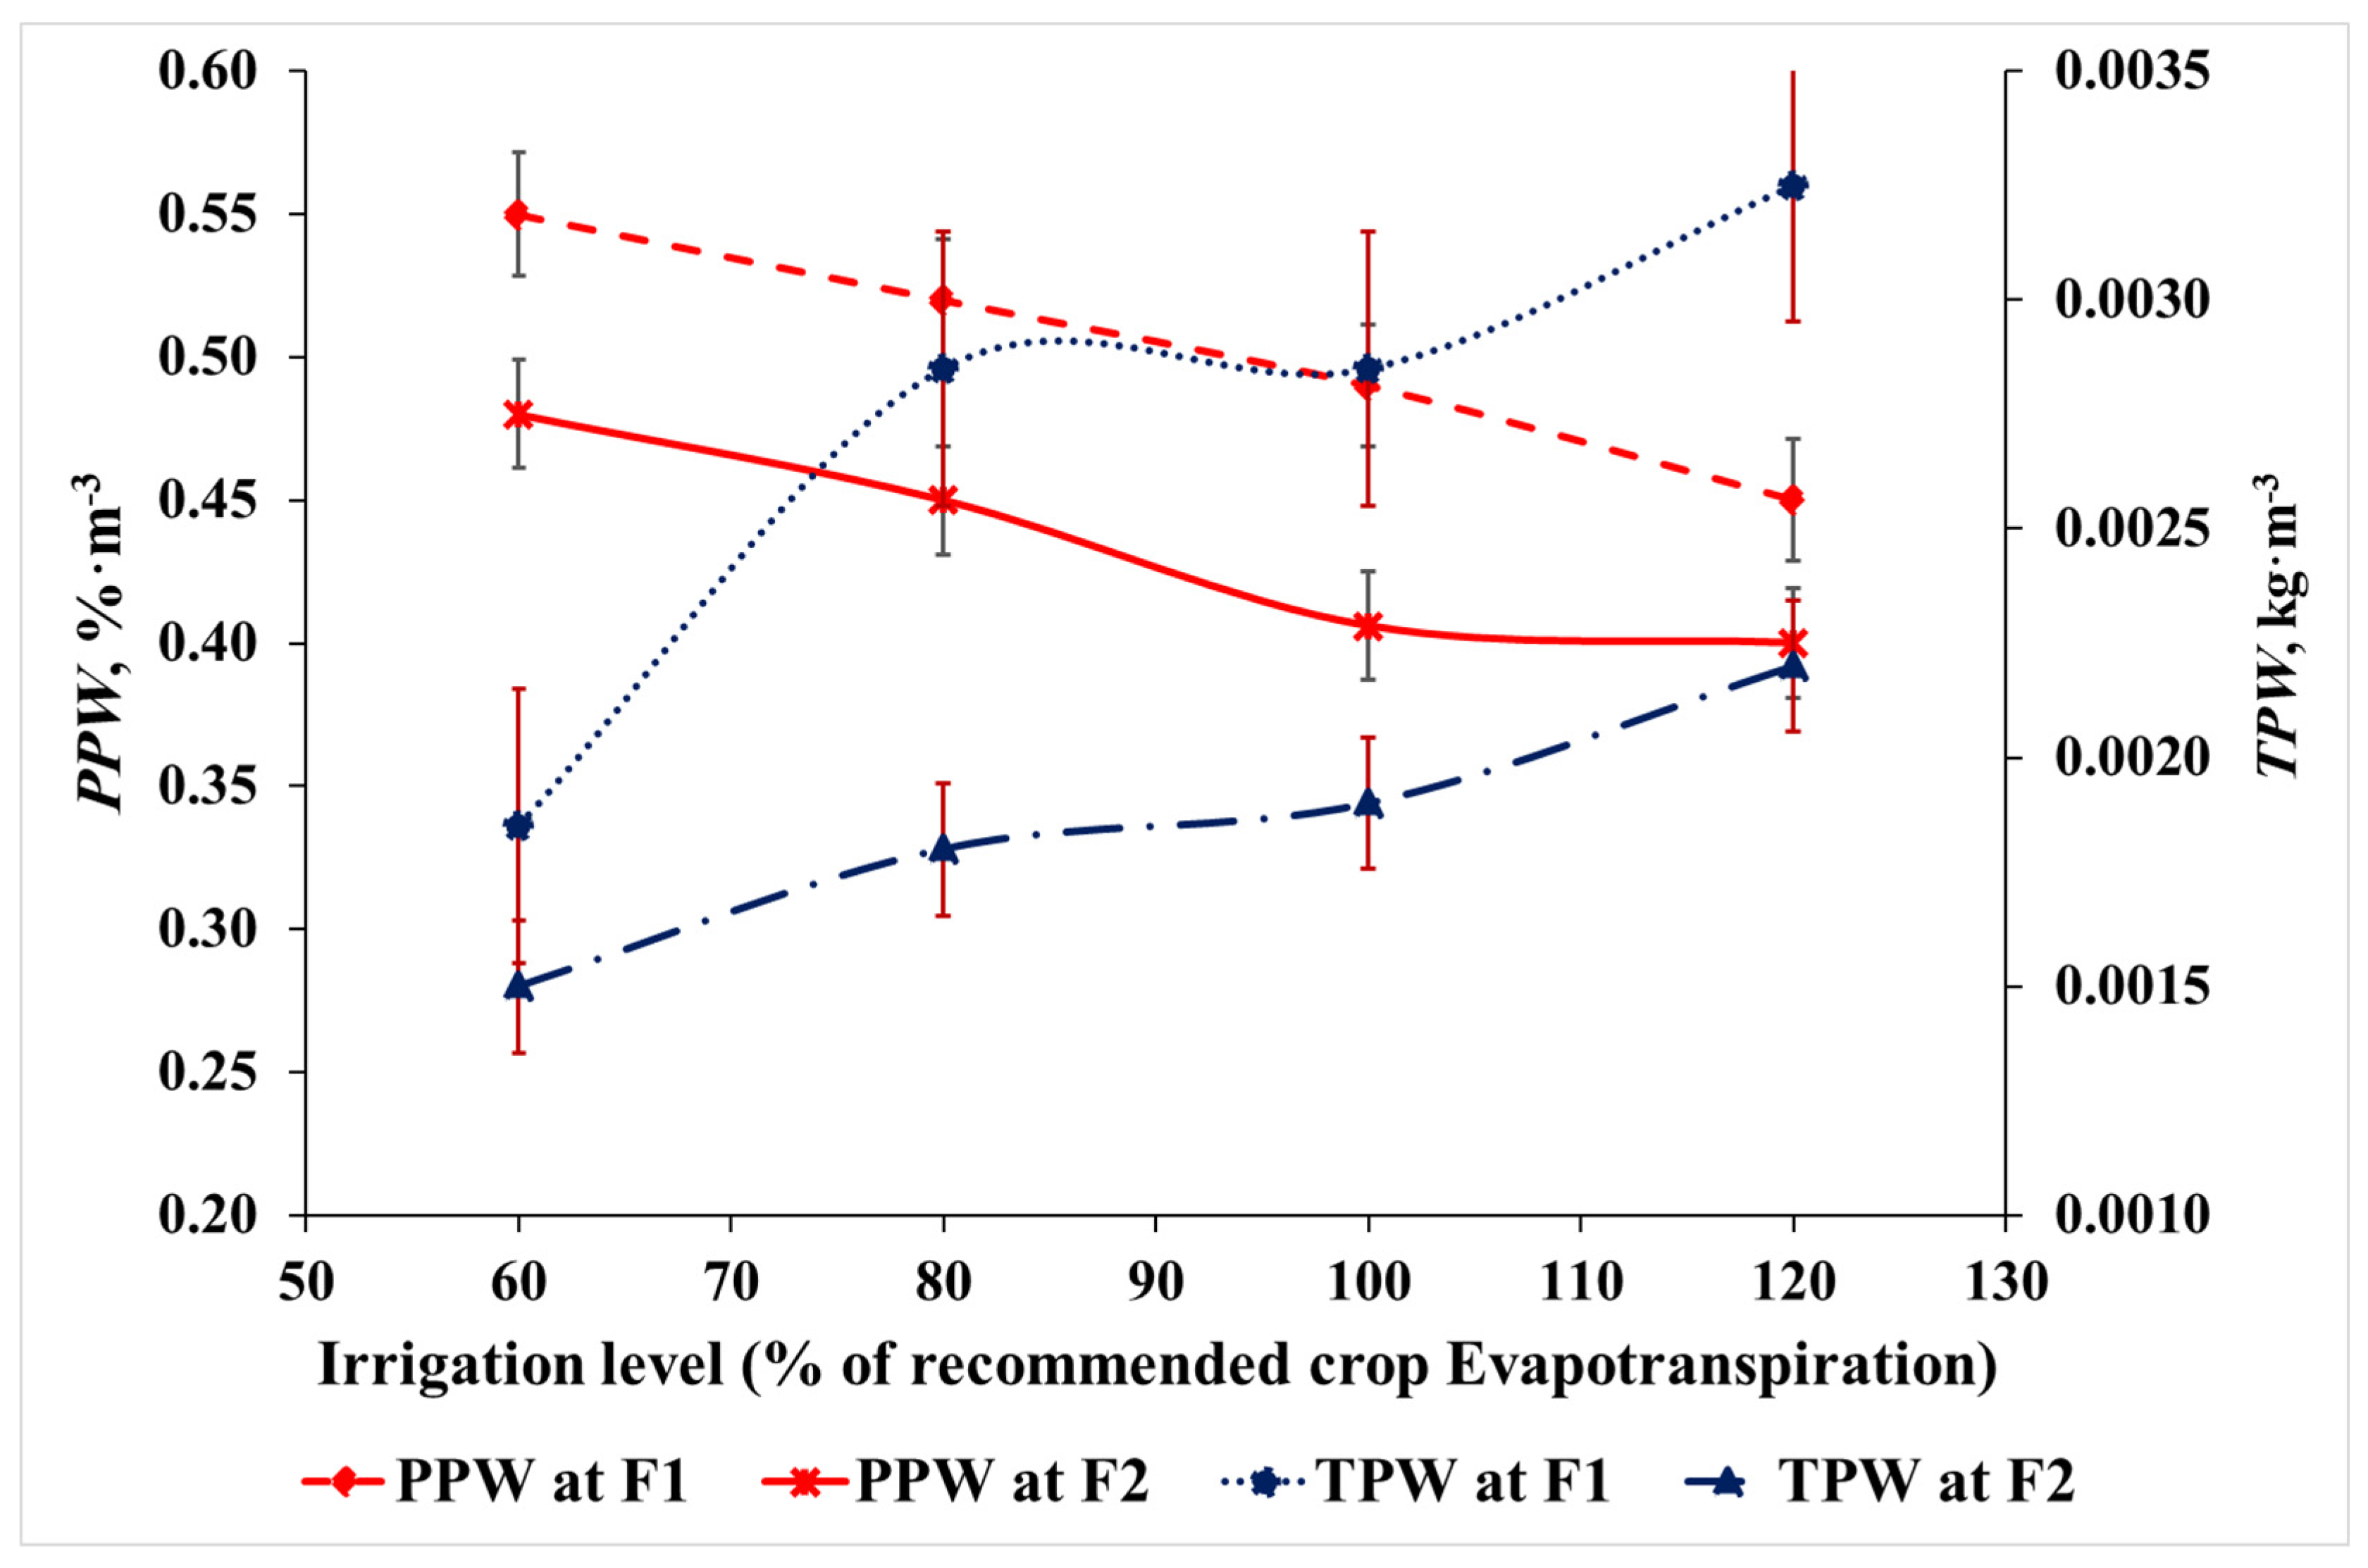
3.3. Effect of Irrigation and Fertilization Levels on Protein

Although the quality of the forage can be evaluated according to its’ protein content but sometimes it does not correspond to the maximum amount of protein produced by the irrigation water unit. The relation between the irrigation level and the protein percentage/irrigation water unit (PPW) for all treatments is shown in Figure 2. The results show that the protein percentage/irrigation water unit (PPW) increases as the water deficit increases. This may be due to the increase in the protein percentage in the dry matter as the irrigation water increase is not linear. The same trend was observed for the F2 level of nitrogen fertilization.
On the other hand, the total amount of protein produced/water unit (TPW) showed different trends. The (TPW) values increased with the increase of the irrigation water as shown in Figure 2. The regression analysis showed that the relation between the TPW and the irrigation level is a second-degree polynomial. The differentiation of the equations indicated that the maximum TPW value was at I1 for both levels of nitrogen fertilization. TPW should be considered while determining the amount of irrigation water used to produce forage. The decision maker in the farm should decide to use the PPW or the TPW based on the purpose of the produced forage. It is suggested that PPW should be used when forage is produced for marketing and TPW should be used if the forage is produced for feeding in the farm.

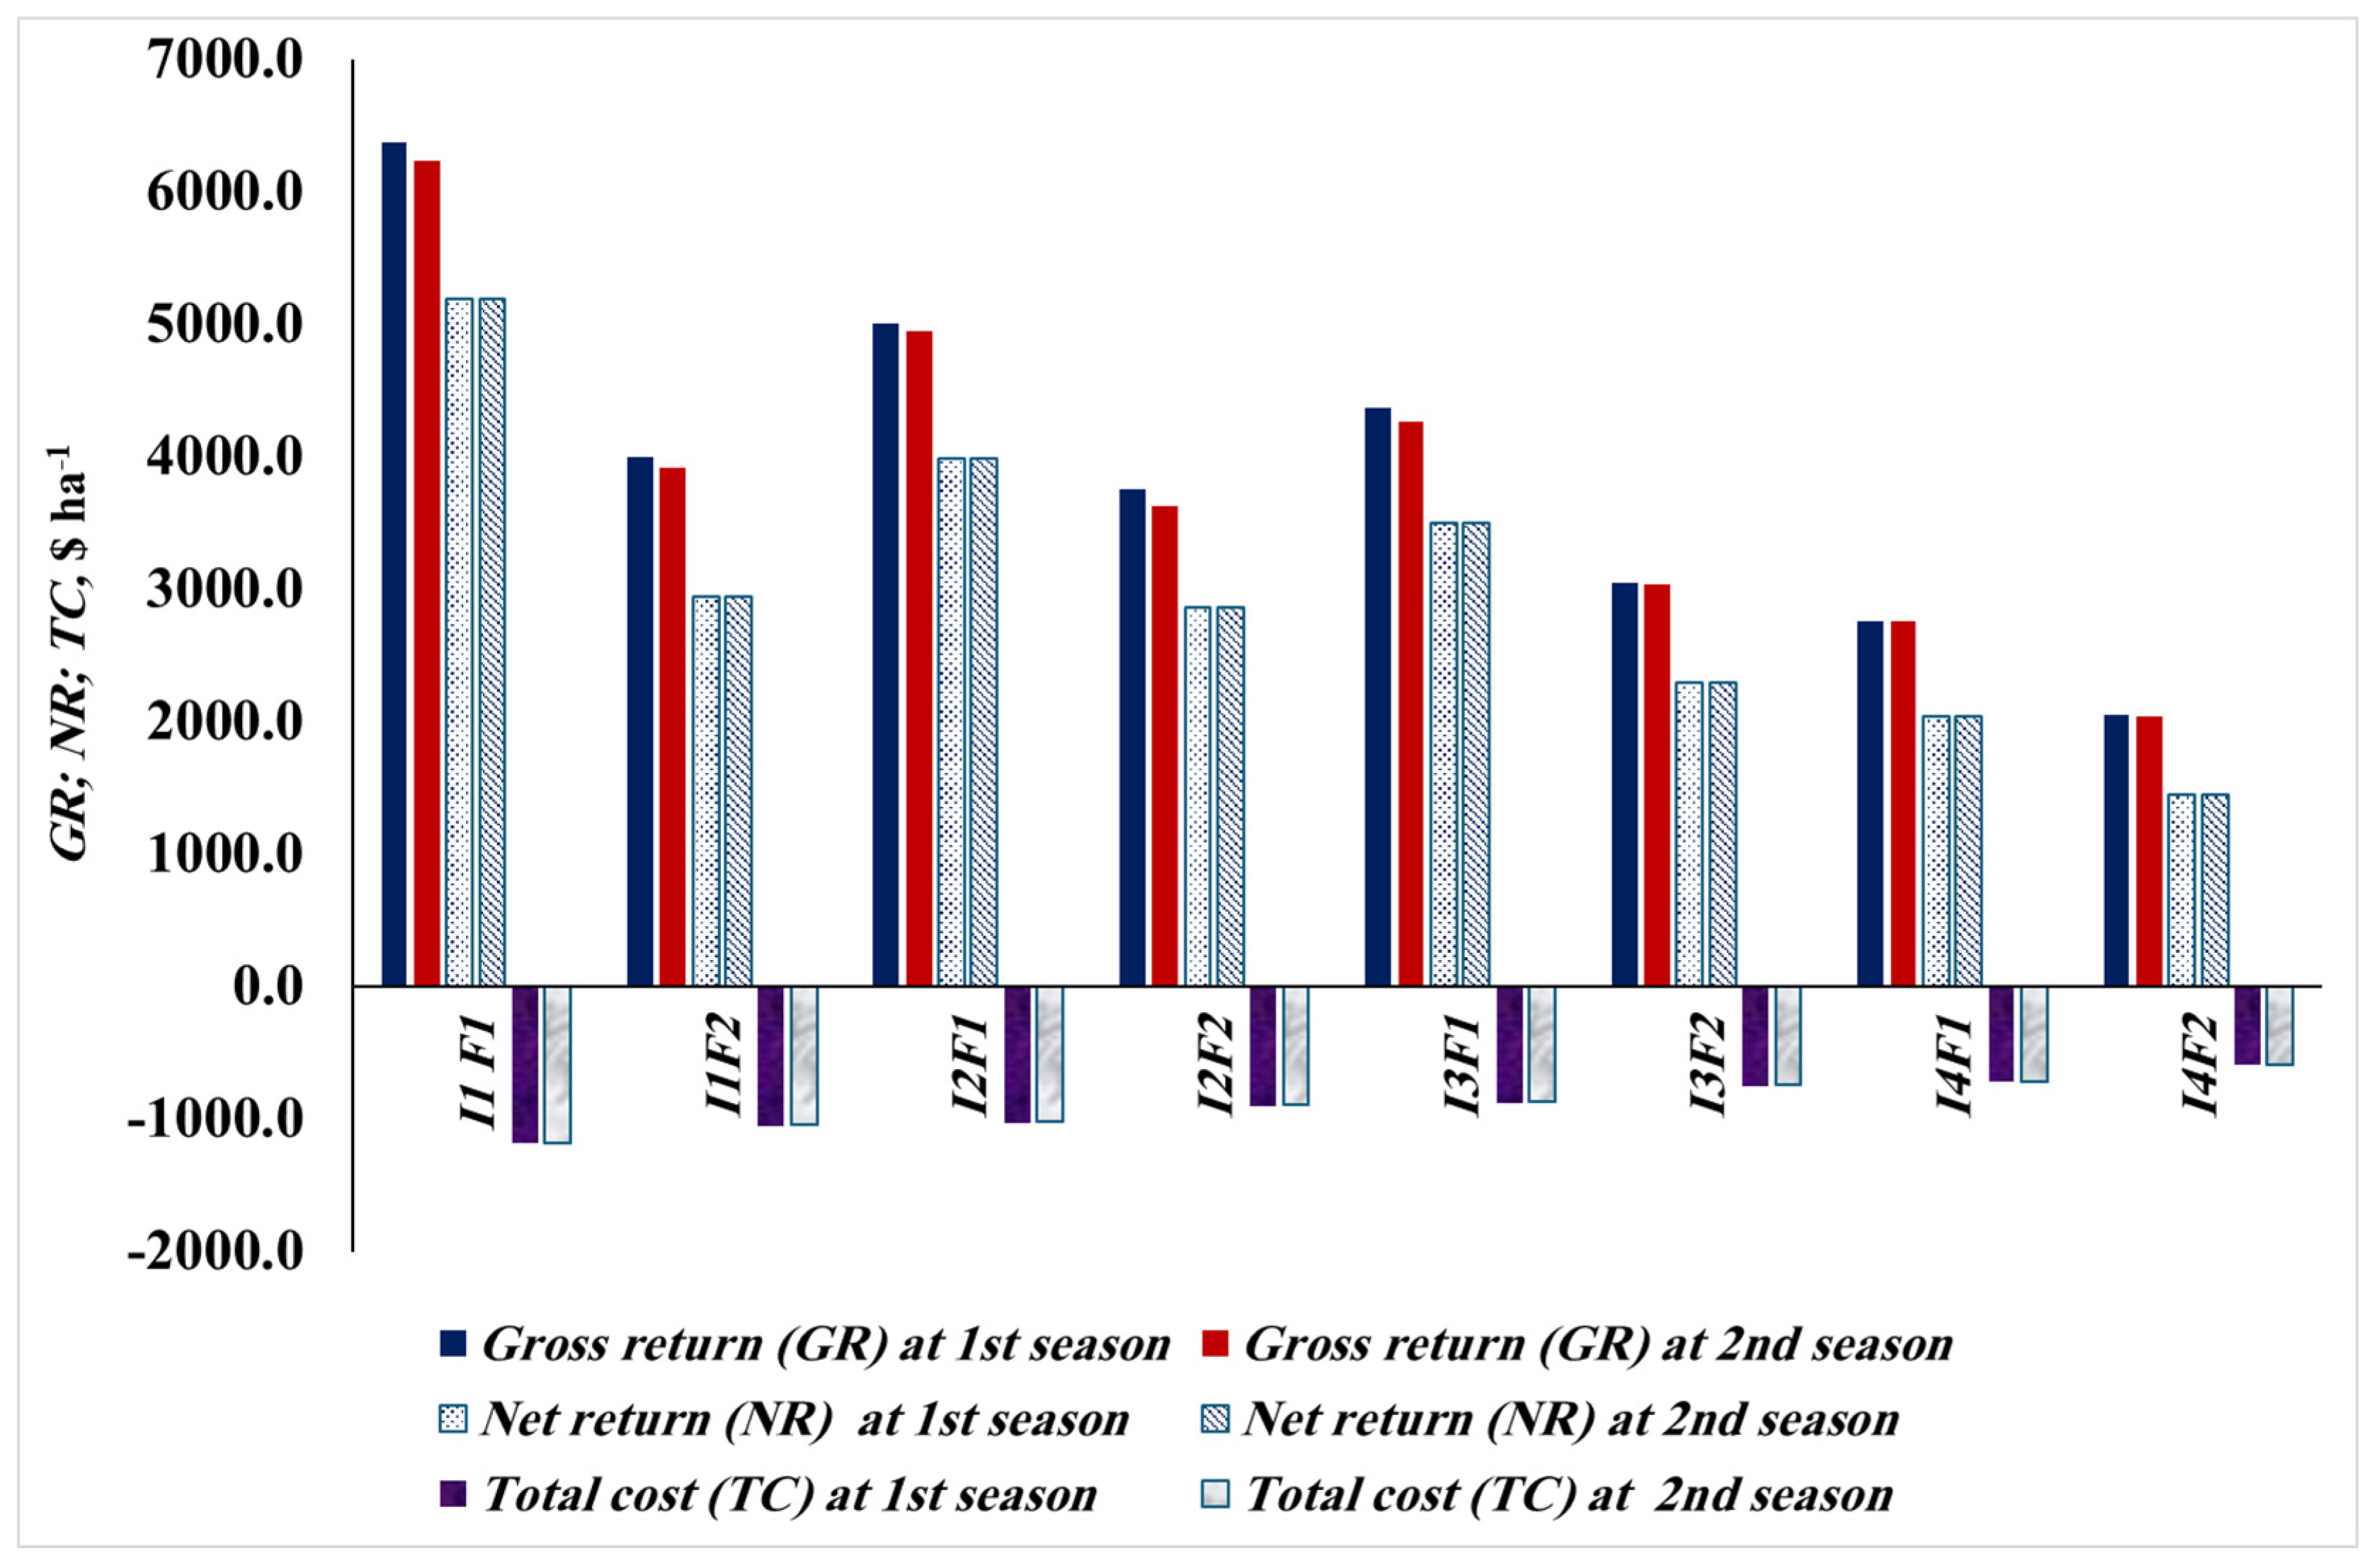
3.4. Economic Evaluation

The economic performance of the various irrigation levels is shown in Figure 3. Its clear that there are notable variations in profitability and efficiency. In Treatment I1F1, which combined the highest irrigation level (I1) with the highest fertilizer rate (F1), the gross return reached $6377.1 in the first season and slightly declined to $6238.8 in the second season. Despite the relatively high total production cost, recorded at $1185.1 and $1175.0 in the first and second seasons respectively, this treatment achieved the highest net return among all treatments, with a value of $5191.9 in both seasons. The benefit-cost ratio (PCR) was also the highest, maintaining a value of 4.42 across both seasons. This indicates that for every dollar invested, a return of $4.42 was obtained, confirming that I1F1 was the most profitable and economically efficient treatment. In Treatment I1F2, which used the same high irrigation level (I1) but with the lower fertilizer rate (F2), the gross return declined to $3999.4 and $3921.4 in the first and second seasons, respectively. Net return dropped accordingly to $2943.2 in both seasons. Although the total costs were slightly lower than I1F1 ($1056.1 and $1046.0), the PCR fell to 2.81. This suggests that reducing the fertilizer input under high irrigation conditions led to reduced profitability. Treatment I2F1, involving control irrigation (I2) and the high fertilizer rate (F1), produced gross returns of $5012.7 and $4953.4 in the first and second seasons, respectively. Net return was $3983.5 in both seasons. The total costs were moderate at $1029.2 and $1020.9, with a PCR of 3.90. These values reflect a relatively high economic efficiency, offering a good balance between resource use and return. In Treatment I2F2, which applied the same irrigation level (I2) but with the lower fertilizer rate (F2), the gross returns declined to $3759.5 and $3633.5, and the net return dropped to $2859.3 in both seasons. The total costs were $900.2 and $891.9, while the PCR was 3.21. Treatment I3F1, which used reduced irrigation (I3) and the higher fertilizer rate (F1), achieved gross returns of $4373.2 and $4265.8. Net return was stable at $3498.1 across both seasons. Total costs were slightly lower at $875.1 and $870.3. This treatment recorded a high PCR of 4.02, which was the second-best among all treatments. This suggests that with reduced water supply, increasing fertilizer application can compensate partially for yield loss and maintain strong economic performance. In Treatment I3F2, which involved low irrigation (I3) and low fertilization (F2), the gross returns dropped to $3044.9 and $3034.2. Net return was $2298.7, while total costs were $746.1 and $741.3. The PCR was 3.10, indicating reasonable but clearly reduced profitability compared to I3F1. This supports the conclusion that under water-limited conditions, higher fertilizer application enhances economic returns more effectively than lower rates. Treatment I4F1, combining the lowest irrigation level (I4) with the high fertilizer rate (F1), produced gross returns of $2763.7 in both seasons, and net returns of $2042.5. The total costs were relatively low at $721.2 and $716.9. With a PCR of 2.85, this treatment offered modest profitability. Although returns were lower than higher irrigation levels, the reduced input costs under severe water constraints make this treatment a feasible choice in arid environments where maximizing water use efficiency is critical.
Among all treatments, I1F1 recorded the highest gross return (GR), highest net return (NP), and the highest benefit-cost ratio (PCR), indicating its superiority in maximizing economic gains. On the other hand, the lowest total production cost (TC) was observed in I4F2, which, despite its low profitability, reflects the lowest input requirement among treatments. These findings confirm that I1F1 is the most economically viable strategy under sufficient water and fertilizer availability, whereas I4F2 may be suitable in cases of severe resource limitations. Moreover, under moderate water availability, treatment I3F1 demonstrated a favorable balance between input efficiency and economic returns. With a gross return of $4373.2 and $4265.8 in the first and second seasons respectively, and a stable net return of $3498.1 in both seasons, it achieved the second-highest benefit-cost ratio (PCR) of 4.02. Despite utilizing a reduced irrigation level (I3), the application of a higher fertilizer rate (F1) effectively compensated for potential yield losses. This combination yielded a strong economic performance with relatively lower production costs ($875.1 and $870.3), indicating that I3F1 represents an economically efficient alternative in conditions of limited water availability.

4. Discussion

This study was conducted to assess the quantitative and qualitative characteristics of Panicum maximum cv. Mombasa under conditions of deficit irrigation and varying levels of nitrogen fertilization. Additionally, the research examined the variation in water productivity (WP) across different irrigation regimes and nitrogen treatments, aiming to determine the most effective water management practices to enhance both productivity and forage quality. The findings demonstrated that water stress substantially decreased both the fresh and dry biomass yields of the grass. Under moderate water deficit conditions (I3), the dry matter yield did not differ significantly from the fully irrigated control, indicating that beyond a certain water supply threshold, further irrigation does not proportionally enhance dry matter production.
Regarding nitrogen application, plants receiving the recommended nitrogen level (F1) exhibited significantly higher fresh and dry biomass compared to those subjected to the reduced nitrogen level (F2), highlighting the essential role of sufficient nutrient provision in maximizing grass productivity. These findings are consistent with previous studies. Waseem et al. [18] emphasized that drought stress directly reduces crop productivity, while Alsiteel and Alshareef [19] reported that water deficits impair a wide range of morphological and physiological traits. Similarly, Zuffo et al. [20] highlighted that P. maximum cv. Mombasa is capable of accumulating higher dry matter than other forage grasses, particularly under optimal growth conditions. This highlights the cultivar’s potential for high biomass production when both water and nitrogen resources are adequately supplied. The reduced water supply in I3 resulted in an increased WP due to the efficient use of the limited water provided. This observation aligns with findings by Silva et al. [21], who reported that moderate water deficits can enhance WP in forage grasses by optimizing water utilization for biomass production. The data revealed a clear interaction between irrigation and nitrogen treatments. The combination of full irrigation (I1) and recommended nitrogen supply (F1) produced the greatest biomass and tallest plants, whereas the poorest outcomes were associated with the combination of severe water deficit (I4) and reduced nitrogen (F2). These results are consistent with the findings of Habermann et al. [6], who noted that water stress directly and negatively affects forage crop productivity. Furthermore, the observation that full irrigation (I1) outperformed the standard control irrigation (I2) suggests that the crop coefficient traditionally used for Mombasa grass may be underestimated for hot and arid climates. This assertion is supported by Alsunaydi et al. [7] and Fonseca and Martuscello [22]. In terms of water productivity, the study found that WP improved under moderate water deficit conditions (I3) when nitrogen was adequately supplied (F1), achieving the highest efficiency at 80% of full irrigation. This indicates that under optimal nitrogen supply, deficit irrigation can lead to more efficient biomass production per unit of water applied.
However, under suboptimal nitrogen fertilization (F2), plant growth was hindered, especially at higher irrigation levels. The lack of sufficient nitrogen likely constrained critical physiological processes, such as photosynthesis and protein synthesis, which are essential for plant growth and biomass production [23]. As a result, the plants could not fully utilize the additional water provided under I1 and I2, leading to lower biomass and reduced WP. When nitrogen supply was suboptimal (F2), the benefits of increased WP under reduced water supply diminished, likely due to limitations in physiological processes such as photosynthesis and protein synthesis [24]. This finding is supported by Carvalho et al. [25], who noted that nitrogen deficiency exacerbates water stress effects and reduces the efficiency of water and nutrient use in forage crops. Analysis of forage quality parameters, specifically the protein-related measurements, indicated that the protein percentage per irrigation water unit (PPW) increased as water deficit levels intensified. However, the total protein yield per unit of irrigation water (TPW) exhibited a polynomial relationship, with maximum TPW observed under full irrigation (I1) at both nitrogen application levels. These results align with those of da Silva Pause et al. [26], who reported reductions in crude protein content during drought stress conditions. The findings imply that the highest forage quality in terms of protein concentration does not necessarily coincide with the highest total protein yield per unit of water. While drought stress may concentrate protein within plant tissues, it does not maximize total protein production. These patterns are corroborated by da Silva Moscoso et al. [27], who found reductions in crude protein content during periods of water shortage, as well as by Gunes et al. [28] and Garg [29], who observed that plants maintaining better nutrient uptake under drought are generally more tolerant to water stress. Collectively, the findings suggest that although full irrigation supports maximum biomass and protein yields, implementing moderate water deficits, particularly when combined with optimal nitrogen levels, can significantly enhance water productivity without compromising production quality. The choice between maximizing PPW (perennial plant water use) or TPW (total plant water use) should ultimately align with the specific objectives of the forage production system, whether focusing on market-driven forage quality or on-farm feed production needs.
Similarly, among all treatments, I1F1 recorded the highest gross return (GR), highest net return (NP), and highest benefit-cost ratio (PCR), indicating its superiority in maximizing economic gains under sufficient water and fertilizer availability. However, treatment I4F2, despite its low profitability, exhibited the lowest total production cost (TC) and thus reflected the least input requirement, making it an optimal choice when resources are severely limited. Furthermore, treatment I3F1 showed a favorable balance between input efficiency and economic returns under moderate water availability. With a gross return of $4373.2 and $4265.8 in the first and second seasons, respectively, and a stable net return of $3498.1 in both seasons, it achieved the second highest benefit-cost ratio (PCR) of 4.02. This treatment, despite utilizing reduced irrigation (I3), effectively compensated for potential yield losses with the application of a higher fertilizer rate (F1), resulting in a strong economic performance with relatively lower production costs ($875.1 and $870.3). These findings collectively suggest that deficit irrigation strategies, particularly when water availability is limited and costly, may be more economically sustainable under arid conditions, with treatments like I3F1 offering a promising compromise between resource use efficiency and economic return.

5. Conclusions

Water stress markedly reduces growth and productivity of Mombasa grass, while sufficient nitrogen fertilization helps counterbalance these adverse effects. Higher water inputs lead to increased fresh and dry weights, taller plants, and more tillers; however, excessive irrigation may result in lower economic efficiency due to elevated water costs. Maximum yield was achieved with the highest irrigation level (I1), yet this treatment proved least cost-effective compared to deficit irrigation strategies. Moderately reduced water supply (I2 and I3) provided a more favorable balance between biomass production and profitability, demonstrating improved water productivity under limited water conditions. Economically, treatment I3F1 proved to be the most efficient option under moderate water availability. It combined reduced irrigation with a high fertilizer rate, resulting in a strong net return and the second-highest benefit-cost ratio among all treatments. These findings emphasize the need for refined irrigation and nitrogen management practices tailored to arid environments, where water is both scarce and costly.
Future research should examine seasonal variations in growth, yield, and forage quality of Mombasa grass under different irrigation and nutrient conditions. Understanding the physiological mechanisms of plant responses to water stress and nutrient management will help optimize practices for greater sustainability and economic efficiency in forage production.

Author Contributions

A.A. (Abdulaziz Alharbi), methodology, investigation, resources, data curation, writing—original draft preparation, writing—review and editing, visualization. S.A., methodology, investigation, resources, data curation, visualization. M.I.M., methodology, investigation, data curation, writing—review and editing, and visualization. A.A. (Ahmed Alzoheiry), methodology, investigation, resources, data curation, writing—original draft preparation, writing—review and editing, visualization. M.G., methodology, investigation, resources, data curation, writing—original draft preparation, writing—review and editing, visualization. The manuscript was written through contributions of all authors. All authors have read and agreed to the published version of the manuscript.

Funding

This research received no external funding.

Data Availability Statement

The original contributions presented in this study are included in the article; further inquiries can be directed to the corresponding author.

Acknowledgments

The researchers would like to thank the Deanship of Graduated Studies and Scientific Research at Qassim University for financial support (QU-APC-2025).

Conflicts of Interest

The authors declare no conflicts of interest.

References

  1. Viciedo, D.O.; de Mello Prado, R.; Martínez, C.A.; Habermann, E.; de Cássia Piccolo, M. Short-term warming and water stress affect Panicum maximum Jacq. stoichiometric homeostasis and biomass production. Sci. Total Environ. 2019, 681, 267–274. [Google Scholar] [CrossRef] [PubMed]
  2. Hidosa, D.; Adicha, A.; Sultan, M. Production and commercialization status of improved panicum grass cultivation in the lowland livestock production system of South Omo South-Western Ethiopia. Res. World Agric. Econ. 2022, 3, 12–24. [Google Scholar] [CrossRef]
  3. Pereira, V.V.; Fonseca, D.M.D.; Martuscello, J.A.; Cecon, P.R.; Santos, M.V.; Braz, T.G.D.S. Biomass accumulation in mombasa guinea grass plants under different levels of nitrogen supply and plant densities. Rev. Bras. Zootec. 2012, 41, 1118–1126. [Google Scholar] [CrossRef]
  4. Dias, M.B.D.C.; Costa, K.A.D.P.; Severiano, E.D.C.; Bilego, U.O.; Vilela, L.; de Souza, W.F.; de Oliveira, I.P.; da Silva, A.C.G. Cattle performance with Brachiaria and Panicum maximum forages in an integrated crop-livestock system. Afr. J. Range Forage Sci. 2022, 39, 230–243. [Google Scholar] [CrossRef]
  5. Albiac, J.; Calvo, E.; Kahil, T.; Esteban, E. The challenge of irrigation water pricing in the Water Framework Directive. Water Altern. 2020, 13, 674–690. [Google Scholar]
  6. Habermann, E.; Dias de Oliveira, E.A.; Contin, D.R.; Delvecchio, G.; Viciedo, D.O.; de Moraes, M.A.; de Mello Prado, R.; de Pinho Costa, K.A.; Braga, M.R.; Martinez, C.A. Warming and water deficit impact leaf photosynthesis and decrease forage quality and digestibility of a C4 tropical grass. Physiol. Plant. 2019, 165, 383–402. [Google Scholar] [CrossRef]
  7. Alsunaydi, S.; Alharbi, A.B.; Al-Soqeer, A.A.; Motawei, M.I. Nutritional Composition and Productivity of Panicum maximum cv. “Mombasa” Under Different Levels of Nitrogen Fertilization and Water Deficit. Life 2024, 14, 1614. [Google Scholar] [CrossRef]
  8. Hunter, M.C.; Kemanian, A.R.; Mortensen, D.A. Cover crop effects on maize drought stress and yield. Agric. Ecosyst. Environ. 2021, 311, 107294. [Google Scholar] [CrossRef]
  9. Gelley, C.H.; Ashworth, A.J.; Keyser, P.D.; Nave, R.L.; Rhinehart, J.D. Water-use efficiency of forage crops in the southeastern United States. Agronomy 2020, 10, 1377. [Google Scholar] [CrossRef]
  10. Jongen, M.; Pereira, J.S.; Aires, L.M.I.; Pio, C.A. The effects of drought and timing of precipitation on the inter-annual variation in ecosystem-atmosphere exchange in a Mediterranean grassland. Agric. For. Meteorol. 2011, 151, 595–606. [Google Scholar] [CrossRef]
  11. Anyia, A.O.; Herzog, H. Water-use efficiency, leaf area and leaf gas exchange of cowpeas under mid-season drought. Eur. J. Agron. 2004, 20, 327–339. [Google Scholar] [CrossRef]
  12. Ghannoum, O.; Von Caemmerer, S.; Conroy, J.P. The effect of drought on plant water use efficiency of nine NAD–ME and nine NADP–ME Australian C4 grasses. Funct. Plant Biol. 2002, 29, 1337–1348. [Google Scholar] [CrossRef]
  13. Hussain, M.Z.; Grünwald, T.; Tenhunen, J.D.; Li, Y.L.; Mirzae, H.; Bernhofer, C.; Otieno, D.; Dinh, N.Q.; Schmidt, M.; Wartinger, M.; et al. Summer drought influence on CO2 and water fluxes of extensively managed grassland in Germany. Agric. Ecosyst. Environ. 2011, 141, 67–76. [Google Scholar] [CrossRef]
  14. Carter, M.R.; Gregorich, E.G. Soil Sampling and Methods of Analysis; CRC Press: Boca Raton, FL, USA, 2007. [Google Scholar]
  15. Allen, R.G.; Pereira, L.S.; Raes, D.; Smith, M. Crop evapotranspiration-Guidelines for computing crop water requirements-FAO Irrigation and drainage paper 56. Fao Rome 1998, 300, D05109. [Google Scholar]
  16. Council, A.W. Guidelines for Brackish Water Use for Agricultural Production in the Near East and North Africa Region; Food and Agriculture Organization of the United Nations: Rome, Italy, 2023. [Google Scholar]
  17. Alotaibi, B.A.; Baig, M.B.; Najim, M.M.; Shah, A.A.; Alamri, Y.A. Water scarcity management to ensure food scarcity through sustainable water resources management in Saudi Arabia. Sustainability 2023, 15, 10648. [Google Scholar] [CrossRef]
  18. Waseem, M.; Athar, H.R.; Ashraf, M.; Bhatti, A.S. Effect of water stress on growth and photosynthetic parameters of different wheat cultivars. Pak. J. Bot. 2006, 38, 1667–1674. [Google Scholar]
  19. Alsiteel, M.J.; Alshareef, I.M. Effect of Drought on the Growth of Two Panicum maximum jacq. Cultivars in Southern Libya. Libyan J. Agric. 2022, 27. [Google Scholar]
  20. Zuffo, A.M.; Steiner, F.; Aguilera, J.G.; Ratke, R.F.; Barrozo, L.M.; Mezzomo, R.; Ancca, S.M. Selected indices to identify water-stress-tolerant tropical forage grasses. Plants 2022, 11, 2444. [Google Scholar] [CrossRef] [PubMed]
  21. Silva, T.G.F.; Zolnier, S.; Borges, I. Water use efficiency of forage crops under different irrigation regimes and nitrogen levels. Crop Sci. 2020, 60, 2342–2355. [Google Scholar]
  22. Fonseca, D.M.; Martusello, J.A. Plantas Forrageiras, 2nd ed.; Editora UFV: Viçosa, Brazil, 2010; 591p. [Google Scholar]
  23. Ali, M.; Khan, M.A.; Ashraf, M.Y. Influence of nitrogen application on growth, yield, and water use efficiency in forage grasses under water stress. Agric. Water Manag. 2017, 191, 89–98. [Google Scholar]
  24. Zhang, Y.; Wang, J.; Gong, S.; Xu, D.; Sui, J. Nitrogen fertigation effect on photosynthesis, grain yield and water use efficiency of winter wheat. Agric. Water Manag. 2017, 179, 277–287. [Google Scholar] [CrossRef]
  25. Carvalho, I.R.; Nunes, B.T.; Rodrigues, L.B. Effect of water and nutrient availability on the productivity of tropical forage grasses. J. Grassl. Sci. 2018, 64, 204–212. [Google Scholar]
  26. da Silva Pause, A.G.; de Souza França, A.F.; Okada, E.S.M.; Gandra, J.R.; Dupas, E.; de Oliveira, E.R.; Ferreira, J.L.; Marques, O.F.C. Nutritional value of Mombasa grass submitted to different grazing heights and nitrogen fertilization. Braz. J. Anim. Environ. Res. 2021, 4, 860–874. [Google Scholar] [CrossRef]
  27. Moscoso, C.J.; Morgan, S.A.; Rivero, M.J. The effect of drying methods on water-soluble carbohydrates and crude protein concentrations and their ratio in two perennial ryegrass cultivars. Agronomy 2019, 9, 383. [Google Scholar] [CrossRef]
  28. Gunes, A.; Cicek, N.; Inal, A.; Alpslan, M.; Eraslan, F.; Gueri, E.; Guzelordu, T. Genotypic response of chickpea (Cicer arietinum L.) cultivars to drought stress implemented at pre-and post-anthesis stages and its relations with nutrient uptake and efficiency. Plant Soil Environ. 2006, 52, 368–376. [Google Scholar] [CrossRef]
  29. Garg, B.K. Nutrient uptake and management under drought: Nutrient-moisture interaction. Curr. Agric. 2003, 27, 1–8. [Google Scholar]
Figure 1. Water productivity (WP) of Mombasa grass under different irrigation levels and nitrogen fertilization treatments.
Agronomy 15 01274 g001
Figure 2. Protein percentage per irrigation water unit and total protein produced per water unit of Mombasa grass under different irrigation levels and nitrogen fertilization treatments. PPW at F1 = protein percentage/irrigation water unit at 100% fertilization, PPW at F2 = protein percentage/irrigation water unit at 50% fertilization, TPW at F1 = total amount of protein produced/irrigation water unit at 100% fertilization, and TPW at F2 = total amount of protein produced/irrigation water unit at 50% fertilization.
Agronomy 15 01274 g002
Figure 3. Economic performance of treatments: gross return, net return, and irrigation cost.
Agronomy 15 01274 g003
Table 1. Soil physical properties and water retention characteristics.
Depth, cmDistribution of the Soil Particle Size, %Texture
Class
θ v FC *, cm3·cm−3 θ v PWP **, cm3·cm−3
SandSilt Clay
0–2581.116.42.5Loamy Sand0.1120.056
* FC: Field Capacity; ** PWP: Permanent Welting Point; Values presented in the table represent the averages of five soil samples collected from the experimental field. According to international soil texture classification.
Table 2. Main effects of irrigation and nitrogen on fresh/dry biomass, tiller density, and height over two seasons.
TreatmentSeason ISeason II
FW *, ton·ha−1DW *, ton·ha−1Height, cmNO. TillersFW, ton·ha−1DW, ton·ha−1Height, cmNO. Tillers
IrrigationI181.5a **18.7a145.4a23.9a80.9a18.3a143.9a24.1a
I274.5b16.8b136.1b22.9ab75.2b16.9b137.1b23.1ab
I371.5b15.7b132.2b22.5b72.5b15.6b132.2b22.5b
I463.6c14.9b122.3c20.7c63.8c14.8b122.5c21.3c
FertilizationF169.4a16.3a127.1a21.3a68.9a15.9a127.1a21.1a
F256.3b12.8b119.1b19.2a54.7b12.3b119.1b19.5a
* FW = fresh weight; DW = dry weight. ** Means followed by the same letter in a column are not significantly different from each other at p = 0.05.
Table 3. Interactive effects of irrigation and nitrogen on biomass, tillering, and height in panicum maximum cv. Mombasa.
TreatmentFW, ton·ha−1DW,
ton·ha−1
Height,
cm
NO. Tillers
Irrigation (I)Fertilization (F)
I1F192.2a *21.3a153.1a25.5a
F270.9c16.0c137.7b22.3b
I2F178.1b17.6b134.5b23.4a
F264.9d15.0d129.9b21.6b
I3F162.3d16.1c114.8c19.8c
F249.3e14.5e109.3d18.4c
I4F145.1f15.3f105.9d16.5d
F240.1g13.6f99.4e14.5e
* Means followed by the same letter in a column are not significantly different from each other at p = 0.05.
Disclaimer/Publisher’s Note: The statements, opinions and data contained in all publications are solely those of the individual author(s) and contributor(s) and not of MDPI and/or the editor(s). MDPI and/or the editor(s) disclaim responsibility for any injury to people or property resulting from any ideas, methods, instructions or products referred to in the content.

