Article

Analysis of Potato Growth, Water Consumption Characteristics and Irrigation Strategies in the Agro-Pastoral Ecotone of Northwest China

1
Yinshanbeilu Grassland Eco-Hydrology National Observation and Research Station, China Institute of Water Resources and Hydropower Research, Beijing 100038, China
2
Institute of Water Resources for Pastoral Area, Ministry of Water Resources, Hohhot 010020, China
*
Authors to whom correspondence should be addressed.
These authors contributed equally to this work.
Agronomy 2025, 15(12), 2685; https://doi.org/10.3390/agronomy15122685 (registering DOI)
Submission received: 18 September 2025 / Revised: 19 November 2025 / Accepted: 20 November 2025 / Published: 22 November 2025

Abstract

The agro-pastoral ecotone in Yinshanbeilu is the main potato-producing region. In recent years, the shift from rainfed to irrigated agriculture has created challenges in understanding potato water consumption patterns, water use efficiency, and irrigation optimization. This study utilized the DSSAT model to simulate soil moisture, leaf area index, and potato yield based on a two-year in situ observational experiment. The study showed that simulated values of the soil water moisture, leaf area index, and yield, with Absolute Relative Error (ARE) of 4.18–5.27%, Normalized Root Mean Square Error (nRMSE) of 5.64–8.65%, and Coefficient of Determination (R2) values of 0.86–0.921, exhibited acceptable accuracy. Simulated results pointed out that potato water consumption ranged between 375.2 and 414.2 mm, with 50–52% occurring during tuber formation to bulking stages, and the average water consumption intensity was 2.62~2.81 mm/d. Based on DSSAT model simulation, this study found that water use efficiency (WUE) reached 162.17–166.20 kg/(hm2·mm), while irrigation water use efficiency (IWUE) varied between 86.1 and 108.1 kg/(hm2·mm). With the highest yield as the target, the recommended irrigation amounts for potato in normal year and dry year were 180 mm and 240 mm. With the highest utilization rate of groundwater resources as the target, the recommended irrigation amounts in normal year and dry year were 162 mm and 192 mm. These findings offer valuable insights for promoting sustainable groundwater use and enhancing water conservation practices in the Yinshanbeilu agro-pastoral ecotone.

1. Introduction

The cultivated land area in the agro-pastoral ecotone of the Yinshanbeilu area in Inner Mongolia reached 1.5 million hm2, accounting for 36% of the total land area, and the irrigated area accounts for only 7.5% of the cultivated land area, while the rest is dry slope land [1]. Potato is an important crop in the region, with a planting area of about 70–80% of the cultivated land [2]. The farmland in the agro-pastoral ecotone of Yinshanbeilu is irrigated with groundwater. In recent years, the area of irrigated land has increased, leading to severe overexploitation of groundwater. The groundwater level decreases by 27.50 cm to 47.50 cm every year, resulting in an imbalance between groundwater extraction and replenishment [3]. At present, many farmers are not clear about the water consumption patterns and irrigation systems for potato, resulting in a large amount of irrigation water not being effectively utilized.
Many scholars have conducted extensive research on potato cultivation, irrigation water quantity, fertilization amount, and water use efficiency. Wang et al. [4] employed the Analytic Hierarchy Process combined with the Fuzzy Comprehensive Evaluation Method to optimize irrigation and fertilization levels for potato crops. This study was based on two years of experimental data, with evaluation indicators covering economic benefits, tuber quality, and soil environmental benefits. Their findings indicated that the optimal irrigation corresponded to 100% of crop evapotranspiration (ETc), coupled with a fertilization rate of 200–349–248 kg/ha for nitrogen, phosphorus, and potassium (N-P-K), respectively. Zhang et al. [5] conducted in situ observational experiments on canopy net radiation, soil heat flux, and soil temperature in Gansu and Shandong regions to study the thermal effects of different film coverings under drip irrigation conditions and their effects on potato growth. They calculated potato tuber grading, yield, and water use efficiency, and found that the water consumption of transparent film treatment in the Gansu region was significantly lower than that of black film treatment. Li et al. [6] studied the effect of soil cultivation under straw strip cover on potato yield and water use efficiency in the northwest rain-fed area. In normal years, no soil cultivation significantly increased water use efficiency by 20.10%, 24.89%, and 17.07% compared to mound hilling, furrow ridging with soil banking, and trench sowing with soil incorporation, respectively. Compared with APSIM, WOFOST, and AquaCrop models, the DSSAT model is more focused on detailed crop simulation, providing richer datasets and practical tools. It is more advantageous in simulating water/nutrient stress and dynamically generating management measures. In addition, the DSSAT model integrates more comprehensive soil–crop–atmosphere dynamics modules to support multi-factor coupling analysis. Wang et al. [7] assessed potato drip irrigation and fertilization regimens by means of the DSSAT SUBSTOR Potato model, proposing that the optimal irrigation volume in the northwest region should be 100% ETC, and the ideal irrigation and fertilization dosage (N-P2O5-K2O) was 200-80-300 kg/hm2. Cao et al. [8] analyzed the response of different potato varieties to water deficit in Dingxi City, Gansu Province, and explored the differences in water demand among different varieties. Tang et al. [9] revelaed that future climate change may affect potato yield and water use efficiency under varying irrigation regimes. They found that future climatic conditions are likely to have a beneficial effect, enhancing the region’s suitability for potato cultivation. Rolbieckir et al. [10] found that irrigation is an effective field management measure to increase tuber yield. Compared with rain-fed conditions, irrigation significantly increased tuber yield by 55%. In a separate study, Molaei [11] examined the impact of different irrigation techniques on potato production, revealing that drip irrigation resulted in a 42% higher tuber yield compared to sprinkler irrigation. Montoya et al. [12] conducted a two-year field experiment on potatoes under varying irrigation levels to validate the SUBSTOR Potato model, and the results showed that the model could effectively simulate tuber yield. Mild deficit irrigation (5%~10%) can improve water use efficiency. The research results of Camargo et al. [13] on potato growth under different irrigation amounts showed that water stress (irrigation treatments with 60% and 80% water demand) reduced the crop growth rate of potato, resulting in a decrease in biomass. The irrigation treatment with 90% water demand had the highest potential biomass and would not affect potato growth and tuber yield. The article adds discussion: Overall, when the irrigation amount is reduced from 100% ETc to a certain level, the yield decreases slightly but remains within an acceptable range, while the water use efficiency (WUE) is significantly improved. This is a more sustainable irrigation strategy in water-scarce areas. It was recommended that areas with insufficient water resources should be irrigated with appropriate deficit irrigation. The appropriate amount of irrigation and soil moisture content is key to improving tuber yield and water use efficiency.
In summary, a large amount of research on potato water use efficiency and irrigation systems has been conducted in Gansu, Shandong, and Northwest China. However, research on the water consumption patterns of potatoes, the dynamic changes in soil moisture and yield, and the prediction of optimal irrigation in the groundwater over-exploitation areas of agro-pastoral ecotone remains scarce in Inner Mongolia. At present, most research focuses on in situ observation experiments. By setting different irrigation and fertilization scenarios, the optimal irrigation system was proposed. However, there are two key issues with using models to study potato water use efficiency and irrigation strategies. Firstly, there is a lack of locally calibrated model parameters. Using external parameters can lead to simulation bias and make it difficult to accurately assess water use efficiency. Secondly, groundwater and hydrological year constraints are not fully considered, resulting in unsuitable irrigation strategies and hindering the sustainable development of the industry in the agro-pastoral ecotone of Yinshanbeilu.
Therefore, this study took the potato as the object and conducted a two-year in situ observational experiment to calibrate and verify the constructed DSSAT model. The study analyzed the water use efficiency and predicted the optimal irrigation strategy for potatoes in the agro-pastoral ecotone of Yinshanbeilu. The outcomes aimed to provide scientific references for efficient utilization of groundwater resources and high-quality agricultural development in the agro-pastoral ecotone of Yinshanbeilu.

2. Materials and Methods

2.1. Study Area

Wuchuan County is located within the agro-pastoral transitional zone of Yinshanbeilu in Inner Mongolia (Figure 1). The total cultivated land area is 144,667 hectares, with irrigated land comprising 28,667 hectares. In this area, groundwater is the exclusive source of water for agricultural irrigation. The climate is characterized as a temperate continental monsoon, with a mean annual temperature ranging from 3.5 °C to 4.5 °C and annual precipitation varying between 280 mm and 350 mm. The frost-free period lasts approximately 110 days [14]. Within the 0–100 cm soil layer, the bulk density is from 1.2 to 1.7 g/cm3 [15]. The primary crops cultivated in the region are potatoes and oats.

2.2. Experimental Design

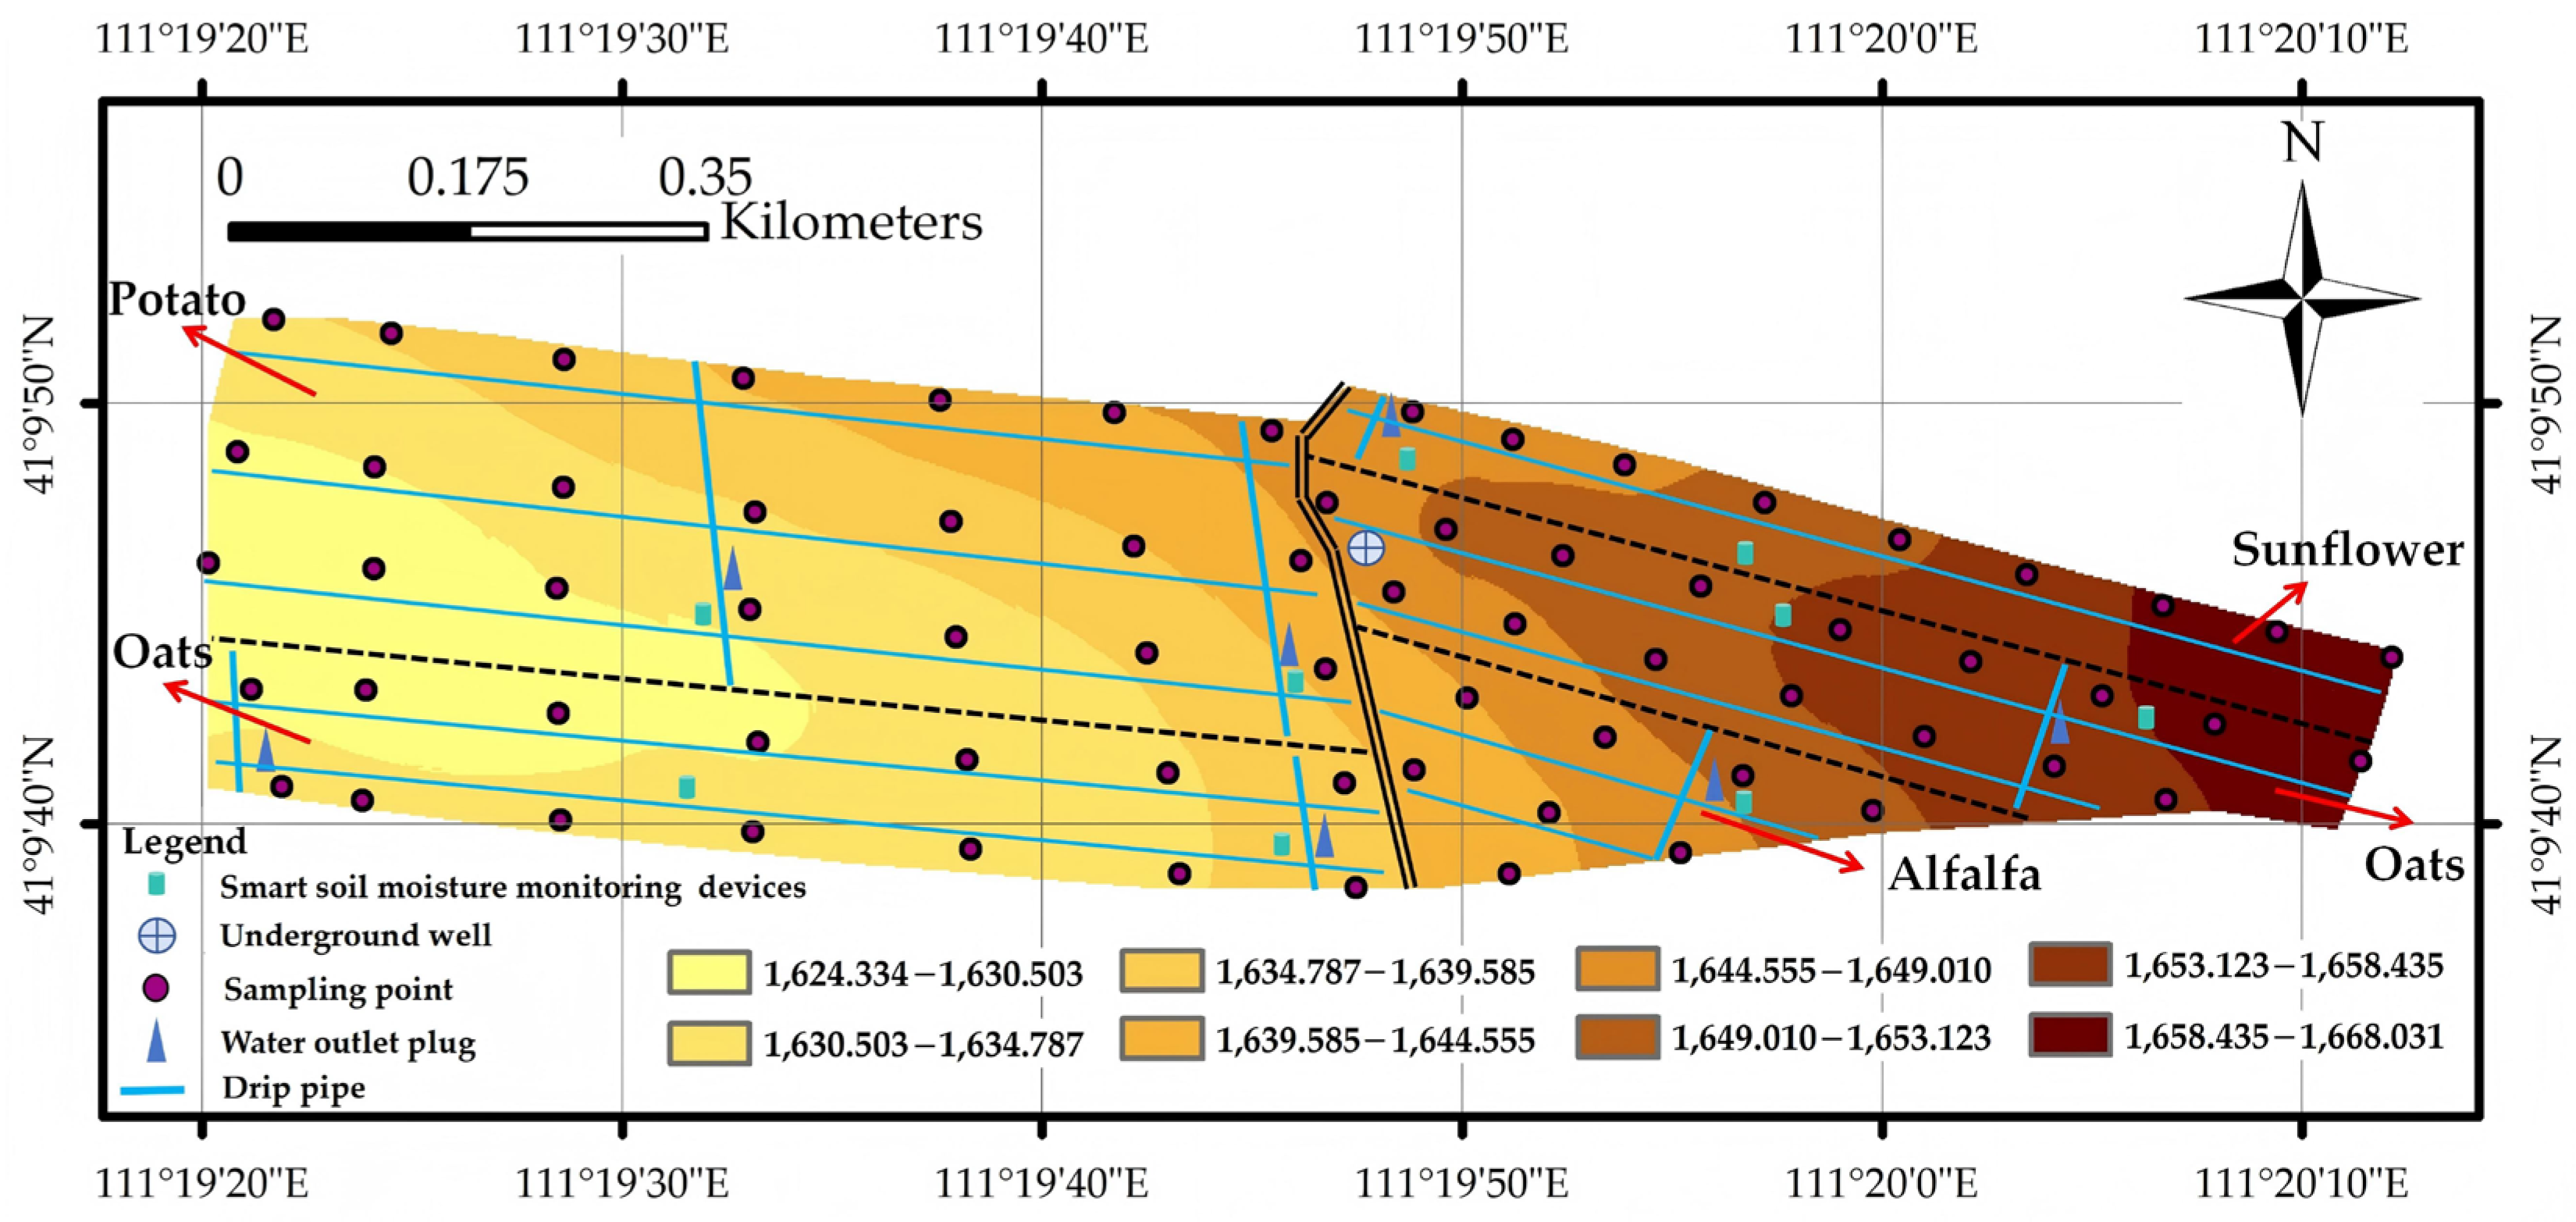
A typical irrigation unit with an irrigation area of 35.3 hectares and a single irrigation well was selected to study the water and fertilizer system, in which the planting areas of potato, oats, alfalfa, and sunflower were 15.2 hm2, 10.8 hm2, 4.9 hm2, and 4.4 hm2, respectively (Figure 2). This study selected potatoes as the research object.
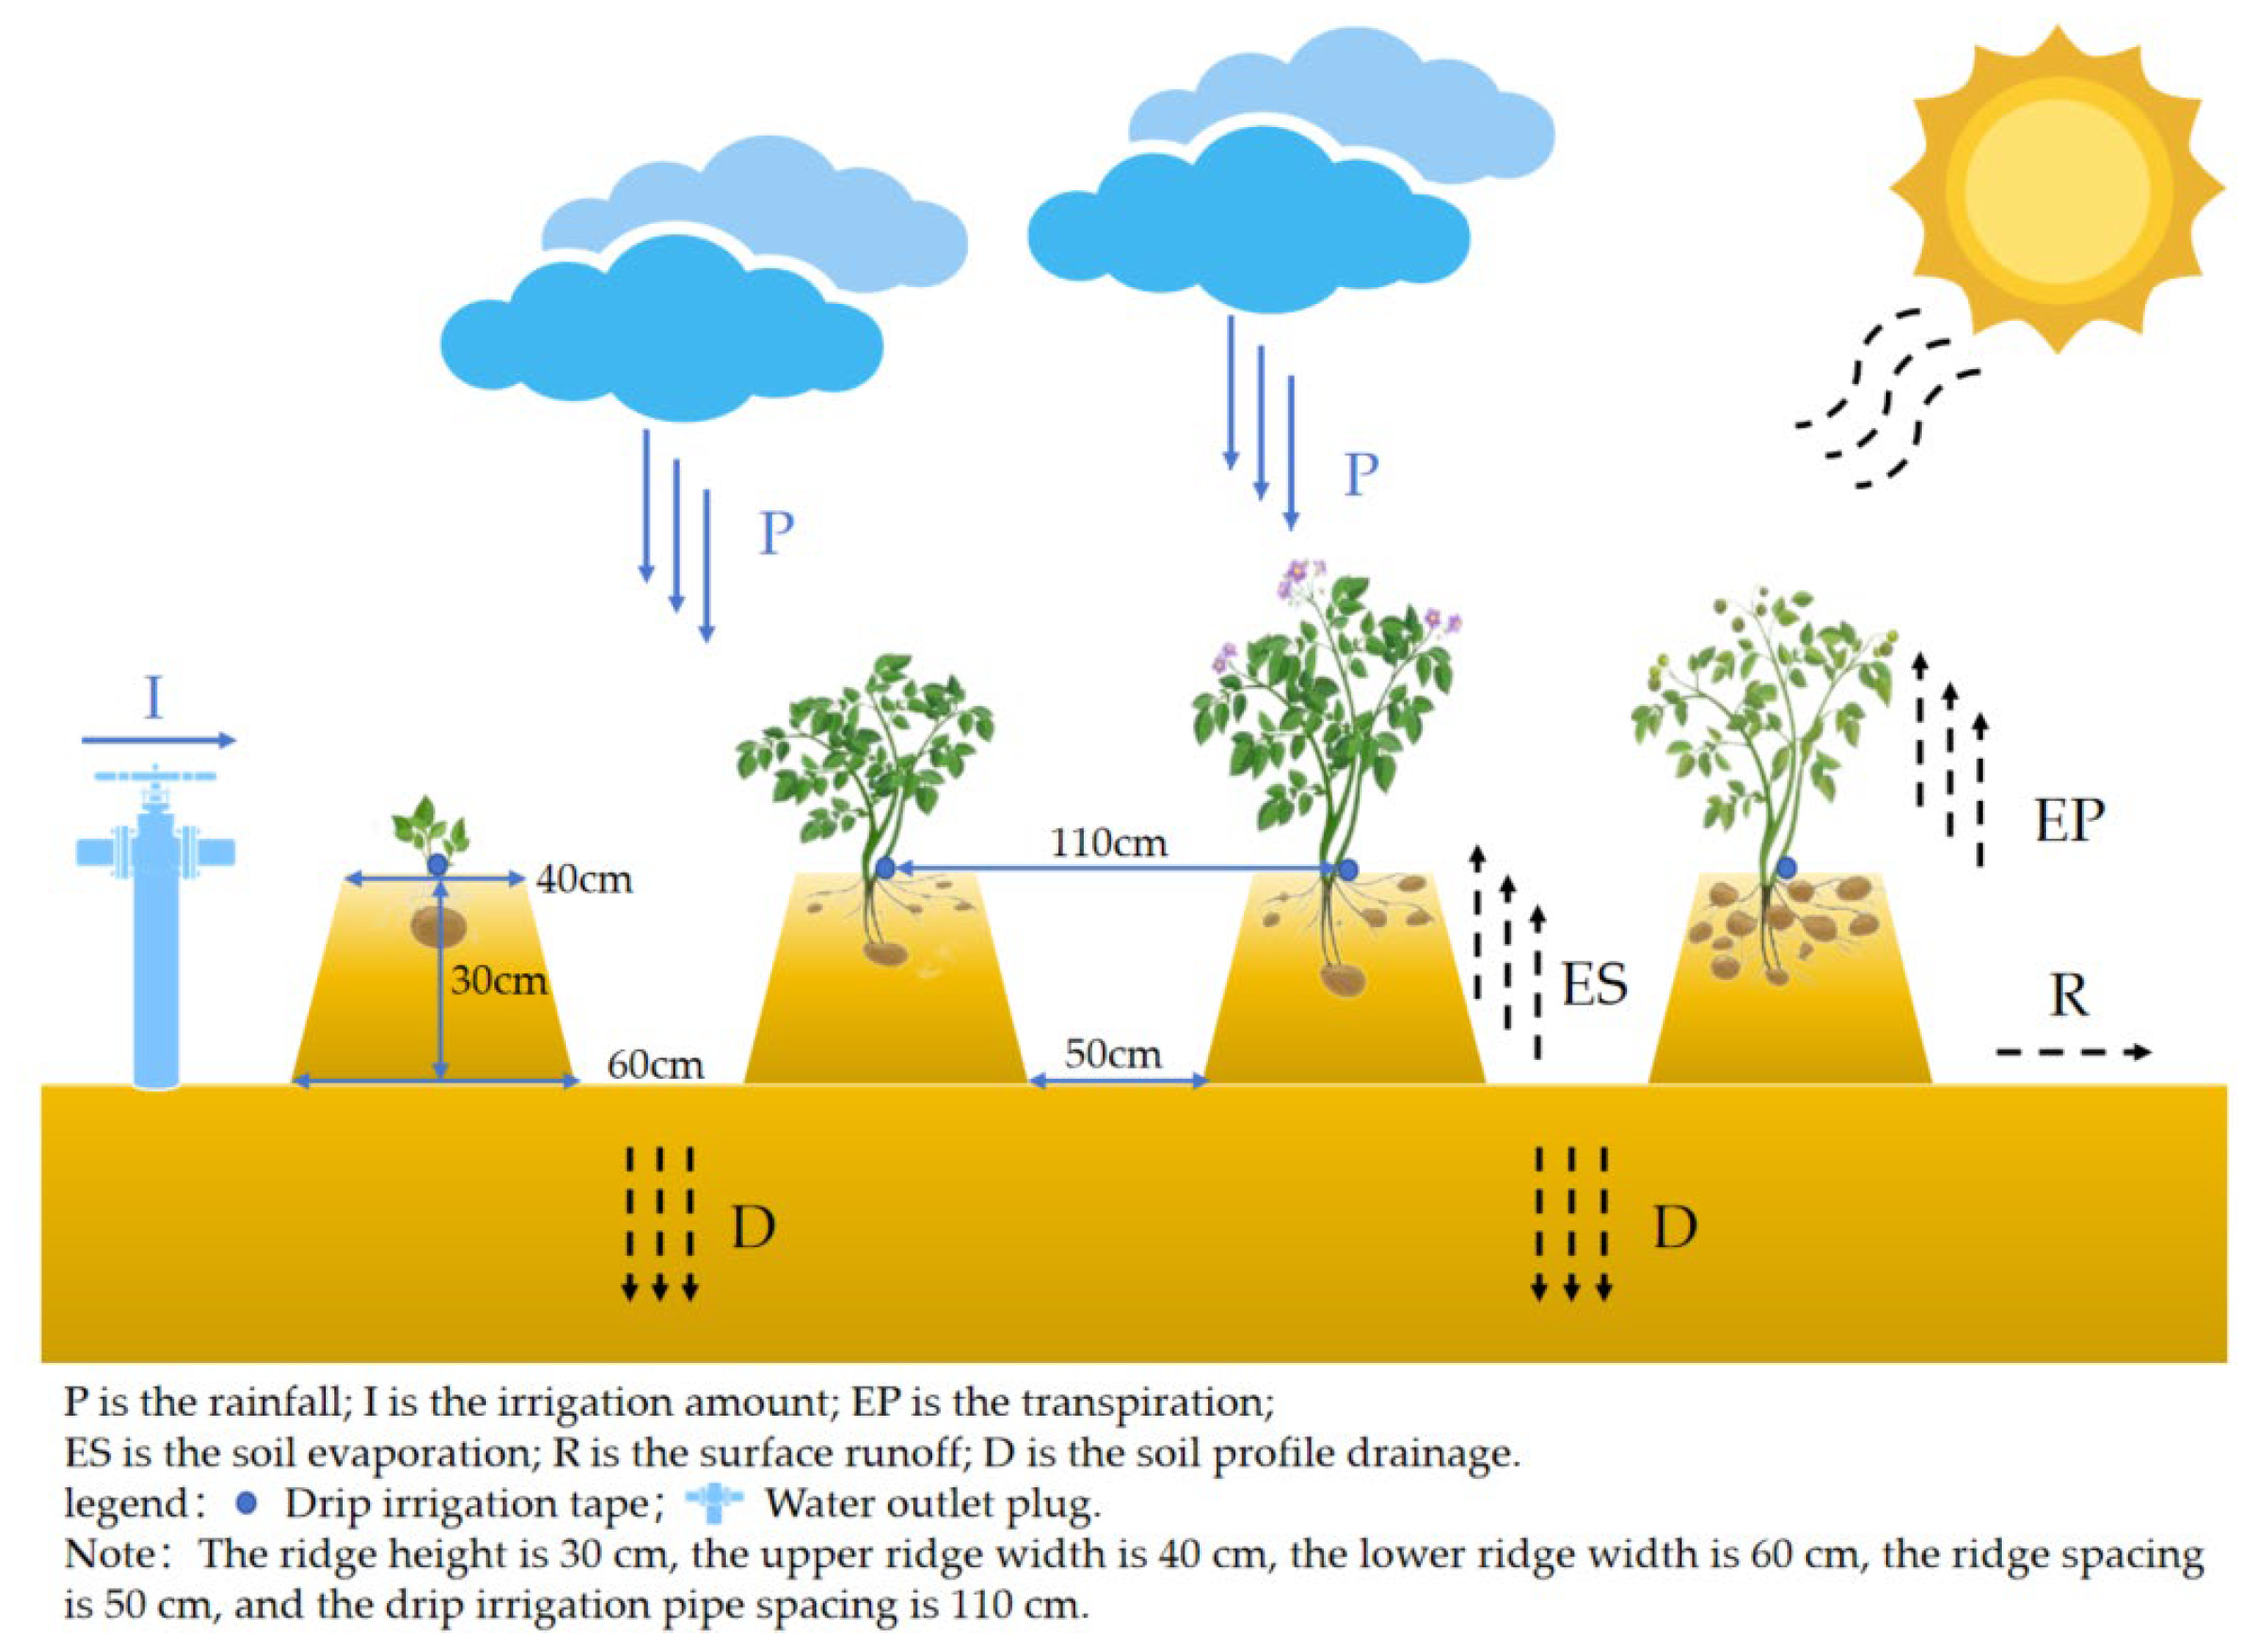
The potato variety was V7, with planting configuration set as ridge height of 30 cm, upper ridge width of 40 cm, lower ridge width of 60 cm, and ridge spacing of 50 cm, with one row planted per ridge (Figure 3). The distance between the drip irrigation pipes is 110 cm and the flow rate is 2.0 L/h. The irrigation method was surface drip irrigation. Fertilizer application followed farmers’ practices: nitrogen (CO(NH2)2) at 185 kg/ha, phosphorus (P2O5) at 135 kg/ha, and potassium (K2O) at 100 kg/ha.
The monitoring period was from May 1 to September 30 in 2022–2023, with sampling conducted on the 1st and 15th of each month. Additional sampling was performed based on rainfall, irrigation, and different growth stages of the potatoes. Soil sampling was conducted to a depth of 100 cm, and potato growth indicators including plant height, leaf area, and yield were determined. The growing period, irrigation times, irrigation frequency, and irrigation quota of potatoes were documented.

2.3. Measured Indicators

2.3.1. Soil Data Collection

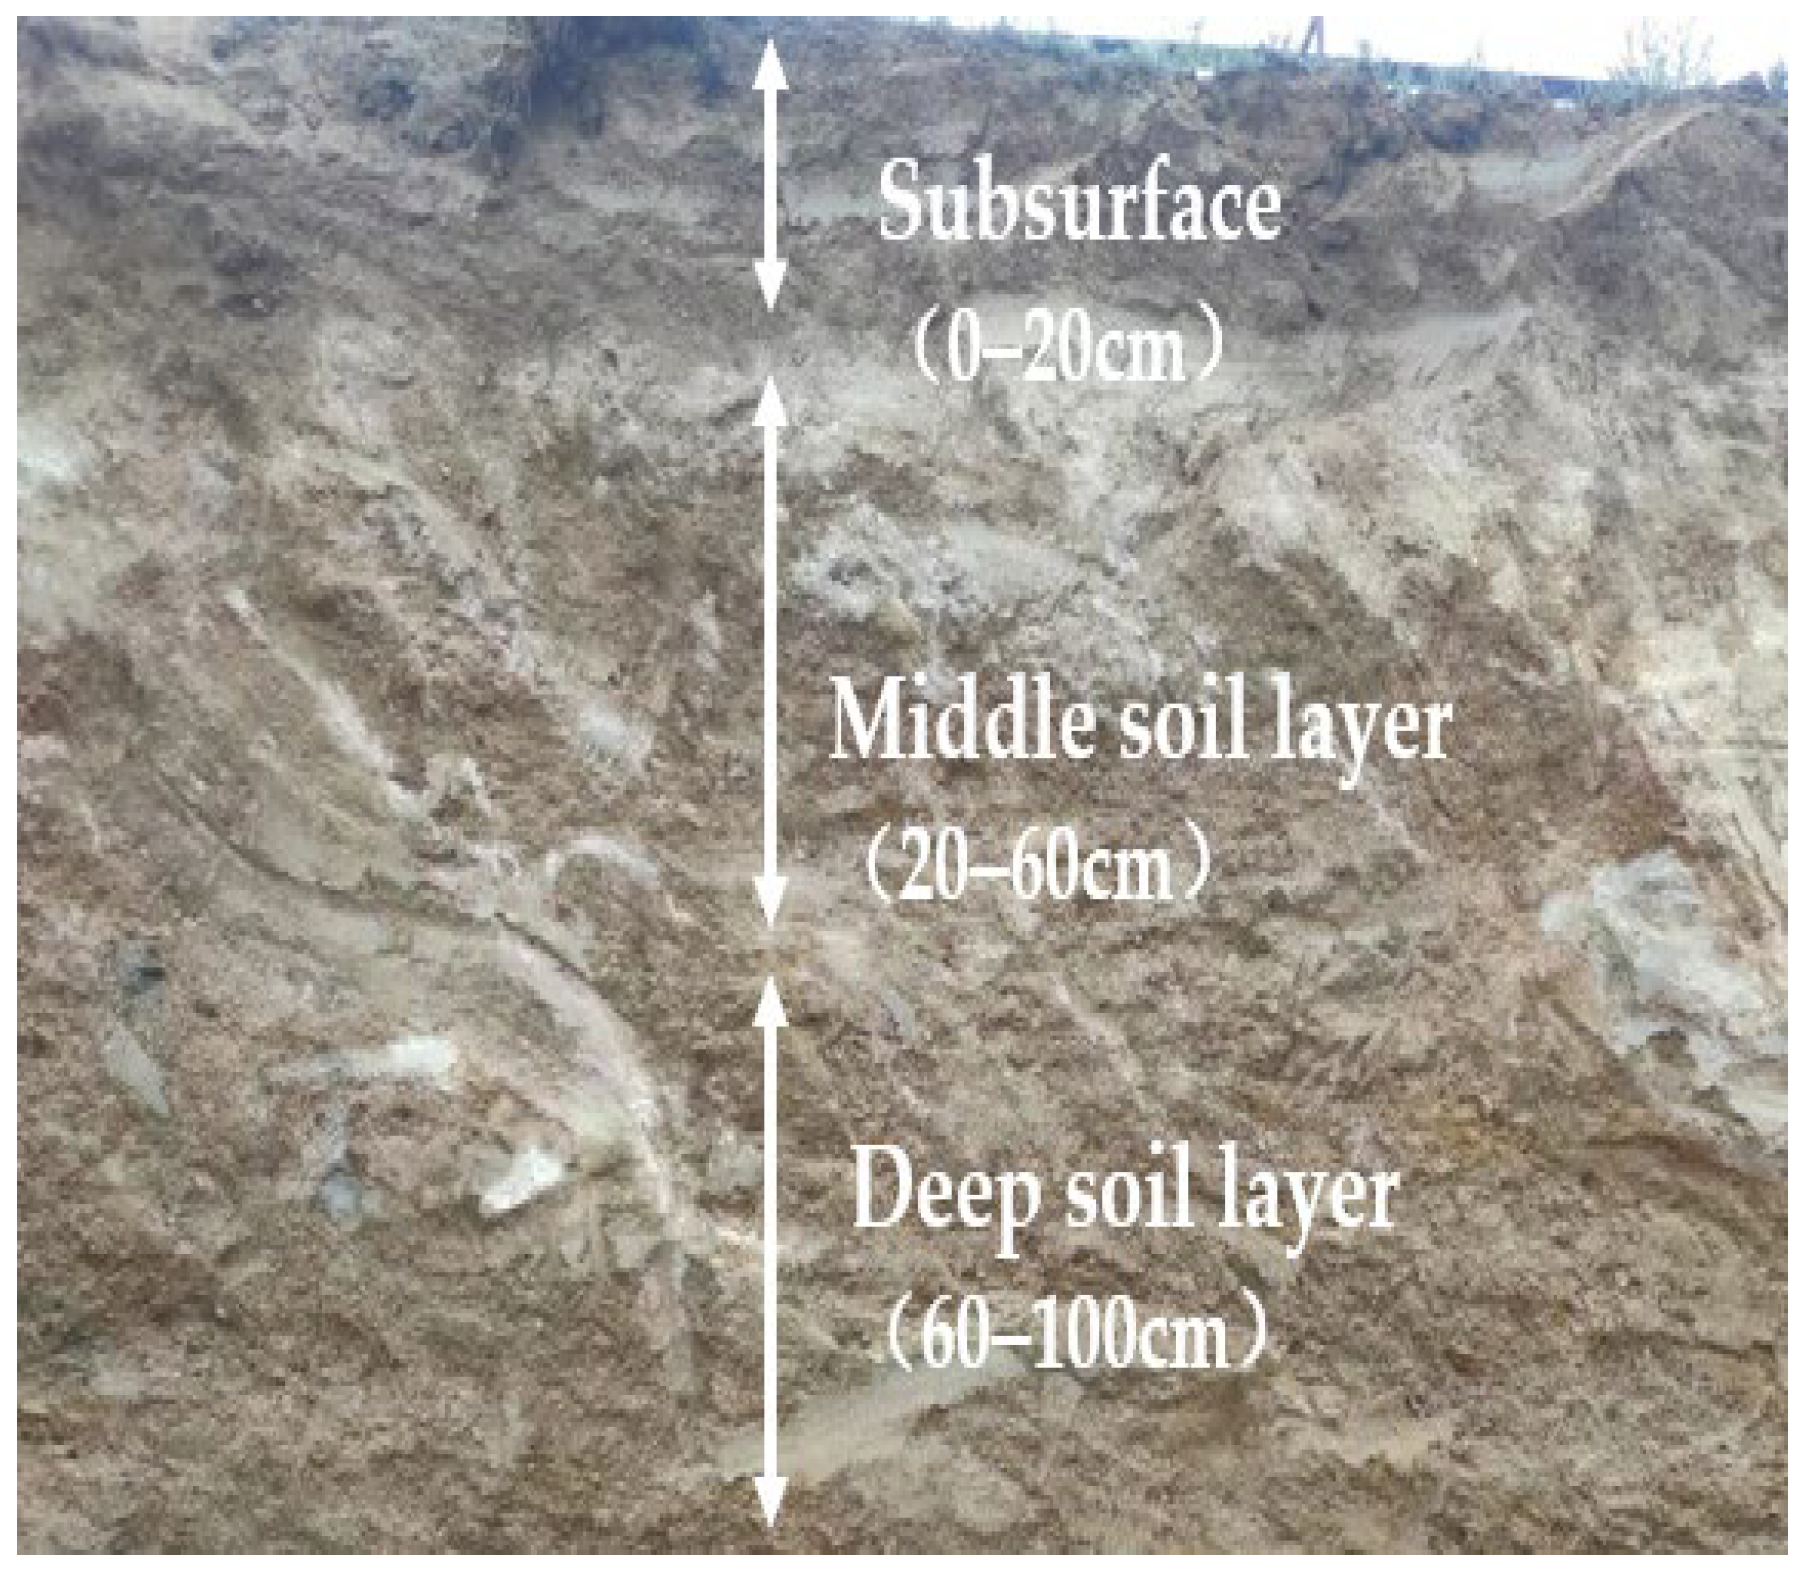
Soil moisture sensors were installed in potato planting areas to record the soil moisture dynamics. Embedded at soil layer depths of 10–100 cm at 10 cm intervals (i.e., 10, 20, …, 100 cm), the sensors (ET-100 model from China E Ecological Company, Beijing, China) were set to collect, monitor, and record data every 1 h. At the same time, the drying method was used to test soil moisture content at different growth stages, as well as pre- and post-irrigation, and applied to calibrate the soil moisture data simulated by the model. Soil samples were collected at 0–20 cm, 20–40 cm, 40–60 cm, 60–80 cm, and 80–100 cm soil layers (three samples per layer). The soil bulk density, field water-holding capacity, and saturated soil water content were measured using the cutting ring method, soil pH was determined using a pH meter, while farmland organic matter content was submitted to the laboratory for analysis. These basic physical parameters are shown in Table 1. The study area has poor soil quality, where shallow soil layers show relatively high fertility, while deep layers have low fertility. As soil depth increases, the sand content increases accordingly, leading to poor soil water retention capacity (Table 1). The soil profile texture is presented in Figure 4.

2.3.2. Meteorological Data Collection

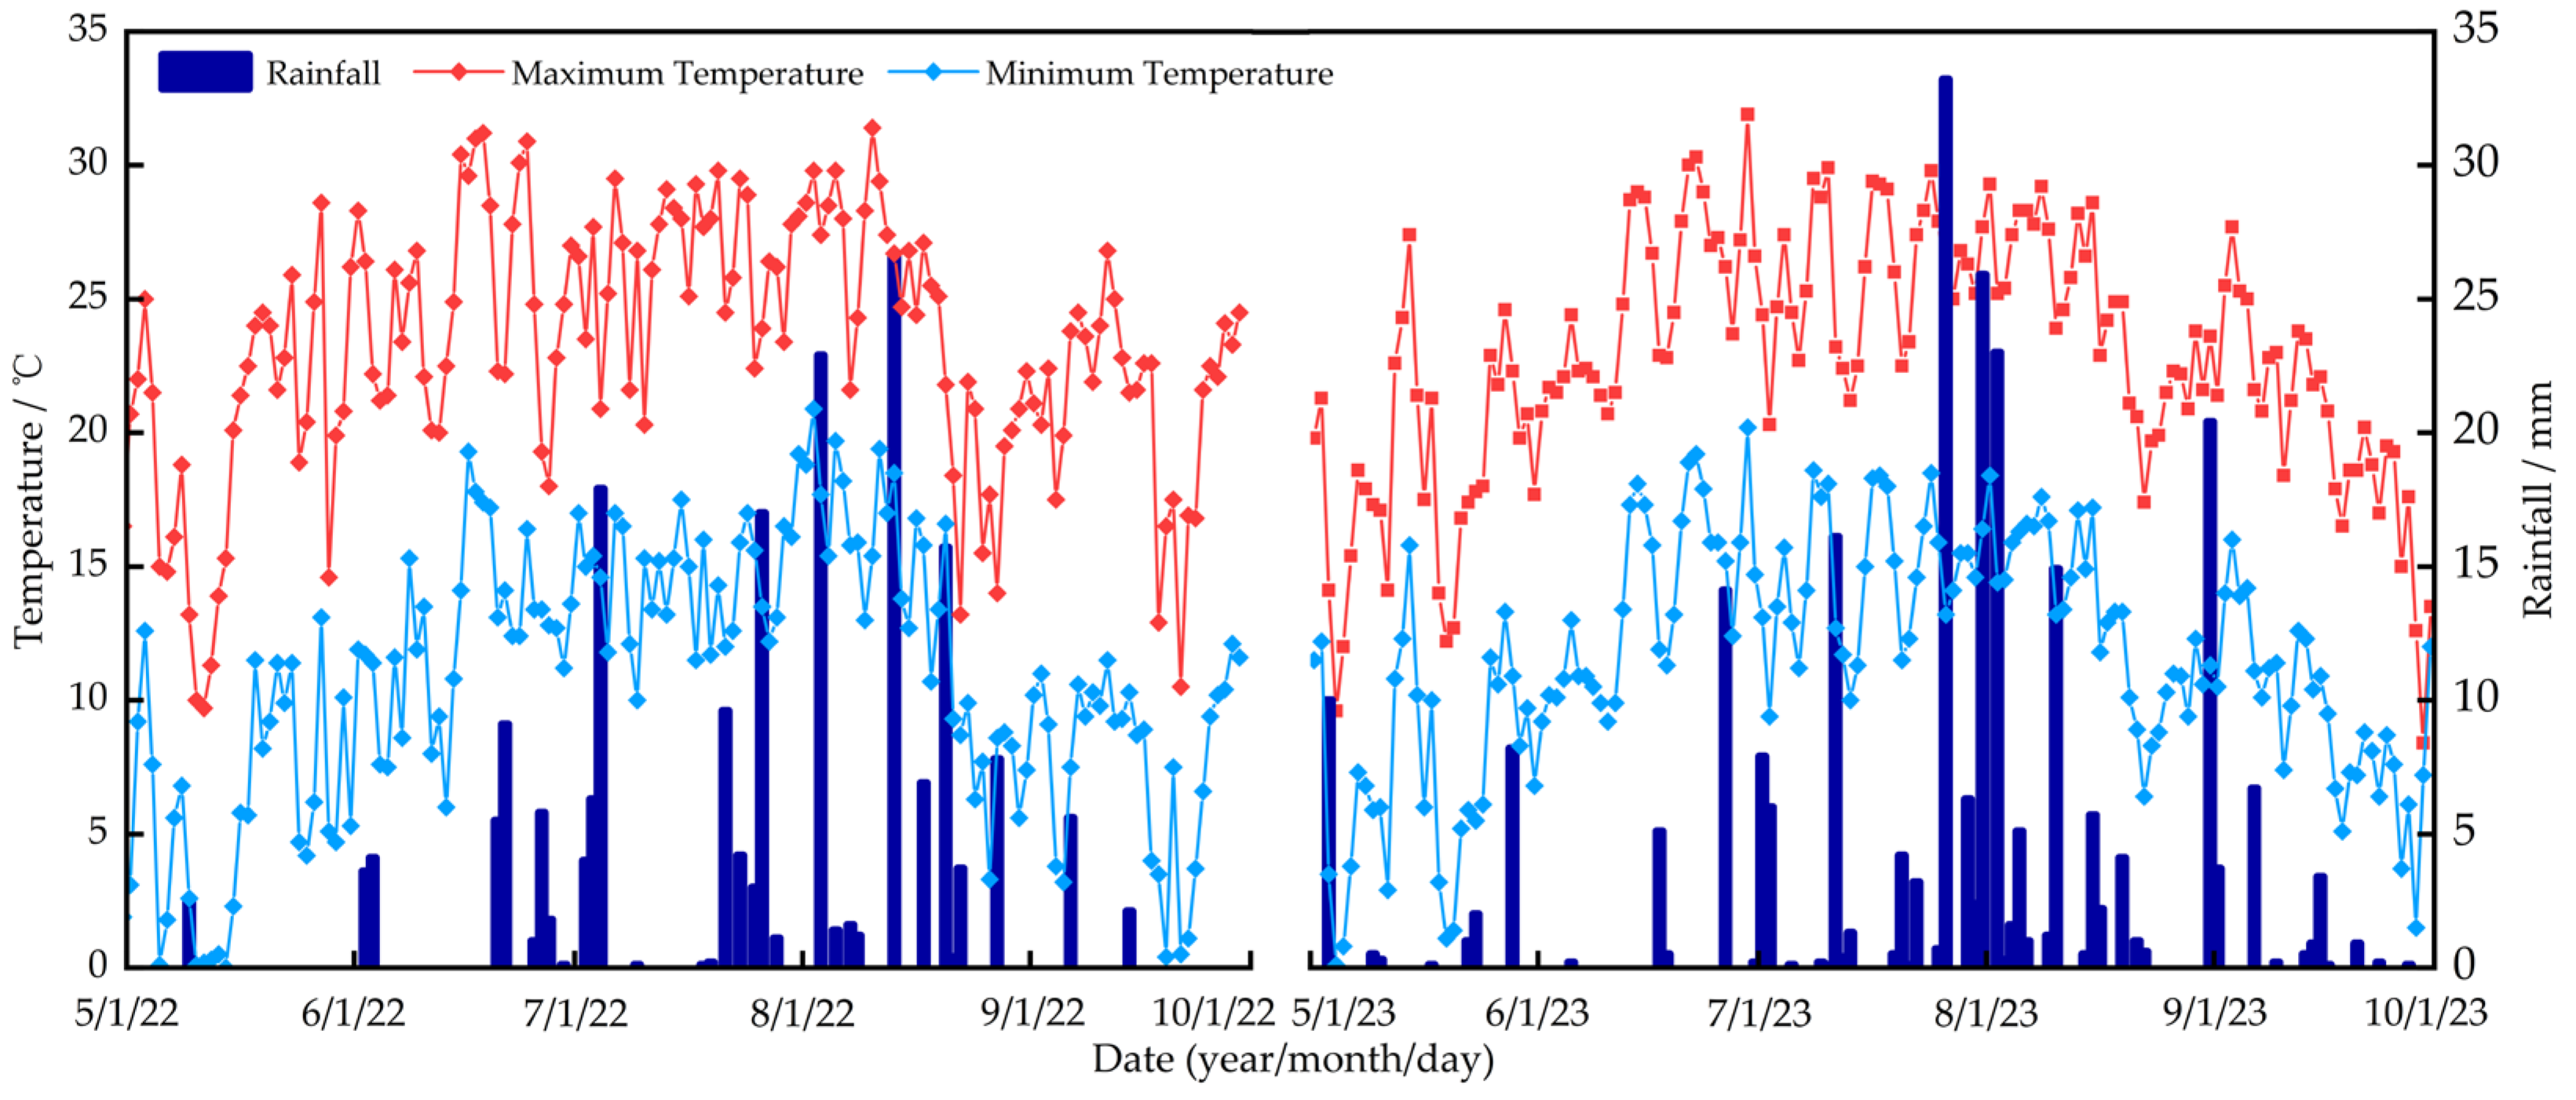
Meteorological data were retrieved by downloading from the China Meteorological Network (https://data.cma.cn, 19 November 2025). Figure 5 depicts the changes in temperature and precipitation during the crop growth period. During the crop growth periods in 2022 and 2023, the rainfall amounts were 213.6 mm and 257.8 mm, with temperatures of 0.4–29.8 °C in 2022 and 1.3–26.9 °C in 2023.

2.3.3. Growth Period

The growth period of the potato can be divided into four growth stages from sowing to harvesting, including the sowing–emergence period, emergence–formation period, formation–bulking period, and bulking–harvest period. The various growth stages in 2022 and 2023 are displayed in Table 2.

2.3.4. Irrigation Quota

The irrigation amount for different growth stages of potatoes is shown in Table 3.

2.4. Research Methods

2.4.1. Overview of the DSSAT Model

The Decision Support System for Agrotechnology Transfer (DSSAT) by the University of Georgia, USA, can combine crop simulation models with soil, climate, and experimental databases through a series of programs to make long-term and short-term climate change decisions, including CROPGRO, CERES, SUBSTOR, CANEGRO, and many other modules. The model can simulate numerous crops [16,17]. Compared with other models, the DSSAT model accurately depicts crop physiological processes and simulates single-season crop growth and yield with high accuracy. It is particularly suitable for research on grain and cash crops, and can simultaneously integrate multiple stress factors such as water and nitrogen, making it more applicable and meeting the needs of comprehensive analysis [18,19]. This study used DSSAT version 4.8.5.

2.4.2. Constructed Model and Calculated Equation

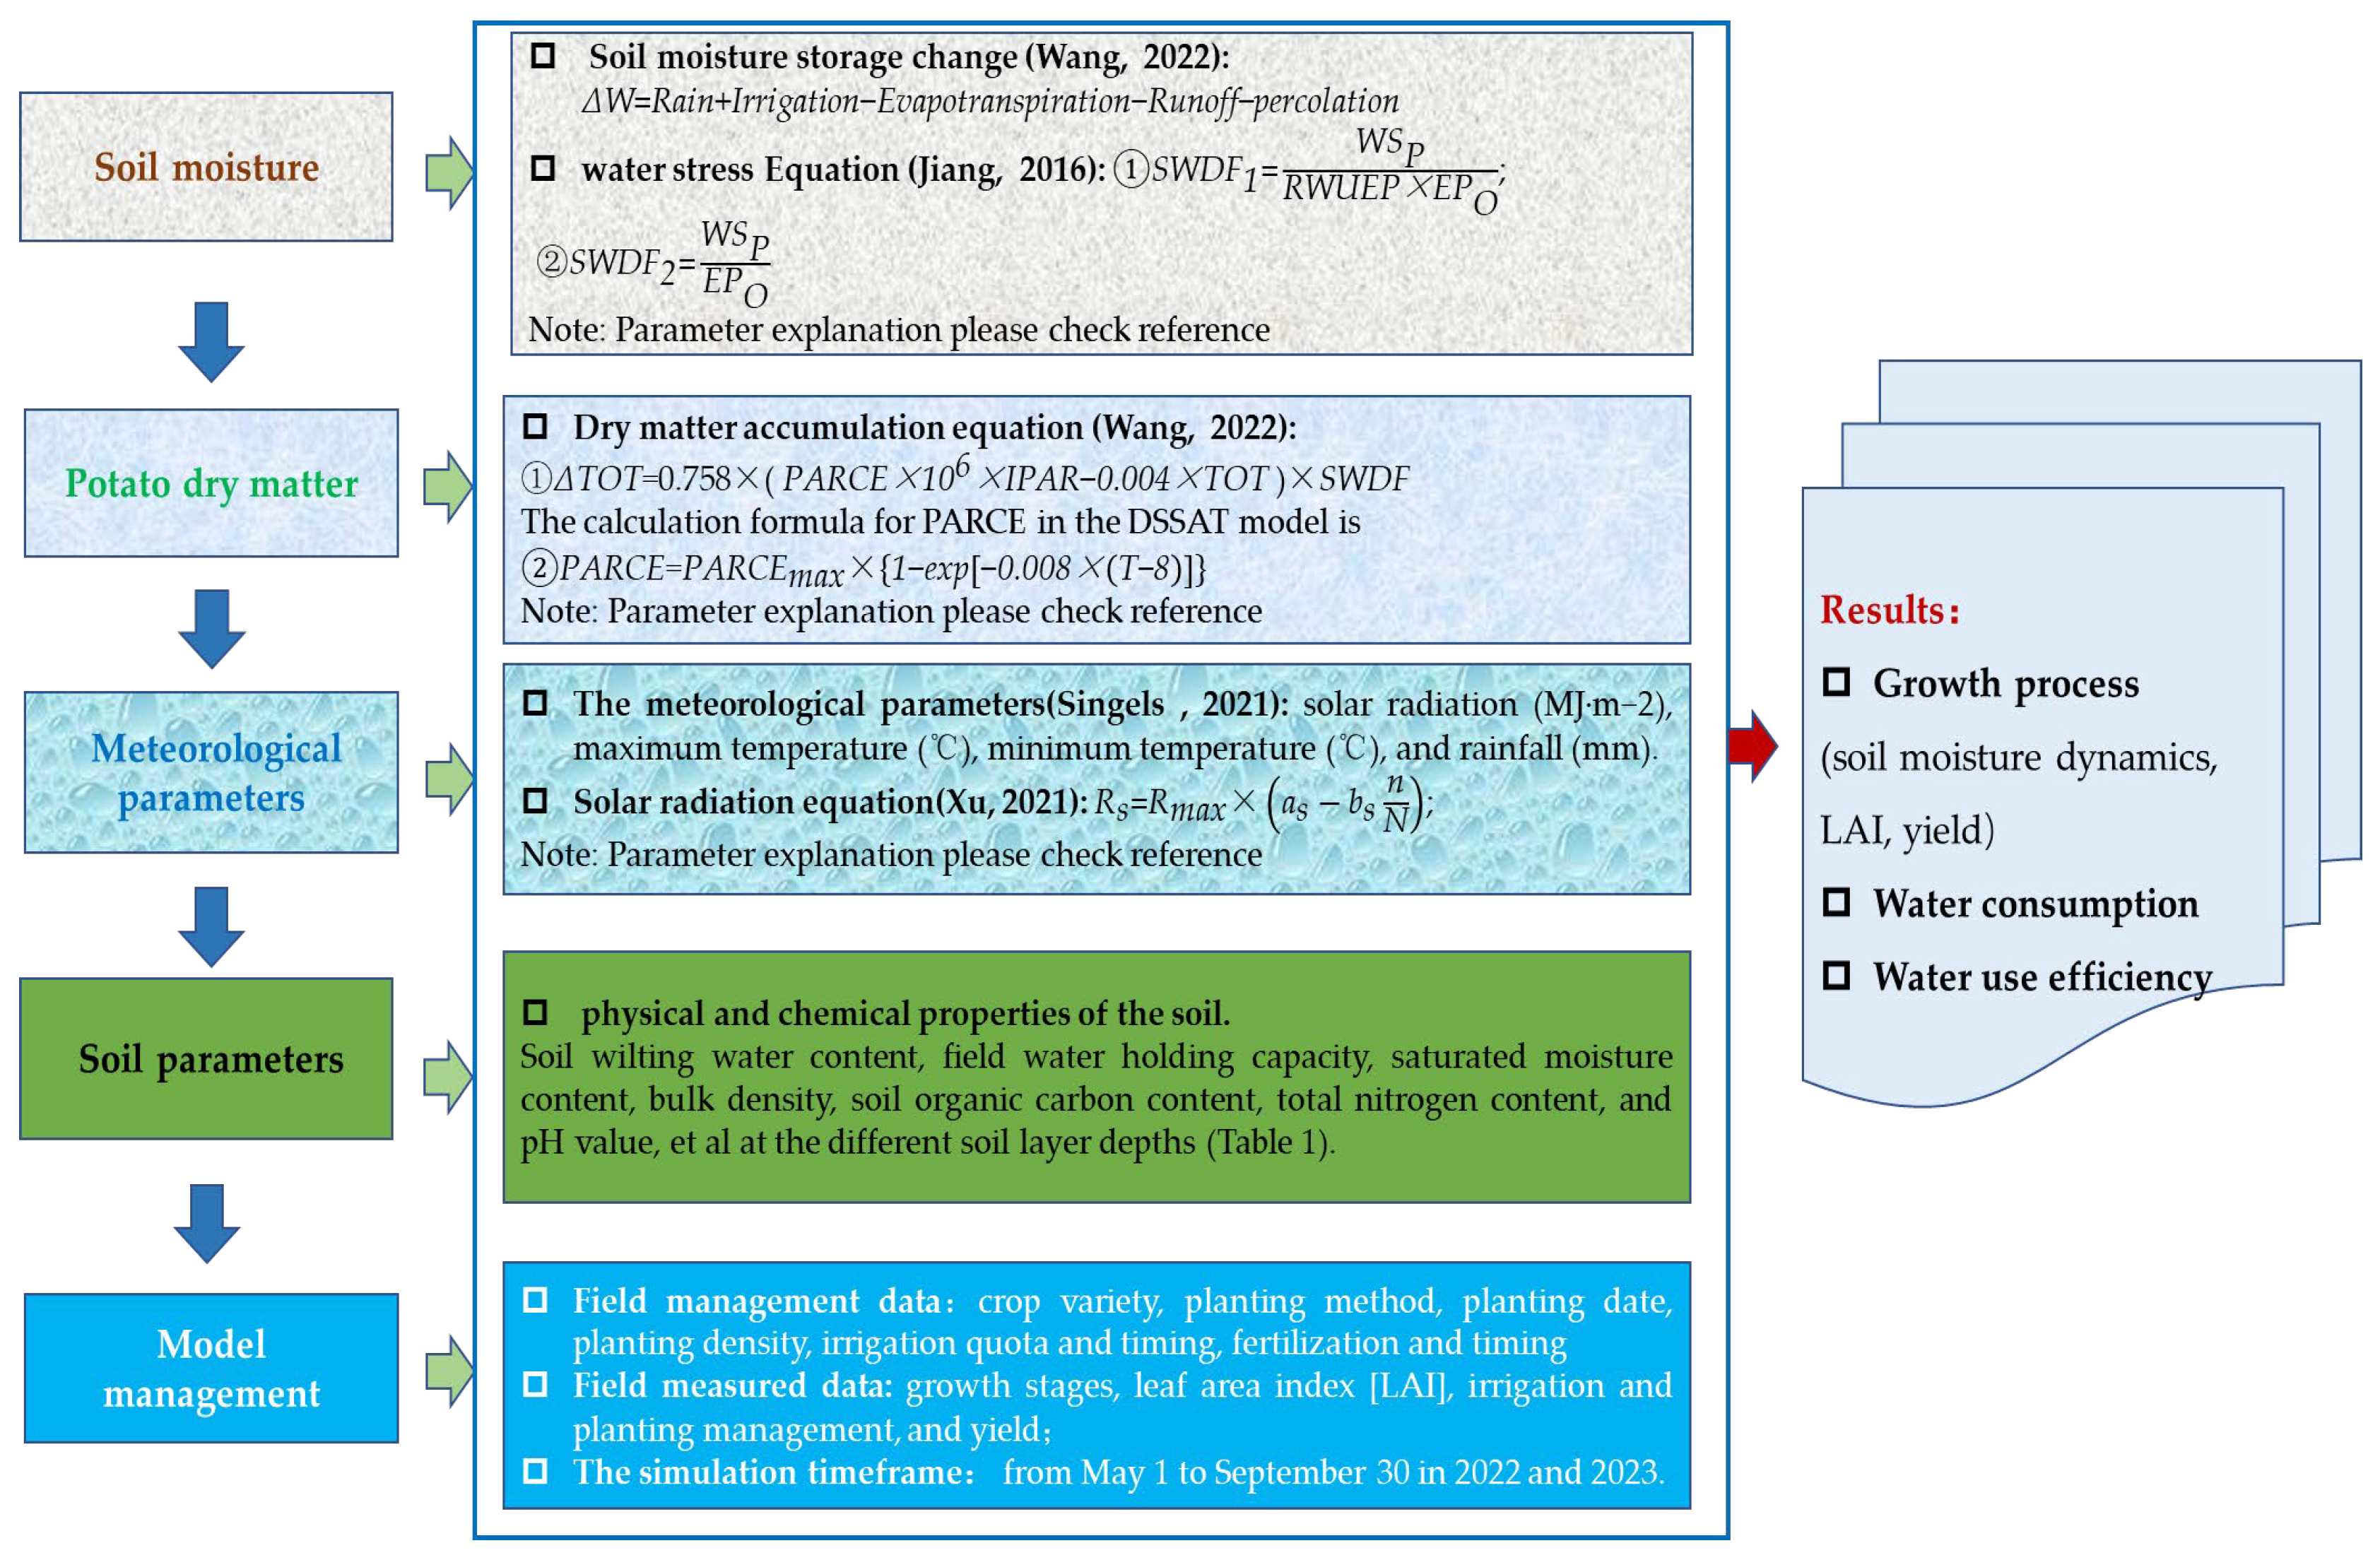
DSSAT model needed five parts to construct the model to simulate the growth process and water consumption characteristics of potatoes, including soil moisture, potato dry matter, meteorological parameters, soil parameters, and management data [20,21,22,23,24]. We not only used the DSSAT model to simulate the growth process of irrigated potatoes, but also the growth process of rain-fed potatoes. The model of rain-fed potato was constructed, except for not adding irrigation time, frequency, and water quantity parameters in the model, all other parameters were consistent with those used for modeling irrigated potatoes (Figure 6).
The meteorological parameters required for the DSSAT model include solar radiation (MJ/m2), maximum temperature (°C), minimum temperature (°C), and rainfall (mm). The field management parameters required by the model include crop variety, planting method, planting date, planting density and depth, irrigation quota and timing, and fertilization amount and timing, among others (Figure 6).

2.4.3. Sensitivity Analysis

There were many parameters involved in crop growth models, and parameter diversity was the main source of uncertainty in crop growth process models. Analyzing the uncertainty and sensitivity of model parameters helped to understand the impact of model structure and parameters on the output variables of the model. Sensitivity analysis of parameters mainly observes changes in soil moisture content, leaf area index, and yield by increasing or decreasing the percentage of parameters. When the parameter changed proportionally, the greater change in the output of the model simulation results, the more sensitive the parameter was to the model simulation. This study selected 8 important input parameters (variety, soil, meteorology, field management, etc.) for DSSAT-SUBSTOR-Potato and used Latin Hypercube Sampling (LHS) to generate samples. The parameter selection was based on the physiological characteristics of potatoes and the DSSAT model parameter manual.

2.4.4. Uncertainty Analysis Method

The uncertainty of data may bring uncertainty to the final model results; therefore, it was important to conduct uncertainty analysis to the model results. This study used the d-factor index to analyze the uncertainty of the DSSAT model. The d-factor value was high, which indicate that the uncertainty of the model results was strong. The formula is as follows:
d x ¯ = 1 n i = 1 n X Ui X Li
d - factor = d x ¯ σ x
where d x ¯ is the average distance between the upper limit (XU) and lower limit (XL) of the indicator, which is the average distance of the confidence interval (considering a 95% confidence level in this study); n is the number of datasets; σ x is the standard deviation of the observed value.

2.4.5. Calibration and Validation

This study employed the Absolute Relative Error (ARE) and Normalized Root Mean Square Error (nRMSE) to quantify deviations between simulated and observed values from the DSSAT model [25,26,27]. In general, a lower ARE value (closer to 0) reflects higher simulation accuracy for the target variable, while an nRMSE below 10% is considered indicative of excellent model performance [28]. Furthermore, the Coefficient of Determination (R2) was used to evaluate the agreement between simulated and measured results. Values of R2 closer to 1 represent stronger consistency between the datasets. The formulas for these evaluation metrics are given below:
  A R E = S i M i M i × 100 %
  R M S E = i = 1 n M i S i 2 n
n R M S E = R M S E M × 100 %
R 2 = i = 1 n M i M S i S 2 i = 1 n M i M 2 i = 1 n S i S 2
where Mi represents the observed value, Si denotes the simulated value, M is the mean of the measured values, S is the mean of the simulated values, and n is the sample size.

2.5. Evaluated Indictor of Potato Irrigation Efficiency

The water balance equation was constructed to calculate the water consumption of potatoes during the growth period [29]. The water use efficiency (WUE, kg/m3) and irrigation water use efficiency (IWUE, kg/m3) of potatoes were calculated following previous research studies [30,31].

3. Results

3.1. Sensitivity Analysis and Uncertainty Analysis

3.1.1. Uncertainty Analysis

To investigate the effects of each parameter of the model on output such as soil moisture content, leaf area index, and yield, this study conducted parameter sensitivity analysis (Table 4).
The direct influencing factors of soil moisture content were soil-available moisture content (SOL-AWC) and total irrigation amount (IRRIG), which contributed 64.1% to soil moisture content. SOL-AWC determined soil water retention capacity, while IRRIG directly supplemented the water requirements during the critical growth period of potatoes. The sensitivity of soil moisture content to other parameters was relatively low.
The factors with the highest sensitivity to leaf area index (LAI) were tuber potential growth rate (G3) and total solar radiation (SRAD), with a contribution of 58.9% to LAI. G3 determined the competitive ability of tubers for photosynthetic products. SRAD, as a source of photosynthetic energy, directly affected the formation of LAI peak.
The most sensitive factors for tuber yield were total nitrogen application rate (NAPP), potential tuber growth rate (G3), and soil available water content (SOL-AWC), which contributed 76.6% to yield. NAPP optimized plant nutrient supply and enhanced synthesis capacity; G3 increased dry matter accumulation; SOL-AWC ensured water supply to the potato.

3.1.2. Uncertainty Analysis

The uncertainty analysis of various parameters such as soil moisture content, leaf area index, and yield is shown in Table 5. Results showed the d-factor varied between 0.01 and 0.36, and the trend of parameter uncertainty was basically consistent with the trend of sensitivity analysis. For soil moisture content, the total irrigation water volume was the parameter with the greatest uncertainty. For the leaf area index, the parameter with the greatest uncertainty was total solar radiation. The potential growth rate and total nitrogen application rate of tubers were the parameters with the greatest uncertainty for yield.

3.2. Model Calibration and Validation

3.2.1. Model Calibration

This study utilized experimental data from 2022 for model calibration, with performance evaluated using the ARE, nRMSE, and R2. For potato leaf area index, the calculated ARE was 4.18%, nRMSE was 5.64%, and R2 was 0.88; for yield, the corresponding values were 4.89% (ARE), 6.57% (nRMSE), and 0.87 (R2) (Table 6). The accuracy indicators for potato soil moisture content (ARE, nRMSE, R2) ranged from 5.27 to 7.87, and from 0.86 to 8.65 for the 0–60 cm soil layer (Table 7). The calibrated genetic parameters of the potato are shown in Table 8. The parameter accuracy met the requirements of the model.

3.2.2. Model Validation

The calibrated genetic parameters of the potato (Table 8) were input into the DSSAT model to validate the model using measured data in 2023, including soil moisture content, LAI, and yield. For soil moisture, R2 was 0.905. For leaf area index, R2 was 0.915. For yield, R2 was 0.921. The simulated values of soil moisture, leaf area index, and yield were in good agreement with the measured values (Figure 7).

3.3. Dynamics of Soil Moisture, Leaf Area Index, and Potato Yield

(1) Soil moisture content
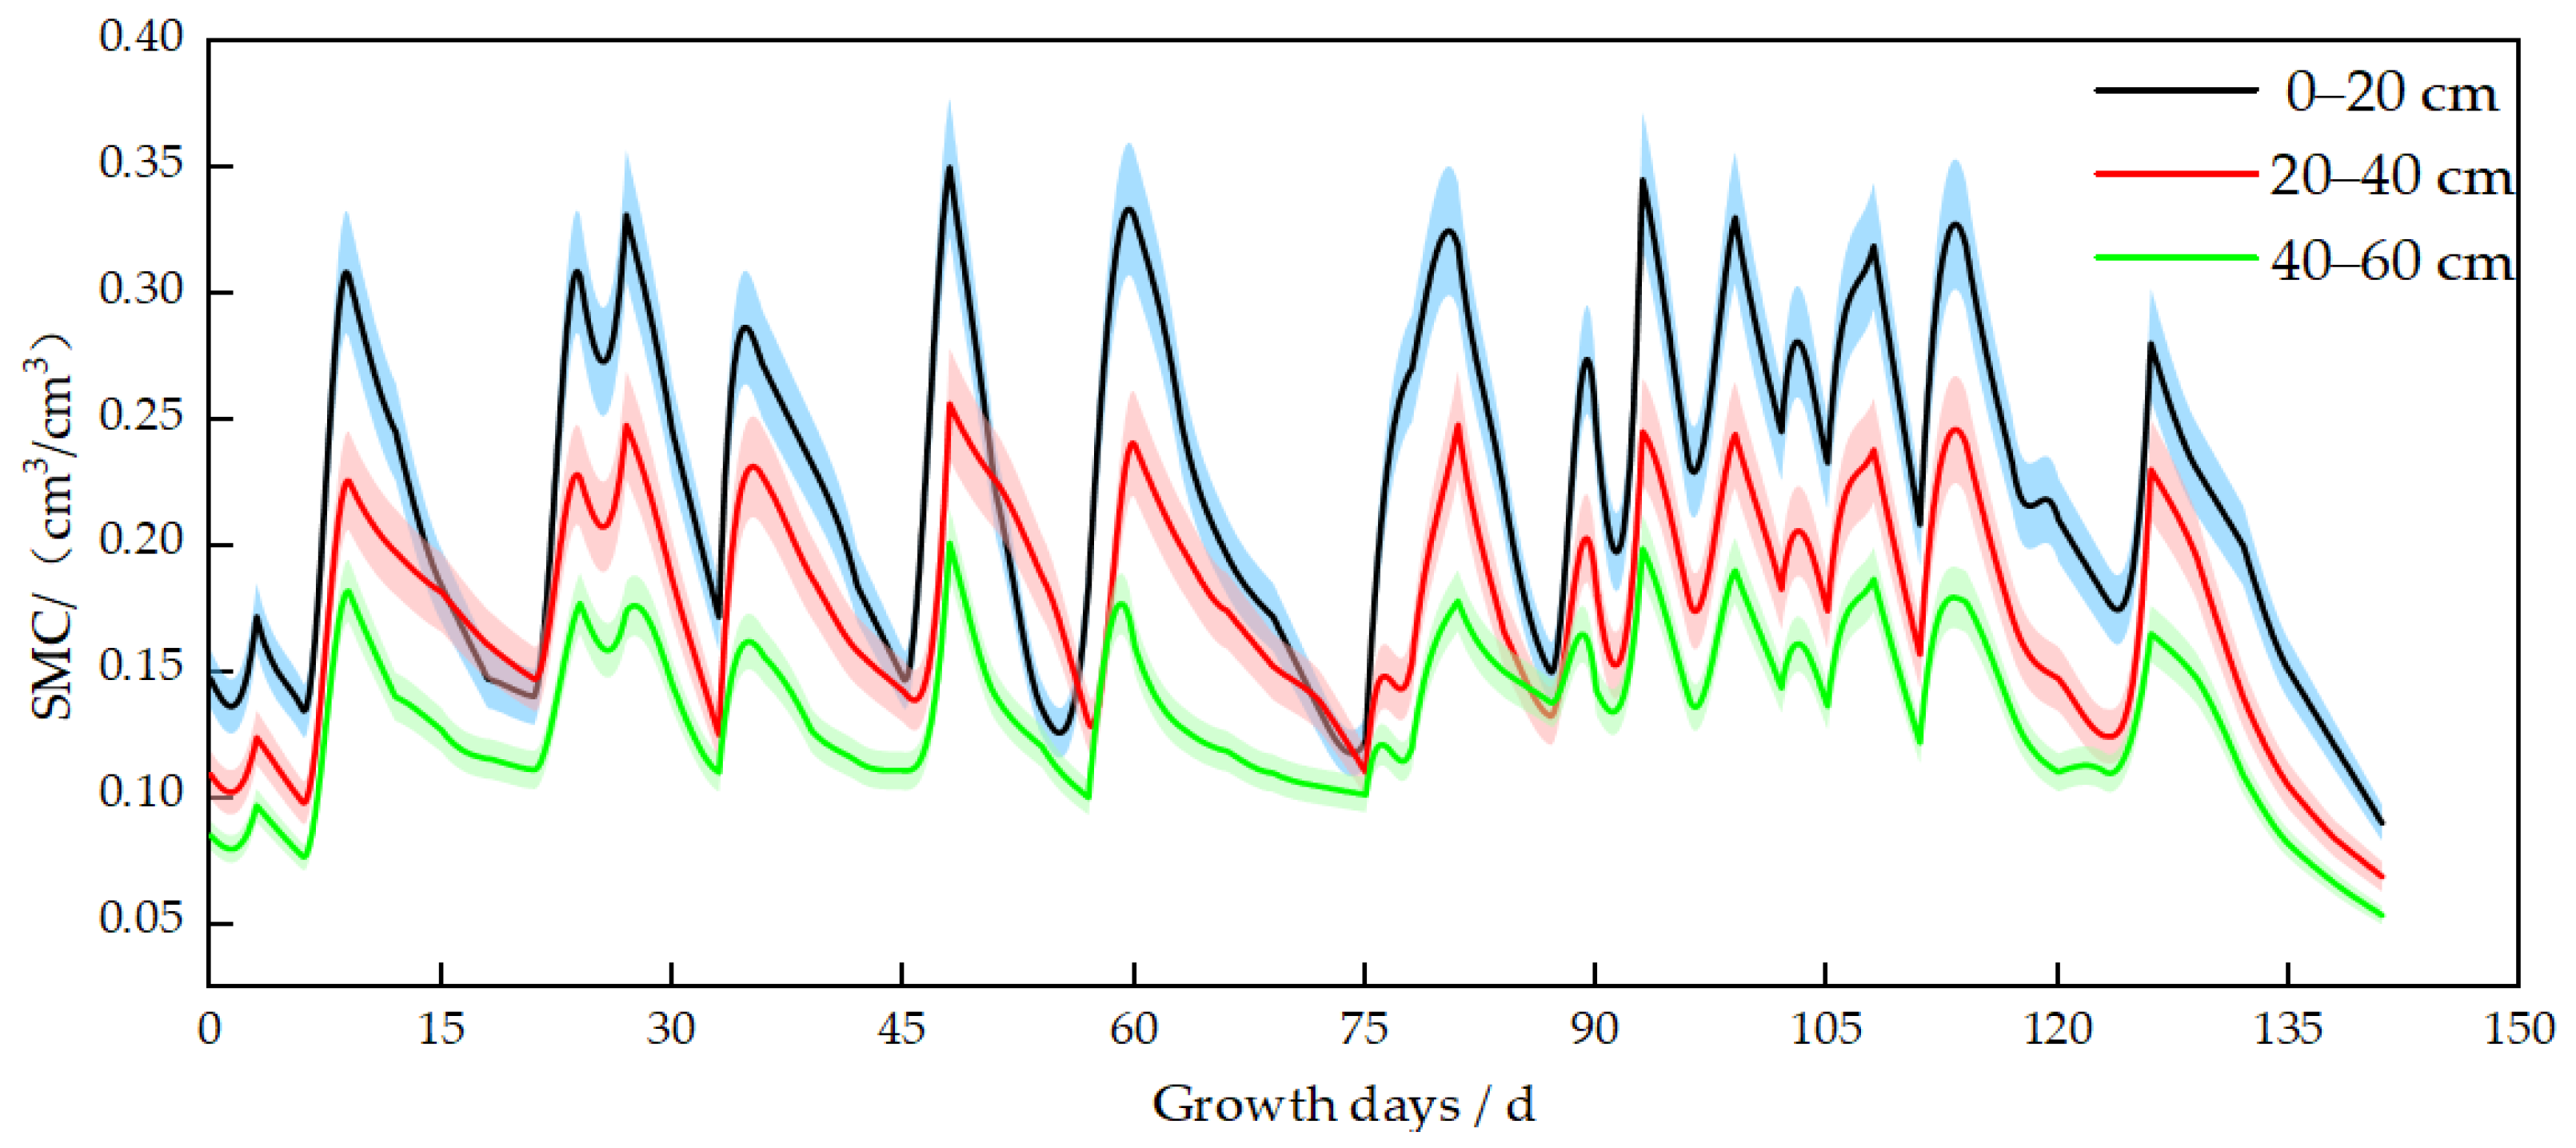
Since 2022 and 2023 were considered normal years, precipitation, irrigation, and soil moisture content were similar. This study selected the simulated data from 2023 to analyze the dynamic characteristics of soil moisture, leaf area index (LAI), and yield. In 2023, there were eight irrigation events for potatoes. During the rapid growth stage (45–75 days after planting), the soil water content in the 0–20 cm layer was reduced by approximately 60–66% (mean ± SE: 63 ± 1.8%), in the 20–40 cm soil layer decreased by 52–60% (mean ± SE: 56 ± 1.5%), and in the 40–60 cm soil layer decreased by 42–51% (mean ± SE: 46.5 ± 1.6%;) after an irrigation event until the next irrigation event was performed. During the middle growth stage (75–95 days after planting), the soil moisture decline in the 0–20 cm layer was about 53–59% (mean ± SE: 56 ± 1.4%), 43–48% (mean ± SE: 45.5 ± 1.2%) in the 20–40 cm layer, and 35–40% (mean ± SE: 37.5 ± 1.1%) in the 40–60 cm layer. Moisture loss during the rapid growth stage was found to be 7–12% higher than that during the mid-growth stage (mean ± SE: 9.5 ± 0.9%; Figure 8).
(2) Leaf Area Index
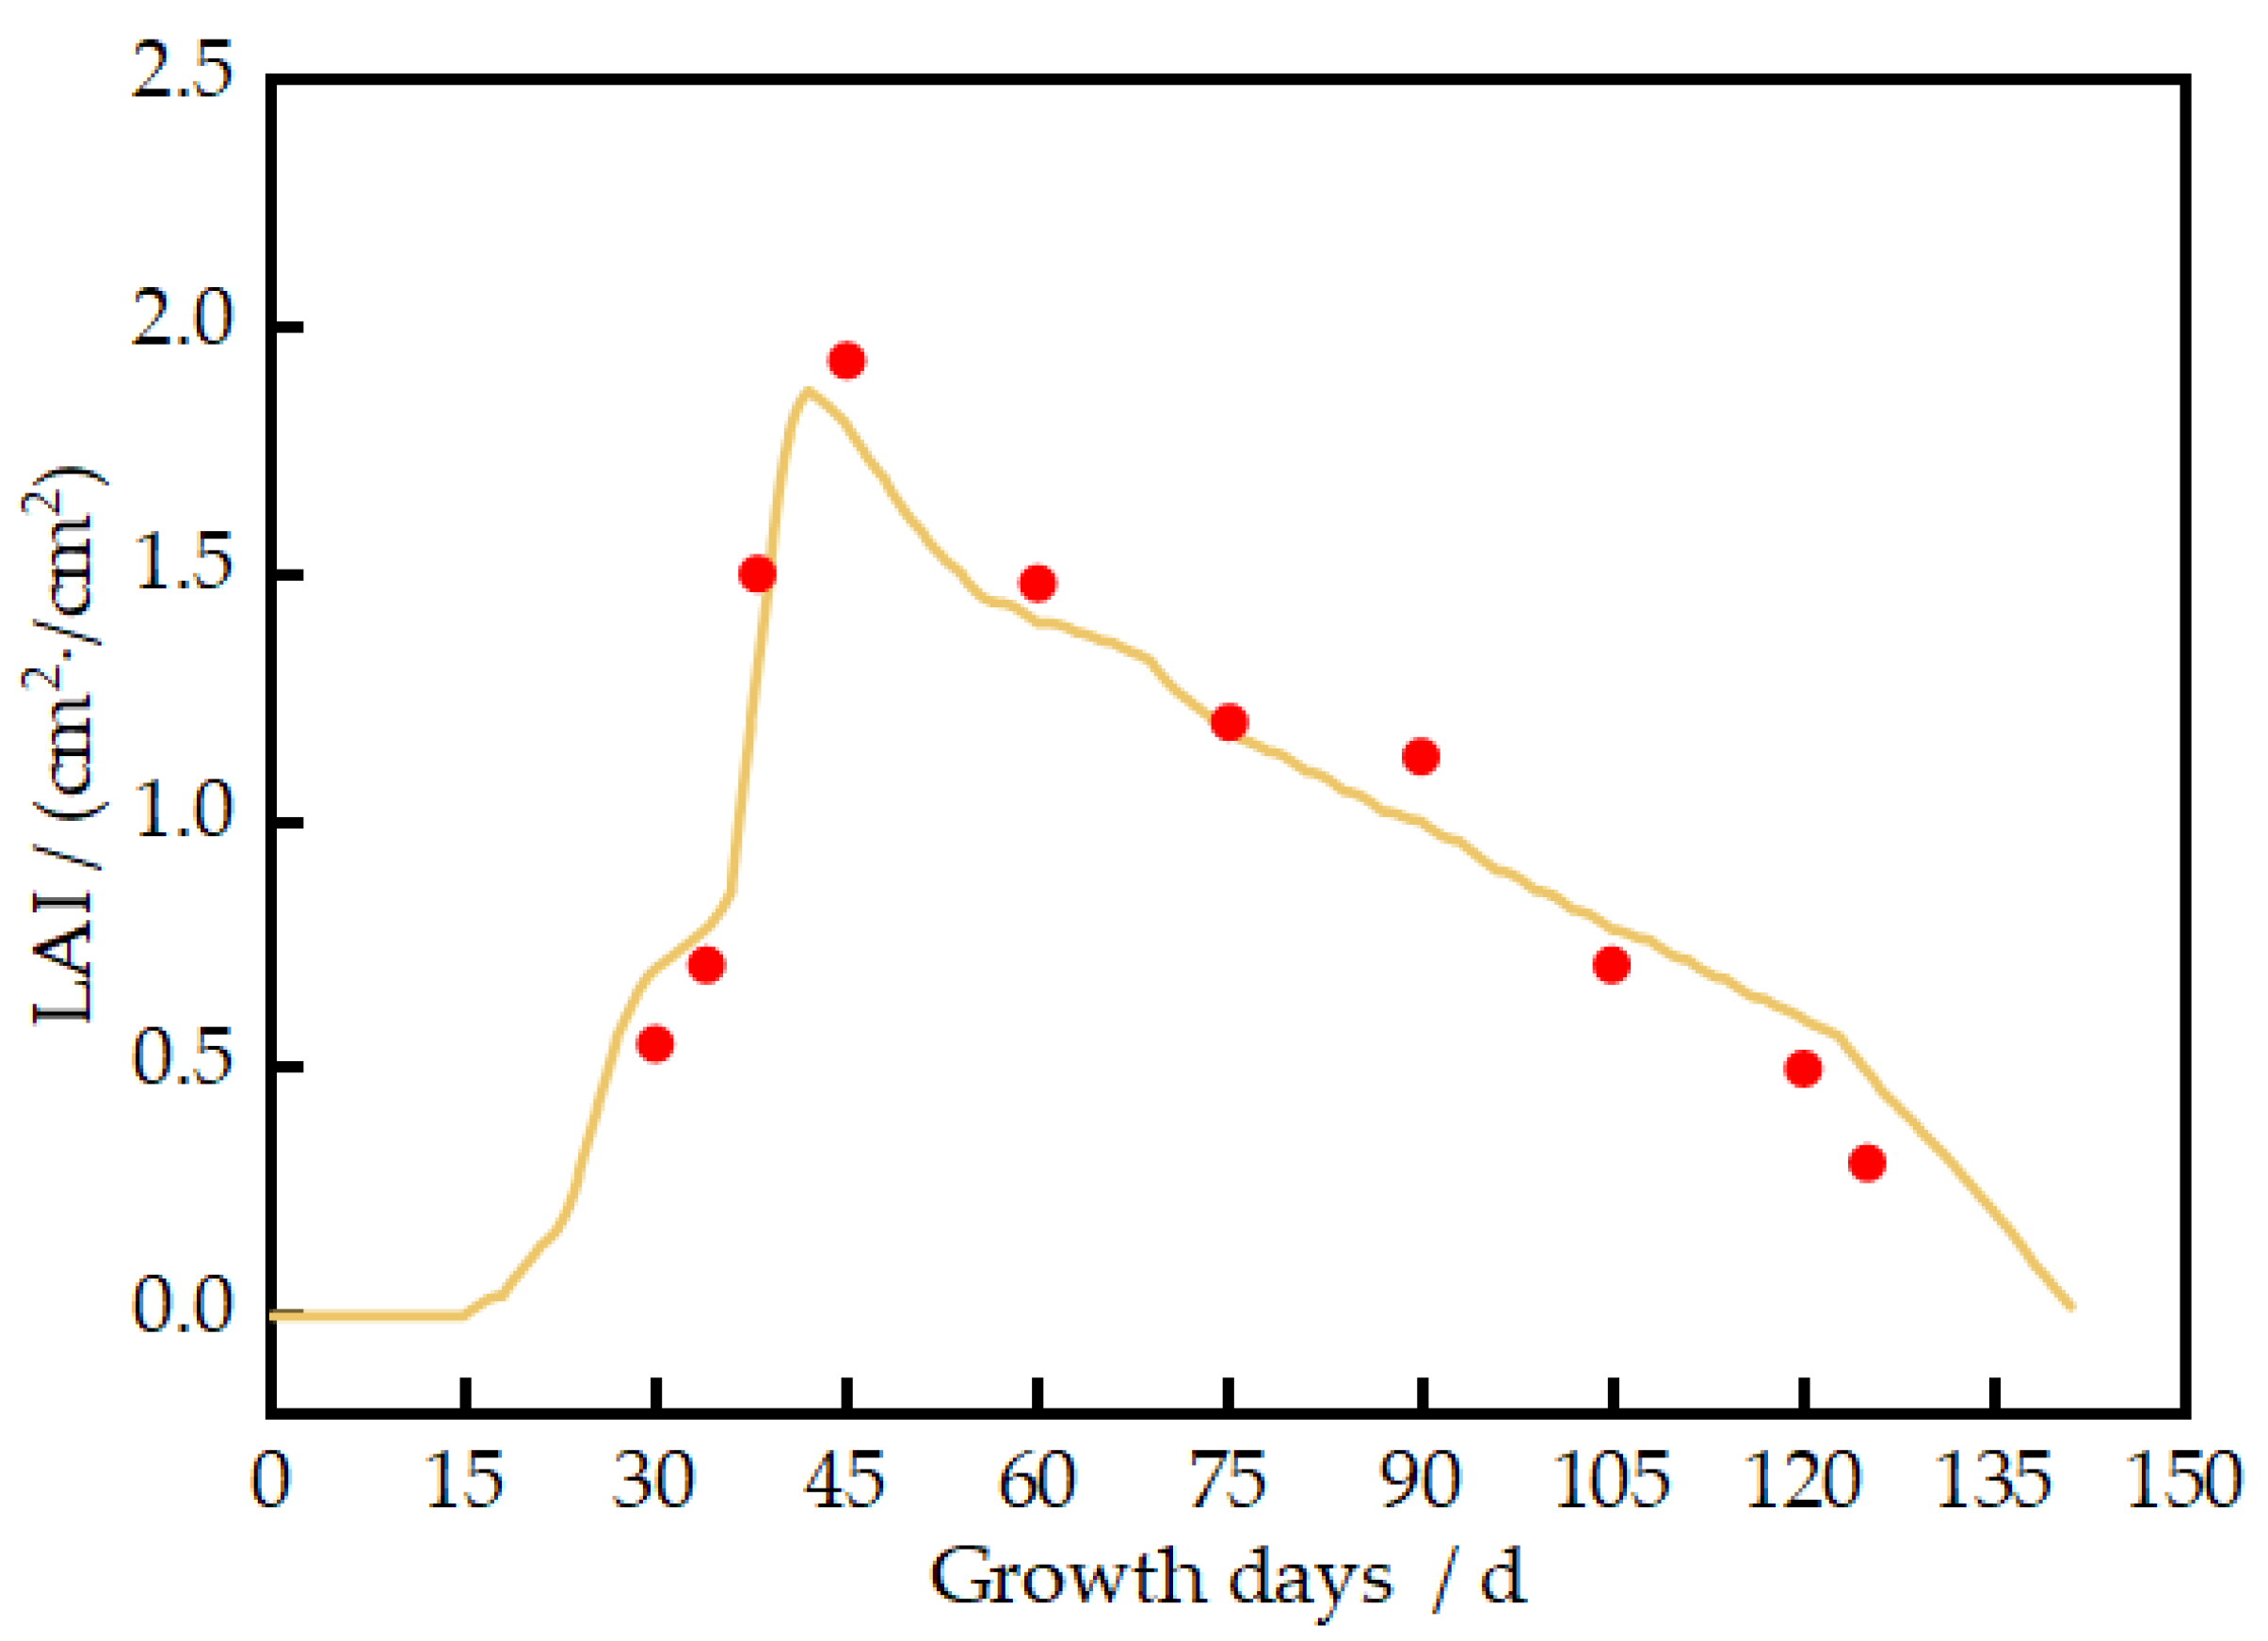
The potato leaf area index (LAI) reached its peak 30–45 days after planting, which aligned with the rapid decline in soil water content, indicating a higher water demand during this stage (Figure 9).
(3) Yield
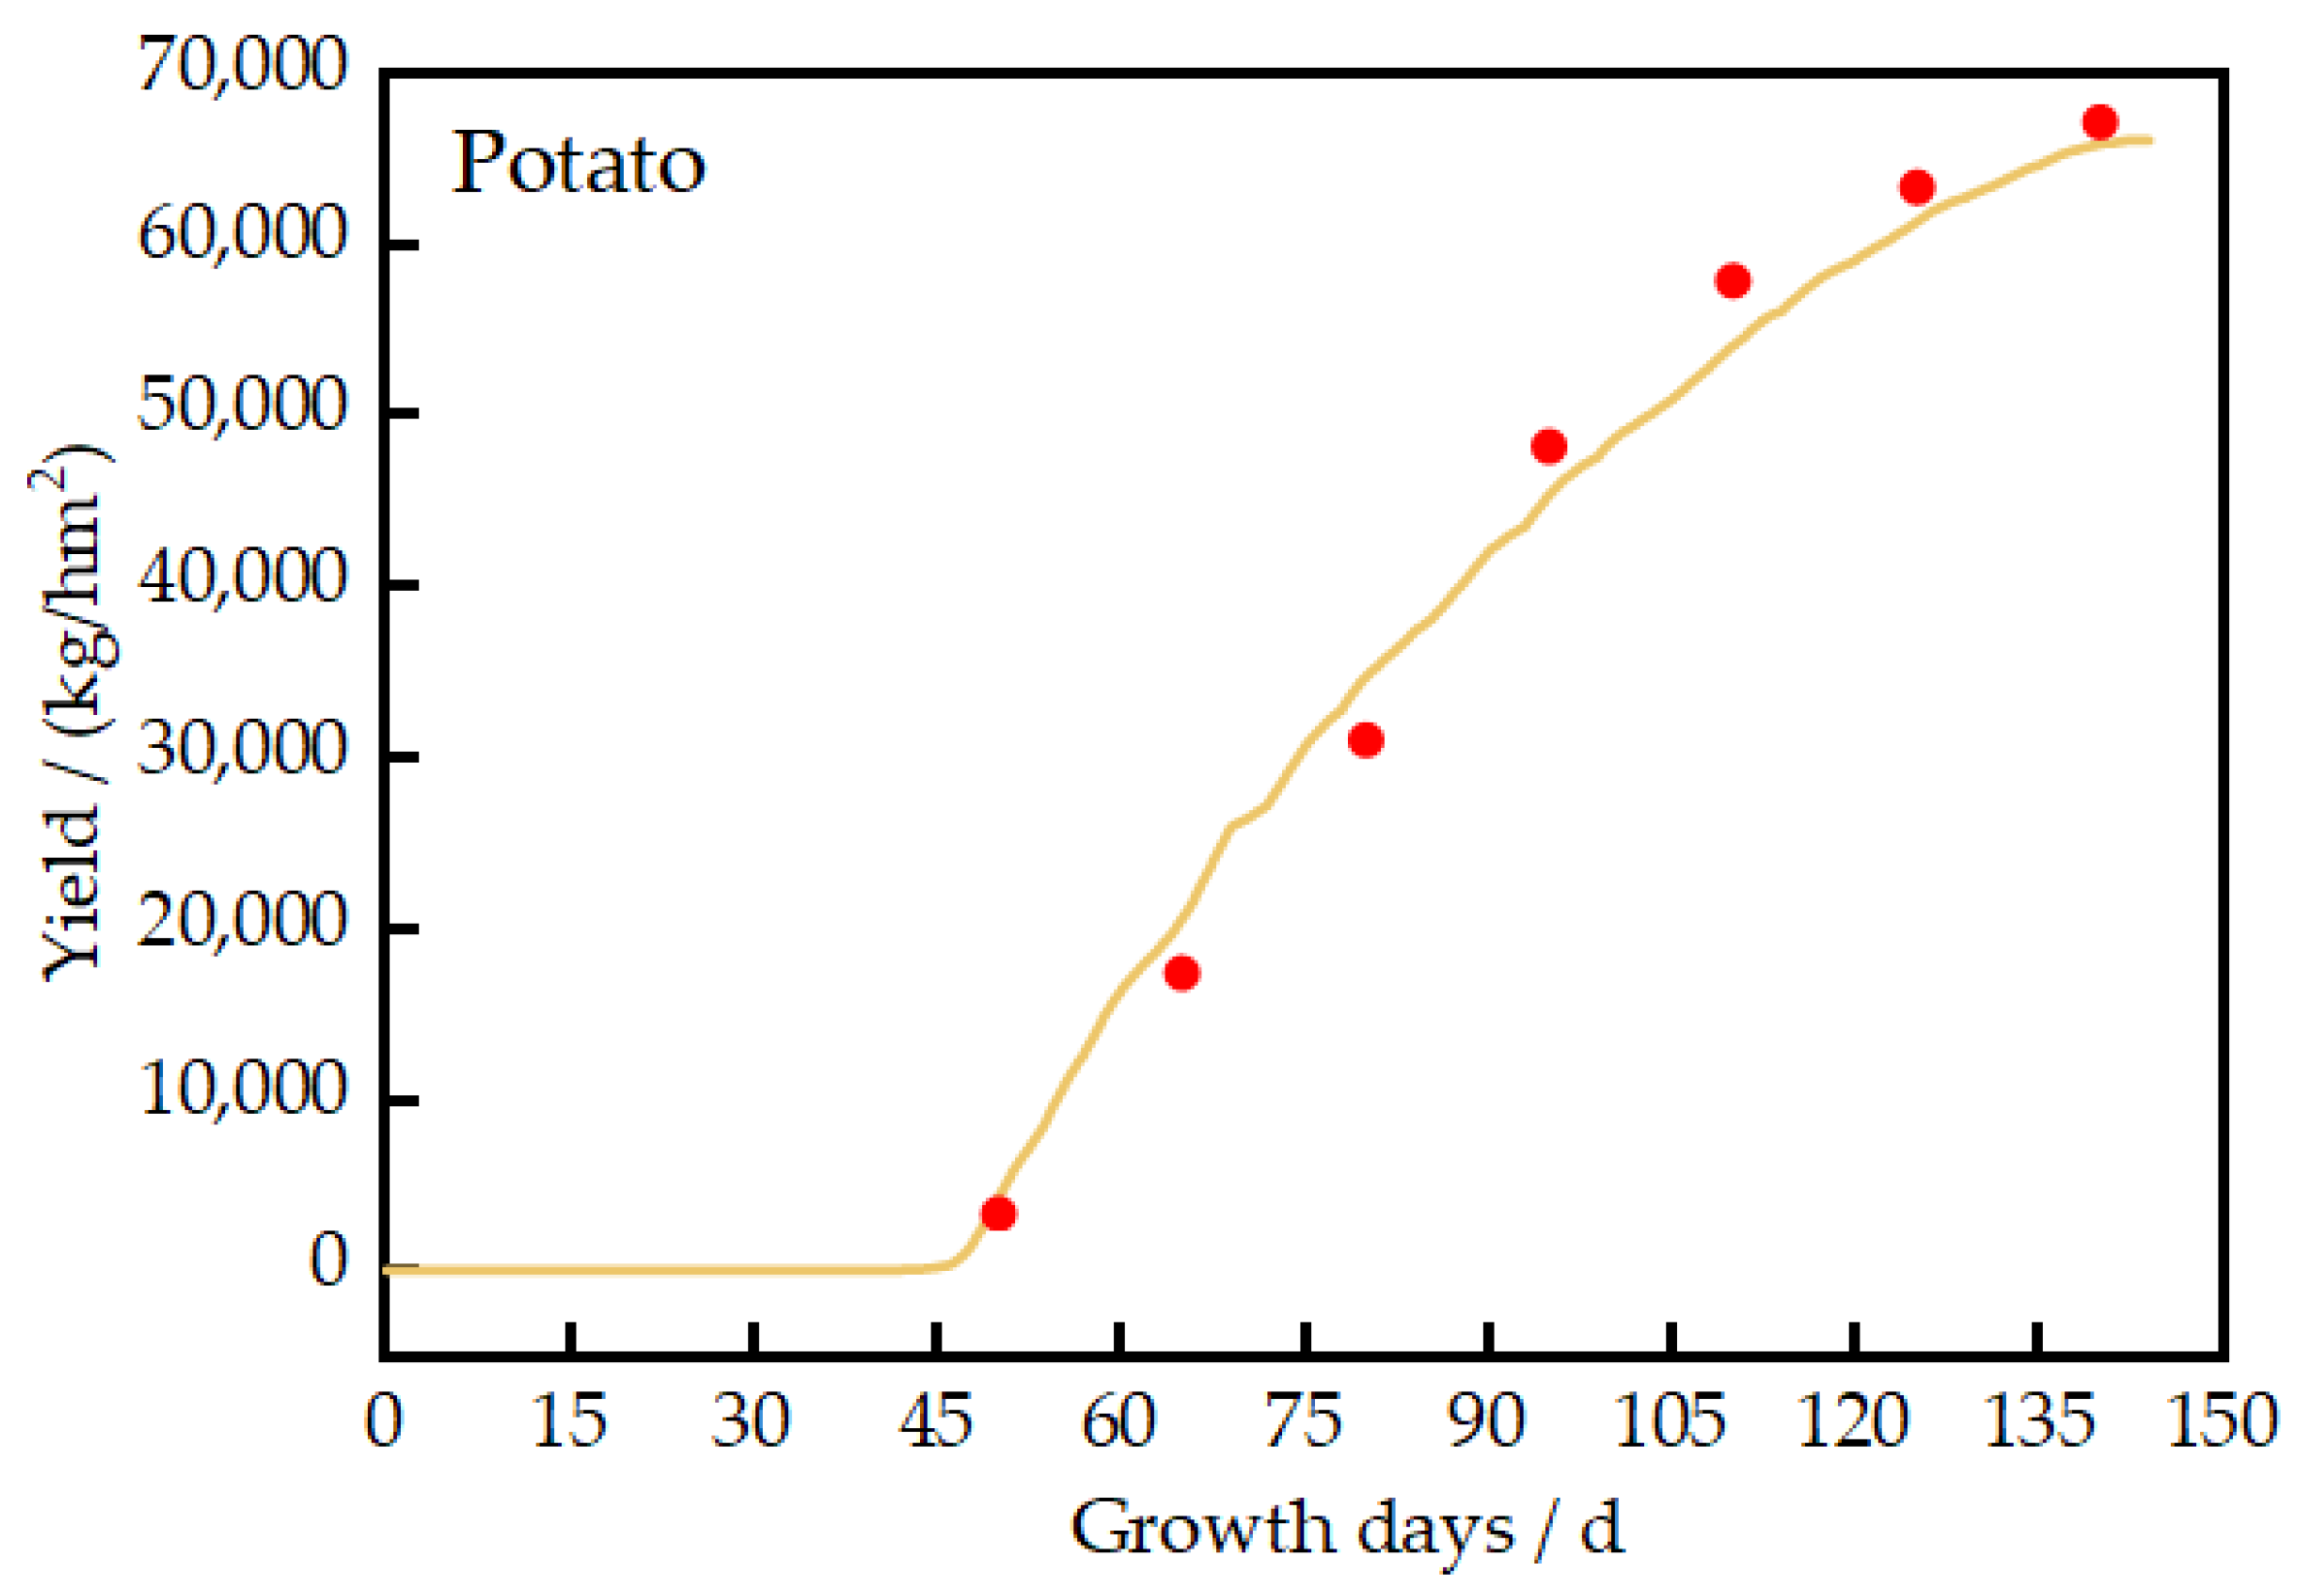
Potato yield rapidly increased during the tuber formation and swelling period (55–105 days after planting), during which soil moisture decreased rapidly. The yield of potatoes was almost 67,000 kg·hm−2 (Figure 10).

3.4. Water Consumption Patterns of Potatoes

According to Table 9, the water consumption during the growth stages of potatoes was 375.2 mm in 2022 and 414.2 mm in 2023. The percentage of total water consumption in each growth stage was as follows: sowing–emergence 13–15%, emergence–formation stage 24–25%, formation–bulking stage 50–52%, and bulking–maturity 10–11%. The daily potato water consumption intensity in 2022 and 2023 varied between 2.62 and 2.81 mm.

3.5. Water Balance Estimation and Water Use Efficiency Evaluation for Potatoes

3.5.1. Water Balance Estimation for Potatoes

The percolation water amounts for potatoes were 24.7 mm in 2022 and 22.7 mm in 2023. For 2022, soil evaporation accounted for 68% of total evapotranspiration and potato transpiration accounted for 32%, while in 2023, these two components contributed 57% and 43% to total evapotranspiration, respectively (Table 10).

3.5.2. Water Use Efficiency Evaluation of Potatoes

Based on the water use efficiency (WUE) and irrigation water use efficiency (IWUE) indicators, the relationship between potato yield and water consumption was analyzed. The calculation results (Table 11) showed that the WUE of potatoes ranges from 162.17 to 166.20 kg/hm2·mm, while the IWUE ranges from 86.1 to 108.1 kg/hm2·mm. For every 1 mm of water consumption, approximately 162.17–166.20 of potatoes can be produced per hectare. For every 1 mm of groundwater consumed, about 8.61–10.81 kg of potatoes are generated per hectare.

3.6. Optimization of Potato Irrigation Strategies Under Different Hydrological Conditions

3.6.1. Classification of Hydrological Years

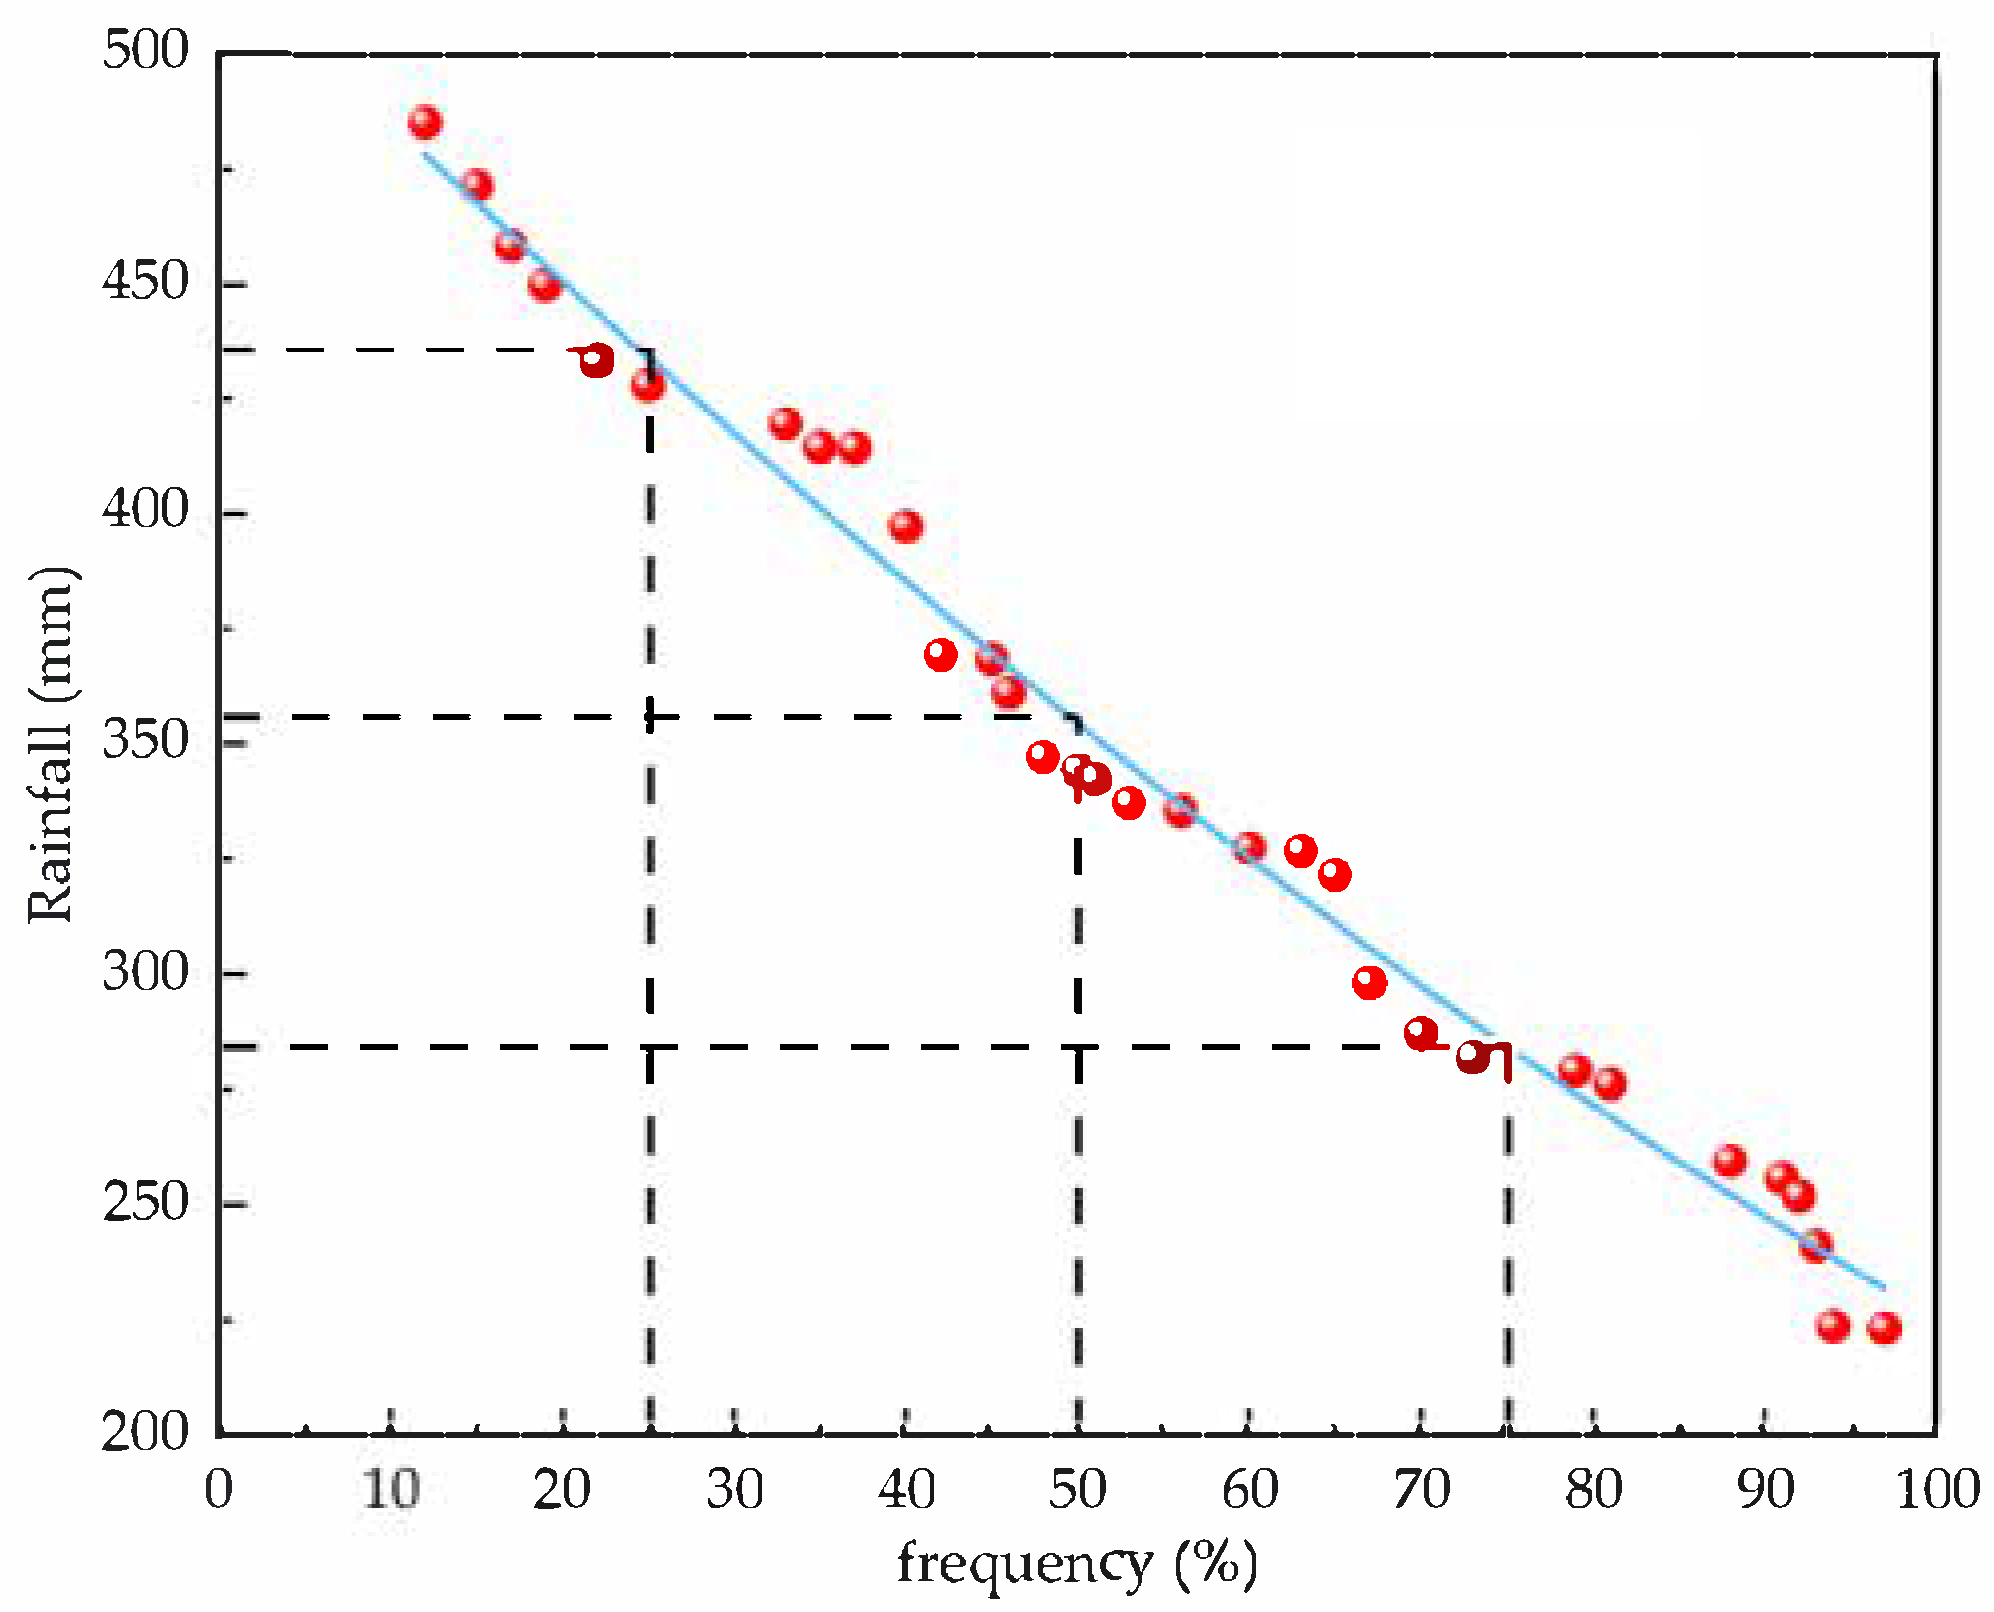
The frequency method was used to analyze the rainfall data from 1991 to 2023. Based on the frequency analysis results, the years were divided into wet years, normal years, and dry years. When p ≤ 25%, it was considered a wet year; 25% < p < 85% was considered a normal year; and p ≥ 85% was considered a dry year. The calculation formula is as follows:
P i   = m n + 1 × 100 %
With the application of hydrological frequency calculation software, the Pearson Type III curve was used to analyze the rainfall data from 1991 to 2023. Figure 10 shows the rainfall frequency curve, from which it can be seen that the precipitation in wet years is 419.4–485.2 mm, in normal years 259.4–414.4 mm, and in dry years 223.2–255.8 mm.
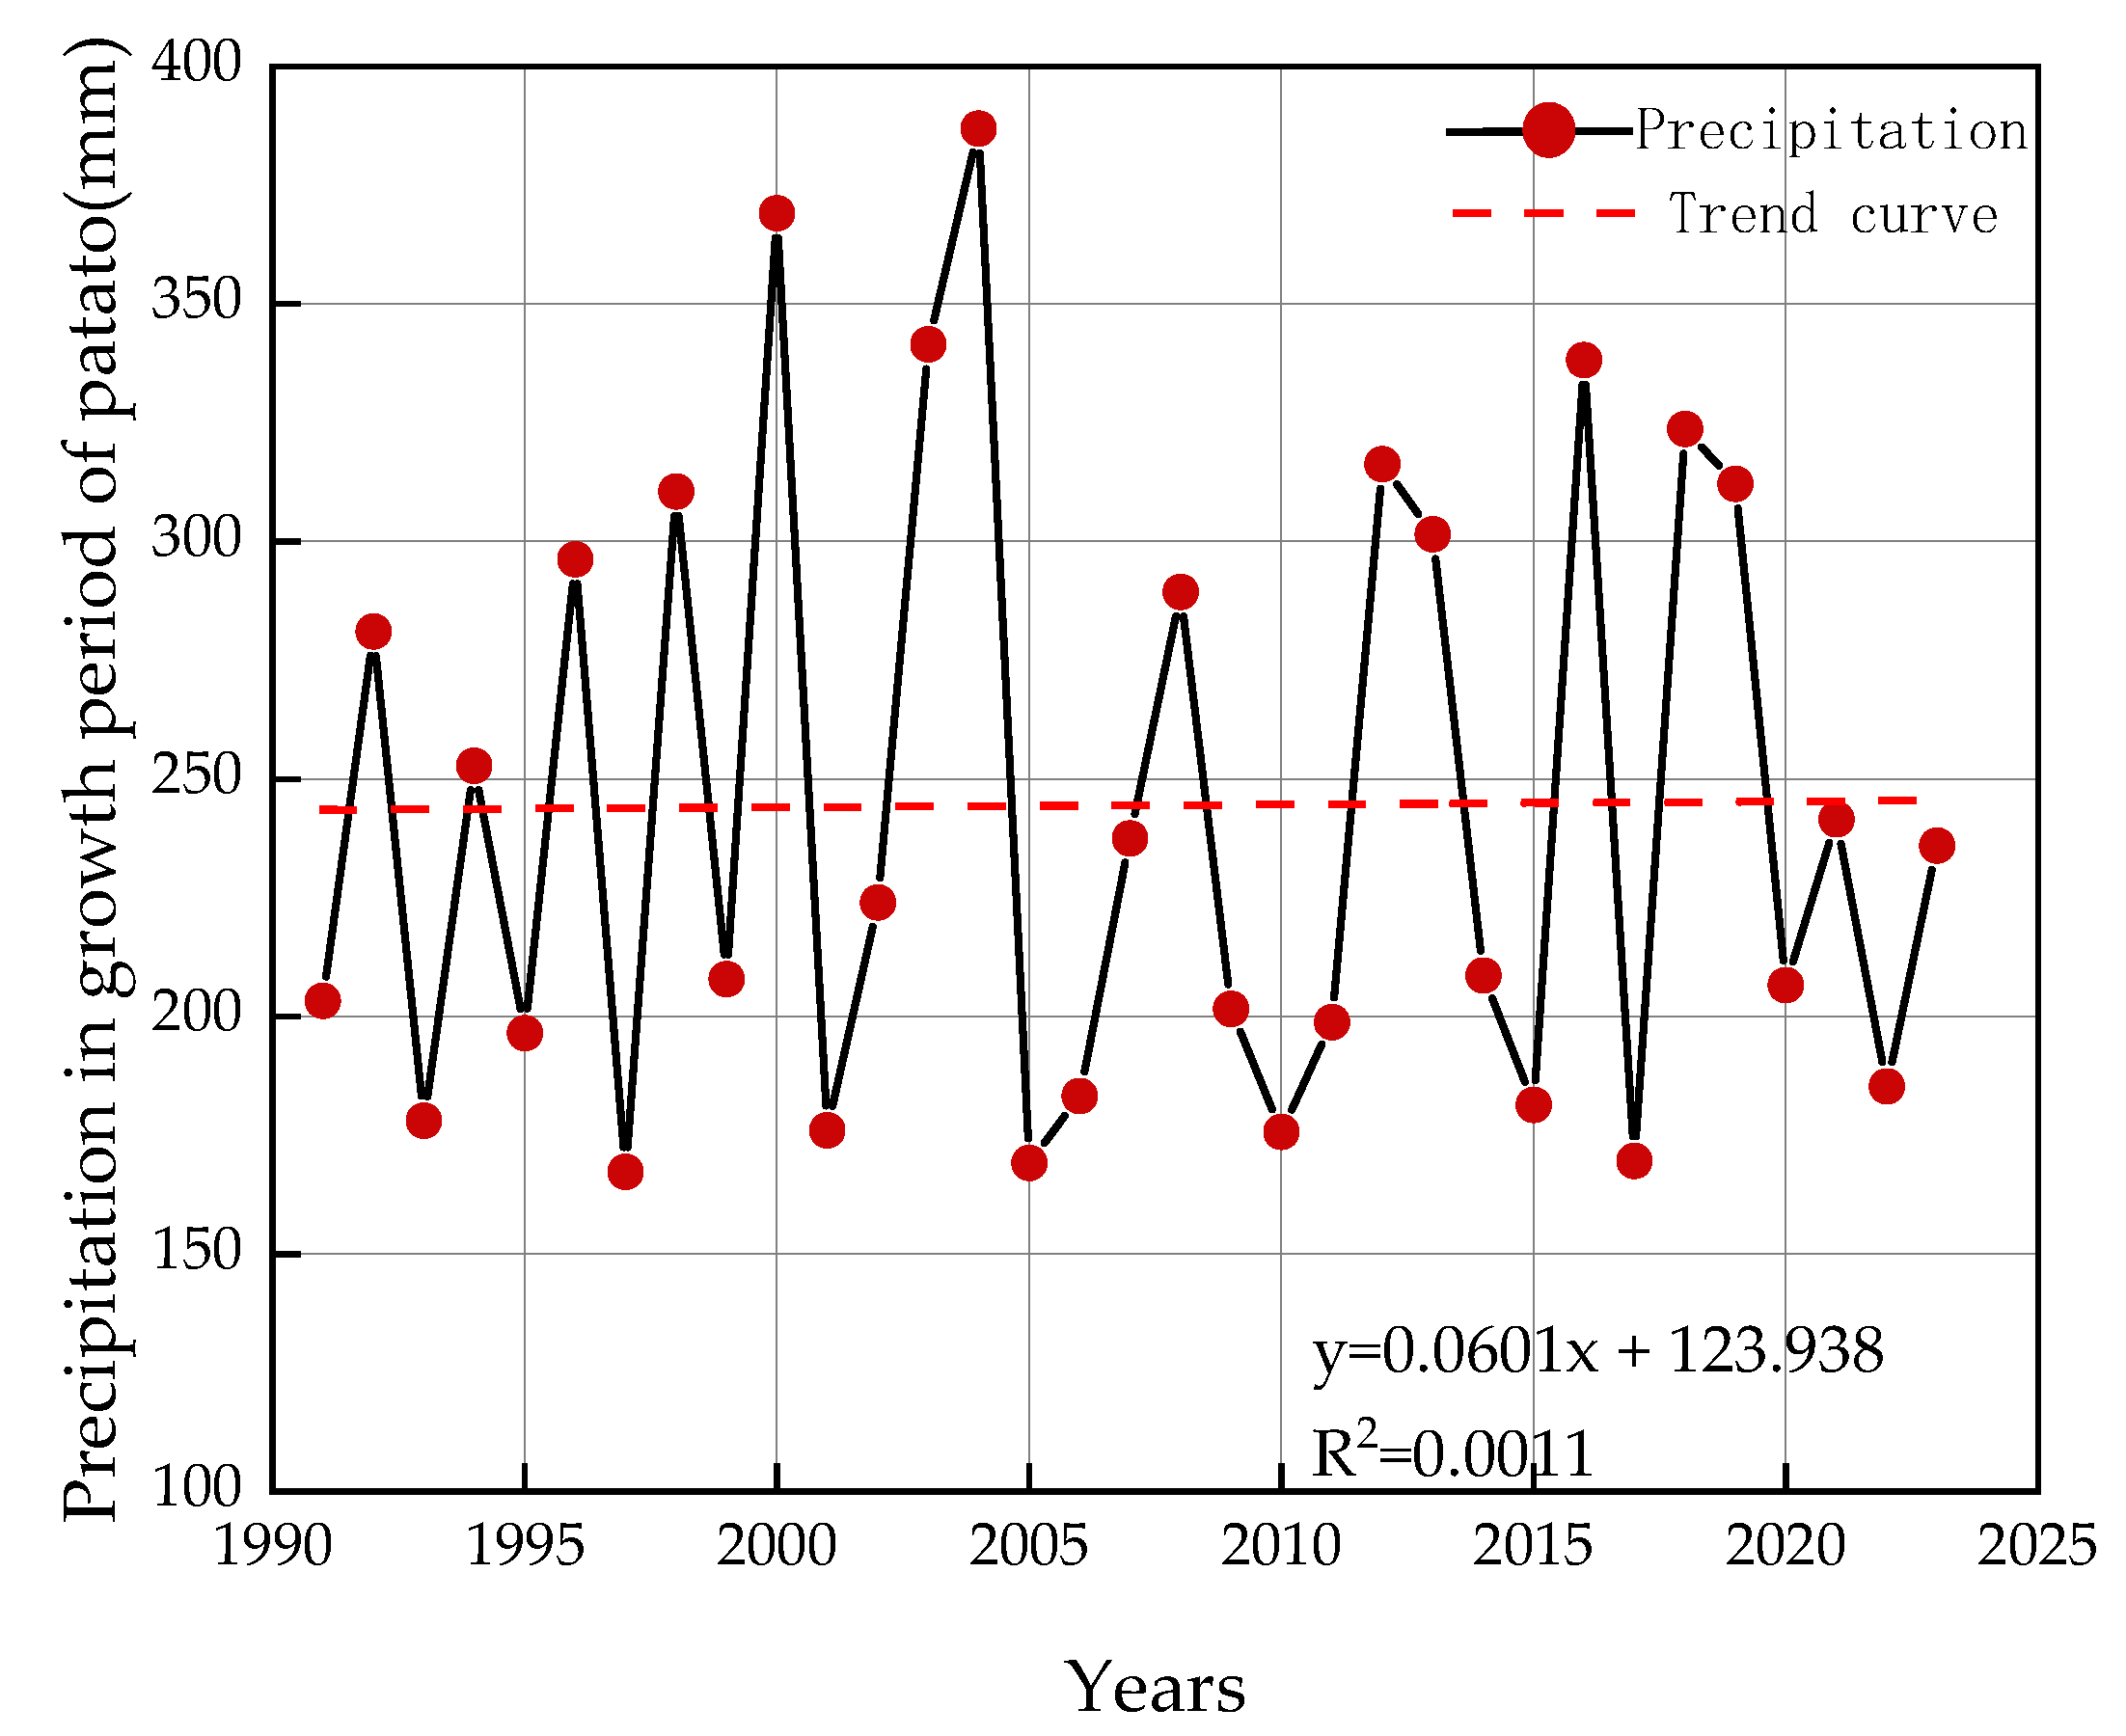
The 33-year period (1991–2023) was categorized as follows: 8 wet years (p ≤ 25%): 1992, 1998, 2003, 2008, 2013, 2014, 2016, 2018; 20 normal years (25% < p < 85%): 1991, 1993, 1994, 1995, 1996, 1997, 2000, 2001, 2004, 2005, 2009, 2010, 2011, 2012, 2015, 2017, 2019, 2020, 2021, 2023; and 5 dry years (p ≥ 85%): 1999, 2002, 2006, 2007, 2022 (Figure 11).

3.6.2. Analysis of Precipitation Patterns During Potato Growing Season

Based on hydrological year classification and statistical analysis of precipitation data from 1991 to 2023, the average rainfall during the potato growing season was 244.5 mm over the 33-year period. The maximum precipitation of 386.9 mm was recorded in 2004, while the minimum of 167.3 mm occurred in 1997. Analysis of wet, normal, and dry hydrological years revealed corresponding rainfall amounts of 341 mm, 249 mm, and 173 mm, respectively (Figure 12).

3.6.3. Evaluating Potato Irrigation Management Approaches Under Different Hydrological Conditions

Based on precipitation and water consumption in different hydrological years, irrigation water was reasonably allocated to achieve efficient farmland irrigation management. Based on the local farmers’ actual irrigation methods and the Water Quota for Industries in Inner Mongolia Autonomous Region (DB15/T 385-2020), irrigation quotas for potatoes under different hydrological years were set. Optimal irrigation volumes of 180 mm for normal years and 240 mm for dry years were identified. To adapt to different hydrological conditions, various irrigation experimental combinations were designed to ensure different water supply scenarios. The specific irrigation schemes are shown in Table 12. For the normal (dry) year combination, simulation scenario 1 represented the basic irrigation water amount, simulation scenario 2 corresponds to 90% of the basic irrigation water amount, and simulation scenario 3 corresponds to 80% of the basic irrigation water amount.

3.6.4. Optimal Irrigation Water Volume in Different Hydrological Years

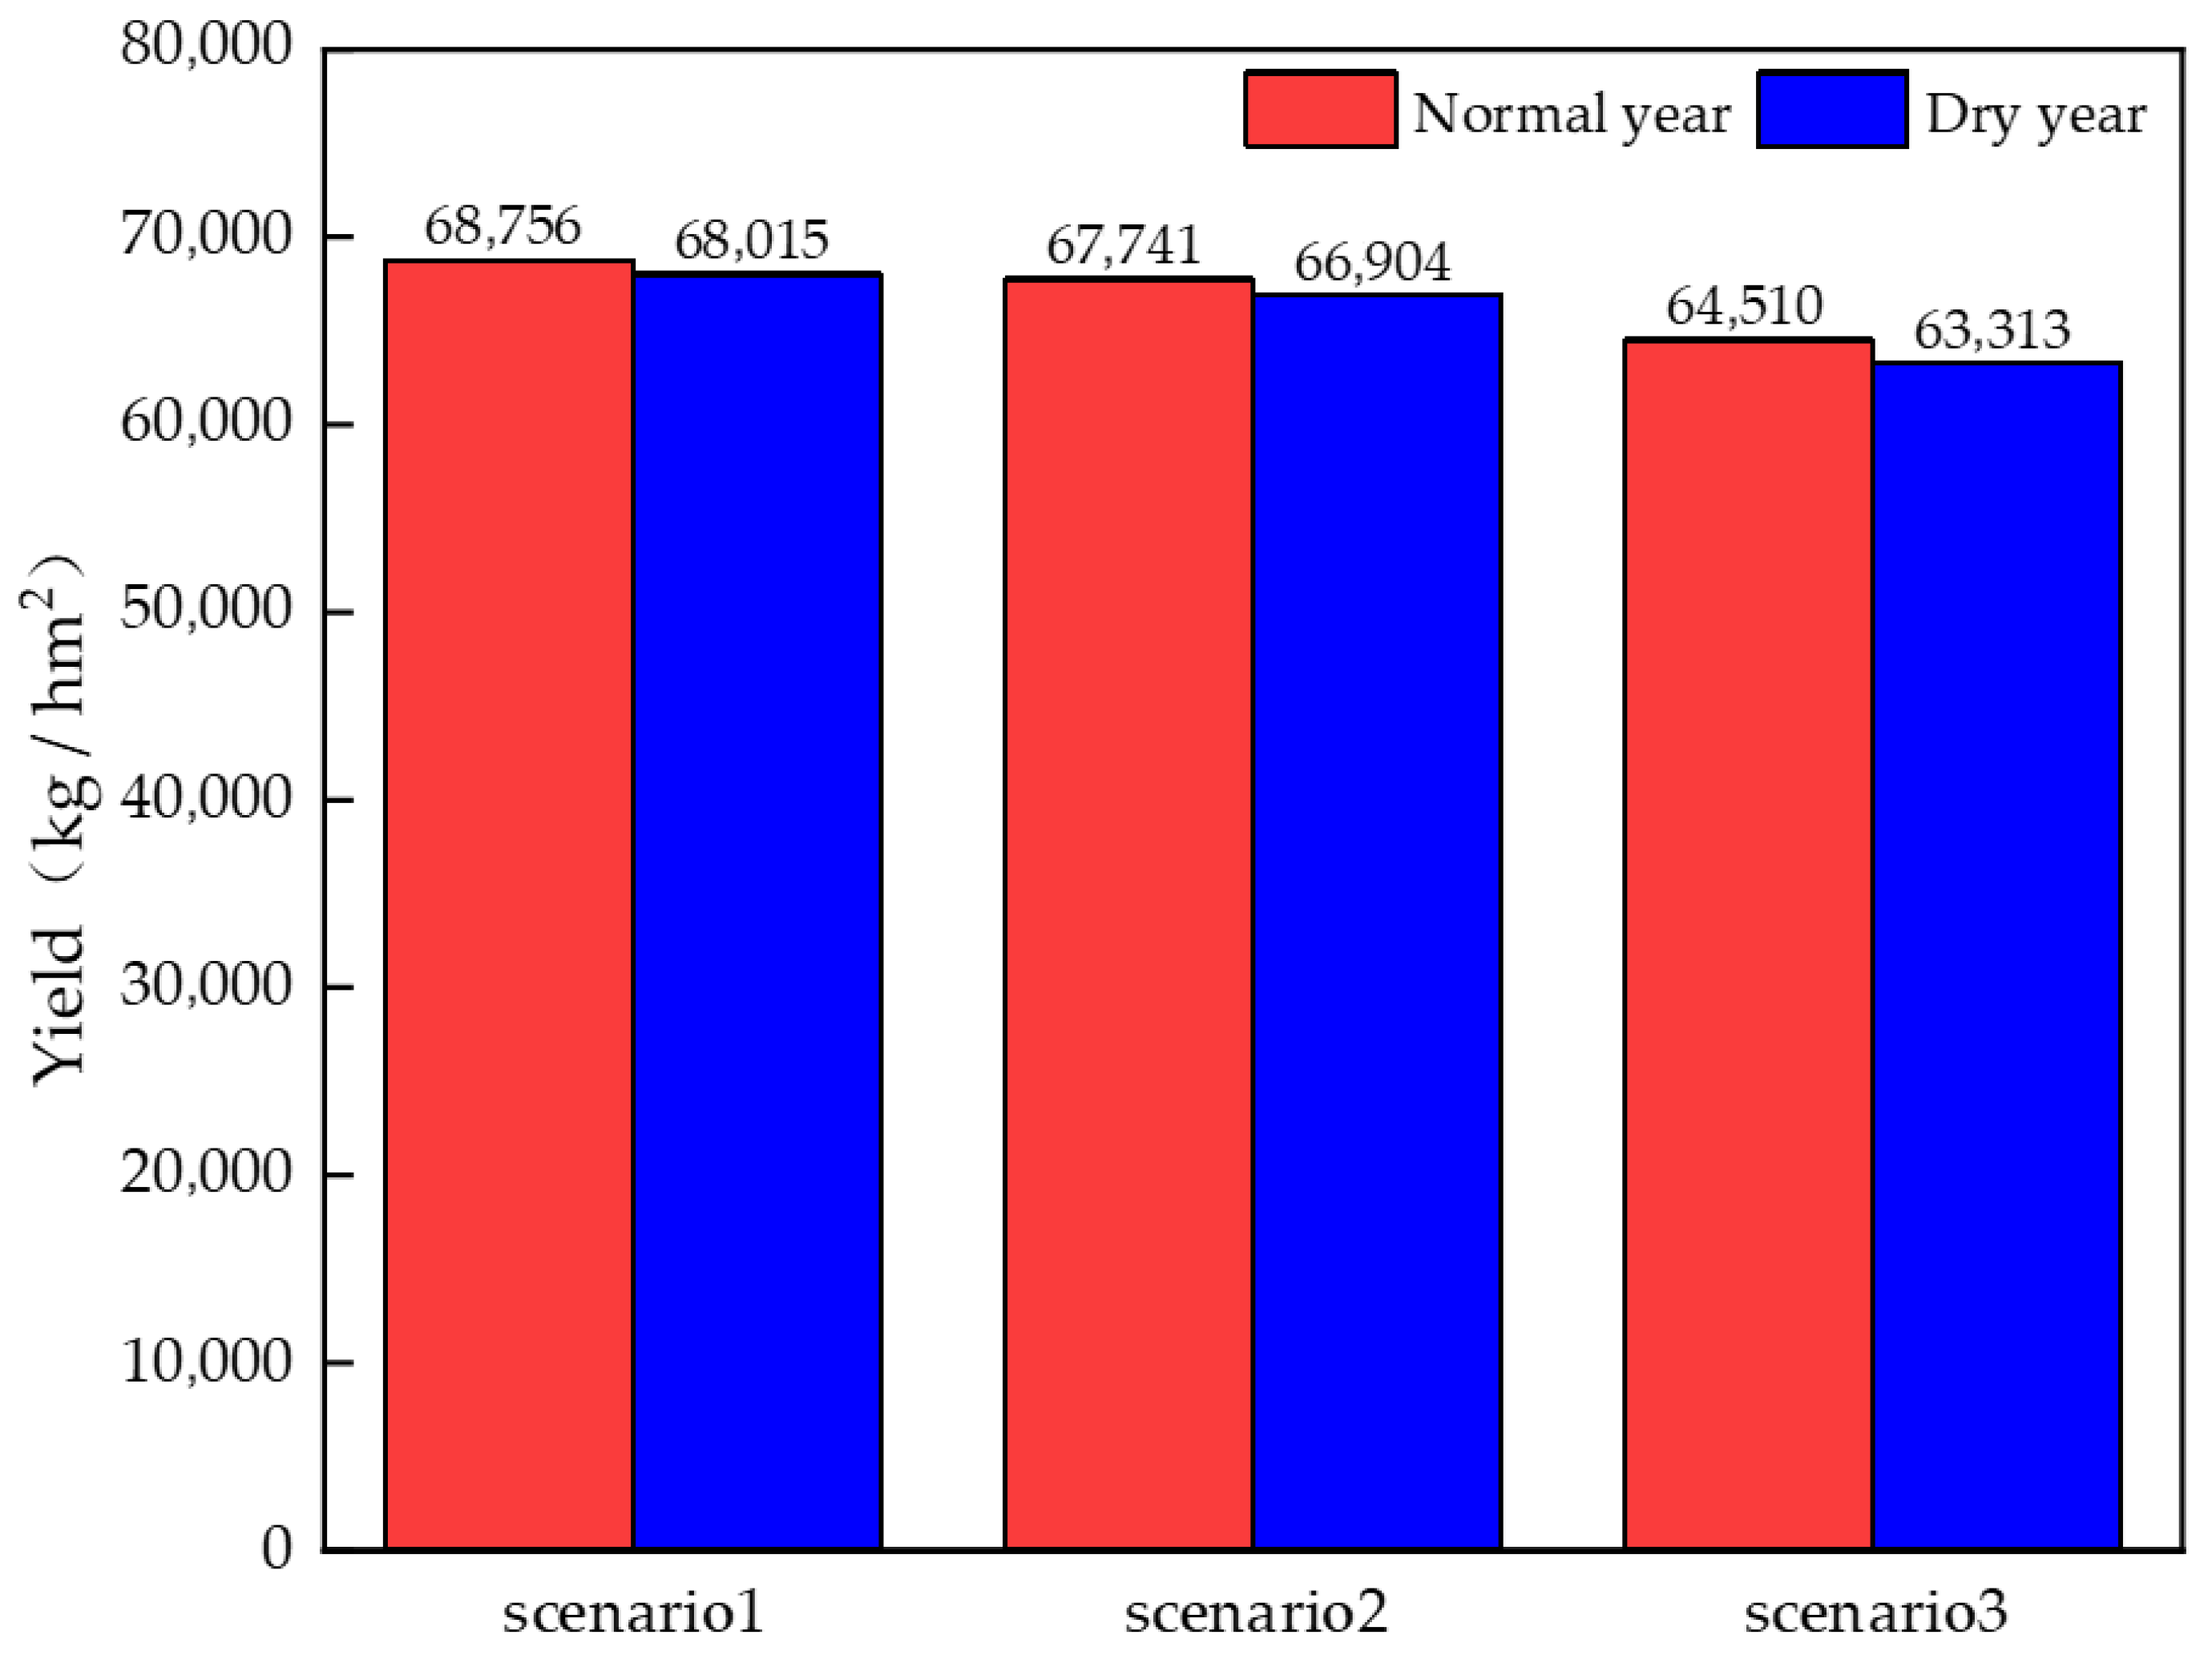
For both normal and dry years, the potato yield was the highest in scenario 1, followed by scenario 2, and the lowest value was observed in scenario 3. While the yield difference between scenarios 1 and 2 was minimal, a substantial reduction was observed when comparing these two scenarios with scenario 3. This pattern indicates that decreased irrigation application leads to corresponding yield reduction. The potato yield of in scenario 1 under normal water conditions was 68,756 kg/hm2, which was about 1.48% and 6.18% higher than scenario 2 and scenario 3, respectively. The yield in scenario 1 under dry water conditions was 68,015 kg/hm2, which was about 1.63% and 6.91% higher than scenario 2 and scenario 3, respectively. The yields in all three scenarios under normal water conditions were higher than those under dry water conditions, which are 1.08%, 1.24%, and 1.86% higher, respectively (Figure 13).
Using the water use efficiency (WUE) formula, the relationship between potato yield and water consumption under different hydrological years was assessed. The computed results were compiled in Table 13 and Table 14. In normal hydrological years, the WUE values for potato Scenarios 1, 2, and 3 were 160.3 kg/hm2·mm, 164.8 kg/hm2·mm, and 164.1 kg/hm2·mm, respectively. Under dry year conditions, WUE increased sequentially across the scenarios, with Scenario 3 attaining the maximum value of 173.5 kg/hm2·mm.
With the goal of achieving the highest potato yield, it was recommended to irrigate 180 mm in a normal year and 240 mm in a dry year. With the goal of optimal groundwater resource utilization, it was recommended to irrigate 162 mm in a normal year and 192 mm in a dry year.

4. Discussion

The agro-pastoral ecotone in Yinshanbeilu served as a major potato production area in northern China. Optimizing water demand and consumption patterns, improving water use efficiency, and refining irrigation schedules for potatoes in groundwater over-exploitation areas hold significant importance for achieving efficient utilization of groundwater resources and implementing water-saving in the agro-pastoral ecotone.
Zhang et al. [32] demonstrated that under water-saving and fertilizer-reduction conditions, the W3F2 treatment (maintaining 100% crop evapotranspiration with N-P-K application rates of 175–60–225 kg/hm2) drip irrigation fertigation experiments in the field had proven to be a scientific and effective water and fertilizer management solution, yielding potato production of 59,395 kg/hm2. This study showed that potato yield was higher compared to Zhang’s research, because this study did not set different levels of deficit irrigation and fertilization, and followed the farmers’ own irrigation and fertilization patterns, resulting in a larger amount of irrigation and fertilization. The difference in yield depended on the difference in irrigation and fertilization systems. From the perspective of crop physiology, higher irrigation amounts, especially during water-critical periods such as tuber formation and bulking, can more effectively alleviate water stress, thereby ensuring the accumulation and translocation of photosynthetic products. Meanwhile, higher nitrogen input was also conducive to maintaining the vitality of functional leaves in the later growth stage of crops and prolonging the grain filling duration. The high N rate might have led to “luxury transpiration” due to excessive canopy growth, thereby increasing total evapotranspiration (ET). This means that the calculated water productivity (Yield/ET) was not the maximum achievable under optimal water–nitrogen synergy. A similar yield might be achievable with less water at a slightly lower N level. This study found that the WUE of potatoes varied from 162.17 to 166.20 kg/hm2·mm; the IWUE varied from 86.1 to 108.1 kg/hm2 mm; and the total water consumption varied between 375.2 mm and 414.2 mm. Compared with the research by Zhang et al. [5] in Gansu Province, where water productivity was reported as 160–171 kg·hm−2·mm−1, the water productivity in this study under normal and dry hydrological years (160–173.5 kg·hm−2·mm−1) aligns closely with their findings. This indicates that adjusting irrigation levels based on different hydrological years could maintain normal water productivity in potato crops. Furthermore, the simulated scenarios and irrigation strategies established in this study were reasonable and adoptable, providing a scientific basis for optimizing water-saving groundwater management in over-exploited regions. The potato water consumption in Gansu ranges from 478 mm to 517 mm, while in Shandong, it is approximately 470 mm. In the study area, located in the agro-pastoral ecotone, the potato water consumption was approximately 100 mm lower than in Gansu and Shandong. This difference is attributed to the region’s lower accumulated temperature and shorter growing season, which inherently reduced water demand during the crop’s developmental phases. Cao et al. [8] reported that the Qingshu No. 9 potato variety achieved a high yield of 53,438–79,463 kg/ha, while this study showed potato yield was 62,355–67,170 kg/ha, which was within the high-yield range. Tang et al. [9] utilized a calibrated APSIM-Potato model to predict potato yield and water use changes in China under future warming scenarios. Their study at Wuchuan Station determined that potato water consumption reached 282 mm, 329 mm, 374 mm, and 407 mm when irrigation amounts were 60 mm, 120 mm, 180 mm, and 240 mm, respectively. However, their study did not account for the impacts of different hydrological year types on potato production and water utilization in agro-pastoral ecotones. Our study effectively addresses their research gap. This study utilized the DSSAT model to investigate the water consumption of potatoes and revealed the water efficiency and optimal irrigation strategy for groundwater-irrigated potato fields in the Agro-pastoral ecotone under different hydrological year types. The results demonstrated that irrigation amount with 173 mm corresponded to 375.2 mm water consumption, aligning with findings from Kang‘s research and confirming the reliability of these results. To ensure the reliability of the findings, an irrigation amount of 180 mm was recommended for normal years and 240 mm for dry years when targeting maximum potato yield. Alternatively, to optimize groundwater resource utilization, the recommended irrigation volumes were 162 mm in normal years and 192 mm in dry years. In a related study conducted in the arid northwestern area of Weiwu City, Song et al. [33] investigated the water–nitrogen coupling effects on potato yield, quality, and water use efficiency under mulch drip irrigation. They reported that the P2N2 treatment (maintaining a soil moisture content of 70% and a nitrogen application rate of 135 kg/ha) achieved the highest starch content and tuber yield, with a maximum yield of 54,187 kg/ha. Meanwhile, the PIN2 treatment (soil moisture content of 40% with the same nitrogen rate of 135 kg/ha) resulted in the highest water productivity, reaching 12.86 kg/m3. By comparison, the present study indicated that potato water productivity ranged from 16.03 to 17.35 kg/m3, with corresponding yields between 63,313 and 68,756 kg/ha. The relatively higher results in this study can be attributed to the nitrogen application of 185 kg/hm2, which exceeds that of the Song Na study by 50 kg/hm2, and to the precipitation during the potato growing season, which reached 249 mm in normal years and 173 mm in dry years, providing relatively favorable conditions. It is important to note that our hydrological year classification was based on a stationary frequency analysis of the 1991–2023 rainfall record. Given the potential for climate change to alter precipitation patterns, future work should employ non-stationary frequency analysis methods, incorporating time or climate indices as covariates, to provide more robust hydrological classifications under a changing climate, ensuring ample water and nutrient conditions for potato growth in the study area.
Since this paper focuses on addressing the rational utilization of groundwater in over-exploited areas, this study proposed optimal irrigation strategies for potato as the primary objective. The study’s irrigation water use efficiency (IWUE) relies on simulated rainfed yield (Ya) from a crop model instead of field measurements, so IWUE’s absolute value is tied to the model’s rain-fed performance. Also, it ignored fertilizer effects on potato growth, focusing only on local farmers’ actual fertilization. Future research will use field rain-fed control plots to obtain more accurate IWUE values and include fertilizer influence.

5. Conclusions

Based on in situ observation experiments of potatoes in 2022 and 2023, this study used the DSSAT model to investigate the water use efficiency and optimal irrigation strategy of groundwater irrigation for potatoes in the agro-pastoral ecotone in Yinshanbeilu. The main conclusions were as follows:
(1)
This study found that simulated values of the soil water moisture, leaf area index, and yield, with Absolute Relative Error (ARE) of 4.18–5.27%, Normalized Root Mean Square Error (nRMSE) of 5.64–8.65%, and R of 0.86–0.921, represented acceptable accuracy. The DSSAT model can be applied to the research area.
(2)
Total water consumption of potatoes ranged from 375.2 mm to 414.2 mm, with the tuber formation to bulking stages accounting for 50–52% of total water consumption and a water consumption intensity of 2.62–2.81 mm/d. The WUE and IWUE were 162.17–166.20 kg/hm2·mm and 86.1–108.1 kg/hm2·mm, respectively.
(3)
Targeting maximum potato yield, the recommended irrigation amounts were 180 mm for normal years and 240 mm for dry years. To prioritize groundwater use efficiency, irrigation amounts are 162 mm and 192 mm for normal and dry years, respectively. These findings offer a theoretical foundation for implementing water-saving and high-yield irrigation management practices for potato cultivation in the region.

Author Contributions

G.W. and X.M. conceived and designed the experiments. G.W. and X.M. developed the initial and final versions of this manuscript and analyzed the data. J.W. and D.T. contributed their expertise and advice. J.R. and Z.L. conducted the experiments. All authors have read and agreed to the published version of the manuscript.

Funding

Study on water consumption characteristics and soil environment regulation mechanism of alfalfa with different growth years in the Yellow River Region of Inner Mongolia, Grant No. MKGP2024JK015. Key Projects of DaMaoQi Irrigation Experimental Station; The Project of Monitoring and Experimenting Study of Yinshanbeilu Grassland Eco-Hydrology National Observation and Research Station, Field testing station.

Data Availability Statement

The original contributions presented in this study are included in the article. Further inquiries can be directed to the corresponding author.

Acknowledgments

We highly appreciate the reviewers’ and editors’ useful suggestions for this work. This study was supported by DaMaoQi Irrigation Experimental Station and the Yinshanbeilu Grassland Eco-Hydrology National Observation and Research Station Field Testing Station.

Conflicts of Interest

The authors declare no conflicts of interest.

References

  1. Zhang, C.; Su, J.; Du, Z. Ecological problems and countermeasures of the agro-pastoral ecotone at the northern foot of Yinshan Mountain in Inner Mongolia. Ecol. Agric. Res. 1999, 4, 30. [Google Scholar]
  2. Qing, S.; An, W. Potato-Crop with Advantage in Hilly Areas the Northern Foot of Yin Mountain. China J. Agric. Resour. Reg. Plan. 2004, 25, 1–4. [Google Scholar]
  3. Jin, X. Study on the Effects of Changes in Irrigation Patterns on Groundwater in Farming-Pastoral Zones in Semi-Arid Areas. Ph.D. Thesis, China Institute of Water Resources and Hydropower Research, Beijing, China, 2019. [Google Scholar]
  4. Wang, H.; Cheng, M.; Zhang, S.; Fan, J.; Feng, H.; Zhang, F.; Wang, X.; Sun, L.; Xiang, Y. Optimization of irrigation amount and fertilization rate of drip-fertigated potato based on Analytic Hierarchy Process and Fuzzy Comprehensive Evaluation methods. Agric. Water Manag. 2021, 256, 107130. [Google Scholar] [CrossRef]
  5. Zhang, Y.; Wang, F.; Nie, W.; Feng, S. Effects of Film Mulching on Thermal Conditions and Potato Growth under Drip Irrigation. Trans. Chin. Soc. Agric. Mach. 2020, 51, 252–261. [Google Scholar]
  6. Li, H.; Chai, S.; Chang, L.; Cheng, H.; Han, F.; Chai, Y. Effects of earthing up on yield and water use efficiency of potato under straw strip mulching planting pattern. Trans. Chin. Soc. Agric. Eng. 2019, 35, 107–115. [Google Scholar]
  7. Wang, H.; Cheng, M.; Liao, Z.; Guo, J.; Zhang, F.; Fan, J.; Feng, H.; Yang, Q.; Wu, L.; Wang, X. Performance evaluation of AquaCrop and DSSAT-SUBSTOR-Potato models in simulating potato growth, yield, and water productivity under various drip fertigation regimes. Agric. Water Manag. 2023, 276, 108076. [Google Scholar] [CrossRef]
  8. Cao, Z.; Liu, Y.; Zhang, X.; Shen, B.; Qin, S.; Liu, Z.; Wang, L.; Li, Z.; Zhang, J. Effects of deficit irrigation on growth, yield, and water use of potato plants. Trans. Chin. Soc. Agric. Eng. 2019, 35, 114–123. [Google Scholar]
  9. Tang, J.; Xiao, D.; Bai, H. Yield and water use efficiency of potato at different irrigation levels in agro-pastoral ecotone under future climate change. Trans. Chin. Soc. Agric. Eng. 2020, 36, 103–112. [Google Scholar]
  10. Rolbiecki, R.; Rolbiecki, S.; Figas, A.; Jagosz, B.; Stachowski, P.; Sadan, H.A.; Prus, P.; Pal-Fam, F. Requirements and Effects of Surface Drip Irrigation of Mid-Early Potato Cultivar Courage on a Very Light Soil in Central Poland. Agronomy 2020, 11, 33. [Google Scholar] [CrossRef]
  11. Molaei, B.; Gheysari, M.; Mostafazadeh-Fard, B.; Landi, E.; Majidi, M.M. Evaluation of yield and yield characteristics of two potato varieties under sprinkler and trickle irrigation systems. J. Water Soil Sci. 2015, 19, 241–251. [Google Scholar] [CrossRef]
  12. Camargo, D.; Montoya, F.; Córcoles, J.; Ortega, J. Modeling the impacts of irrigation treatments on potato growth and development. Agric. Water Manag. 2015, 150, 119–128. [Google Scholar] [CrossRef]
  13. Montoya, F.; Camargo, D.; Córcoles, J.I.; Domínguez, A.; Ortega, J.F. Analysis of deficit irrigation strategies by using SUBSTOR-Potato model in a semi-arid area. J. Agric. Sci. 2020, 157, 578–591. [Google Scholar] [CrossRef]
  14. Li, S.; An, P.; Pan, Z.; Wang, F.; Li, X.; Liu, Y. Farmers’ initiative on adaptation to climate change in the Northern Agro-pastoral Ecotone. Int. J. Disaster Risk Reduct. 2015, 12278–12284. [Google Scholar] [CrossRef]
  15. Miao, X.; Wang, G.; Li, R.; Xu, B.; Zheng, H.; Tian, D.; Wang, J.; Ren, J.; Li, Z.; Zhou, J. Study on Modeling and Evaluating Alfalfa Yield and Optimal Water Use Efficiency in the Agro-Pastoral Ecotone of Northern China. Plants 2024, 13, 229. [Google Scholar] [CrossRef]
  16. Gao, S.; He, P.; Gong, X.; Li, H.; Liu, Y.; Wang, Q.; Wang, X.; He, A.; Fu, Y. Sensitivity and uncertainty analysis of wheat cultivar parameters of the DSSAT model under different water and N treatments. Sci. Rep. 2025, 15, 10441. [Google Scholar] [CrossRef]
  17. Zhu, B.; Chen, S.; Xu, Z. The estimation of maize grain protein content and yield by assimilating LAI and LNA, retrieved from canopy remote sensing data, into the DSSAT model. Remote Sens. 2023, 15, 2576. [Google Scholar] [CrossRef]
  18. Lin, Z.; Li, Y.; Hoogenboom, G.; Gao, Y.; Wu, B.; Wu, L.; Wu, L.; Zhou, H.; Yan, B.; Lu, P.; et al. DSSAT modeling of oilseed flax (Linum usitatissimum L.): Sensitivity analysis of yield to weather variability and nitrogen application. Field Crop. Res. 2025, 328, 109930. [Google Scholar] [CrossRef]
  19. Foumani, M.P.; Yin, X.; Fu, J.S.; Yang, C.E.; Adotey, R. Impact of future climate from different general circulation models on cotton yield predictions in north Cotton Belt through crop simulation with DSSAT. Field Crops Res. 2025, 322, 109719. [Google Scholar] [CrossRef]
  20. Wang, X.; Xin, L.; Du, J.; Li, M. Simulation of cotton growth and yield under film drip irrigation condition based on DSSAT Model in southern Xinjiang. Agric. Water Manag. 2022, 53, 314–321. [Google Scholar]
  21. Jiang, Y.; Zhang, L.; Zhang, B.; He, C.; Jin, X.; Bai, X. Modeling irrigation management for water conservation by DSSAT-maize model in arid northwestern China. Agric. Water Manag. 2016, 177, 37–45. [Google Scholar] [CrossRef]
  22. Wang, P. Research of Optimizing Deficit Irrigation for Sugarcane in Guangxi Province Using the DSSAT Model Based on Genetic Algorithm. Master’s Thesis, Hebei University of Engineering, Handan, China, 2022. [Google Scholar]
  23. Singels, A.; Bezuidenhout, C. A new method of simulating dry matter partitioning in the Canegro sugarcane model. Field Crops Res. 2002, 78, 151–164. [Google Scholar] [CrossRef]
  24. Xu, R.; He, Y.; Zhao, X.; Luo, S.; Yang, J.; Yu, J.; Zhu, Y.; Zhao, C.; Li, Z. Analysis on Potato Potential Yield and Its Influencing Factors in Northeast China from 1961 to 2017 Based on the DSSAT Model. Chin. J. Agric. Resour. Reg. Plan. 2021, 42, 102–114. [Google Scholar]
  25. Zhang, M. Remote Sensing for Maize Nitrogen Nutrition Diagnosis Based on Field Experiments and the DSSAT Model. Master’s Thesis, Jilin University, Changchun, China, 2023. [Google Scholar]
  26. Wu, C.; Anlauf, R.; Ma, Y. Application of the DSSAT model to simulate wheat growth in eastern China. J. Agric. Sci. 2013, 5, 198–208. [Google Scholar] [CrossRef]
  27. Yan, W.; Jiang, W.; Han, X.; Hua, W.; Yang, J.; Luo, P. Simulating and Predicting Crop Yield and Soil Fertility under Climate Change with Fertilizer Management in Northeast China Based on the Decision Support System for Agrotechnology Transfer Model. Sustainability 2020, 12, 2194. [Google Scholar] [CrossRef]
  28. Falge, E.; Baldocchi, D.; Olson, R.; Anthoni, P.; Aubinet, M.; Bernhofer, C.; Burba, G.; Ceulemans, R.; Clement, R.; Dolman, H.; et al. Gap filling strategies for defensible annual sums of net ecosystem exchange. Agric. For. Meteorol. 2001, 107, 43–69. [Google Scholar] [CrossRef]
  29. Wang, G.; Shi, H.; Li, X.; Zheng, Q.; Guo, J.; Wang, W. Analysis of water and salt transportation and balance during cultivated land, waste land and lake system in Hetao Irrigation Area. J. Hydraul. Eng. 2019, 50, 1518–1528. [Google Scholar]
  30. Blum, A. Effective use of water (EUW) and not water-use efficiency (WUE) is the target of crop yield improvement under drought stress. Field Crops Res. 2009, 112, 119–123. [Google Scholar] [CrossRef]
  31. Attia, A.; Rajan, N.; Xue, Q. Application of DSSAT-CERES-Wheat model to simulate winter wheat response to irrigation management in the Texas High Plains. Agric. Water Manag. 2016, 165, 50–60. [Google Scholar] [CrossRef]
  32. Zhang, F.; Gao, Y.; Jiao, W.; Hu, W. Effect of water and fertilizer supply on growth, water and nutrient use efficiencies of potato in sandy soil of Yulin area. Trans. Chin. Soc. Agric. Mach. 2017, 48, 1–9. [Google Scholar]
  33. Song, N.; Wang, F.; Yang, C.; Yang, K. Coupling effects of water and nitrogen on yield, quality and water use of potato with drip irrigation under plastic film mulch. Trans. Chin. Soc. Agric. Eng. 2013, 29, 98–105. [Google Scholar]
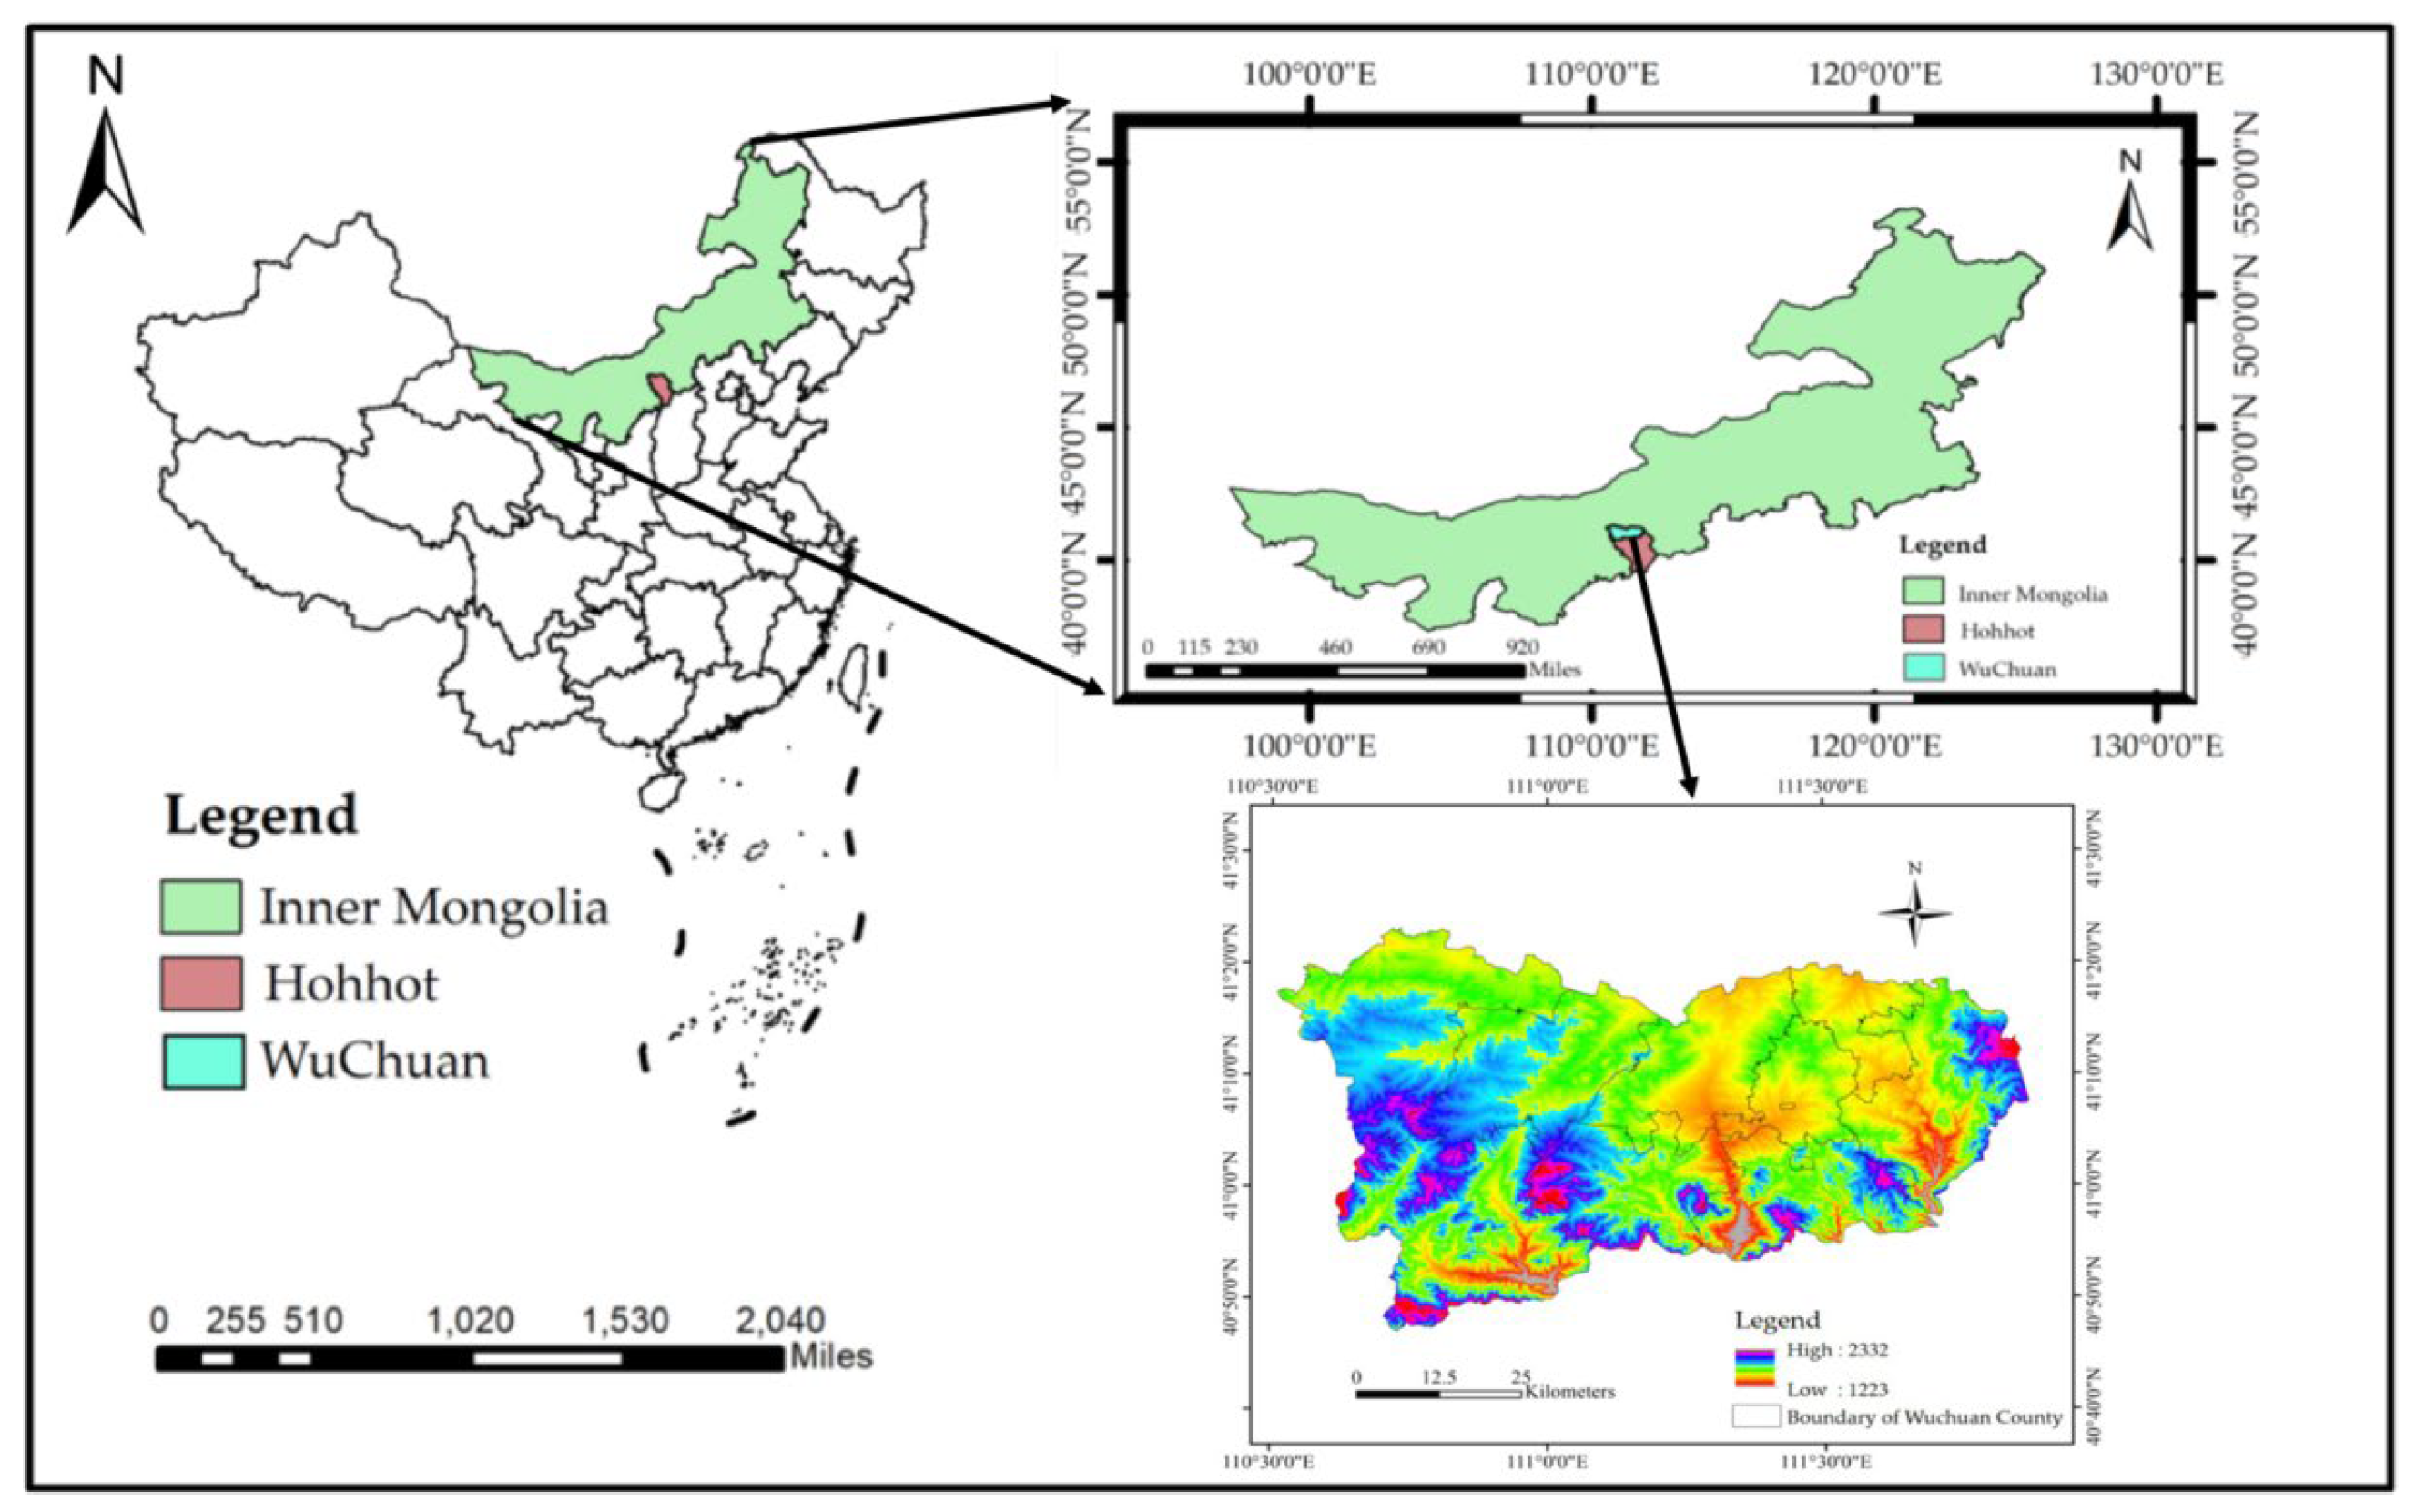
Figure 1. Location map.
Agronomy 15 02685 g001
Figure 2. Experimental design.
Agronomy 15 02685 g002
Figure 3. Potato planting pattern.
Agronomy 15 02685 g003
Figure 4. Basic structure of soil profile.
Agronomy 15 02685 g004
Figure 5. Atmospheric temperature and rainfall in the crop growth period.
Agronomy 15 02685 g005
Figure 6. Model construction diagram.
Agronomy 15 02685 g006
Figure 7. Validation of soil water content and leaf area values during the entire tuber formation stage of potato.
Agronomy 15 02685 g007
Figure 8. Soil moisture content (SMC) in the 0–60 cm soil layer.
Agronomy 15 02685 g008
Figure 9. Dynamic changes in the leaf area index in potatoes.
Agronomy 15 02685 g009
Figure 10. Values for the entire tuber formation change trend of potato.
Agronomy 15 02685 g010
Figure 11. Rainfall frequency curve.
Agronomy 15 02685 g011
Figure 12. Rainfall during the potato growth stage from 1991 to 2023.
Agronomy 15 02685 g012
Figure 13. Effects of irrigation strategies on potato yield under different hydrological conditions.
Agronomy 15 02685 g013
Table 1. Basic soil physical parameters.
Soil Layer DepthBulk DensityField Moisture CapacitySaturated Soil Water ContentAvailable pAvailable KSoil Organic MatterpH
(cm)(g/cm3)(cm3/cm3)(cm3/cm3)(g/kg)(g/kg)(g/kg)
20222023202220232022202320222023202220232022202320222023
0–201.341.360.320.300.350.350.011590.012080.163880.158722.172.317.297.16
20–401.571.510.250.240.290.260.004560.005340.132750.128315.615.747.116.97
40–601.581.570.230.180.230.200.003090.002980.074560.071781.491.737.087.03
60–801.621.610.170.210.210.210.001840.001850.066370.067230.690.726.966.92
80–1001.651.630.130.140.170.160.001570.001690.092320.088750.520.486.936.82
Table 2. Potato growth stages.
Growth Period20222023
PeriodGrowth DaysPeriodGrowth Days
Sowing–Emergence2/5~27/525 d1/5~28/527 d
Emergence–Formation28/5~26/630 d29/5~29/632 d
Formation–Bulking27/6~15/850 d30/6~19/851 d
Bulking–Harvest16/8~11/928 d20/8~13/924 d
Total2/5~11/9133 d1/5~13/9134 d
Table 3. Irrigation amount for different reproductive periods.
Growth StageIrrigation Amount (mm)
20222023
Sowing–Emergence3231
Emergence–Formation5550
Formation–Bulking6657
Bulking–Harvest2018
Total173156
Table 4. Sensitivity analysis of various parameters.
ParametersP2G3SOL-AWCSOL-NH4SRADNAPPIRRIGSW0–30 cm
SMCβ0.030.140.280.090.060.040.450.02
contribute2.60%12.30%24.60%7.90%5.30%3.50%39.50%2.30%
LAIβ0.080.270.180.120.390.050.030.02
contribute7.10%24.10%16.10%10.70%34.80%4.50%2.70%2.00%
Yieldβ0.370.370.210.130.070.290.210.01
contribute32.60%32.60%18.50%11.50%6.20%25.50%18.50%1.50%
Note: P2—tuber growth stress coefficient; G3—potential tuber growth rate; SOL_SWC—soil effective moisture content; SOL-NH4—initial ammonium nitrogen content in the 0–30 cm soil layer; SRAD—total solar radiation during the whole growth period; NAPP—total nitrogen application rate; IRRIG—total irrigation amount; SW0–30 cm—initial soil moisture content of 0–30 cm.
Table 5. Uncertainty analysis of various parameters.
d-FactorParameters
P2G3SOL-AWCSOL-NH4SRADNAPPIRRIGSW0–30 cm
SMC0.020.010.220.070.050.030.360.11
LAI0.040.230.070.030.310.150.100.02
Yield0.030.300.110.020.060.230.170.01
Table 6. Calibration of potato leaf area and yield.
IndexLAI/(cm2/cm−2)Yield/(kg/hm2)
ARE/%4.184.89
nRMSE/%5.646.57
R20.880.87
Table 7. Calibration of soil moisture simulation.
Soil Layer/cmARE/%nRMSE/%R2
0–205.277.870.87
20–406.348.650.86
40–604.886.820.88
Table 8. Evaluation of genetic parameters in potato varieties.
ParametersDefinitionCalibrated
Value
G2Leaf area expansion rate [cm2/(m2·d)]1100
G3Potential tuber growth rate [g/(plant·d)]23.3
PDTuber growth stress coefficient0.9
P2Photo period coefficient0.5
TCUpper limit critical temperature for tubers to start growing20
Table 9. Evaluating water consumption during the growing season based on the DSSAT model.
VarietyGrowth StageWater Consumption (mm)Water Consumption ModulusWater Consumption Intensity (mm/d)
202220232022202320222023
PotatoSowing–Emergence43.8042.1715%13%2.251.99
Emergence–Formation73.0077.8625%24%3.133.11
Formation–Bulking146.00168.6950%52%3.754.22
Bulking–Harvest29.2035.6810%11%1.341.90
Total/Average375.2414.21.001.002.622.81
Table 10. Water balance components of the potato soil profile during the 2022 and 2023 growing seasons.
ParametersRain/mmIrrigation/mmΔW (Soil Water Storage Change)/mmEvapotranspiration/mmEvaporation/mmTranspiration/mmPercolation/mm
Year20222023202220232022202320222023202220232022202320222023
potato185.3236173156−41.6−44.9375.2414.2255.14236.1120.06178.124.722.7
Table 11. Variation in water use and irrigation water use efficiency (2022–2023).
ParametersIrrigation/mmEvapotranspiration/mmYield
/(kg/hm2)
Rainfed Yield/(kg/hm2)Water Use Efficiency/
(kg/hm2·mm)
Irrigation Water Use Efficiency/
(kg/hm2·mm)
Year202220232022202320222023202220232022202320222023
potato173156375.2414.262,35567,17043,64953,736166.20162.17108.186.1
Table 12. Simulation scenario design for different hydrological years.
Hydrological YearDifferent Irrigation SchemesIrrigation Water (mm)Hydrological YearDifferent Irrigation SchemesIrrigation Water (mm)
Normal year1180Dry year1240
21622216
31443192
Table 13. Potato water consumption and water use efficiency in normal hydrological years.
Hydrological YearDifferent Irrigation SchemesIrrigation/mmEvapotranspiration/mmYield/
(kg/hm2)
Water Use Efficiency/
(kg/hm2·mm)
Normal year118042768,756160.3
216240967,741164.8
314439164,510164.1
Table 14. Potato water consumption and water use efficiency in dry hydrological years.
Hydrological YearDifferent Irrigation SchemesIrrigation/mmEvapotranspiration/mmYield/
(kg/hm2)
Water Use Efficiency/
(kg/hm2·mm)
Dry year124041068,015164.7
221638566,904172.0
319236063,313173.5
Disclaimer/Publisher’s Note: The statements, opinions and data contained in all publications are solely those of the individual author(s) and contributor(s) and not of MDPI and/or the editor(s). MDPI and/or the editor(s) disclaim responsibility for any injury to people or property resulting from any ideas, methods, instructions or products referred to in the content.