Article

Yield Stability and Antioxidant Response of Wheat Under Multi-Environment Conditions: Insights from AMMI and GGE Biplot Analyses

by
Predrag Brković
1,
Mirela Matković Stojšin
1,*,
Olivera Nikolić
2,
Vladimir Perišić
3,
Kristina Luković
3,
Snežana Babić
4 and
Svetlana Roljević Nikolić
1
1
“Tamiš” Research and Development Institute, Novoseljanski put 33, 26000 Pančevo, Serbia
2
Faculty of Ecological Agriculture, Educons University, Vojvode Putnika 87, 21208 Sremska Kamenica, Serbia
3
Institute for Vegetable Crops Smederevska Palanka, Karađorđeva 71, 11420 Smederevska Palanka, Serbia
4
Institute for Forage Crops Kruševac, 37251 Globoder, Serbia
*
Author to whom correspondence should be addressed.
Agronomy 2025, 15(12), 2684; https://doi.org/10.3390/agronomy15122684 (registering DOI)
Submission received: 20 October 2025 / Revised: 18 November 2025 / Accepted: 19 November 2025 / Published: 22 November 2025
(This article belongs to the Special Issue Genotype × Environment Interactions in Crop Production—2nd Edition)

Abstract

The identification of wheat genotypes with balanced grain yield, stability, and antioxidant response to abiotic stress is crucial for creating adaptable varieties in changing climates. The research was conducted as a multi-environment trial (MET) across six environments (three localities over two seasons), and included 15 wheat genotypes (bread wheat lines, standard varieties and two spelt wheat lines). This study integrates AMMI and GGE biplot analyses with antioxidant profiling across growth stages to identify genotypes combining yield stability and stress tolerance. Lines KG-4/1, KG-11/1 and the variety Pobeda were identified as high-yielding and stable genotypes, with KG-11/1 ranked as an “ideal genotype” and KG-4/1 achieving the highest grain yield on MET level (6.48 t ha–1). Specific adaptation of genotypes KG-40/1 and Renesansa indicates their potential for targeted breeding in particular environments. Antioxidant parameters (TPC and DPPH• scavenging activity) at early growth stages were positively correlated with grain yield, indicating that they can serve as suitable biochemical markers for selecting stress-tolerant, high-yielding wheat genotypes. This comprehensive approach, which includes the analysis of grain yield stability/adaptability and antioxidant parameters, is adequate for the evaluation of promising lines that may be suitable genetic resources in climate-resilient wheat breeding programs.

1. Introduction

Wheat (Triticum spp.) is one of the most important crops and has played a significant role in the development of human civilization. Today, wheat is a staple food for approximately 40% of the human population, providing about 20% of the protein and calories on a daily basis [1,2], making it essential for ensuring global food security [2]. Wheat is particularly important in developing countries, where it is the primary source of food for about 2.5 billion people [1]. Given the predictions that the global human population will reach 9.4 billion by 2050, the demand for this crop is expected to increase by about 60% [3]. However, meeting the growing demand for wheat will not be possible through the expansion of arable land, but rather will have to be based on improving grain yield per unit area [4,5]. According to Reynolds et al. [6], wheat grain yield will need to increase by 50% in the coming decades. Therefore, to achieve this goal, it is necessary to increase its grain yield potential [7,8]. At the same time, global wheat production is increasingly affected by biotic and abiotic factors, which negatively affect plant growth and development [9]. Among abiotic factors, drought and temperature are the two most critical ones, leading to a decrease in wheat grain yield [10,11,12].
The primary goal of any plant breeding program is to create genotypes that are characterized by high yield, broad adaptability, resistance to biotic and abiotic stress factors, and good quality for end use [13,14]. Creating such varieties is a major challenge for breeders, especially because it is a slow process that largely depends on the available genetic variability within the population [15]. Effective selection requires an understanding of the nature and extent of variation within a population [16], as well as knowledge of the relationships between grain yield and its components, while taking into account the influence of genotype, environment and their interaction on the phenotypic expression of these traits [17,18,19,20]. Genotype × environment interaction (GEI) describes how different genotypes behave in different growing conditions, primarily in different localities and growing seasons [21]. As a result, plant breeders are constantly searching for genotypes that have high yield potential and low GEI [22,23]. In this context, conducting multi-ecological trials (METs) is of great importance, as they provide the basis for selecting genotypes adapted for cultivation in wide geographical areas (broad adaptability), as well as in specific environmental conditions (specific adaptability) [23,24,25,26]. Accordingly, it is therefore very important to evaluate prospective breeding lines through MET, as a way to adapt to changes in the environment [27,28].
Agromorphological traits are often used as key indicators of phenotypic variability and serve as selection criteria in improving crop yield [29,30]. However, for a comprehensive assessment of the adaptability of genotypes, it is important to study the physiological and biochemical responses of plants [31,32,33,34], as well as their interrelationship with grain yield [31]. Abiotic stress occurring during wheat development leads to the accumulation of free radicals, or reactive oxygen species (ROS), which can cause oxidative damage in plants, resulting in reduced plant growth and lower grain yield. In response, plants activate complex mechanisms, including the synthesis of antioxidant compounds [32,34]. Phenolic compounds represent important bioactive components responsible for neutralizing free radicals, while the DPPH• scavenging test is often used as an indicator of the overall antioxidant activity of plants. The intensity and duration of stress directly affect the degree of activation of defense mechanisms in the plant. For this reason, the assessment of plant responses to stress at different growth stages is crucial for the creation of varieties with improved tolerance to adverse environmental conditions [35]. Additionally, integrating antioxidant traits with yield stability analyses enables a more accurate assessment of overall genotype adaptability [36].
The study aimed to: (i) assess yield stability and adaptability using a multivariate approach; (ii) identify genotypes with specific or broad adaptability; (iii) determine representative testing environments; and (iv) evaluate whether antioxidant parameters can serve as markers of stress resilience.

2. Materials and Methods

2.1. Plant Material and Experimental Design

In this study, 15 hexaploid wheat (Triticum spp.) genotypes were analyzed: 10 promising bread wheat (Triticum aestivum ssp. vulgare) KG-lines (KG-4/1, KG-9/1, KG-11/1, KG-16/1, KG-21/1, KG-30/1, KG-33/1, KG-40/1, KG-41/1, and KG-43/1), realized in Centre for Small Grains and Rural Development in Kragujevac; three bread wheat varieties used as standards: NS 40S, Renesansa, and Pobeda, developed at the Institute of Field and Vegetable Crops in Novi Sad. Additionally, two KG-lines of spelt wheat (Triticum spelta ssp.), KG-54-7/3-5 and KG-54-7/3-2, were included to increase the variability of the analyzed germplasm and to test their yield potential in different environments, considering that spelt wheat is cultivated on small areas in Serbia but holds specific significance in nutrition as an alternative cereal (Table 1).
The experimental trial was conducted at three localities: Pančevo (Experimental Field of the “Tamiš” Research and Development Institute, 44°56′31″ N 20°43′18″ E, 80 m), Kragujevac (Center for Small Grains and Rural Development, 44°02′47″ N 20°56′54″ E, 196 m), and Kruševac (Institute for Forage Crops Kruševac, 43°34′56″ N 21°12′16″ E, 148 m), over two growing seasons (2022/2023 and 2023/2024). These localities were selected due to their diverse agroecological conditions, allowing for a relevant assessment of grain yield potential, as well as the evaluation of the stability and adaptability of wheat genotypes. At all three localities, the analyzed wheat genotypes were sown in a randomized complete block design (RCBD) with three replications. The plot size was 5 m2.
Standard agronomic practices for wheat production were applied at all localities. Basic tillage was performed after the harvest of the previous crop. Continuous sowing was carried out mechanically, with an inter-row spacing of 12.5 cm. In the first season, sowing was performed in the last decade of October to the early November, and in the second season, sowing was performed somewhat later, depending on the locality. The amount of fertilizer applied was determined based on the agrochemical analysis of the soil for each locality (Table 2). At all three localities and in both growing seasons, standard crop protection measures were applied as needed. Harvest was carried out in both seasons when grain moisture fell below 14%. In the first season, the harvest was carried out in mid-July at all localities. In the second season, the harvest was performed earlier than in the first season at all localities. Detailed information on fertilizer composition, application rates, top dressing, as well as exact sowing and harvesting dates are provided in Table S1.

2.2. Soil Characteristics of the Experimental Localities

Basic chemical soil analysis was carried out on soil samples collected from all three localities, at a depth of 0 to 30 cm (Table 2). The soil at the Pančevo locality belongs to the type of carbonate chernozem, which is developed on loess. The loamy texture gives these soils favorable physical properties. Chemical analyses showed that the soil at the Pančevo locality is strongly calcareous (12.59% CaCO3). The soil reaction (pH in KCl) was 7.57, which classifies it as moderately alkaline. The humus content of 3.39% categorizes this soil as humus-rich. The soil was moderately supplied with nitrogen (0.20%) and rich in phosphorus (20.6 mg 100 g−1) and potassium (25.53 mg 100 g−1) (Table 2).
The soil at the Kragujevac locality is classified as smonitza. Smonitza belongs to the group of automorphic soils. According to its mechanical composition, it is considered a heavy clay soil with a high content of colloidal fractions. This composition in the dry period leads to the formation of vertical wedge-shaped cracks up to a depth of one meter into which fine surface soil falls from the surface to the bottom of the crack. In wet conditions, the clay swells and the cracks close, and additional material at the bottom of the cracks exerts pressure and the aggregates rise. The high content of clay that swells makes smonitza sticky and plastic in the wet state, and in the dry state it represents a compact and cracked mass. Smonitza in the experimental trial in Kragujevac had an acidic reaction (pH in KCl 5.81), a high content of humus (3.95%), and was moderately supplied with nitrogen (0.20%). The content of available phosphorus was low (9.67 mg 100 g−1), while the amount of available potassium was optimal (19.40 mg per 100 g−1), Table 2. The primary soil type in the experimental trial in Kruševac is alluvium in degradation with an acidic reaction. The key characteristic of these soils is that they are young and undeveloped, typically located in river valleys. Chemical analysis showed that the soil had a low humus content (2.14%), was moderately supplied with nitrogen (0.228%), with potassium at an optimal level (19.24 mg 100 g−1), and a low content of available phosphorus (8.56 mg 100 g−1), Table 2.

2.3. Meteorological Conditions

Meteorological data for the Pančevo and Kruševac localities were obtained from meteorological stations located at the experimental fields, while meteorological data for the locality Kragujevac were obtained from the meteorological station of the Republic Hydrometeorological Service of Serbia [37], located near the experimental field (Figure 1). At the Pančevo locality in the first growing season, high temperatures and lower precipitation were recorded at the time of sowing (third decade of 23 October 2022), while in Kragujevac and Kruševac, at the time of sowing (first decade of 23 November 2022), temperatures and precipitation were higher than the multi-year average. These agrometeorological conditions were generally favorable for sowing, as well as for germination and emergence at all three localities. In the second growing season, during sowing (November) at all three localities, temperatures were within the multi-year average, while precipitation was extremely high (twice the average in Pančevo and even three times more in Kragujevac and Kruševac compared to the multi-year average). Lower precipitation at the last decade of October enabled high-quality soil preparation and sowing, while higher precipitation in the third decade of November, accompanied by average temperatures, had a positive impact on germination, emergence and initial growth phases at all localities (Figure 1). The period December–January at all three localities, in both growing seasons, was characterized by significantly higher temperatures than the average (in Kragujevac, as much as 3.2 °C higher than the multi-year average for December). In the first growing season, precipitation was higher than the average at all localities, while in the second season, the sum of precipitation was below the multi-year average. Such weather conditions extended the growth period, and wheat later entered the dormancy phase. The continuation of the tillering phase in the first growing season (in February) was accompanied by temperatures within the multi-year average at all localities. During this period, precipitation was lower than the multi-year average in Kragujevac and Kruševac, while slightly higher precipitation was recorded in Pančevo compared to the multi-year average. In the second growing season, during the tillering phase (February), high temperatures were recorded (twice the multi-year average), with significantly lower precipitation (in Kragujevac ten times less than the multi-year average). Such weather conditions determined the early continuation of the tillering phase. The stem elongation period at the Kruševac locality in the first season was characterized by slightly lower temperatures and less precipitation compared to the multi-year average, while in Pančevo and Kragujevac, lower temperatures and higher precipitation than average were recorded. April in 2024 was characterized with higher temperatures and average precipitation at all localities, except in Pančevo where less precipitation than average was recorded (Figure 1). In this growth season, weather conditions led to a shortening of stem elongation phase, which affected the vegetative growth of wheat across all three localities.
Lower temperatures and reduced precipitation were recorded at the examined localities during the flowering period in May 2023, with the lowest rainfall observed in Kruševac. May 2023 was characterized by higher mean temperatures in Pančevo and Kragujevac, and slightly below average in Kruševac. In June, in the first growing season, temperatures at all localities were within the multi-year average, with significantly higher precipitation recorded at the Kragujevac and Kruševac (in Kruševac, the total precipitation in June was 204.4 mm, which is 127.5 mm higher compared with the multi-year average). In the second growing season, the mean temperature at all three localities was 2 °C higher than the multi-year average. Precipitation in June was lower at the Pančevo locality, while at the other two localities, it was within the multi-year average (Figure 1). These weather conditions in the second growing season led to earlier ripening of wheat grains and earlier harvest.

2.4. Agro-Morphological Traits

At full maturity (BBCH 89), grain yield and grain yield components were measured. From each plot, 10 plants (30 plants per genotype in three replicates) were randomly sampled for further analysis of grain yield components. Plant height (cm) was measured from the ground level to the top of the spike, excluding awns. Spike length (cm) was measured from the base to the top of the main (primary) spike, excluding awns. The number of grains per spike was obtained by manually counting all grains from the primary spike. Grain yield was determined by harvesting the entire plot area at full maturity and expressed in tons per hectare (t ha−1) and adjusted to a moisture content of 14%.

2.5. Biochemical Parameters

To assess antioxidant activity and evaluate plant responses to prevailing environmental conditions, leaf samples were collected from each plot during three key phenological stages of wheat development, according to the BBCH scale [38]: tillering (BBCH 23—three tillers visible), stem elongation (BBCH 36—sixth node detectable), and anthesis (BBCH 65—full flowering, when 50% of the flowers are open). These growth stages were selected because they represent critical developmental stages characterized by intense metabolic and physiological processes, which can significantly affect the levels of antioxidant compounds. After sampling, the plant material was dried and ground, followed by biochemical analysis of selected parameters. For extraction, 0.2 g of the powdered plant material was weighed and 5 mL of methanol (p.a.) was added. The extraction was carried out in the dark for 24 h. After extraction, centrifugation was performed for 5 min at 8000 rpm (Laboratory mini centrifuge, NIPPON Genetics EUROPE, Düren, Germany). The prepared extracts were stored in a refrigerator at +4 °C until the time of analysis.

2.5.1. DPPH Radical Scavenging Activity

The free radical scavenging ability was tested by a modified method according to Molyneux [39], using the stable DPPH (2,2-diphenyl-1-picrylhydrazyl) radical. The principle of the method is based on the reduction in the DPPH radical (DPPH•) to its reduced form (DPPH-H), which results in a color change from violet to yellow. The free DPPH radical, with an unpaired electron, exhibits maximum absorption at 517 nm. An aliquot of 40 µL of the plant extract was added to 2 mL of DPPH reagent, previously diluted with methanol until its absorbance was 0.70 ± 0.01. The mixture was vortexed and then incubated in the dark at room temperature for 30 min. In the presence of the extract acting as a hydrogen donor, the stable DPPH radical is reduced to DPPH-H, resulting in the loss of the violet color. After incubation, the absorbance was measured at a wavelength of 517 nm using a UV/VIS spectrophotometer (Shimadzu UV-1800, Shimadzu USA Manufacturing, Canby, OR, USA). The free DPPH radical scavenging activity was calculated using a trolox calibration curve and expressed in milligrams of trolox equivalent (TE) per gram of dry plant material (mg TE g−1 d.m.). All measurements were performed in triplicate.

2.5.2. Total Phenolic Content

The total phenolic content (TPC) in plant extracts was determined by the Folin–Ciocalteu method according to Singleton and Rossi [40]. For the analysis, an aliquot of 20 µL of plant extract was used, to which 0.2 mL of Folin–Ciocalteu reagent diluted with distilled water in a ratio of 1:9 was added, then 2 mL of distilled water and 1 mL of 7.5% sodium carbonate. In an alkaline medium, phenolic compounds reduce the Folin–Ciocalteu reagent, which contains phosphomolybdate and phosphotungstate, forming a blue complex. The intensity of the blue color is proportional to the concentration of total phenols in the sample. After incubation of the reaction mixture for 25 min in a water bath at 45 °C, the absorbance of the mixture was read at a wavelength of 765 nm using a UV/VIS spectrophotometer (Shimadzu UV-1800, Shimadzu USA Manufacturing, USA). The total phenol content was calculated using a gallic acid calibration curve and expressed in milligrams of gallic acid equivalents per gram of dry matter (mg GAE g−1 d.m.). All measurements were performed in triplicate.

2.6. Statistical Analysis

Analysis of variance (ANOVA) was performed using the stats package in R version 4.3.2 (R Project for Statistical Computing, R Foundation for Statistical Computing, Vienna, Austria, [41]) to assess the effects of factors and their interactions on the analyzed traits (agromorphological and biochemical parameters). The assumptions of ANOVA, including normality and homoscedasticity, were checked using the Shapiro–Wilk test (stats package, [41]) and Levene’s test (car package, [42]), and both were satisfied. Differences between factor levels were tested for significance using the Tukey HSD test implemented in the agricolae package [43] at the 1% and 5% significance levels.
To assess the stability of genotypes and genotype × environment interaction (GEI) for grain yield, the Additive Main Effects and Multiplicative Interaction (AMMI) model was applied. This method combines analysis of variance (ANOVA) for additive effects and principal component analysis (PCA) for multiplicative interaction effects, providing a detailed understanding of the performance of genotypes across environments [44]. The AMMI1 biplot displays the main effects of genotype and environment (mean values) on the x-axis against the values of the first axis of the principal components of interaction (IPCA1) on the y-axis. The AMMI2 biplot is created based on the values of the first interaction principal component axis (IPCA1) on the x-axis and the values of the second interaction principal component axis (IPCA2) on the y-axis, which together explained over 70% of the GEI, allowing for a more detailed evaluation of the interaction pattern. Both AMMI1 and AMMI2 biplots were generated using Microsoft Excel based on the results of the AMMI analysis obtained in R version 4.3.2 [42] using the metan package [45]. In addition, in order to rank the genotypes based on their stability, AMMI stability values (ASVs) were calculated according to the formula proposed by Purchase [46]. This analysis takes into account both principal component interaction axes (IPCA1 and IPCA2) from the AMMI analysis.
With the aim of identifying genotypes with high yield and stability in different agroecological conditions (environments), as well as defining potential mega-environments, a GGE biplot analysis (Genotype plus Genotype by Environment interaction) was performed. The first two principal components, explaining over 70% of the total variation, were used to construct a series of biplot analyses, such as: Mean vs. Stability, Which-Won-Where, Discriminative vs. Representativeness, and Ranking Genotypes. This analysis was performed using the metan package in R [45].
Principal component analysis (PCA) was applied to explore the relationships between agro-morphological traits and biochemical parameters across localities. The analysis included phenotypic data from 15 genotypes evaluated at three localities. Nine variables, representing agro-morphological traits and biochemical parameters, were included in the analysis and are visualized as vectors on the PCA biplots. Before the analysis, all variables were standardized by centering on their mean and scaling to unit variance to remove the effects of different measurement scales. This analysis was performed using R version 4.3.2, applying singular value decomposition (SVD) on the standardized data matrix. The results were graphically presented to visualize the distribution of data per locality and the contribution of each variable to the principal components. PCA biplots (PC1 vs. PC2) were generated using the factoextra package [47] in R to visualize data structure in two dimensions. Given that three principal components (PC1, PC2, and PC3) with eigenvalues greater than 1 were identified, a 3D plot was created using the Plotly library (4.11.0) in R [48].

3. Results

3.1. Phenotypic Variability of Yield and Yield-Related Traits

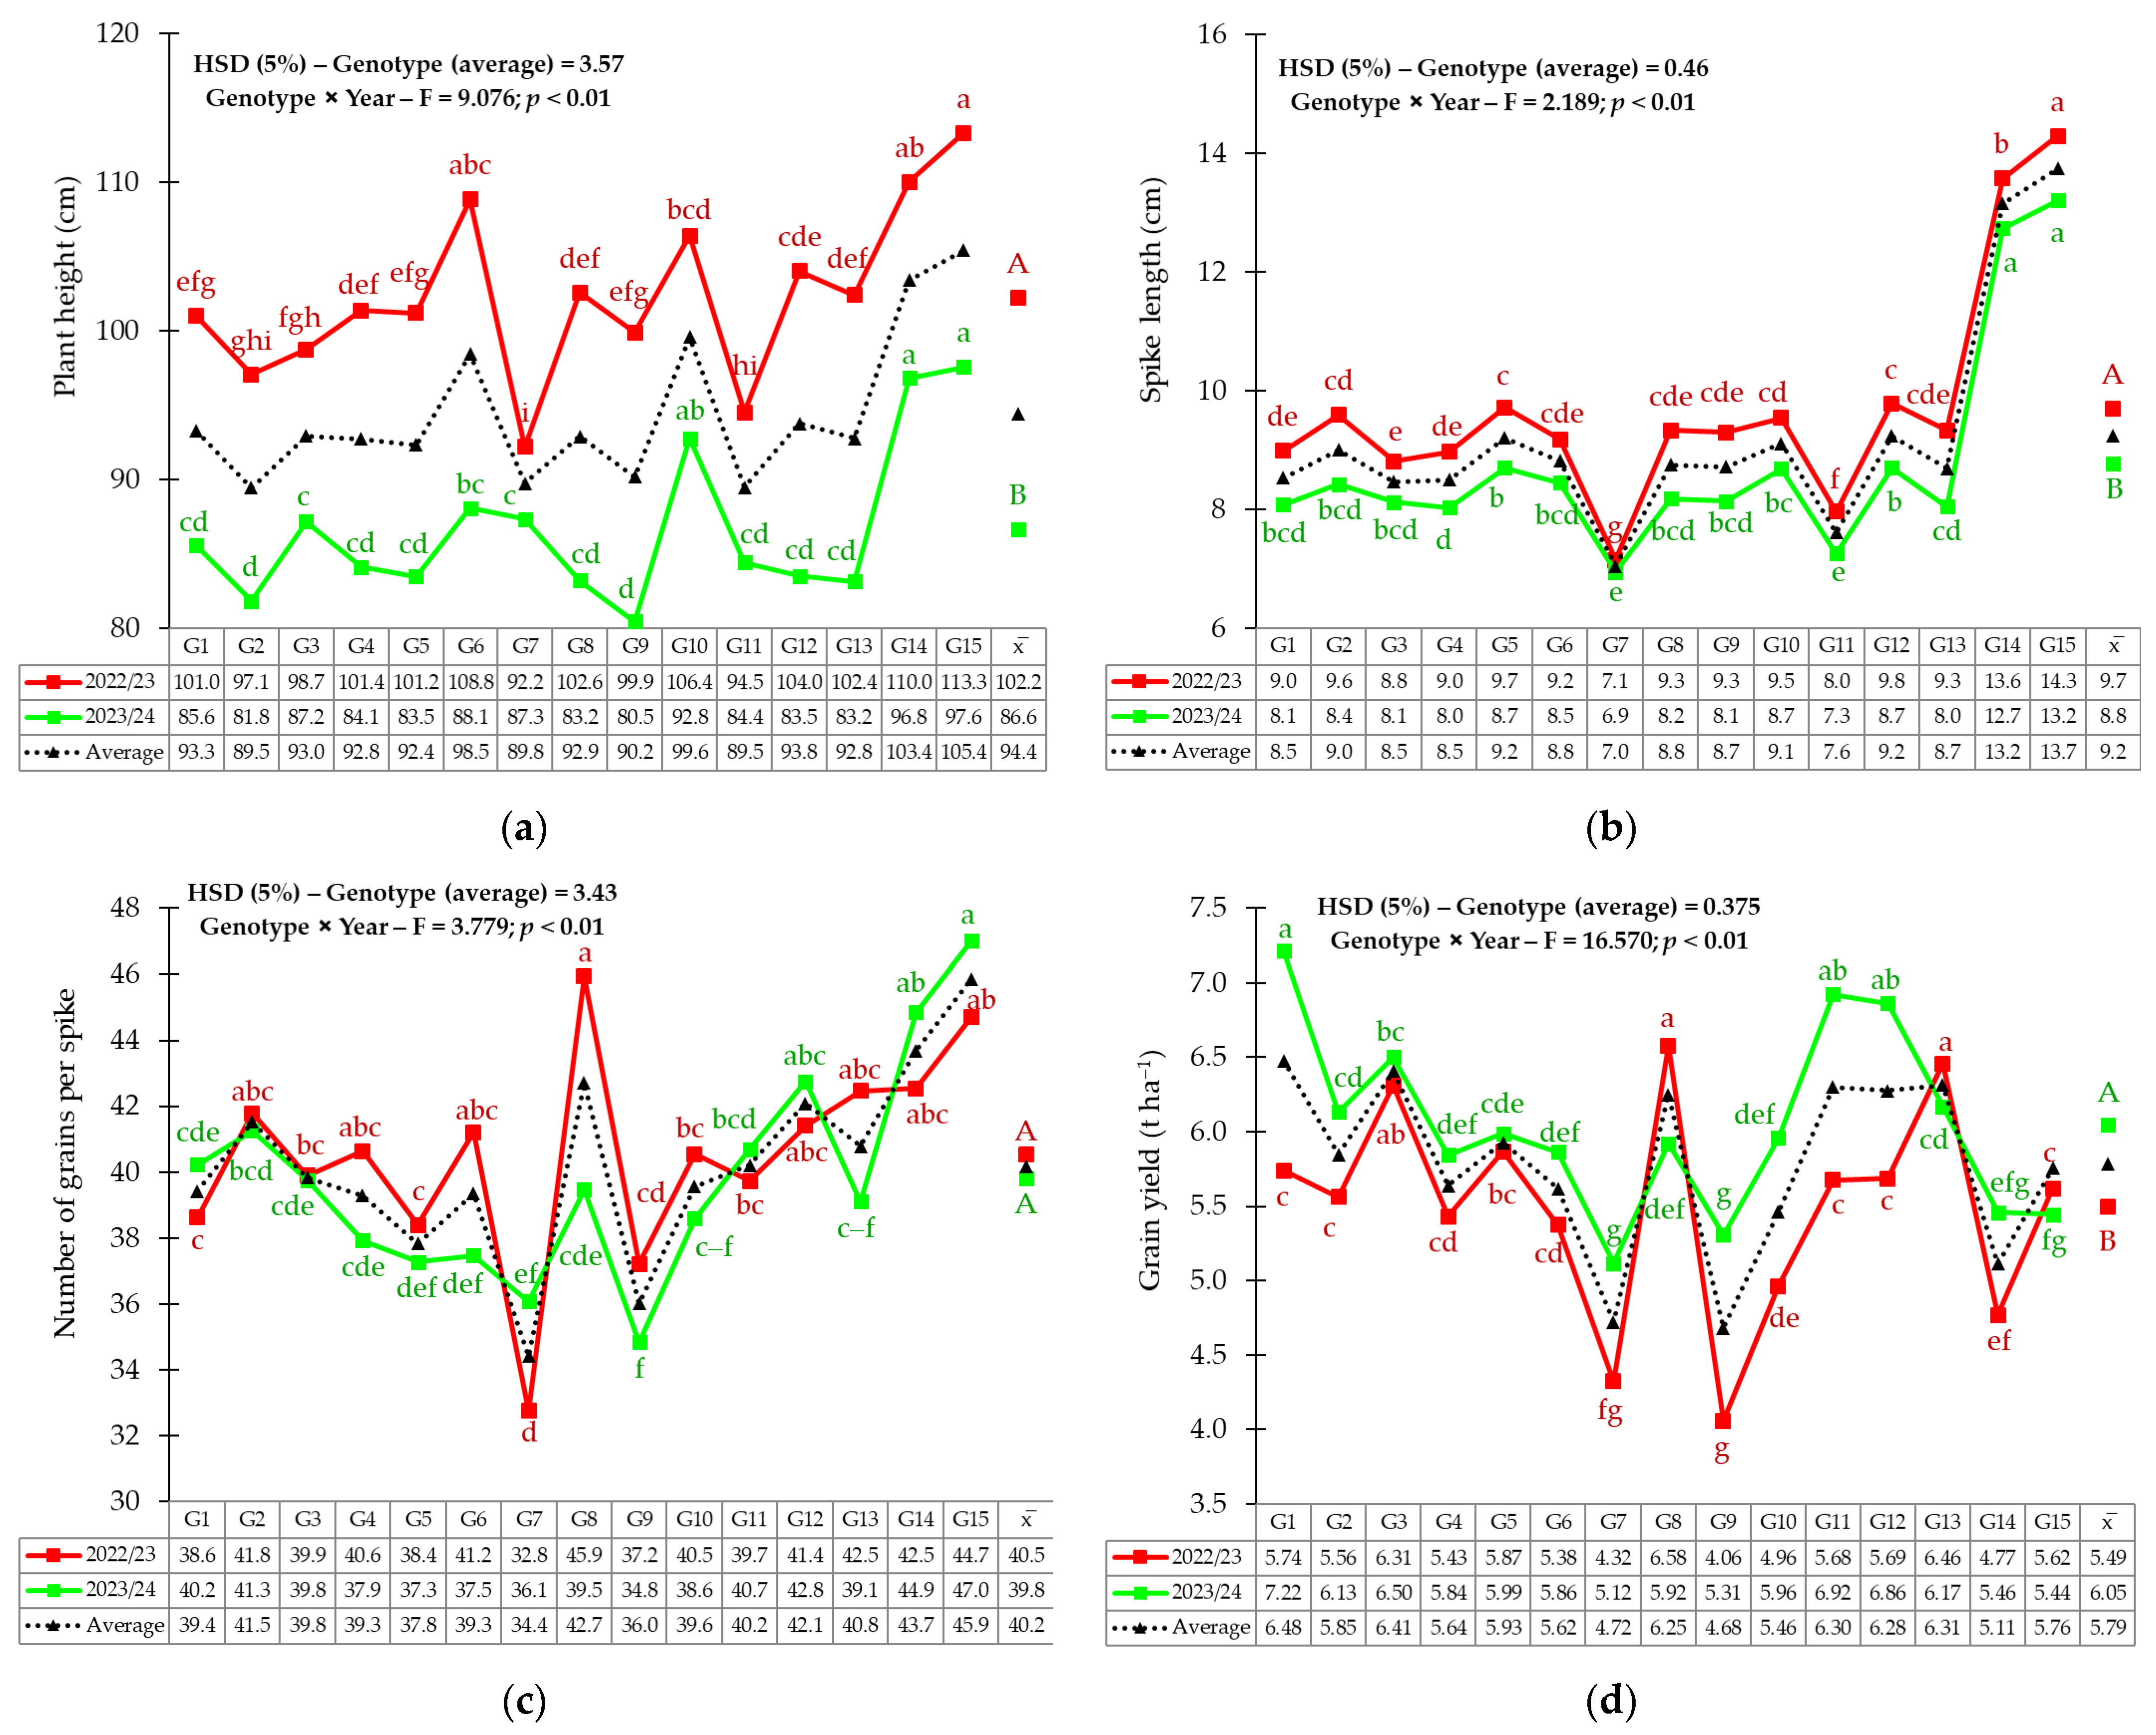
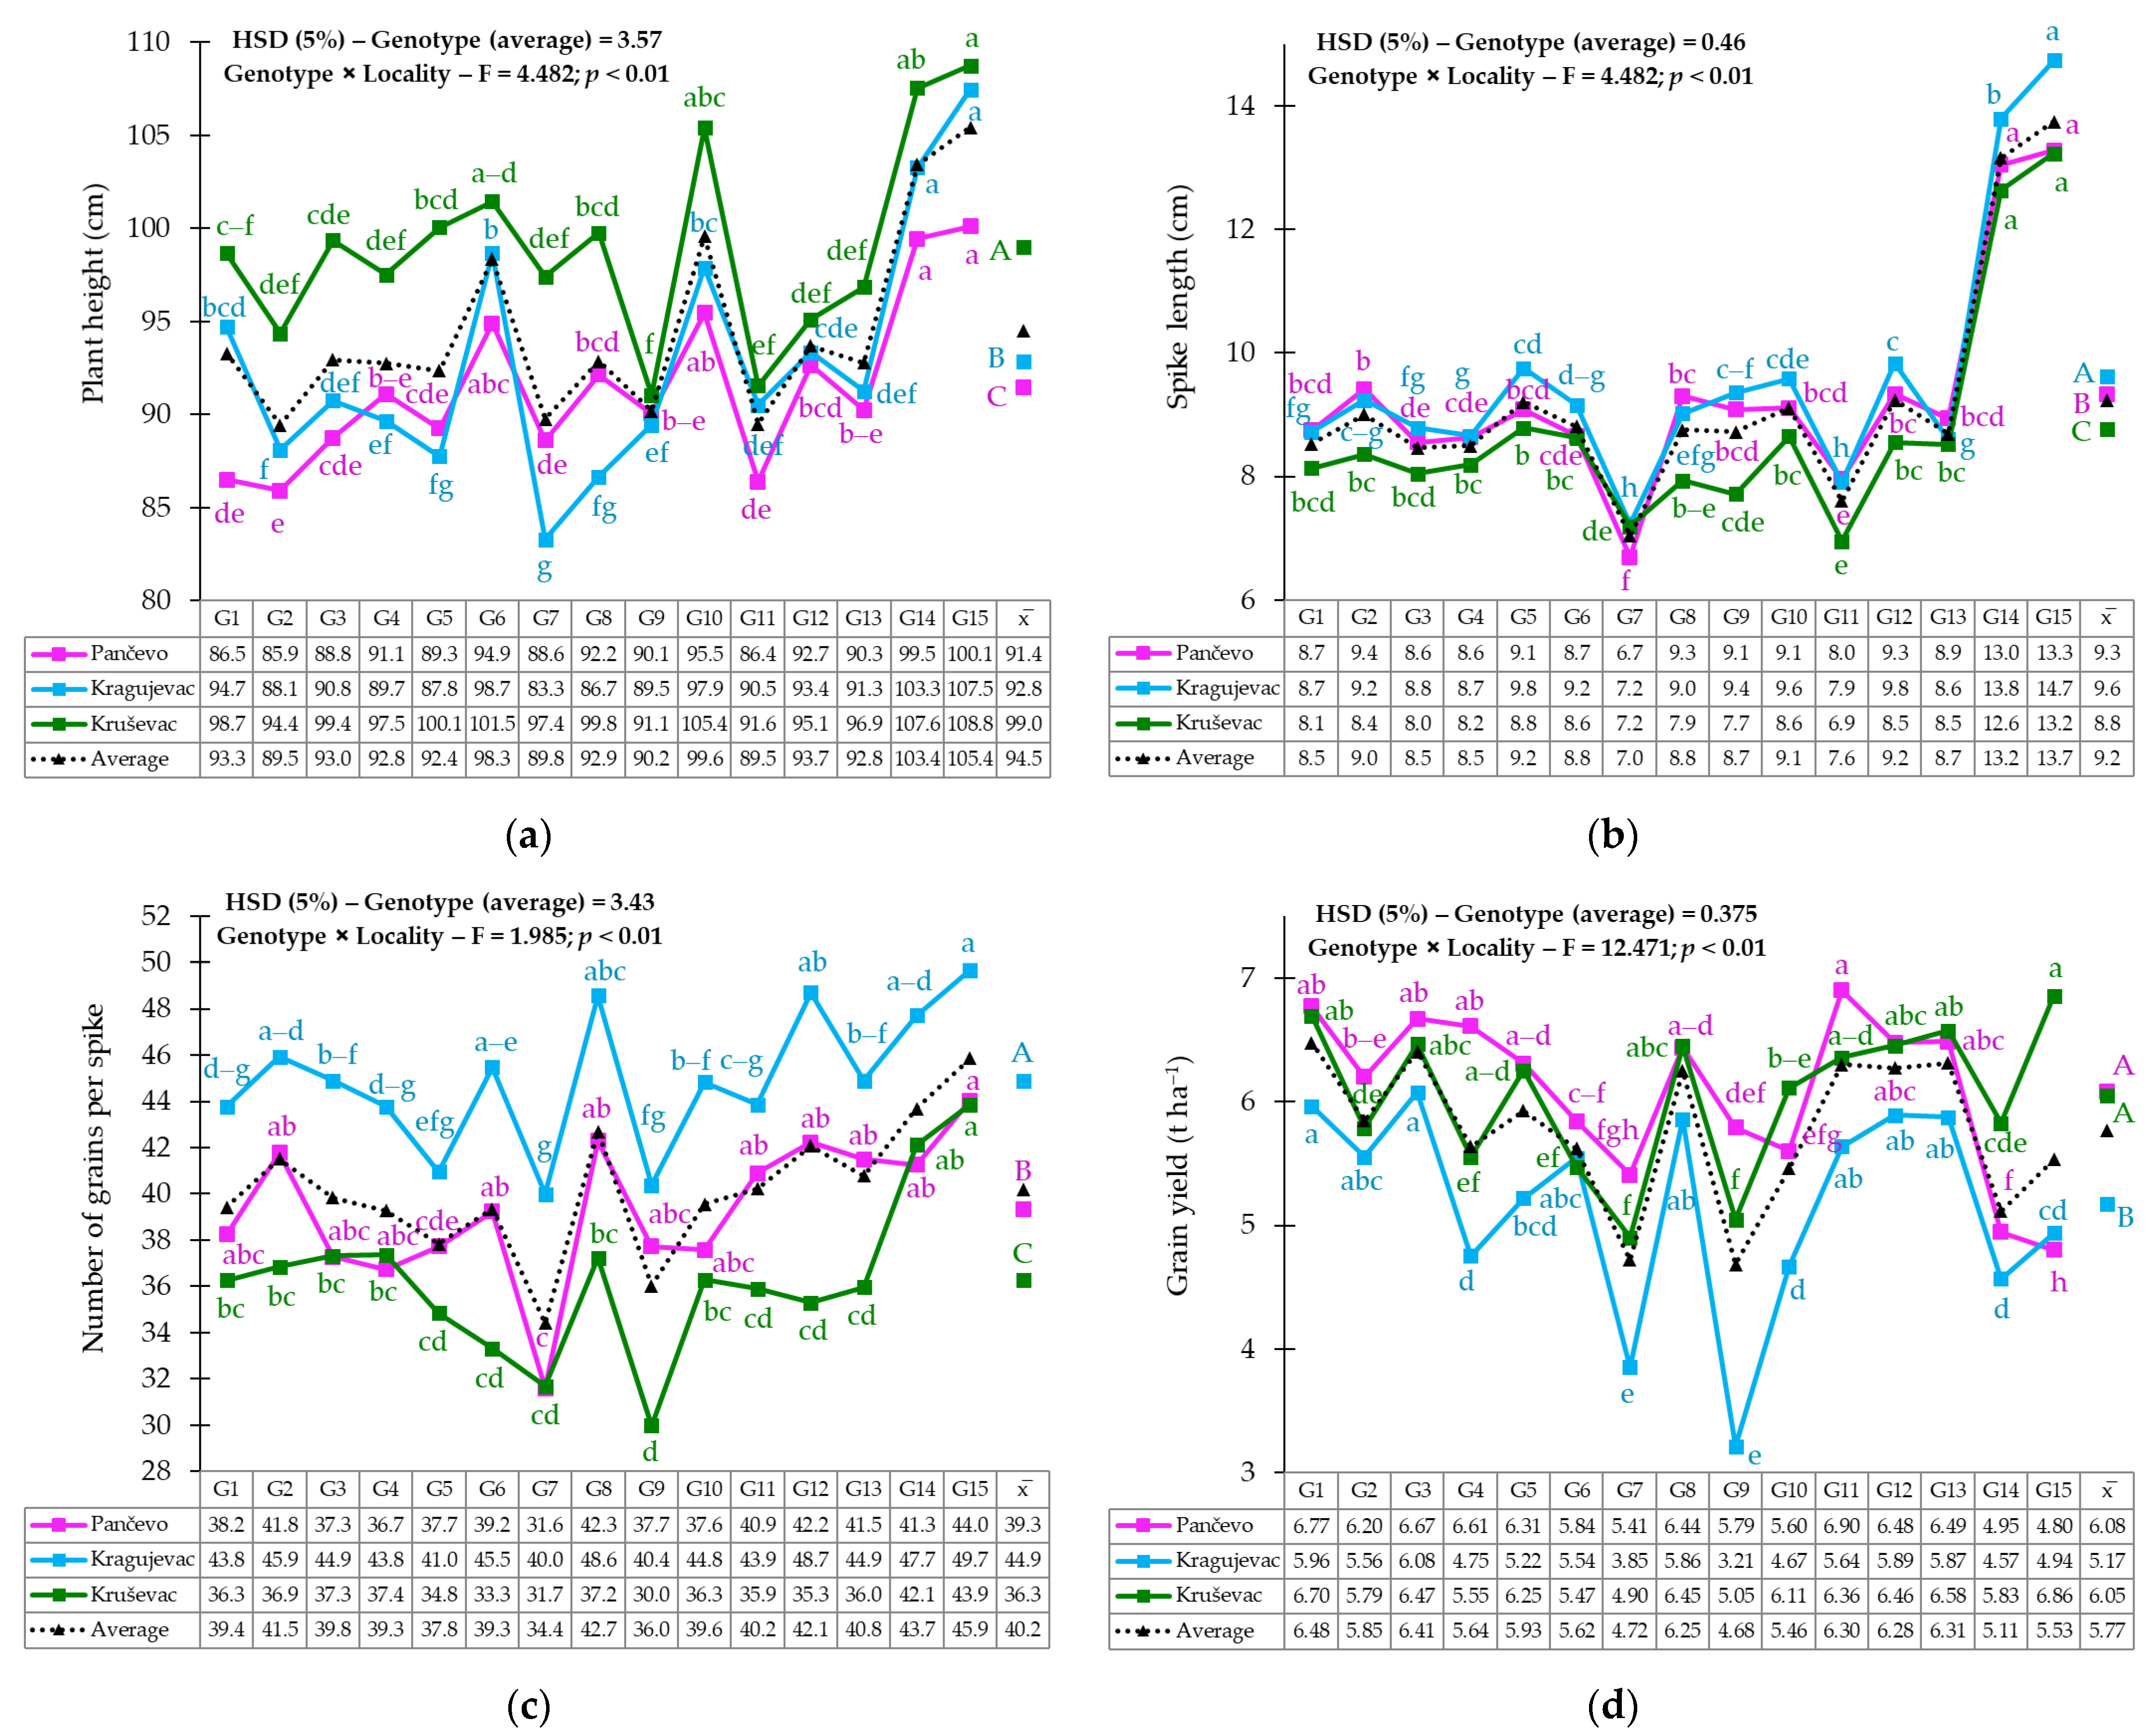
Analysis of variance indicated statistically significant effects of genotype, locality, year and their interactions on all examined traits (plant height, spike length, number of grains per spike, and grain yield) (Table S2, Figure S1). For plant height, the highest mean square value (MS) was recorded for the year factor (MS = 16,403.4), indicating the dominant influence of seasonal variations, primarily temperature and precipitation during vegetative phases, on this trait (Table S2). Significantly higher values were recorded in the first season (102.2 cm) compared with the second season (86.6 cm) (Figure 2a). When it comes to localities, the highest value was observed in Kruševac (99.0 cm), and the lowest in Pančevo (91.4 cm), on average for both seasons (Figure 3a). The spelt wheat genotypes KG-54-7/3-5 (G14) and KG-54-7/3-2 (G15) had the highest plant height in both seasons and all localities, whereas genotype KG-41/1 (G9) showed the lowest plant height in the 2023/2024 season and KG-33/1 (G7) in Kragujevac locality (Figure 2a and Figure 3a). The most pronounced changes in height between seasons, were recorded by genotypes Renesansa (G12), KG-41/1 (G9), and KG-30/1 (G6) (Figure 2a). Line KG-33/1 (G7) had the greatest contribution to the genotype × locality (Figure 3a).
Spike length was the most influenced by the factor of genotype (MS = 59.01), which indicates that this trait is more genetically determined (Table S2). The highest values of this trait were observed in genotypes of spelt wheat (over 13 cm), while the lowest spike length (7.0 cm) was measured in line KG-33/1 (G7). Spike length was significantly (p ˂ 0.05) higher in the first season (9.7 cm) than in the second (8.8 cm) and tended to be higher in Kragujevac (9.6 cm) and Pančevo (9.3 cm) compared to Kruševac (8.8 cm) (Figure 2b and Figure 3b). The genotype × locality interaction was significant for this trait (F = 4.482) (Table S2), where the largest contribution was achieved by lines KG-40/1 (G8) and KG-41/1 (G9). The least variation in spike length across localities was observed for line KG-33/1 (G7) (Figure 3b).
Average value of number of grains per spike was slightly higher in the first season (40.5) compared to the second (38.8), but this difference was not statistically significant (p ˃ 0.05) (Figure 2c). Locality factor (MS = 1717.39) had the greatest influence on the variation in this trait, where the highest average value was established in Kragujevac (44.9), followed by Pančevo (39.3), and the lowest one in Kruševac (36.3) (Table S2, Figure 3c). Genotype G7 had the lowest value of number of grains per spike, while the highest value had genotype G15 (47.0) (Figure 2c and Figure 3c). The largest contribution to the genotype × year interaction had genotype G8, which had the highest value of number of grains per spike in 2022/2023 season, with a decrease of 14.1% in the second season (Figure 2c). The greatest contribution to the genotype × locality interaction regarding the number of grains per spike was made by genotypes G6, G9, and G12, which had on average more than 25% lower values in Kruševac compared to those achieved in Kragujevac (Figure 3c).
The greatest influence on the phenotypic expression of grain yield had the locality factor (MS = 24.09) (Table S2). The grain yield was the highest in Pančevo (6.08 t ha−1), with no statistical differences (p ˃ 0.05) compared to the yield achieved at Kruševac (6.05 t ha–1), while a significantly lower (p < 0.05) grain yield was achieved at Kragujevac (5.17 t ha–1). The lowest grain yield was recorded in genotype KG-41/1 (G9) in Kragujevac, while the highest grain yield was observed in genotype NS 40S (G11) in Pančevo (Figure 3d). Grain yield was significantly higher in the second season (6.05 t ha−1) compared to the first (5.49 t ha−1), with a significant genotype × year interaction (F = 16.570; p < 0.01). Most genotypes achieved higher values of grain yield in the second season, while KG-40/1 (G8), Pobeda (G13), and KG-54-7/3-2 (G15) had higher grain yield in the first season (Figure 2d). Genotype KG-41/1 (G9) contributed most strongly to both genotype × locality and genotype × year interactions (Figure 2d and Figure 3d).

3.2. Genotype × Environment Interaction

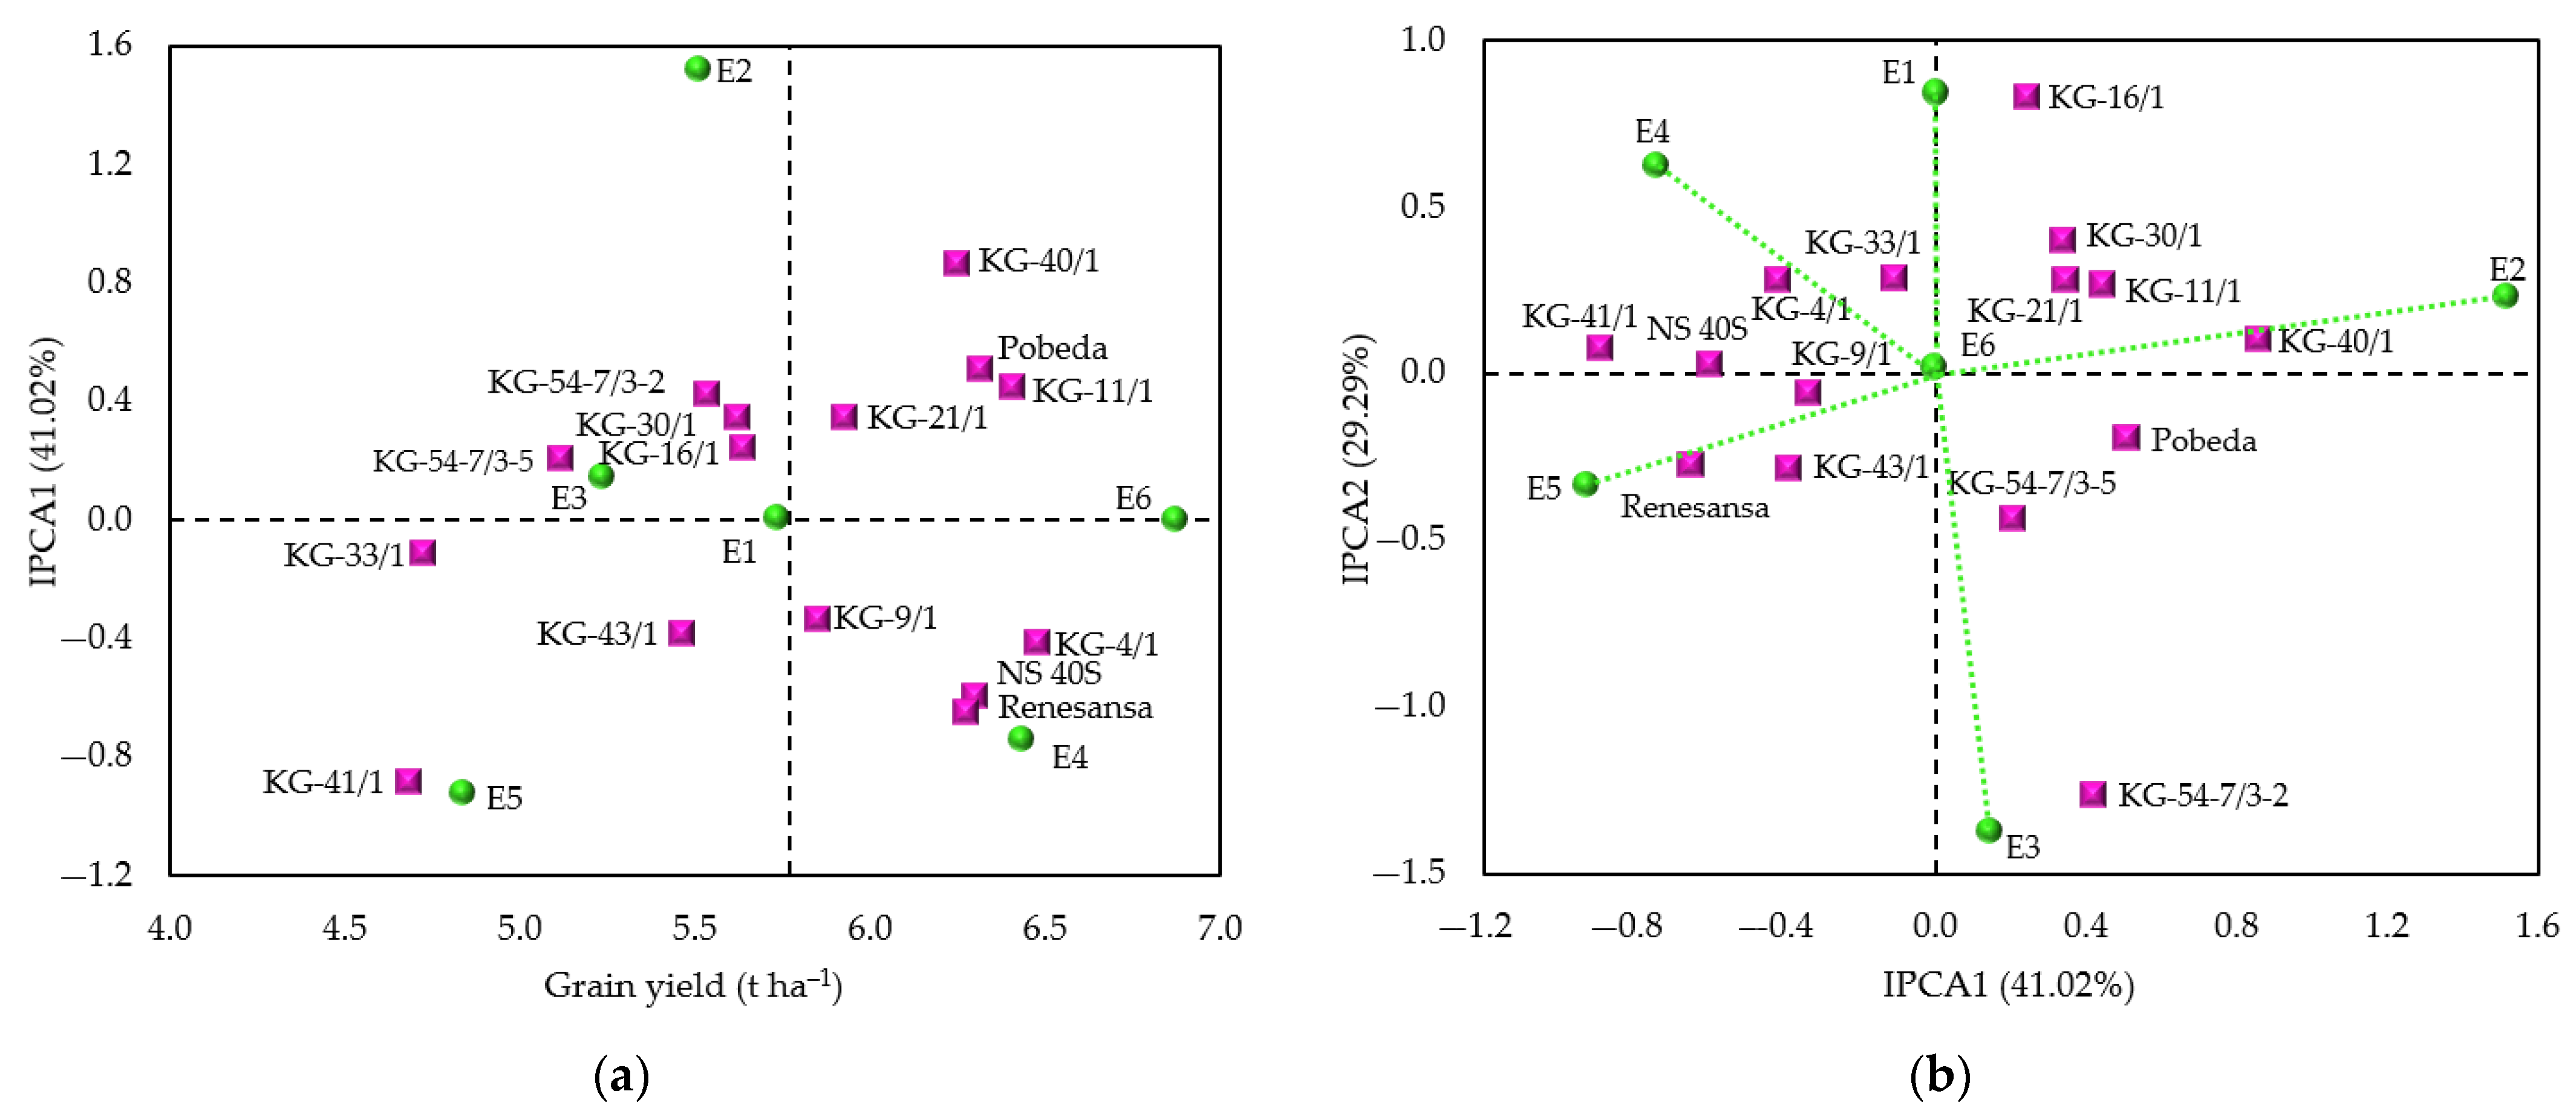
Given the significant influence of GEI on grain yield variation, a detailed analysis of interaction effect was conducted using the AMMI model for this trait (Table S3). The largest share of the total grain yield variation was accounted for by the environment (29.4%), while a smaller share is explained by the factor of genotype (20.0%). Genotype × environment interaction explained 23.08% of the total variation in grain yield (Table S3). To better understand the interaction structure, AMMI1 and AMMI2 biplots were constructed (Figure 4). The AMMI1 biplot presents mean grain yields (x-axes) against the first interaction principal component (IPCA1), which accounts for 41.02% of the interaction sum of squares. From the distribution of genotypes and environments on the AMMI1 biplot, an almost equal influence of the additive and multiplicative parts of variation on the phenotypic expression of grain yield is observed (Figure 4a).
The most stable genotype, located close to the x-axis, was KG-33/1, which also showed low mean grain yield across environments. High stability was also observed in genotypes KG-54-7/3-5 and KG-16/1, whose average values of grain yield were slightly below the overall trial mean. On the other hand, high-yielding genotypes, such as KG-11/1, Pobeda, and KG-4/1, demonstrated moderate overall stability, which makes these genotypes valuable genetic resources for breeding programs aimed at improving yield potential and stability. The most unstable genotype was KG-41/1, with the lowest average grain yield (Figure 4a). To further explore GEI, an AMMI2 biplot was generated, incorporating both IPCA1 and IPCA2 axes, which together explained over 70% of the interaction. Additionally, genotype stability was calculated using AMMI Stability Values (ASVs), which consider the combined effects of both IPCA1 and IPCA2 (Table S4). Genotypes located close to the origin, such as KG-33/1, KG-9/1, KG-43/1, KG-21/1, and KG-54-7/3-5, had low values for both IPCA axes, low ASVs, and were considered highly stable across environments. Genotype KG-54-7/3-2, which was the farthest from the origin and had the highest ASV, was positioned close to the vector of environment E3 (Kruševac 2022/2023), indicating strong adaptation to specific conditions. Also, genotype KG-40/1, with a high IPCA1 and high ASV, displayed overall instability, but showed specific adaptability in environment E2 (Kragujevac 2022/2023) (Figure 4b, Table S4). Genotype Renesansa was positioned close to the vector of environment E5 (Kragujevac 2023/2024), indicating a positive interaction with that environment. Environments E1 (Pančevo 2022/2023) and E4 (Pančevo 2023/2024) are positioned closest to each other, indicating that they provide similar conditions for genotype ranking. Genotypes NS 40S and KG-41/1 were positioned closer to environment E4 (Pančevo 2023/2024), while genotype KG-16/1 showed a positive interaction with environment E1 (Pančevo 2022/2023) (Figure 4b).
Table 3 presents the ranking of genotypes across different environments based on their mean grain yield values. It is evident that, in all environments, one or two of the tested standard varieties (NS 40S, Renesansa, and Pobeda) were consistently ranked among the top four genotypes, highlighting their agronomic relevance. Among the tested KG breeding lines, KG-4/1 demonstrated the most consistent high performance, ranking within the top four genotypes in the largest number of environments (E1—Pančevo 2022/2023, E4—Pančevo 2023/2024, E5—Kragujevac 2023/2024, and E6—Kruševac 2023/2024). Also, KG-11/1 and KG-40/1 were ranked in the top four genotypes in several environments (Table 3).
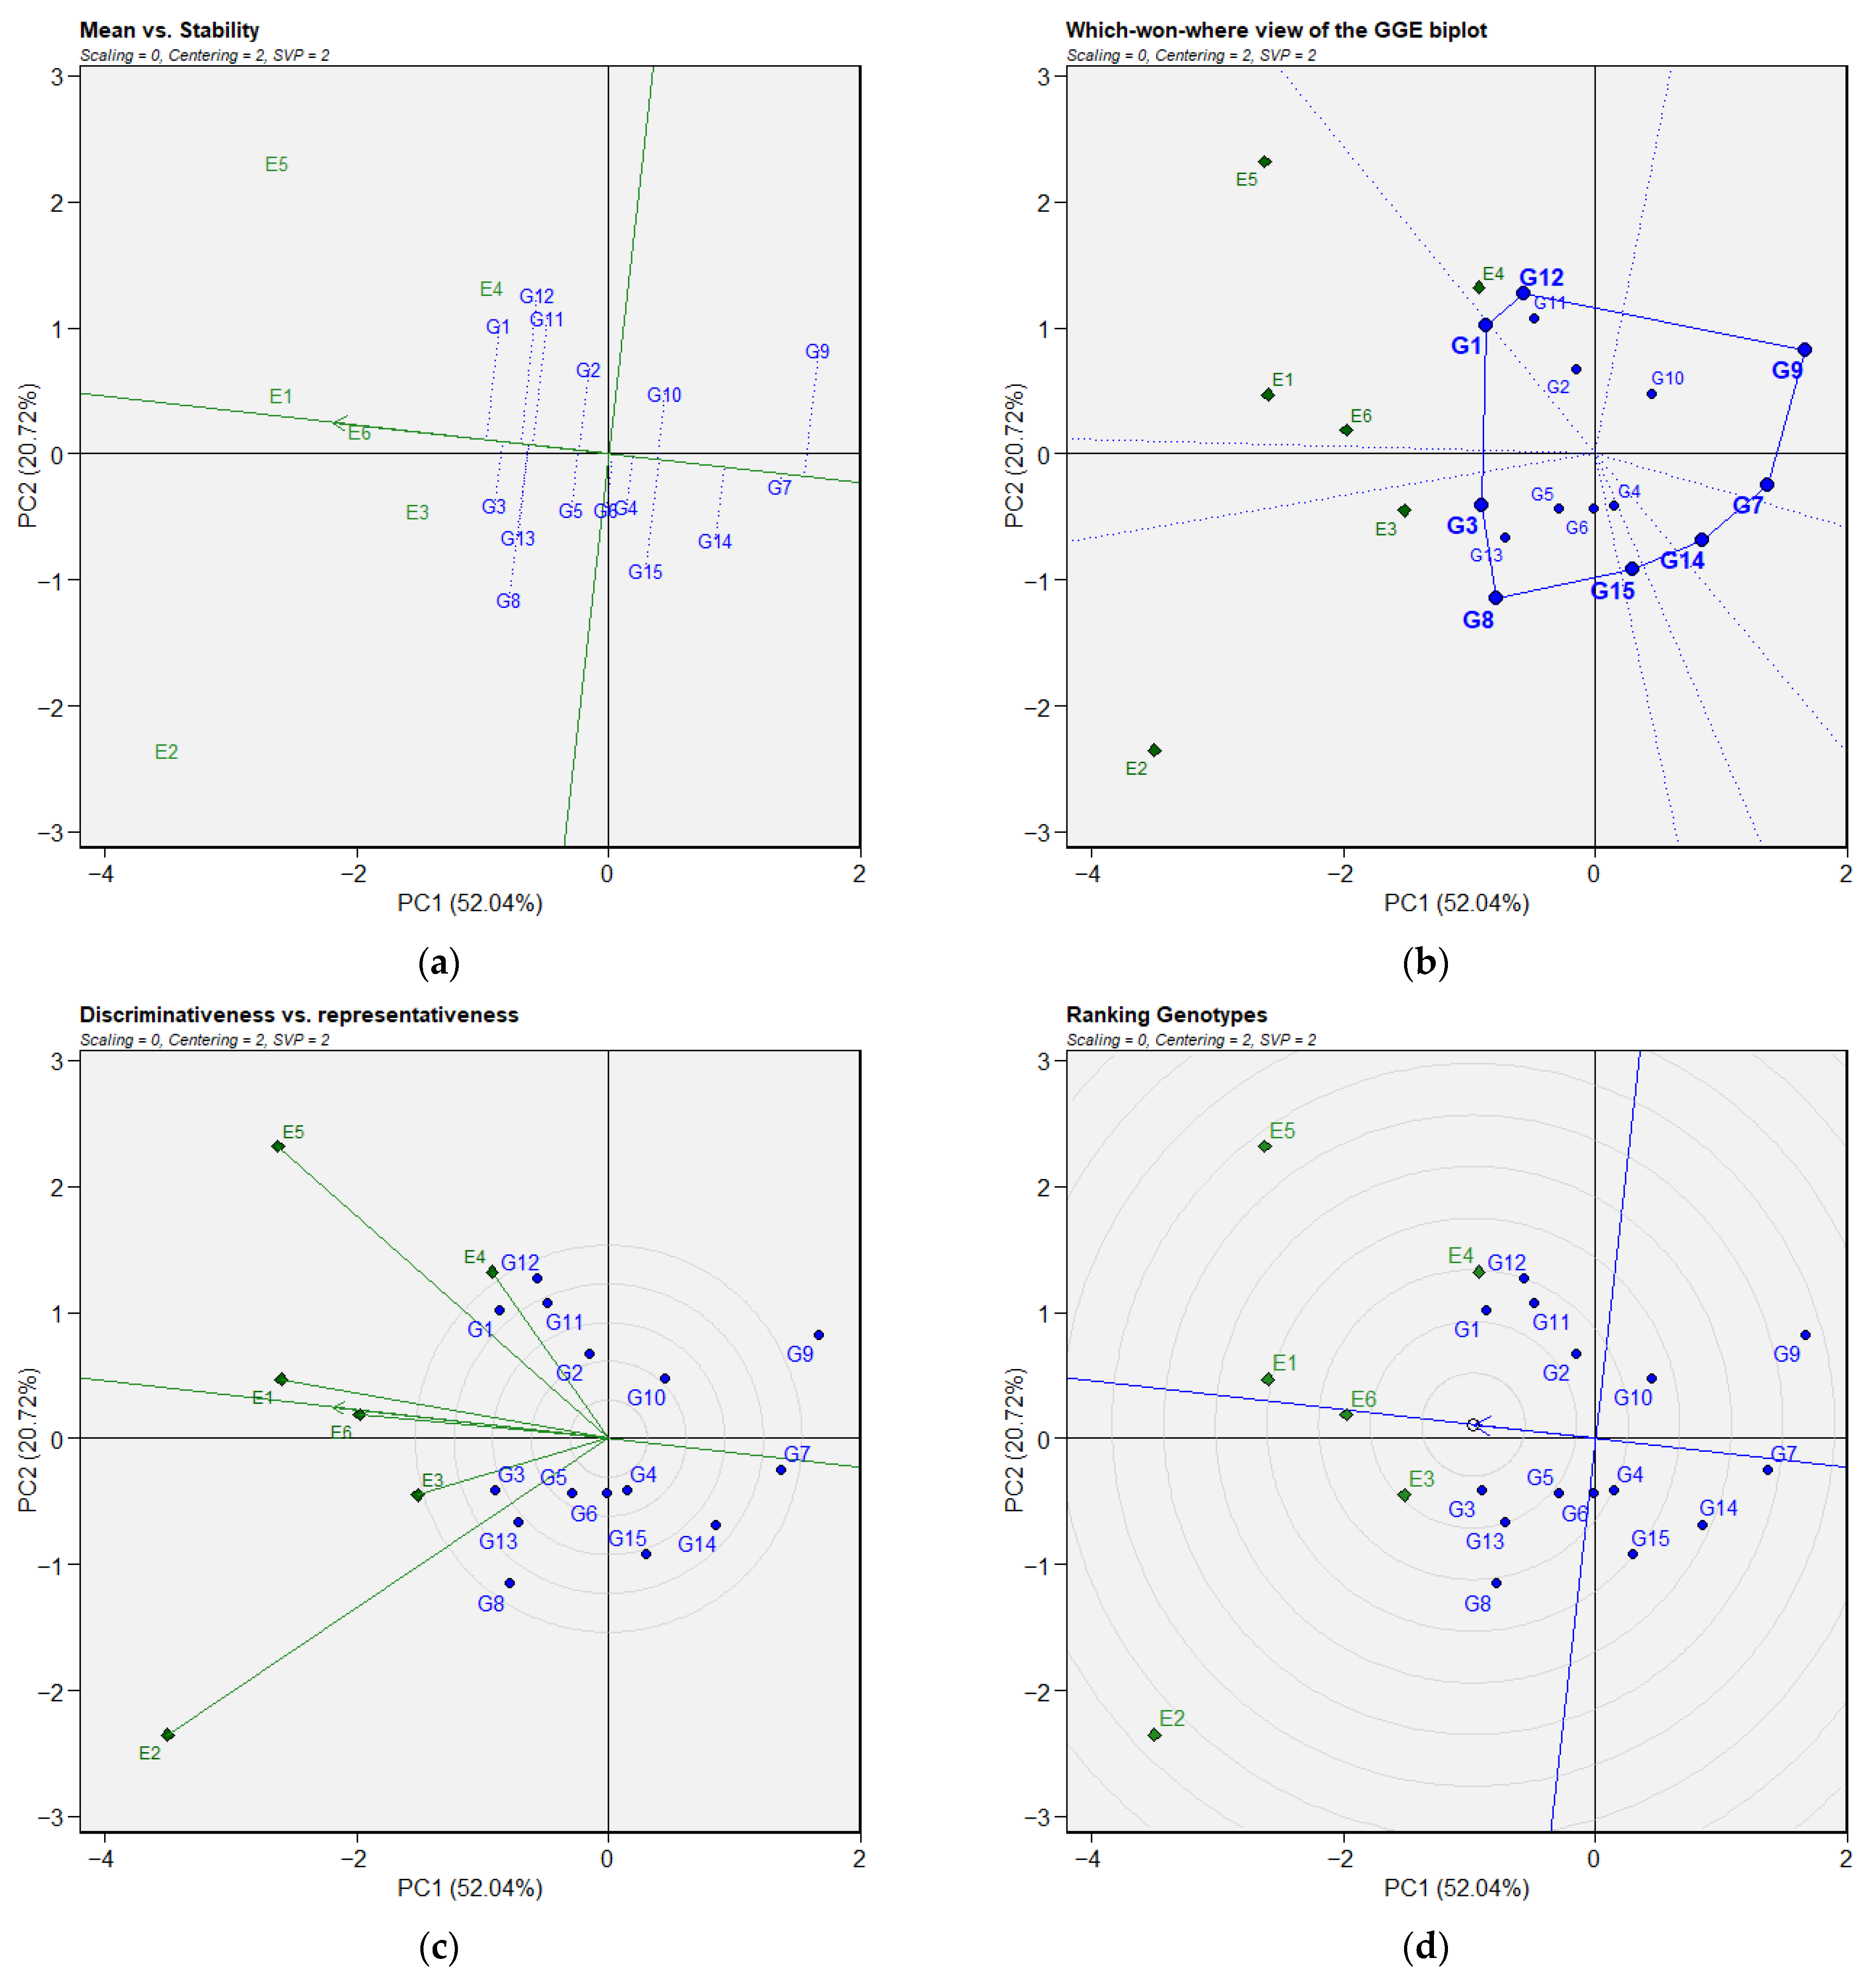
Genotype plus Genotype by Environment (GGE) biplot analysis was performed to assess genotype stability, specific adaptability, and to identify mega-environments. In the GGE biplots (Figure 5a–d), PC1 and PC2 together explain most of the variation in the data (72.76% of the total variation). The Mean vs. Stability view of the GGE biplot (Figure 5a), displays both the mean yield and the stability of genotypes across environments. Genotypes G1 (KG-4/1), G3 (KG-11/1), and G13 (Pobeda) were ranked as the most productive, as they are positioned in the direction of the arrow on the Average Environment Coordination (AEC) abscissa. Among them, G3 (KG-11/1) and Pobeda exhibited the highest stability, having the lowest projection on the AEC ordinate, indicating their suitability for broad adaptation across Serbian agroecological zones. Genotype G7 (KG-33/1), which has almost zero projection onto the AEC ordinate, was identified as the most stable, i.e., it had the lowest contribution to GEI. In contrast, genotypes G8 (KG-40/1), G11 (NS 40S) and G12 (Pobeda) were high-yielding but low stable, indicating suitability for specific environments (Figure 5a). In order to identify winning genotypes in specific environments, as well as to identify megaenvironments, a which-won-where GGE biplot was created (Figure 5b). Genotypes G1 (KG-4/1), G3 (KG-11/1), G8 (KG-40/1), G15 (KG-54-7/3-2), G14 (KG-54-7/3-5), G7 (KG-33/1), G9 (KG-41/1), and G12 (Renesansa) are positioned furthest from the biplot origin in various directions, and form a polygon. Set of perpendicular lines drown from the origin divided the plot into sectors. The genotype located at the vertex (top) of the polygon within a particular sector represents the winning genotype in that sector. In this case, all environments were grouped into three sectors, each associated with a different winning genotype. The genotype G12 (Pobeda) wins in the sector where the environment E4 (Pančevo 2023/2024) is positioned, showing potential for targeted breeding. Genotype G1 (KG-4/1) performs best in multiple environments (E1—Pančevo 2022/2023, E5—Kragujevac 2023/2024, and E6—Kruševac 2023/2024), which together form a mega-environment. This indicates its broad adaptation and potential value in breeding programs aimed at developing widely adaptable and high-yielding wheat varieties. Genotypes G7 (KG-33/1), G9 (KG-41/1), G14 (KG-54-7/3-5), and G15 (KG-54-7/3-2), positioned within the sector that does not contain any environment, are characterized by low grain yield at the trial level. Genotypes G4 (KG-16/1), G5 (KG-21/1), G6 (KG-30/1), G2 (KG-9/1), and G10 (KG-43/1), positioned near the center of the biplot, exhibit the greatest stability across the tested environments (Figure 5b).
Discriminativeness vs. representativeness view of GGE biplot was created to assess the environments’ ability to differentiate and represent genotypes (Figure 5c). The E2 environment (Kragujevac 2022/2023), with the longest vector, showed the highest capacity for genotype differentiation based on grain yield. In contrast, the environment E3 (Kruševac 2022/2023), with the shortest vector, had the weakest capacity for genotype differentiation. The environments E6 (Kruševac 2023/2024), E1 (Pančevo 2022/2023), and E3 (Kruševac 2022/2023) form the smallest angle with the AEC abscissa, indicating that they are more representative, better reflecting the average trial conditions and thus are suitable for evaluating broadly adapted genotypes (Figure 5c). Ranking genotypes GGE biplot (Figure 5d) was created to rank genotypes and identify ideal genotypes within the examined set. Genotypes G3 (KG-11/1) is positioned closest to the imagined ideal genotype, which is represented by the smallest inner concentric circle on the AEC abscissa. Genotypes G12 (Pobeda), G5 (KG-21/1), and G1 (KG-4/1), are also positioned near the ideal genotype, making them promising candidates for breeding broadly adapted, high-yielding wheat varieties (Figure 5d).

3.3. Antioxidant Activity Parameters

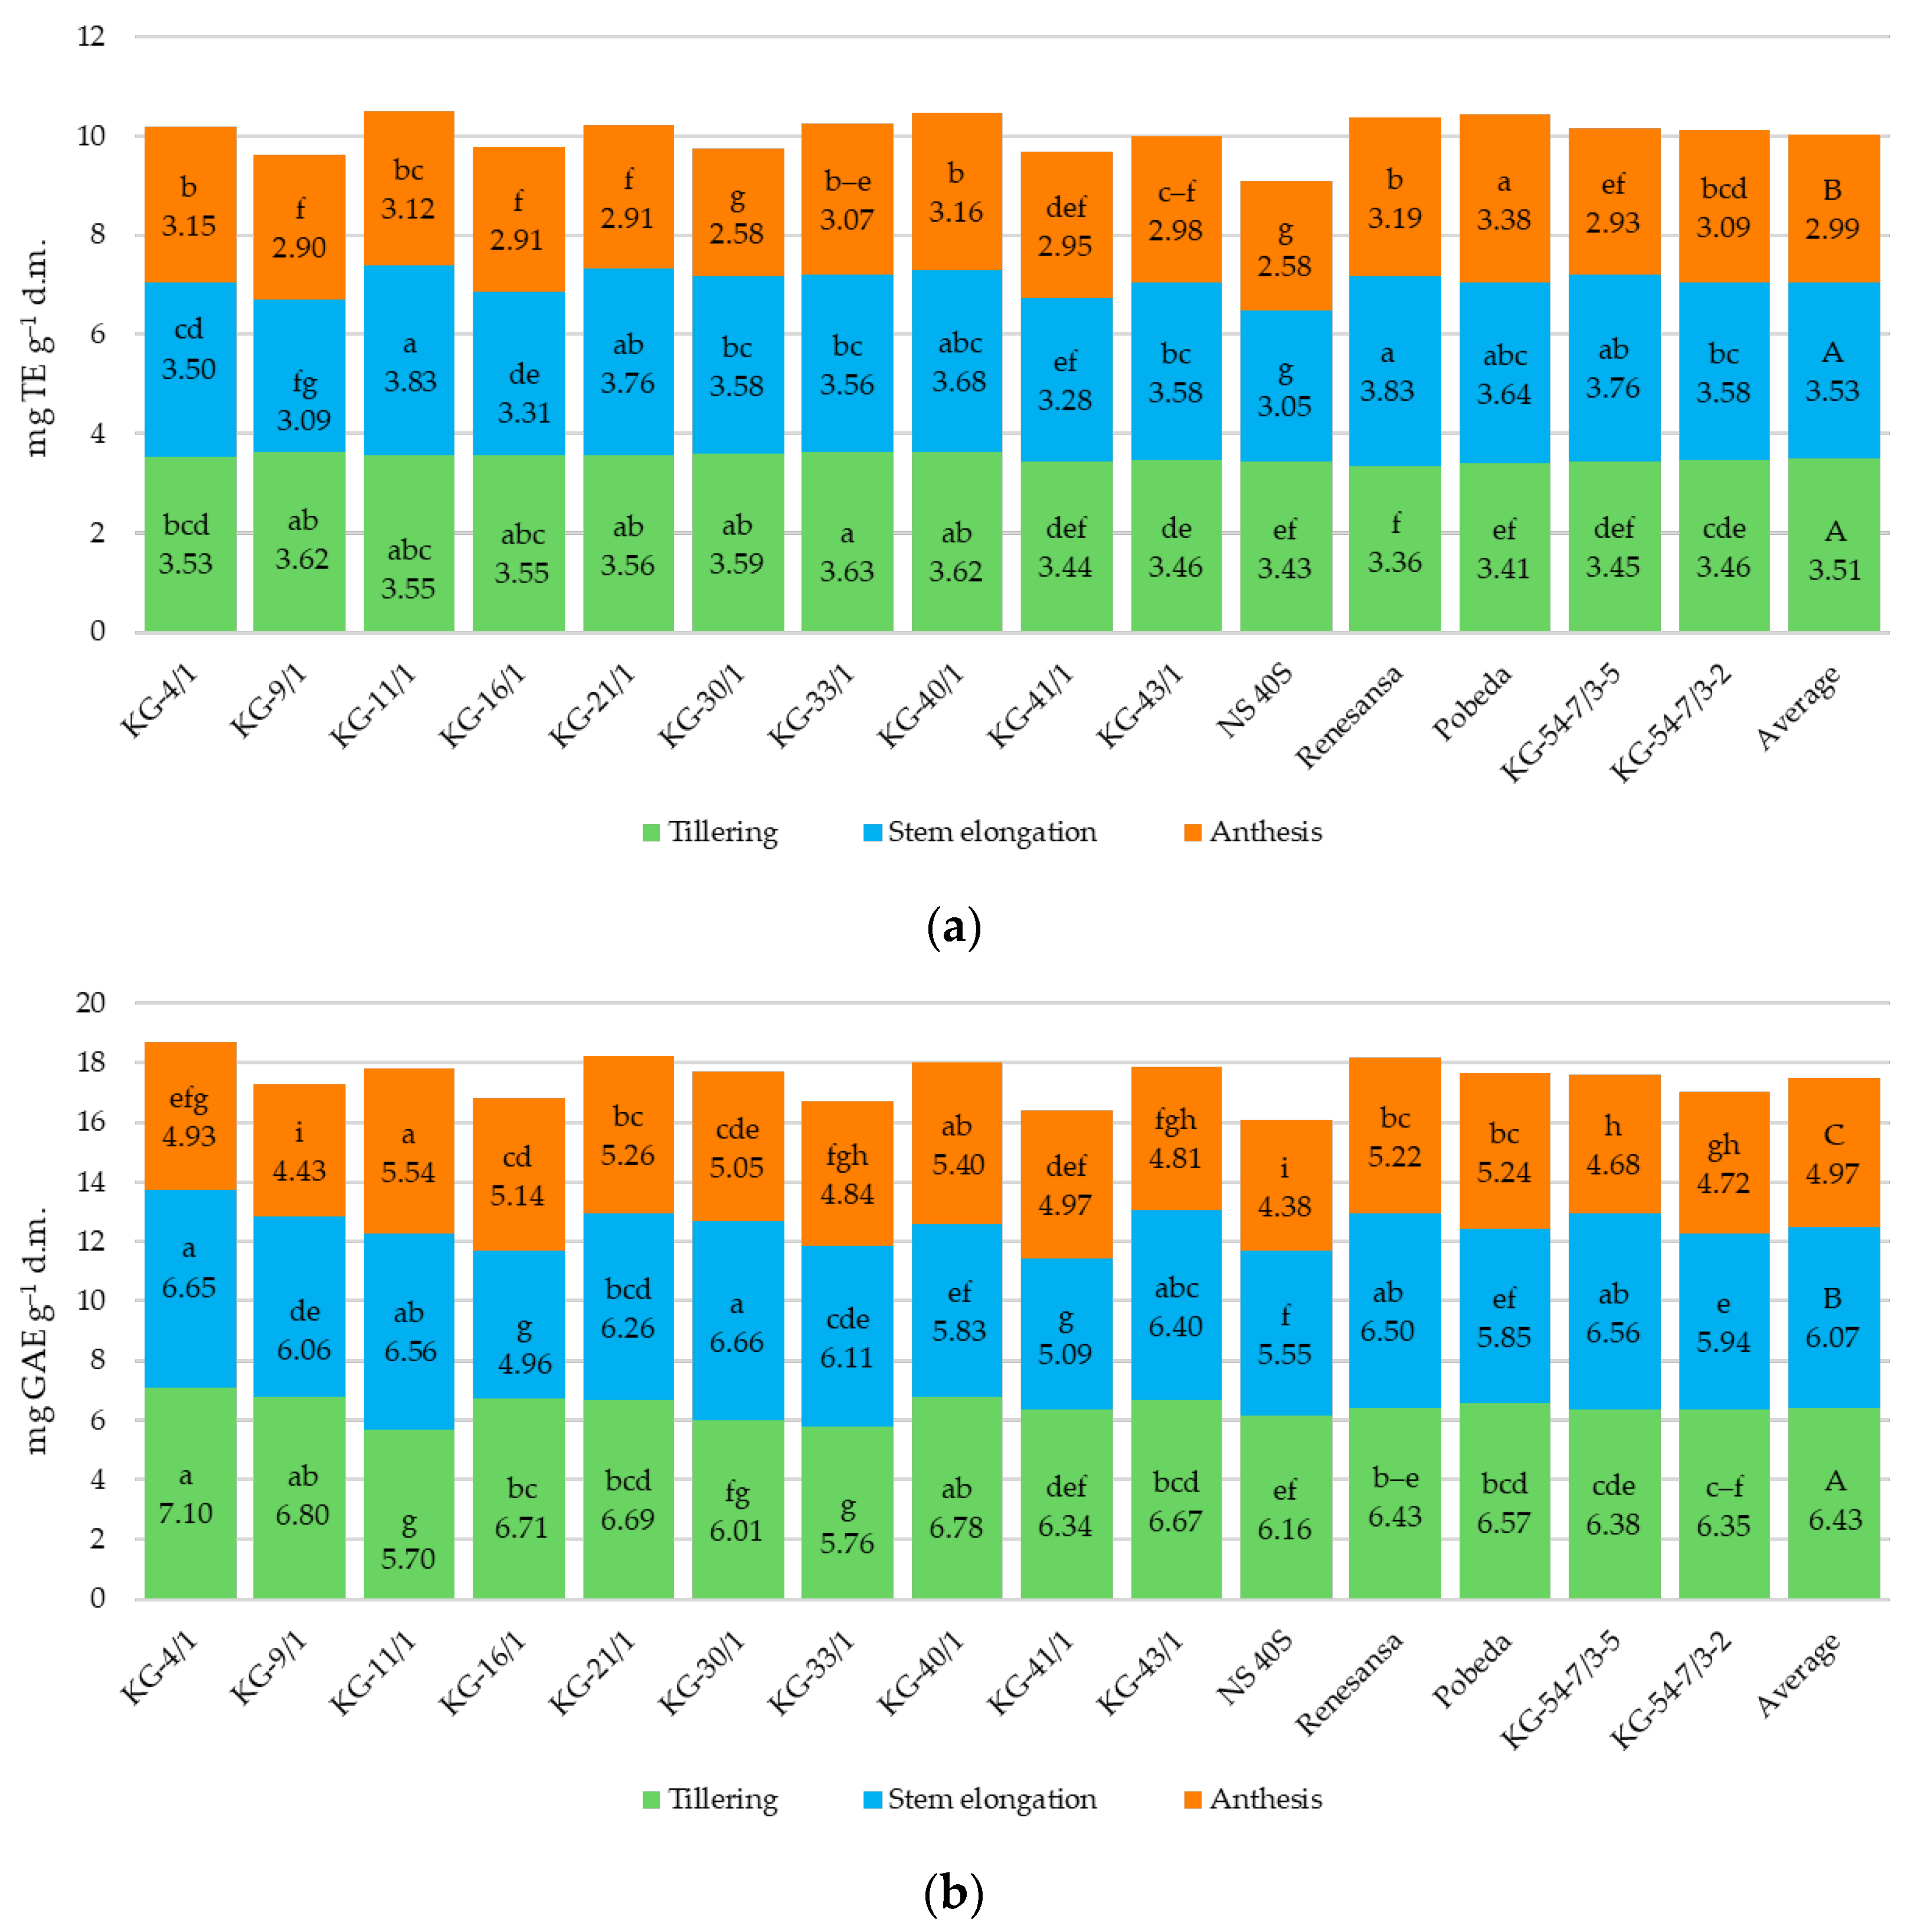
Figure 6 shows the DPPH• scavenging activity and total phenolic content (TPC) of 15 wheat genotypes at three growth stages, averaged across three localities during two growing seasons.
A significantly lower antioxidant activity (p < 0.05) was observed at the anthesis stage (2.99 mg TE g−1 d.m.) compared to the tillering (3.51 mg TE g−1 d.m.) and stem elongation stages (3.53 mg TE g−1 d.m.) (Figure 6a). The highest average value of TPC was recorded at the tillering stage (6.43 mg GAE g−1 d.m.), followed by stem elongation (6.07 mg GAE g−1 d.m.), while the lowest value was recorded at anthesis (4.97 mg GAE g−1 d.m.) (Figure 6b). Genotype NS 40S had the lowest values for both parameters, followed by genotype KG-41/1 (Figure 6a,b). The highest DPPH• scavenging activity was observed in KG-33/1 during tillering (3.63 mg TE g−1 d.m.), in Renesansa and KG-11/1 at stem elongation (3.83 mg TE g−1 d.m.), and in Pobeda at anthesis (3.38 mg TE g−1 d.m.) (Figure 6a). Line KG-4/1 had the highest TPC at tillering (7.10 mg GAE g−1 d.m.), as well as at stem elongation (6.65 mg GAE g−1 d.m), together with the line KG-30/1 (6.66 mg GAE g−1 d.m). The highest TPC at anthesis was measured in genotype KG-11/1 (5.54 mg GAE g−1 d.m. (Figure 6b).
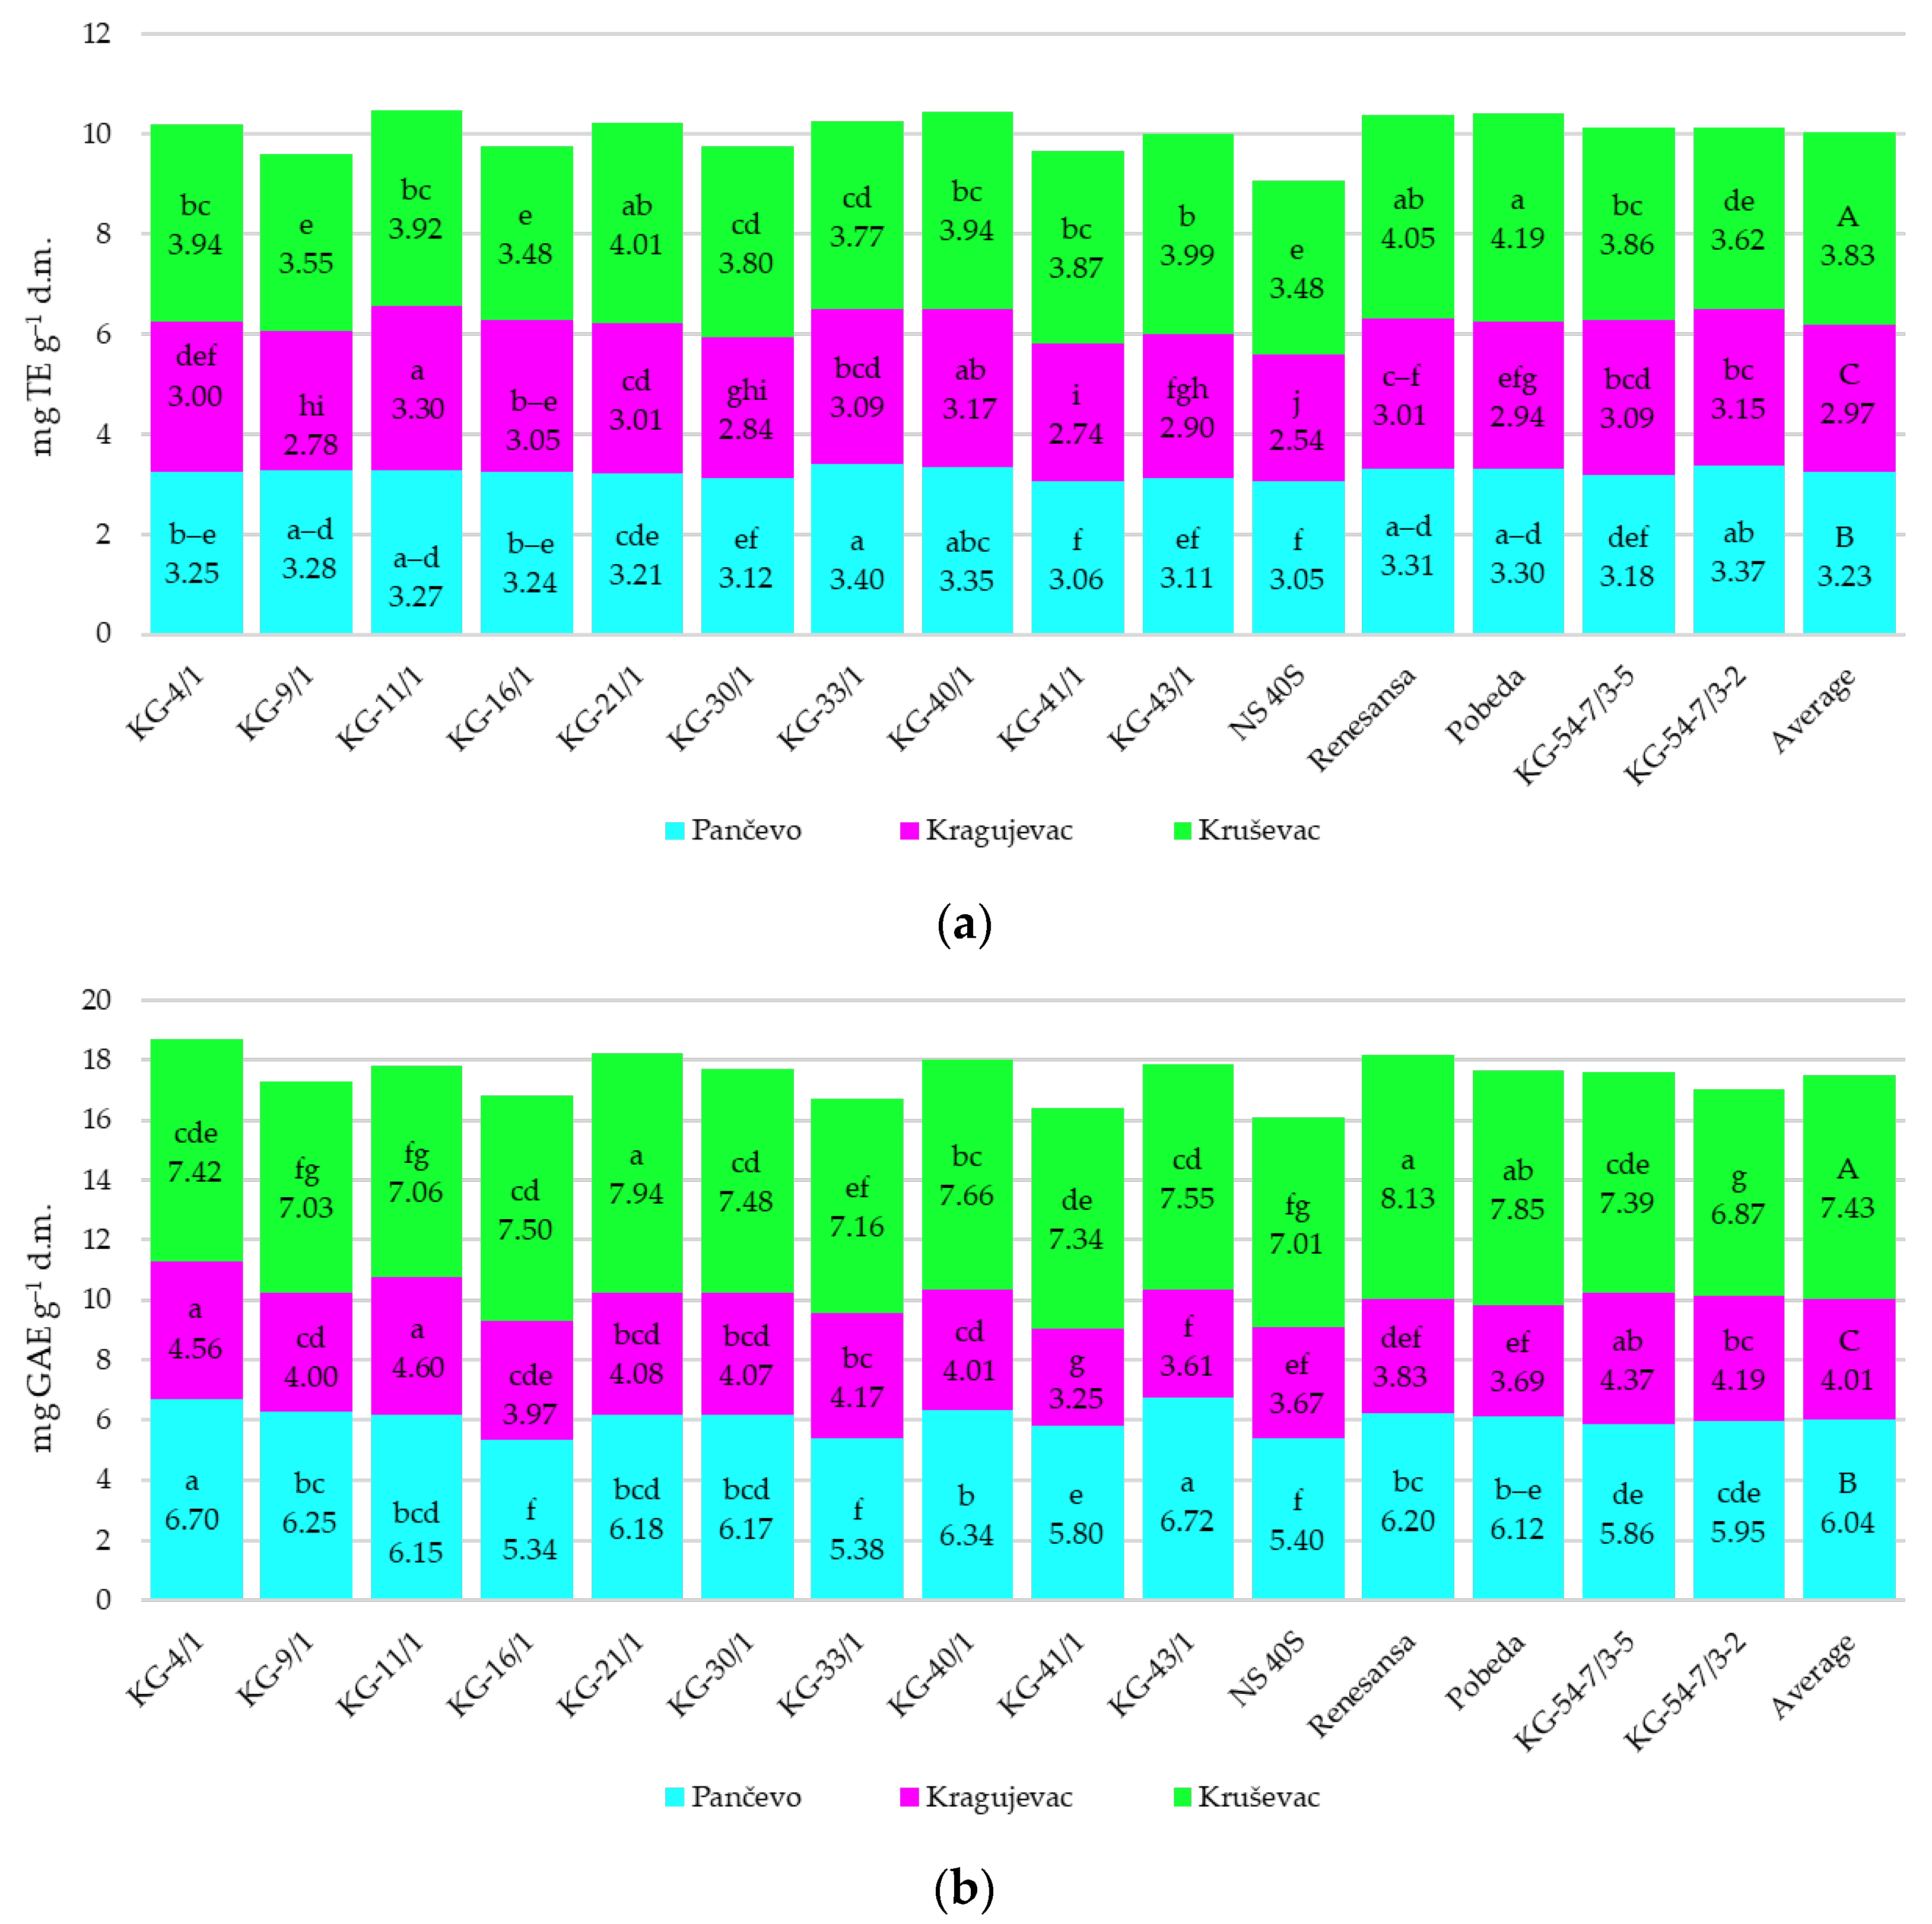
When comparing localities, antioxidant activity, based on both analyzed parameters, differed significantly (p < 0.05) among all three localities, being highest in Kruševac (3.83 mg TE g−1 d.m. and 7.43 mg GAE g d.m.), followed by Pančevo (3.23 mg TE g−1 d.m. and 6.04 mg GAE g d.m.), and lowest in Kragujevac (2.97 mg TE g−1 d.m. and 4.01 mg GAE g d.m.), on average for all phenophases during the trial period (Figure 7a,b).
Genotype KG-33/1 showed the highest antioxidant activity in Pančevo (3.40 mg TE g−1 d.m.), genotype KG-11/1 in Kragujevac (3.30 mg TE g−1 d.m.), while in Kruševac, the highest value was observed in genotype Pobeda (4.19 mg TE g−1 d.m.). Genotype NS 40S had the lowest antioxidant activity across all localities, which ranged from 2.54 mg TE g−1 d.m. in Kragujevac up to 3.48 mg TE g−1 d.m. in Kruševac (Figure 7a). The average TPC in Pančevo ranged from 5.40 mg GAE g−1 d.m. in genotype NS 40S up to 6.72 mg GAE g−1 d.m. in genotype KG-43/1. At the Kragujevac locality, the TPC ranged from 3.25 mg GAE g−1 d.m. in genotype KG-41/1 to 4.60 mg GAE g−1 d.m. in genotype KG-11/1. In Kruševac, the highest TPC was found in genotype Renesansa (8.13 mg GAE g d.m.), and the lowest one in genotype KG-54-7/3-2 (6.87 mg GAE g−1 d.m.) (Figure 7b).

3.4. Relationship Among Analyzed Traits

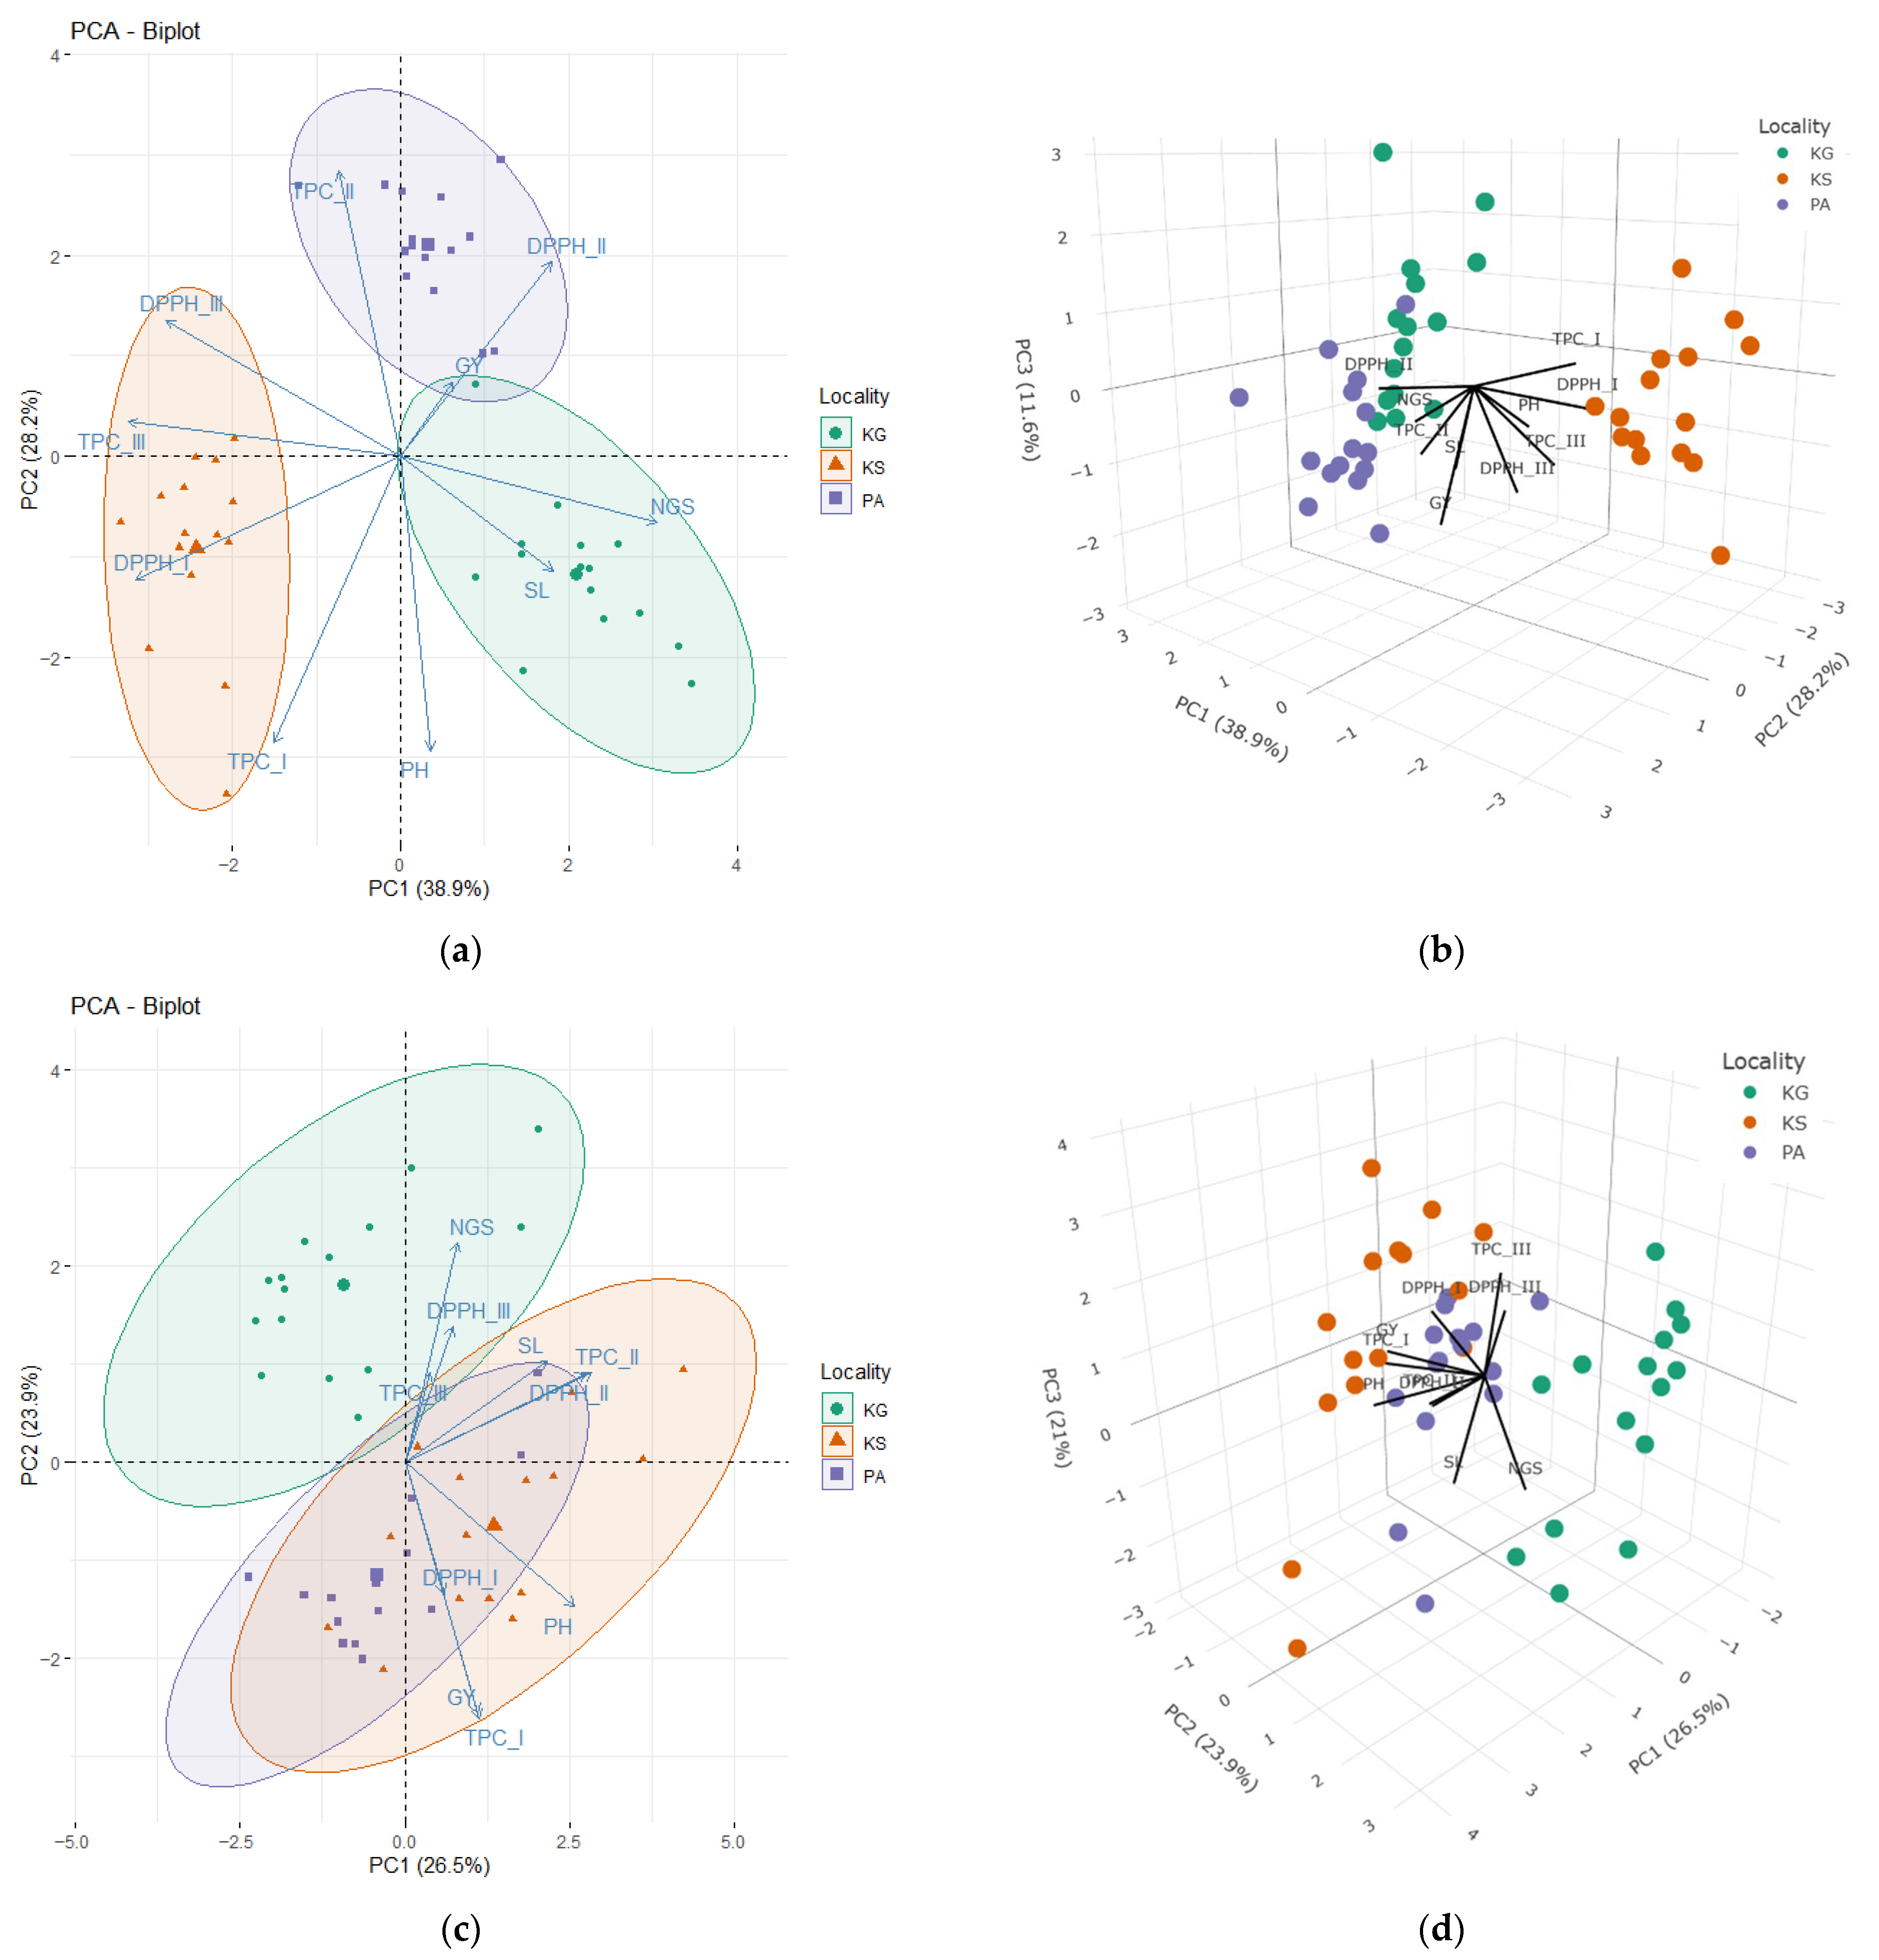
The analysis of the relationships between the analyzed parameters across localities was performed using PCA, separately for each season. A PCA biplot (PC1 vs. PC2) and a 3D plot (PC1 vs. PC2 vs. PC3) were created for each season (Figure 8). The first three principal components, with eigenvalues > 1, explain most of the total variability in the data by season (Table S5). In the 2022/2023 season, PC1 and PC2 together explain 67.1% of the variation (Figure 8a), while PC3 contributes an additional 11.6% (Figure 8b). The PCA biplot and 3D plot clearly separate localities and traits. The ellipses around the grouped genotypes indicate variability within each locality, with the highest variability present in Kruševac, followed by Kragujevac, and the least in Pančevo (Figure 8a). The vector for grain yield overlaps a sharp angle with the vectors representing the parameters of antioxidant activity in the phenophase of stem elongation and is positioned within the genotypes grown at the Pančevo locality. DPPH• scavenging activity and total phenolic content overlap each other at a sharp angle within each phenophase. The number of grains per spike is positively correlated with the spike length, and the vectors of these two traits are located within the Kragujevac locality (Figure 8a). A similar pattern is confirmed by the 3D plot, but the additional variance explained by the PC3 axis helped to more clearly reveal certain patterns of correlation between traits. According to this plot, spike length is positively correlated with grain yield, number of grains per spike and antioxidant activity parameters in the stem elongation phenophase, while plant height is closely related to antioxidant activity parameters in the tillering and anthesis phenophases (Figure 8b).
In the second season (2023/2024), the first two principal components explain 50.4% of the total variability, represented by the PCA biplot (Figure 8c), while an additional 21% of the variability (PC3) is represented by the 3D plot, which explains 71.4% of the observed variability (Figure 8d). On the PCA biplot, a clear separation of the Kragujevac locality in relation to Pančevo and Kruševac was observed. The vectors of the number of grains per spike, spike length and the parameters of antioxidant activity in the anthesis and stem elongation phenophases form a mutual sharp angle, which indicates positive correlations between them. Also, grain yield, plant height, and antioxidant activity parameters in the tillering phase are positively correlated. On the other hand, in this season, the number of grains per spike and spike length form an obtuse angle with grain yield, which indicates a negative correlation between these traits and yield. (Figure 8c). The 3D plot shows a slightly different pattern of the relationship between the analyzed traits, influenced by high positive or negative values of the PC3 component of certain traits (Table S5). Unlike the PCA biplot, the parameters of antioxidant activity in the anthesis phenophase are more descriptive of the Pančevo and Kruševac localities. Grain yield, plant height, and parameters of antioxidant activity in the tillering and stem elongation phenophases form a sharp angle with each other, indicating positive correlations between them (Figure 8d).

4. Discussion

4.1. Phenotypic Variability of Agro-Morphological Traits

Many studies have shown that germplasm diversity is of crucial importance in breeding programs aiming to develop new varieties with improved grain yield potential in different climates [16,26,49,50]. The results of this research indicate a pronounced variability among the tested wheat genotypes in the phenotypic expression of the analyzed grain yield and grain yield components. An additional contribution to the diversity of germplasm is provided by the two tested lines of spelt wheat (Triticum spelta L.), which are characterized by specificities in terms of agro-morphological characteristics and grain yield. Hence, assessment of genetic diversity within germplasm is essential in breeding programs, as it allows the selection of varieties and lines with better agronomic characteristics under specific environmental conditions [51].
A significant influence of the analyzed factors (genotype, locality, and year) and their interactions on the phenotypic expression of the analyzed traits was established. In this study, spike length varied more among genotypes than among seasons and localities. Similar results were obtained by Mladenov et al. [52] and Ullah et al. [53], who found a high proportion of genotypic variance in the total phenotypic variation in spike length. This is confirmed by the findings of Shamsabadi et al. [54], who reported that spike length is mainly influenced by additive genes, making it suitable for direct selection of desirable plants. Genotypes of spelt wheat were characterized by the longest spike length (on average above 13 cm), and they contributed the most to the share of the genotypic effect in the total trait variation. Similar spike length values for spelt wheat (12.2 cm on average) were found by Lacko-Bartošová, M. et al. [55], comparing spelt wheat with einkorn (T. monococcum) and emmer (T. dicoccon).
Plant height varied significantly among genotypes, localities, and seasons, with environmental factors (locality and year) having a greater influence on this trait than genotype. Similar results were obtained by Matković Stojšin et al. [36], Popović et al. [56], and Ljubičić et al. [57]. In our research, higher amount of precipitation in the vegetative stages of wheat development in 2022/2023, favored higher plant growth in all three localities. Spelt wheat genotypes achieved the highest plant height in both years. Although a tall stem in wheat is an undesirable trait, due to the increased tendency to lodging, Chrpová et al. [58] stated that the high plant in spelt wheat has a role as a passive resistance factor to Fusarium Head Blight. The variety NS 40S was singled out as a high-yielding variety with a very low plant height value, making it suitable resource for selection aimed at improving plant architecture and lodging resistance.
Number of grains per spike varied the most under the influence of the locality factor, where the highest value was recorded at the locality Kragujevac (44.9), followed by Pančevo (39.3), and the lowest average value in Kruševac (36.3). The interaction of genotype and year was particularly pronounced for this yield component, where spelt wheat genotypes showed higher values in the dry season, while the KG-40/1 achieved the highest value in a more favorable season. This shows that the number of grains per spike is a highly variable trait, which depends on climatic conditions. According to Serrago et al. [59], the efficiency of grain formation is reflected in the balance between juvenile spikes growth and the development of flower buds during stem elongation. Also, the number of grains per spike depends on the accumulation of dry matter in spikes, which takes place in the period of 20 to 30 days before flowering [59,60]. The higher number of grains per spike in Pančevo and Kragujevac, especially during the 2022/2023 season, was largely due to greater precipitation (102.2 and 109.8 mm, respectively), in the period 20 to 30 days before flowering (March–April), while lower precipitation (81.7 mm) was recorded in Kruševac during the same period. Consequently, in addition to genetic factors, environmental factors during stem elongation, flowering, and fertilization also influence number of grains per spike.
Grain yield is formed during the ontogenetic development of the plant in interaction with environmental factors [61]. In our study, the locality factor had a dominant effect in the phenotypic variation in grain yield, expressed through the highest mean square (MS) value, confirming the significant influence of environmental factors established by many authors [62,63,64]. The highest grain yield was achieved at the Pančevo locality (6.08 t ha−1); however, it did not significantly differ from the grain yield achieved at Kruševac (6.05 t ha−1), while the lowest average grain yield was observed at the Kragujevac locality (5.17 t ha−1). A higher grain yield value was recorded in the 2023/2024 season (6.05 t ha−1) compared to 2022/2023 (5.49 t ha−1). Although a lower total amount of precipitation was recorded in the second season (2023/2024), their distribution, combined with temperature conditions, was more favorable for achieving higher yield in Pančevo and Kruševac. Therefore, the microclimatic conditions of the locality had a decisive role in the formation of grain yield. Also, achieving a high grain yield at the locality Kruševac in the 2023/2024 season, despite poorer soil conditions, can be attributed to exceptional grain yields in spelt wheat genotypes. This is in line with Sugár et al. [65], who reported that spelt wheat exhibits good adaptability to adverse climatic conditions and poor soils. In addition, due to the presence of hulls and the genetic polymorphism of the spelt population, this type of wheat is resistant to pests and various diseases, which makes it suitable for cultivation in organic production systems [58,66,67,68,69,70]. The significantly lower grain yield recorded at Kruševac locality in the 2022/2023 season compared to 2023/2024 was the result of very heavy rainfall in June 2023 (204 mm), which led to water retention on the surface layer of the soil, crop failure, and disease occurrence. The significance of the interaction between genotype and year is reflected in the different grain yield performance of genotypes over the years. Namely, the genotypes KG-4/1, NS 40S and Renesansa achieved higher grain yield in the 2023/2024 season, while the genotypes KG-40/1, Pobeda and the spelt line KG-54-7/3-2 had a higher grain yield in the 2022/2023 season compared to 2023/2024. These results indicate a complex reaction of genotypes to the combined effects of locality and year, resulting from differences in climatic conditions in each year and soil conditions per locality [63].

4.2. Grain Yield Stability

In the conditions of increasingly pronounced climate changes, the importance of selecting wheat genotypes that show high grain yield and stability across environments is increasing. According to Begna [71], environmental factors such as soil type, humidity, temperature, light intensity, relative air humidity, amount of precipitation, day length, and implemented agrotechnical practice have an impact on the expression of genes that control crop traits, resulting in different phenotypic expression of traits by environment. Due to the fluctuations of these environmental factors, the phenotypic response of genotypes is not always the same across all environments, which indicates the presence of pronounced GEI, which further complicates the selection of genotypes [22,71,72,73]. Hence, analyzing GEI is essential to assess the stability and broad adaptability of genotypes, and also allows for recommending genotypes for production in specific areas (specific adaptability) [74,75]. To identify stable and high-yielding genotypes, it is necessary to conduct multi-environment trials (MET) [23,26,76,77,78,79]. Statistical models commonly used to analyze MET data include Additive Main Effect and Multiplicative Interaction (AMMI) and Genotype Plus Genotype by Environment (GGE) biplots [13,77,80,81,82,83,84,85,86,87]. The AMMI model showed that GEI explained 23.08% of the total variation in grain yield, with the first two interaction axes explaining 70.31% of GEI. Similar results were obtained by Ljibičić et al. [57], Wardofa et al. [88], and Jędzura et al. [89]. Environmental variation, particularly differences in temperature and precipitation distribution, led to differential genotypic responses. Environments E1 (Pančevo in 2022/2023), E6 (Kruševac in 2023/2024) and E3 (Kruševac in 2022/2023) contribute the least to the GEI, due to small deviations in genotype performance in these environments compared to their overall performance. Line KG-33/1 showed the highest stability but low grain yield, whereas KG/41-1 had both low stability and low grain yield, making it undesirable for selection. Conversely, genotypes KG-4/1, KG-11/1, and Pobeda, combined both high grain yield and low GEI, indicating broad adaptability and suitability for cultivation across diverse agroecological conditions. High grain yield and pronounced instability characterize the genotype KG-40/1, suggesting its potential for targeted breeding under conditions similar to environment E2 (Kragujevac 2022/2023). Likewise, spelt lines showed a positive interaction with the environment E3 (Kruševac 2022/2023), confirming their potential for specific adaptation to marginal environments.
The GGE biplot analysis, developed by Yan et al. [90], is very useful tool for assessing genotypes through their interaction with environment, as well as for identification of ideal environments for testing genotypes. By interpreting Mean vs. stability GGE biplot, in accordance with the approach of Yan et al. [90,91], it was observed that among the high-yielding genotypes, KG-11/1 and Pobeda exhibited the highest stability, indicating their suitability for broad adaptation across diverse agroecological conditions in Serbia. Similarly, other studies [76,81,92] also identified high-yielding and highly stable wheat genotypes, using Mean vs. Stability GGE biplot. Bishwas et al. [81] point out that the ideal lines are those with the highest grain yield and absolute stability. In our research, the high-yielding genotypes KG-4/1, KG-40/1, NS 40S and Renesansa are positioned significantly far from the AEC abscissa, exhibiting instability. However, this instability may result from their specific adaptability to certain environments [23]. Thus, which-won-where GGE biplot was created with the aim to identify winning genotypes in specific environments, as well as to identify mega-environments [93]. Namely, genotype Renesansa is specifically adapted to the conditions of carbonate chernozem (locality Pančevo) in the growing season 2023/2024. Bishwas et al. [81], applying this type of GGE biplot, identified elite wheat lines with specific adaptability under irrigation conditions, as well as a line that is adaptable in the environment with terminal heat-stressed. Also, Perišić et al. [83], conducting an experiment with 14 wheat lines and the Pobeda variety as a standard in Kragujevac, Kruševac and Sombor, identified lines specifically adapted to the conditions of the given localities. Line KG-4/1 is specifically adapted to the mega-environment comprising environments E1 (Pančevo 2022/2023), E5 (Kragujevac 2023/2024) and E6 (Kruševac 2023/2024). Al-Ashkar et al. [62] also identified a mega-environment that encompassed multiple agroecological environments, including environments with optimal conditions, as well as those with drought and heat stress conditions. Based on this result, they conclude that factor of year did not significantly affect the differences between environments, nor the response of genotypes. Genotypes KG-11/1 and KG-40/1 are the best in environments E3 (Kruševac 2022/2023) and E2 (Kragujevac 2022/2023), which form one mega-environment characterized by similar conditions that provided almost equal ranking of genotypes. Specifically adapted genotypes can be targeted to the prevailing conditions in a certain area [78], which is why it is very important to carry which-won-where GGE biplot in breeding programs. According to the level of discrimination vs. representativeness GGE biplot, environment E2 (Kragujevac 2022/2023) was characterized by the highest discriminativeness, i.e., the ability to distinguish genotypes based on grain yield. Hence, this environment can be considered the most suitable for testing genotypic differences. Yue et al. [79] state that environments with high discriminative power are ideal for identifying stable genotypes with broad adaptability. On the other hand, Yan et al. [92] reported that environments with long vectors that form a large angle with the AEC axis cannot be used to select superior genotypes, but are useful for eliminating unstable genotypes. In accordance with this, we emphasize that the environments E1 (Pančevo 2022/2023) and E6 (Kruševac 2023/2024) are ideal for the evaluation of genotypes, given that they are both representative (form a sharp angle with the AEC axis) and discriminative (far from the coordinate origin). The representativeness of these environments reflects in their role represent as average conditions among environments, making them typical of the entire experiment. According to Yan et al. [92] and Aktaş et al. [94] this type of GGE biplot is more effective for estimating means compared to the AMMI biplot. By conducting the Ranking genotypes GGE biplot analysis, the genotype KG-11/1 (G3) was singled out as the closest to the ideal genotype. This genotype is characterized by high grain yield and high stability. Also, the genotypes KG-4/1 (G1), KG-21/1 (G5), and Pobeda (G13) are the least distant from the ideal genotype, which makes them a suitable genetic resource for achieving high grain yield and stability. Bishwas et al. [81] highlight that the ideal elite wheat line identified using this analysis, can be a reference in the evaluation of other lines.
Our results show that the combined use of AMMI and GGE biplot analyses provides a framework for selecting stable and closely adapted genotypes, as well as for identifying ideal environments for testing genotypes. All of this may be of great importance in developing plant breeding strategies to address the challenges of climate change.

4.3. Antioxidant Activity

In the era of climate change, improving wheat grain yield is increasingly challenging, requiring the introduction of new technologies and traits into breeding programs [95]. The analysis of biochemical parameters has found its application in the selection of genotypes, especially in induced stress conditions, because they are important indicators of the plant’s response to stress. Numerous studies aimed at examining the response of wheat to various biotic and abiotic stresses have confirmed the presence of antioxidant compounds in plants, as well as variation in their levels depending on the genotype [34,36,96], the intensity of the stress factor [97,98,99], and the phase of plant development [36,96,100,101]. Nardino et al. [34] point out that the assessment of antioxidant activity is important for a more comprehensive understanding of genotype characteristics and their tolerance to stress they are exposed to. However, most of the previous research was focused on the investigation of antioxidant parameters in the early stages of plant development or during grain development stages, most often under controlled conditions (ex situ) or through the comparison of stress treatment with control. In contrast, this research provides an insight into the reaction of plants to prevalent environmental stresses in real (in situ) conditions, through MET by analyzing the production of antioxidant parameters (DPPH• scavenging activity and the TPC) in the key phenophases of plant development (tillering, stem elongation, and anthesis). Phenolic compounds, as major non-enzymatic antioxidants, have a high capacity to neutralize free radicals, i.e., reactive oxygen species (ROS), produced under stress [32,102,103]. The highest DPPH• scavenging activity was measured at stem elongation (3.53 mg TE g–1 d.m.), and tillering phenophase (3.51 mg TE g–1 d.m.), while the lowest was observed at anthesis (2.99 mg TE g–1 d.m.). This is in agreement with the results of Matković Stojšin et al. [36], who analyzed the influence of saline soil stress on the DPPH• scavenging activity in different phenophases of wheat. The total phenolic content was the highest at tillering, followed by stem elongation, and lowest at anthesis.
Genotypes differed in their antioxidant responses during plant development. Renesansa, Pobeda and KG-11/1 showed the highest DPPH• scavenging activity in the stem elongation and anthesis phenophases. Regarding the TPC, genotypes KG-4/1, KG-21/1, and Renesansa stood out with the highest values, especially in the phenophases of tillering and stem elongation. Genotypes differed in their antioxidant responses during plant development. Renesansa, Pobeda and KG-11/1 showed the highest DPPH• scavenging activity in the stem elongation and anthesis phenophases. Regarding the TPC, genotypes KG-4/1, KG-21/1, and Renesansa stood out with the highest values, especially in the phenophases of tillering and stem elongation. Melios et al. [104] reported a significant effect of genotype, environment, and their interaction on the antioxidant properties of durum wheat grains, identifying a potential superior genotype displaying high and stable TPC and antioxidant capacity across various crop management systems. Similar results were reported by Buczek et al. [105], who investigated the effect of genotype, location, cropping systems, and year on the content of antioxidant compounds in grains of hybrid winter wheat genotypes.
The highest antioxidant activity of wheat was found at the locality Kruševac, followed by Pančevo, while the lowest antioxidant activity was found at the locality Kragujevac. These differences can be attributed to environmental conditions (climatic and soil conditions during both seasons of the study). Similarly, Buczek et al. [105] reported significant location × cropping system and location × year interaction, indicating that both crop management and growing season influenced the accumulation of phenolic compounds and antioxidant capacity in wheat genotypes across different locations. The low rainfall at Kruševac, especially in the tillering phase (December–February), created stressful conditions for the plants, likely inducing increased synthesis of antioxidant compounds to neutralize ROS. At the locality Kragujevac, a small amount of precipitation during the tillering and stem elongation phases, combined with unfavorable soil conditions, indicates a negative effect of prolonged drought stress on the plant’s antioxidant defenses. Chugh et al. [97] reported that when plants are exposed to drought stress, antioxidant activity initially increases but decreases with increasing drought stress intensity. Also, Zhang et al. [99], conducting research on Atractylodes lancea, found that after exposure of plants to drought stress for more than four days, the activity of antioxidant enzymes continuously decreased. The same authors explained that the cause of this decrease in antioxidant activity was that the production of ROS due to long exposure to drought was out of range, and the antioxidant mechanism of the plant was not able to remove excess ROS. Earlier research by Salekjalali et al. [106] showed that prolonged and severe drought stress reduced the antioxidant activity of barley at the late ripening stage. Pančevo, with slightly higher precipitation, especially during the first season, and more favorable soil conditions, was less stressful for the plants, resulting in genotypes showing moderate antioxidant response, lower than in Kruševac but higher than in Kragujevac.

4.4. Relationship Among Agro-Morphological and Biochemical Parameters

Grain yield is a complex trait that is significantly influenced by environmental factors, as well as by the grain yield components that define it [107,108]. Given that the ultimate goal of any breeding program is to increase grain yield, understanding the interrelationship of grain yield and its components is of great importance [109]. By applying two-dimensional (PCA biplot) and three-dimensional analysis (3D plot), the interrelationships of the analyzed components of grain yield and the parameters of antioxidant activity of wheat were examined in relation to different localities across growing seasons. Many authors have applied PCA with the aim of identifying patterns among traits [29,109,110,111].
In the first growing season, a positive correlation was established between grain yield and antioxidant activity parameters measured in the stem elongation phenophase. In the second growing season, both antioxidant activity parameters measured in the tillering phenophase showed a positive correlation with grain yield. These findings suggest that genotypes which responded to prevalent abiotic stresses in the early stages of plant development by exhibiting higher antioxidant activity, achieved later a higher grain yield. The positive association between early-stage antioxidant activity and final grain yield suggests that biochemical markers could support early screening for stress tolerance in breeding programs. This relationship was most characteristic of the Pančevo and Kruševac localities, which were characterized by both higher grain yield and higher antioxidant responses. Shokat et al. [112] examined the correlation between physiological parameters and parameters of antioxidant activity in wheat leaves exposed to drought stress at anthesis, and grain yield components, and concluded that certain physiological and biochemical parameters can serve as useful selection criteria in the identification of drought-tolerant genotypes. Similar results were previously obtained by Nikolić et al. [31], examining the association of physiological parameters in the anthesis phase with physiological parameters and grain yield in the full maturity phase, highlighting positive correlations between these parameters. Banjac et al. [19] state that varieties that show stronger ability to “remember” stress, are those varieties that respond best to stress in the early stages of development, suffering the least damage, and when re-exposed to the same stress in later phases, they show a similar adaptive response. Most of the research focusing on stress tolerance of wheat has been carried out in a certain developmental period; however, plant reactions vary depending on the phenophase of plant development. Hence, research should be focused on the responses of plants to stress in different stages of development, as well as on conducting experiments in several agroecological environments [35]. In this research, the antioxidant activity parameters are positively correlated within each phenophase. A positive correlation between the TPC and DPPH• scavenging activity was established by numerous researchers [55,113]. Based on this result, it can be concluded that phenols significantly contribute to the antioxidant activity of wheat.
Plant height in the first season had a negative correlation with grain yield, which is consistent with higher rainfall and more vigorous vegetative growth in all three localities, where plants could express their full genetic potential in terms of this trait. A negative correlation between plant height and grain yield in wheat was established by Luković et al. [29], Sangha et al. [111], and Spanic et al. [114]. On the contrary, in the second season, a positive correlation between plant height and grain yield was established. Therefore, the conditions of a reduced amount of precipitation influenced a faster transition from the vegetative to the generative phase of the plant’s development, as a result of which the stem shortened. It is also noted that despite the reduced vegetative development in the second season, the genotypes that exhibited higher plant height managed to better use resources and achieve a higher grain yield under stress conditions. Accordingly, lines of spelt wheat, with the highest plant height, showed resistance to unfavorable conditions and achieved a high grain yield at the Kruševac locality, which contributed to a significant extent to this pattern of correlations. A positive correlation between plant height and grain yield was established by Javed et al. [109]. The different pattern of correlations by season indicates that the association of analyzed traits is shaped to a greater extent by environmental factors.
In both growing seasons, spike length is positively correlated with the number of grains per spike. This is in agreement with the results of Ullah et al. [53] and Ding et al. [115]. According to the 3D PCA plot in the first growing season, positive correlations of spike length, number of grains per spike and grain yield were observed. Positive correlations between the number of grains per spike and grain yield were established by Ullah et al. [53] and Philipp et al. [116]. Also, Zečević et al. [70], studying different genotypes of spelt wheat, pointed out that the number of grains per spike is an important component of grain yield, which affects grain yield potential. However, spike length and number of grains per spike have a negative correlation with grain yield in the second growing season, which was characterized by a lower amount of precipitation. As the vectors of these traits are mostly located within the ellipse of the Kragujevac locality, where the highest values of mentioned traits were achieved, with the lowest grain yield values, we speculate that the values at the Kragujevac locality contributed the most to this pattern of relationships between traits. This result indicates a lower individual grain weight, i.e., poor grain filling, due to abiotic stress, which was particularly pronounced at the Kragujevac locality. Hence, we can conclude that grain yield depended more on grain weight/size than on the number of grains per spike in this season. Genomic studies have shown that genomic regions associated with grain number overlap with regions affecting thousand grain weight, exhibiting opposite phenotypic effects, indicating the existence of a genetically based trade-off between grain number and grain size [117].

5. Conclusions

Integrating yield stability analyses (AMMI/GGE) with antioxidant profiling provides a robust framework for identifying genotypes with both agronomic and physiological resilience. Lines KG-4/1, KG-11/1, and the variety Pobeda represent promising candidates for breeding programs targeting climate variability. In contrast, high-yielding genotypes KG-40/1 and Renesansa showed specific adaptability in certain environments, making them valuable candidates for targeted breeding to develop regionally adapted, high-yielding wheat varieties. Spelt wheat KG-54-7/3-2 exhibited specific adaptability in unfavorable conditions, underscoring its potential for low-input agricultural systems. Pančevo 2022/2023 and Kruševac 2023/2024 stood out as ideal environments for the differentiation of genotypes in terms of grain yield, showing good representativeness and discriminativeness. Antioxidant activity parameters at early growth stages are positively correlated with grain yield and can serve as biochemical markers for identifying stress-tolerant and high-yielding wheat genotypes, with the potential application of these genotypes in future climate-resilient wheat breeding programs.

Supplementary Materials

The following supporting information can be downloaded at: https://www.mdpi.com/article/10.3390/agronomy15122684/s1, Table S1: Agronomic management details during the experiment; Table S2: Analysis of variance for grain yield and grain yield components in 15 wheat genotypes grown across three localities (Pančevo, Kragujevac, and Kruševac), during two growing seasons (2022/2023 and 2023/2024); Figure S1: Interaction plot (genotype × year × locality) for plant height (a), spike length (b), number of grains per spike (c), and grain yield (d); Table S3: AMMI-ANOVA for grain yield of 15 wheat genotypes grown in three localities (Pančevo, Kragujevac, and Kruševac) during two growing seasons (2022/2023 and 2023/2024); Table S4: AMMI Stability Values (ASVs) for grain yield of analyzed wheat genotypes; Table S5: Principal Component Analysis (PCA) showing loadings, eigenvalues, and percentages of explained variance for variables measured during two seasons 2022/2023 and 2023/2024.

Author Contributions

Conceptualization, P.B., M.M.S. and O.N.; methodology, M.M.S., V.P., K.L., S.R.N., P.B., O.N. and S.B.; software, M.M.S. and V.P.; validation, K.L., V.P., S.R.N. and O.N.; formal analysis, P.B., M.M.S., K.L. and S.B., investigation, P.B., M.M.S., V.P., K.L., S.R.N., O.N. and S.B.; resources, V.P., K.L., S.R.N. and S.B.; data curation, P.B., M.M.S., V.P., K.L., S.R.N. and S.B.; writing—original draft preparation, P.B. and M.M.S.; writing—review and editing, P.B., M.M.S. and O.N.; visualization, M.M.S., K.L., S.B. and O.N.; supervision, M.M.S. and O.N.; project administration, S.R.N.; funding acquisition, S.R.N. All authors have read and agreed to the published version of the manuscript.

Funding

This research was supported by the Ministry of Science, Technological Development, and Innovation of the Republic of Serbia, grant numbers: 451-03-136/2025-03/200054, 451-03-136/2025-03/200216, and 451-03-136/2025-03/200217.

Data Availability Statement

The original contributions presented in this study are included in the article. Further inquiries can be directed to the corresponding author.

Acknowledgments

The authors acknowledge the support of the Ministry of Science, Technological Development, and Innovation of the Re-public of Serbia.

Conflicts of Interest

The authors declare no conflicts of interest.

References

  1. Shiferaw, B.; Smale, M.; Braun, H.J.; Duveiller, E.; Reynolds, M.; Mauricho, G. Crops that feed the world 10. Past scuccesses and future challenges to the role played by wheat in global food security. Food Secur. 2013, 5, 291–317. [Google Scholar] [CrossRef]
  2. Giraldo, P.; Benavente, E.; Manzano-Agugliaro, F.; Gimenez, E. Worldwide Research Trends on Wheat and Barley: A Bibliometric Comparative Analysis. Agronomy 2019, 9, 352. [Google Scholar] [CrossRef]
  3. Cao, S.; Xu, D.; Hanif, M.; Xia, X.; He, Z. Genetic Architecture Underpinning Yield Component Traits in Wheat. Theor. Appl. Genet. 2020, 133, 1811–1823. [Google Scholar] [CrossRef]
  4. Albajes, R.; Cantero-Martínez, C.; Capell, T.; Christou, P.; Farre, A.; Galceran, J.; López-Gatius, F.; Marin, S.; Martín-Belloso, O.; Motilva, M.-J.; et al. Building Bridges: An Integrated Strategy for Sustainable Food Production throughout the Value Chain. Mol. Breed. 2013, 32, 743–770. [Google Scholar] [CrossRef]
  5. Slafer, G.A.; Savin, R.; Sadras, V.O. Wheat Yield Is Not Causally Related to the Duration of the Growing Season. Eur. J. Agron. 2023, 148, 126885. [Google Scholar] [CrossRef]
  6. Reynolds, M.; Foulkes, M.J.; Slafer, G.A.; Berry, P.; Parry, M.A.J.; Snape, J.W.; Angus, W.J. Raising Yield Potential in Wheat. J. Exp. Bot. 2009, 60, 1899–1918. [Google Scholar] [CrossRef] [PubMed]
  7. Hall, A.J.; Richards, R.A. Prognosis for Genetic Improvement of Yield Potential and Water-Limited Yield of Major Grain Crops. Field Crops Res. 2013, 143, 18–33. [Google Scholar] [CrossRef]
  8. Senapati, N.; Semenov, M.A. Large Genetic Yield Potential and Genetic Yield Gap Estimated for Wheat in Europe. Glob. Food Secur. 2020, 24, 100340. [Google Scholar] [CrossRef]
  9. Mao, H.; Jiang, C.; Tang, C.; Nie, X.; Du, L.; Liu, Y.; Cheng, P.; Wu, Y.; Liu, H.; Kang, Z.; et al. Wheat Adaptation to Environmental Stresses under Climate Change: Molecular Basis and Genetic Improvement. Mol. Plant 2023, 16, 1564–1589. [Google Scholar] [CrossRef]
  10. Frantová, N.; Rábek, M.; Elzner, P.; Středa, T.; Jovanović, I.; Holková, L.; Martinek, P.; Smutná, P.; Prášil, I.T. Different Drought Tolerance Strategy of Wheat Varieties in Spike Architecture. Agronomy 2022, 12, 2328. [Google Scholar] [CrossRef]
  11. Sareen, S.; Budhlakoti, N.; Mishra, K.K.; Bharad, S.; Potdukhe, N.R.; Tyagi, B.S.; Singh, G.P. Resilience to Terminal Drought, Heat, and Their Combination Stress in Wheat Genotypes. Agronomy 2023, 13, 891. [Google Scholar] [CrossRef]
  12. Aberkane, H.; Belkadi, B.; Kehel, Z.; Filali-Maltouf, A.; Tahir, I.S.A.; Meheesi, S.; Amri, A. Assessment of Drought and Heat Tolerance of Durum Wheat Lines Derived from Interspecific Crosses Using Physiological Parameters and Stress Indices. Agronomy 2021, 11, 695. [Google Scholar] [CrossRef]
  13. Alemu, A.; Åstrand, J.; Montesinos-López, O.A.; Isidro y Sánchez, J.; Fernández-Gónzalez, J.; Tadesse, W.; Vetukuri, R.R.; Carlsson, A.S.; Ceplitis, A.; Crossa, J.; et al. Genomic Selection in Plant Breeding: Key Factors Shaping Two Decades of Progress. Mol. Plant 2024, 17, 552–578. [Google Scholar] [CrossRef] [PubMed]
  14. Kumar, A.; Kumar, A.; Pandey, D.; Reddy, U.G.; Parmar, H.K.; Singh, P.; Garg, N.K.; He, X.; Tarekegn, Z.T.; Singh, G.; et al. Breeding and Selection Strategies to Accelerate Genetic Gains in Wheat for South Asia. VeriXiv 2025, 2, 110. [Google Scholar] [CrossRef]
  15. Crouch, J.H.; Payne, T.S.; Dreisigacker, S.; Wu, H.; Braun, H.-J. Improved Discovery and Utilization of New Traits for Breeding. In Wheat Facts and Futures; Dixon, J., Braun, H.-J., Kosina, P., Crouch, J., Eds.; CIMMYT: Mexico City, Mexico, 2009; pp. 42–51. [Google Scholar]
  16. Balkan, A. Genetic variability, heritability and genetic advance for yield and quality traits in M2-4 generations of bread wheat (Triticum aestivum L.) genotypes. Turk. J. Field Crops 2018, 23, 173–179. [Google Scholar] [CrossRef]
  17. Yagdi, K.; Sozen, E. Heritability, Variance Components and Correlations of Yield and Quality Traits in Durum Wheat (Triticum durum Desf.). Pak. J. Bot. 2009, 41, 753–759. [Google Scholar]
  18. Matković Stojšin, M.; Zečević, V.; Petrović, S.; Dimitrijević, M.; Mićanović, D.; Banjac, B.; Knežević, D. Variability, correlation, path analysis and stepwise regression for yield components of different wheat genotypes. Genetika 2018, 50, 817–828. [Google Scholar] [CrossRef]
  19. Banjac, B.; Mladenov, V.; Petrović, S.; Matković-Stojšin, M.; Krstić, Đ.; Vujić, S.; Mačkić, K.; Kuzmanović, B.; Banjac, D.; Jakšić, S.; et al. Phenotypic Variability of Wheat and Environmental Share in Soil Salinity Stress (3S) Conditions. Sustainability 2022, 14, 8598. [Google Scholar] [CrossRef]
  20. Urošević, D.; Knežević, D.; Ðurić, N.; Matković Stojšin, M.; Kandić, V.; Mićanović, D.; Stojiljković, J.; Zečević, V. Assessing the Potential of Old and Modern Serbian Wheat Genotypes: Yield Components and Nutritional Profiles in a Comprehensive Study. Agronomy 2023, 13, 2426. [Google Scholar] [CrossRef]
  21. Qasemi, S.H.; Mostafavi, K.; Khosroshahli, M.; Bihamta, M.R.; Ramshini, H. Genotype and Environment Interaction and Stability of Grain Yield and Oil Content of Rapeseed Cultivars. Food Sci. Nutr. 2022, 10, 4308–4318. [Google Scholar] [CrossRef] [PubMed]
  22. Amelework, A.B.; Bairu, M.W.; Marx, R.; Laing, M.; Venter, S.L. Genotype × Environment Interaction and Stability Analysis of Selected Cassava Cultivars in South Africa. Plants 2023, 12, 2490. [Google Scholar] [CrossRef]
  23. Taherian, M.; Saeidnia, F.; Hamid, R.; Nazeri, S.M. Identification of High-Yielding and Stable Cultivars of Wheat under Different Sowing Dates: Comparison of AMMI and GGE-Biplot Analyses. Heliyon 2024, 10, e39599. [Google Scholar] [CrossRef]
  24. Olivoto, T.; Lúcio, A.D.C.; da Silva, J.A.G.; Marchioro, V.S.; Souza, V.Q.; Jost, E. Mean Performance and Stability in Multi-Environment Trials I: Combining Features of AMMI and BLUP Techniques. Agron. J. 2019, 111, 1–12. [Google Scholar] [CrossRef]
  25. Pour-Aboughadareh, A.; Poczai, P.; Etminan, A.; Jadidi, O.; Kianersi, F.; Shooshtari, L. An Analysis of Genetic Variability and Population Structure in Wheat Germplasm Using Microsatellite and Gene-Based Markers. Plants 2022, 11, 1205. [Google Scholar] [CrossRef]
  26. Wang, T.-C.; Rose, T.; Zetzsche, H.; Ballvora, A.; Friedt, W.; Kage, H.; Léon, J.; Lichthardt, C.; Ordon, F.; Snowdon, R.J.; et al. Multi-environment field trials for wheat yield, stability and breeding progress in Germany. Sci. Data 2025, 12, 64. [Google Scholar] [CrossRef]
  27. Demydov, O.; Zamlila, N.; Novytska, N.; Kirilenko, V.; Miliar, B. Assessment of the Stability of Common Winter Wheat Breeding Lines in Multi-Environment Tests. Sci. Horiz. 2024, 27, 62–74. [Google Scholar] [CrossRef]
  28. Mohammadi, R.; Roostaei, M.; Armion, M.; Abdipour, M.; Rahmati, M.; Shahbazi, K. Deciphering Genotype × Environment Interaction for Grain Yield in Durum Wheat: An Integration of Analytical and Empirical Approaches for Increased Yield Stability and Adaptability. Eur. J. Agron. 2025, 168, 127656. [Google Scholar] [CrossRef]
  29. Luković, K.; Prodanović, S.; Perišić, V.; Milovanović, M.; Perišić, V.; Rajičić, V.; Zečević, V. Multivariate analysis of morphological traits and the most important productive traits of wheat in extreme wet conditions. Appl. Ecol. Environ. Res. 2020, 18, 5857–5871. [Google Scholar] [CrossRef]
  30. Matković Stojšin, M.; Petrović, S.; Banjac, B.; Roljević Nikolić, S.; Zečević, V.; Bačić, J.; Đorđević, R.; Knežević, D. Development of selection criteria for improving grain yield in wheat grown in different agro-ecological environments. Acta Agric. Serb. 2022, 27, 79–87. [Google Scholar] [CrossRef]
  31. Nikolić, O.; Živanović, T.; Kraljević-Balalić, M.; Milovanović, M. Interrelationship between Grain Yield and Physiological Parameters of Winter Wheat Nitrogen Nutrition Efficiency. Genetika 2011, 43, 91–100. [Google Scholar] [CrossRef]
  32. Caverzan, A.; Casassola, A.; Brammer, S.P. Antioxidant Responses of Wheat Plants under Stress. Genet. Mol. Biol. 2016, 39, 1–6. [Google Scholar] [CrossRef]
  33. Štolfa Čamagajevac, I.; Vuković, R.; Vuković, K.; Vuković, A.; Ivezić, V.; Žuna Pfeiffer, T.; Krstin, L.; Lončarić, Z. Wheat Leaf Antioxidative Status—Variety-Specific Mechanisms of Zinc Tolerance during Biofortification. Plants 2021, 10, 2223. [Google Scholar] [CrossRef]
  34. Nardino, M.; Perin, E.C.; Aranha, B.C.; Carpes, S.T.; Fontoura, B.H.; de Sousa, D.J.P.; Freitas, D.S.D. Understanding Drought Response Mechanisms in Wheat and Multi-Trait Selection. PLoS ONE 2022, 17, e0266368. [Google Scholar] [CrossRef]
  35. Oguz, M.C.; Aycan, M.; Oguz, E.; Poyraz, I.; Yildiz, M. Drought Stress Tolerance in Plants: Interplay of Molecular, Biochemical and Physiological Responses in Important Development Stages. Physiologia 2022, 2, 180–197. [Google Scholar] [CrossRef]
  36. Matković Stojšin, M.; Petrović, S.; Banjac, B.; Zečević, V.; Roljević Nikolić, S.; Majstorović, H.; Đorđević, R.; Knežević, D. Assessment of Genotype Stress Tolerance as an Effective Way to Sustain Wheat Production under Salinity Stress Conditions. Sustainability 2022, 14, 6973. [Google Scholar] [CrossRef]
  37. Republic Hydrometeorological Service of Serbia. Available online: http://www.hidmet.gov.rs/ (accessed on 15 June 2025).
  38. Meier, U. (Ed.) Growth Stages of Mono- and Dicotyledonous Plants—BBCH Monograph; Federal Biological Research Centre for Agriculture and Forestry: Bonn, Germany, 2001. [Google Scholar]
  39. Molyneux, P. The Use of Stable Free Radical Diphenylpicrylhydrazyl (DPPH) for Estimating Antioxidant Activity. Songklanakarin J. Sci. Technol. 2004, 26, 211–219. [Google Scholar]
  40. Singleton, V.L.; Rossi, J.A. Colorimetry of Total Phenolics with Phosphomolybdic-Phosphotungstic Acid Reagents. Am. J. Enol. Vitic. 1965, 16, 144–158. [Google Scholar] [CrossRef]
  41. R Project for Statistical Computing; Version 4.3.2 (2023-10-31 ucrt); R Foundation for Statistical Computing: Vienna, Austria, 2022; Available online: https://www.R-project.org/ (accessed on 20 July 2025).
  42. Fox, J.; Weisberg, S. An R Companion to Applied Regression, 3rd ed.; Sage: Thousand Oaks, CA, USA, 2019; Available online: https://www.john-fox.ca/Companion/ (accessed on 20 July 2025).
  43. de Mendiburu, F. agricolae: Statistical Procedures for Agricultural Research; R Package Version 1.3-7. 2023. Available online: https://CRAN.R-project.org/package=agricolae (accessed on 20 July 2025).
  44. Gauch, H.G.; Zobel, R.W. AMMI Analysis of Yield Trials. In Genotype by Environment Interaction; Kang, M.S., Gauch, H.G., Eds.; CRC Press: Boca Raton, FL, USA, 1996; pp. 85–122. [Google Scholar]
  45. Olivoto, T.; Lúcio, A.D. metan: An R package for multi-environment trial analysis. Methods Ecol. Evol. 2020, 11, 783–789. [Google Scholar] [CrossRef]
  46. Purchase, J.L.; Hatting, H.; van Deventer, C.S. Genotype × Environment Interaction of Winter Wheat (Triticum aestivum L.) in South Africa: II. Stability Analysis of Yield Performance. S. Afr. J. Plant Soil. 2000, 17, 101–107. [Google Scholar] [CrossRef]
  47. Kassambara, A.; Mundt, F. factoextra: Extract and Visualize the Results of Multivariate Data Analyses; R Package Version 1.0.7. 2020. Available online: https://CRAN.R-project.org/package=factoextra (accessed on 25 July 2025).
  48. Sievert, C. Interactive Web-Based Data Visualization with R, Plotly, and Shiny; Chapman and Hall/CRC: London, UK, 2020; Available online: https://plotly-r.com/ (accessed on 22 August 2025).
  49. Achilli, A.L.; Roncallo, P.F.; Echenique, V. Genetic Gains in Grain Yield and Agronomic Traits of Argentinian Durum Wheat from 1934 to 2015. Agronomy 2022, 12, 2151. [Google Scholar] [CrossRef]
  50. Yan, Q.; Zeng, Z.; Wang, C.; Li, J.; Song, J.; Li, Q.; Zhao, Y.; Liu, C.; Jing, X. Genetic Diversity and Population Structure of Wheat Germplasm for Grain Nutritional Quality Using Haplotypes and KASP Markers. Agriculture 2025, 15, 1986. [Google Scholar] [CrossRef]
  51. Pour-Aboughadareh, A.; Ahmadi, J.; Mehrabi, A.A.; Moghaddam, M.; Etminan, A. Evaluation of agro-morphological diversity in wild relatives of wheat collected in Iran. J. Agric. Sci. Technol. 2017, 19, 943–956. [Google Scholar]
  52. Mladenov, V.; Dimitrijević, M.; Petrović, S.; Boćanski, J.; Banjac, B.; Kondić-Špika, A.; Trkulja, D. Genetic Analysis of Spike Length in Wheat. Genetika 2019, 51, 167–178. [Google Scholar] [CrossRef]
  53. Ullah, I.M.; Mahpara, S.; Bibi, R.; Shah, R.U.; Ullah, R.; Abbas, S.; Ullah, M.I.; Hassan, A.M.; El-Shehawi, A.M.; Bresric, M.; et al. Grain Yield and Correlated Traits of Bread Wheat Lines: Implications for Yield Improvement. Saudi J. Biol. Sci. 2021, 28, 5714–5719. [Google Scholar] [CrossRef] [PubMed]
  54. Shamsabadi, E.E.; Sabouri, H.; Soughi, H.; Sajadi, S.J. Genetic Analysis of Spike Traits in Wheat (Triticum aestivum L.). Genetika 2020, 52, 559–569. [Google Scholar] [CrossRef]
  55. Lacko-Bartošová, M.; Lacko-Bartošová, L.; Kobida, Ľ.; Kaur, A.; Moudrý, J. Phenolic Acids Profiles and Phenolic Concentrations of Emmer Cultivars in Response to Growing Year under Organic Management. Foods 2023, 12, 1480. [Google Scholar] [CrossRef]
  56. Popović, V.; Ljubičić, N.; Kosrić, M.; Radulović, M.; Blagojević, D.; Ugrenović, V.; Popović, D.; Ivošević, B. Genotype × environment interaction for wheat yield traits suitable for selection in different seed priming conditions. Plants 2020, 9, 1804. [Google Scholar] [CrossRef]
  57. Ljubičić, N.; Popović, V.; Ćirić, V.; Kostić, M.; Ivošević, B.; Popović, D.; Pandžić, M.; El Musafah, S.; Janković, S. Multivariate Interaction Analysis of Winter Wheat Grown in Environment of Limited Soil Conditions. Plants 2021, 10, 604. [Google Scholar] [CrossRef] [PubMed]
  58. Chrpová, J.; Grausgruber, H.; Weyermann, V.; Buerstmayr, M.; Palicová, J.; Kozová, J.; Trávníčková, M.; Nguyen, Q.T.; Moreno Amores, J.E.; Buerstmayr, H.; et al. Resistance of Winter Spelt Wheat [Triticum aestivum subsp. spelta (L.) Thell.] to Fusarium Head Blight. Front. Plant Sci. 2021, 12, 661484. [Google Scholar] [CrossRef]
  59. Serrago, R.A.; Carrera, C.S.; Savin, R.; Slafer, G.A. Is the Relationship between Grain Number and Spike Dry Weight Linear? Insights from Larger Spikes in Wheat. Crop J. 2025, 13, 636–640. [Google Scholar] [CrossRef]
  60. Ferrante, A.; Savin, R.; Slafer, G.A. Floret Development and Spike Fertility in Wheat: Differences between Cultivars of Contrasting Yield Potential and Their Sensitivity to Photoperiod and Soil N. Field Crops Res. 2020, 256, 107908. [Google Scholar] [CrossRef]
  61. Mądry, W.; Studnicki, M.; Rozbicki, J.; Golba, J.; Gozdowski, D.; Pecio, A.; Oleksy, A. Ontogenetic-Based Sequential Path Analysis of Grain Yield and Its Related Traits in Several Winter Wheat Cultivars. Acta Agric. Scand. Sect. B Soil Plant Sci. 2015, 65, 605–618. [Google Scholar] [CrossRef]
  62. Al-Ashkar, I.; Sallam, M.; Al-Suhaibani, N.; Ibrahim, A.; Alsadon, A.; Al-Doss, A. Multiple Stresses of Wheat in the Detection of Traits and Genotypes of High-Performance and Stability for a Complex Interplay of Environment and Genotypes. Agronomy 2022, 12, 2252. [Google Scholar] [CrossRef]
  63. Spanic, V.; Jukic, G.; Zoric, M.; Varnica, I. Some Agronomic Properties of Winter Wheat Genotypes Grown at Different Locations in Croatia. Agriculture 2024, 14, 4. [Google Scholar] [CrossRef]
  64. Luković, K.; Rakonjac, A.; Zečević, V.; Matković Stojšin, M.; Rajičić, V.; Stojšin, M.; Bratković, K. Wheat Yield Stability Across Years with Varying Climate Conditions. In Proceedings of the 3rd International Symposium on Biotechnology, Čačak, Serbia, 13–14 March 2025; pp. 111–117. [Google Scholar] [CrossRef]
  65. Sugár, E.; Fodor, N.; Sándor, R.; Bónis, P.; Vida, G.; Árendás, T. Spelt Wheat: An Alternative for Sustainable Plant Production at Low N-Levels. Sustainability 2019, 11, 6726. [Google Scholar] [CrossRef]
  66. Pospišil, A.; Pospišil, M.; Svečnjak, Z.; Matotan, S. Influence of Crop Management upon the Agronomic Traits of Spelt (Triticum spelta L.). Plant Soil Environ. 2011, 57, 435–440. [Google Scholar] [CrossRef]
  67. Dumalasová, V.; Grausgruber, H.; Zelba, O.; Hanzalová, A.; Buerstmayr, H.; Weyermann, V.; dell’Avo, F.; Cuendet, C.; Koppel, R.; Sooväli, P. Spelt Wheat Resistance to Rusts, Powdery Mildew, Leaf Blotch and Common Bunt. Cereal Res. Commun. 2025, 53, 451–467. [Google Scholar] [CrossRef]
  68. Roljević Nikolić, S.; Kovačević, D.; Cvijanović, G.; Dolijanović, Ž.; Marinković, J. Grain Yield and Rhizosphere Microflora of Alternative Types of Wheat in Organic Production. Rom. Biotechnol. Lett. 2018, 23, 13301–13309. [Google Scholar]
  69. Vojnov, B.; Manojlović, M.; Latković, D.; Milošev, D.; Dolijanović, Ž.; Simić, M.; Babec, B.; Šeremešić, S. Grain Yield, Yield Components and Protein Content of Organic Spelt Wheat (Triticum spelta L.) Grown in Different Agro-Ecological Conditions of Northern Serbia. Ratar. Povrt. 2020, 57, 1–7. [Google Scholar] [CrossRef]
  70. Zečević, V.; Bošković, J.; Milenković, S.; Matković Stojšin, M.; Balijagić, J.; Đukić, N.; Knežević, D. Phenotypic Variability of Yield Components of Triticum spelta in Organic Production. Agric. For. 2018, 64, 71–78. [Google Scholar] [CrossRef]
  71. Begna, T. The Role of Genotype by Environmental Interaction in Plant Breeding. Int. J. Agric. Biosci. 2020, 9, 209–215. [Google Scholar]
  72. Bratković, K.; Luković, K.; Perišić, V.; Savić, J.; Maksimović, J.; Adžić, S.; Rakonjac, A.; Matković Stojšin, M. Interpreting the Interaction of Genotype with Environmental Factors in Barley Using Partial Least Squares Regression Model. Agronomy 2024, 14, 194. [Google Scholar] [CrossRef]
  73. Abebe, A.T.; Adewumi, A.S.; Adebayo, M.A.; Shaahu, A.; Mushoriwa, H.; Alabi, T.; Derera, J.; Agbona, A.; Chigeza, G. Genotype × Environment Interaction and Yield Stability of Soybean (Glycine max L.) Genotypes in Multi-Environment Trials (METs) in Nigeria. Heliyon 2024, 10, e38097. [Google Scholar] [CrossRef]
  74. Kebede, G.; Worku, W.; Feyissa, F.; Jifar, H. Genotype by Environment Interaction and Stability Analysis for Selection of Superior Fodder Yield Performing Oat (Avena sativa L.) Genotypes Using GGE Biplot in Ethiopia. Ecol. Genet. Genom. 2023, 28, 100192. [Google Scholar] [CrossRef]
  75. Saeidnia, F.; Taherian, M.; Nazeri, S.M. Graphical Analysis of Multi Environmental Trials for Wheat Grain Yield Based on GGE-Biplot Analysis under Diverse Sowing Dates. BMC Plant Biol. 2023, 23, 198. [Google Scholar] [CrossRef]
  76. Pour-Aboughadareh, A.; Khalili, M.; Poczai, P.; Olivoto, T. Stability Indices to Deciphering the Genotype-by-Environment Interaction (GEI) Effect: An Applicable Review for Use in Plant Breeding Programs. Plants 2022, 11, 414. [Google Scholar] [CrossRef] [PubMed]
  77. Sabir, K.; Rose, T.; Wittkop, B.; Stahl, A.; Snowdon, R.J.; Ballvora, A.; Friedt, W.; Kage, H.; Léon, J.; Ordon, F.; et al. Stage-Specific Genotype-by-Environment Interactions Determine Yield Components in Wheat. Nat. Plants 2023, 9, 1688–1696. [Google Scholar] [CrossRef]
  78. Mullualem, D.; Tsega, A.; Mengie, T.; Fentie, D.; Kassa, Z.; Fassil, A.; Wondaferew, D.; Gelaw, T.A.; Astatkie, T. Genotype-by-Environment Interaction and Stability Analysis of Grain Yield of Bread Wheat (Triticum aestivum L.) Genotypes Using AMMI and GGE Biplot Analyses. Heliyon 2024, 10, e32918. [Google Scholar] [CrossRef] [PubMed]
  79. Yue, H.; Wang, Y.; Chen, Z.; Zhu, J.; Behera, P.P.; Liu, P.; Yang, H.; Wei, J.; Bu, J.; Jiang, X.; et al. Assessing the Role of Genotype by Environment Interaction of Winter Wheat Cultivars Using Envirotyping Techniques in North China. Front. Plant Sci. 2025, 16, 1538661. [Google Scholar] [CrossRef]
  80. Mohammadi, R.; Armion, M.; Zadhasan, E.; Ahamdi, M.M.; Amir, A. The Use of AMMI Model for Interpreting Genotype × Environment Interaction in Durum Wheat. Exp. Agric. 2018, 54, 670–683. [Google Scholar] [CrossRef]
  81. Bishwas, K.C.; Poudel, M.R.; Regmi, D. AMMI and GGE Biplot Analysis of Yield of Different Elite Wheat Line under Terminal Heat Stress and Irrigated Environments. Heliyon 2021, 7, e07206. [Google Scholar] [CrossRef] [PubMed]
  82. Gupta, V.; Kumar, M.; Singh, V.; Chaudhary, L.; Yashveer, S.; Sheoran, R.; Dalal, M.S.; Nain, A.; Lamba, K.; Gangadharaiah, N.; et al. Genotype by Environment Interaction Analysis for Grain Yield of Wheat (Triticum aestivum (L.) em.Thell) Genotypes. Agriculture 2022, 12, 1002. [Google Scholar] [CrossRef]
  83. Perišić, V.; Perišić, V.; Luković, K.; Bratković, K.; Zečević, V.; Babić, S.; Matković Stojšin, M. Stability of Grain Yield Performance of Winter Wheat Genotypes. Sel. Sem. 2022, 28, 52–60. [Google Scholar] [CrossRef]
  84. Omrani, A.; Omrani, S.; Khodarahmi, M.; Shojaei, S.H.; Illés, Á.; Bojtor, C.; Mousavi, S.M.N.; Nagy, J. Evaluation of Grain Yield Stability in Some Selected Wheat Genotypes Using AMMI and GGE Biplot Methods. Agronomy 2022, 12, 1130. [Google Scholar] [CrossRef]
  85. Wodebo, K.Y.; Tolemariam, T.; Demeke, S.; Garedew, W.; Tesfaye, T.; Zeleke, M.; Gemiyu, D.; Bedeke, W.; Wamatu, J.; Sharma, M. AMMI and GGE Biplot Analyses for Mega-Environment Identification and Selection of Some High-Yielding Oat (Avena sativa L.) Genotypes for Multiple Environments. Plants 2023, 12, 3064. [Google Scholar] [CrossRef]
  86. Hossain, M.A.; Sarker, U.; Azam, M.G.; Kobir, M.S.; Roychowdhury, R.; Ercisli, S.; Ali, D.; Oba, S.; Golokhvast, K.S. Integrating BLUP, AMMI, and GGE Models to Explore GE Interactions for Adaptability and Stability of Winter Lentils (Lens culinaris Medik.). Plants 2023, 12, 2079. [Google Scholar] [CrossRef]
  87. Elbasyoni, I.S. Performance and Stability of Commercial Wheat Cultivars under Terminal Heat Stress. Agronomy 2018, 8, 37. [Google Scholar] [CrossRef]
  88. Wardofa, G.; Mohammed, H.; Asnake, D.; Alemu, T. Genotype × Environment Interaction and Yield Stability of Bread Wheat Genotypes in Central Ethiopia. J. Plant Breed. Genet. 2019, 7, 87–94. [Google Scholar] [CrossRef]
  89. Jędzura, S.; Bocianowski, J.; Matysik, P. The AMMI Model Application to Analyze the Genotype–Environmental Interaction of Spring Wheat Grain Yield for the Breeding Program Purposes. Cereal Res. Commun. 2023, 51, 197–205. [Google Scholar] [CrossRef]
  90. Yan, W.; Hunt, L.A.; Sheng, Q.; Szlavnics, Z. Cultivar evaluation and mega-environment investigation based on the GGE biplot. Crop Sci. 2000, 40, 597–605. [Google Scholar] [CrossRef]
  91. Yan, W.; Kang, M.S.; Ma, B.; Woods, S.; Cornelius, P.L. GGE Biplot vs. AMMI Analysis of Genotype-by-Environment Data. Crop Sci. 2007, 47, 643–655. [Google Scholar] [CrossRef]
  92. Bosi, S.; Negri, L.; Fakaros, A.; Oliveti, G.; Whittaker, A.; Dinelli, G. GGEBiplot Analysis to Explore the Adaption Potential of Italian Common Wheat Genotypes. Sustainability 2022, 14, 897. [Google Scholar] [CrossRef]
  93. Yan, W. Two Types of Biplots to Integrate Multi-Trial and Multi-Trait Information for Genotype Selection. Crop Sci. 2024, 64, 1608–1618. [Google Scholar] [CrossRef]
  94. Aktaş, H. Tracing Highly Adapted Stable Yielding Bread Wheat (Triticum aestivum L.) Genotypes for Greatly Variable South-Eastern Turkey. Appl. Ecol. Environ. Res. 2016, 14, 159–176. [Google Scholar] [CrossRef]
  95. Zandalinas, S.I.; Fritschi, F.B.; Mittler, R. Global Warming, Climate Change, and Environmental Pollution: Recipe for a Multifactorial Stress Combination Disaster. Trends Plant Sci. 2021, 26, 588–599. [Google Scholar] [CrossRef] [PubMed]
  96. Banjac, B.; Dimitrijević, M.; Petrović, S.; Mladenov, V.; Banjac, D.; Kiprovski, B. Antioxidant Variability of Wheat Genotypes under Salinity Stress in situ. Genetika 2020, 52, 1145–1160. [Google Scholar] [CrossRef]
  97. Chugh, V.; Kaur, N.; Gupta, A.K. Differential Antioxidative Response of Tolerant and Sensitive Maize (Zea mays L.) Genotypes to Drought Stress at Reproductive Stage. Indian J. Biochem. Biophys. 2013, 50, 150–158. [Google Scholar]
  98. Kiani, R.; Arzani, A.; Mirmohammady Maibody, S.A.M. Polyphenols, Flavonoids, and Antioxidant Activity Involved in Salt Tolerance in Wheat, Aegilops sylandrica and Their Amphidiploids. Front. Plant Sci. 2021, 12, 646221. [Google Scholar] [CrossRef]
  99. Zhang, A.; Liu, M.; Gu, W.; Wang, J.; Zhang, Y.; Ma, Z.; Zhao, T.; Li, Y.; Bai, Y. Effect of Drought on Photosynthesis, Total Antioxidant Capacity, Bioactive Component Accumulation, and the Transcriptome of Atractylodes lancea. BMC Plant Biol. 2021, 21, 293. [Google Scholar] [CrossRef]
  100. Nawaz, H.; Hussain, N.; Yasmeen, A. Growth, Yield and Antioxidants Status of Wheat (Triticum aestivum L.) Cultivars under Water Deficit Conditions. Pak. J. Agric. Sci. 2015, 52, 953–959. [Google Scholar]
  101. Barros Santos, M.C.; da Silva Lima, L.R.; Nascimento, F.R.; do Nascimento, T.P.; Cameron, L.C.; Ferreira, M.S.L. Metabolomic Approach for Characterization of Phenolic Compounds in Different Wheat Genotypes during Grain Development. Food Res. Int. 2019, 124, 118–128. [Google Scholar] [CrossRef]
  102. Brandolini, A.; Castoldi, P.; Plizzari, L.; Hidalgo, A. Phenolic Acids Composition, Total Polyphenols Content and Antioxidant Activity of Triticum monococcum, Triticum turgidum and Triticum aestivum: A Two-Years Evaluation. J. Cereal Sci. 2013, 58, 123–131. [Google Scholar] [CrossRef]
  103. Sharma, A.; Shahzad, B.; Rehman, A.; Bhardwaj, R.; Landi, M.; Zheng, B. Response of Phenylpropanoid Pathway and the Role of Polyphenols in Plants under Abiotic Stress. Molecules 2019, 24, 2452. [Google Scholar] [CrossRef] [PubMed]
  104. Melios, S.; Ninou, E.; Irakli, M.; Tsivelika, N.; Sistanis, I.; Papathanasiou, F.; Didos, S.; Zinoviadou, K.; Karantonis, H.C.; Argiriou, A.; et al. Effect of Genotype, Environment, and Their Interaction on the Antioxidant Properties of Durum Wheat: Impact of Nitrogen Fertilization and Sowing Time. Agriculture 2024, 14, 328. [Google Scholar] [CrossRef]
  105. Buczek, J.; Jańczak-Pieniążek, M.; Harasim, E.; Kwiatkowski, C.A.; Kapusta, I. Effect of Cropping Systems and Environment on Phenolic Acid Profiles and Yielding of Hybrid Winter Wheat Genotypes. Agriculture 2023, 13, 834. [Google Scholar] [CrossRef]
  106. Salekjalali, M.; Haddad, R.; Jafari, B. Analysis of Antioxidant Enzyme Activity during Reproductive Stages of Barley under Drought Stress. J. Ecobiotechnol. 2011, 3, 40–47. [Google Scholar]
  107. Mathew, I.; Shimelis, H.; Mwadzingeni, L.; Chaplot, V. Variance Components and Heritability of Traits Related to Root:Shoot Biomass Allocation and Drought Tolerance in Wheat. Euphytica 2018, 214, 225. [Google Scholar] [CrossRef]
  108. Sewore, B.M.; Abe, A. Genetic Variability and Trait Associations in Bread Wheat (Triticum aestivum L.) Genotypes under Drought-Stressed and Well-Watered Conditions. CABI Agric. Biosci. 2024, 5, 64. [Google Scholar] [CrossRef]
  109. Javed, M.; Ali, A.; Kashif, M.; Ali, M.; Ullah, S.; Alam, A. Estimation of Heritability, Genotypic Variability and Correlations Analysis for Yield and Yield Attributing Traits among Bread Wheat (Triticum aestivum L.) Genotypes. J. Appl. Life Sci. Environ. 2024, 57, 91–106. [Google Scholar] [CrossRef]
  110. Ghafoor, A.Z.; Ceglińska, A.; Karim, H.; Wijata, M.; Sobczyński, G.; Derejko, A.; Studnicki, M.; Rozbicki, J.; Cacak-Pietrzak, G. Influence of Genotype, Environment, and Crop Management on the Yield and Bread-Making Quality in Spring Wheat Cultivars. Agriculture 2024, 14, 2131. [Google Scholar] [CrossRef]
  111. Sangha, J.S.; Wang, W.; Knox, R.; Ruan, Y.; Cuthbert, R.D.; Isidro-Sánchez, J.; Li, L.; He, Y.; DePauw, R.; Singh, A.; et al. Phenotypic Plasticity of Bread Wheat Contributes to Yield Reliability under Heat and Drought Stress. PLoS ONE 2025, 20, e0312122. [Google Scholar] [CrossRef]
  112. Shokat, S.; Großkinsky, D.K.; Roitsch, T.; Liu, F. Activities of Leaf and Spike Carbohydrate-Metabolic and Antioxidant Enzymes Are Linked with Yield Performance in Three Spring Wheat Genotypes Grown under Well-Watered and Drought Conditions. BMC Plant Biol. 2020, 20, 400. [Google Scholar] [CrossRef]
  113. Niroula, A.; Khatri, S.; Khadka, D.; Timilsina, R. Total phenolic contents and antioxidant activity profile of selected cereal sprouts and grasses. Int. J. Food Prop. 2019, 22, 427–437. [Google Scholar] [CrossRef]
  114. Spanic, V.; Drezner, G.; Dvojkovic, K.; Horvat, D. Traits of 25 Winter wheat varieties grown in Croatia in the last 100 years. Agron. Glas. 2016, 78, 3–16. [Google Scholar]
  115. Ding, H.; Wang, C.; Cai, Y.; Yu, K.; Zhao, H.; Wang, F.; Shi, X. Characterization of a Wheat Stable QTL for Spike Length and Its Genetic Effects on Yield-Related Traits. BMC Plant Biol. 2024, 24, 292. [Google Scholar] [CrossRef]
  116. Philipp, N.; Weichert, H.; Bohra, U.; Weschke, W.; Schulthess, A.W.; Weber, H. Grain number and grain yield distribution along the spike remain stable despite breeding for high yield in winter wheat. PLoS ONE 2018, 13, e0205452. [Google Scholar] [CrossRef] [PubMed]
  117. Xie, Q.; Sparkes, D.L. Dissecting the Trade-Off of Grain Number and Size in Wheat. Planta 2021, 254, 3. [Google Scholar] [CrossRef] [PubMed]
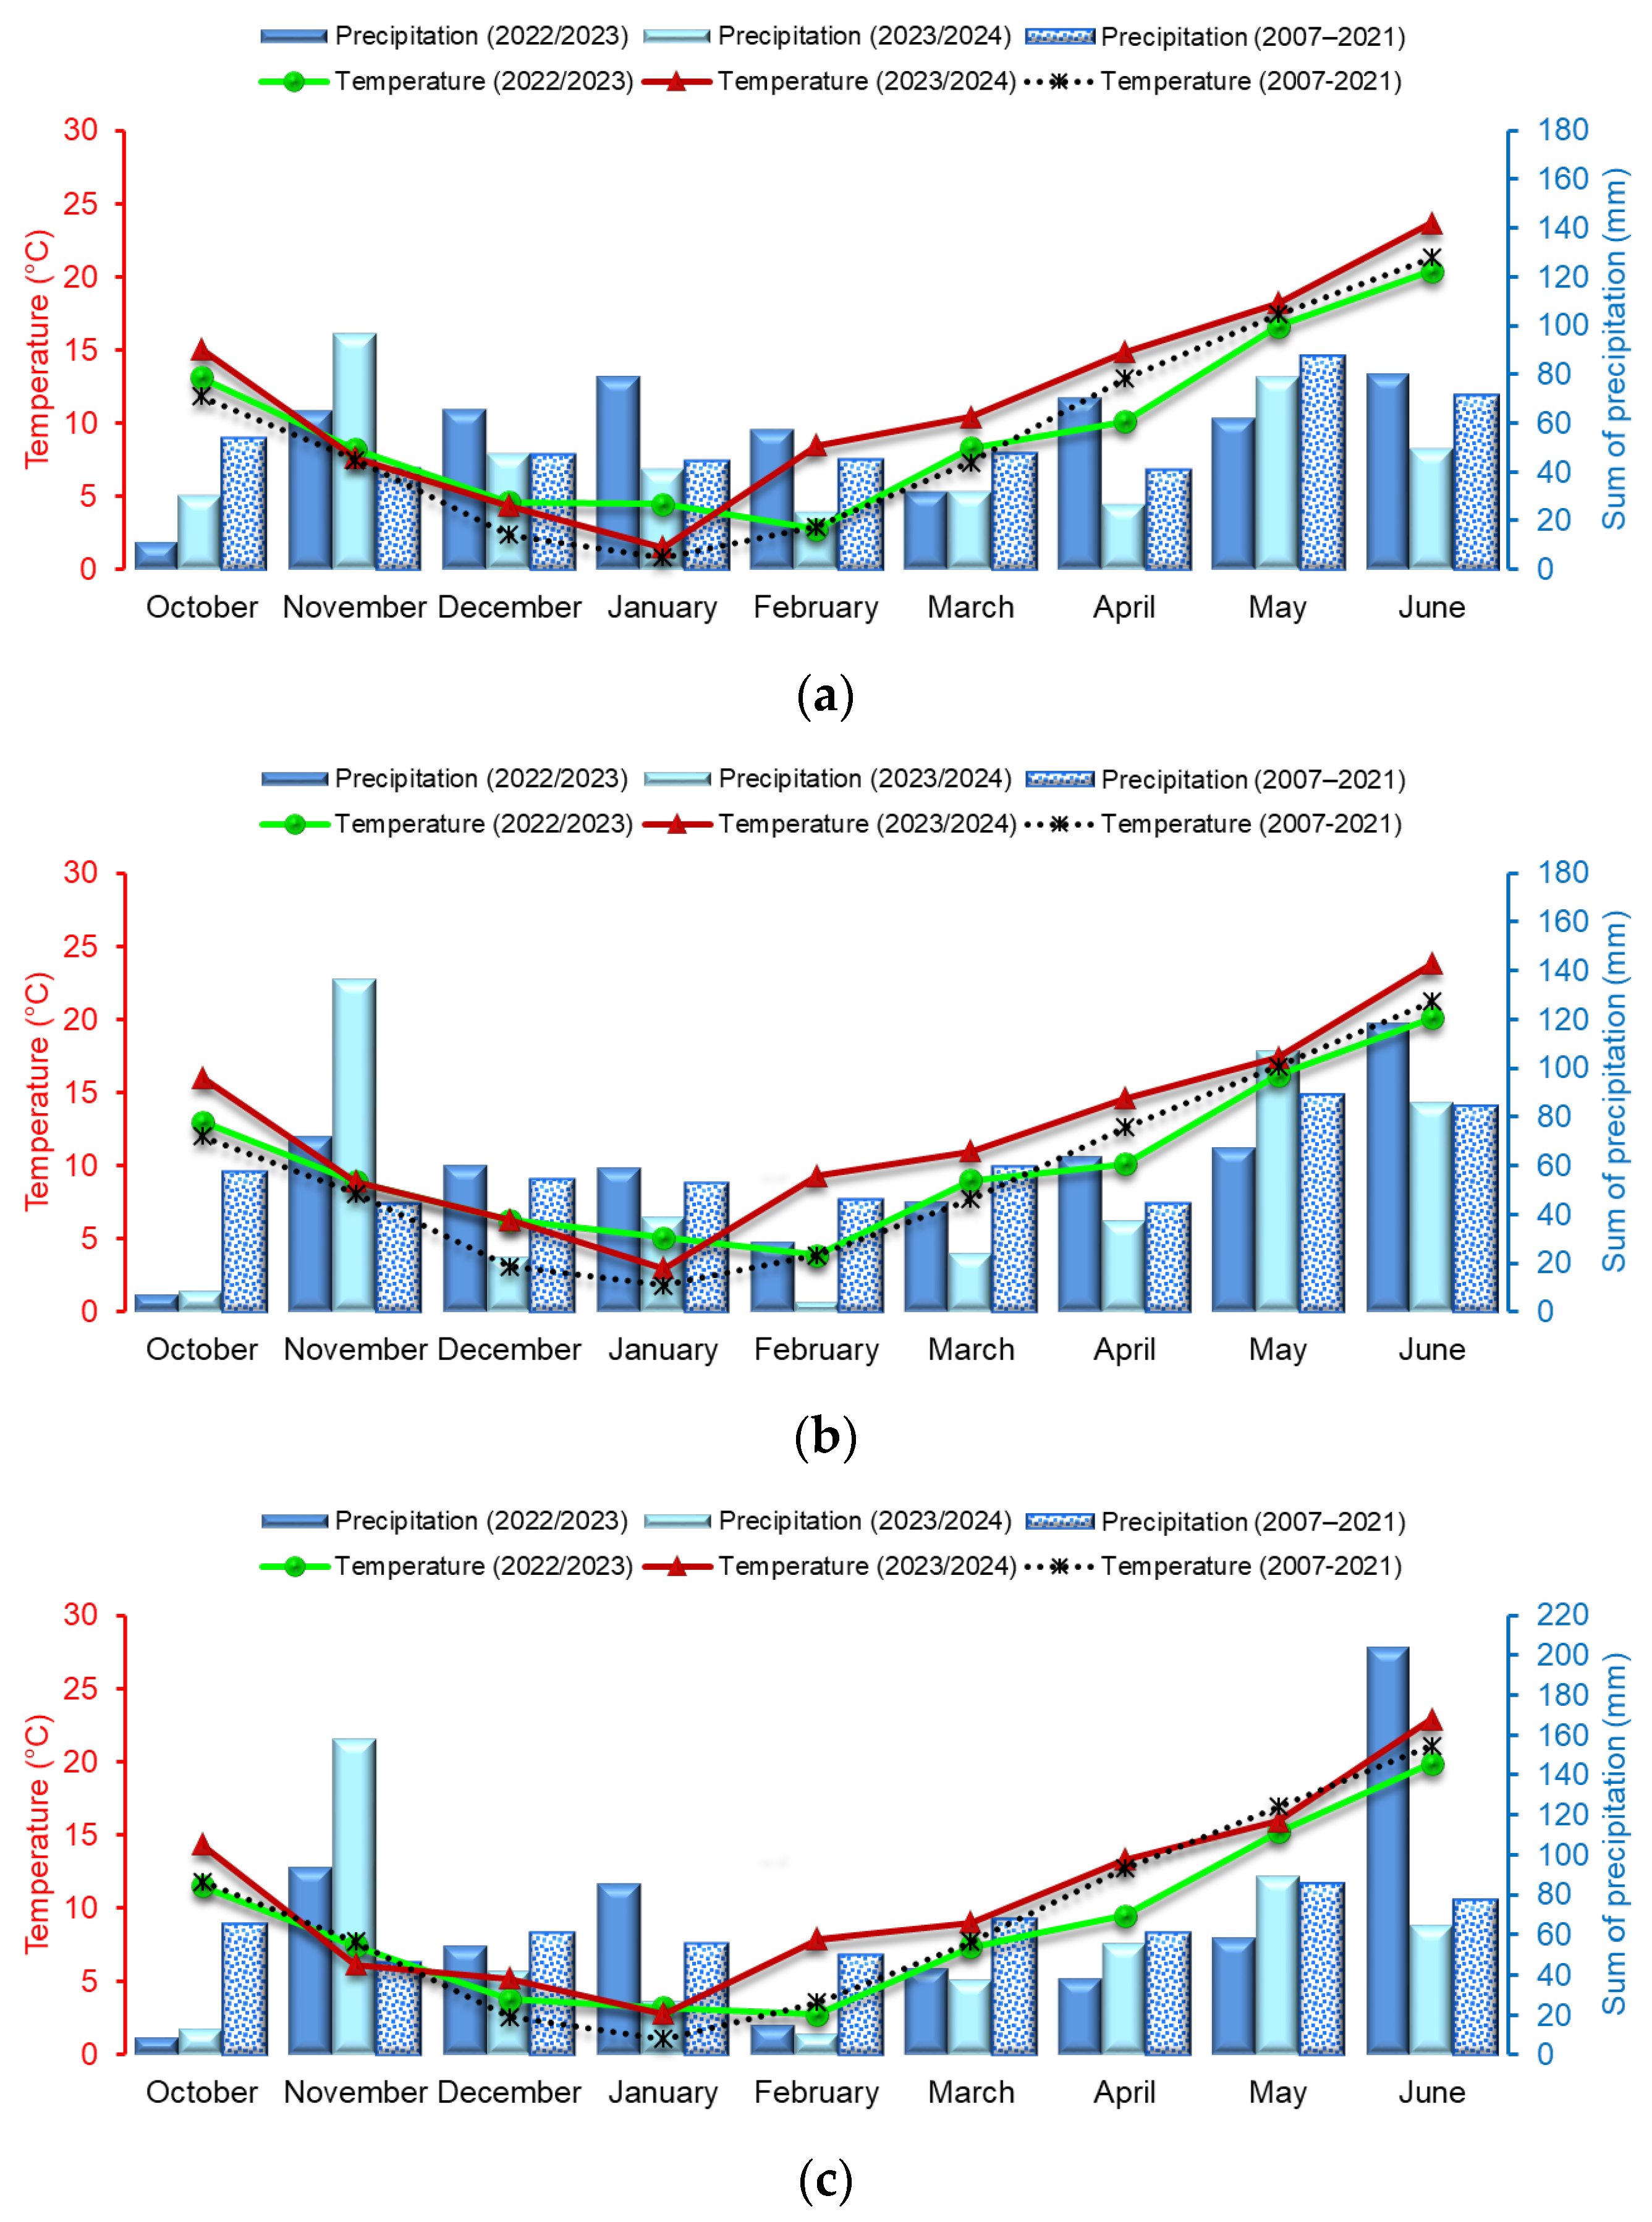
Figure 1. Mean monthly air temperature and total monthly precipitation during the 2022/2023 and 2023/2024 growing seasons at three localities: (a) Pančevo, (b) Kragujevac, and (c) Kruševac.
Agronomy 15 02684 g001
Figure 2. Phenotypic variation in plant height (a), spike length (b), number of grains per spike (c), and grain yield (d) in relation to genotype, year, and their interaction. G1—KG-4/1, G2—KG-9/1, G3—KG-11/1, G4—KG-16/1, G5—KG-21/1, G6—KG-30/1, G7—KG-33/1, G8—KG-40/1, G9—KG-41/1, G10—KG-43/1, G11—NS 40S, G12—Renesansa, G13—Pobeda, G14—KG-54-7/3-5, G15—KG-54-7/3-2; Note: Different small letters indicate significant differences (p < 0.05) in the average values of genotypes within each year; Different capital letters indicate significant differences between years based on overall means.
Agronomy 15 02684 g002
Figure 3. Phenotypic variation in plant height (a), spike length (b), number of grains per spike (c), and grain yield (d) in relation to genotype, locality, and their interaction. G1—KG-4/1, G2—KG-9/1, G3—KG-11/1, G4—KG-16/1, G5—KG-21/1, G6—KG-30/1, G7—KG-33/1, G8—KG-40/1, G9—KG-41/1, G10—KG-43/1, G11—NS 40S, G12—Renesansa, G13—Pobeda, G14—KG-54-7/3-5, G15—KG-54-7/3-2; Note: Different small letters indicate significant differences (p < 0.05) in the average values of genotypes within each locality; Different capital letters indicate significant differences between localities based on overall means.
Agronomy 15 02684 g003
Figure 4. AMMI1 (mean value vs. PCA1) biplot (a) and AMMI 2 (PCA1 vs. PCA2) biplot (b) for grain yield of analyzed wheat genotypes grown across six environments: E1—Pančevo (2022/2023), E2—Kragujevac (2022/2023), E3—Kruševac (2022/2023), E4—Pančevo (2023/2024), E5—Kragujevac (2023/2024), and E6—Kruševac (2023/2024).
Agronomy 15 02684 g004
Figure 5. GGE (Genotype + Genotype-by-Environment) biplots for grain yield of analyzed wheat genotypes grown in six environments: (a) Mean vs. Stability; (b) Which-won-where (c) Discriminativeness vs. representativeness; and (d) Ranking genotypes. Note: G1—KG-4/1, G2—KG-9/1, G3—KG-11/1, G4—KG-16/1, G5—KG-21/1, G6—KG-30/1, G7—KG-33/1, G8—KG-40/1, G9—KG-41/1, G10—KG-43/1, G11—NS 40S, G12—Renesansa, G13—Pobeda, G14—KG-54-7/3-5, G15—KG-54-7/3-2.
Agronomy 15 02684 g005
Figure 6. DPPH radical scavenging activity (mg TE g−1 d.m.) (a) and total phenolic content (mg GAE g−1 d.m.) (b) of wheat genotypes across phenophases (combined data for three localities and two seasons). Note: Different lowercase letters indicate statistically significant differences between genotypes within each phenophase, while different uppercase letters indicate significant differences between phenophases (Tukey’s HSD test, p < 0.05).
Agronomy 15 02684 g006
Figure 7. DPPH radical scavenging activity (mg TE g−1 d.m.) (a) and total phenolic content (mg GAE g−1 d.m.) (b) of wheat genotypes across localities (combined data for three phenophases and two seasons). Note: Different lowercase letters indicate statistically significant differences between genotypes within each locality, while different uppercase letters indicate significant differences between localities (Tukey’s HSD test, p < 0.05).
Agronomy 15 02684 g007
Figure 8. PCA biplots (PC1 vs. PC2) and 3D plots (PC1 vs. PC2 vs. PC3) illustrating relationships among wheat genotypes and analyzed traits (PH—plant height, SL—spike length, NGS—number of grains per spike, GY—grain yield, DPPH—DPPH radical scavenging activity, TPC—total phenolic content measured at three growth stages: I—tillering, II—stem elongation, III—anthesis) in the 2022/2023 (a,b) and 2023/2024 (c,d) growing seasons. Localities: PA—Pančevo, KG—Kragujevac, KS—Kruševac.
Agronomy 15 02684 g008
Table 1. Wheat genotypes used in study.
No.Genotype 1PedigreeInstitution
1.KG-4/1Pobeda × AleksandraCenter for Small Grains and Rural Development, Kragujevac
2.KG-9/1Cipovka × Aleksandra
3.KG-11/1Oda × Aleksandra
4.KG-16/1Planeta × Aleksandra
5.KG-21/1Srna × Aleksandra
6.KG-30/1Evropa 90 × Kruna
7.KG-33/1Zenit × Kruna
8.KG-40/1Milica × Kruna
9.KG-41/1Kruna × Venera
10.KG-43/1Aleksandra × Ana Morava
11.NS 40S (standard)NA 694 × NSA 88-3141Institute for Field and Vegetable Crops, Novi Sad
12.Renesansa (standard)Jugoslavija × NS 55-25
13.Pobeda (standard)Sremica × Balkan
14.KG-54-7/3-5 (spelt)KG-100 × SSK 2001/02Center for Small Grains and Rural Development, Kragujevac
15.KG-54-7/3-2 (spelt)KG-100 × SSK 2001/02
1 The KG codes refer to wheat lines developed at the Center for Small Grains and Rural Development, Kragujevac. All lines and varieties used as standards are considered genotypes.
Table 2. Basic chemical analysis of soil at the analyzed localities.
Debth
(cm)
pH in H2OpH in KClHumus
(%)
N
(%)
P2O5
(mg 100 g−1)
K2O
(mg 100 g−1)
CaCO3
(%)
Pančevo
0–308.277.573.390.2020.625.5312.59
Kragujevac
0–306.935.813.950.209.6719.40˂ 0.42
Kruševac
0–306.175.352.140.2288.5619.240.80
Table 3. First four AMMI selections per environment.
Environment 1Mean
(t ha−1)
IPCA1
Score
Rank of Genotypes
1234
E15.740.005KG-11/1KG-4/1KG-40/1NS 40S
E25.511.516KG-40/1KG-11/1PobedaKG-21/1
E35.240.146KG-54-7/3-2PobedaRenesansaKG-40/1
E46.43−0.744NS 40SKG-4/1KG-16/1KG-41/1
E54.84−0.925RenesansaKG-4/1KG-9/1NS 40 S
E66.870.001KG-4/1KG-11/1KG-21/1NS 40 S
1 E1—Pančevo (2022/2023), E2—Kragujevac (2022/2023), E3—Kruševac (2022/2023), E4—Pančevo (2023/2024), E5—Kragujevac (2023/2024), and E6—Kruševac (2023/2024).
Disclaimer/Publisher’s Note: The statements, opinions and data contained in all publications are solely those of the individual author(s) and contributor(s) and not of MDPI and/or the editor(s). MDPI and/or the editor(s) disclaim responsibility for any injury to people or property resulting from any ideas, methods, instructions or products referred to in the content.