Article

Forage Quality and Yield Enhancement via Wolfberry (Lycium barbarum L.)–Forage Intercropping System

1
State Key Laboratory of Efficient Production of Forest Resources, Yinchuan 750002, China
2
Ningxia Forestry Institute, Yinchuan 750002, China
3
Ningxia Wolfberry Industry Development Center, Yinchuan 750001, China
4
College of Geographical Sciences and Planning, Ningxia University, Yinchuan 750002, China
5
Department of Horticultural Engineering, Ningxia Wine and Desertification Career Technical College, Yinchuan 750021, China
6
Ningxia Yunwu Mountains Grassland Natural Reserve Administration, Guyuan 756099, China
*
Authors to whom correspondence should be addressed.
Agronomy 2025, 15(11), 2660; https://doi.org/10.3390/agronomy15112660
Submission received: 28 September 2025 / Revised: 30 October 2025 / Accepted: 11 November 2025 / Published: 20 November 2025
(This article belongs to the Section Grassland and Pasture Science)

Abstract

The agroforestry system, which integrates the strategic intercropping of trees and grasses, is profoundly shaped by complex ecological interactions that dynamically reshape microclimatic environments and significantly impact the growth of understory forage species. Wolfberry–forage intercropping patterns have the potential to improve soil quality and orchard productivity, but their effects on forage cover crops are still unclear. Therefore, this study selects wolfberry and nine forage grass as research subjects to examine the effects of intercropping these species on the morphological characteristics, yield, quality, photosynthetic capacity, and plant physiology of forage grass. Based on experimental data, cover cropping facilitated plant growth, maintained fruit yield, and promoted leaf photosynthesis in forage compared with monocropping. This was exemplified by a notable increase in forage plants under the intercropping system, for the number of primary branches or tillers, and an improvement in the drying ratio of forage grasses, while reducing plant height, leaf-to-stem ratio, and photosynthetic rate (p < 0.05). Furthermore, the intercropping system significantly enhances the dry weight yield of alfalfa, ryegrass, and mangold, with increases of 60%, 64%, and 70%, respectively (p < 0.05). Additionally, it improves forage quality by increasing the crude protein content in ryegrass and mangold by 32% and 10%, respectively, and decreasing acid detergent fiber content by 10% and 18% (p < 0.05). Collectively, the results indicated that mangold, ryegrass, and alfalfa were the optimal cover crops for sustainable wolfberry production in the study area. The use of appropriate wolfberry–forage cover crops enhanced hay yield and the quality of forage by stimulating photosynthetic capacity and biotic stress resistance. Our research elucidates the mechanisms underlying the effects of intercropping systems on forage grass growth, aiming to provide a scientific basis for the development of animal husbandry and the rational utilization of land resources in the Ningxia region.

1. Introduction

The use of forage as cover crops is a conservation practice widely used to increase crop productivity and land-use sustainability in modern agriculture [1]. Growing forage cover crops in the interspaces of orchards can improve land-use efficiency, reduce soil management cost, and provide animal feed, which contributes to productive harmony [2]. Intercropping can make intensive and efficient use of natural resources such as light, temperature, and water in time and space, and improve the utilization rate of light energy. This agronomic technique enhances fruit yield and quality through the effective utilization of nutrients, light energy, and water resources [3,4]. Cover cropping reduces light loss between plants and creates a favorable growth environment for cash crops, boosting overall plant productivity [5,6]. A multi-layered stand structure that influences aboveground light competition is a major determinant for biomass productivity in agroforestry systems. Cover cropping alters the food chain within agrosystems and controls the occurrence of plant diseases and insect pests [7]. The effects of distinct forage cover crops are variable, which necessitates suitable cover crops to confer maximum benefits on cash crops and alleviate the supply crisis of animal feed [8].
Distinct intercropping crops have different effects on plant growth. There have been significant differences in plant growth between intercropping gramineous plants and legumes, among which plant height, leaf area, and biomass per plant increased significantly during intercropping gramineous plants [9]. On the contrary, intercropping legumes had different growth index trends during the growth period. Maize–soybean intercropping compared to monoculture demonstrated that the intercropping system exerts a greater influence on middle rows than on border rows, with border rows exhibiting advantages in dry matter accumulation and nitrogen–phosphorus uptake, reflecting marginal effect superiority and that intercropping exerts the most significant impact on dry matter accumulation in soybean plants during the flowering stage, with a notably greater effect on the middle rows compared with the edge rows. The edge rows of soybeans exhibit a distinct marginal effect advantage [10]. This finding is consistent with another study on border effects, which indicated that during the late reproductive and growth stages of intercropping, the growth performance of the intermediate row was significantly superior to that of the side row [11]. Wolfberry–forage intercropping could improve fruit quality of wolfberry, but the improvement effect was distinct due to different heterosis and group types [12,13]. Zea mays L. and Medicago sativa L. intercropping had no obvious effect on the crude protein and crude fat contents of alfalfa, but significantly increased the crude fat and crude protein contents of green forage corn by more than 30%, indicating that a reasonable intercropping pattern could take advantage of physiological and ecological differences to improve plant quality [14].
Intercropping systems are affected by canopy shading and interspecific competition, and change the microclimate environmental factors such as air, soil temperature and humidity, light intensity, etc., which threatens the growth of grass in forests [15,16]. To promote the long-term, stable, and efficient development of forest and grass intercropping, it is very important to explore the effects of forest and grass intercropping patterns on grass growth. The research team selected grass species within the agroforestry intercropping system as the study subject, with a focus on analyzing the effects of intercropping on root distribution patterns and growth dynamics [17], soil environment, and benefits [18]. Giant eucalyptus can reduce the effective radiation and transpiration of grass in a forest, and then alleviate the extreme distribution of surface temperature, which can provide a good and stable growth environment [19] for grass growth. There are few studies on the effects of short tree shrubs on grass growth and photosynthesis. Cover crops reduce light loss between plants, improve the microenvironment for cash crops, and increase agricultural productivity [5,6]. In agroforestry systems, the canopy structure controls how sunlight is distributed and competed for above ground, affecting biomass production. Cover cropping also alters food web dynamics, helping suppress plant diseases and insect pests [7]. Interactions between plants, such as trees and understory forage species, gradually enhance resilience and adaptability [20]. Root exudates mediate communication among plants and microbes and are essential for growth, development, and stress tolerance [21]. However, effects vary among cover crop species, so selecting the right ones is key to maximizing benefits for main crops and addressing livestock feed shortages [8].
In regions where agriculture and animal husbandry are given comparable priority, the integration of forage cover crops into farming systems has been shown to significantly enhance wolfberry yield, interspecific competitiveness, and overall economic returns [12]. The incorporation of forage species in wolfberry orchards constitutes a promising agronomic practice for promoting the integrated development of fruit cultivation and livestock production in Ningxia [22]. However, comparative research on the impacts of different cover crop species on forage performance remains limited, and the underlying physiological mechanisms remain insufficiently understood. Closing these knowledge gaps is crucial for the development of evidence-based management strategies that support sustainability in wolfberry–forage intercropping systems. The aim of this study was to unravel the responses of forage to wolfberry–forage intercropping system in terms of plant growth, hay yield and quality, as well as physiological characteristics. The optimal cover crops for the wolfberry–forage system were selected based on plant responses. We hypothesized that wolfberry–forage intercropping influences the growth, yield, and forage quality of forage crops by regulating interspecific competition and enhancing the overall light use efficiency. The results of this study could provide empirical support for improving forage productivity and developing superior wolfberry–forage system management strategies and reveal the mechanism of the effect of the intercropping on forage growth.

2. Materials and Methods

2.1. Experimental Design

This study was carried out from 2019 to 2021 at field experimental sites in Ningxia, China, with the same materials and methods as [12,13]. The experimental materials were 1 excellent line of wolfberry with 9 types of forage. The forage species were classified into three families: Gramineae: ryegrass (Lolium perenne L.), sweet sorghum (Sorghum bicolor L.), lvyuan 5 (Poaceae L.), oat (Avena sativa L.), and feather grass (Stipa tenuifolia L.); Leguminosae: alfalfa (Medicago sativa L.), white clover (Trifolium repens L.), and kudouzi (Sophora alopecuroides L.); and Chenopodiaceae: mangold (Betu vulgaris L.). The field experiments used a completely randomized design, with three replicates per treatment (three points were sampled from each treatment and mixed into one sample, which was regarded as one replicate). The experimental study was established at the Zhongqi Group Chinese Wolfberry Production Base (37°48′ N, 105°67′ E), from April 2019 to October 2021, based on a three-year continuous field trial involving 19 treatments: 9 wolfberry–forage intercropping systems, 1 wolfberry monoculture, and 9 forage monocultures. In March 2016, one-year-old wolfberry cuttings were transplanted into the field with three rows per replicate and 160 plants per row, forming plots approximately 160 m in length, with 80 m designated for wolfberry monoculture and 80 m for wolfberry–forage intercropping. From September 2018 to October 2021, corresponding forage species were established on the opposite side of the intercropping plots across an area of approximately 80 m, matching the intercropped zone, to serve as forage monoculture treatments. The total experimental plot area was 21,600 square meters, equivalent to 32.4 hectares. Forage seed size, root depth, and other factors were different, resulting in considerable variations in seeding density and depth. Forage seeds were sown in the field without treatment. The field experiment adopted drip irrigation, with pipes laid along the rows of wolfberry 20 cm above the ground. We also applied sprinkler irrigation in both monocropping and cover cropping systems, which increased the annual irrigation quota from 3600 m3 ha−1 to 5250 m3 ha−1. Precipitation in the growing season in 2019, 2020, and 2021 was 127.1 m3, 127.7 m3, and 128.3 m3, respectively. Due to low rainfall in the growing season and minimal difference between years, the annual irrigation quota was not substantially adjusted in the study period.

2.2. Forage Growth and Yield Estimation

Ryegrass, Lvyuan 5, alfalfa, and white clover were sown on 10 September 2018. Oats, feather grass, sweet sorghum, kudouzi, and mangold were sown between 10 March and 20 March in 2019, 2020, and 2021. The annual cutting frequencies for ryegrass, Lvyuan 5, alfalfa, white clover, oats, feather grass, sweet sorghum, kudouzi, and mangold were 4, 4, 4, 5, 3, 2, 2, 1, and 1, respectively. At harvest, ryegrass and Lvyuan 5 were in the booting stage; alfalfa and white clover were in the budding stage; oats were in the heading stage; mangold was in the late tuber growth stage; sweet sorghum was in the milk-ripening stage; and kudouzi was in the drum stage. Mangold was sown by hole sowing, while the other forages were seeded in strips using a small seeder. For each treatment, five-point sampling was conducted. Whole mangold plants were sampled from each point, and the total length of roots, stems, and leaves was recorded as plant height. For the other eight forage species, 10 plants were randomly selected at each point, resulting in a total of 150 plants measured with a tape measure across three replicates per treatment. Stems and leaves were separated, and fresh weights were recorded. Green leaves were killed in an oven at 105 °C for 30 min and dried at 75 °C until a constant weight was reached. Leaf-to-stem ratios (leaf/stem ratio = leaf weight/stem weight) were calculated for the eight forage grasses, excluding the dry weight ratio for mangold.
The first-order branching or tiller number of forage crops was measured at the initial harvest time. Five sampling points were established in the experiment, with a 1 m2 area or 1 m segment selected at each point. The number of branches or tillers emerging from roots and stems was counted per unit area. For mangold, kudouzi, and sweet sorghum, the statistical data were based on the number of plants within the 1 m segment. The fresh weight and dry weight yield of forage crops were measured at the initial harvest time. A five-point sampling method was employed for each forage material according to the cutting times [13]. For mangold, a 1 m segment was taken at each point to collect whole plants, which were weighed for fresh weight and then dried in a drying room. For the other eight types of forage grasses, a 1 m2 square was cut at each point, leaving a 5 cm stubble. After recording the fresh weight, 500 g samples were placed in an envelope bag. Following three replicates of treatment, samples were subjected to oven drying at 105 °C for 0.5 h, followed by 75 °C for 30 min, and finally dried at 80 °C for 48–72 h until constant weight was achieved (The drying equipment was procured from Xi’an Manside Machinery Technology Co., Ltd., Xi’an, China). The hay weight was recorded, and the dry–fresh ratio and forage yield (hay) were calculated.

2.3. Forage Photosynthetic and Physiological Measurements

An LAI-SunScan plant canopy analyzer (Hangzhou Lvbo Instrument Co., Ltd., Hangzhou, China) was used to determine leaf chlorophyll content (SPAD value). For in situ photosynthetic measurements, five functional leaves of each forage type were randomly selected and three biological replicates were performed. The net photosynthetic rate (Pn), stomatal conductance (Gs), and transpiration rate (Tr) were measured at 8:30–11:30 a.m. on a clear and windless day. We used a GFS-3000 portable gas exchange fluorescence system with a standard measuring head and built-in red and blue light sources (Walz, Gmbh, Nuremberg, Bavaria, Germany). The ambient CO2 concentration was 400 ppm, the air flow rate was 750 µmol s−1, and the leaf chamber temperature was 25 °C. Water use efficiency (WUE) was calculated as Pn/Tr [23]. The content of malondialdehyde (MDA) [24] and the activity of superoxide dismutase (SOD) [25] in wolfberry leaves and roots were determined with field samples by thiobarbituric acid and nitrogen blue tetrazole methods, respectively. All samples were collected in the field.

2.4. Forage Quality Estimation

Ryegrass, Lvyuan No. 5, feather grass, alfalfa, and white clover were cut and sampled on 7 May 2021. Ryegrass, Lvyuan No. 5, and feather grass were in the starting stage, and alfalfa and white clover were in the emerging stage; oats were mowed at the heading stage on 25 June 2021; and mangold, sweet sorghum, and bitter beans were cut and sampled on 25 August 2021, when mangold was at the end of root tuber growth, sweet sorghum was at the milk ripening stage, and bitter beans were at the bulking stage. After each treatment and sampling, the forage was killed in the oven at 105 °C for 30 min, dried at 65 °C to constant weight, and then crushed through a sieve with a diameter of 0.42 mm.
With reference to the method in “Feed Analysis and feed quality Detection Technology”, the content of crude protein (CP) was determined by the Kjeldahl nitrogen determination method, and ether extraction was determined by the Soxhlet method (EE). The Van Soest method was used to determine the neutral detergent fiber (NDF) and acid detergent fiber (ADF). Crude ash (CA) content was measured using the dry ashing method. The relative feed value (RFV) was calculated as RFV = DMI(%BW) × DDM(%DM)/1.29 to compare forage quality and expected feed intake of hay, which was proposed by the Forage Analysis Committee of the American Pasture Council. DMI (dry matter intake, DMI) is the voluntary intake of dry matter of roughage, expressed as a percentage of body weight (%BW). DDM (digestible dry matter, DDM) is the digestible dry matter, and the unit is percentage of dry matter (%DM). The prediction model formulas for DMI and DDM are as follows:
DMI(%BW) = 120/NDF(%DM),
DDM(%DM) = 88.9 − 0.779ADF(%DM),
RFV = DMI(%BW) × DDM(%DM)/1.29.

2.5. Statistical Analysis

All experimental data were processed and analyzed using Excel v2010 (Microsoft Corp., Redmond, WA, USA) and SPSS v17.0 Statistics (SPSS Inc., Chicago, IL, USA). Prior to statistical evaluation, the normality of the dataset was assessed using the Chi-square test. When the analysis of variance (ANOVA) revealed significant differences (p < 0.05), mean values across different cover crop treatments were compared using Fisher’s protected least significant difference (LSD) method. The t-test was employed to evaluate the differences in forage yield and quality between monoculture and intercropping systems. To determine the key variables influencing plant growth, yield, and forage quality, Pearson’s correlation analysis was conducted. Data visualization was carried out using Excel v2010 (Microsoft Corp.), Origin v17.0 (OriginLab Corp., Northampton, MA, USA), and Corrplot v0.1.0 (Hiplot, Shanghai, China).

3. Results

3.1. The Forage Morphological Indexes Under Different Wolfberry–Forage Intercropping Patterns

3.1.1. Influence on Forage Plant Height

In Figure 1, the planting patterns of nine kinds of intercropping wolfberry showed that single cropping was higher than the intercropping level, and the changes among different forages were different. Forage plant height was inhibited to varying degrees under different intercropping patterns, although the mangold plant height was lower than the intercropping level under single cropping, but the difference was not significant (p > 0.05). The plant height of oat (40.95%), kudouzi (32.88%), white clover (29.85%), alfalfa (28.51%), feather grass (17.88%), and sweet sorghum (15.34%) intercropped with wolfberry were significantly inhibited compared with that of single cropping (p < 0.05). The plant height of Lvyuan 5 and ryegrass intercropping decreased, but there was no significant difference (p > 0.05). The most sensitive part of plants to the external environment is reflected in the changes in morphological indexes, which directly show the changes in forage morphological indexes under different intercropping and monocropping modes. Consequently, the findings comprehensively demonstrate that the intercropping of wolfberry–forage systems exerts no significant impact on the plant height of the forage grasses.

3.1.2. The Effect on the Number of First Order Branches/Tillers of Forage

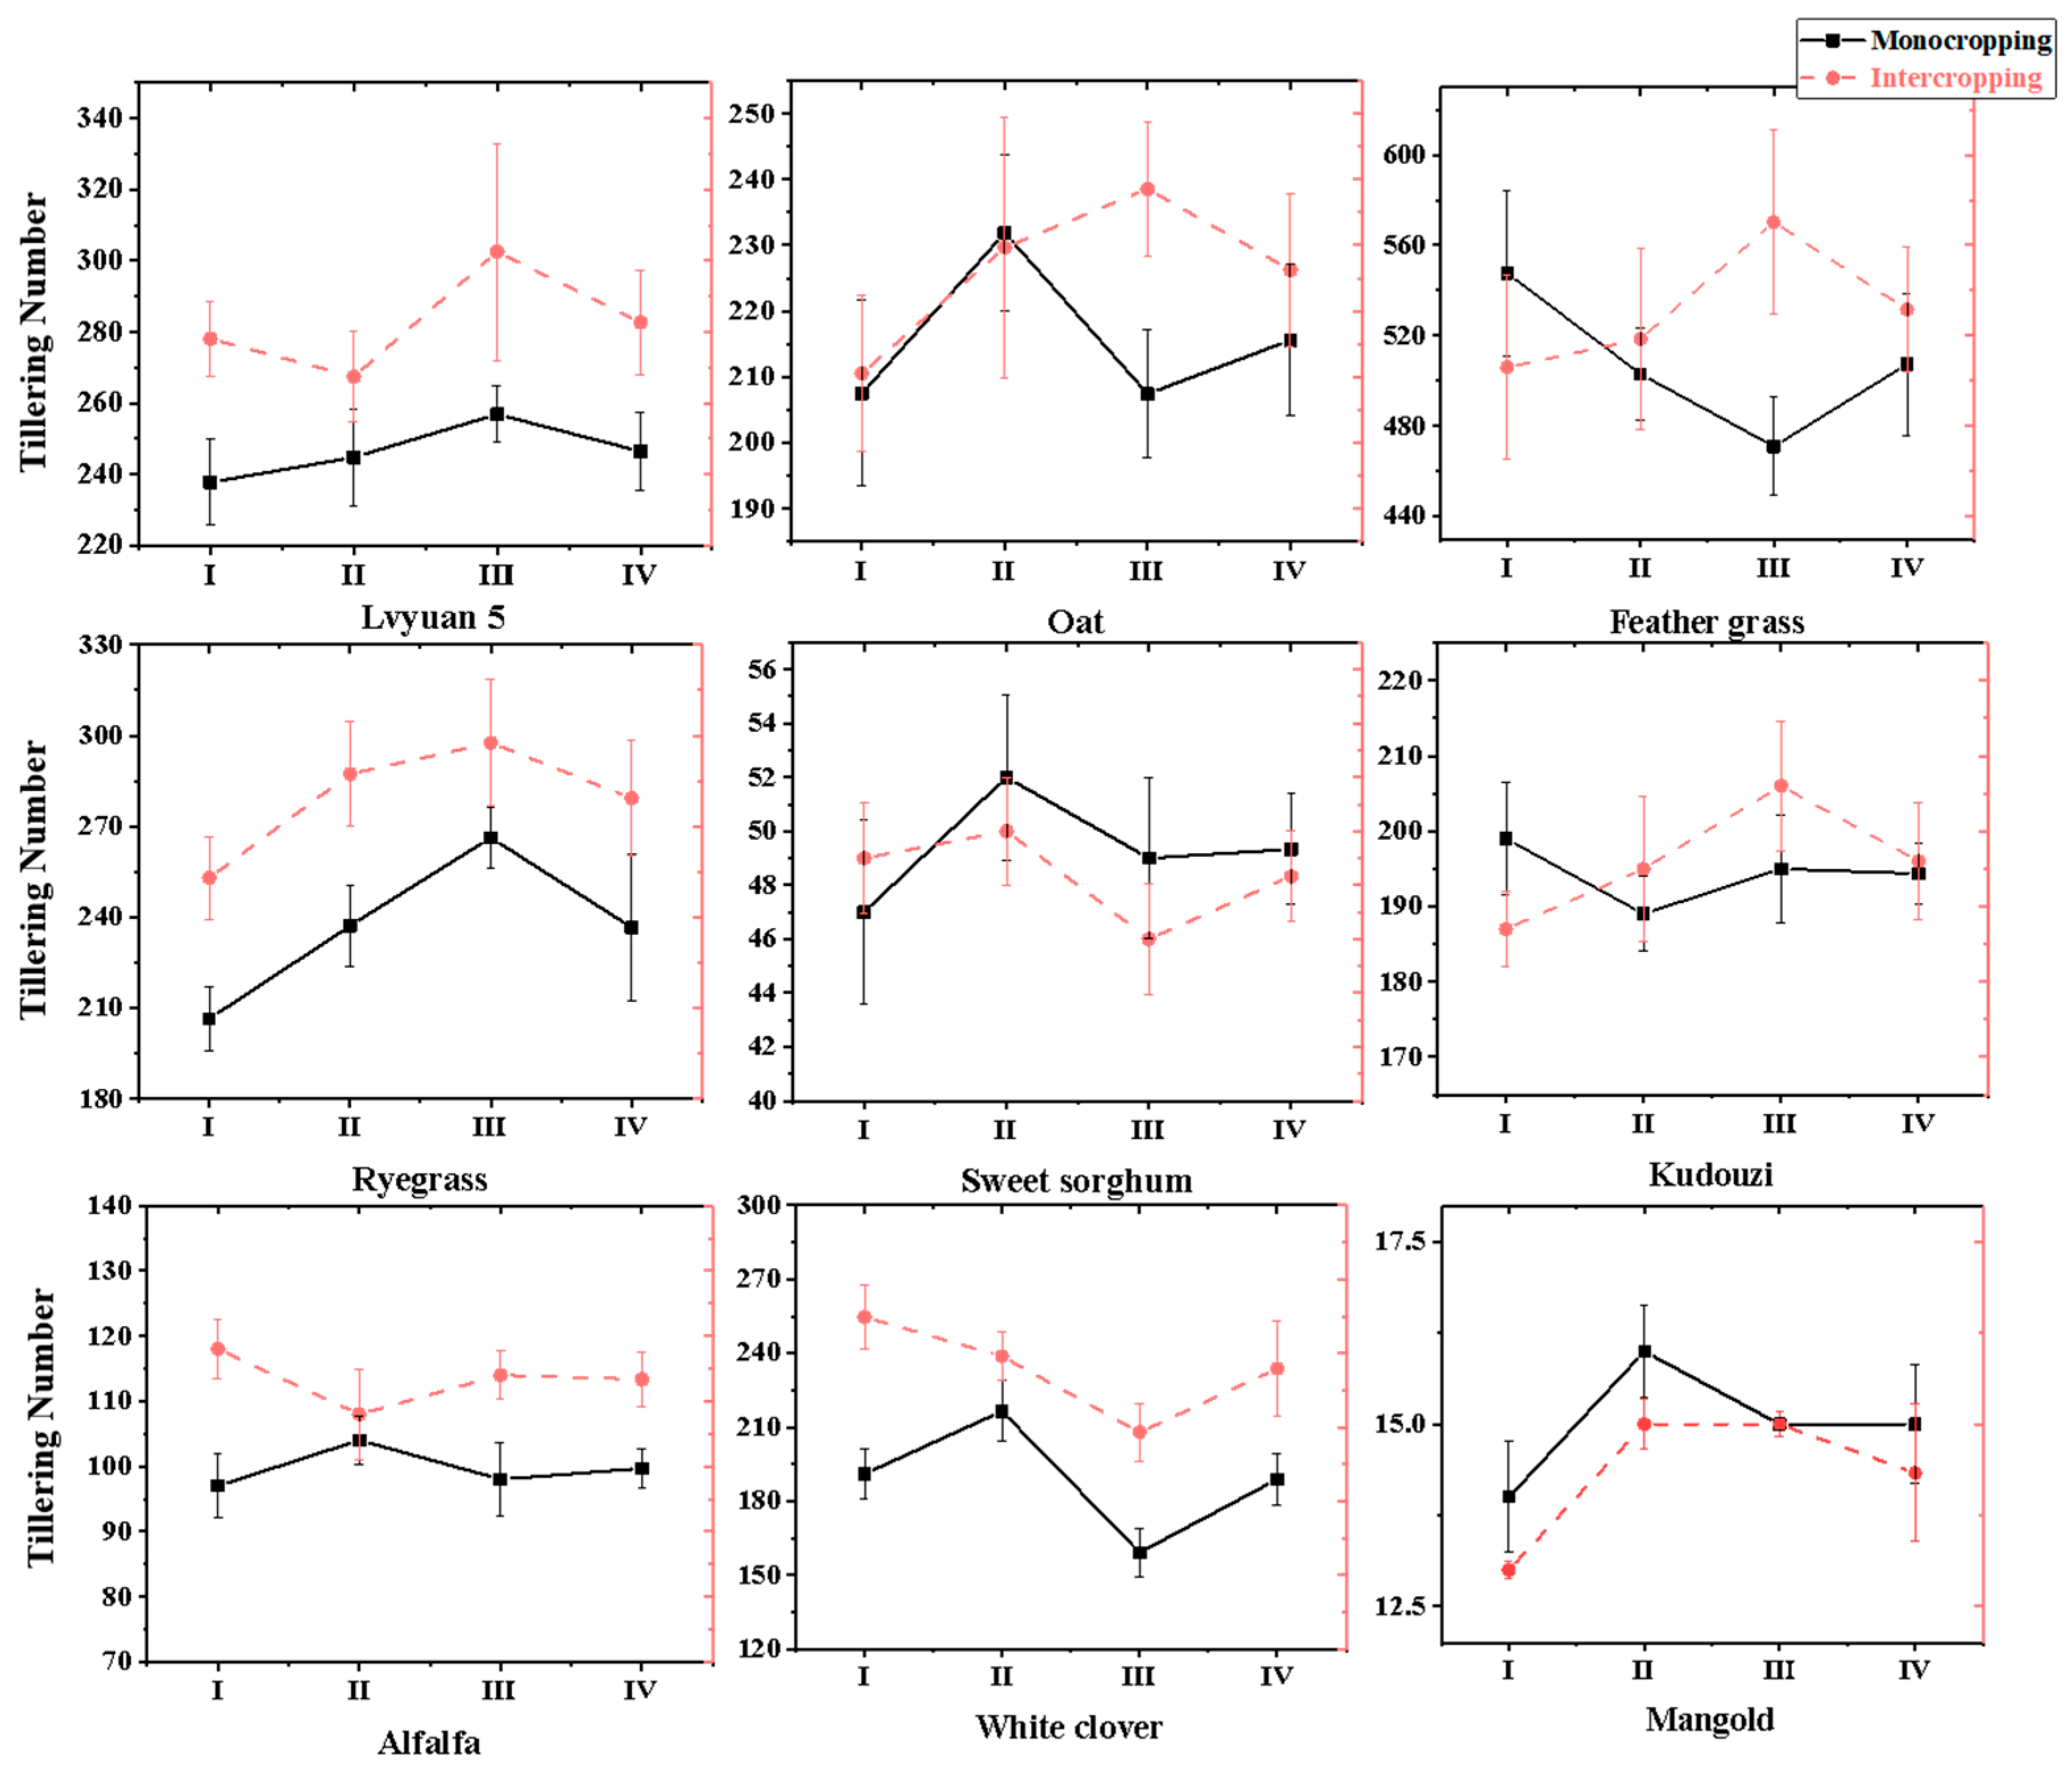
In Figure 2, the planting pattern of nine kinds of forage intercropping was lower than that of intercropping, and the changes were different among different forage types. Under different intercropping patterns, the first order branch/tiller number of forages was inhibited to varying degrees, although the first order branch number of sweet sorghum and mangold was higher than the intercropping level in single cropping, but the change was not significant (p > 0.05). The intercropping of clover, ryegrass, Lvyuan No. 5, and alfalfa could promote the increase in primary branch/tiller number, and the promotion effect was significantly different (p < 0.05), with promotion rates of 23.76%, 18.05%, 14.69%, and 13.71%, respectively. The number of first order branches/tillers increased when wolfberry was interplanted with oat, feather grass, and kudouzi, but there was no significant difference (p > 0.05). The analysis of the results demonstrates that intercropping systems significantly enhance the development of first order branches/tillers in both graminaceous and leguminous species, thereby contributing to increased forage yield. The results provide evidence for the overall enhancement of forage yield by forage first order branches/tillers.

3.1.3. Effects on Leaf/Stem Ratio of Forage

In Figure 3, the leaf-to-stem ratios of nine forage species intercropped with wolfberry were higher than that of intercropping, and the changes were different among different forage species. Under different wolfberry–forage intercropping patterns, the leaf-to-stem ratio of forage was inhibited to different degrees, and the changes were significant (p < 0.05). The inhibition rates of the leaf-to-stem ratio of nine kinds of forage intercropped by wolfberry were as follows: feather grass (42.89%), mangold (42.78%), ryegrass (26.21%), oat (19.40%), sweet sorghum (18.75%), Lvyuan No. 5 (17.80%), clover (13.18%), alopecas (10.95%), and alfalfa (9.09%). In this study, the leaf-to-stem ratio of mangold under intercropping conditions was significantly reduced by 42.78%, indicating a marked increase in the yield of the edible portion. This finding provides strong evidence that the wolfberry–mangold intercropping system effectively enhances mangold productivity.

3.1.4. Effects on Forage Yield and Dry–Fresh Ratio

In Table 1, the dry weight yield per unit area of nine intercropped forages was higher than that of intercropped forages, and the changes were different among different forages. There were significant differences in dry weight yield among different intercropping patterns (p < 0.05). The dry weight of nine kinds of intercropped forage relative to the yield of monocropping was as follows: bitter bean (74.32%), sweet sorghum (69.655%), clover (58.97%), feather grass (46.43%), oat (41.79%), Lvyuan No. 5 (24.77%), alfalfa (20.07%), ryegrass (17.99%), and mangold (9.03%). Considering that intercropping is carried out on the premise of 3 m row spacing and a 2 m walking path of wolfberry, whether the intercropping pattern can promote a yield increase can be scientifically determined by comparing the forage under the two planting modes after equal area conversion, that is, I2 = I1 × 2. Further analysis showed that intercropping kudouzi sativa (48.63%), sweet sorghum (39.29%), and clover (17.94%) had significant yield reductions (p < 0.05). Intercropping feather grass increased the yield by 7.15%, but the increase was not significant (p > 0.05). Intercropping oat, Lvyuan No. 5, alfalfa, ryegrass, and mangold increased significantly (p < 0.05), and the yield increased successively, with increases of 16.41%, 50.46%, 59.87%, 64.00%, and 81.94%, respectively. Consequently, we hypothesize that the 1 m walkways on both sides of the pasture provide sufficient space to support forage growth, and that the intercropping environment established through wolfberry cultivation significantly enhances the yields of oats, Lvyuan No. 5, alfalfa, ryegrass, and mangold.
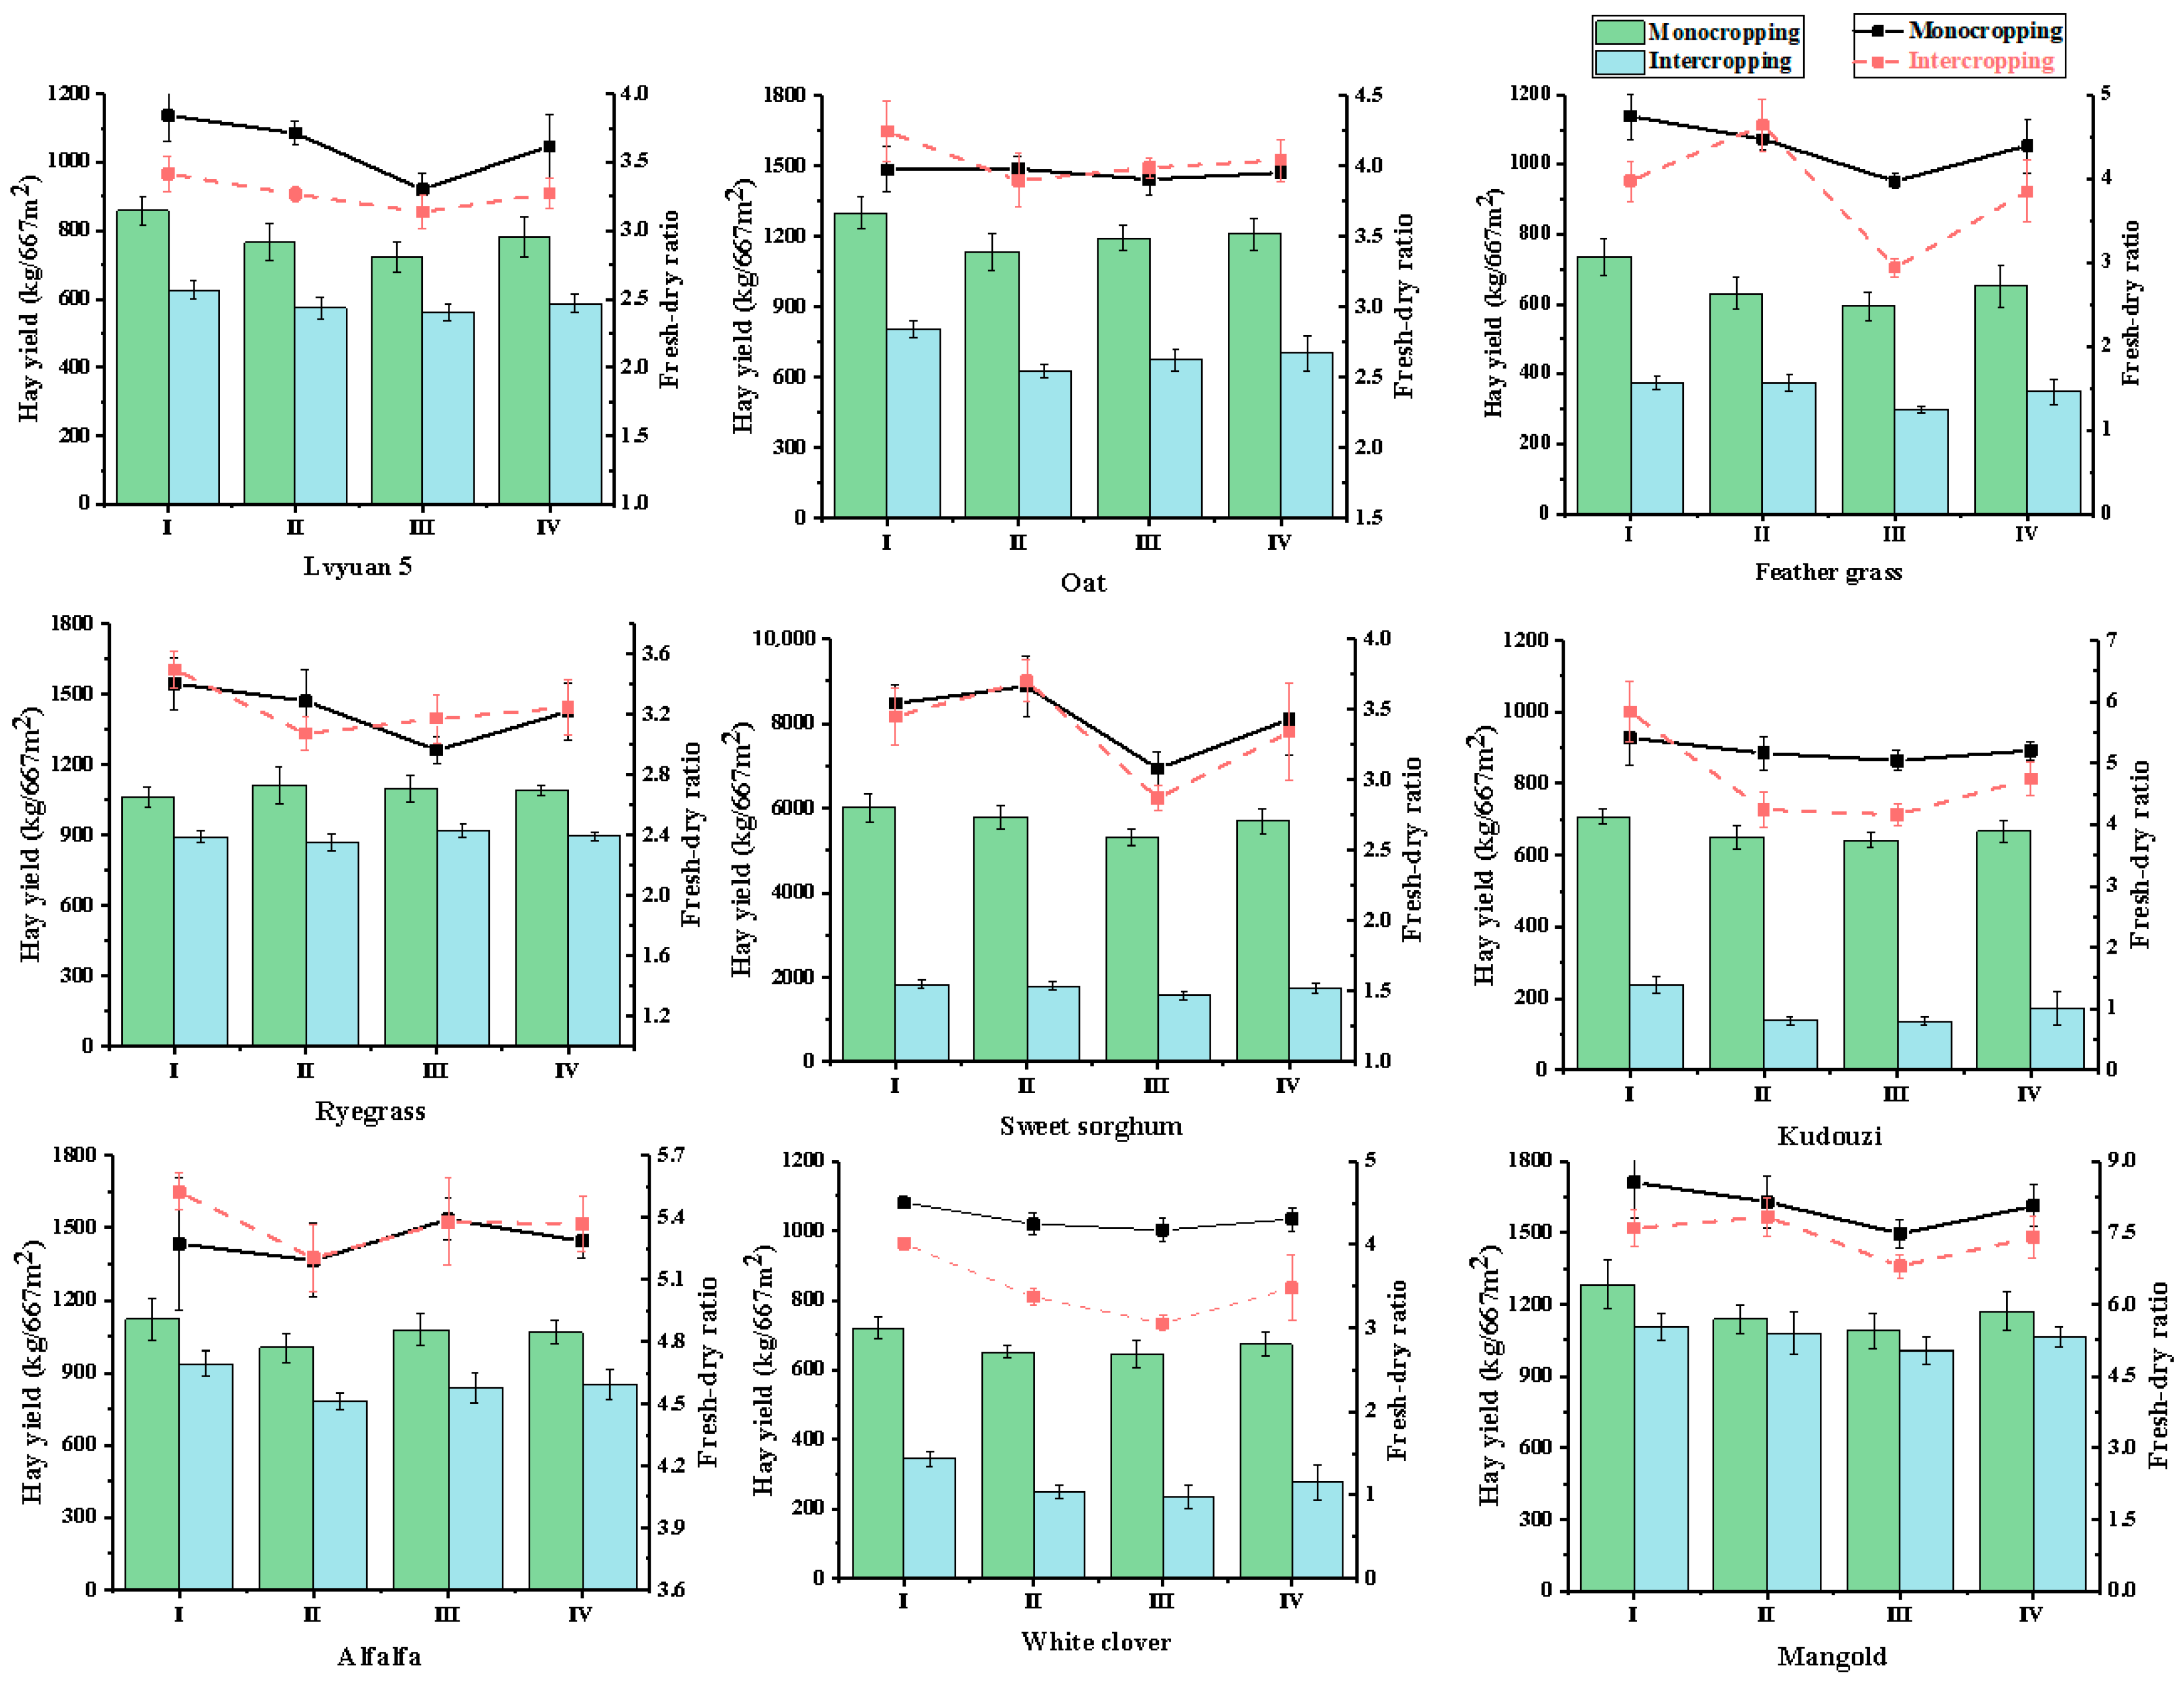
In Figure 4, the fresh–dry ratio showed a downward trend as a whole, that is, the water content of monocropping forage was higher than that of intercropping, and the drying yield was lower. At the intercropping level, the fresh–dry ratio of feather grass (12.39%) and clover (19.24%) decreased significantly (p < 0.05); the fresh–dry ratio of Lvyuan 5 (9.56%), kudouzi (8.80%), mangold (8.09%), and sweet sorghum (2.58%) were not significantly decreased (p > 0.05); and the fresh–dry ratio of oat (2.29%), ryegrass (0.88%), and alfalfa (1.59%) increased slightly, but there was no significant difference.
The forage materials with a higher dry yield under the monocropping mode were sweet sorghum (2850.33 kg/mu), mangold (1170.26 kg/mu), ryegrass (1092.05 kg/mu), and alfalfa (1066.61 kg/mu). The forage materials with a higher dry yield in the intercropping pattern were mangold (1064.61 kg/mu), ryegrass (895.49 kg/mu), sweet sorghum (865.18 kg/mu), and alfalfa (852.58 kg/ mu). Due to the greater height of sweet sorghum relative to wolfberry, it exerts a competitive disadvantage on the latter regarding light interception, making this intercropping combination less favorable. A comprehensive evaluation of long-term agronomic management practices in wolfberry cultivation—such as weeding, fertilization, and root sucker removal—alongside spatial compatibility within intercropping systems, demonstrates that wolfberry achieves optimal performance when intercropped with mangold, ryegrass, and alfalfa.

3.2. Effects of Different Wolfberry–Forage Intercropping Patterns on Forage Photosynthesis

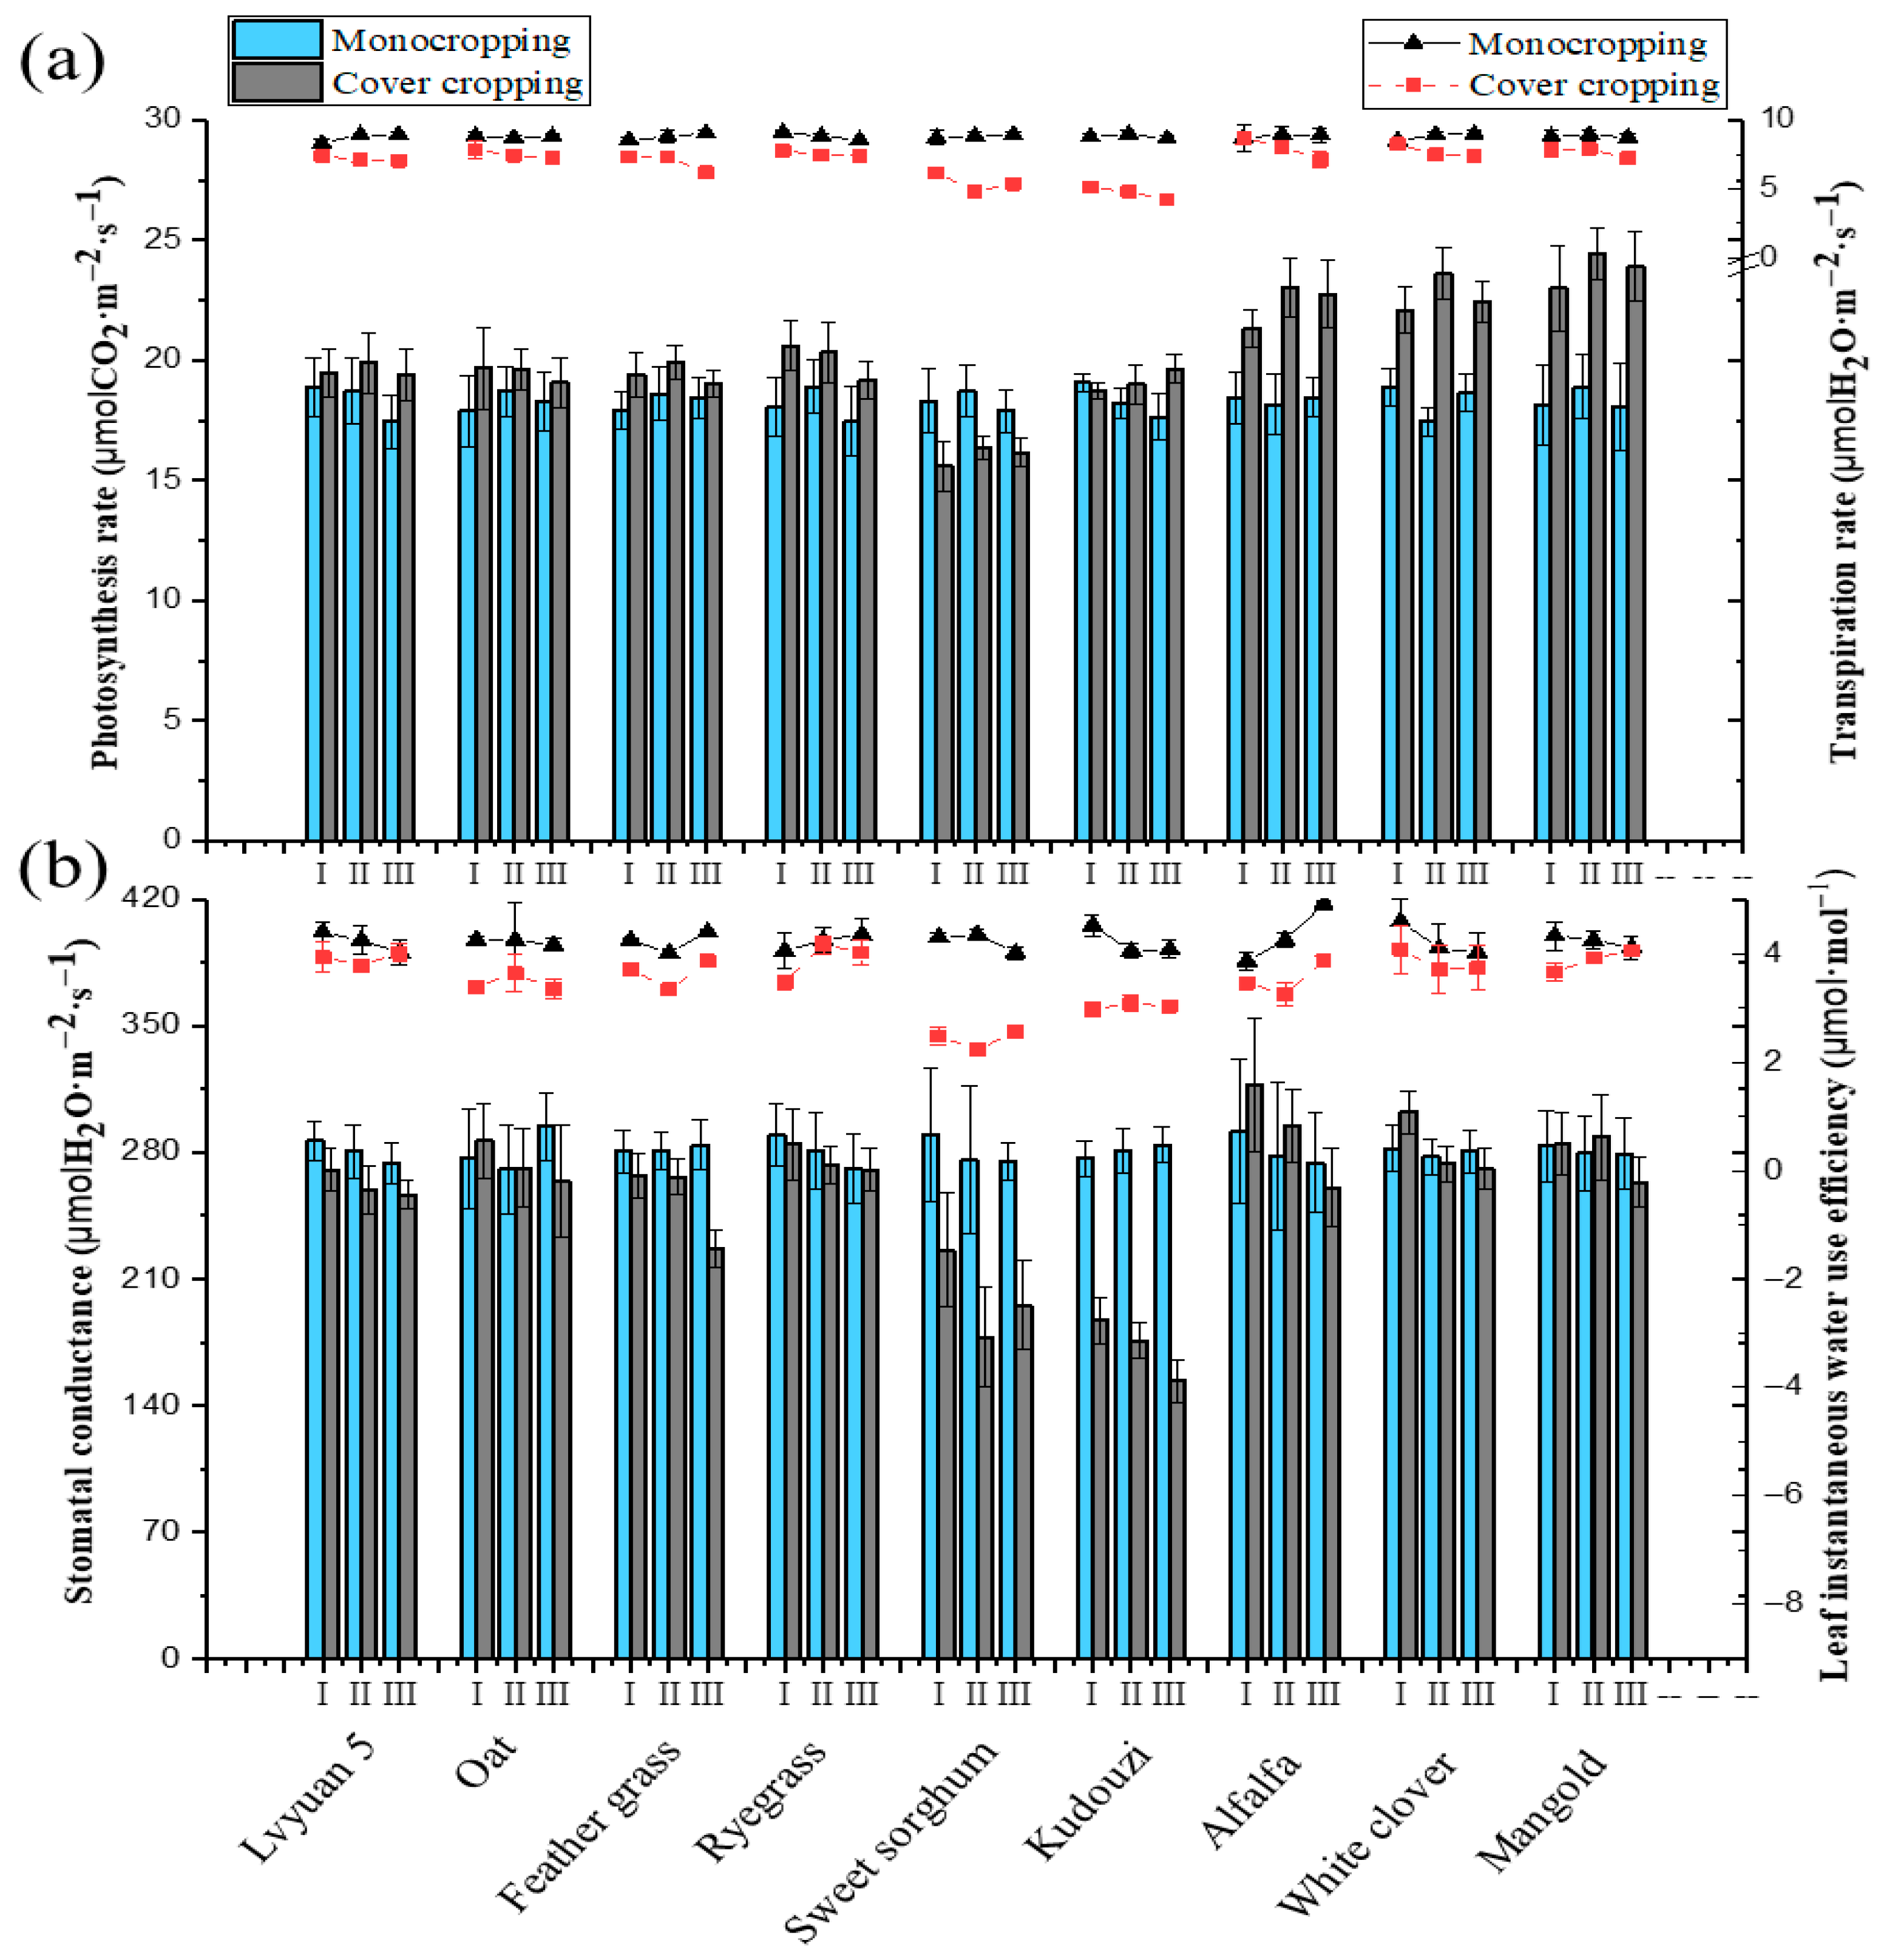
In Figure 5, the net photosynthetic rate (Pn) and stomatal conductivity (Gs) of intercropping showed a downward trend compared with that of monocropping. There was no significant difference in Pn between intercropping and wolfberry compared with monocultures (p > 0.05), except that the Pn between intercropping and wolfberry decreased by 10.87% compared with monocultures (p < 0.05). The Gs of Lvyuan 5 and ryegrass was higher in intercropping than in monocropping and the increase was 0.56% and 2.27%, respectively, with no significant difference (p > 0.05). The Gs intercropping of sweet sorghum, alpicot, alfalfa, and clover decreased by 12.18%, 22.00%, 18.22%, and 15.60% compared with that of single cropping, respectively, and the differences were significant (p < 0.05). The transpiration rate (Tr) of intercropping showed a downward trend compared with that of monocropping. The Tr of sweet sorghum, alfalfa, clover, and mangold intercropping decreased by 14.93%, 17.44%, 15.50%, and 10.30 compared with that of single cropping, respectively (p < 0.05). The changes in leaf instantaneous water use efficiency (WUE) were different under different intercropping patterns. The WUE of sweet sorghum, alfalfa, and clover intercropping patterns was significantly increased, and the growth rates were 64.31%, 25.48%, and 10.24%, respectively (p < 0.05). The WUE of ryegrass intercropping, feather grass intercropping, and wolfberry intercropping decreased by 15.08% and 10.35% (p < 0.05). A comprehensive analysis of photosynthetic characteristics shows that various forage species display consistent response patterns to changes in cultivation systems, although the magnitude of these responses varies among species. By modulating key photosynthetic traits, forage species strengthen their adaptive capacity, thereby reducing the adverse effects of environmental fluctuations on growth and development.

3.3. Physiological Indexes of Forage by Different Wolfberry–Forage Intercropping Patterns

3.3.1. Aboveground Parts of Different Forage Types

In Table 2, there are significant differences among different families (p < 0.05), including legumes (1.93) > gramineae (0.31) > chenopodium (0.06). There was no significant difference in MDA content of the same family under the same planting mode, but the change trend of the MDA content of the same family was basically the same under the two planting modes. Specifically, the increase in MDA content in grass leaves during intercropping was higher than that of monocropping, and the most significant increases were feather grass (133.2%), sweet sorghum (88.1%), and Lvyuan 5 (36.7%) (p < 0.05). Compared with monoculture, the MDA content in leaves of alopecus alfalfa (26.1%) and kudouzi (41.5%) were significantly increased during the intercropping of leguminous forage (p < 0.05). On the contrary, the MDA content of clover leaf during intercropping was decreased by 13.6% compared with that of monoculture, and the difference was significant (p < 0.05). The MDA content in leaves of chenopodium mangold during intercropping was significantly decreased by 57.6% compared with monocropping (p < 0.05).
Superoxide dismutase (SOD), a key enzyme that removes reactive oxygen species and superoxide radicals, is a core indicator of plant responses to environmental stress. Leaf SOD levels vary among forage species under monoculture and intercropping. In gramineous intercropping, SOD content generally decreased compared with monoculture, except in ryegrass, which showed no change. In leguminous intercropping, SOD increased significantly (p < 0.05), except in alfalfa. For chenopodiaceous species, SOD decreased slightly, but not significantly (p > 0.05). Overall, leguminous plants, especially clover, show greater tolerance and adaptability under intercropping.

3.3.2. Underground Parts of Different Forage Types

In Table 2, there was no significant difference in the content of MDA among plants of different families (p > 0.05). There were no significant changes in the contents of grasses and chenopodium in the same family under the same planting pattern except legumes (p < 0.05). Under different planting modes, the root MDA content of grasses increased significantly during intercropping except for grasses (17.86%), but there was no significant change in other grasses (p > 0.05). The change trend of the three legumes was different, among which, intercropping alfalfa significantly increased by 25.1% compared with monocropping (p < 0.05), intercropping alfalfa significantly decreased by 23.6% compared with monocropping (p < 0.05), and clover had no significant change (p > 0.05). The root MDA content of chenopodium mangold in intercropping was slightly decreased compared with that in monocropping, but there was no significant change (p > 0.05).
In Table 2, SOD content in roots was different under different monocropping and intercropping patterns. SOD content in grass and chenopodium intercropping decreased significantly (p < 0.05) to 10.33% and 39.10%, respectively, while SOD content in leguminous intercropping was slightly increased, but there was no significant difference (p > 0.05). A specific analysis showed that ryegrass (11.01%), sweet sorghum (37.59%), and mangold (39.10%) were significantly decreased (p < 0.05); clover (31.16%) was significantly increased (p < 0.05); and there were no significant changes in other materials (p > 0.05). According to the comprehensive analysis, legumes, especially clover, showed strong tolerance and adaptability to the environment.

3.4. Nutrient Indexes of Forage by Different Wolfberry–Forage Intercropping Patterns

In Table 3, the nutrient components of the same forage type under the intercropping pattern are different to different degrees compared with that of single cropping. Under the same cultivation mode, there were significant differences in nutrient components among the 10 forage grasses; the trend of the nutrient composition of plants of the same family under different cultivation modes was basically consistent.
The content of CP in the intercropping of gramineae and piginoides increased by 11.15% and 7.77% compared with that of single cropping, with significant differences (p < 0.05). The most significant increases were in ryegrass (10.71%), oat (9.64%), and feed sugar beet (7.77%). The CP content of legumes decreased by about 2.39%; the difference was significant (p < 0.05) and the decrease was most significant in alfalfa (4.1%) intercropping. The NDF content was decreased by 2.19% and 4.94% in the intercropping of grasses and piginoides compared with that in monoculars, and the overall content was decreased by about 4.9%, 3.8%, and 3.3% in mangold, oat, and sweet sorghum, with significant differences (p < 0.05). The NDF content of legume intercropping (2.1%) showed an increasing trend compared with that of single cropping, and the increase in alfalfa was the most significant, reaching 3.69%, with a significant difference (p < 0.05). The ADF content in gramineae intercropping decreased by 1.45% compared with that in monoculture, and the decrease in ADF content was the most significant in oat and ryegrass, which decreased by 3.73% and 2.98% (p < 0.05). The NDF content of leguminous (2.45%) and chenopodiaceae (0.79%) intercropping showed an increasing trend compared with that of monoculture, and the increase in alfalfa was the most significant, reaching 4.24% (p < 0.05), while there was no significant difference in mangold (p > 0.05). The ash content in grasses and pigweed intercropping was lower than that in monocropping, and the overall content was decreased by 3.27% and 18.08%. The ash content in mangold, ryegrass, and agrostis was the most significantly decreased, decreasing by 18.08%, 10.18%, and 2.99%, and the differences were significant (p < 0.05). The ash content in leguminous (4.38%) intercropping showed an increasing trend compared with that in monocropping, among which clover increased by 7.34% most significantly, followed by alopecus alfalfa (3.61%) and alfalfa (2.2%), with significant differences (p < 0.05). The EE content of gramineous intercropping increased by 5.06% compared with that of single cropping (p < 0.05), and the increase was the most significant in ryegrass (9.54%), feather grass (6.87%), and Lvyuan 5 (5.79%). The EE content of legumes and chenopodiaceae decreased by 3.35% and 57.93% with significant differences (p < 0.05), and the decrease was most significant in the intercropping of alfalfa (6.52%) and mangold (57.93%).
The forage value of 10 forage species was analyzed comprehensively. Under the two cultivation modes, the best performance was with ryegrass (136.36; 141.73), alfalfa (122.59; 115.88), and mangold (118.63; 124.5). The intercropping pattern could increase the relative forage value of grasses and piginoides by 3.1% and 5.0%, and the difference was significant (p < 0.05). The intercropping pattern decreased the feeding value of legumes by 3.01%, and the inhibitory effect on alfalfa was the strongest (5.5%); this difference was significant (p < 0.05). The results provide evidence for the overall enhancement of forage quality using intercropping systems.

3.5. Factors Influencing Growth, Yield, and Quality of Forage

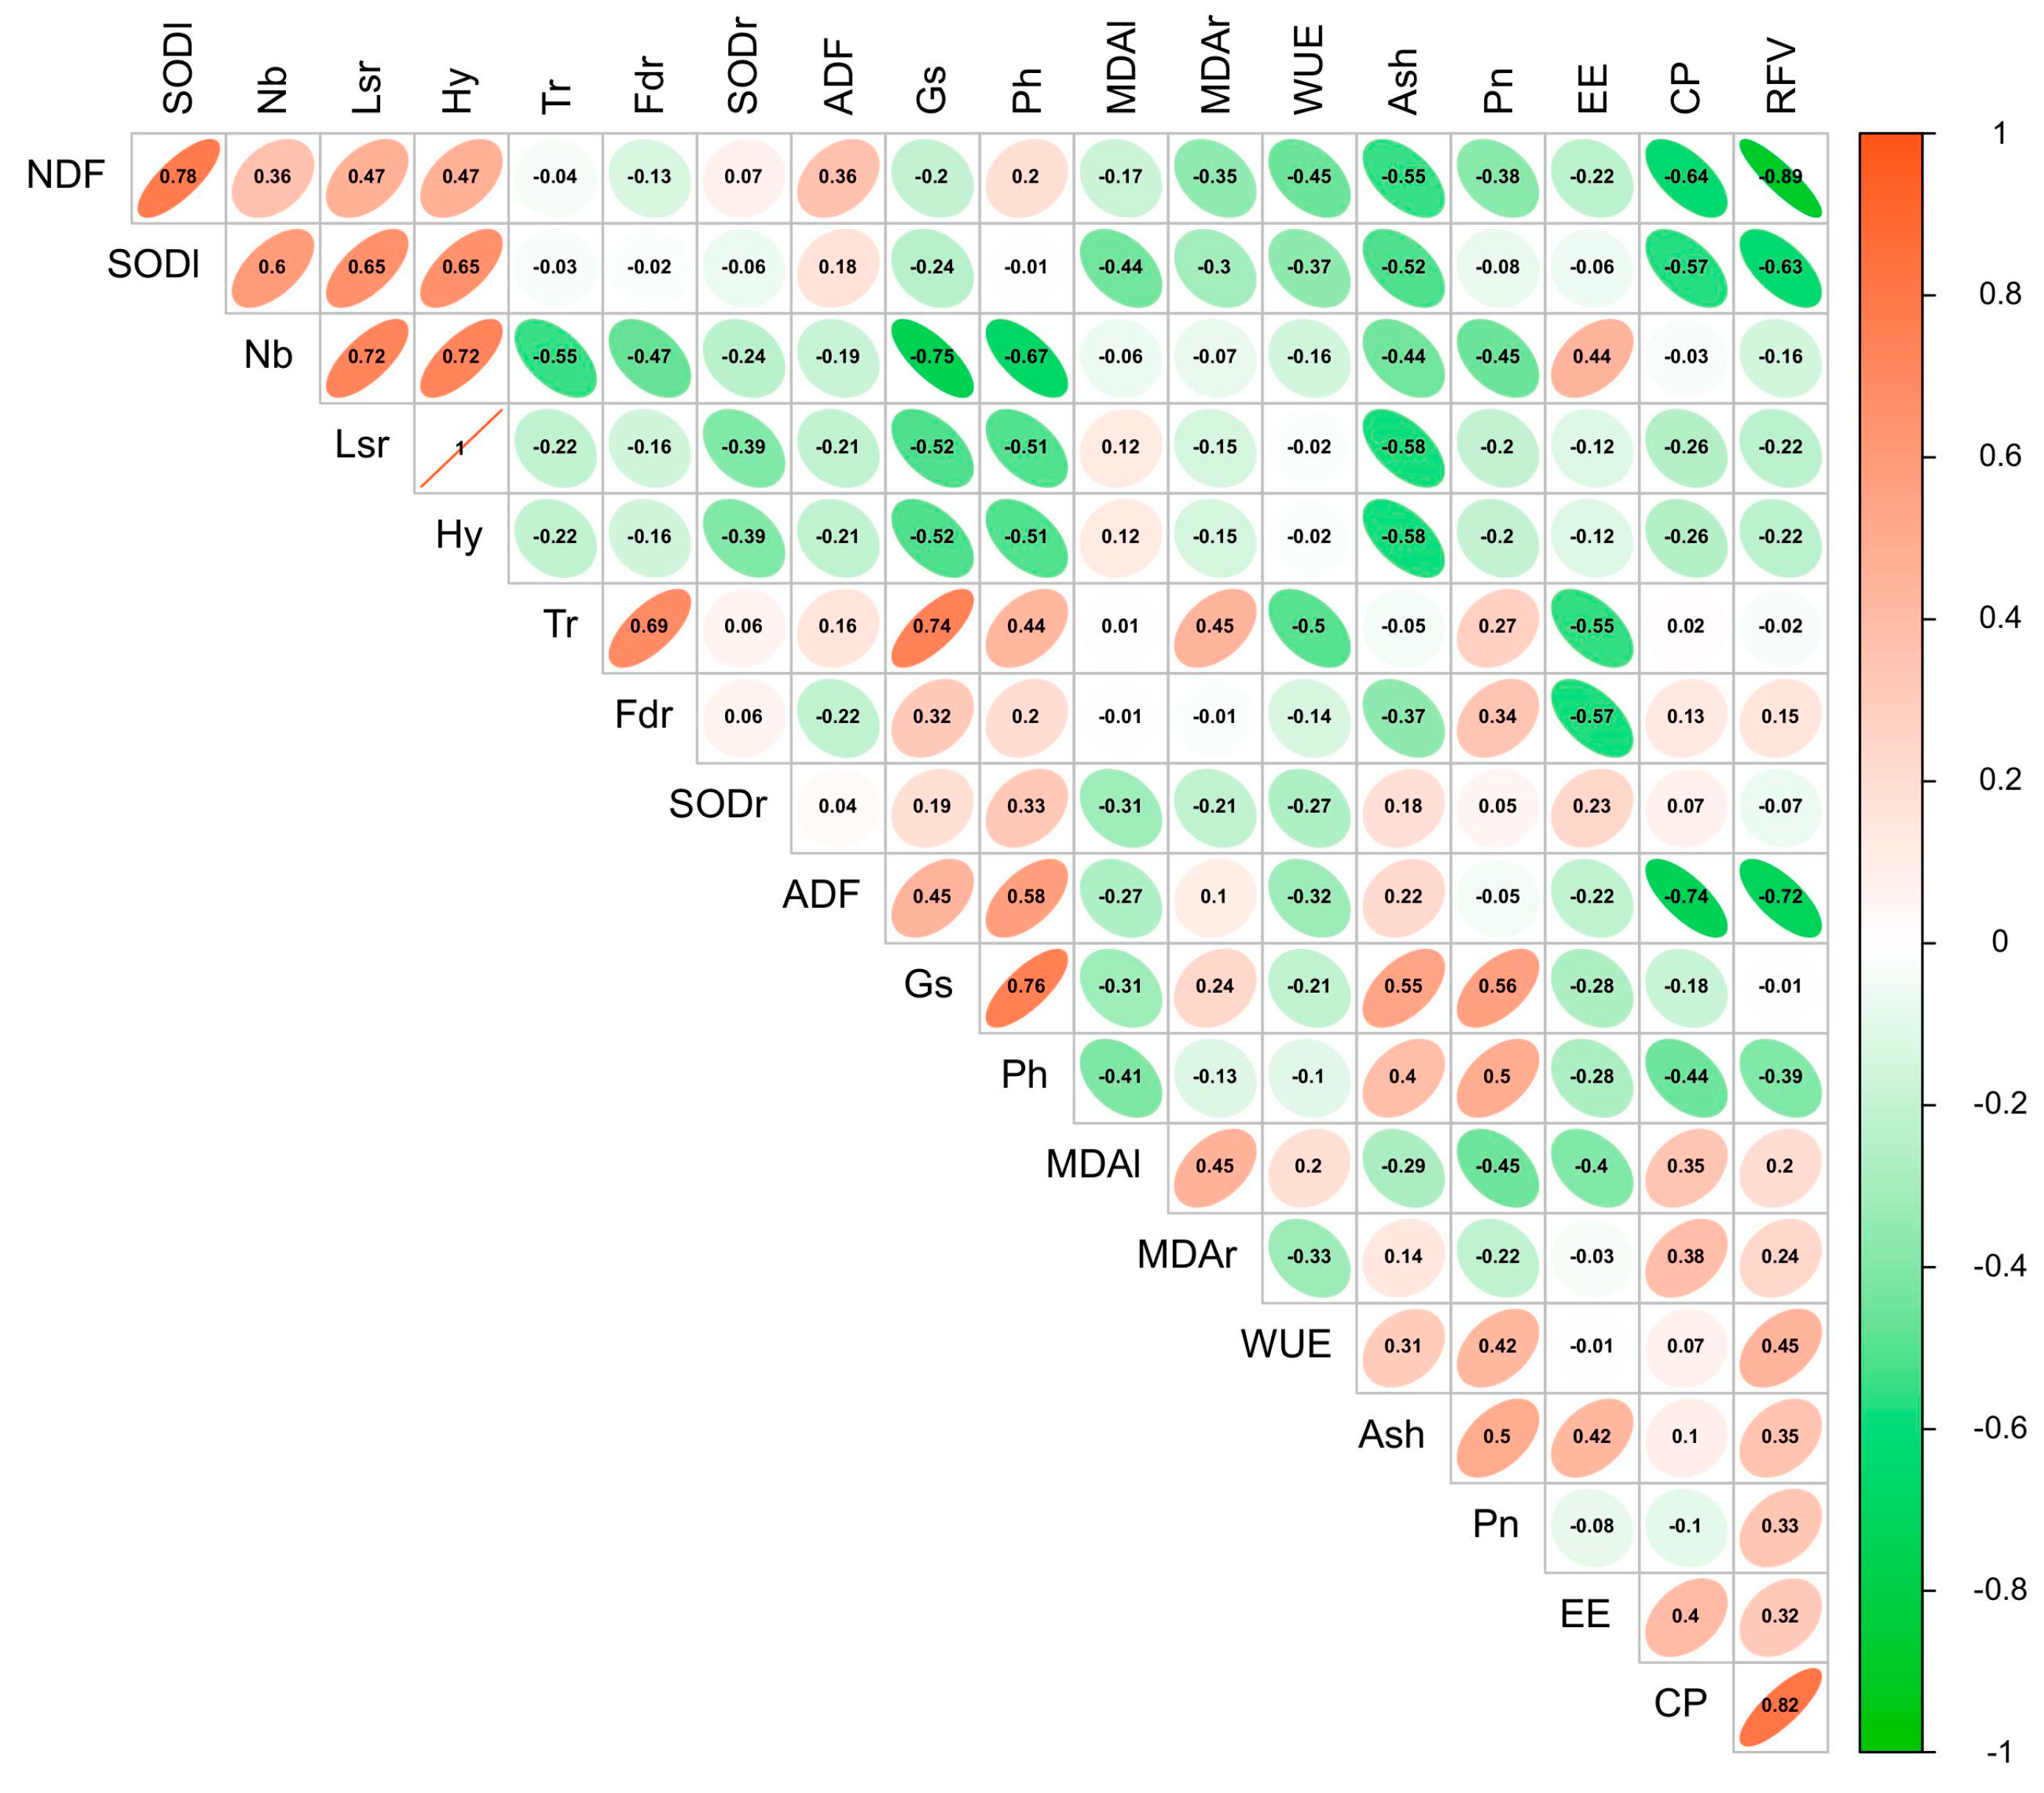
In Figure 6, the net photosynthetic rate was positively correlated with stomatal conductance and leaf instantaneous water use efficiency, and negatively correlated with leaf malondialdehyde and root malondialdehyde (p < 0.05). Stomatal conductance was significantly positively correlated with transpiration rate (p < 0.01) and positively correlated with plant height and ash content (p < 0.05). Leaf instantaneous water use efficiency was negatively correlated with transpiration rate, superoxide dismutase, and neutral detergent fiber (p < 0.05). Transpiration rate was positively correlated with stomatal conductance and fresh–dry ratio (p < 0.01). Hay yield was positively correlated with neutral detergent fiber, leaf superoxide dismutase, branch number, and leaf-to-stem ratio (p < 0.05), and was significantly positively correlated with branch number and leaf-to-stem ratio (p < 0.01). The hay yield was negatively correlated with plant height, ash content, and stomatal conductance (p < 0.05). Crude protein was negatively correlated with acid, neutral detergent fiber, and leaf superoxide dismutase (p < 0.05). Crude fat was negatively correlated with transpiration rate and fresh–dry ratio, and positively correlated with crude ash, crude protein, and relative feeding value (p < 0.05). Crude ash was negatively correlated with neutral detergent fiber, leaf superoxide dismutase, leaf-to-stem ratio, and hay yield, and positively correlated with stomatal conductance and net photosynthetic rate (p < 0.05). The relative feeding value was positively correlated with crude protein, crude fat, net photosynthetic rate, crude ash, leaf instantaneous water use efficiency, root malondialdehyde, and leaf malondialdehyde (p < 0.05), and the relative feeding value was positively correlated with crude protein (p < 0.01). The relative feeding value was negatively correlated with leaf superoxide dismutase, and significantly negatively correlated with neutral detergent fiber and acid detergent fiber (p < 0.01).

4. Discussion

In forest and grass intercropping systems, due to canopy shading, interspecific competition, and other effects, the changes in light intensity, air humidity, soil temperature, water content, and other microclimate environmental factors will inevitably affect the growth of forage grass [26,27]. There are differences in the temporal and spatial ecological niches of forage types in intercropping systems, and differences in forage properties, plant height, canopy structure, root depth, phenological characteristics, and light energy utilization between intercropping systems compared with single cropping, resulting in the full utilization of light, space, water and nutrients [28,29]. A change in forage planting pattern is accompanied by a change in plant physiology, morphology, and other parameters, and eventually leads to a change in plant growth status and biomass, which is the overall response of plants to environmental changes [12,13,27].

4.1. Wolfberry–Forage Intercropping Affects Forage Crops Yield by Regulating Interspecific Competition

There is competition and an interspecific effect between wolfberry and forage, which will affect the growth of forage. It was found that the forage yield per unit area decreased after the intercropping of forage and wolfberry, which was consistent with the research results of Giacomini’s, which showed that the decrease in the seeding ratio of intercropping oat would affect the hay yield of oat [30]. The planting area of intercropped forage was affected by the setting of footpaths in the intercropping pattern. According to the equal area conversion, the yield of mangold, ryegrass, alfalfa, and wolfberry was significantly increased, while the yield of bitter beans, sweet sorghum, and clover was significantly decreased when intercropping. Chen’s study on oat–Vicaria Sativa found that intercropping could promote the growth of oat, which was reflected in the significant increase in plant height, but inhibited the growth of Vicaria sativa [31].
Different forage types showed different adaptability and tolerance when the planting environment changed. MDA content is one of the products of lipid peroxidation in biofilm systems, indicating the degree of damage and the intensity of membrane lipid peroxidation [32,33]. SOD is a protective enzyme, which can maintain the normal growth of plants by inhibiting the lipid peroxidation reaction [34,35]. It is closely related to the response of plants to changes in the external environment [1] and can maintain the reactive oxygen species produced by superoxide dismutase at a low level [36]. These two enzymes cooperate with each other to form a defense peroxidation system, which can effectively resist the changes in the external environment. In this study, the activity trend of key enzymes in grass leaves and roots was different from that of monoculture. Among grasses, the MDA activity was higher in intercropping than in monoculture, while the SOD activity was the opposite. Except for grasses, the other grasses showed greater growth in monoculture than in intercropping, but the difference was not significant, which further indicated that the grasses had stronger adaptability and environmental encroachment in intercropping. The MDA and SOD activities in the leaves and roots of the three legume plants were significantly different under the two cropping modes, and the overall MDA decreased significantly under the intercropping pattern of alfalfa and clover. The SOD activity of clover was significantly increased, while the opposite was true of alfalfa. MDA and SOD activities in mangold exhibited a significant reduction under intercropping conditions.
Under the continuous cultivation of wolfberry, some allelopathic substances secreted by its roots may interact with those secreted by the roots of intercropping forage in soil, and thus have different effects on the regulation of enzyme activities of different forage types [37]. These allelopathic substances may promote the production of excessive peroxides in plants, which exceed the threshold value and lead to a decrease in SOD activity [38]. The excessive accumulation of H2O2 within the organism induces membrane lipid peroxidation, resulting in an ele-vated malondialdehyde (MDA) content [39], which is manifested in the physiological state of gramineous plants during intercropping. It is worth noting that although MDA and SOD showed different changes, the content of each detection was very low, indicating that the intercropping environment had little effect on the interspecific plants compared with other biological and abiotic stresses. Our previously published findings indicate that cover cropping can effectively improve the soil microenvironment, increase microbial diversity, and enhance enzymatic activity, thereby enhancing the stress resistance of wolfberry [12]. These outcomes are consistent with our observations of elevated superoxide dismutase (SOD) activity in wolfberry leaves and altered malondialdehyde (MDA) levels in both roots and leaves under cover cropping systems [1]. Although the physiological responses vary across different intercropped forage species, prior research has demonstrated that intercropping contributes to greater ecological stability, particularly through improvements in soil microbial community structure and enhanced resistance to pests and diseases. Based on these findings, we propose that optimized wolfberry–forage intercropping configurations may strengthen system-level resilience to environmental stress, thereby facilitating the full realization of intercropping benefits. No matter how the physiological mechanism of the plant changes, it is the result of multiple feedback mechanisms [40].

4.2. Wolfberry–Forage Intercropping Stimulates Forage Plant Growth by Enhancing the Overall Light Use Efficiency

Light energy utilization is very important for the yield formation of forage [41]. The occlusion between two species is one of the factors of light environment change in intercropping systems [42]. Studies have shown that light utilization rate (LUE) plays a decisive role in the yield of plants with sufficient environmental factors such as water and fertilizer [43]. LUE is a comprehensive index of plant photosynthetic characteristics, which is the result of the joint action of Pn, Gs, Tr, WUE, and other photosynthetic indexes, and the effect of different indexes differs. In this study, it was found that the performance of Pn was chenopodium > gramineous > leguminous, and the change trend of grass biomass was the same as that of Lin’s study [43]. In the intercropping pattern, Pn and Gs both showed a downward trend, and it was found during the experiment that the leaves of the intercropping forage were thinner than those of the monocropping forage, so the decrease in Pn in the intercropping pattern may be caused by the decrease in the number of chloroplasts in leaves, which is consistent with the research results of Shao on the correlation between the net photosynthetic rate of leaves and chlorophyll content [44]. In the intercropping pattern between wolfberry and forage, in order to not affect the normal growth of wolfberry, the height of forage should be relatively low, resulting in partial light energy intercepted by wolfberry, thus inhibiting Pn and Gs and affecting the photosynthetic efficiency, which is consistent with the results of previous studies [45,46]. There was no significant difference in Tr and WUE based on the intercropping pattern and monoculture mode.
This study systematically depicted the response of wolfberry plants to nine different forage cover crops of three families in an arid region of northwestern China. We found that specific forage species intercropping with wolfberry, especially alfalfa, ryegrass, and mangold, enhanced forage yield by increasing the primary branch or tiller number or the dry matter ratio. Plant growth is driven by cellular expansion and dry matter accumulation, mainly depending on photosynthesis [47]. A higher primary branch or tiller number contributes to an increased total blade area, which contributes to the enhancement of organic biosynthesis and dry matter accumulation [48]. Therefore, a few forage cover crops, including ryegrass and alfalfa, facilitated material provision for yield by increasing the primary branch or tiller number or the dry matter ratio.

4.3. Rational Wolfberry–Forage Intercropping Combinations Contribute to Improved Forage Quality

Besides yield, quality is also a key factor for evaluating the quality of forage. Improving forage quality is one of the important goals of intercropping communities, and crude protein is the most commonly used index to measure forage quality [49]. Intercropping patterns had different effects on different forage types. On the one hand, the value of forage, such as mangold and ryegrass, could be improved by significantly increasing crude protein, crude fat, and crude ash, and reducing neutral and acidic washing fiber. On the other hand, it can also reduce the feeding value of other forages, such as sweet sorghum and alopecas. The crude protein content of intercropped broccoli is significantly lower than that of broccoli from single cropping [50]. The nutrients of forage are mainly accumulated in the leaves, and a higher leaf-to-stem ratio can increase the nutrient content and palatability of forage, and then affect the contents of NDF and ADF in forage [51]. Our results showed that the leaf-to-stem ratio, leaf specific gravity, and NDF content of nine forage species all decreased under the intercropping pattern, which increased the feeding value of the forage. In addition, compared with monocultures, intercropping significantly improved the quality of chenopodium and gramineae, but decreased the quality of legumes, which was consistent with the results from [52]. Additionally, this result was produced by affecting CP, EE, and ash. These results indicated that intercropping was beneficial to the improvement of the feeding value of chenopodium and gramineae, but not conducive to the improvement of the feeding value of legumes. Mangold, ryegrass, and alfalfa showed the best performance according to the comprehensive analysis of the feeding value of nine forage grasses.

5. Conclusions

This study underscores the importance of selecting appropriate wolfberry–forage intercropping combinations for sustainable forage production, with a particular emphasis on plant growth, yield, and forage quality. The results demonstrate that intercropping specific forage species—mangold, ryegrass, alfalfa, and white clover—with wolfberry significantly enhances forage productivity and quality while improving overall light use efficiency. Enhancing the interspecific competitive advantage of the intercropping system is critical for promoting forage growth and ensuring yield stability under interspecific competition with cover crops. Overall, forage intercropping improves both nutritional value and forage quality by modulating the metabolite composition linked to superoxide dismutase activity in leaves and roots. Based on a comprehensive evaluation of forage performance, four species—mangold, ryegrass, alfalfa, and white clover—were identified as optimal cover crops. Integrating these species into wolfberry orchards managed under traditional clean tillage practices can effectively enhance forage biomass and quality. These findings hold significant implications for fodder supply within the health-oriented market and contribute meaningfully to the enhancement of ecosystem services.

Author Contributions

R.L.: Writing—original draft. L.Z.: Writing—review, editing, and software. G.Q.: Writing—review and editing, Data curation. X.N.: Resources, Supervision, Project administration. F.W.: Methodology. Y.W.: Investigation. Z.Y.: Project administration. R.Q.: Supervision. H.W.: Investigation. Y.L.: Formal analysis. X.G.: Validation, Software. All authors have read and agreed to the published version of the manuscript.

Funding

The Natural Science Foundation of Ningxia (2024AAC03768, 2024AAC03769, and 2025AAC030554), the National Natural Science Foundation of China (Grant No. 42561010), and the Key Research and Development of Ningxia (Talent special) (2024BEH04070).

Data Availability Statement

All the data can be obtained by contacting the author.

Acknowledgments

This research is supported by the Natural Science Foundation of Ningxia, the National Natural Science Foundation of China, and the Key Research and Development of Ningxia (Talent special).

Conflicts of Interest

The authors declare no conflicts of interest.

References

  1. Wang, F.; Zhu, L.; He, J.; Nan, X.; Chen, H.; Yang, L.; Jia, Q.; Yu, Z.; Wang, H.; Zhao, Y.; et al. Selecting appropriate forage cover crops to improve growth, yield, and fruit quality of wolfberry by regulation of photosynthesis and biotic stress resistance. Sci. Hortic. 2024, 337, 113470. [Google Scholar] [CrossRef]
  2. Crotty, F.V.; Stoate, C. The legacy of cover crops on the soil habitat and ecosystem services in a heavy clay, minimum tillage rotation. Food Energy Secur. 2019, 8, e00169. [Google Scholar] [CrossRef]
  3. Hamzei, J.; Seyyedi, M. Energy use and input–output costs for sunflower production in sole and intercropping with soybean under different tillage systems. Soil Tillage Res. 2016, 157, 73–82. [Google Scholar] [CrossRef]
  4. Hada, T.S.; Meena, L.K.; Pandey, P.P. Intercropping of mango and legumes for forage production: A review. Indian J. Agric. Allied Sci. 2021, 7, 3. [Google Scholar]
  5. Zhang, W.; Liu, G.; Sun, J.; Fornara, D.; Zhang, L.; Zhang, F.; Li, L. Temporal dynamics of nutrient uptake by neighboring plant species: Evidence from intercropping. Funct. Ecol. 2016, 31, 469–479. [Google Scholar] [CrossRef]
  6. Ali, A.; Mattsson, E. Individual tree size inequality enhances aboveground biomass in homegarden agroforestry systems in the dry zone of Sri Lanka. Sci. Total Environ. 2017, 575, 6–11. [Google Scholar] [CrossRef]
  7. Afrin, S.; Latif, A.; Banu, N.M.A.; Kabir, M.M.M.; Haque, S.S.; Ahmed, M.M.E.; Tonu, N.N.; Ali, M.P. Intercropping Empower Reduces Insect Pests and Increases Biodiversity in Agro-Ecosystem. Agric. Sci. 2017, 8, 1120–1134. [Google Scholar] [CrossRef]
  8. Knörzer, H.; Graeff-Hönninger, S.; Guo, B.; Wang, P.; Claupein, W. The Rediscovery of Intercropping in China: A Traditional Cropping System for Future Chinese Agriculture—A Review; Springer Nature: London, UK, 2009. [Google Scholar]
  9. Lv, Y.; Francis, C.; Wu, P.; Chen, X.; Zhao, X. Maize–Soybean Intercropping Interactions Above and Below Ground. Crop Sci. 2014, 54, 914–922. [Google Scholar] [CrossRef]
  10. Qin, D.Z.; Cui, W.F.; Chen, J.; Liu, J.; Qin, L.; Wang, L.P.; Zhao, Y.L.; Wang, L.H. Marginal effect of dry matter accumulation and nitrogen and phosphorus uptake and utilization in maize and soybean intercropping. Southwest China J. Agric. Sci. 2024, 37, 552–560. [Google Scholar]
  11. Gao, Y.; Duan, A.; Sun, J.; Li, F.; Liu, Z.; Liu, H.; Liu, Z. Crop coefficient and water use efficiency of winter wheat/spring maize strip intercropping. Field Crops Res. 2009, 111, 65–73. [Google Scholar] [CrossRef]
  12. Zhu, L.; He, J.; Tian, Y.; Li, X.; Li, Y.; Wang, F.; Qin, K.; Wang, J. Intercropping Wolfberry with Gramineae plants improves productivity and soil quality. Sci. Hortic. 2022, 292, 110632. [Google Scholar] [CrossRef]
  13. Zhu, L.; Li, X.; He, J.; Zhou, X.; Wang, F.; Zhao, Y.; Liang, X.; Nan, X.; Li, Y.; Qin, K. Development of wolfberry–Forage Intercropping Patterns. Agronomy 2023, 13, 1365. [Google Scholar] [CrossRef]
  14. Liu, H.; Zeng, Z.; Jiao, L.; Jiao, L.; Hu, Y.; Wang, Y.; LI, H. Intercropping of Different Silage Maize Cultivars and Alfalfa. Acta Agron. Sin. 2006, 32, 125–130. [Google Scholar]
  15. Zhu, J.; van der Werf, W.; Anten, N.P.R.; Vos, J.; Evers, J.B. The contribution of phenotypic plasticity to complementary light capture in plant mixtures. New Phytol. 2015, 207, 1213–1222. [Google Scholar] [CrossRef] [PubMed]
  16. Gong, X.; Liu, C.; Li, J.; Luo, Y.; Yang, Q.; Zhang, W.; Yang, P.; Feng, B. Responses of rhizosphere soil properties, enzyme activities and microbial diversity to intercropping patterns on the Loess Plateau of China—ScienceDirect. Soil Tillage Res. 2019, 195, 104355. [Google Scholar] [CrossRef]
  17. Liu, G.; Zeng, F.; Lei, J.; Lu, Y.; Guan, J. The Distribution and Growth Dynamics of Roots in Walnut-Alfalfa Intercropping Systems. Arid. Zone Res. 2015, 32, 504–508. [Google Scholar]
  18. Wang, P.; Wang, Y.; Wu, Q.S. Effects of soil tillage and planting grass on arbuscular mycorrhizal fungal propagules and soil properties in citrus orchards in southeast China. Soil Tillage Res. 2016, 155, 54–61. [Google Scholar] [CrossRef]
  19. Liu, C.; Hu, T.; Li, Q.; Li, R.; Xie, C.; Wu, X. Investigation into the Photosynthetic Physiological and Ecological Adaptability of forage in Giant Eucalyptus Forest Intercropping Systems. Acta Prataculturae Sin. 2008, 17, 8. [Google Scholar]
  20. Wang, G.; Bei, S.; Li, J.; Bao, X.; Zhang, J.; Schultz, P.A.; Li, H.; Li, L.; Zhang, F.; Bever, J.D.; et al. Soil microbial legacy drives crop diversity advantage: Linking ecological plant–soil feedback with agricultural intercropping. J. Appl. Ecol. 2021, 58, 496–506. [Google Scholar] [CrossRef]
  21. Kong, C.-H.; Zhang, S.-Z.; Li, Y.-H.; Xia, Z.-C.; Yang, X.-F.; Meiners, S.J.; Wang, P. Plant neighbor detection and allelochemical response are driven by root-secreted signaling chemicals. Nat. Commun. 2018, 9, 3867. [Google Scholar] [CrossRef]
  22. Li, J.; Xu, B.; Yang, X.; Jin, Y.; Gao, T.; Yu, H.; Ma, H.; Qin, Z.; Zhao, L. Temporal and spatial variations of grassland desertification in Lingwu and Yanchi of Ningxia, China. In Proceedings of the 2013 Second International Conference on Agro-Geoinformatics (Agro-Geoinformatics), Fairfax, VA, USA, 12–16 August 2013; IEEE: Piscataway, NJ, USA, 2013. [Google Scholar]
  23. Pei, B.; Zhang, G.C.; Zhang, S.Y. Effects of soil drought stress on photosynthesis and antioxidant enzyme activities of sea Buckthorn leaves. Acta Ecol. Sin. 2013, 33, 11. [Google Scholar]
  24. Yang, Q.; Guo, S.H. Plant Physiology and Biochemistry Experiment Course; China Agricultural Science and Technology Press: Beijing, China, 2010. [Google Scholar]
  25. Sun, Q.; Hu, J.J. Research Techniques in Plant Physiology; Northwest A&F University Press: Yangling, China, 2006. [Google Scholar]
  26. Ahmad, S.; Khan, P.A.; Verma, D.K.; Mir, N.H.; Sharma, A.; Wani, S.A. Forage production and orchard floor management through grass/legume intercropping in apple based agroforestry systems. Int. J. Chem. Stud. 2018, 6, 953–958. [Google Scholar]
  27. Gao, L.; Xu, H.; Bi, H.; Xi, W.; Bao, B.; Wang, X.; Bi, C.; Chang, Y. Intercropping Competition between Apple Trees and Crops in Agroforestry Systems on the Loess Plateau of China. PLoS ONE 2013, 8, e70739. [Google Scholar] [CrossRef] [PubMed]
  28. Li, Y.; Feng, J.; Zheng, L.; Huang, J.; Yang, Y.; Li, X. Intercropping with marigold promotes soil health and microbial structure to assist in mitigating tobacco bacterial wilt. J. Plant Pathol. 2020, 102, 731–742. [Google Scholar] [CrossRef]
  29. Waha, K.; Dietrich, J.P.; Portmann, F.T.; Siebert, S.; Thornton, P.K.; Bondeau, A.; Herrero, M. Multiple cropping systems of the world and the potential for increasing cropping intensity. Glob. Environ. Chang. 2020, 64, 102131. [Google Scholar] [CrossRef]
  30. Giacomini, S.J.; Aita, C.; Vendruscolo, E. Dry matter, C/N ratio and nitrogen, phosphorus and potassium accumulation in mixed soil cover crops in Southern Brazil. Rev. Bras. De Ciência Solo 2003, 27, 325–334. [Google Scholar] [CrossRef]
  31. Chen, G.; Guo, L.; Ren, C.; Guo, L.; Zhao, G.; Hu, Y.; Zeng, Z. Effects of row spacing and intercropping on yield and quality of hay of Vicia sativa and Oat green. Acta Agron. Sin. 2011, 37, 2066–2074. [Google Scholar] [CrossRef]
  32. Yadeghari, L.Z.; Heidari, R.; Carapetian, J. The Influence of Cold Acclimation on Proline, Malondialdehyde (MDA), Total Protein and Pigments Contents in Soybean (Glycine max) Seedlings. J. Biol. Sci. 2007, 7, 1436–1441. [Google Scholar] [CrossRef]
  33. Bailly, C.; Benamar, A.; Corbineau, F.; Come, D. Changes in malondialdehyde content and in superoxide dismutase, catalase and glutathione reductase activities in sunflower seeds as related to deterioration during accelerated aging. Physiol. Plant. 2010, 97, 104–110. [Google Scholar] [CrossRef]
  34. McKersie, B.D.; Chen, Y.; de Beus, M.; Bowley, S.R.; Bowler, C.; Inze, D.; D’Halluin, K.; Botterman, J. Superoxide dismutase enhances tolerance of freezing stress in transgenic alfalfa (Medicago sativa L.). Plant Physiol. 1993, 103, 1155–1163. [Google Scholar] [CrossRef] [PubMed]
  35. Rubio, M.C.; González, E.M.; Minchin, F.R.; Webb, K.J.; Arrese-Igor, C.; Ramos, J.; Becana, M. Effects of water stress on antioxidant enzymes of leaves and nodules of transgenic alfalfa overexpressing superoxide dismutases. Physiol. Plant. 2010, 115, 531–540. [Google Scholar] [CrossRef]
  36. Xu, Z.; Mi, W.; Mi, N.; Fan, X.; Zhou, Y.; Tian, Y. Comprehensive evaluation of soil quality in a desert steppe influenced by industrial activities in northern China. Sci. Rep. 2021, 11, 17493. [Google Scholar] [CrossRef]
  37. Huang, W.; Gfeller, V.; Erb, M. Root volatiles in plant-plant interactions II: Root terpenes from Centaurea stoebe modify Taraxacum officinale root chemistry and root herbivore growth. Cold Spring Harb. Lab. 2018, 42, 1964–1973. [Google Scholar]
  38. Huang, X.; Li, Y.; Yi, Q.; Ding, W. The Impact of Five Chemosensitive Compounds on the Enzymatic Activity of Ginseng Roots. Chin. Herbs 2010, 5, 117–121. [Google Scholar]
  39. Duan, Y.; Liu, X.; Wu, J.; Zhou, W.; Guo, X.; You, J.; Tang, T.; Wang, F.; Guo, J. The Impact of Intercropping Patterns on the Physiological Growth Characteristics and Rhizosphere Soil Physicochemical Properties of Coptis chinensis. J. Ecol. 2020, 39, 10. [Google Scholar]
  40. Nobel, P.S. Physicochemical and Environmental Plant Physiology; Academic Press, Inc.: Cambridge, MA, USA, 1991. [Google Scholar]
  41. Isselstein, J.; Komainda, M.; Muto, P. Interaction of multispecies sward composition and harvesting management on forage yield and quality from establishment phase to the subsequent crop. Grass Forage Sci. 2022, 77, 89–99. [Google Scholar]
  42. Li, H.; Jiang, D.; Wollenweber, B.; Dai, T.; Cao, W. Effects of shading on morphology, physiology and grain yield of winter wheat. Eur. J. Agron. 2010, 33, 267–275. [Google Scholar] [CrossRef]
  43. Lin, F.; Liu, X.; Tong, C.; Wu, Y. The Impact of Intercropping on Light Energy Utilization Efficiency and Productivity of Various Forage Crops. J. Appl. Ecol. 2019, 30, 11. [Google Scholar]
  44. Shao, Q.; Wang, H.; Guo, H.; Zhou, A.; Huang, Y.; Sun, Y.; Li, M. Effects of Shade Treatments on Photosynthetic Characteristics, Chloroplast Ultrastructure, and Physiology of Anoectochilus roxburghii. PLoS ONE 2014, 9, e85996. [Google Scholar] [CrossRef]
  45. Liu, X.; Rahman, T.; Song, C.; Su, B.; Yang, F.; Yong, T.; Wu, Y.; Zhang, C.; Yang, W. Changes in light environment, morphology, growth and yield of soybean in maize-soybean intercropping systems. Field Crops Res. 2017, 200, 38–46. [Google Scholar] [CrossRef]
  46. Wang, Z.; Zhao, X.; Wu, P.; Gao, Y.; Yang, Q.; Shen, Y. Border row effects on light interception in wheat/maize strip intercropping systems. Field Crops Res. 2017, 214, 1–13. [Google Scholar] [CrossRef]
  47. Charbonnier, F.; le Maire, G.; Dreyer, E.; Casanoves, F.; Christina, M.; Dauzat, J.; Eitel, J.U.H.; Vaast, P.; Vierling, L.A.; Roupsard, O. Competition for light in heterogeneous canopies: Application of MAESTRA to a coffee (Coffea arabica L.) agroforestry system. AGR For. Meteorol 2013, 181, 152–169. [Google Scholar] [CrossRef]
  48. Zhao, F.; Yang, X.; Schull, M.A.; Román-Colón, M.O.; Yao, T.; Wang, Z.; Zhang, Q.; Jupp, D.L.; Lovell, J.L.; Culvenor, D.S.; et al. Measuring effective leaf area index, foliage profile, and stand height in New England forest stands using a full-waveform ground-based lidar. Remote. Sens. Environ. 2011, 115, 2954–2964. [Google Scholar] [CrossRef]
  49. Riday, H.; Brummer, E.C.; Moore, K.J. Heterosis of Forage Quality in Alfalfa. Crop. Sci. 2002, 42, 1088–1093. [Google Scholar] [CrossRef]
  50. Jiang, Z.; Chen, F.; Wang, D.; Wei, Z.; Tang, C. Effects of broccoli and oat intercropping on yield and quality of forage. Chin. J. Grassl. 2020, 42, 127–135. [Google Scholar]
  51. Wu, Y.; Zhang, W.; Chen, M.; Wu, D. Production performance of different varieties of oat in Yangzhou area. Pratacultural Sci. 2018, 35, 6. [Google Scholar]
  52. Zhao, Y.; Liu, X.; Tong, C.; Wu, Y. Effect of root interaction on nodulation and nitrogen fixation ability of alfalfa in the simulated alfalfa/triticale intercropping in pots. Sci. Rep. 2020, 10, 1008–1010. [Google Scholar] [CrossRef] [PubMed]
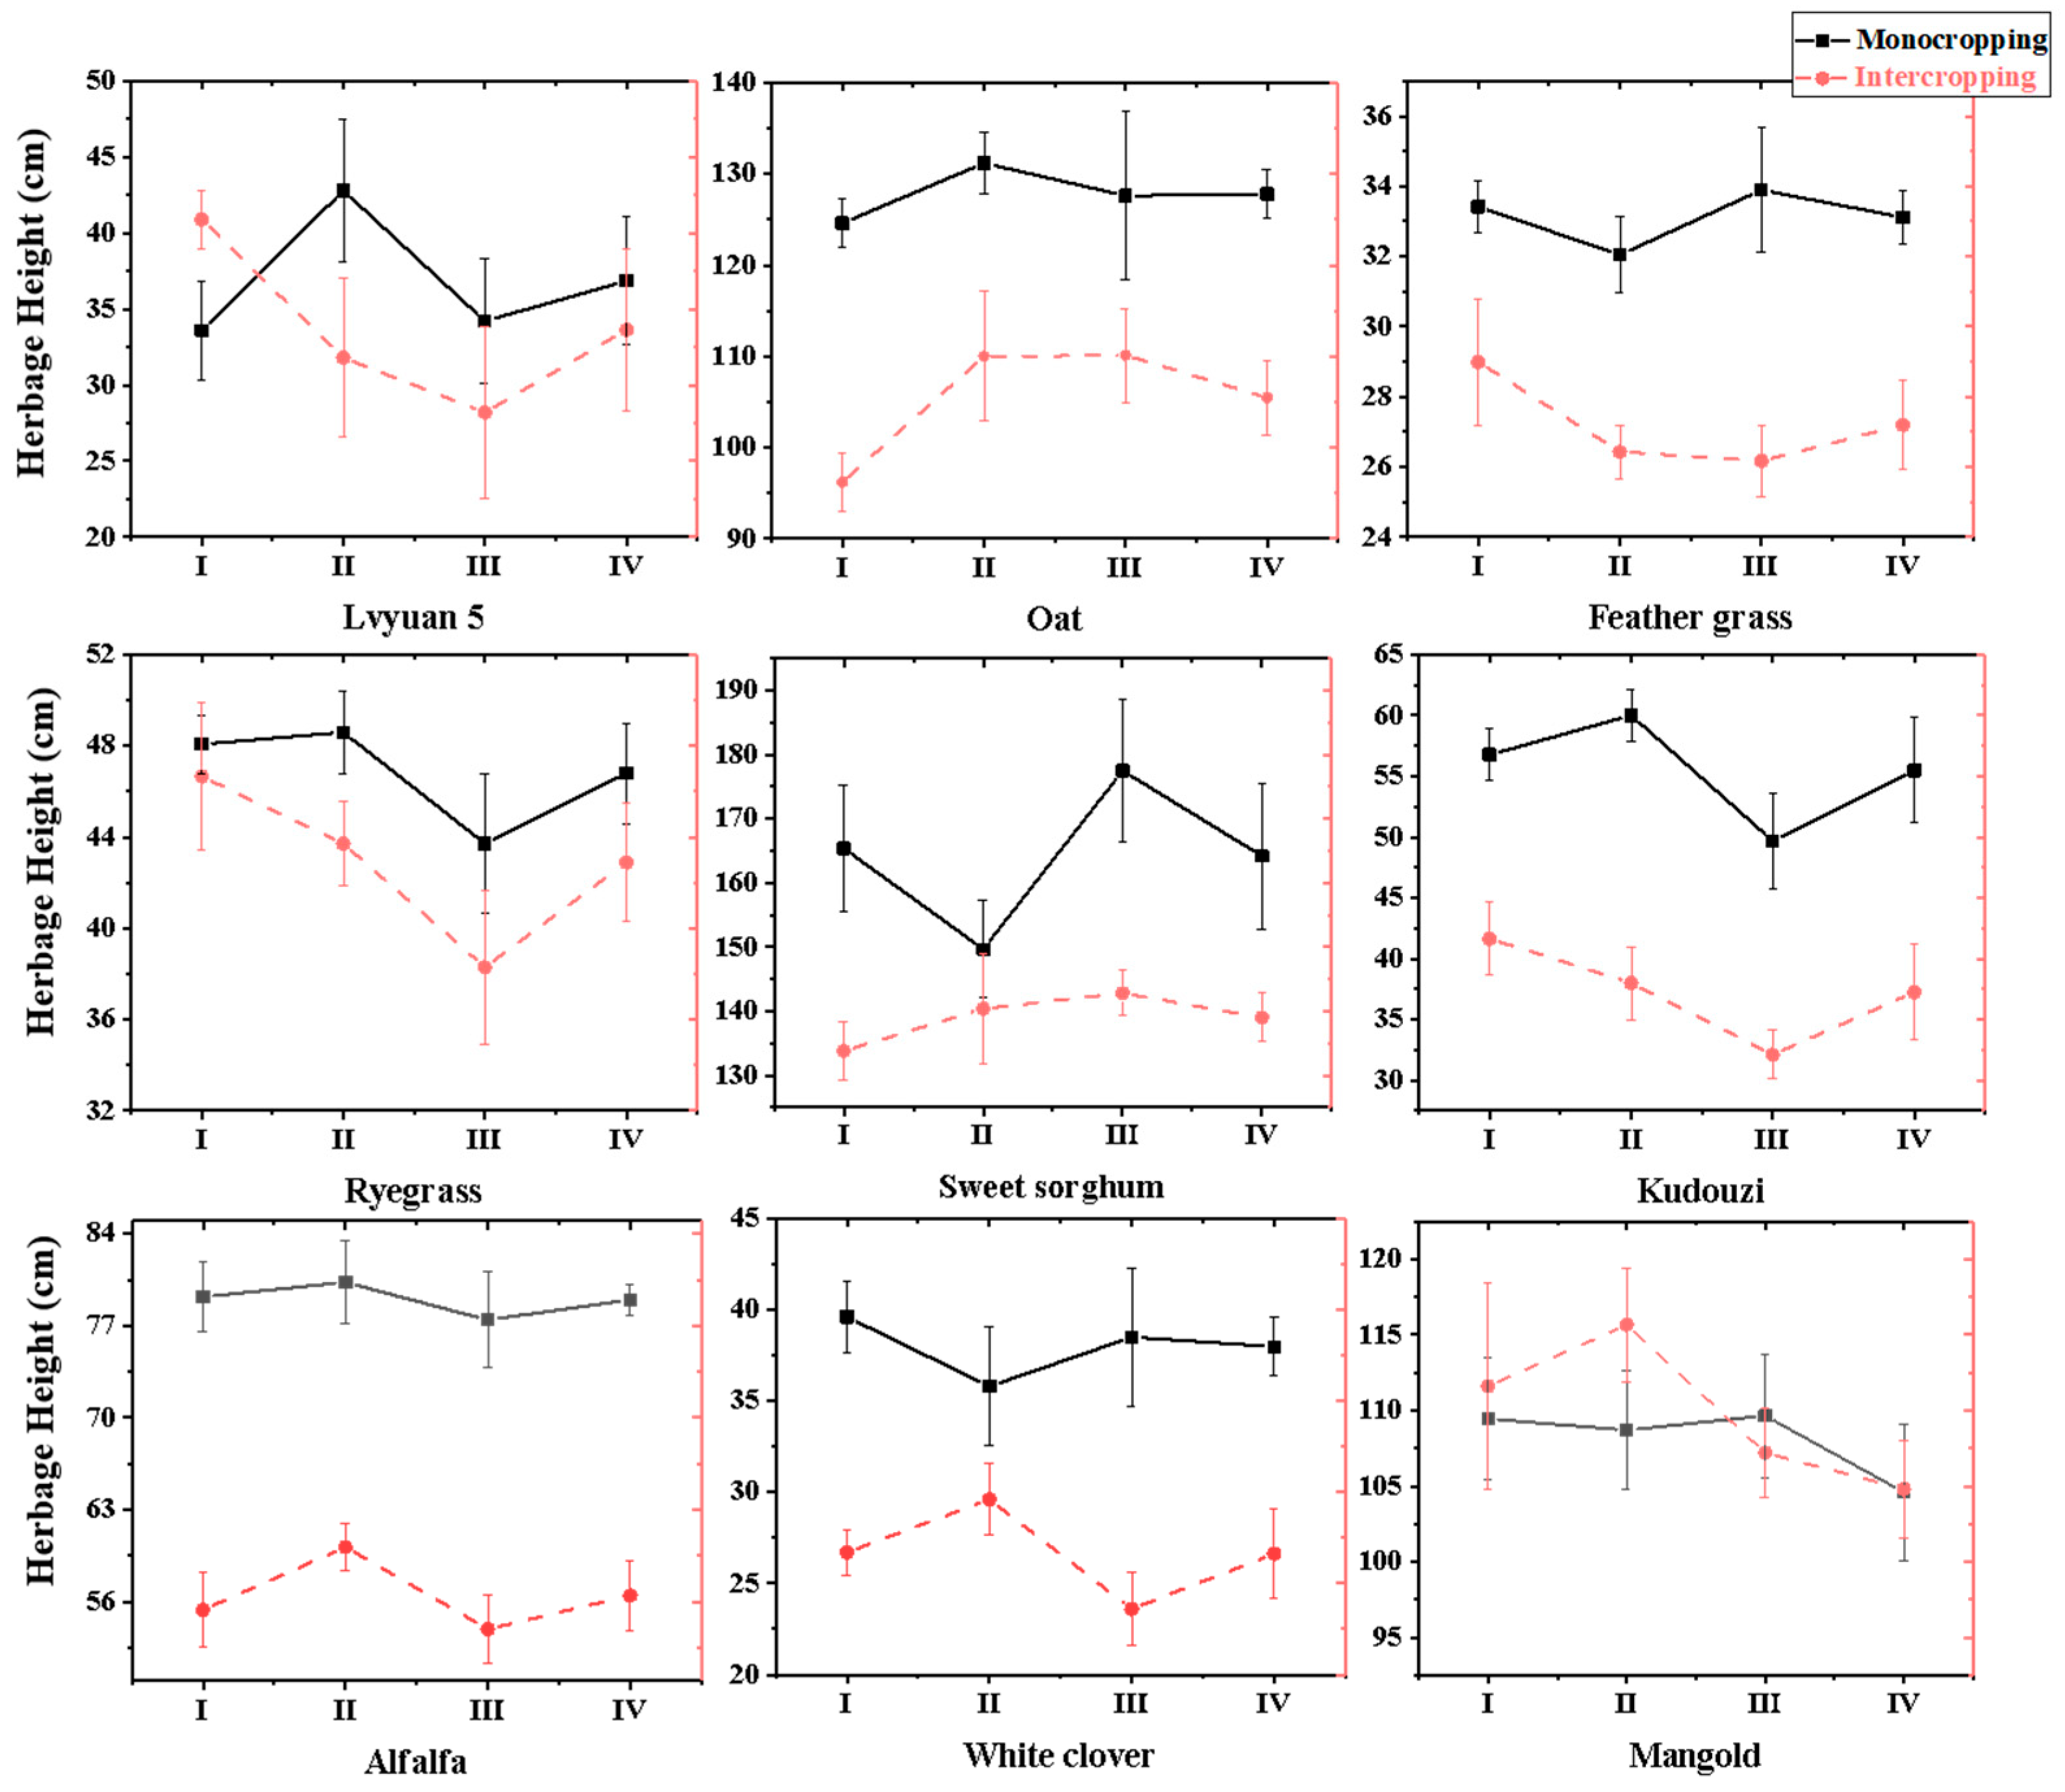
Figure 1. Line chart of different herbage plant heights under monocropping and intercropping patterns.
Agronomy 15 02660 g001
Figure 2. Line chart of different herbage first order branching/tillering numbers under monocropping and intercropping patterns.
Agronomy 15 02660 g002
Figure 3. Line chart of different herbage leaf–stem ratios under monocropping and intercropping patterns.
Agronomy 15 02660 g003
Figure 4. Line chart of hay yield and fresh weight to dry weight ratios of different herbage under monocropping and intercropping patterns. Hay yield was presented as bar charts, while the fresh–dry ratio rate was illustrated using line graphs.
Agronomy 15 02660 g004
Figure 5. Photosynthetic responses of 9 forage types under monocropping and intercropping. (a) Photosynthetic rate and transpiration rate; (b) Stomatal conductance and leaf instantaneous water use efficiency. Photosynthetic rate and stomatal conductance were presented in bar charts, while the transpiration rate and leaf instantaneous water use efficiency were illustrated using line graphs. Pn, net photosynthetic rate; Tr, transpiration rate; Gs, stomatal conductance; and WUE, leaf instantaneous water use efficiency.
Agronomy 15 02660 g005
Figure 6. Correlation matrix of 9 forage types’ plant growth, yield, nutrient quality, physiological parameters, and biotic stress resistance under monocropping and intercropping. CP, crude protein; NDF, neutral detergent fiber; ADF, acid detergent fiber; Ash, crude ash; EE, ether extract; RFV, relative feed value; Pn, net photosynthetic rate; Gs, stomatal conductance; Tr, transpiration rate; WUE, leaf instantaneous water use efficiency; MDAl, leaf malondialdehyde content; SODl, leaf superoxide dismutase activity; MDAr, root malondialdehyde content; SODr, root superoxide dismutase activity; Ph, plant height; Nb, number of branches; Lsr, leaf-to-stem ratio; Hy, hay yield; Fdr, fresh–dry ratio.
Agronomy 15 02660 g006
Table 1. Yield of hay forage under intercropping and monocropping patterns.
MaterialCropping PatternHay Yield (kg/667 m2)Yield Change_I vs. M (%)
201920202021MeanLevel 1Level 2
Lvyuan 5M857.65 ± 39.71765.09 ± 54.62721.51 ± 44.58781.41 ± 56.77−24.7750.46
I1627.25 ± 27.66574.01 ± 31.45562.36 ± 24.99587.87 ± 28.25
I21254.51 ± 55.321148.0 ± 62.901124.71 ± 49.981175.74 ± 56.50
OatM909.44 ± 68.42795.01 ± 79.83836.45 ± 56.16846.97 ± 67.58−41.7916.41
I1565.50 ± 34.99440.34 ± 28.56474.14 ± 47.68493.33 ± 35.70
I21131.00 ± 69.98880.64 ± 57.12948.28 ± 95.36986.43 ± 71.39
Feather grassM441.34 ± 32.19378.05 ± 25.66356.15 ± 17.87392.07 ± 60.21−46.437.15
I1225.88 ± 19.60224.90 ± 17.80178.97 ± 10.77209.87 ± 36.48
I2451.76 ± 39.19449.80 ± 25.66357.94 ± 17.87419.33 ± 72.94
RyegrassM1062.29 ± 43.991113.67 ± 77.531100.19 ± 58.981092.05 ± 21.75−17.9964
I1895.02 ± 21.76870.70 ± 33.67920.76 ± 31.07895.49 ± 20.44
I21790.03 ± 43.521741.40 ± 67.341841.51 ± 64.121790.98 ± 40.88
Sweet sorghumM3005.47 ± 230.62893.30 ± 270.622652.23 ± 89.552850.33 ± 194.76−69.65−39.29
I1915.54 ± 87.94893.49 ± 74.69786.61 ± 107.44865.18 ± 72.61
I21831.08 ± 175.881787.98 ± 149.381573.22 ± 214.881730.36 ± 125.22
KudouziM707.64 ± 20.56650.07 ± 34.69642.64 ± 19.88666.78 ± 29.05−74.32−48.63
I1238.07 ± 23.88138.51 ± 10.71137.19 ± 9.88171.26 ± 47.25
I2476.14 ± 47.76277.03 ± 21.42274.38 ± 19.76342.51 ± 94.49
AlfalfaM1120.92 ± 85.191001.74 ± 57.311077.16 ± 66.341066.61 ± 49.22−20.0759.87
I1938.80 ± 53.88780.99 ± 35.46837.94 ± 60.17852.58 ± 65.25
I21877.60 ± 107.761561.98 ± 70.921675.88 ± 120.341705.15 ± 130.51
White cloverM720.14 ± 29.77652.51 ± 18.69646.79 ± 37.54673.14 ± 33.31−58.97−17.94
I1345.07 ± 22.19247.76 ± 19.80235.79 ± 33.77276.21 ± 48.94
I2690.13 ± 44.38495.53 ± 39.60471.58 ± 67.54552.41 ± 97.87
MangoldM1282.72 ± 101.541137.80 ± 59.781090.26 ± 73.991170.26 ± 81.85−9.0381.94
I11107.49 ± 56.121080.14 ± 87.191006.19 ± 54.261064.61 ± 42.79
I22214.99 ± 112.242160.27 ± 174.382012.38 ± 108.522129.21 ± 85.58
Note: I1 represents the actual forage yield under the intercropping pattern. I2 denotes the hay yield under the intercropping pattern after adjusting for the equivalent ratio of monocropping and intercropping areas, allowing for a comparative analysis with the hay yield from monocropped areas.
Table 2. Antioxidant capacity and oxidative stress in forage plants under monocropping and intercropping patterns.
Cropping
Pattern
TreatmentLeafRoot
MDA
(mg g−1 FW min−1)
SOD
(Ug g−1 FW min−1)
MDA
(mg g−1 FW
min−1)
SOD
(Ug g−1 FW min−1)
MonocroppingLvyuan 50.22 ± 0.010 ijk0.16 ± 0.027 def0.73 ± 0.007 i108.42 ± 10.491 d
Oat0.24 ± 0.008 ijk0.19 ± 0.009 bcd0.83 ± 0.061 df100.02 ± 12.323 ef
Feather grass0.19 ± 0.012 jk0.38 ± 0.064 a0.77 ± 0.033 ghi92.27 ± 2.828 g
Ryegrass0.25 ± 0.004 ijk0.17 ± 0.018 cde0.78 ± 0.012 gh135.34 ± 3.535 c
Sweet sorghum0.21 ± 0.011 jk0.20 ± 0.026 b0.75 ± 0.049 hi141.64 ± 12.642 a
Kudouzi1.43 ± 0.039 e0.11 ± 0.012 gh0.82 ± 0.015 df116.57 ± 7.071 c
Alfalfa1.22 ± 0.081 f0.13 ± 0.005 fg1.61 ± 0.137 a90.26 ± 4.264 g
White clover2.58 ± 0.239 a0.12 ± 0.001 g0.83 ± 0.072 df69.27 ± 2.828 i
Mangold0.15 ± 0.000 k0.20 ± 0.011 b0.59 ± 0.021 j133.92 ± 12.727 b
IntercroppingWolfberry–Lvyuan 50.31 ± 0.016 hi0.14 ± 0.024 ef0.74 ± 0.017 hi103.42 ± 11.627 e
Wolfberry–oat0.25 ± 0.022 ijk0.20 ± 0.001 bc0.84 ± 0.098 d100.81 ± 8.485 ef
Wolfberry–feather grass0.45 ± 0.003 g0.36 ± 0.027 a0.81 ± 0.029 dfg88.06 ± 9.005 g
Wolfberry–ryegrass0.25 ± 0.073 ijk0.11 ± 0.015 g0.79 ± 0.042 fgh101.78 ± 10.056 ef
Wolfberry–sweet sorghum0.39 ± 0.007 gh0.20 ± 0.043 bc0.76 ± 0.009 hi88.38 ± 8.478 g
Wolfberry–kudouzi2.03 ± 0.040 c0.15 ± 0.016 ef1.03 ± 0.092 c118.55 ± 10.556 c
Wolfberry–alfalfa1.54 ± 0.045 d0.11 ± 0.016 ghi1.23 ± 0.048 b90.24 ± 4.242 g
Wolfberry–white clover2.23 ± 0.008 b0.16 ± 0.031 de0.84 ± 0.046 d90.56 ± 13.334 g
Wolfberry–mangold0.06 ± 0.004 l0.20 ± 0.044 bc0.58 ± 0.012 j81.41 ± 4.242 h
L.S.D. (5%)
Note: MDA, malondialdehyde content; SOD, superoxide dismutase activity. Mean values (x ± SE) followed by the same lowercase letters were not significantly different among treatments based on ANOVA LSD test (p < 0.05) of square-root-transformed data (n = 3).
Table 3. Plant Nutrient Composition of different herbage under intercropping pattern.
Cropping PatternTreatmentCPNDFADFAshEERFV
MonocroppingLvyuan 5 10.41 ± 0.89 k52.17 ± 3.97 g38.32 ± 1.92 cd9.94 ± 0.98 e4.84 ± 0.34 cd104.41 ± 7.66 gh
Oat11.83 ± 0.76 h54.37 ± 3.19 f40.75 ± 1.56 b10.88 ± 0.12 cd4.41 ± 0.14 de97.79 ± 3.98 i
Feather grass10.57 ± 0.35 jk70.72 ± 3.77 a34.36 ± 2.89 f4.58 ± 0.12 i3.64 ± 0.12 f81.73 ± 4.62 k
Ryegrass11.32 ± 0.88 g47.43 ± 2.19 i24.87 ± 1.43 j13.46 ± 0.45 a6.81 ± 0.22 b136.36 ± 9.36 a
Sweet sorghum7.87 ± 0.21 l66.75 ± 5.21 c45.02 ± 1.95 a11.52 ± 0.87 b2.75 ± 0.06 g75.02 ± 3.22 l
Kudouzi20.89 ± 1.78 a56.68 ± 1.98 e28.61 ± 1.64 h6.38 ± 0.32 h4.12 ± 0.11 ef109.32 ± 4.51 e
Alfalfa19.26 ± 0.65 b45.86 ± 2.06 j36.54 ± 1.44 e10.47 ± 0.17 d2.76 ± 0.67 g122.59 ± 7.90 b
White clover 14.14 ± 0.33 de53.45 ± 3.42 f30.59 ± 1.65 g7.36 ± 0.09 g1.15 ± 0.04 h113.25 ± 5.07 d
Mangold 13.38 ± 0.12 ef53.43 ± 2.99 f26.65 ± 1.77 i9.79 ± 0.13 e2.90 ± 0.07 g118.63 ± 4.11 c
IntercroppingWolfberry–Lvyuan 511.09 ± 0.66 ij51.77 ± 3.01 gh38.53 ± 1.57 cd9.72 ± 0.39 e5.12 ± 0.78 c105.81 ± 5.62 fg
Wolfberry–oat12.97 ± 0.23 fg52.30 ± 2.66 g39.23 ± 2.01 bc10.63 ± 1.00 d4.50 ± 0.19 de103.77 ± 4.77 h
Wolfberry–feather grass11.24 ± 0.91 i69.22 ± 3.29 b34.11 ± 2.34 f4.58 ± 0.16 i3.89 ± 0.07 f83.76 ± 4.61 j
Wolfberry–ryegrass12.56 ± 1.06 de46.01 ± 1.86 j24.13 ± 0.99 j12.09 ± 1.12 a7.46 ± 0.64 a141.73 ± 7.87 a
Wolfberry–sweet sorghum7.96 ± 0.09 l64.52 ± 3.42 d44.31 ± 2.33 a11.30 ± 0.80 bc2.81 ± 0.03 g78.41 ± 3.42 l
Wolfberry–kudouzi20.52 ± 0.89 a57.42 ± 3.19 e29.22 ± 1.90 h6.61 ± 0.23 h4.01 ± 0.04 ef107.15 ± 4.80 f
Wolfberry–alfalfa18.47 ± 0.28 c47.55 ± 2.17 i38.09 ± 2.09 d10.70 ± 0.78 d2.58 ± 0.12 g115.88 ± 4.42 c
Wolfberry–white clover 13.96 ± 0.68 de54.11 ± 3.21 f30.89 ± 2.01 g7.90 ± 0.39 f1.14 ± 0.09 h111.46 ± 3.17 d
Wolfberry–mangold 14.42 ± 1.32 d50.79 ± 4.06 h26.86 ± 1.65 i8.02 ± 0.64 f1.22 ± 0.07 h124.50 ± 6.99 b
Note: CP, NDF, ADF, Ash, EE, and RFV represent crude protein, neutral detergent fiber, acid detergent fiber, crude ash, ether extract, and relative feed value, respectively. Mean values (x ± SE) followed by the same lowercase letters were not significantly different among treatments based on ANOVA LSD test (p < 0.05) of square-root-transformed data (n = 3).
Disclaimer/Publisher’s Note: The statements, opinions and data contained in all publications are solely those of the individual author(s) and contributor(s) and not of MDPI and/or the editor(s). MDPI and/or the editor(s) disclaim responsibility for any injury to people or property resulting from any ideas, methods, instructions or products referred to in the content.