1. Introduction
The escalating global demand for renewable energy, driven by concerns over fossil fuel depletion and climate change, has spurred intensive research into lignocellulosic biomass as a sustainable feedstock [
1,
2]. Among various energy crops,
Miscanthus spp., a genus of perennial C4 grasses, has emerged as a frontrunner due to its high biomass yield, broad adaptability, low input requirements, and excellent calorific value [
3,
4]. Two prominent species native to China,
Miscanthus sacchariflorus (MS) and
Miscanthus lutarioriparius (ML), are particularly valued for their potential for producing bioethanol, bio-based materials, and chemicals [
5].
The conversion efficiency and economic viability of these bio-products are intrinsically linked to the chemical composition of the feedstock, primarily the relative content of cellulose, hemicellulose, and lignin, as well as ash and moisture content [
6]. However, these properties can vary significantly due to genetic diversity, cultivation practices, and post-harvest storage conditions [
7]. Consequently, large-scale breeding programs and industrial processing require a rapid, accurate, and high-throughput method to screen vast numbers of samples for optimal chemical profiles [
5]. This need drives the development of high-throughput phenotyping technologies, which involve the rapid and non-destructive assessment of complex plant traits on a large scale.
Traditional wet-chemistry methods for lignocellulose analysis, while accurate, are laborious, time-consuming, destructive, and generate hazardous chemical waste, making them impractical for large-scale applications [
8]. This bottleneck severely limits the pace of germplasm improvement and biomass quality control. Near-infrared spectroscopy (NIRS) has been widely recognized as a promising alternative. As a non-destructive analytical technique, NIRS measures the absorption of light by molecules containing C–H, O–H, and N–H bonds, providing a chemical fingerprint of the sample [
9]. Coupled with chemometric modeling, NIRS enables the rapid and simultaneous prediction of multiple chemical components from a single spectrum [
10].
Previous studies have demonstrated the feasibility of using NIRS to predict lignocellulosic content in various biomass feedstocks, including
Miscanthus spp. [
11,
12]. For instance, Li et al. [
13] and Chen et al. [
14] developed NIRS models for
Miscanthus components, confirming the potential of this technology. However, the predictive power of NIRS models can be compromised by the high dimensionality and multicollinearity of spectral data, where many features are redundant or irrelevant [
15]. To address this, feature (variable or wavelength) selection algorithms are employed to isolate the most informative features, thereby simplifying the model, reducing overfitting, and improving predictive accuracy and robustness [
16].
Competitive Adaptive Reweighted Sampling (CARS) is a well-established algorithm that mimics Darwin’s “survival of the fittest” principle to select optimal variable subsets [
17]. More recently, hybrid strategies have been proposed, such as combining Variable Combination Population Analysis (VCPA) with a Genetic Algorithm (GA) or with Iteratively Retaining Informative Variables (IRIVs), which have shown promise in other fields but are less explored for biomass analysis [
18].
This study addresses the critical need for high-throughput phenotyping in Miscanthus breeding and bio-utilization. To this end, our specific objectives were to: (1) establish robust NIRS calibration models for the quantification of cellulose, hemicellulose, lignin, ash, and moisture in a diverse collection of Miscanthus spp. samples; (2) systematically compare the performance of PLS models built with the full spectrum versus those optimized by three distinct feature selection algorithms (CARS, VCPA-GA, and VCPA-IRIV), representing different selection approaches, to identify the most effective modeling strategy; and (3) validate the resulting optimized method as a practical high-throughput phenotyping tool to accelerate germplasm screening and quality assessment for the Miscanthus-based bioeconomy.
2. Materials and Methods
2.1. Plant Materials and Sample Preparation
This study utilized a total of 107 accessions, comprising 25 of MS and 82 of ML The two species were intentionally combined to create a single, diverse population, thereby enhancing the chemical and spectral variability of the calibration set and improving the robustness and general applicability of the resulting NIRS models. The samples were identified by Prof. Yi and harvested during senescence in November 2021 from the Miscanthus Resource Nursery at Hunan Agricultural University, Changsha, China (28°18′ N, 113°07′ E). The collected aerial biomass was dried in an oven (DHG-9070A, Shanghai Jinghong Experimental Equipment Co., Ltd., Shanghai, China) at 65 °C for approximately 48 h until a constant weight was achieved. The dried samples were coarsely chopped, then ground into a fine powder using a plant grinder (DLF-55S water-cooled pulverizer, Wenzhou Dingli Technology Equipment Co., Ltd., Wenzhou, China). The powder was sieved through a 65-mesh screen (approx. 230 µm) and stored in sealed bags separately at 4 °C in a refrigerator (BCD-618WGHSSEDBL, Haier Group, Haier Refrigerator Co., Ltd., Qingdao, China) prior to analysis.
2.2. Chemical Composition Analysis
The moisture, ash, cellulose, hemicellulose, and lignin contents were determined according to the National Energy Industry Standards of China for lignocellulosic biomass. Moisture content was determined using an automatic infrared moisture analyzer (HE53/02, Mettler Toledo Instruments (Shanghai) Co., Ltd., Shanghai, China), a standardized gravimetric method based on the loss-on-drying principle (NB/T 34057.3-2017 [
19]). Ash content was determined by incineration in a muffle furnace (MFLC-36/12D, Tianjin Tesi Instrument Co., Ltd., Tianjin, China), at 575 ± 25 °C (NB/T 34057.6-2017 [
20]). The contents of cellulose, hemicellulose, and acid-insoluble lignin were determined using the two-step sulfuric acid hydrolysis method (NB/T 34057.5-2017 [
21]). All chemical analyses were performed in triplicate for each sample.
2.3. NIR Spectroscopy
Diffuse-reflectance NIR spectra were collected from 900 to 2500 nm using a bench-top spectrometer equipped with a rotating sample stage and integrating sphere (G3000 spectrometer, Sichuan Ways-Spec Technology Co., Ltd., Chengdu, China). The spectral sampling interval was 1 nm (final 1601 features), and 16 scans/sample were averaged after white-reference correction (Spectralon, Sichuan Ways-Spec Technology Co., Ltd., Chengdu, China). Environmental conditions were controlled at 22 ± 2 °C and 40–60% RH. The filled sample cup depth exceeded 10 mm to minimize background. All wavelength units are in nm; spectral resolution and interval follow manufacturer specifications.
2.4. Spectral Data Preprocessing
To minimize physical effects such as baseline shifts and particle size variation, the raw spectra were preprocessed. Various methods were tested, and the second derivative (SD) using the Savitzky–Golay algorithm (11-point window, 2nd-order polynomial) was found to provide the best results for enhancing spectral features and was applied to all subsequent analyses.
2.5. Feature Selection
Three algorithms were used to select informative features from the preprocessed spectra. CARS selects feature subsets based on their regression coefficients in PLS models, progressively eliminating uninformative features [
17]. VCPA-GA first uses an exponential decay function (EDF) to reduce the variable space and then employs a Genetic Algorithm (GA) to refine the selection of the most predictive features combinations [
18]. Similarly to VCPA-GA, the VCPA-IRIV method also uses EDF for initial screening, followed by the Iteratively Retaining Informative Variables (IRIV) procedure to classify features and retain only those with strong or weak information content [
18]. The key parameters for VCPA-GA and VCPA-IRIV were set as described by Yun et al. [
18] (
Table 1).
2.6. Sample Set Partitioning
The 107 samples were divided into a calibration set (for model training) and a prediction set (for external validation) at a 2:1 ratio. The Sample set Partitioning based on joint x–y distances (SPXY) algorithm was employed [
22]. This method considers the Euclidean distances in both the spectral space (X-variables) and the chemical composition space (Y-variables), ensuring that both sets are representative of the overall sample diversity.
2.7. Model Construction and Evaluation
Partial Least Squares (PLS) regression was used to build quantitative models correlating the spectral data (full range or selected features) with the measured chemical reference values. To prevent overfitting, the optimal number of latent variables (LVs) for each model was determined using 10-fold cross-validation, selecting the number of LVs that minimized the root mean square error of cross-validation (RMSECV).
The performance of the models was evaluated using several statistical metrics for both the calibration and prediction sets:
Coefficient of Determination (R2c, R2cv, R2v): Indicates the proportion of variance explained by the model for calibration, cross-validation, and prediction, respectively.
Root Mean Square Error (RMSEC, RMSECV, RMSEP): Measures the average error of the model.
Residual Predictive Deviation (RPD): Calculated as the standard deviation (SD) of the reference values in the prediction set divided by the RMSEP.
RPD values are used to assess the practical predictive ability of the model, where RPD > 3 indicates a good model, and RPD > 5 suggests excellent predictive power.
All data processing and modeling were performed using Python (version 3.10) with custom-written scripts and relevant libraries, including scikit-learn (version 1.2.2) for PLS regression, Numpy (version 1.24.3) for numerical operations, Scipy (version 1.10.1) for spectral preprocessing, Matplotlib (version 3.7.1) for figure generation.
3. Results and Discussion
3.1. Chemical Characterization of Miscanthus Samples
In this study, 107 samples of
Miscanthus spp. were selected, and their lignocellulosic components were quantified. As shown in the box plot in
Figure 1A, the compositional data were evenly and approximately normally distributed, indicating that the selected samples adequately represented the natural variation in chemical composition within the broader population.
The measured component contents span the following ranges: cellulose (30.61–41.28%), hemicellulose (19.97–27.44%), lignin (15.74–22.93%), ash (3.05–11.37%) and moisture (2.03–8.94%). Among these, ash and moisture exhibited the highest CVs at 33.85% and 40.68%, respectively. The CV for lignin, cellulose, and hemicellulose showed lower variability, with CVs of 7.32%, 6.91%, and 5.55%, respectively, the lowest among all components (
Figure 1A). Furthermore, the relatively wide distribution ranges of ash and moisture suggest that these components may be more reliably predicted by subsequent NIRS models than cellulose, hemicellulose and lignin, which exhibit narrower variability.
Overall, the chemical compositions of the
Miscanthus spp. samples were sufficiently diverse and representative to support robust NIRS modeling. Cellulose, hemicellulose, and lignin, the primary components of bio-based product development, collectively accounted for an average of 80% of the dry matter in the 107 samples. Notably, the cellulose content in MS and ML exceeds that of corn straw [
23,
24], suggesting a superior potential for applications such as nanocellulose and bioethanol production [
25]. Additionally, when compared to the straw of
Helianthus tuberosus L., another potential biomass feedstock, the hemicellulose levels in our
Miscanthus samples are notably higher, indicating greater economic promise for high-value applications such as xylooligosaccharide production [
26,
27]. Given that lignin is a key determinant of calorific value, the elevated lignin content in
Miscanthus spp. relative to
Helianthus tuberosus L. straw, further underscores their strong potential for use in biomass-based combustion and power generation [
27].
3.2. Spectral Analysis and Pretreatment
The NIRS of the 107
Miscanthus spp. samples are presented in
Figure 1B. The spectra span the wavelength range of 900–2500 nm, with absorbance as the ordinate, and 1601 data points per spectrum. The spectra exhibit strong and distinct absorption features, reflecting the high and variable contents of key lignocellulosic components, particularly cellulose, hemicellulose, and lignin.
The majority of characteristic absorption bands are concentrated in the 1400–2500 nm region [
28], which corresponds to the first and second overtones as well as combination bands of fundamental vibrations involving C–H, O–H, N–H, C=O, and C=C bonds. Specific assignments include:
the O–H asymmetric stretching vibration of cellulose at ~1500 nm;
the C=C aromatic overtone vibration of lignin at ~1660 nm;
the C=O stretching vibration of acetyl groups in hemicellulose at ~1730 nm;
the combined O–H asymmetric stretching and bending vibrations of water at ~1941 nm;
overlapping O–H and C–H bending and stretching vibrations from cellulose and xylan at ~2100 nm;
O–H and C–O stretching vibrations associated with lignin at ~2250 nm;
C–H bending and stretching vibrations of xylan at ~2350 nm;
the combination bands arising from weak N-H (e.g., in residual proteins), C=O, and C=C vibrations, appearing broadly between 2050 and 2400 nm.
To enhance spectral interpretability and model performance, SD preprocessing was applied, and the resulting transformed spectra are shown in
Figure 1C. This technique effectively corrects baseline drift and offsets caused by light scattering or instrumental variation, suppresses non-chemical spectral artifacts, and improves the resolution of overlapping absorption bands. Furthermore, SD preprocessing enhances the signal-to-noise ratio and minimizes random noise, thereby facilitating the development of more accurate and robust chemometric models. As demonstrated here, appropriate spectral pretreatment is essential for extracting meaningful chemical information and ensuring reliable predictions in NIR-based quantitative analysis.
3.3. Optimization of Near-Infrared Spectral Features
Feature selection is a critical step in NIRS modeling, as it enhances computational efficiency, reduces model complexity, and often improves prediction accuracy by retaining only the most informative spectral features [
29]. In this study, three features selection algorithms, CARS, VCPA-GA and VCPA-IRIV, were employed to identify optimal features subsets, reflecting their distinct theoretical frameworks [
17,
18,
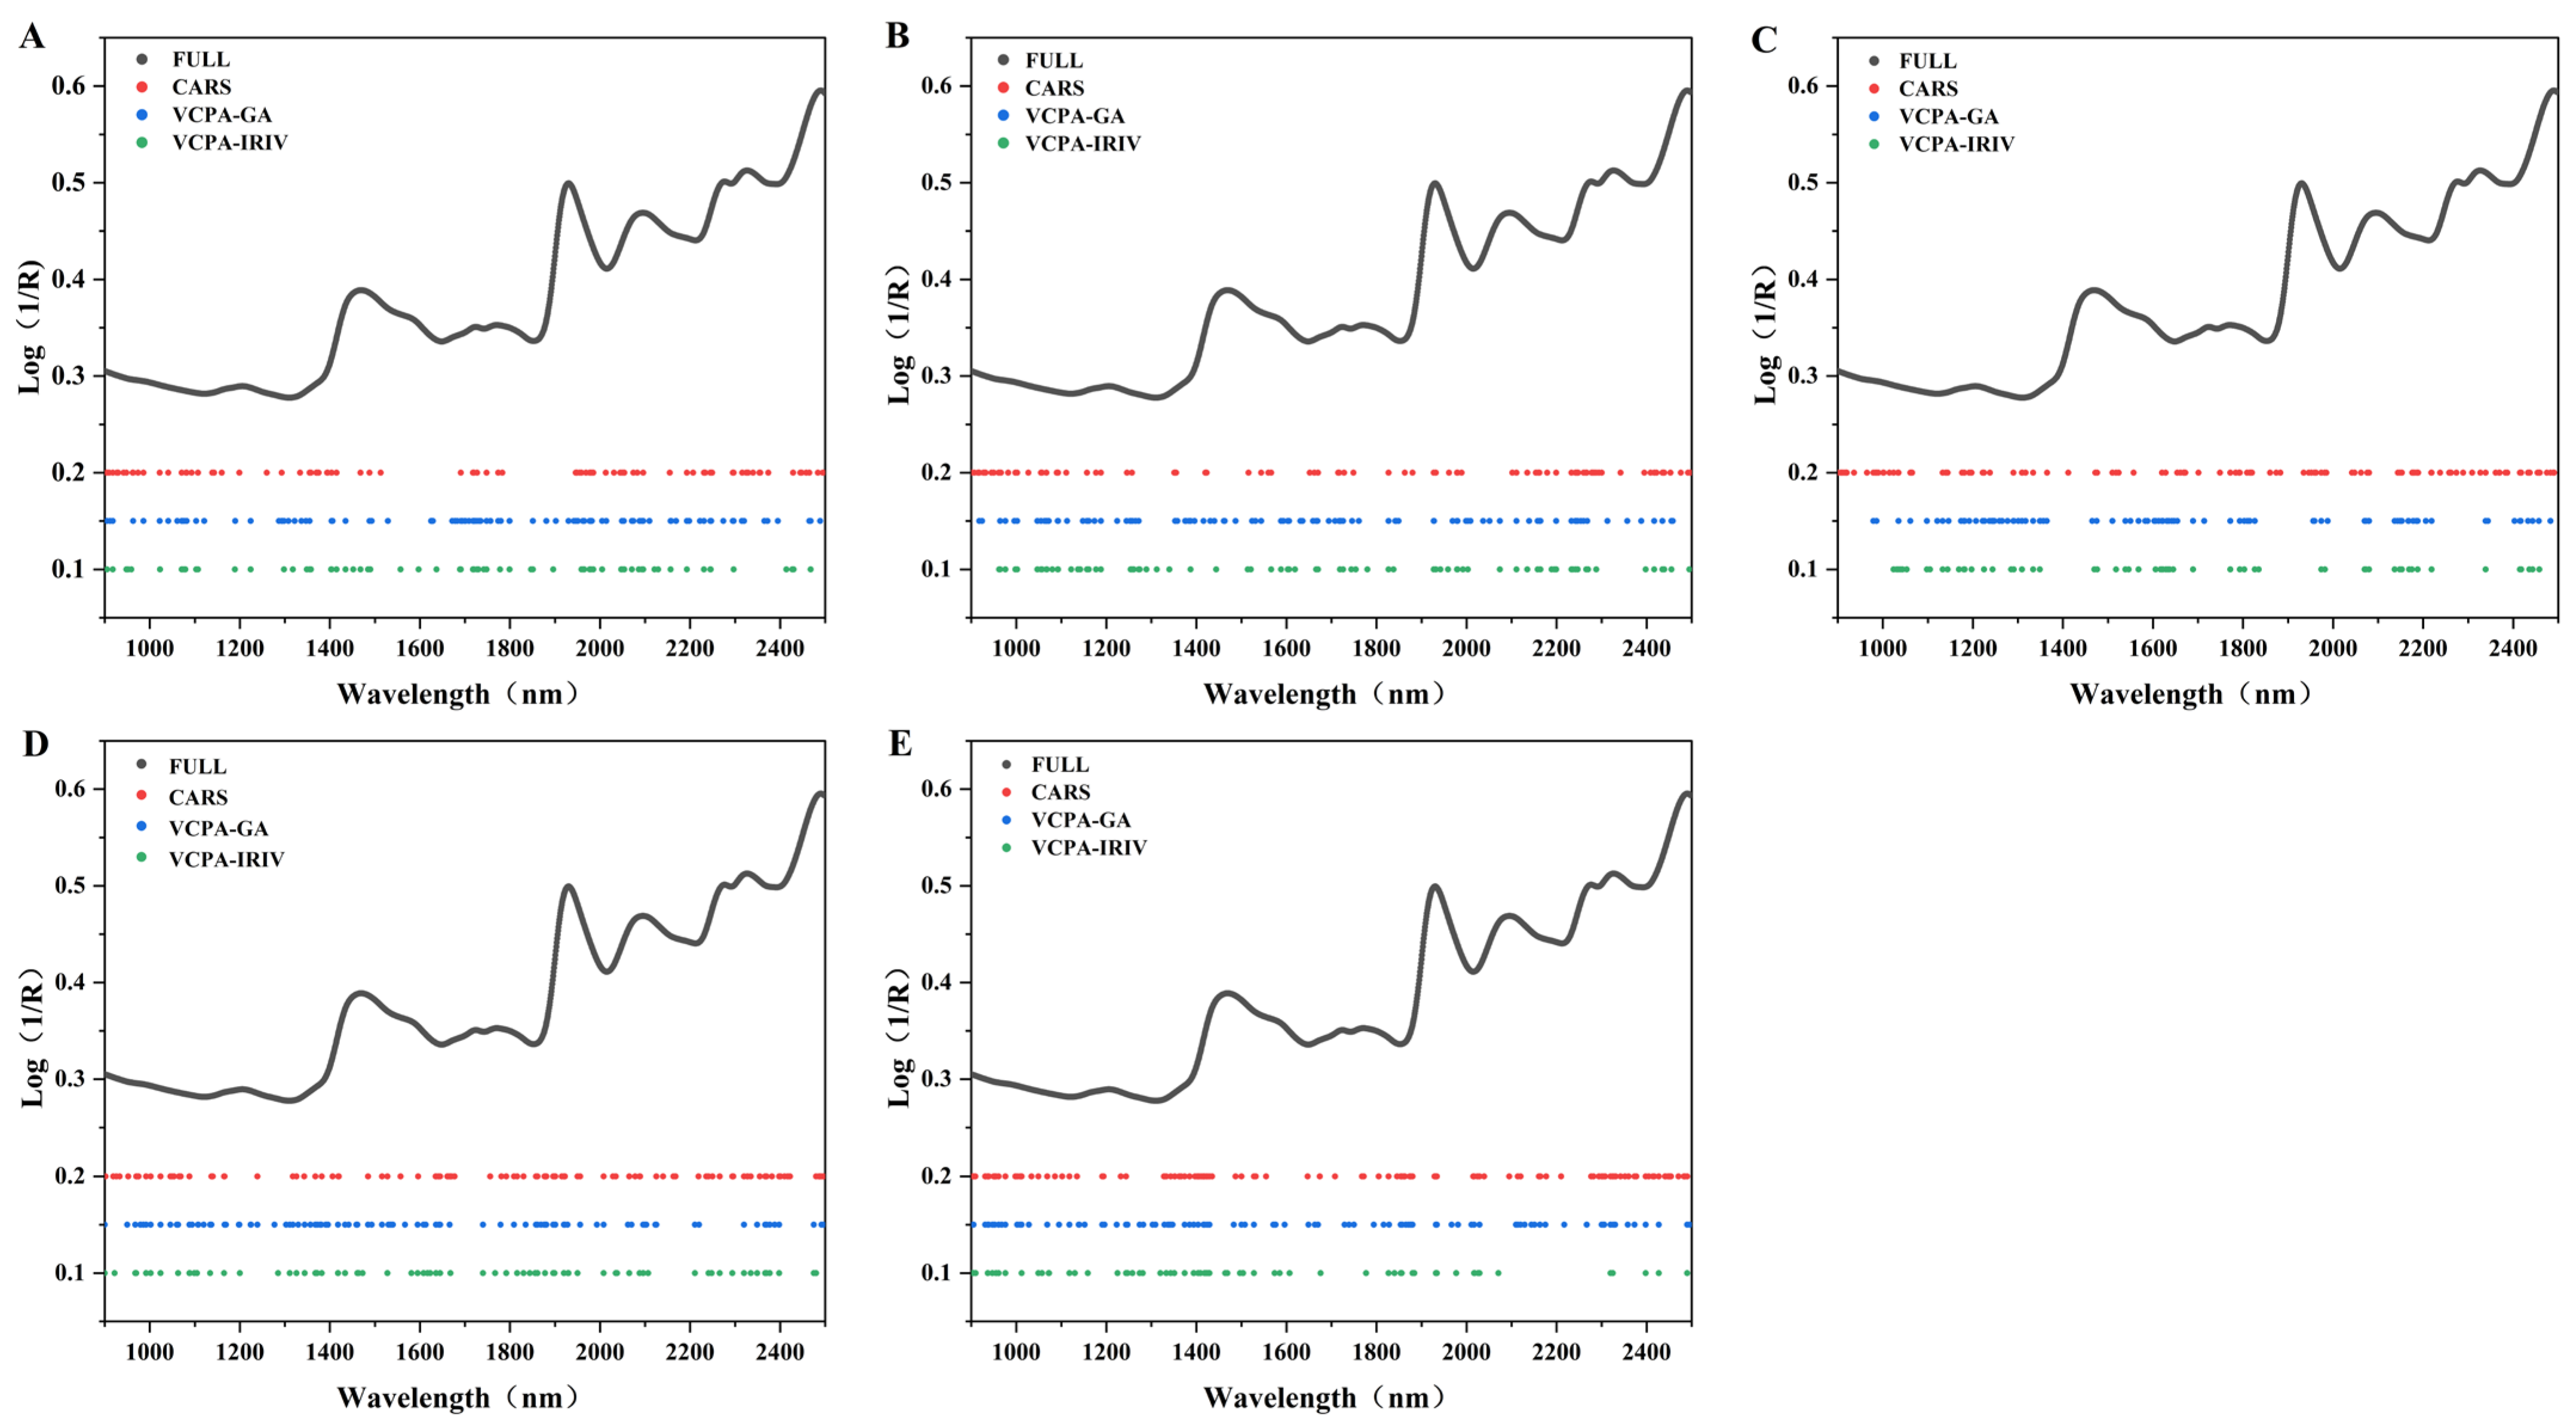
30]. The resulting selected features are summarized in
Figure 2 and
Table 2.
For most components, CARS retained a larger number of spectral features compared to VCPA-GA and VCPA-IRIV, with the exception of cellulose and hemicellulose, where the three methods yielded comparable selections. This difference likely stems from CARS’s more conservative elimination strategy, which gradually removes uninformative features while preserving moderately relevant ones, whereas the hybrid VCPA-based approaches tend to discard weakly informative features more aggressively during optimization. Notably, all three algorithms achieved substantial dimensionality reduction: the maximum number of selected features was 120 (7.5% of the original 1601 spectral points), significantly simplifying subsequent modeling without compromising predictive power (
Table 2). As shown in
Figure 2, the retained features were distributed across key spectral regions associated with lignocellulosic components, confirming that they captured chemically relevant information and thereby enabled simpler yet more accurate PLS models.
A strong absorption band observed at 1925–1942 nm—attributed to the O–H asymmetric stretch and deformation vibrations of water—is known to interfere with the quantification of other lignocellulosic components [
31]. Intriguingly, the CARS algorithm largely avoided this region, whereas both VCPA-GA and VCPA-IRIV included features within it, potentially introducing noise into their models. In contrast, all three methods successfully retained established key spectral regions associated with lignocellulose:
Cellulose and hemicellulose: 1471–1563, 1586–1597, 1725–1731, 2092–2101, 2328–2336, and 2486–2491 nm [
28,
32];
Lignin: 1811, 2328–2332, 2375, and 2488 nm [
28,
32].
CARS selected a greater number of features within these informative regions, which likely contributes to the consistently higher prediction accuracy of CARS-PLS models across all target components.
Interestingly, all three algorithms commonly selected features in the 900–1400 nm range—a region not traditionally considered critical for lignocellulose prediction. Previous studies have linked specific sub-bands in this region to protein (e.g., 906–942, 1152, 1159, and 1187 nm) and fat (e.g., 1167–1210 and 1240–1270 nm) [
33]. However, CARS has also been reported to utilize 1250–1400 nm for cellulose, 1111–1250 nm for hemicellulose, and 1176–1282 nm for lignin modeling [
34], suggesting that these shorter features may still contain latent, component-specific information. Critically, because samples were collected during winter senescence (the “yellowing” phase), endogenous protein and lipid reserves were largely remobilized, minimizing interference from these non-target components. Consequently, the inclusion of 900–1400 nm features did not degrade model performance; rather, it enhanced robustness by leveraging additional spectral diversity.
Indeed, spectral diversity is essential for developing reliable NIRS calibrations. As shown in
Figure 1B, the 900–1400 nm region exhibits considerable variation across samples, supporting its utility in multivariate modeling. Taken together, these findings indicate that harvesting during the winter yellowing stage not only reduces confounding effects from soluble nutrients but also enriches spectral contrast, ultimately facilitating more accurate prediction of lignocellulosic composition.
3.4. Sample Set Division
The selection of a representative calibration set is critical for developing robust and reliable multivariate calibration models, as it directly influences the predictive performance and stability of the model [
35]. In this study, the sample set was partitioned into calibration and prediction subsets using the SPXY algorithm, which simultaneously considers both spectral (X) and reference property (Y) information to ensure comprehensive coverage of the data space. To balance model training and independent validation, approximately one-third of the samples (36 out of 107) were assigned to the prediction set, whereas the remaining two-thirds (71 samples) formed the calibration set.
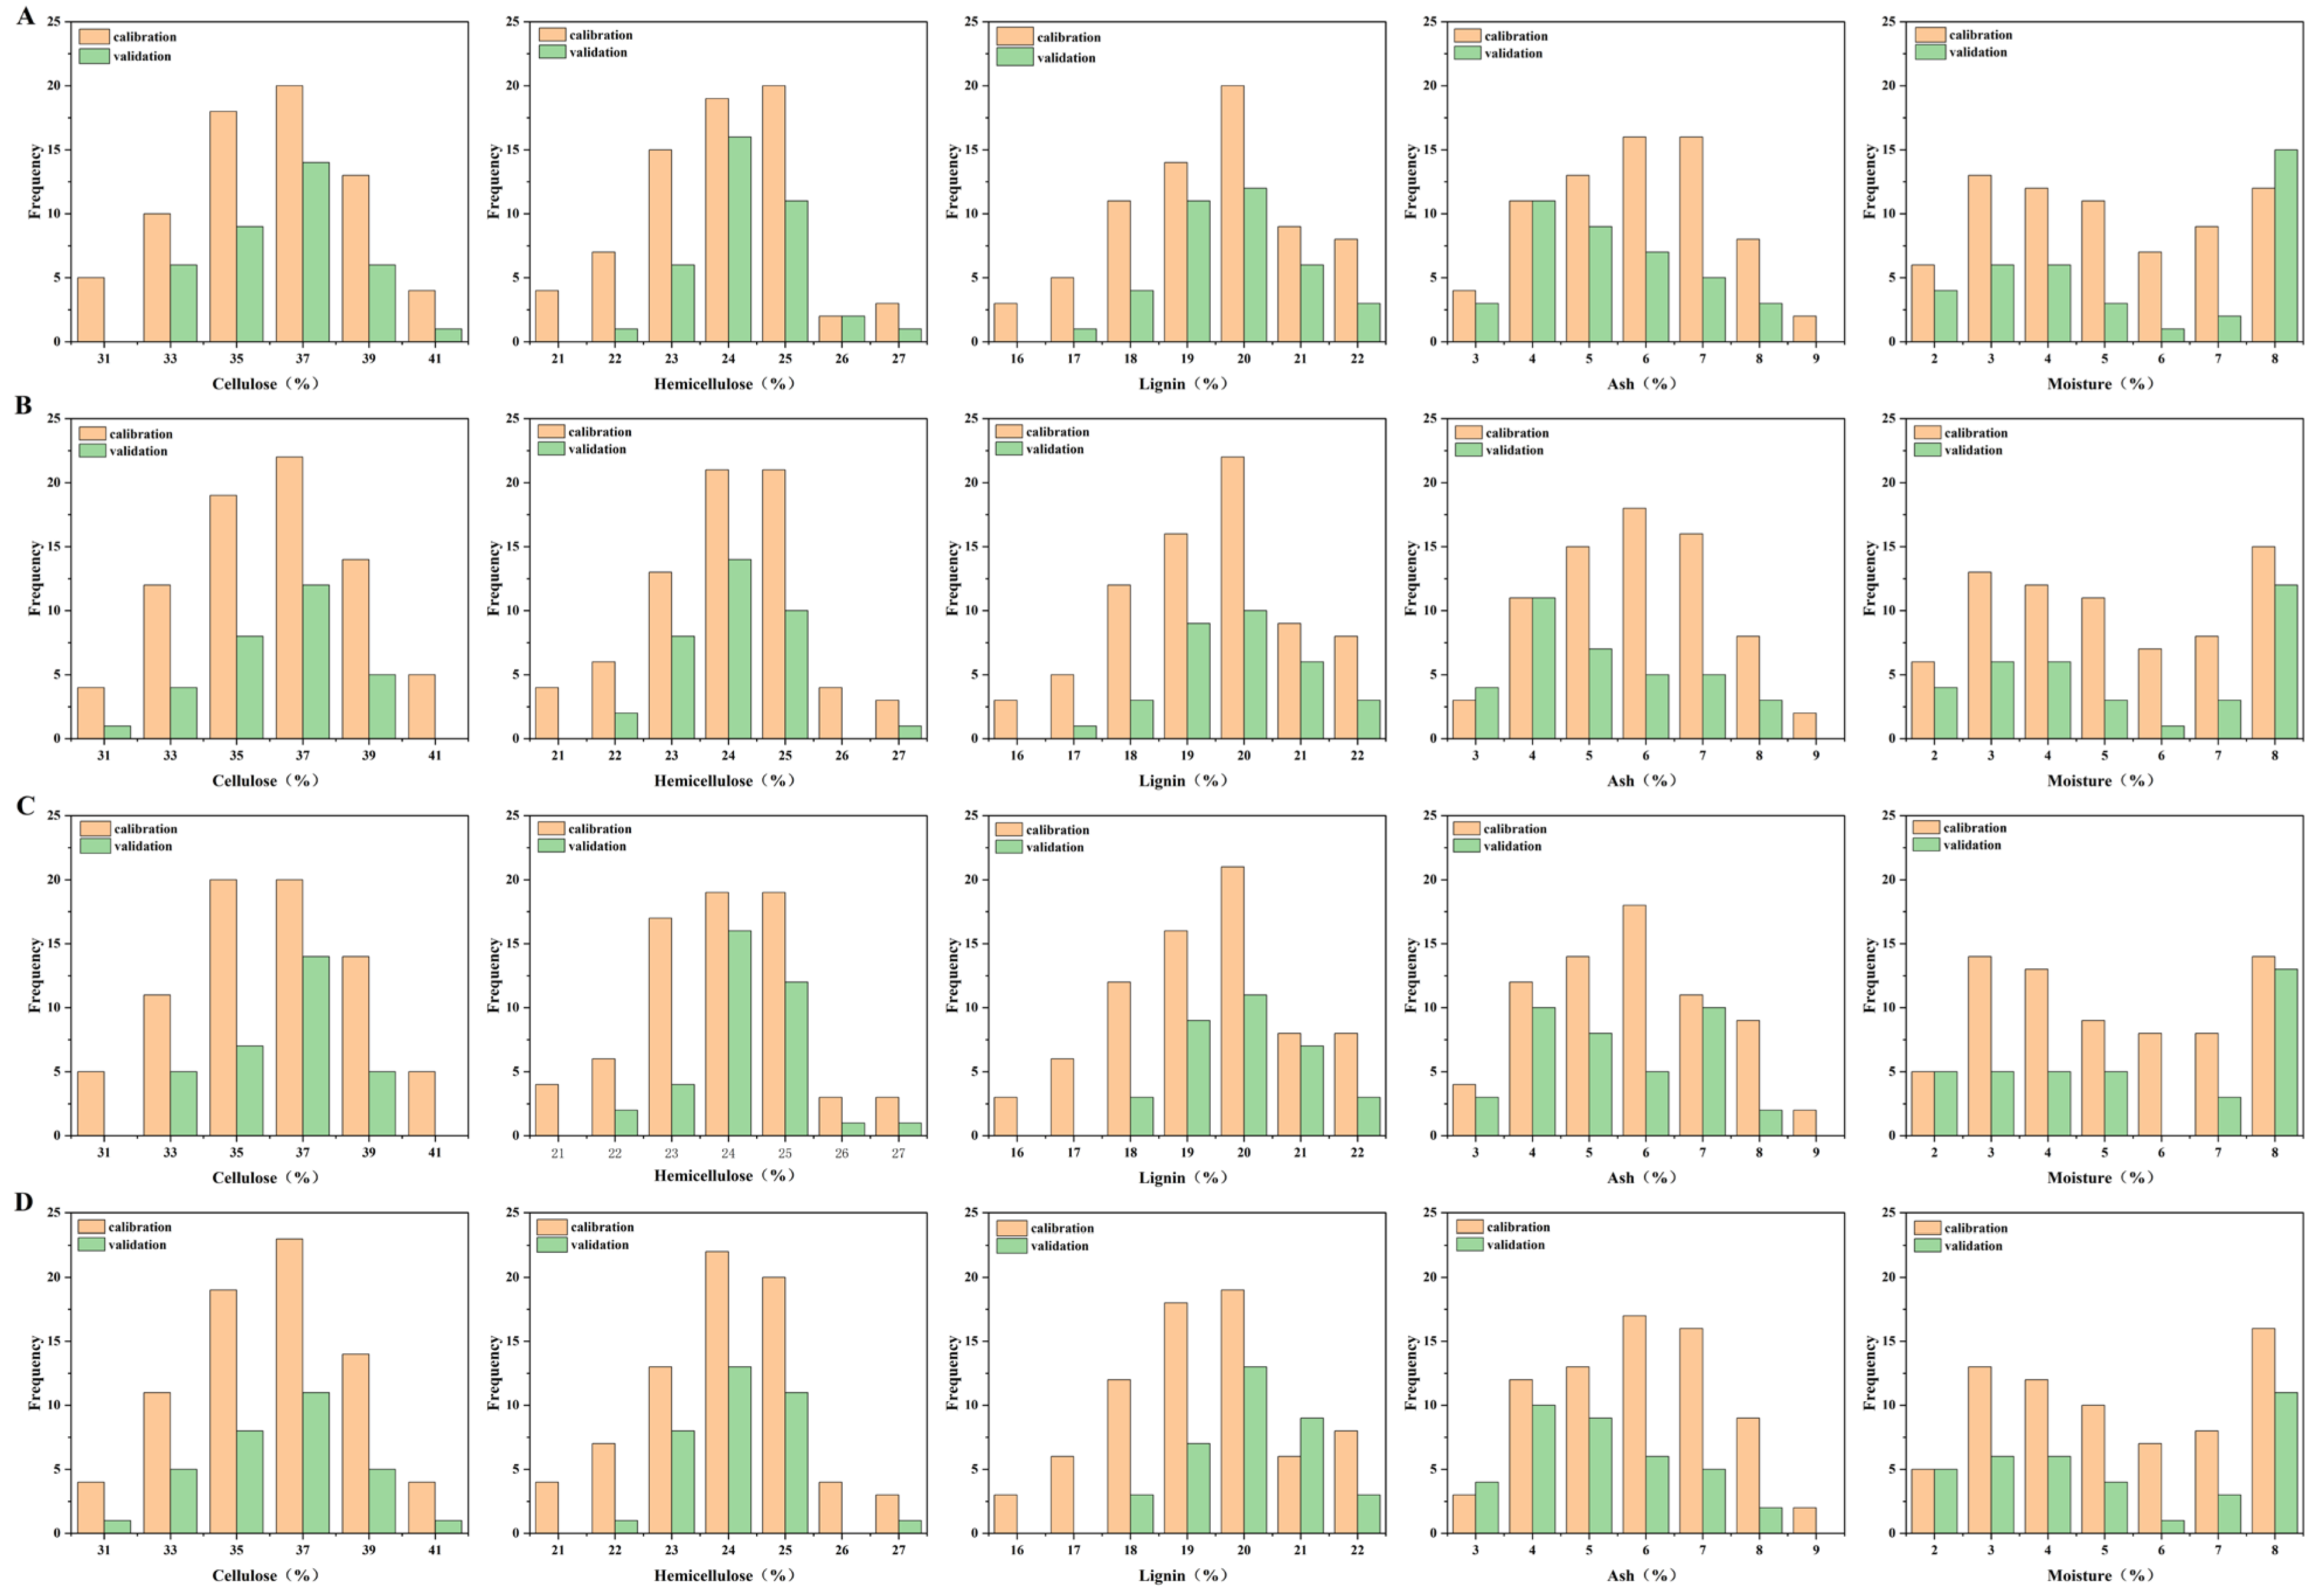
Figure 3A presents the distribution of samples partitioned using the full spectral range (1601 features), whereas
Figure 3B–D illustrate the partitions obtained after applying SPXY to the reduced variable sets selected by CARS, VCPA-GA, and VCPA-IRIV. In all cases, the SPXY algorithm yielded calibration and prediction sets with broad and representative distributions across the range of lignocellulosic component contents studied. Notably, the calibration sets encompass a higher proportion of extreme values and largely envelop the prediction sets in property space, confirming the effective coverage of sample variability.
This distribution pattern demonstrates that SPXY successfully optimizes the representativeness of both subsets, thereby supporting reliable model development and validation of the model. However, when using the full spectrum, an imbalance was observed in the moisture content; the prediction set contained a slightly higher concentration of samples at certain moisture levels than the calibration set. This potential bias was effectively mitigated when SPXY was applied to the feature-reduced datasets generated by the three feature selection algorithms, underscoring the benefit of combining spectral pretreatment with intelligent sample partitioning.
An exception was noted for lignin in the VCPA-IRIV-based partition: the calibration set contained fewer samples than the prediction set within a specific lignin-content range. This underrepresentation may limit the model’s ability to accurately predict lignin in that interval, potentially explaining the relatively lower performance of the VCPA-IRIV-PLS model for this component. In contrast, the CARS- and VCPA-GA-based partitions exhibited more balanced distributions across all target components, contributing to the superior accuracy and robustness of the respective PLS models.
3.5. Quantitative Analysis of NIRS for Lignocellulosic Components
In this study, 15 PLS regression models were developed to predict the contents of cellulose, hemicellulose, lignin, ash, and moisture in
Miscanthus samples. These models were built using spectral feature subsets optimized by three algorithms—CARS, VCPA-GA, and VCPA-IRIV—in combination with sample partitioning via the SPXY algorithm. To ensure robustness and minimize overfitting, all PLS models were validated using 10-fold cross-validation [
36,
37]: the calibration set was divided into 10 subsets, with one subset used as validation data in each iteration while the remaining nine were used for training. The optimal number of latent features for each model was determined by jointly minimizing the RMSEC and RMSECV.
For comparative purposes, five additional PLS models based on the full spectrum (1601 features) were also constructed (
Figure 4). The results demonstrate that all 15 optimized models significantly outperformed their full-spectrum counterparts, exhibiting lower RMSEC (0.18–0.44) and RMSECV (0.43–0.69), higher coefficients of determination for calibration (R
2c = 0.92–0.99) and cross-validation (R
2cv = 0.80–0.96), and improved stability. These findings corroborate our earlier observation—based on component distribution analysis—that modeling performance is closely tied to the representativeness and variability of the sample set. Notably, although ash is typically challenging to predict via NIRS due to its inorganic nature and low concentration in plant biomass [
27,
31], the feature-selection algorithms employed here markedly enhanced ash prediction accuracy, highlighting their effectiveness in extracting subtle but relevant spectral information.
Recent guidelines suggest that a successful multivariate calibration model should achieve a RPD > 3 and an RMSEP/RMSECV ratio between 0.8 and 1.2 [
12,
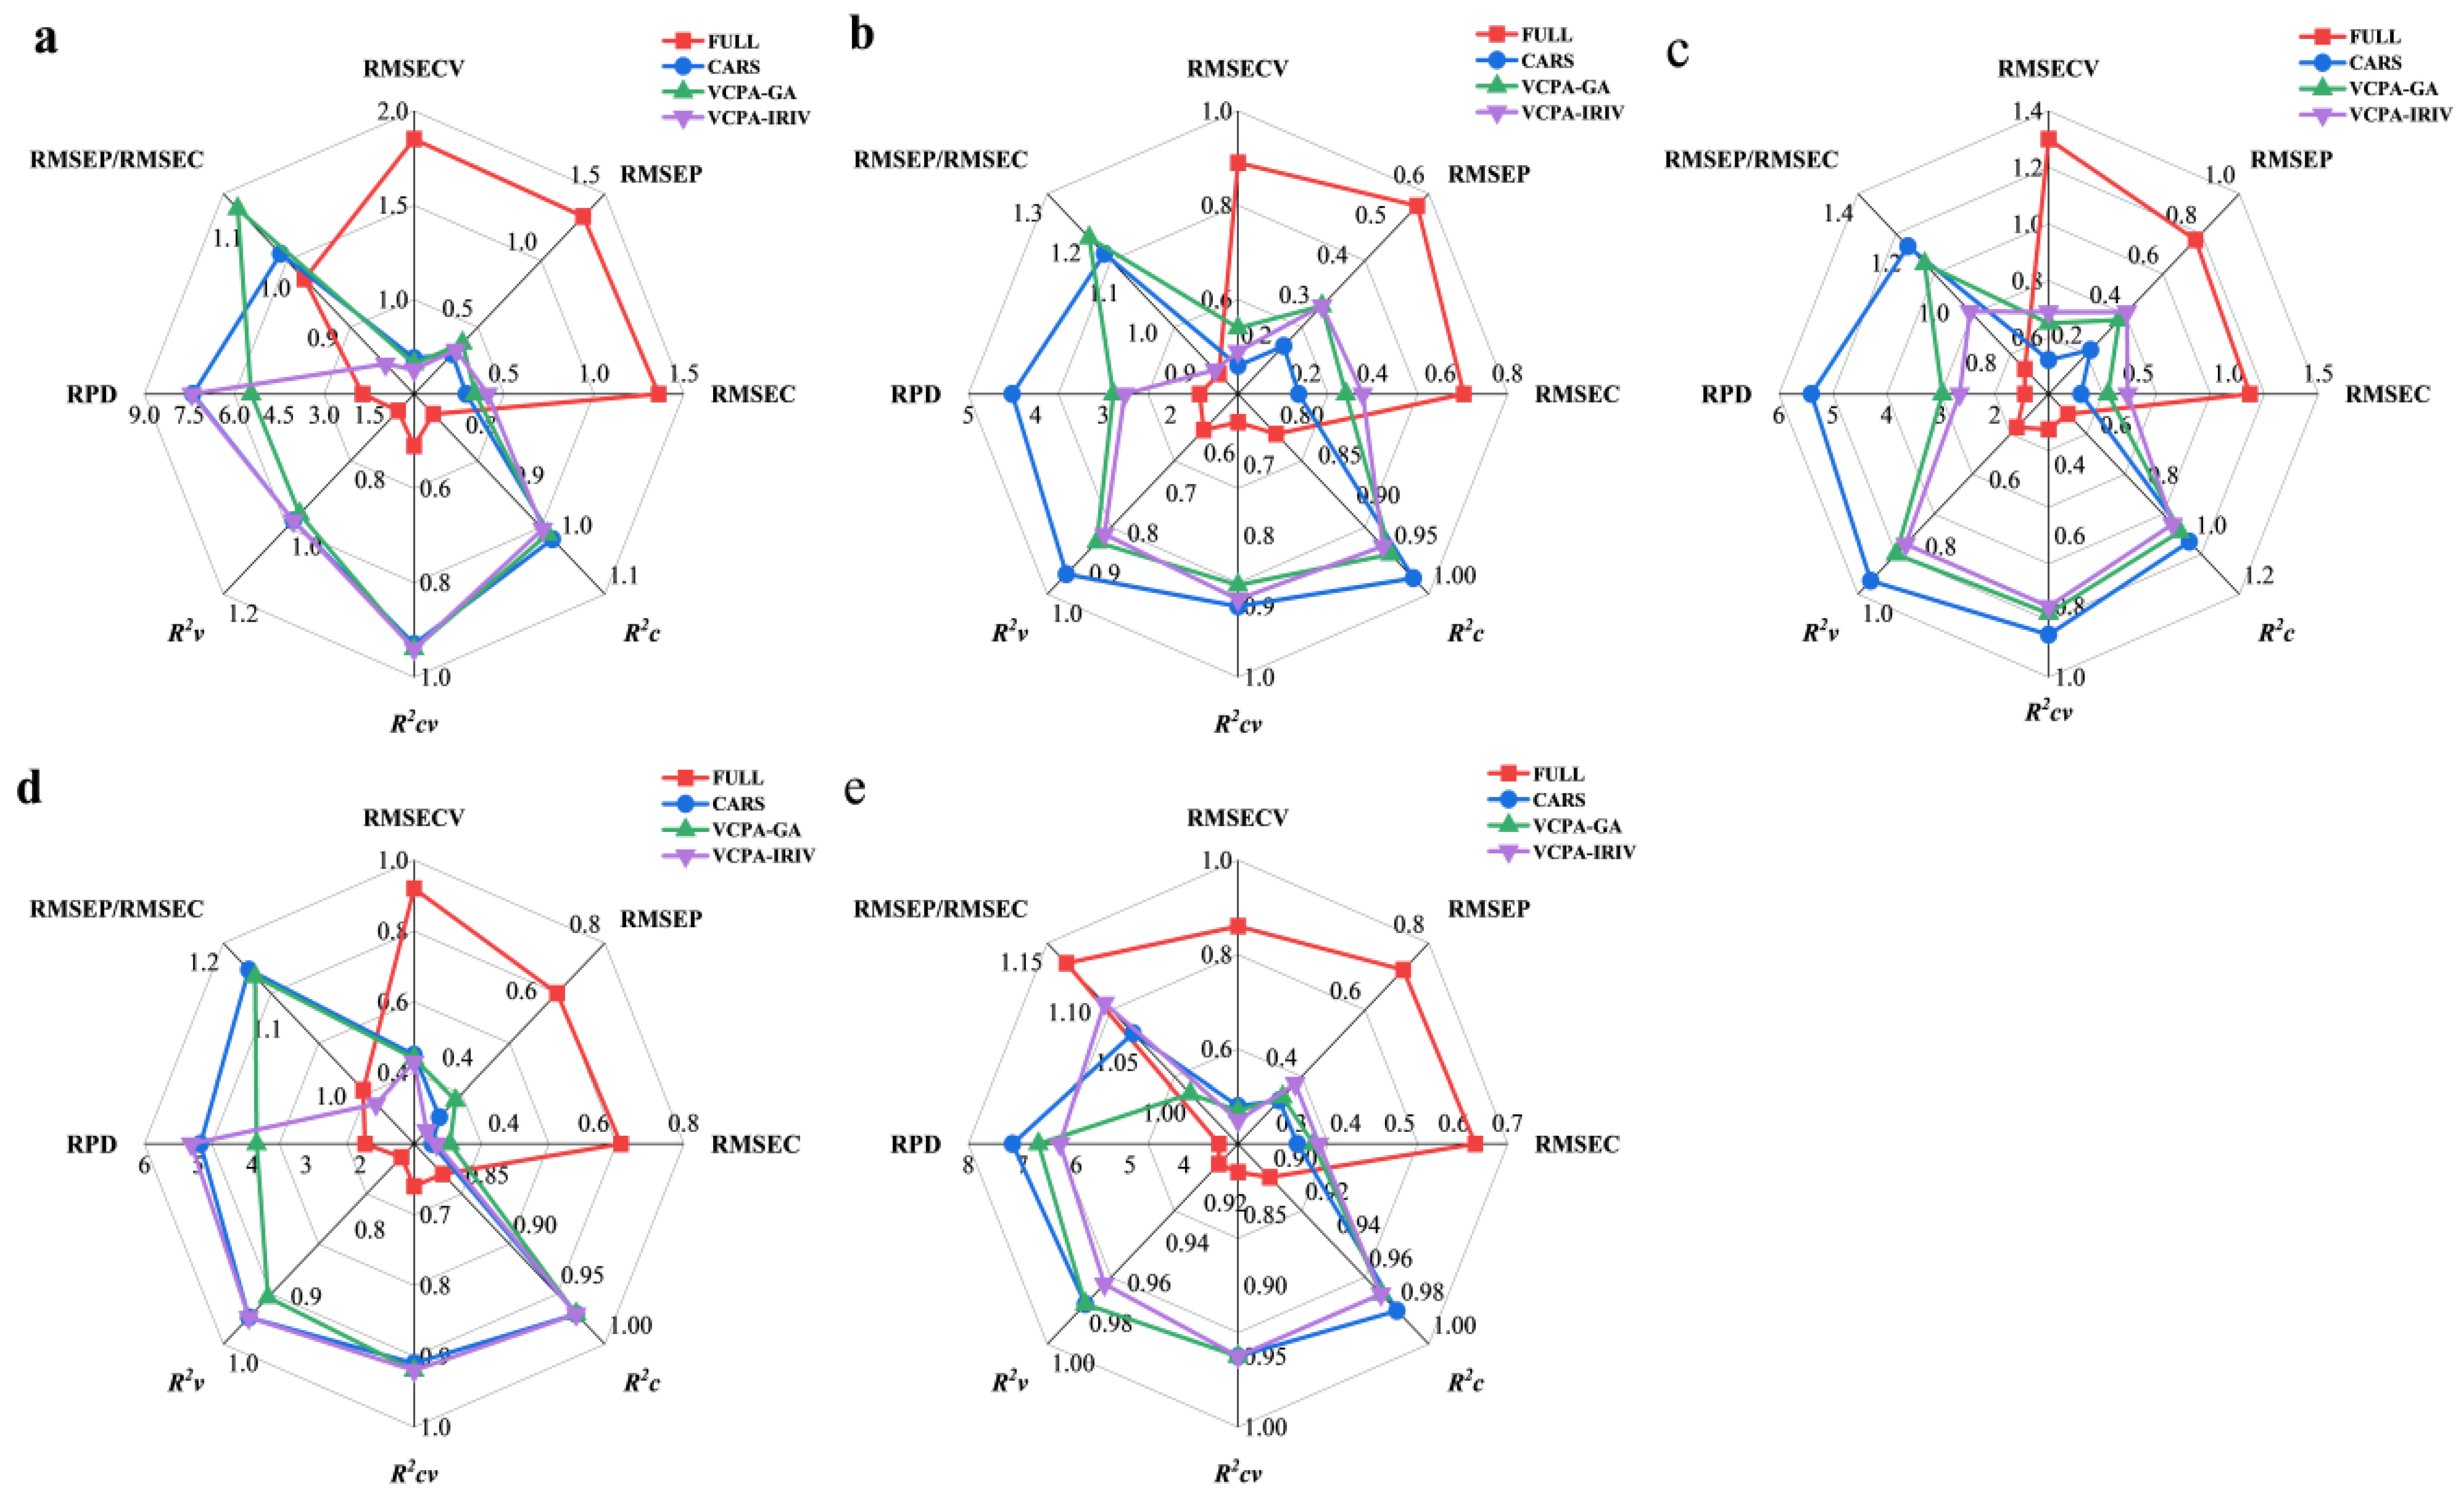
38]. In this study, the optimized PLS models met or approached these benchmarks, indicating strong predictive capability. To facilitate visual comparison of model performance, radar plots were generated for the full-spectrum PLS, CARS-PLS, VCPA-GA-PLS, and VCPA-IRIV-PLS models (
Figure 4). Among the three feature selection strategies, CARS consistently delivered the best overall performance.
As summarized in
Figure 4, the CARS-PLS models achieved the highest predictive accuracy for all components except ash. Specifically, R
2v values ranged from 0.97 to 0.99, RMSECV from 0.43 to 0.69, RMSEC from 0.18 to 0.31, RMSEP from 0.22 to 0.33, and RPD from 4.35 to 7.38—demonstrating excellent calibration and prediction capabilities.
For ash, however, the VCPA-IRIV-PLS model outperformed CARS-PLS despite using only 73 spectral features (4.56% of the original 1601). This indicates that VCPA-IRIV effectively compresses the spectral space while retaining features most relevant to ash prediction. This result aligns with prior findings in black tea ash modeling, where hybrid feature selection methods also proved superior for inorganic components [
38], suggesting that VCPA-IRIV may be particularly well-suited for predicting low-abundance, non-organic components.
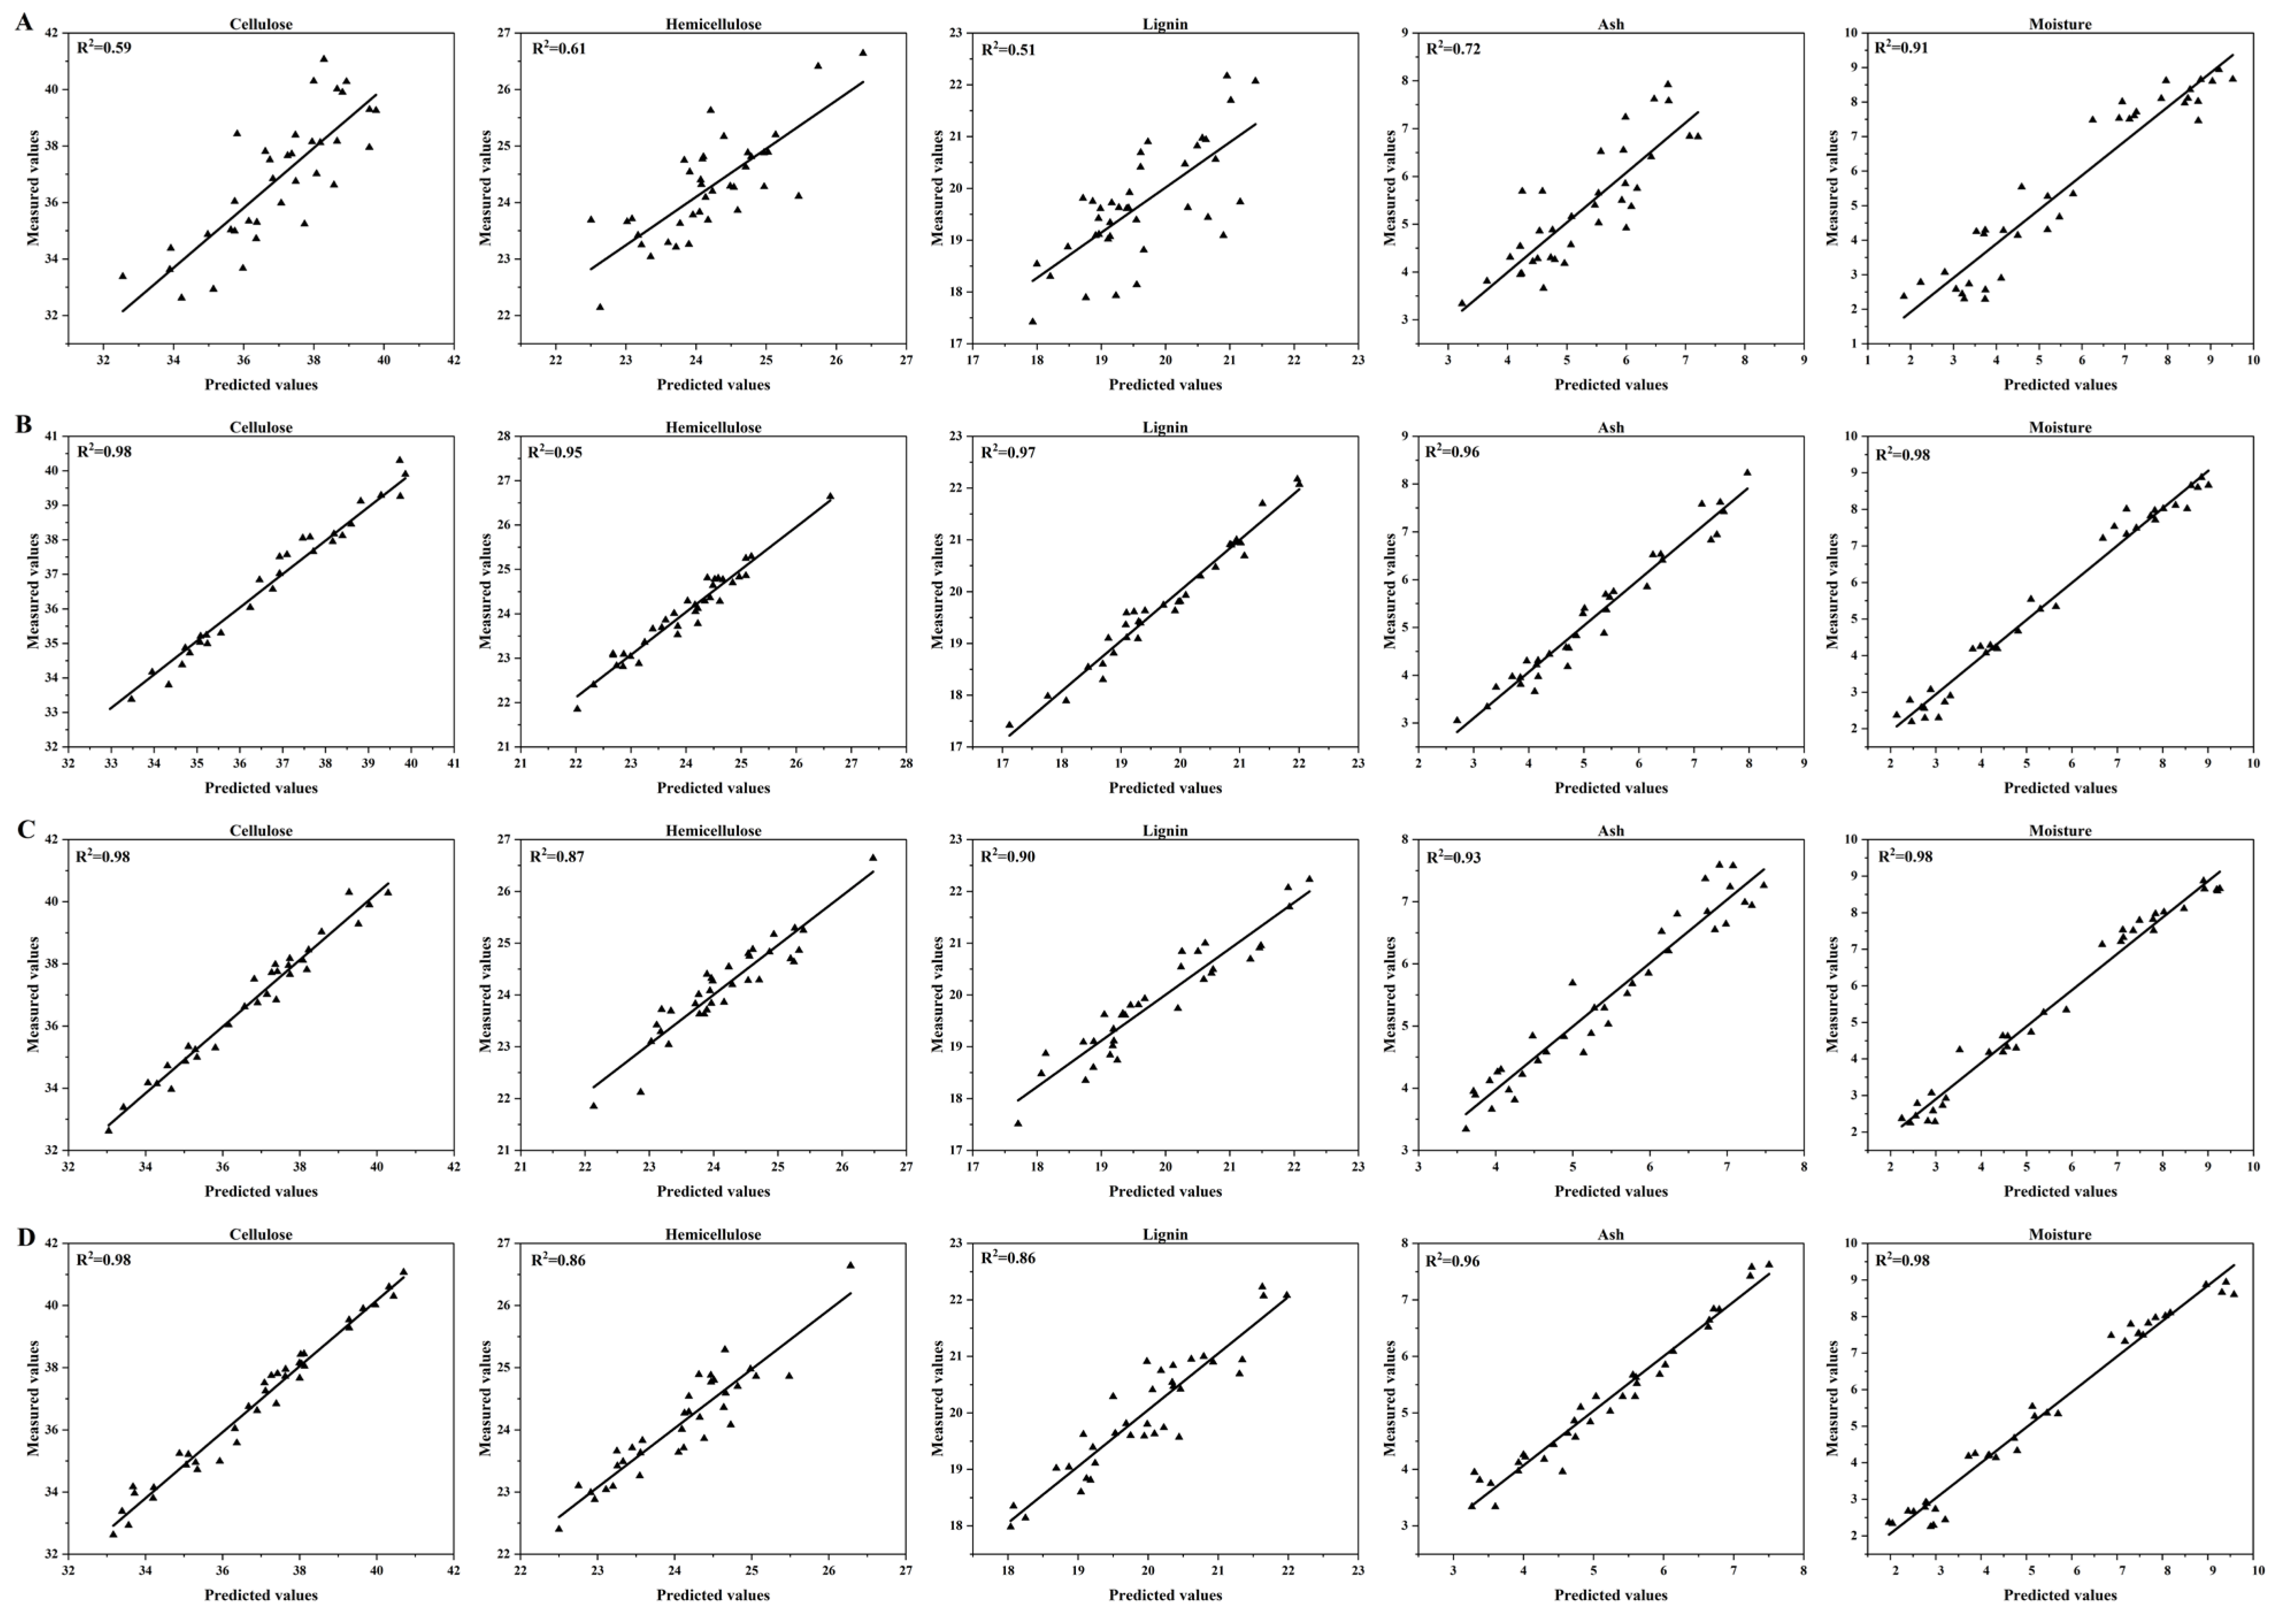
Figure 5 presents the scatter plots of predicted versus measured values, offering a direct visual assessment of the models’ predictive performance. The plots for the CARS-PLS models demonstrate a remarkable level of accuracy, with data points tightly and evenly clustered around the ideal y = x line for all five components. This low dispersion visually confirms the high R
2 and low RMSEP values reported in
Figure 4.
In contrast, while the VCPA-GA and VCPA-IRIV models also show strong correlations, their scatter plots reveal slightly greater dispersion and a few noticeable outliers, particularly for lignin and ash. For instance, the VCPA-IRIV plot for lignin shows several points deviating from the trend line, consistent with its relatively lower RPD value. This visual evidence reinforces that CARS’s feature selection strategy, which retains a robust and highly informative set of features, translates directly into more reliable and accurate predictions across the entire concentration range. The superior fit demonstrated by the CARS-based models in
Figure 5 underscores their robustness and suitability for high-throughput analysis.
In summary, all three variable selection algorithms—CARS, VCPA-GA, and VCPA-IRIV—significantly enhanced the accuracy, robustness, and interpretability of PLS models for lignocellulosic component prediction. The resulting CARS-PLS models (with the exception of ash) provide a reliable, rapid, and non-destructive tool for assessing key biomass traits in Miscanthus samples, supporting their potential use in bioenergy and biorefinery applications.
4. Conclusions
This study successfully demonstrates the potential of NIRS, combined with advanced feature selection algorithms, for the rapid and non-destructive quantitative prediction of key lignocellulosic components, cellulose, hemicellulose, lignin, ash, and moisture, in Miscanthus biomass. Spectral preprocessing using the SD effectively corrected baseline drift and scattering effects, thereby enhancing spectral reproducibility and model robustness.
Among the three feature selection strategies evaluated—CARS, VCPA-GA, and VCPA-IRIV—all yielded highly accurate and stable PLS models, with coefficients of determination (R2v) exceeding 0.80 for all target components. Notably, the CARS-PLS model exhibited superior predictive performance for cellulose, hemicellulose, lignin, and moisture, achieving high R2v (>0.95) and residual predictive deviation (RPD > 4.3) values, confirming that the features selected by CARS are highly informative for lignocellulose quantification. For ash prediction, the VCPA-IRIV-PLS model performed best, underscoring the importance of algorithm selection depending on the chemical nature of the target component.
Overall, this work establishes a reliable, rapid, and non-destructive NIRS-based analytical framework for assessing lignocellulosic composition in Miscanthus biomass. The developed models offer a practical tool for high-throughput phenotyping, enabling efficient screening of superior germplasm and accelerating breeding programs aimed at optimizing biomass quality for bioenergy and biorefinery applications.


