Article

Urea-N Activated Biochar Effectively Suppresses CO2 and N2O Emissions from Farmland Soil

1
School of Mechatronics and Vehicle Engineering, Chongqing Jiaotong University, Chongqing 400074, China
2
Key Laboratory of Crop Drought Resistance Research of Hebei Province, Institute of Dryland Farming, Hebei Academy of Agriculture and Forestry Sciences, Hengshui 053000, China
3
College of Sericulture, Textile and Biomass Sciences, Southwest University, Chongqing 400715, China
4
College of Water Resources and Civil Engineering, China Agricultural University, Beijing 100083, China
*
Authors to whom correspondence should be addressed.
These authors contributed equally to this work.
Agronomy 2025, 15(11), 2655; https://doi.org/10.3390/agronomy15112655
Submission received: 20 August 2025 / Revised: 12 November 2025 / Accepted: 14 November 2025 / Published: 19 November 2025
(This article belongs to the Special Issue Crop Management in Water-Limited Cropping Systems)

Abstract

The inconsistent efficacy of biochar in mitigating agricultural greenhouse gas emissions remains a major barrier to its widespread adoption and the realization of its environmental benefits. This study aimed to develop a stable and efficient mitigation strategy by optimizing biochar physicochemical properties through urea-N activation (corn stover: urea mass ratios of 5:1 and 15:1). Five treatments were established: CK (control), GC (fertilization), GB (fertilization + raw biochar), GAB5 (fertilization + low-N activated biochar), and GAB15 (fertilization + high-N activated biochar). Mechanisms were elucidated by monitoring soil profile (0–20 cm) gas concentrations and surface fluxes, combined with a comprehensive analysis of soil physicochemical properties, enzyme activities, and microbial biomass. Results demonstrated that activated biochar, particularly GAB15, significantly reduced cumulative CO2 (9.4%, p < 0.05) and N2O (45.2%, p < 0.05) emissions and their concentrations in the 0–10 cm layer. This superior efficacy was linked to profound improvements in key soil properties: GAB15 significantly enhanced soil cation exchange capacity (CEC, increased by 17.3%, p < 0.05), NH4+-N content (increased by 88.2%, p < 0.05), Mean Weight Diameter (MWD, increased by 13.0%), the content of water-stable aggregates > 0.25 mm (R>0.25mm, increased by 57.3%) (p < 0.05), dissolved organic carbon (DOC), and the MBC (microbial biomass carbon)/MBN (soil microbial biomass nitrogen) ratio. Redundancy analysis (RDA) and structural equation modeling (SEM) revealed core mechanisms: CO2 mitigation primarily stemmed from the physical protection of organic carbon within macroaggregates and a negative priming effect induced by an elevated MBC/MBN ratio; N2O mitigation was attributed to weakened nitrogen mineralization due to enhanced aggregate stability and reduced substrate (inorganic N) availability for nitrification/denitrification via strong adsorption at the biochar–soil interface. This study confirms that urea-activated biochar produced at a 15:1 corn stover-to-urea mass ratio (GAB15) effectively overcomes the inconsistent efficacy of conventional biochar by targeted physicochemical optimization, offering a promising and technically feasible approach for mitigating agricultural greenhouse gas emissions.

1. Introduction

Biochar, a multifunctional soil amendment, holds immense promise for enhancing soil health, promoting carbon sequestration, and advancing sustainable agricultural development. Its porous structure and rich surface functional groups can improve nutrient retention, water-holding capacity, aggregate formation, and directly influence microbial community structure and activity [1,2,3]. Crucially, biochar exhibits significant potential in regulating soil carbon and nitrogen cycling and mitigating greenhouse gas (GHG) emissions such as CO2 and N2O, offering a nature-based solution to climate change mitigation [4,5,6,7].
However, a critical bottleneck hinders the practical application of biochar in farmland: its efficacy in regulating soil GHG emissions, particularly CO2 and N2O, is characterized by high inconsistency and instability. Meta-analyses and field studies consistently report that biochar application reduces N2O emissions from agricultural soils, with reductions typically ranging from 13% to 48% depending on application rate, biochar type, and soil conditions [8,9,10]. The mitigation effect is most pronounced in acidic and sandy soils, and with biochars produced at lower pyrolysis temperatures or from specific feedstocks (e.g., straw, wood) [11,12,13]. Mechanistically, biochar enhances the abundance of N2O-reducing genes (e.g., nosZ), increases soil pH, and alters denitrification and nitrification processes. The impact of biochar on CO2 emissions is more variable. Some studies report reductions in cumulative CO2 flux, particularly in clay or acidic soils and under certain application rates [14,15,16]. However, other studies observe increases in CO2 emissions, especially in the short term or when biochar is combined with nitrogen fertilizers or applied to soils with high microbial activity [5,17,18]. The variability is attributed to differences in biochar properties, soil type, moisture, and management practices [19,20,21,22]. Biochar’s mitigation of N2O and CO2 emissions is mediated by several mechanisms: (1) increasing soil pH and cation exchange capacity, (2) enhancing soil structure and porosity, (3) altering microbial community composition and functional gene abundance, and (4) affecting nutrient cycling and retention [23,24]. Key influencing factors include biochar feedstock, pyrolysis temperature, application rate, soil texture, pH, and climate [25,26,27]. This uncertainty is not merely a scientific puzzle; it severely undermines the confidence of farmers, policymakers, and industries in investing in and scaling up biochar technology, limiting the reliable realization of its environmental benefits and full economic potential in real-world agricultural settings.
The root of this inconsistency lies in the complex and bidirectional effects of biochar on soil carbon and nitrogen metabolism: On one hand, biochar can sequester organic matter and inorganic nutrients via adsorption, enhance aggregate stability, and create microenvironments less conducive to aerobic decomposition or nitrification/denitrification [28,29,30,31]. On the other hand, the introduction of exogenous carbon or improved aeration may also stimulate microbial activity, accelerating mineralization processes and potentially increasing emissions in the short term [32,33,34]. Furthermore, the significant variability in biochar’s inherent physicochemical properties—such as porosity, specific surface area (SSA), surface functional groups, pH, and ash content—is a core factor driving performance heterogeneity [31,35]. These properties are highly dependent on biomass feedstock and pyrolysis conditions, especially temperature. For instance, biochar produced at low temperatures (<500 °C) is typically acidic with higher nutrient content, but its mitigation efficiency is constrained by soil conditions [36]. Conversely, high-temperature (>600 °C) pyrolysis yields alkaline biochar with well-developed pore structure and high SSA, often demonstrating superior efficiency in mitigating CO2 and N2O emissions [37]. Critically, the “aging” process of biochar in soil continuously alters its properties (e.g., declining adsorption capacity, surface oxidation, decreasing pH), leading to the gradual attenuation of its initial mitigation effects over time, thereby exacerbating application inconsistency [38].
Addressing these challenges, post-production “activation” processes are widely regarded as a key strategy to optimize biochar’s physicochemical properties and enhance its functional stability. Current research focuses on using alkaline activating agents (e.g., KOH, NaOH) or nitrogen-rich substances (e.g., urea) to augment biochar’s pore structure, SSA, surface functional groups (particularly nitrogen-containing groups), and adsorption capacity [39,40,41,42,43]. Among these, urea activation is particularly promising for agricultural applications due to its cost-effectiveness, operational simplicity, and the potential to introduce nitrogen nutrients. However, a critical parameter of this technology—the optimal biomass-to-urea mass ratio (nitrogen concentration)—lacks systematic investigation and clear standards. Suboptimal ratios may result in insufficient activation (limited performance enhancement) or excessive nitrogen loading (potential environmental risks), creating a bottleneck for the standardization and large-scale deployment of activated-biochar technology. The optimal urea-to-biomass ratio for maximizing CO2 capture varies, but studies suggest that ratios yielding 4–5% nitrogen content in biochar are effective [44,45,46]. Nitrogen-doping can improve CO2 capture but must be balanced to avoid negative environmental impacts, such as nitrogen leaching or emissions. Therefore, exploring the optimal urea-N activation ratio to directionally tune key biochar properties (e.g., CEC, pore structure, surface chemistry) for stable and efficient mitigation performance holds significant scientific and practical value.
Building upon this background, it was hypothesized that 4% nitrogen content in biochar optimizes corn stover biochar’s physicochemical properties (e.g., surface area, CEC, N-functional groups), thereby enhancing soil aggregate stability, regulating C/N availability, and inducing negative priming effects to stably mitigate CO2/N2O emissions. To test this hypothesis the study aiming to achieve three core objectives: (a) Quantify the effects of urea-N activated biochar (GAB5 vs. GAB15) on soil physicochemical and biological traits; (b) Uncover dominant mechanisms of CO2/N2O mitigation by activated biochar (focusing on GAB15), emphasizing aggregate protection, adsorption, negative priming, and substrate limitation; (c) Establish an optimal urea activation ratio to maximize GHG mitigation efficiency in farmland.
This research not only seeks to unravel the mitigation mechanisms of activated biochar but also aims to provide a robust scientific foundation for the standardized and scalable application of biochar technology in sustainable agriculture and climate change mitigation.

2. Materials and Methods

2.1. Description of the Study Area

This experiment was conducted in a greenhouse at the Tongzhou Experimental Station of China Agricultural University, China (latitude: 39°42′07.8″ N, longitude: 116°41′48.0″ E), spanning from June to September 2020. The experiment was conducted in a greenhouse with an area of approximately 40 m2, which was well-ventilated. The air temperature and humidity inside the greenhouse were similar to those of the outdoor environment, with the primary purpose of using the greenhouse being to control the soil moisture in the experimental area. The greenhouse ensured adequate ventilation, with daytime temperatures maintained between 22 °C and 25 °C, and nighttime temperatures between 15 °C and 18 °C. During the experiment, the average daily sunlight duration was approximately 13.5 h, and the average daily humidity was about 73%. The greenhouse soil in the 0–20 cm depth was detected to be loam soil (9.6% clay, 52.6% silt, and 37.8% sand), which has a pH of 7.26, SOC of 29.71 g kg−1, SON of 2.3 g kg−1, NH4+-N of 6.48 × 10⁻³ g kg−1, NO3-N of 28.00 × 10⁻³ g kg−1, available K of 38.14 × 10⁻³ g kg−1, and available P of 1.70 × 10⁻³ g kg−1.

2.2. Biochar Preparation and Experimental Design

The anaerobic pyrolysis method was used to prepare the biochar. Maize straw, collected from the Tongzhou Experimental Station of China Agricultural University, was first soaked in distilled water to remove impurities and then oven-dried. This study employs urea activation with the core objectives of “surface modification” and “functionalization.” By introducing a rich array of nitrogen-containing functional groups, the adsorption capacity of biochar was significantly enhanced. Due to the limited pore-expanding ability of urea, KOH was used in this study. KOH activation greatly increased the internal and external surface area of the biochar, allowing the nitrogen-containing functional groups introduced during the urea modification phase to be more exposed, facilitating better interaction with target adsorbates. To highlight the differences in urea activation, a gradient of urea addition was set (a mass ratio of urea to straw residue of 5:1 (AB5) or 15:1 (AB15)), and it should be noted that KOH was added solely to amplify the activation effect of urea. The overall biochar activation process consists of two steps. The first step is urea modification. Mix urea (99.0 wt%) with straw residue at a mass ratio of urea to straw residue of 5:1 (AB5) or 15:1 (AB15). Add an appropriate amount of deionized water, immerse for 12 h, and then dry in a blast drying oven at 105 °C. Place the dried straw residue in a tube furnace, heat it to 600 °C at a rate of 10 °C/min under a N2 atmosphere (flow rate of 100 mL/min) for 0.5 h, and then allow it to cool naturally. After cooling, rinse the sample repeatedly with deionized water to remove impurities. Finally, place it in a blast drying oven at a constant temperature of 105 °C for later use. The second step was KOH activation. Immerse the urea-modified sample in a KOH solution (85.0 wt%, mass ratio KOH/sample = 4.0), stir for 0.5 h, and then immerse for 12 h. Transfer to a constant temperature drying oven at 105 °C for drying. Subsequently, place the sample in a tube furnace for activation and heat it to the predetermined temperatures (800 °C) at a rate of 10 °C/min under a N2 atmosphere (flow rate of 100 mL/min) for 1 h. After cooling to room temperature, take out the sample. The chemical and physical properties of the biochar are shown in Table 1 and Figure 1.
The experimental units consisted of a cuboid plexiglass column (15 cm × 15 cm × 35 cm, length × width × height) fitted with a bottom outlet connected to drainage tubing (Ø = 3 cm) (Figure 1). Each column with 20 replicates was placed in a randomized pattern. For each sampling period, three pots were randomly selected for destructive sampling, which was used for soil biochemical analysis. The plexiglass column was filled with loam soil, air-dried, and sieved to 2 mm. One maize seedling, Zhengdan 958, was planted in each experimental unit. This experiment employs drip irrigation, setting the field’s water-holding capacity at 75% as the maximum threshold for irrigation and establishing an irrigation cycle of 5 days.
Organic fertilizer (N + P2O5 + K2O ≥ 10%, organic matter > 50%) was used as the base fertilizer, with an application rate of 8 g per plant. Urea (total nitrogen ≥ 46%) was administered on three occasions: 14 July, 3 August, and 27 August, with an application rate of 10 g per plant each time. The following treatments were applied: (a) AB15 at 3% (w/w) was applied in the 0–10 cm soil layer. The air-dried soil was in a 0–30 cm soil layer mixed with organic fertilizer (GAB15); (b) AB5 at 3% (w/w) was applied in the 0–10 cm soil layer, and the air-dried soil was in a 0–30 cm soil layer mixed with organic fertilizer (GAB5); (c) biochar (without activation) at 3% (w/w) was applied in the 0–10 cm soil layer, and the air-dried soil was in a 0–30 cm soil layer mixed with organic fertilizer. (GB); (d) The air-dried soil was in a 0–30 cm soil layer mixed with organic fertilizer without biochar amendment (GC); (e) The air-dried soil was in a 0–30 cm soil layer without biochar or organic fertilizer application (CK), and during the experiment, drip irrigation was used for irrigation.

2.3. Gas Sample Collection and Analysis

2.3.1. Gas Emissions from a Soil Profile

Holes were made at depths of 5 cm and 15 cm in the soil column, and gas sampling tubes (10 cm in length, 10 mm in diameter) were inserted to a depth of 7.5 cm. The walls of the sampling tubes inside the soil column were uniformly perforated (hole diameter 0.5 mm) and wrapped with a 40 μm nylon filter membrane (Whatman, Maidstone, UK) to prevent clogging by particulates. At the point where the sampling tube exits the soil column, double-layer silicone rubber seals were used, and the sampling end of the tube was connected to a three-way valve. Prior to sampling, the system was flushed three times the dead volume using a 50 mL syringe, then the valve was closed and left for 10 min to allow soil gas to re-equilibrate. The formal sampling volume was 20 mL. The CO2 and N2O emissions in the soil profile (0–20 cm) were calculated based on both aqueous and gaseous phases of N2O in the soil profile. For each sampling event, the aqueous phase of CO2/N2O (0–20 cm) column was calculated by multiplying soil water content (v/v) with solubility (Henry’s law) constants of 1.195 for CO2 and 0.882 for N2O at 25 °C [47].
The gaseous phase was the CO2/N2O concentration measured at depths of 5 and 15 cm multiplied by the corresponding atmospheric volume of the soil layer. The atmospheric volume was calculated by subtracting volumetric water content (VWC) from soil porosity. Thus, the soil profile accumulation was estimated as the sum of the aqueous and gaseous CO2/N2O phases. The sampling period was approximately 2 to 4 days.

2.3.2. Surface Emissions

The CO2/N2O fluxes were measured in every column using the static closed chamber method. Briefly, a removable cover (12 cm in diameter, 50 cm in height) and a soil ring without a top and bottom (12 cm in diameter, 30 cm in height) were used. The removable cover was designed to ensure it could cover the surface soil and must be tall enough to exceed the maximum growth height of the corn tassels. Due to experimental conditions, the corn tassels in this study did not exceed 50 cm in height. A soil ring was inserted 5 cm into the soil at each sample position. Gas samples (three replicates of one treatment) were collected at four-time intervals (0, 10, 20, and 30 min) using 20 mL plastic syringes. CO2 concentration was analyzed using a GC-FID (Agilent 7890A, Agilent Technologies, Santa Clara, CA, USA) equipped with a methanizer (350 °C) and an HP-PLOT/Q column, with a calibration range of 100–10,000 ppm. N2O concentration was analyzed using a GC-ECD (Agilent Technologies, Santa Clara, CA, USA) and a Porapak-Q column, with a calibration range of 0.1–100 ppm. The detector temperatures were 250 °C (FID) and 300 °C (ECD), respectively. Daily emissions were calculated using the following equation:
F = ρ × V/A × (dc/dt) × 273/(273 + T)
where F is the N2O flux (g m−2 h−1), ρ is the density of the gas in a standardized state (g m−3), V is the volume of the chamber (m3), A is the cross-sectional area of the chamber (m2), dc/dt is the rate of gas accumulation (μg m−3 h−1), and T is the chamber temperature (°C). In addition, to minimize pressure changes during the static chamber sampling process, a pressure balance tube was installed on the chamber to ensure that the internal and external pressures remained balanced when gas samples were extracted, preventing soil gases from being passively drawn out due to negative pressure, which could otherwise overestimate the emission flux. Considering that the internal temperature of the static chamber may rise during the sampling period (especially under sunlight), a white plastic membrane with a reflective insulation layer was used to cover the chamber during each sampling to reduce solar radiation-induced temperature increase. Additionally, the temperature (T) used in Equation (1) is the average value measured multiple times during the 30 min sampling period, which helps to correct for calculation errors caused by small temperature differences.

2.4. Soil Sample Collection and Analyses

Soil samples were collected on the 20th, 40th, and 60th days after sowing (DAS20, DAS40, and DAS60). Then, all collected soil samples were air-dried and passed through a 2 mm sieve. Soil dissolve organic carbon (DOC), pH, CEC, and NH4+-N were analyzed at DAS20, DAS40, and DAS60. In addition, it analyzed the microbial biomass at DAS60.
The Brunauer–Emmett–Teller (BET) surface area, pore volume (micropore), and micropore diameter were determined using a Trustar II 3020 (Micromeritics Instrument Corp., Norcross, GA, USA). FTIR spectroscopy was performed using an FTIR spectrometer (NEXUS 670, Thermo Fisher Nicolet, Waltham, MA, USA). Soil pH values were determined using a pH electrode (Orion 420Aplus, Thermo Fisher Scientific, Waltham, MA, USA). The cationic exchange capacity (CEC) was determined using the sodium acetate flame photometric method.
The DOC was measured using a TOC-1020A organic carbon analyzer (Elementar Analysensysteme GmbH, Langenselbold, Germany). Specifically, 10 g of air-dried soil samples, which had passed through a 2 mm sieve, were weighed and dissolved in distilled water at a water-to-soil ratio of 2:1. After shaking the mixture at a constant temperature of 25 °C for 30 min, the filtrate was filtered using a 0.45 μm filter membrane and directly analyzed using the TOC-1020A organic carbon analyzer.
Soil nitrate (NH4+ and NO3) was analyzed using a Skalar San++ continuous flow analyzer (Skalar Analytical B.V., Breda, The Netherlands), after taking 5 g of fresh soil samples and shaking them with a 2 M KCl extracting solution at a 1:10 ratio.
The β-glucosidase activity was assayed using a hydrolysis method with salicylic acid as the substrate. Specifically, 1.5 mL of a 0.5% salicylic acid solution and 0.5 mL of enzyme extract were combined in a 25 mL stoppered test tube and incubated at 37 °C for 1 h. Upon removal from the water bath, 1.5 mL of DNS reagent was immediately added to the test tube to terminate the enzymatic reaction, followed by thorough mixing. The mixture was then boiled in a boiling water bath for 5 min, cooled, diluted to 25 mL with distilled water, mixed thoroughly, and the absorbance of the resulting solution was measured at a wavelength of 540 nm.
Urease activity was determined according to previous study [48]. Briefly, 1 g of soil was mixed with a 10% (w/v) urea solution in 20 milliliters of pH 6.7 citrate buffer. The mixture was then incubated at 37 ± 0.1 °C for 24 h. Subsequently, the ammonium-nitrogen (NH4+-N) concentration was measured spectrophotometrically.
Soil microbial biomass carbon (MBC) and soil microbial biomass nitrogen (MBN) were determined by the chloroform fumigation extraction method [49]. In brief, 20 g of both chloroform-fumigated and unfumigated fresh soil were extracted with 0.5 M K2SO4. After agitation for 30 min, the concentrations of carbon and nitrogen in the extracts were measured using a Phoenix 8000 Carbon Autoanalyzer (Tekmar–Dohrmann, Cincinnati, OH, USA) and a flow-injection nitrogen analyzer, respectively (FIAstar 5000, FOSS, Hillerød, Denmark).
The β-glucosidase activity was assessed using the method of Alef [50]. Briefly, 1 g of moist soil, equivalent to 55% water-holding capacity (WHC), was placed in a flask with 0.25 mL of toluene, 4 mL of buffer, and 1 mL of p-nitrophenyl glucoside (PNG) solution. The mixture was incubated at 37 °C for one hour. Subsequently, 1 mL of CaCl2 and 4 mL of Tris buffer (pH 12) were added, mixed, and filtered. The absorbance was measured at 400 nm using a spectrophotometer, and the final quantity of p-nitrophenol was calculated using a standard calibration curve.
Soil alkaline phosphatase activity is measured using a spectrophotometer method [51]. Briefly, 1 g of moist soil with a water-holding capacity (WHC) of 55% was placed in a flask along with 0.25 mL of toluene, 4 mL of buffer, and 1 mL of a 15 mM pNPP solution. The mixture was incubated at 37 °C for one hour. Subsequently, 1 mL of 0.5 M CaCl2 and 4 mL of 0.5 M NaOH were added, mixed thoroughly, filtered, and the absorbance at 400 nm was measured using a spectrophotometer.
All enzyme activity assays were performed in triplicate. For each assay, corresponding blank controls (reaction mixture without soil sample) were included to correct for non-enzymatic reactions and background absorbance of the reagents. The detection limits for urease, β-glucosidase, and alkaline phosphatase activities under our experimental conditions were 0.02 mg NH4+-N g−1 24 h−1, 0.8 nmol p-nitrophenol g−1 h−1, and 0.15 μg p-nitrophenol g−1 h−1, respectively. The inter-assay coefficients of variation (CVs) were maintained below 8% to ensure the reproducibility and stability of the results.

2.5. SEM and RDA

Based on previous studies and the hypotheses of this research, two independent theoretical models were preset to separately explain the emission pathways of CO2 and N2O. The CO2 emission model aims to test how soil moisture (SM), mean weight diameter (MWD), and their effects on microbial carbon-to-nitrogen ratio (MBC/MBN, C/N), dissolved organic carbon (DOC), β-glucosidase activity (β-gl), and gas diffusion coefficient (Ds/D0) ultimately influence CO2 emissions.
The N2O emission model aims to test how soil moisture (SM) and the proportion of water-stable aggregates greater than 0.25 mm (R>0.25mm) influence N2O emissions through their effects on soil ammonium-nitrogen content (NH4+-N), microbial carbon-to-nitrogen ratio (C/N), alkaline phosphatase activity (alkaline phosphatase, alp), and gas diffusion coefficient (Ds/D0).
The sample size for this study was N = 297. The maximum likelihood method was used for parameter estimation. The model’s goodness-of-fit was comprehensively evaluated using the following indicators: chi-square value (χ2), degrees of freedom (df), chi-square/degrees of freedom ratio (χ2/df, ideal value < 3), p-value (ideal value > 0.05), Comparative Fit Index (CFI, ideal value > 0.9), Goodness-of-Fit Index (GFI, ideal value > 0.9), and Root Mean Square Residual (RMR, ideal value < 0.05). Since the initial model demonstrated good fit, no modifications were made. Model identification was ensured by making sure the number of parameters to be estimated was less than or equal to the number of data points’ variance and covariance.
Redundancy Analysis (RDA) is a Principal Component Analysis (PCA) applied to the fitted value matrix from multiple linear regression between response variable matrices and explanatory variable matrices. RDA can simultaneously represent sample and environmental factors on a two-dimensional ranking chart, intuitively illustrating the relationship between sample distribution and environmental factors. The angle between the vectors of explanatory variables (environmental factors) and response variables indicates the strength of their correlation. This study employed RDA to describe the influence of soil environmental factors on soil CO2 and N2O emissions (response variables).

2.6. Statistical Analysis

This study also measured soil moisture, soil temperature, mean weight diameter (MWD), the content of aggregates larger than 0.25 mm ( R > 0.25 m m ), and soil porosity. Soil temperature and moisture content were measured using the ET-100 (Insentek, Beijing, China). Soil moisture content was expressed as volumetric water content (θv), defined as the percentage of the soil’s volume occupied by water (%). The soil mean weight diameter (MWD, mm) was calculated using the following formula:
M W D = i = 1 n ϕ i w i w T
In the formula, ϕ i represents the average particle diameter of aggregates in each size fraction, w i is the mass of aggregates in each size fraction, w T is the total mass of the soil sample, and n is the number of aggregate size classes.
The content of aggregates larger than 0.25 mm ( R > 0.25 , %):
R > 0.25 = m > 0.25 m T   100
In the formula, m > 0.25 represents the mass of aggregates larger than 0.25 mm, and m T is the total mass of the soil sample. Soil porosity refers to the volume ratio of pores (including both water-filled and air-filled pores) in the soil:
S o i l   P o r o s i t y = ( 1 ρ b ρ s ) × 100 %
In the formula, ρ b represents the Bulk Density, and ρ s is the Particle Density.
Considering the influence of soil moisture and soil medium on the calculation accuracy of the gas diffusion coefficient, based on the traditional model, the concepts of water-induced linear reduction (WLR) and medium complexity factor cm (medium complexity factor) are introduced [52]. The expression of the gas diffusion coefficient is as follows:
D s D 0 = Φ θ 2 + C m Φ Φ
where Φ is the total porosity (m3·m−3), θ is the soil water content (m3·m−3), C m is the medium factor, and its is 2.1 in our research [52]. D 0 is the gas diffusion coefficient in the air at 293.15 K and 101.3 kPa, CO2 is 1.38 × 10⁻⁵ m2·s−1, N2O is 2.12 × 10⁻⁵ m2·s−1.
Data analysis was carried out with SPSS 22.0 software. Variance analysis (ANOVA) was performed using the General Linear Model Univariate procedure. Before performing analysis of variance (ANOVA), all data were tested for normality using the Shapiro–Wilk test and for homogeneity of variance using Levene’s test. When the data did not meet the assumptions of normality or homogeneity of variance, log transformations were applied to meet the analysis requirements. In this study, all treatments were considered fixed effect factors. For soil physicochemical property data collected at different growth stages (DAS20, DAS40, DAS60), repeated measures ANOVA was used, with ‘treatment’ as the between-group factor and ‘time’ as the within-group factor. Tukey’s range test was performed to analyze significant differences (p < 0.05) between treatments. OriginPro 2019 was used to prepare the figures.

3. Result

3.1. Chemical and Physical Properties of Biochar

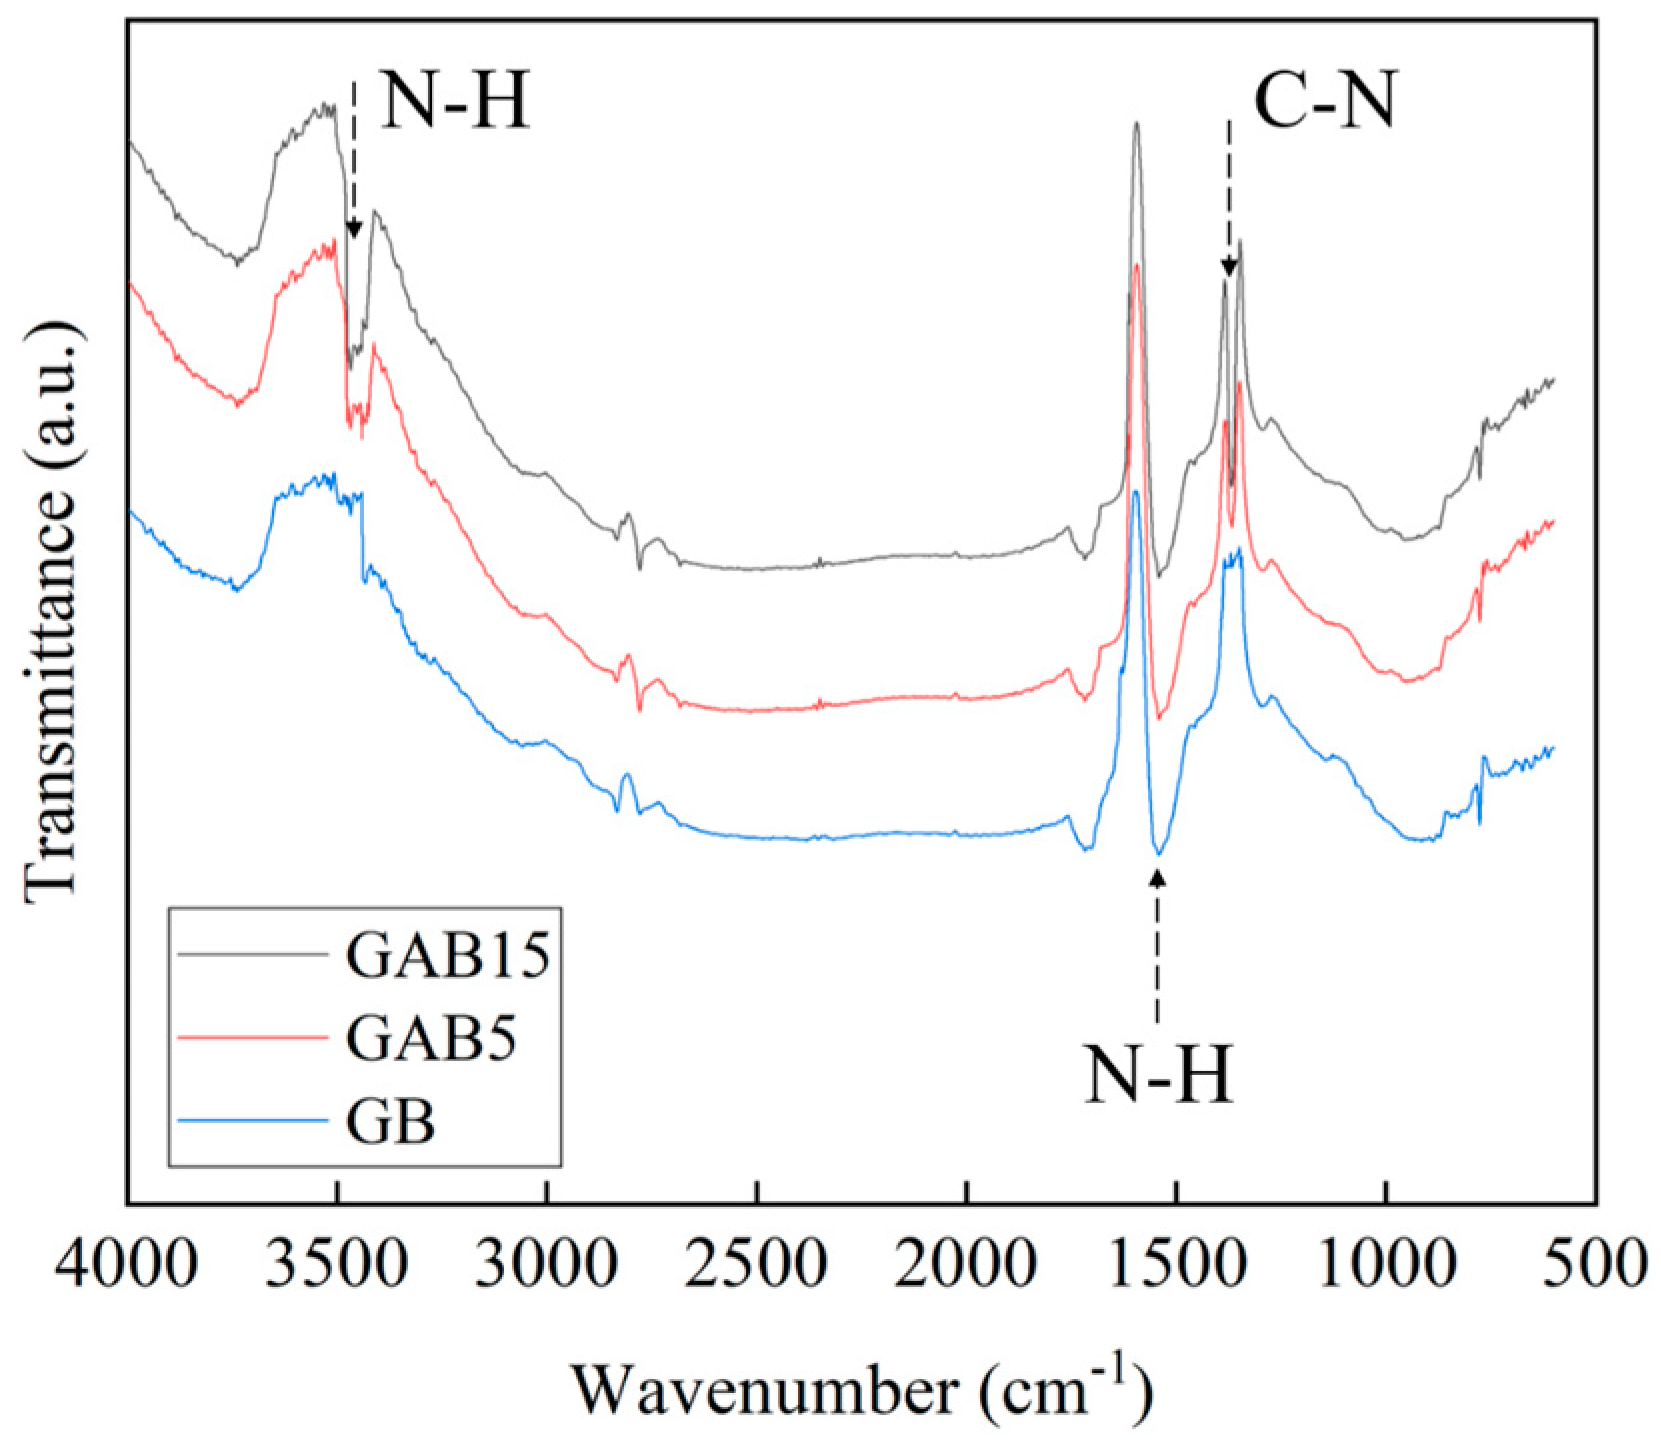
Table 1 presents the microporous structures of the two activated-biochar samples. The findings indicate that the use of potassium hydroxide (KOH) and urea during activation increased the volume of micropores on the biochar surface. GAB15 exhibited a greater surface area and micropore volume than GAB5. Figure 2 illustrates the infrared spectra of the two biochar samples, with characteristic peaks for activated biochar observed at 3442 cm−1, 1541 cm−1, and 1367 cm−1. The N-H symmetric stretching vibration peak was identified at 3442 cm−1, while the N-H bending vibration peak and C-N stretching vibration peak were located at 1541 cm−1 and 1367 cm−1, respectively. These results demonstrate that the number of nitrogen functional groups increased significantly with nitrogen addition during the activation process.

3.2. Soil Physical Properties

3.2.1. Soil Moisture and Temperature

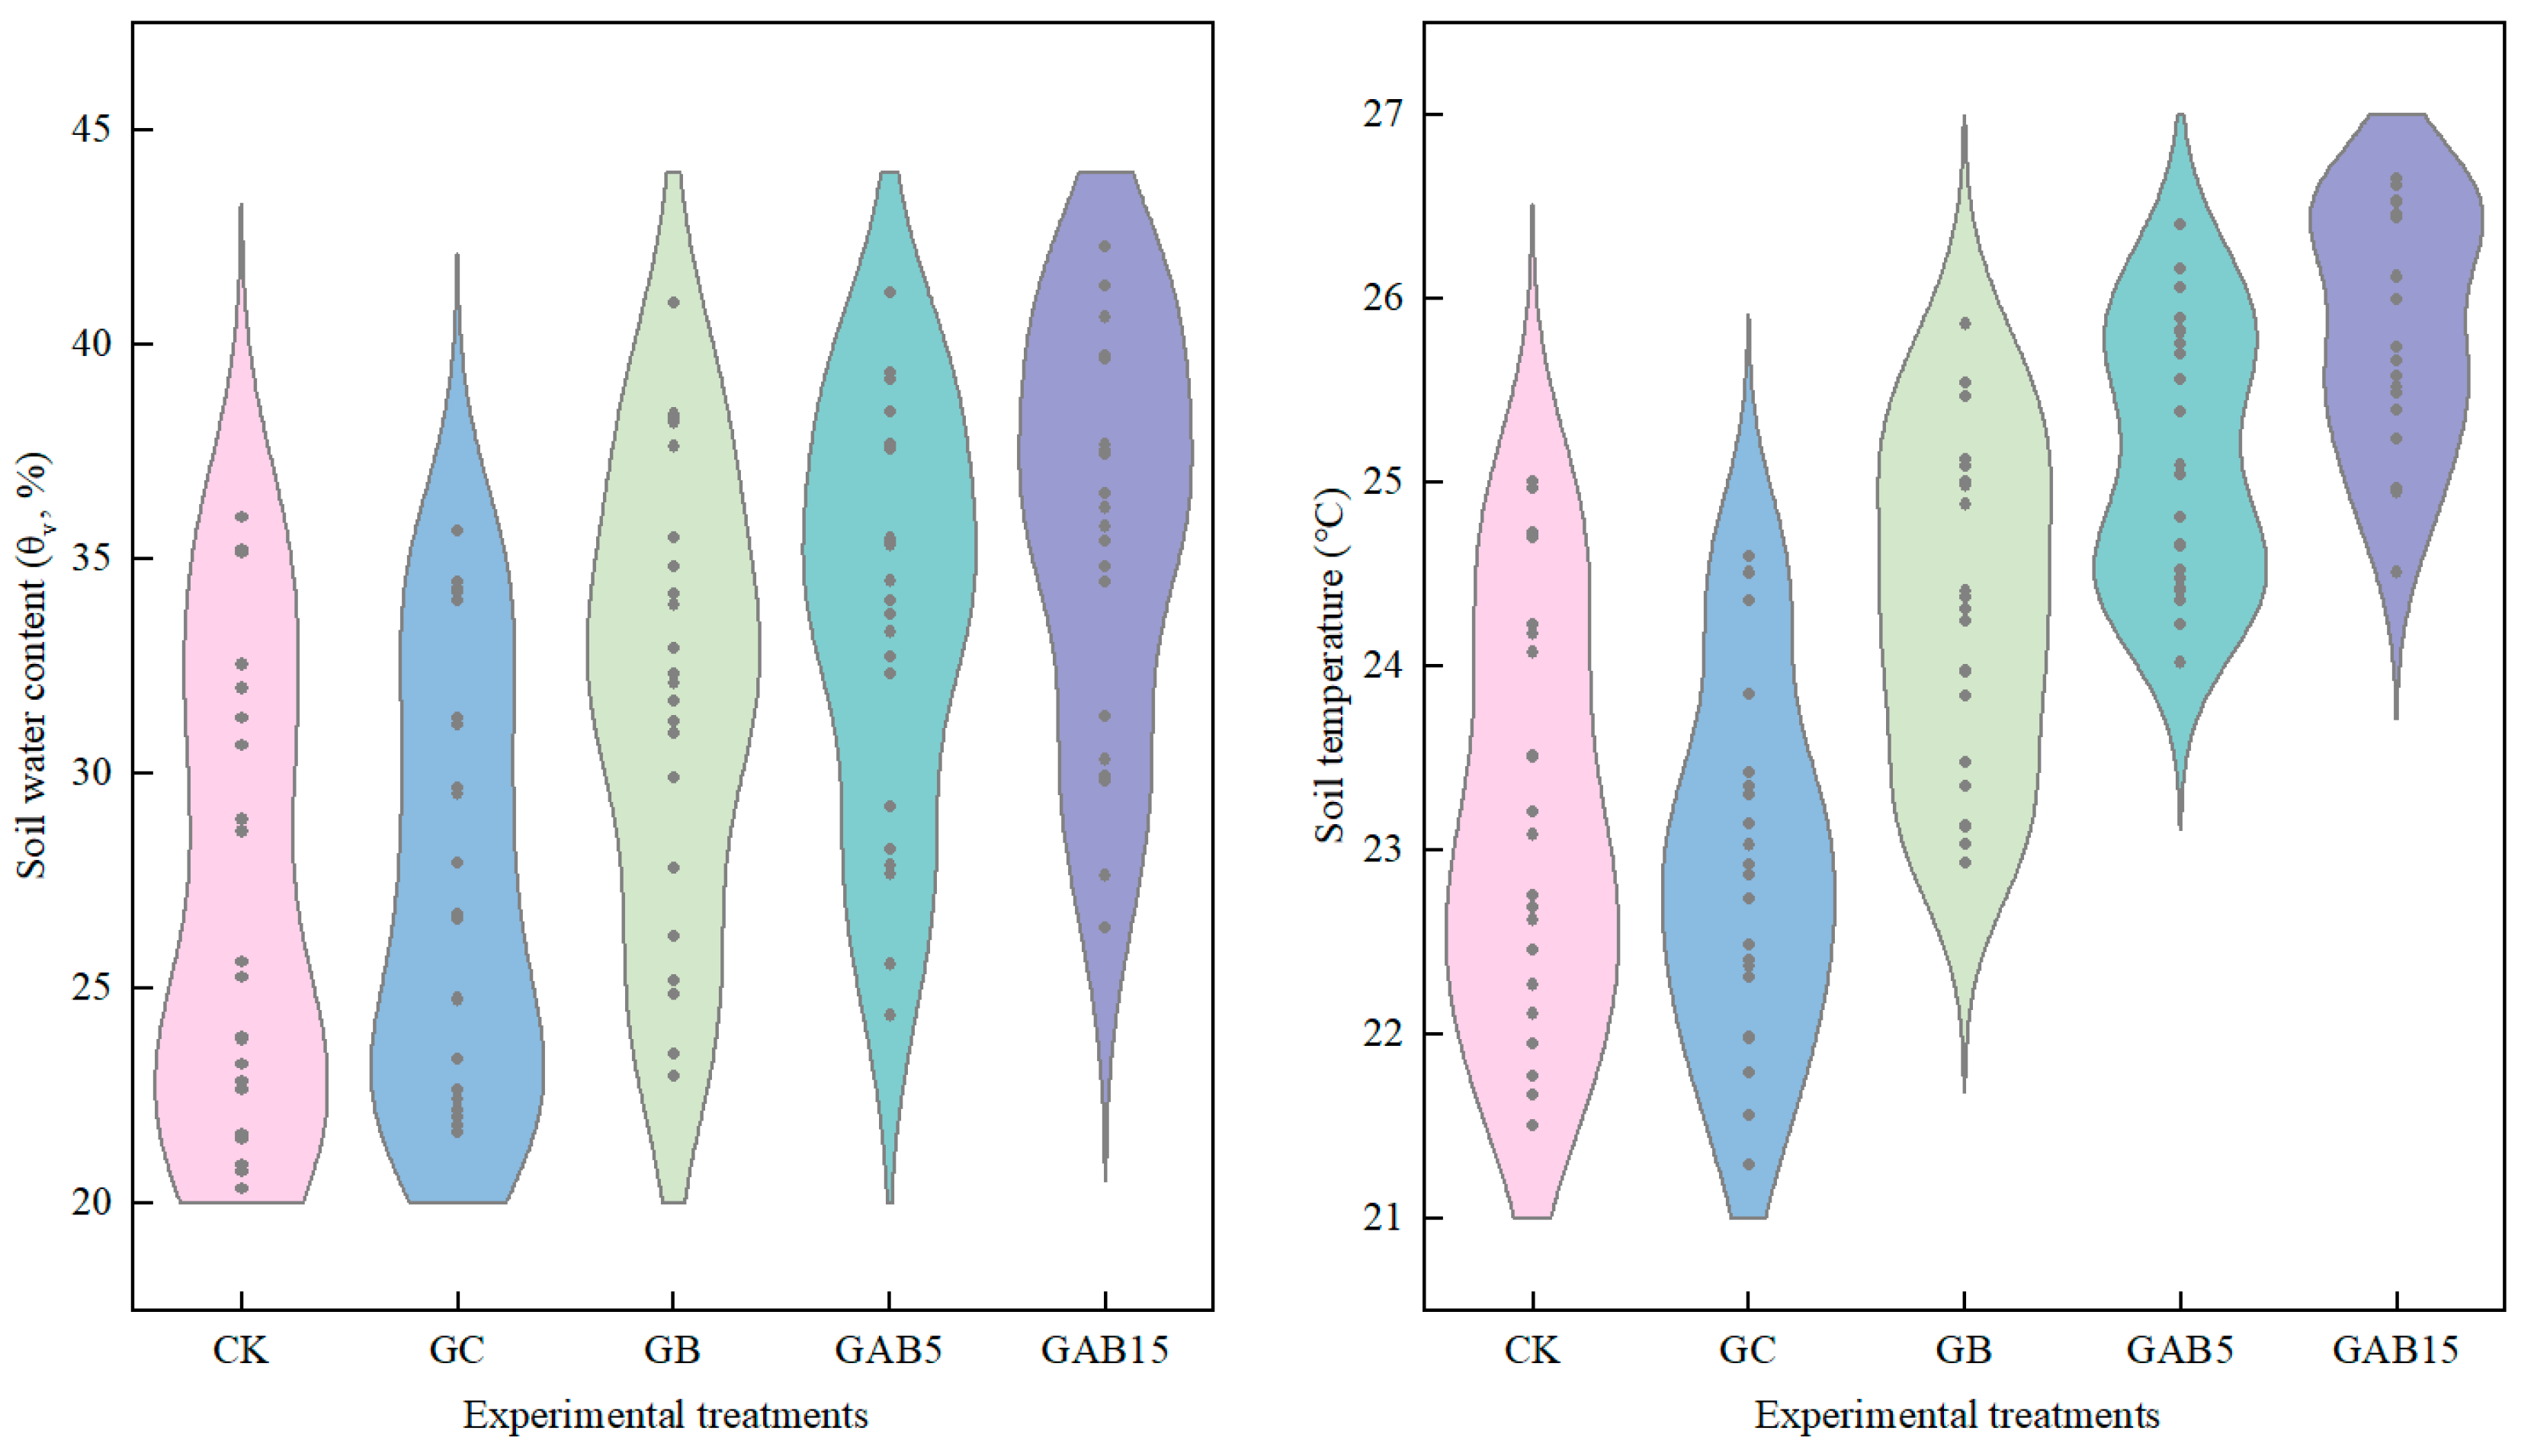
The effects of biochar application on soil moisture and temperature were evident (Figure 3). In general, the moisture content and temperature of the soil increased to varying extents following biochar addition. The soil moisture content for the GB, GAB5, and GAB15 treatments varied considerably, with average increases of 16.60%, 23.05% (p < 0.05), and 30.55% (p < 0.05), respectively, compared with the GC treatment. Similarly, the average soil temperature increased by 6.12%, 9.61% (p < 0.05), and 12.63% (p < 0.05), respectively.

3.2.2. Soil Aggregate Stability

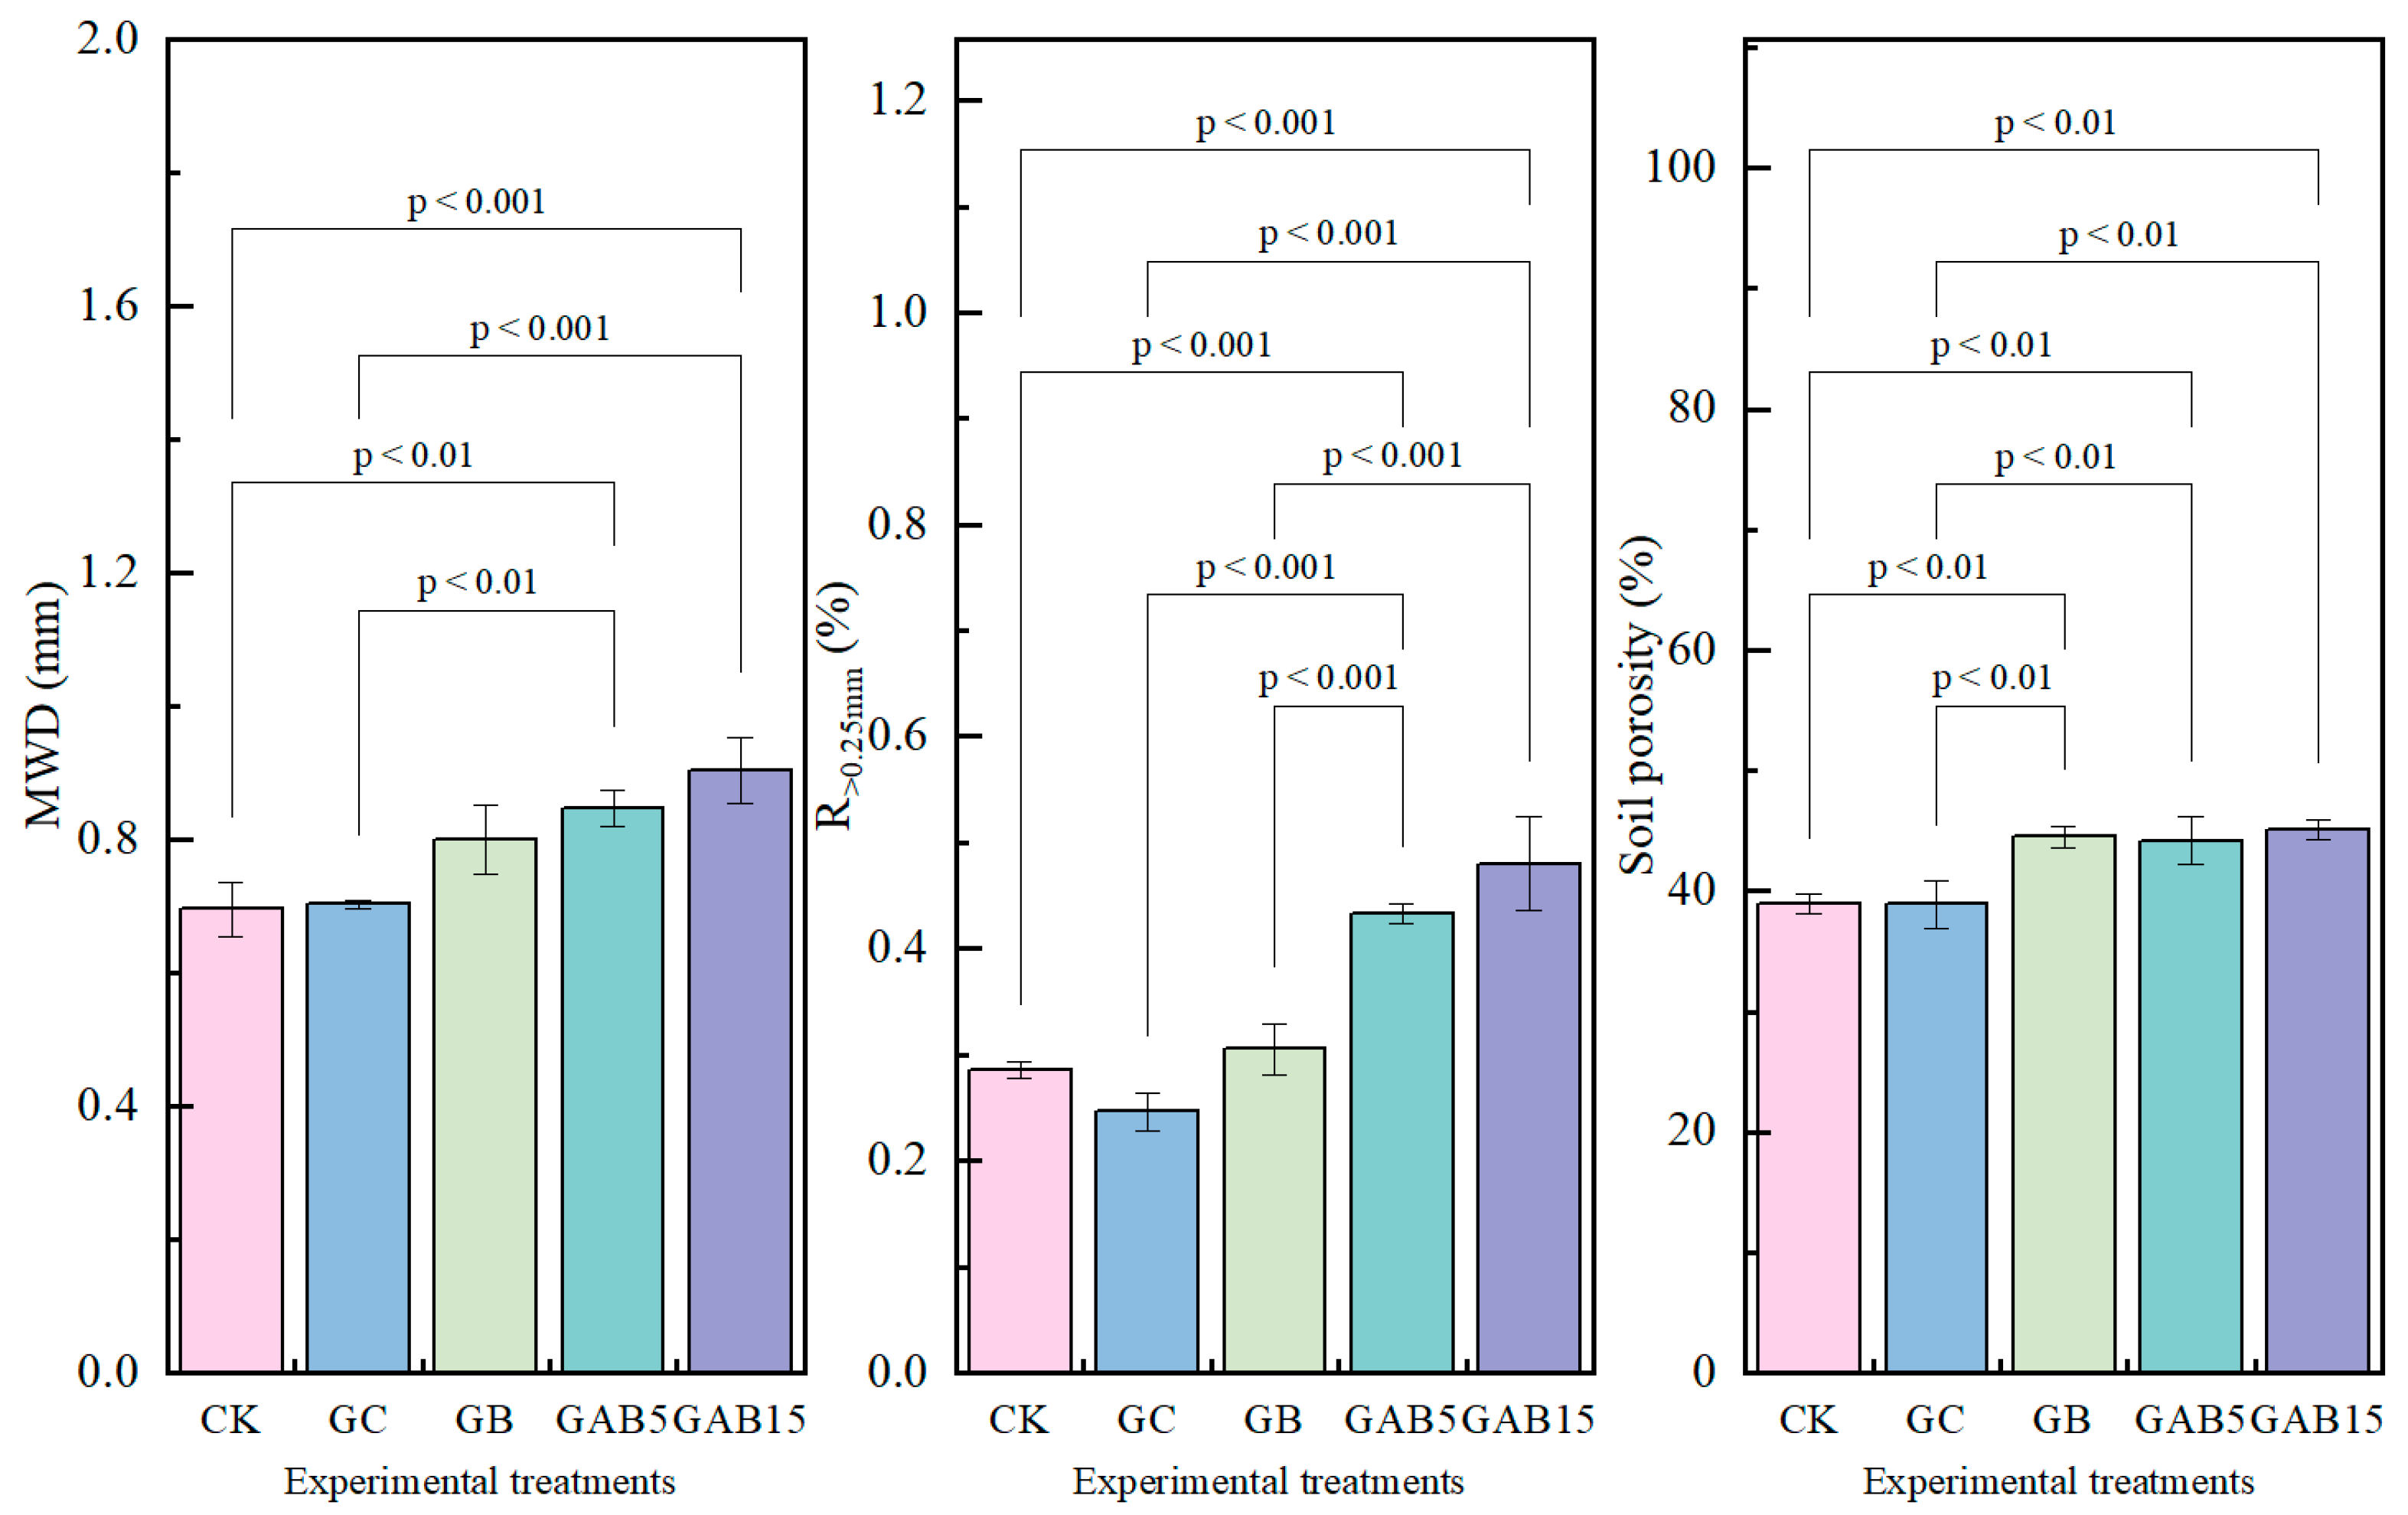
To assess the impact of biochar on soil aggregate stability, MWD and R>0.25mm were utilized in this study (Figure 4). Compared to the GC treatment, both GAB5 and GAB15 treatments exhibited a significant increase in MWD and R>0.25mm (p < 0.05), whereas the GB treatment did not reach a significant level. A statistically significant difference was observed between the GB and GAB15 treatments (p < 0.05); however, no significant difference was observed between GAB5 and GAB15. In contrast to the GC treatment, the soil porosities of GB, GAB5, and GAB15 increased by 14.48%, 13.56%, and 16.00%, respectively (p < 0.05), with no significant differences among the three treatments.

3.2.3. Ds/D0 and Soil Water Content

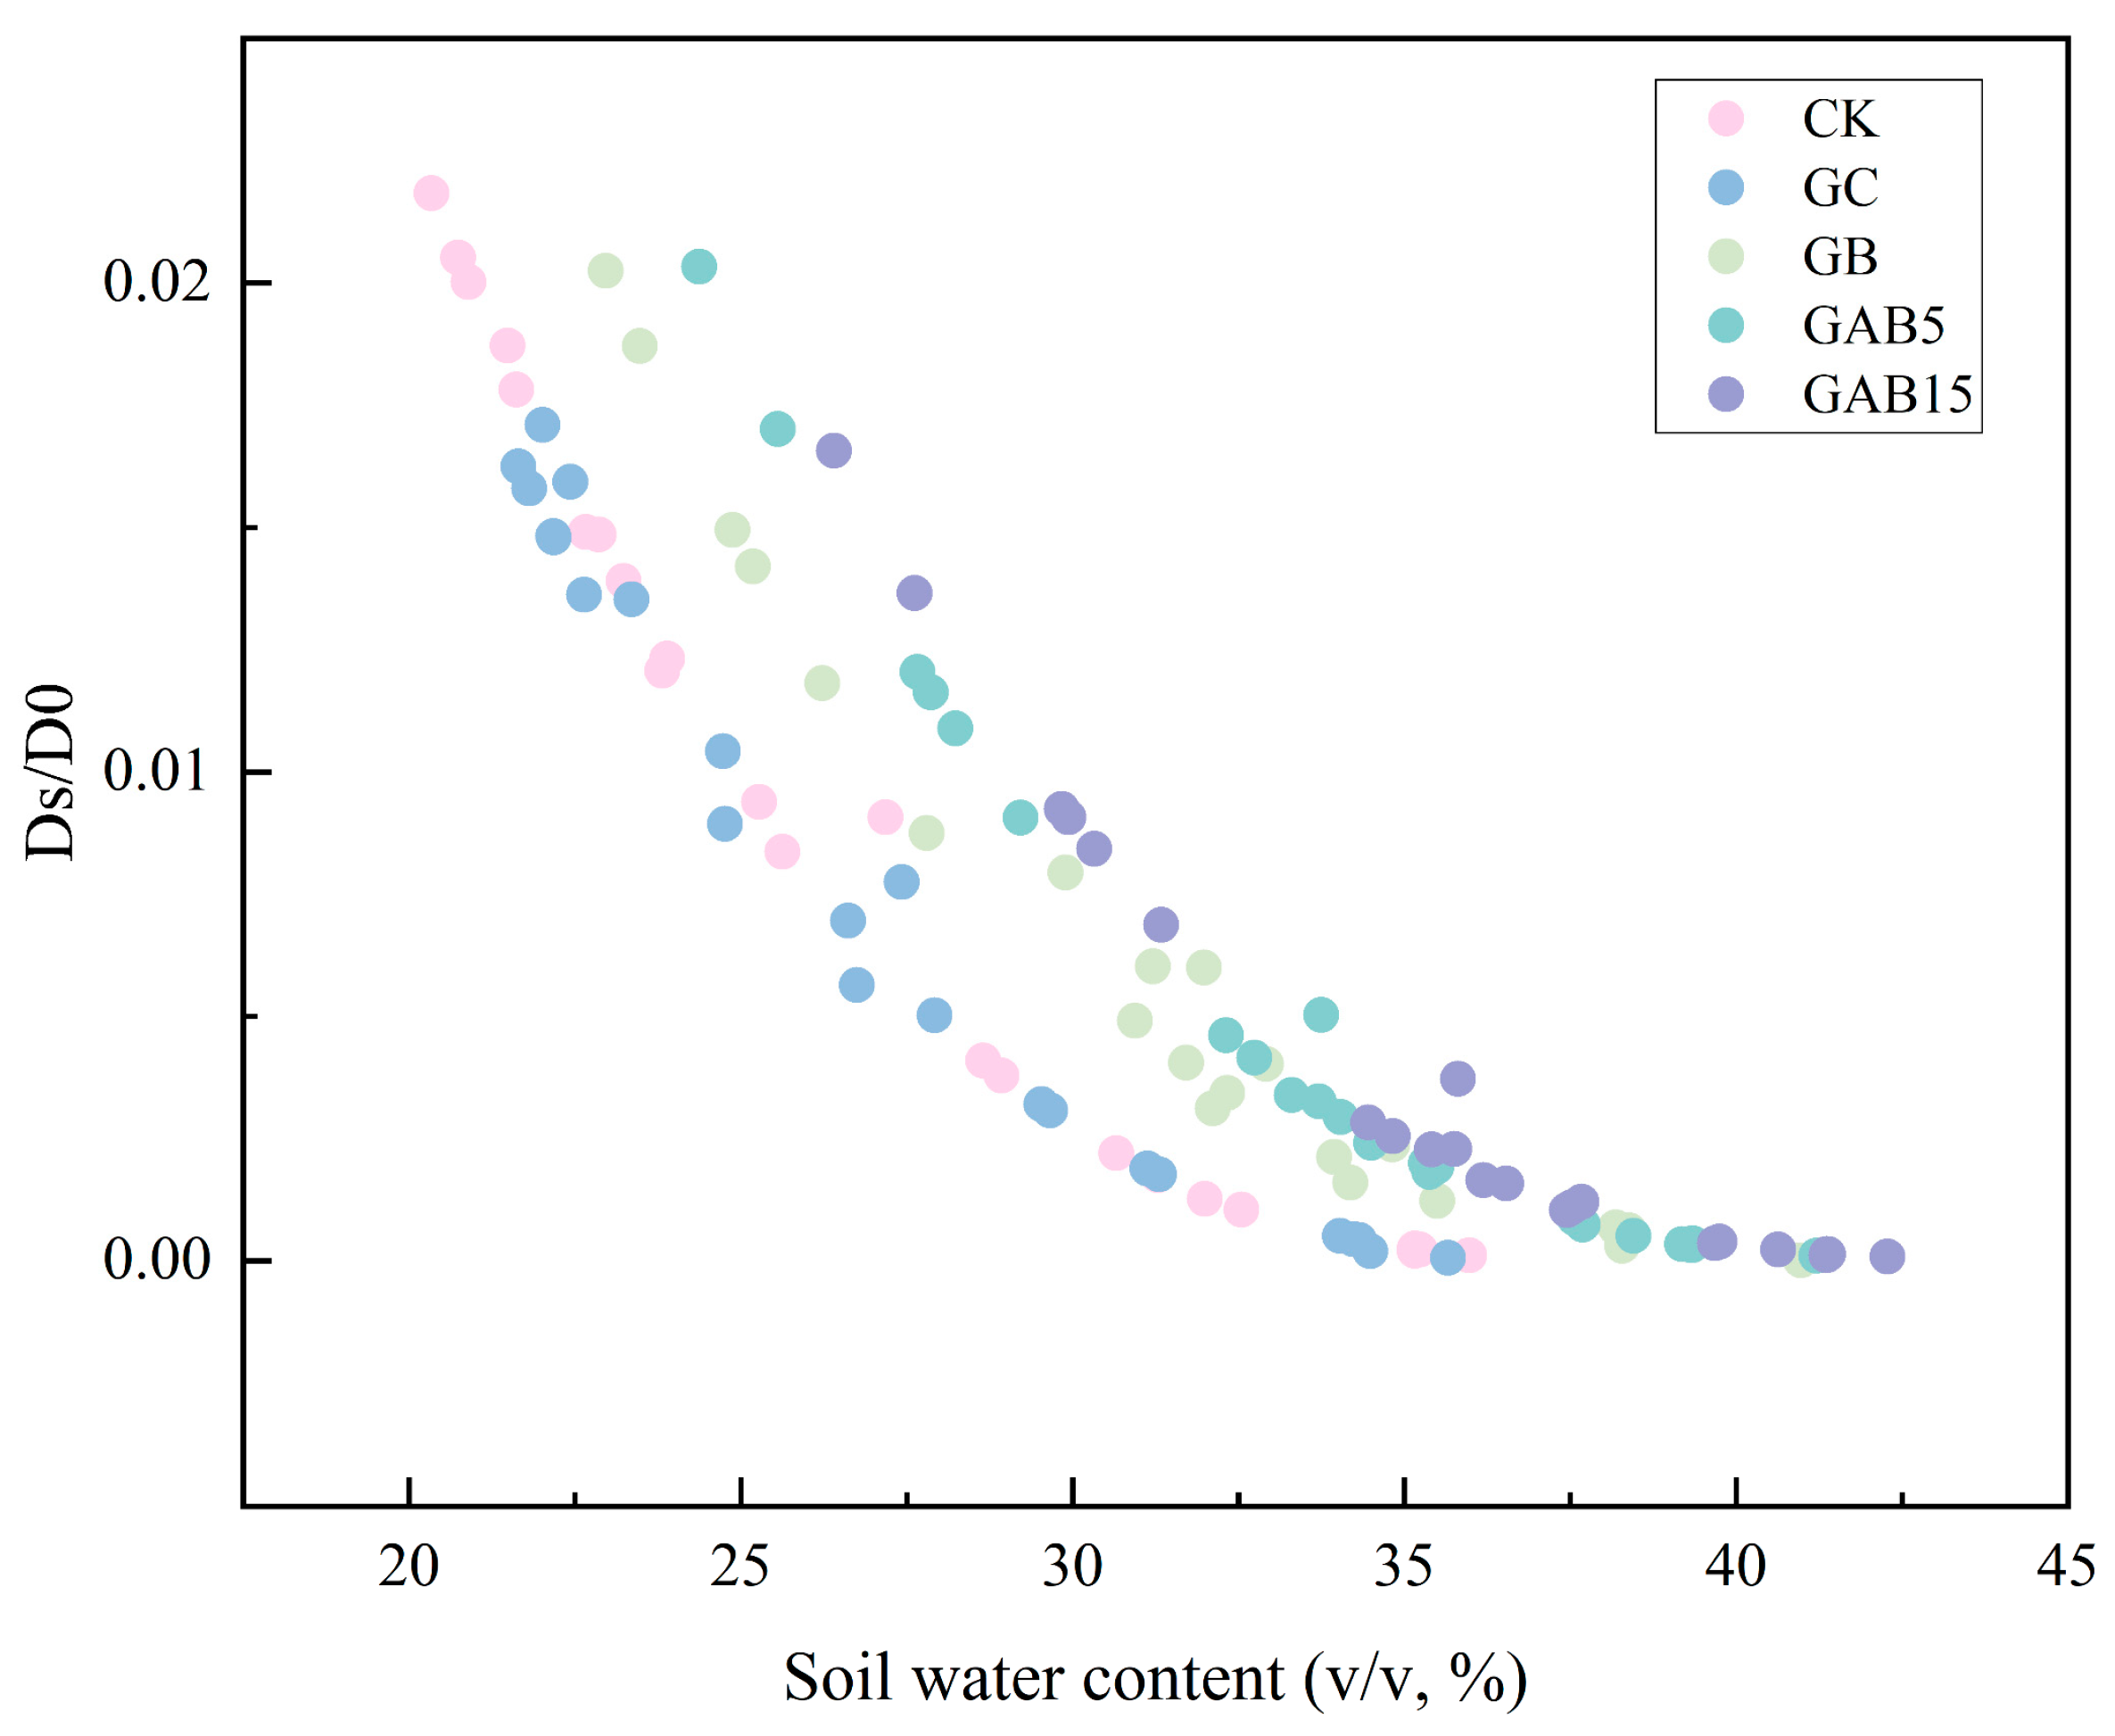
The relationship between Ds/D0 and soil water content is presented in Figure 5. With an increase in soil moisture content, Ds/D0 demonstrated an decreasing trend. When the soil moisture content was constant, the Ds/D0 for each treatment followed the order GAB15 > GAB5 > GB > GC/CK, indicating that biochar application increased soil gas diffusivity, with a more pronounced effect observed after biochar activation.

3.3. Soil Chemical Properties

3.3.1. Soil pH and CEC

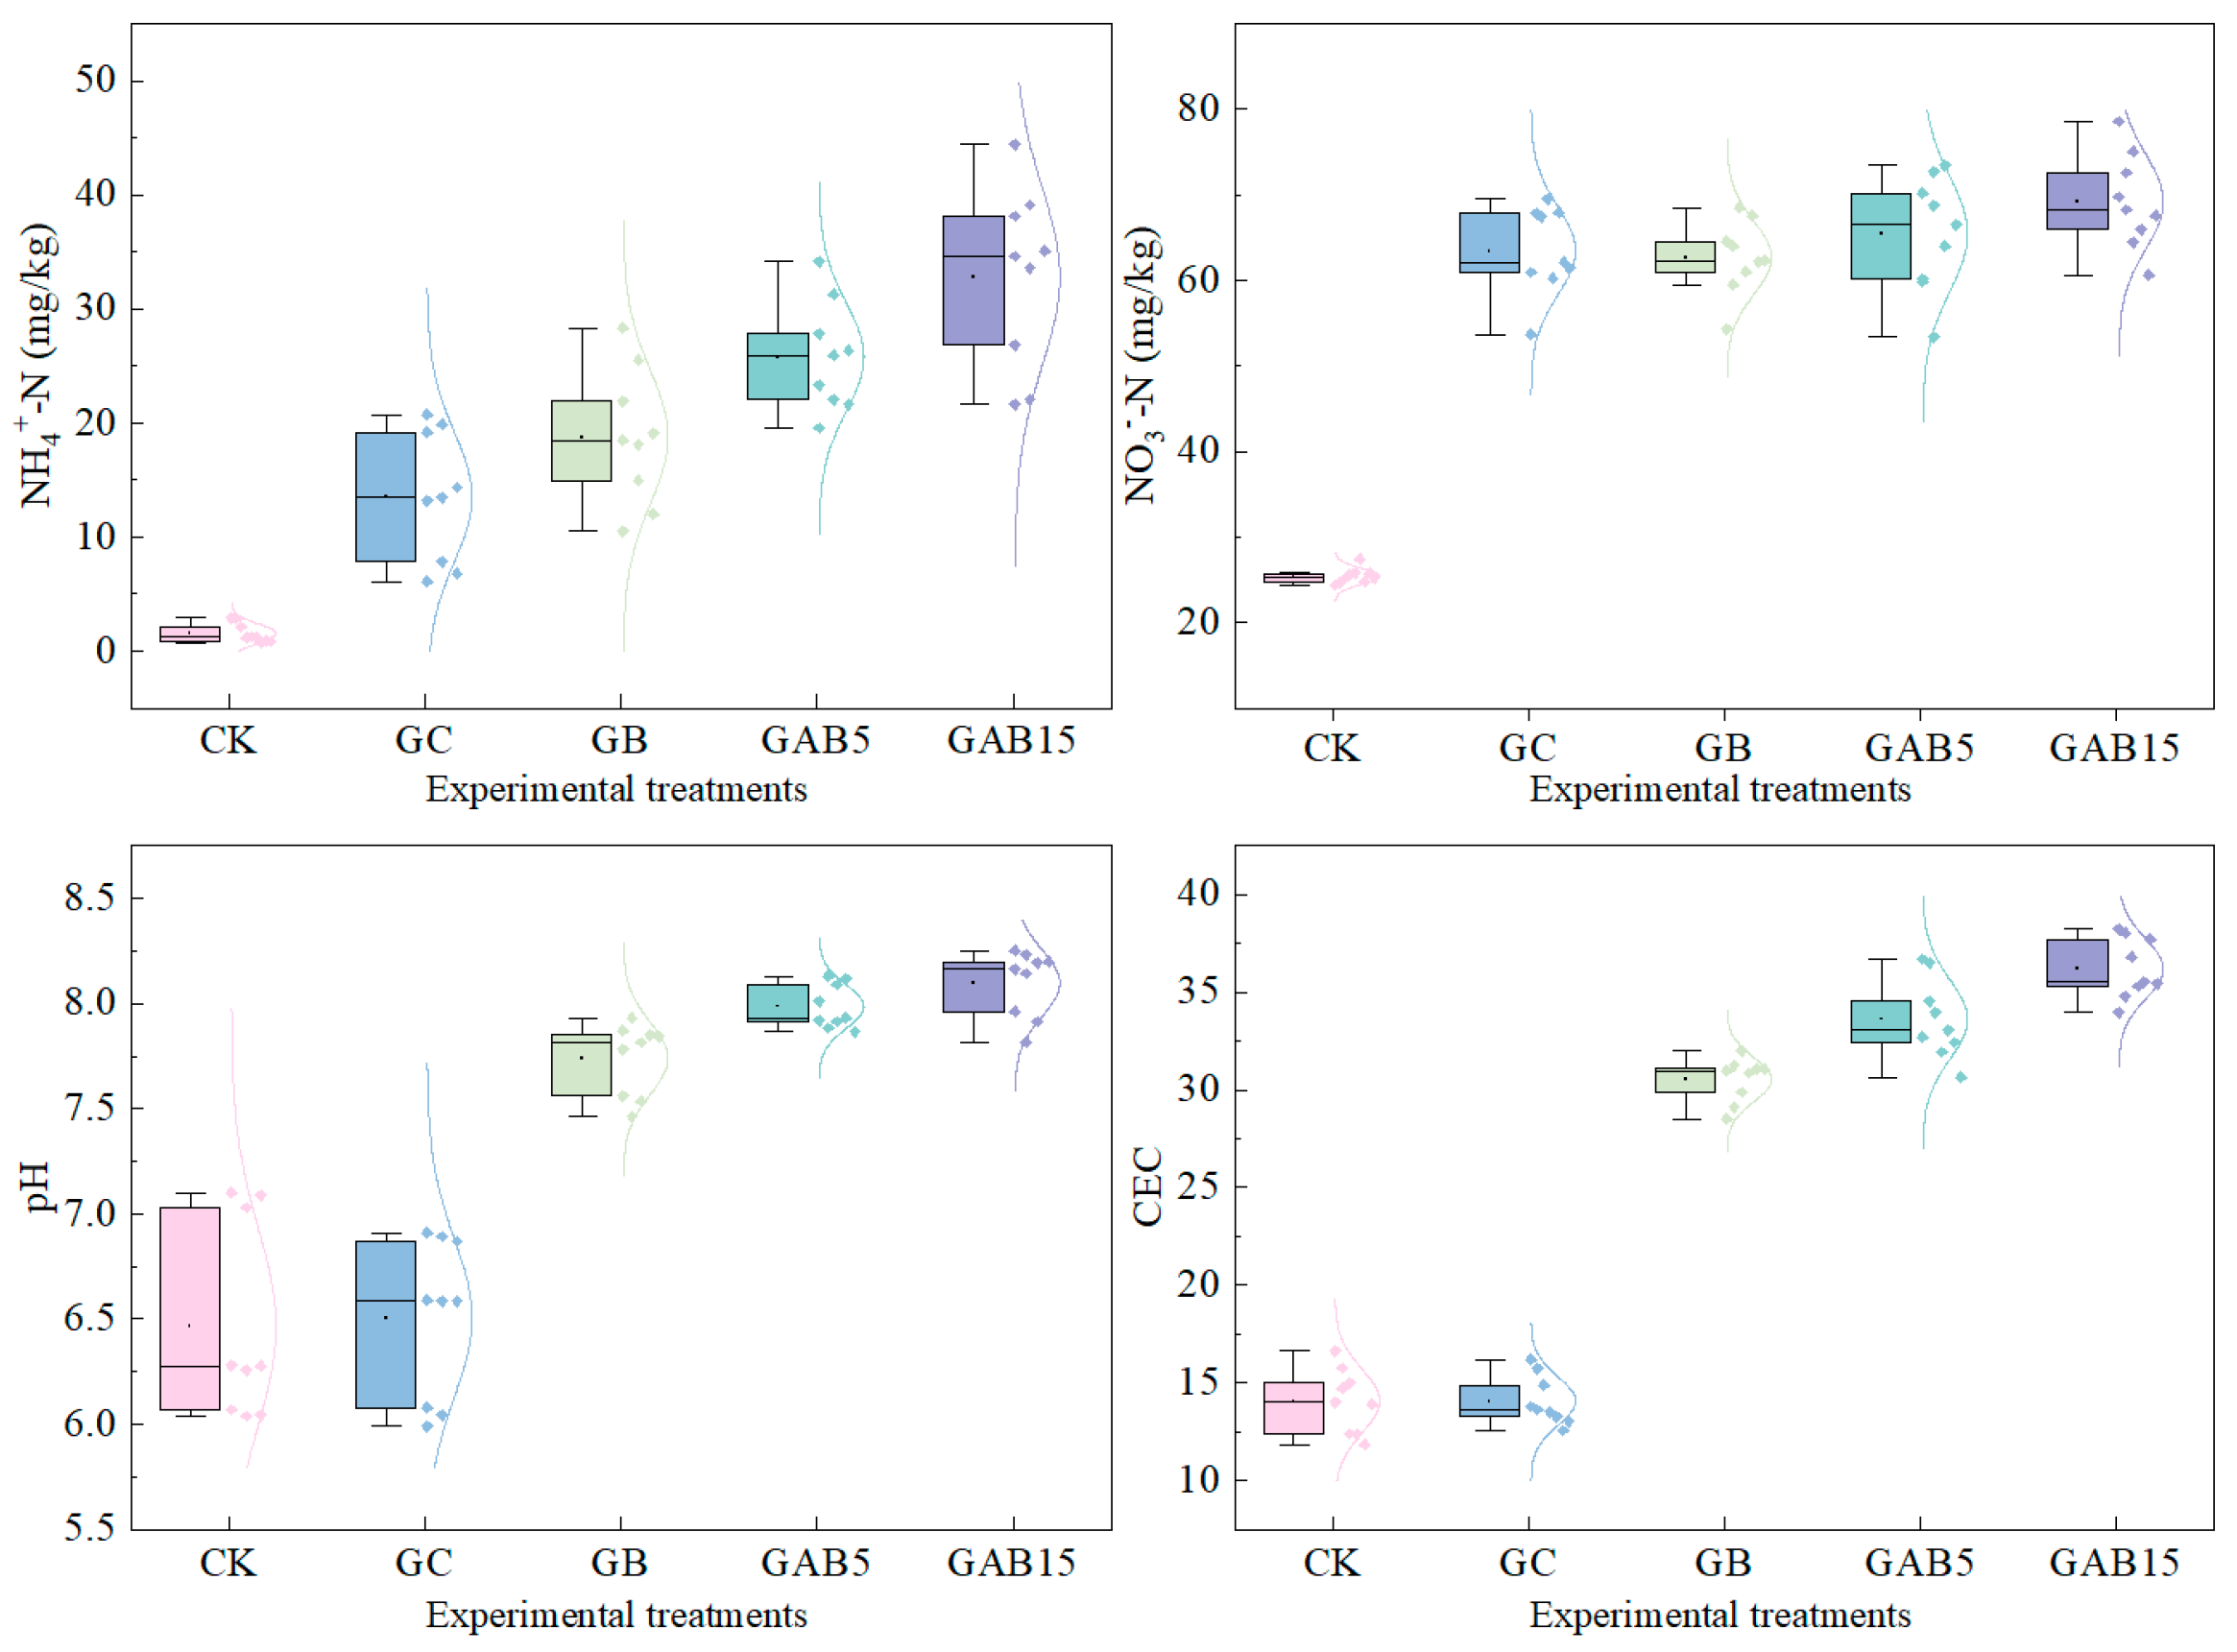
The soil pH and cation exchange capacity (CEC) in activated-biochar treatments were significantly higher than in other treatments (p < 0.05) (Figure 6). No significant differences were observed between GC and CK. Compared to GB, GAB15 treatment significantly increased soil pH and CEC by 4.9% and 17.3% (p < 0.05), respectively; GAB5 increased by 3.3% and 4.5%, respectively.

3.3.2. Soil NH4+-N and NO3-N

Biochar treatments resulted in an increase in both soil NH4+-N and NO3-N contents, as shown in Figure 6. GAB15 significantly augmented soil NH4+-N and NO3-N by 60.6–88.2% (p < 0.05) and 5.5–18.4% (p < 0.05), respectively, when compared to GB. Additionally, GAB15 showed an increase of 23.1–68.6% (p < 0.05) and 5.5–18.4%.

3.4. Soil Enzymatic Activities and Microbial Biomass

3.4.1. Soil Enzymatic Activities

Biochar significantly influenced both microbial biomass and enzymatic activity (p < 0.05) (Table 2). The GB treatment exhibited the highest enzymatic activity at depths greater than 10 cm, while the CK treatment demonstrated the lowest. Between DAS20 and DAS60, GAB15 and GAB5 treatments enhanced enzyme activities compared to GC, particularly for β-glucosidase and alkaline phosphatase (p < 0.05). Notably, GB promoted urease activation, showing an increase of 1.3–47.9% relative to GAB15.

3.4.2. Microbial Biomass

At DAS40 and DAS60, the microbial biomass in GB was significantly higher than in GAB5 and GAB15 (Table 3). Compared with GAB15, GB increased MBC by 4.7–4.8%, and MBN by 8.3–24.8% (p < 0.05) relative to GAB5 and GAB15. However, the MBC/MBN ratio was higher in activated-biochar. GAB15 elevated MBC/MBN by 9.1–17.5% at DAS20-DAS60 (p < 0.05), and GAB5 by 7.3–8.0% at DAS40-DAS60. In terms of dissolved organic carbon (DOC), biochar treatments outperformed CK and GC, with GAB15 showing the highest values. The order of DOC was GAB15 > GAB5 > GB > GC > CK. Compared with GB, GAB15 increased DOC by 19.0–22.3% (p < 0.05), and GAB5 by 8.0–9.7%.

3.5. The Dynamic of CO2 and N2O

3.5.1. The Emission of CO2 and N2O in the Soil Surface

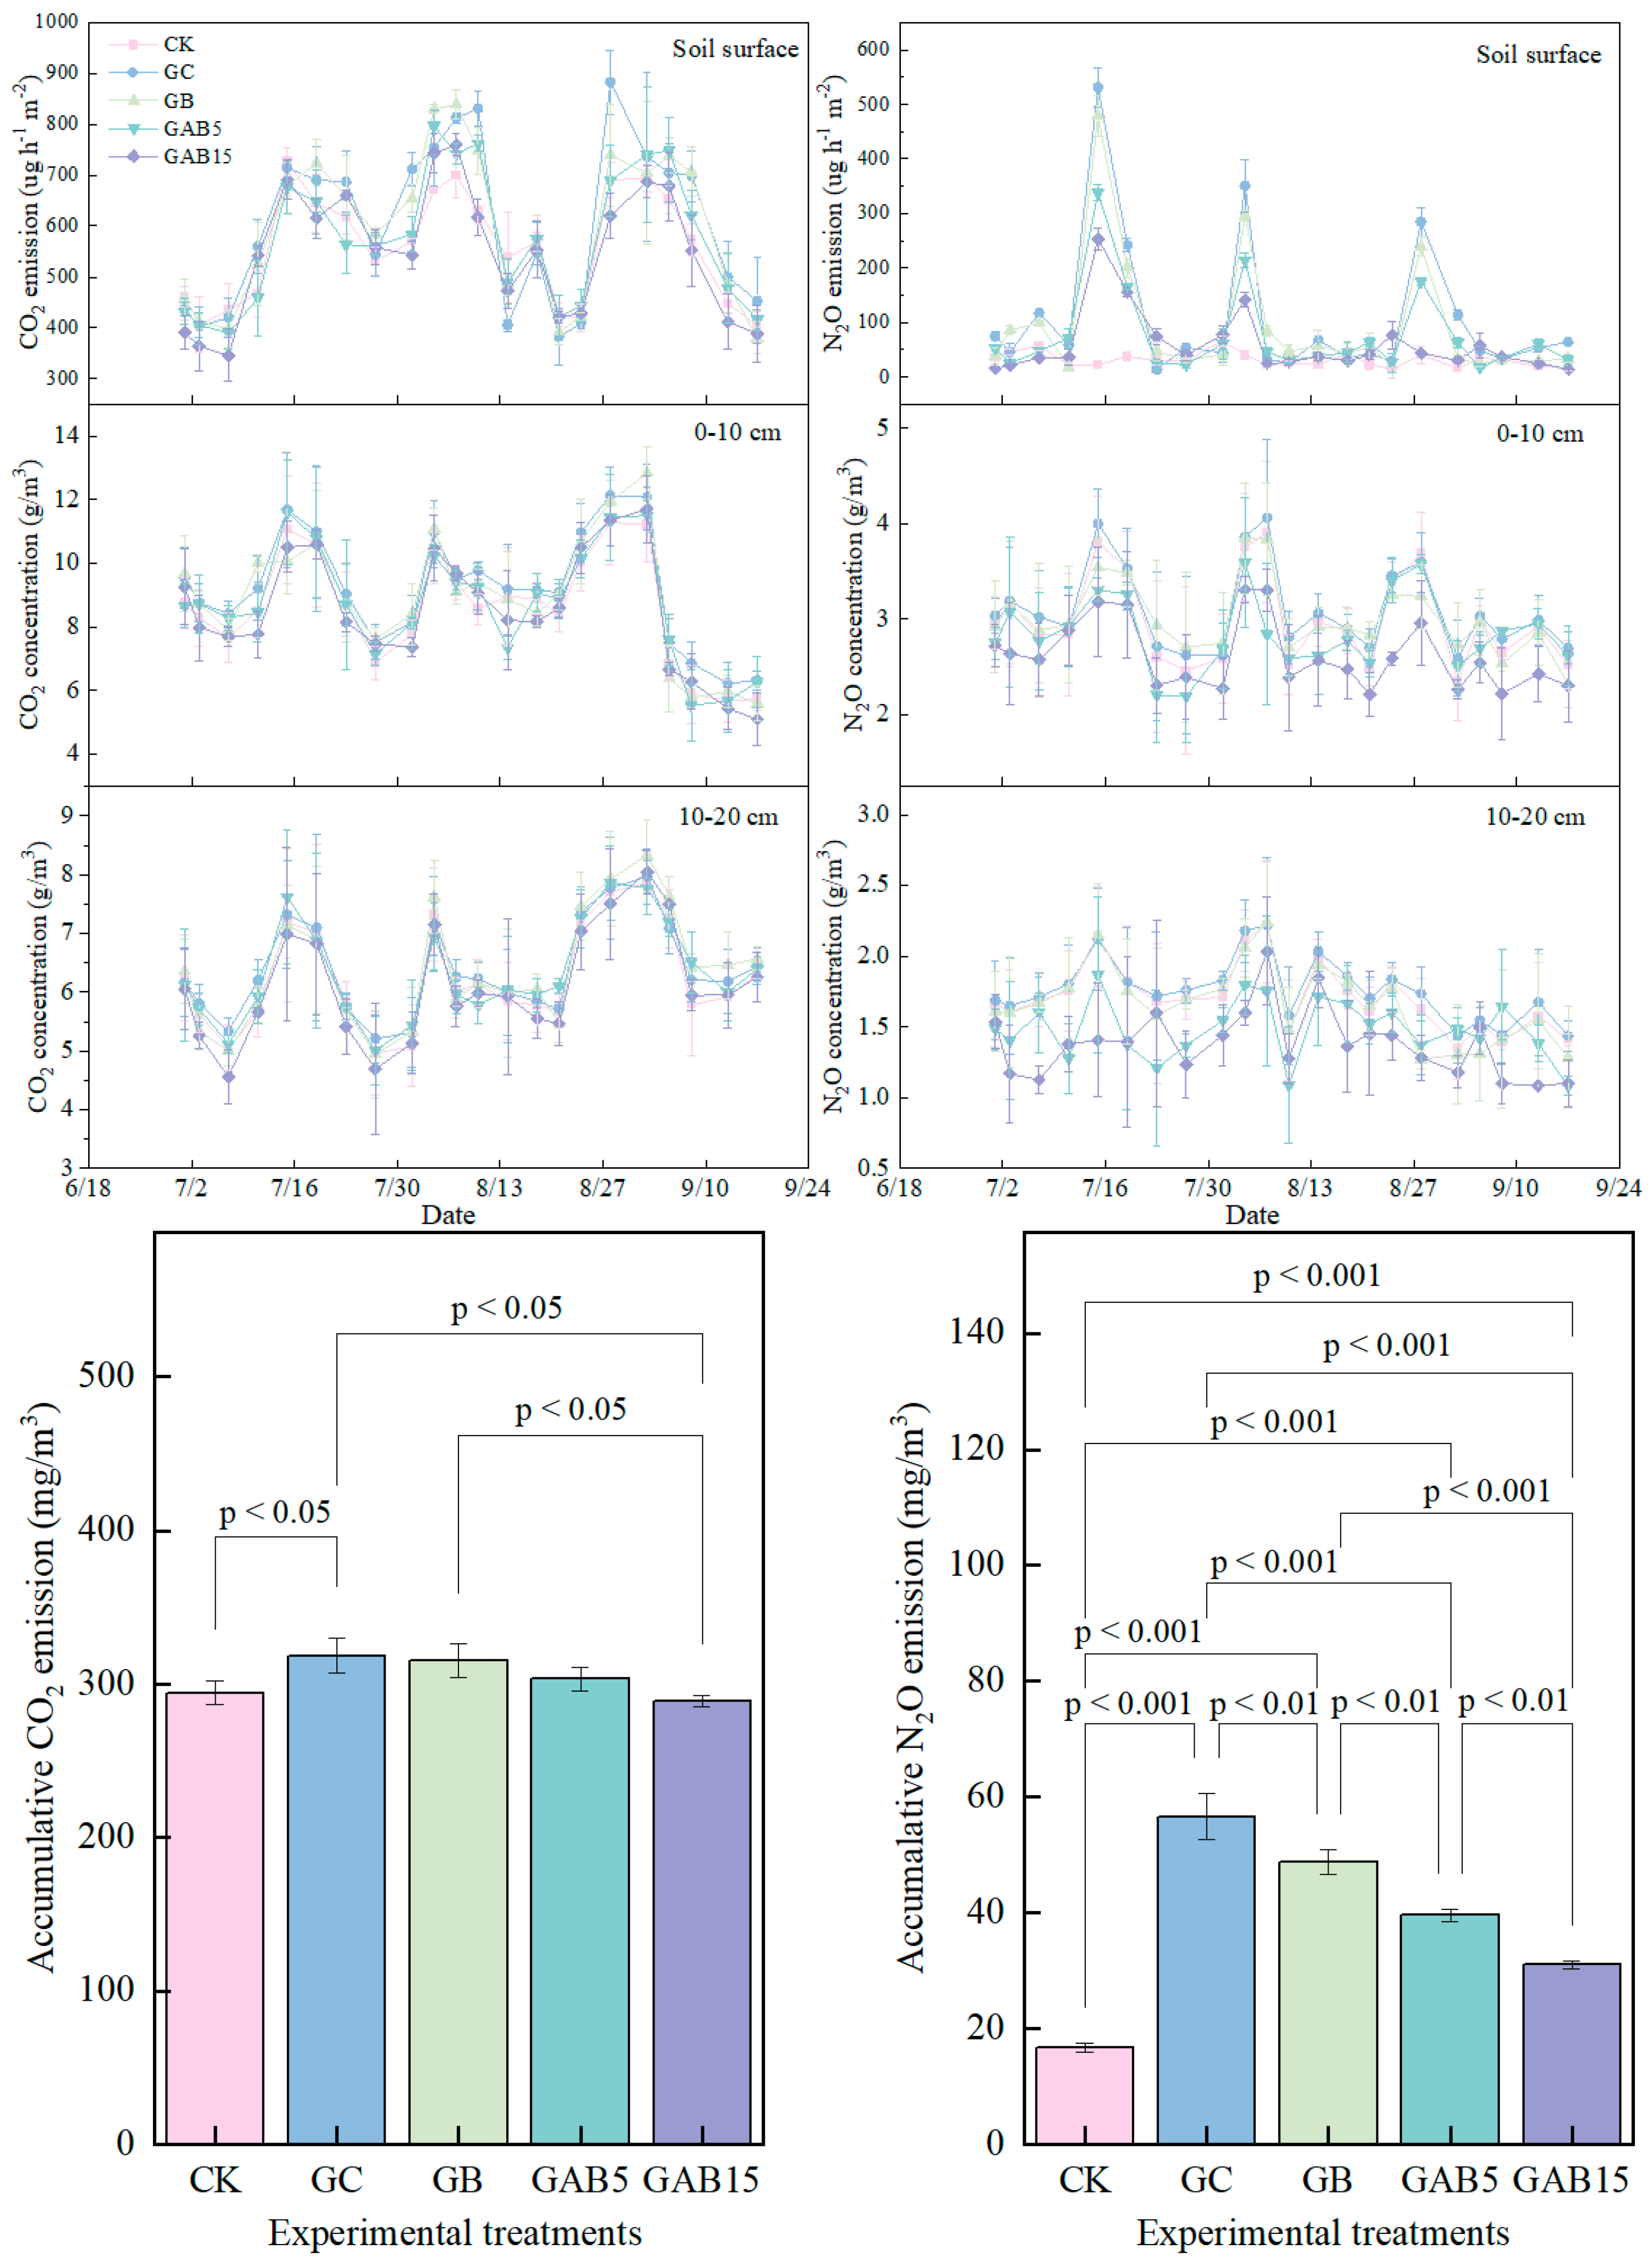
Throughout the experimental timeframe, substantial fluctuations were observed in gas emissions across all treatments (Figure 7). Distinct peaks in emissions were recorded universally among treatments on 14 July, 3 August, and 27 August. Conversely, other periods lacked such pronounced peaks, suggesting a more potent influence of urea application compared to irrigation on soil gas emissions. The characteristics of these emissions varied: CO2 peaks were modest yet prolonged, whereas N2O peaks were intense but brief. Peak emissions from deeper soil strata were significantly reduced compared to surface layers (p < 0.05), implying a lesser impact of fertilization on deeper soil gas outputs. While overall differences in peak emissions among treatments were minimal, exceptions existed where surface soil N2O emission peaks in GC and GB treatments surpassed those of other treatments.
After biochar application, soil CO2 emissions were reduced to a certain extent (Figure 7). Compared with the GC, the cumulative CO2 emissions of GB and GAB5 treatment were reduced by 1.1% and 4.8%, respectively, and GAB15 was significantly reduced by 9.4% (p < 0.05). The CO2 emission in the GB treatment was not lower than that in GC, indicating that non-activated biochar did not completely eliminate CO2 emissions. The inhibitory effect of biochar on N2O was more significant. Compared with the GC, the N2O cumulative emissions from the GB, GAB5, and GAB15 treatments were reduced by 13.9%, 30.0%, and 45.2%, respectively (p < 0.05). After activation, biochar significantly inhibited N2O emissions, and the inhibition reached a significant level in the GAB15 treatment (p < 0.05).

3.5.2. The Accumulative CO2 and N2O in the Soil Profile

The accumulation pattern of CO2 varied significantly at different depths (p < 0.05) (Figure 7). In the 0–10 cm depth, biochar significantly decreased the average concentration of CO2. Compared with GC, the GB, GAB5, and GAB15 treatments showed a significant decrease in the average concentration of CO2 by 3.1%, 5.0%, and 7.4%, respectively (p < 0.5) (Figure 7). In the 10–20 cm depth, the difference in the average concentration of CO2 among the treatments was not significant without biochar application. The N2O reduction by biochar was more remarkable. In the 0–10 cm soil layer, compared with the GC treatment, GB reduced the N2O average concentration by 8.2% (p < 0.05), GAB5 by 17.1% (p < 0.05), and GAB15 by 25.3% (p < 0.05). In the 10–20 cm soil layer, GAB5 reduced by 26.5% (p < 0.05), and GAB15 by 35.6% (p < 0.05). Biochar significantly inhibited CO2 accumulation in the 0–10 cm soil layer (p < 0.05). After activation, the inhibition was more remarkable. Biochar inhibits N2O accumulation in the 0–10 cm and 10–20 cm soil layers. A stronger alkalinity correlated with a stronger N2O emission reduction ability of biochar in soil.

3.6. Redundancy Analysis of Soil CO2 and N2O Emission

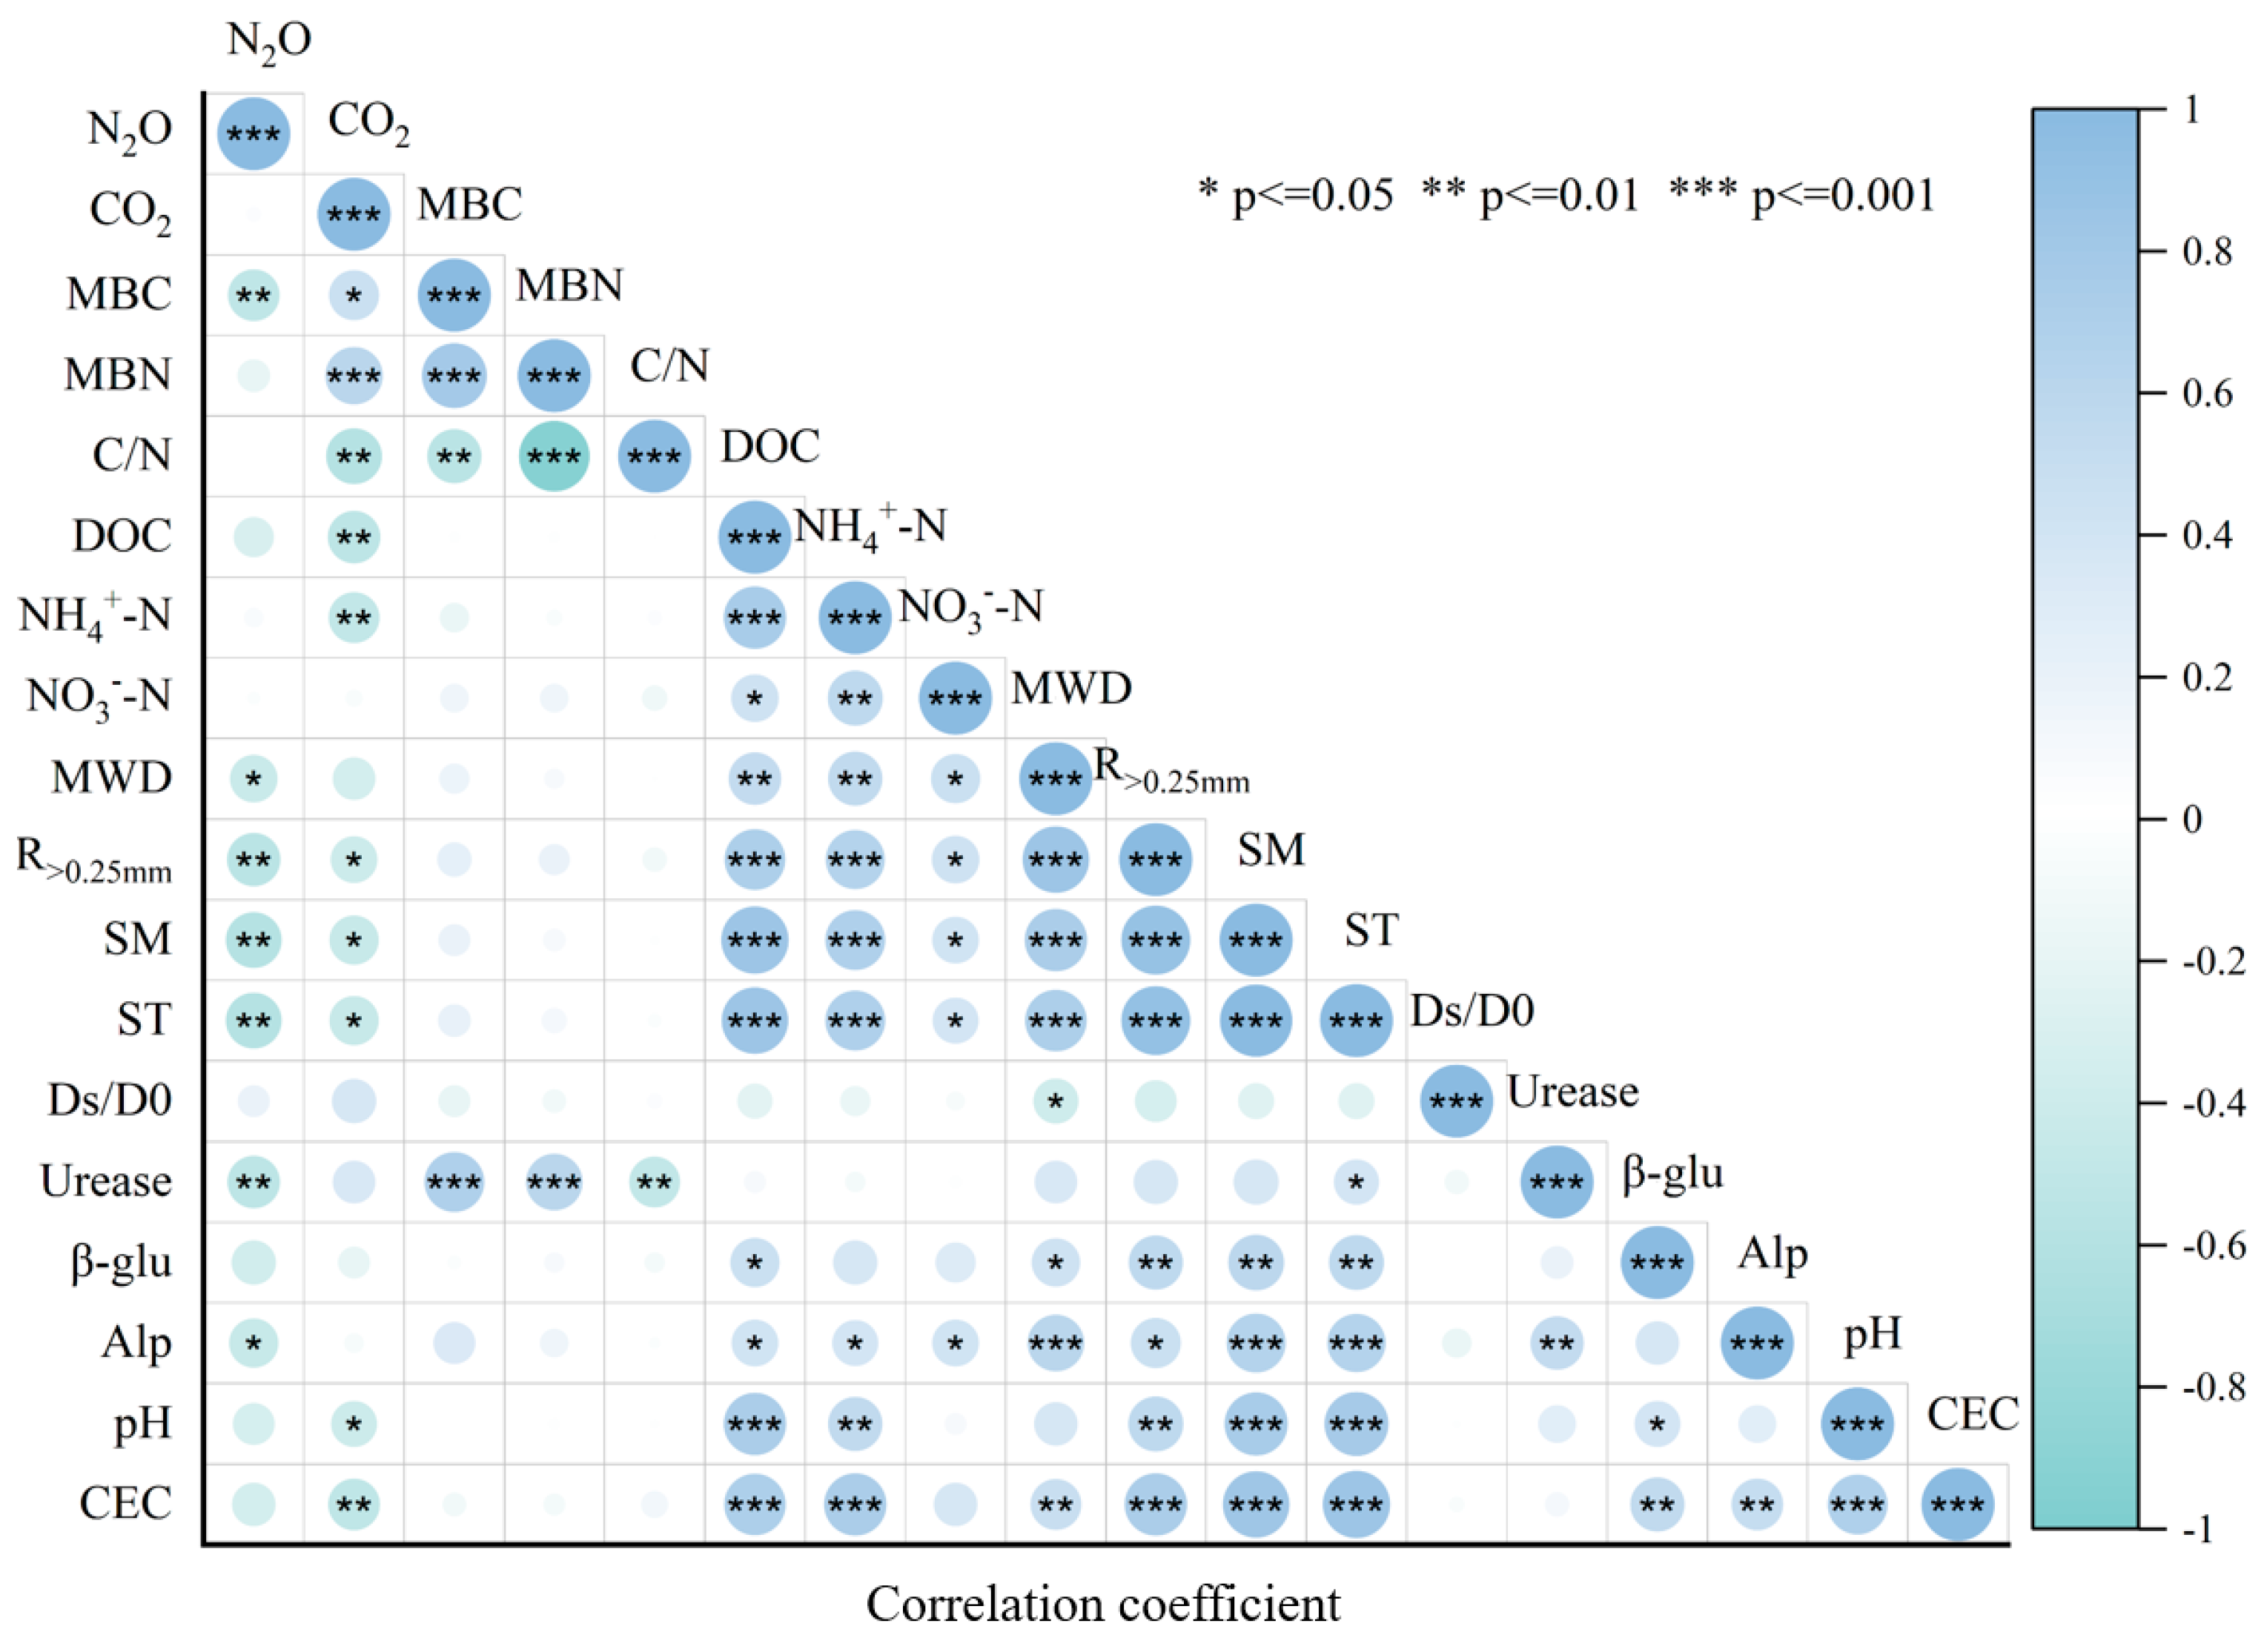
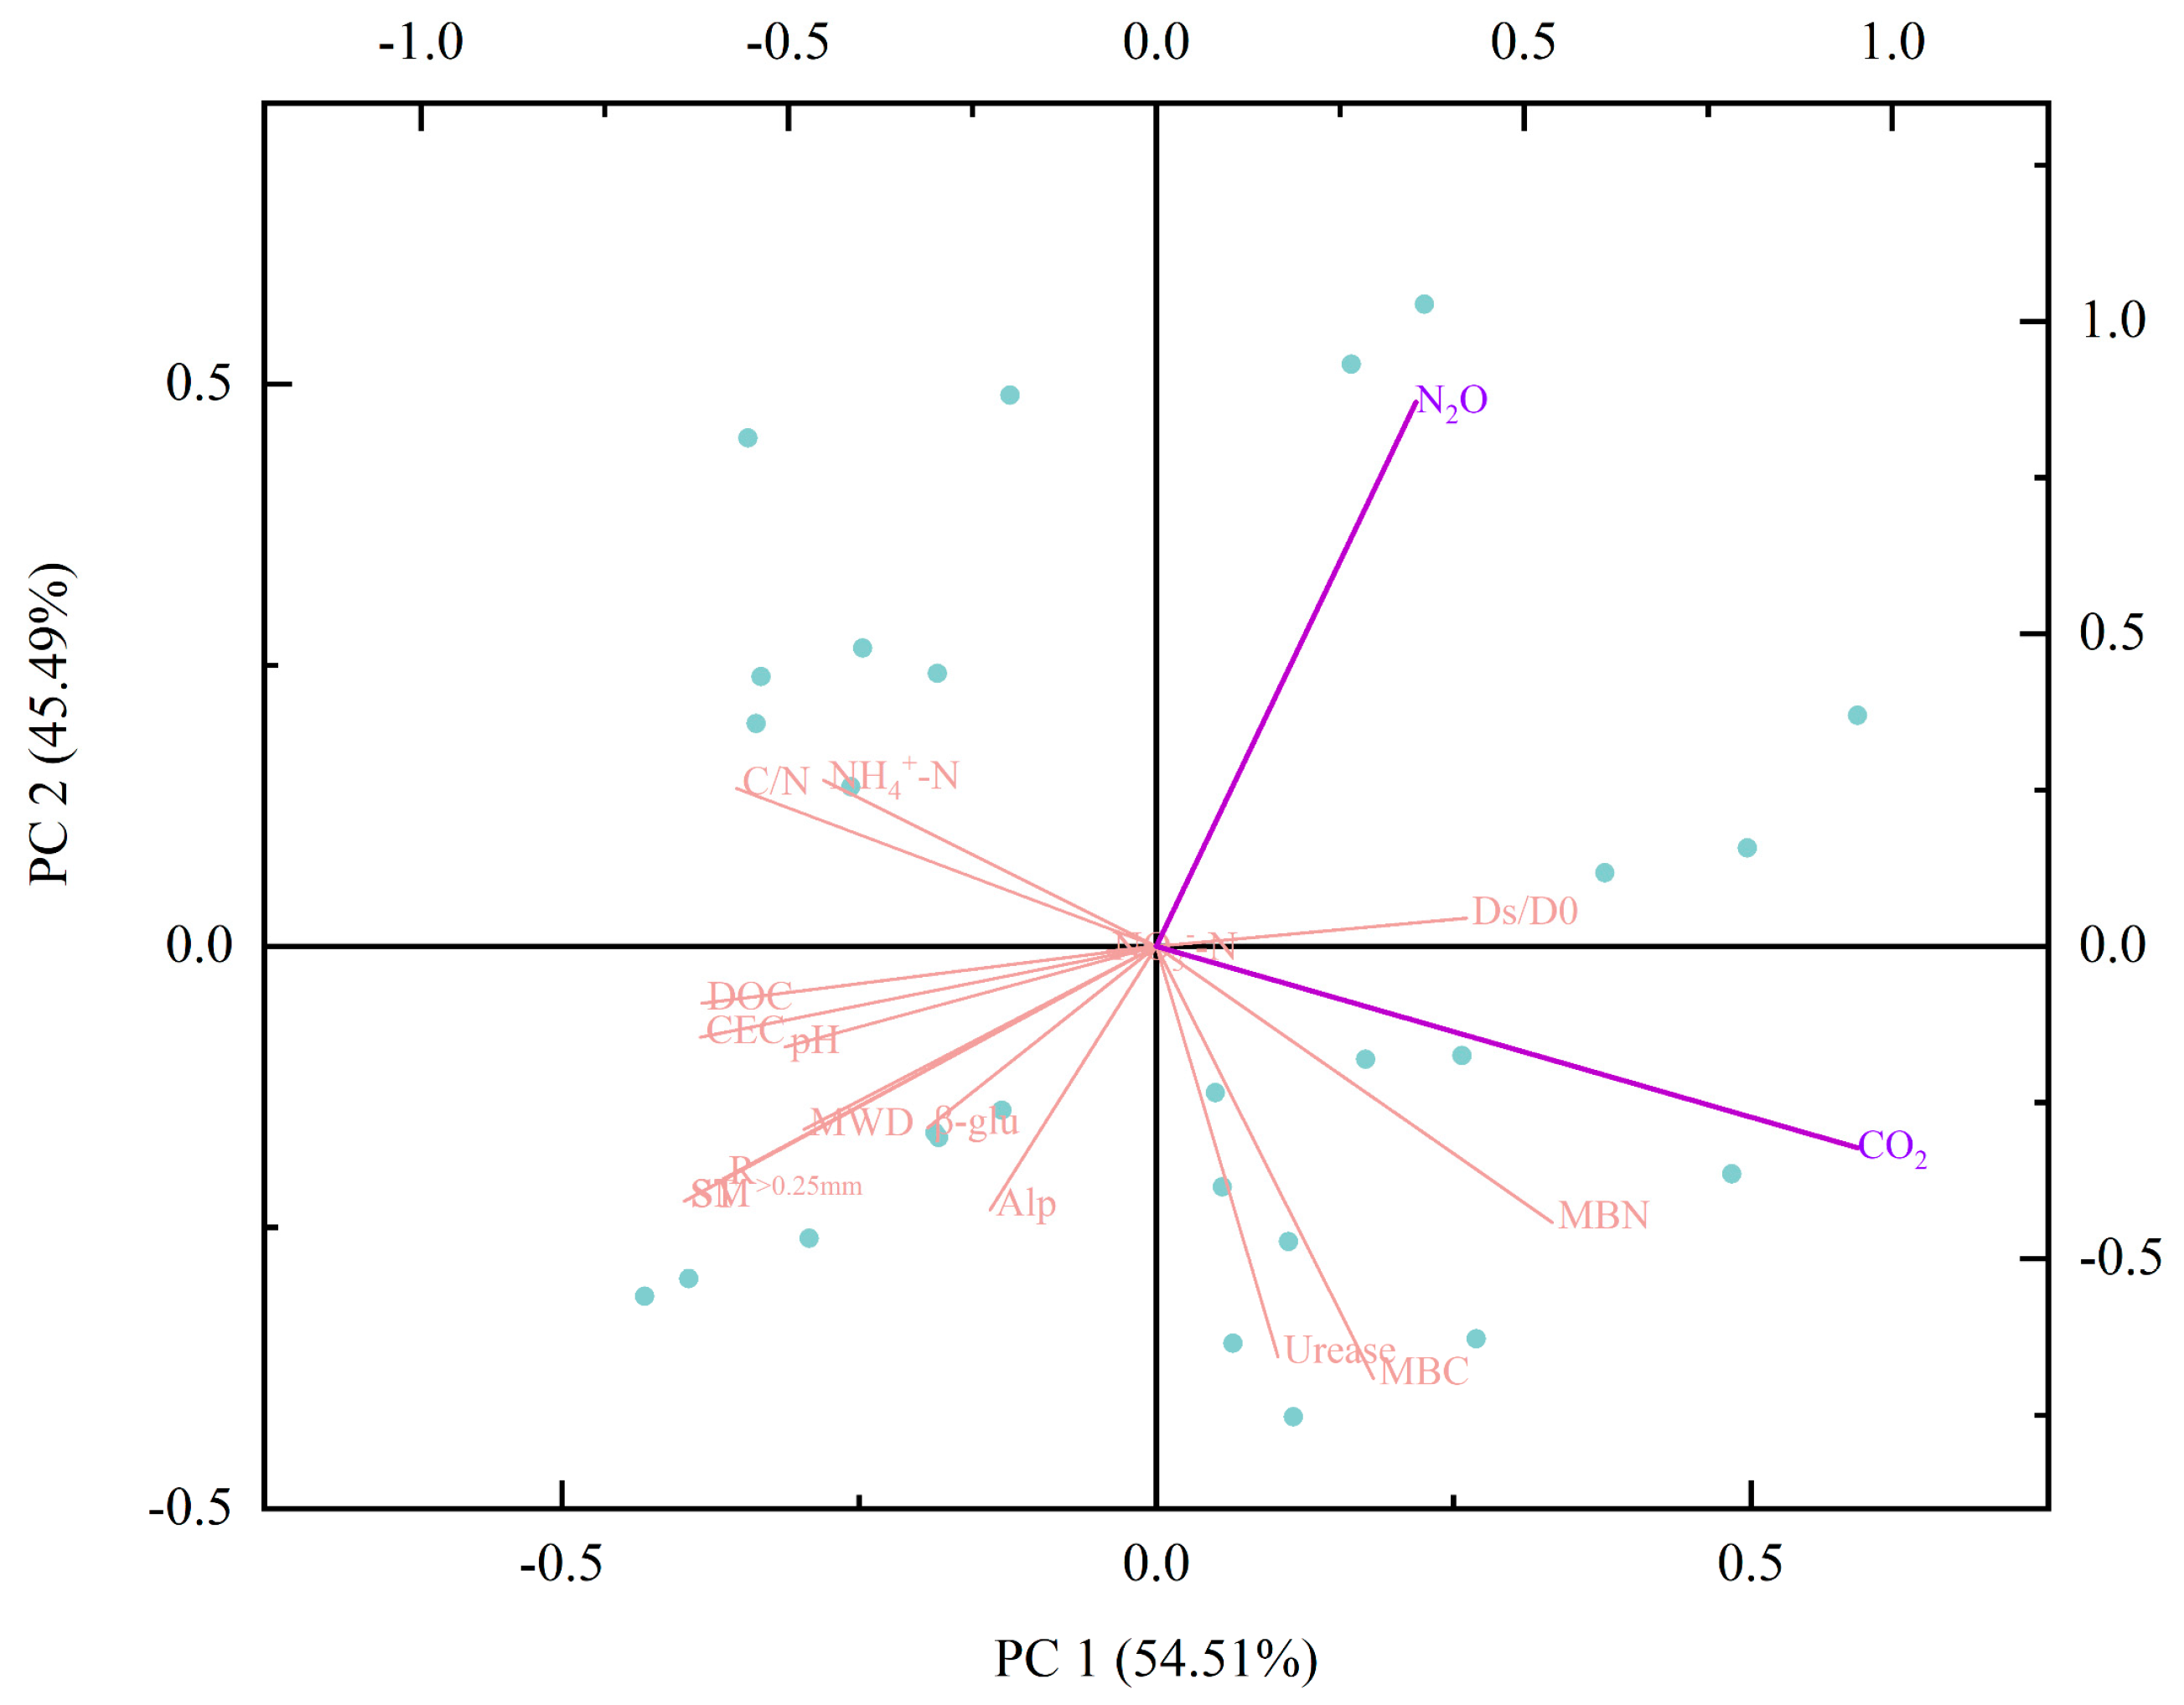
Correlation analysis was conducted between soil CO2 and N2O emissions and soil physicochemical properties (Figure 8). N2O was significantly negatively correlated with MBC (p < 0.05), MWD, R>0.25mm, soil moisture, soil temperature, urease, and alkaline phosphatase. CO2 was significantly positively correlated with MBC and MBN, and significantly negatively correlated with C/N, DOC, R>0.25mm, soil moisture, soil temperature, urease, and alkaline phosphatase (p < 0.05). To avoid collinearity among various indicators and further analyze the environmental factors affecting soil CO2 and N2O emissions, a redundancy analysis was conducted for each biochar treatment (Figure 9). PC1 and PC2 effectively explained the correlation between soil CO2, N2O, and soil environmental factors (88.8%). Specifically, urease, glucosidase, and alkaline phosphatase provided comprehensive explanatory powers of 97.6%, 52.9%, and 52.4%, respectively, for the response variables. CO2 was significantly positively affected by Ds/D0, MBC, MBN, and urease, and negatively affected by soil temperature and humidity, aggregate stability, C/N, DOC, CEC, and pH (p < 0.05). N2O was significantly positively affected by Ds/D0 and negatively affected by soil temperature, humidity, aggregate stability, C/N, CEC, pH, urease, β-glucosidase, and alkaline phosphatase (p < 0.05).

3.7. SEM of Soil CO2 and N2Oemission

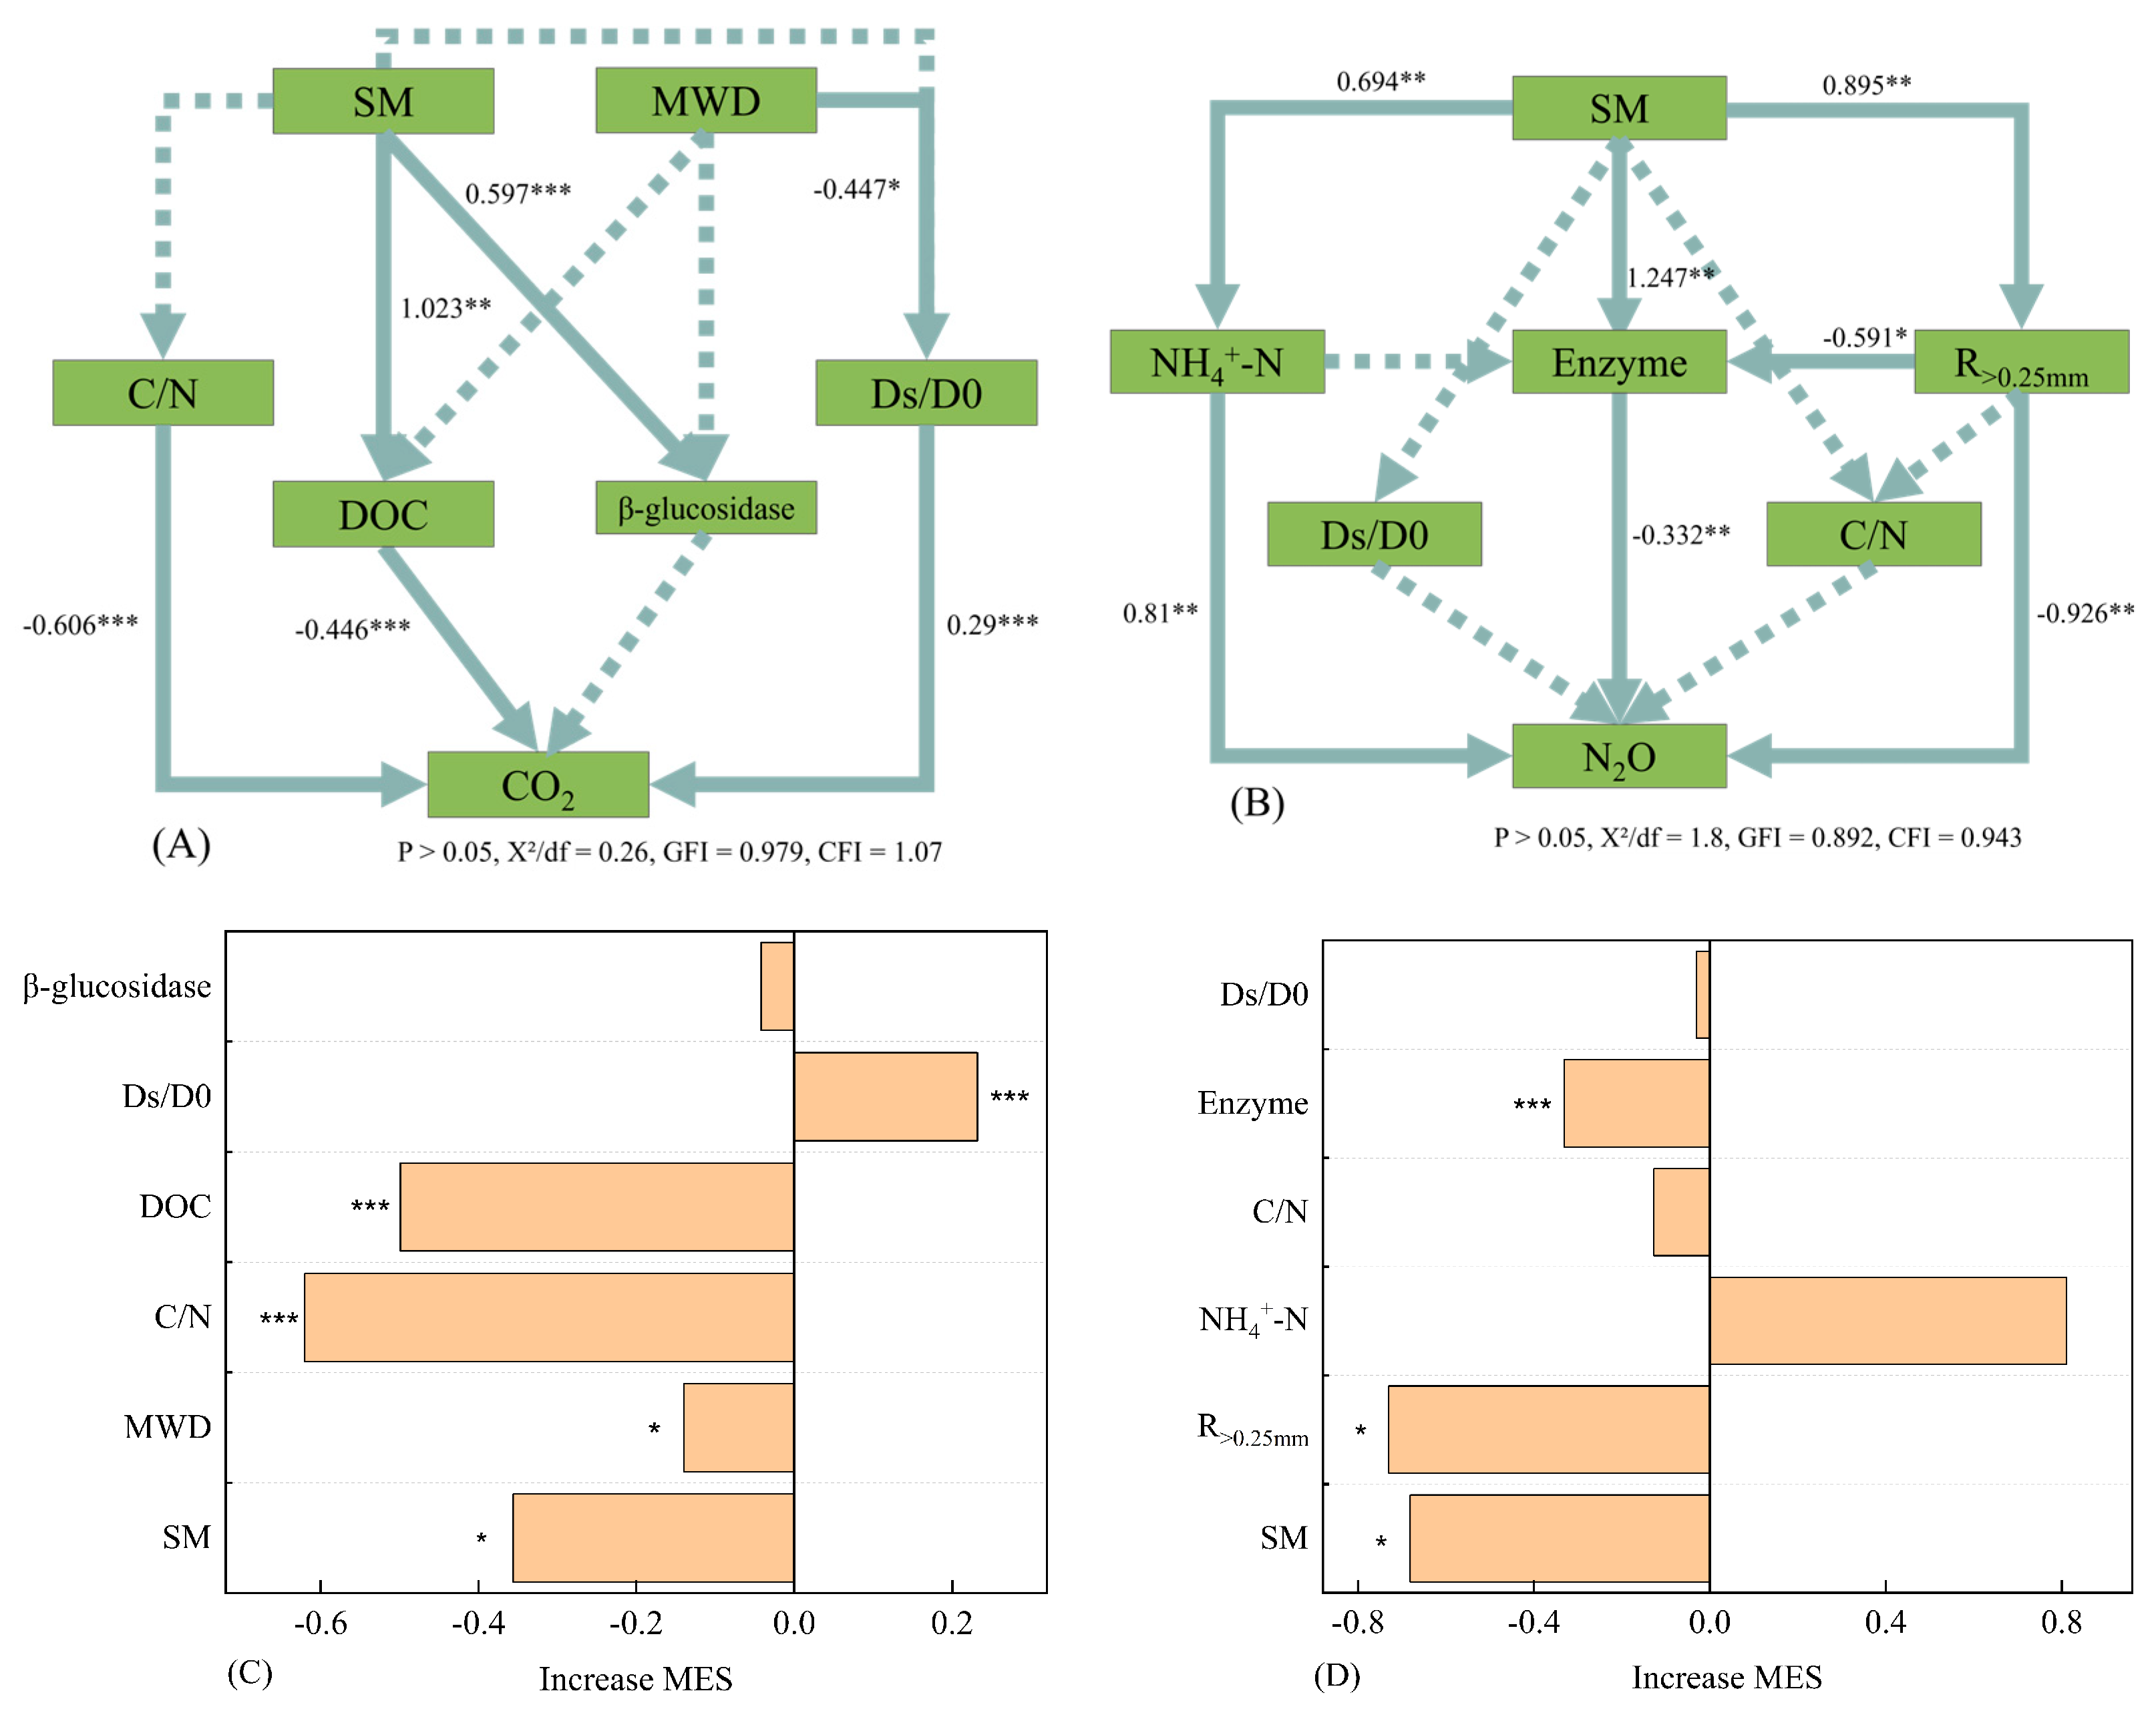
This study hypothesized that biochar could reduce CO2 and N2O emissions by regulating various soil properties, including temperature, humidity, aggregate stability, nutrient content, gas diffusivity, and enzyme activity. A path analysis was conducted to test this hypothesis (Figure 10A). The indices, χ2/df = 1.29, CIF = 0.96 > 0.9, CFI = 0.99 > 0.9, indicate that the structural equation can be used to explain the effect of soil water content on soil CO2 emissions. Soil water content directly affects DOC content in the topsoil layer, and ultimately indirectly affects CO2 emissions on the soil surface. The total effect of soil water content on soil CO2 emission was −0.36, meaning that for every unit increase in soil water content, soil surface CO2 decreased by 0.36 units. Activated biochar accounts for 73% of soil CO2 variation by altering soil moisture. The indices, χ2/df = 1.8, CFI = 0.943 > 0.9, indicate that the structural equation can be used to explain the effect of soil water content on soil N2O emissions (Figure 10B). Soil water content directly affects NH4+-N content, enzyme activities, and R>0.25mm in the topsoil layer, and ultimately indirectly affects N2O emission on the soil surface. The total effect of soil water content on soil N2O emission was −0.68, meaning that for every unit increase in soil water content, soil surface N2O decreased by 0.68 units.

4. Discussion

This study demonstrates that nitrogen-activated biochar (especially GAB15) synergistically mitigates farmland CO2 and N2O emissions (by 9.4% and 45.2%, respectively), with efficacy significantly surpassing conventional biochar (GB) (Figure 7). This aligns with the consensus that high-temperature biochar (>600 °C) exhibits superior mitigation efficiency [53,54,55]. Meta-analyses and field studies consistently report that biochar application reduces N2O emissions from agricultural soils, with reductions typically ranging from 13% to 48% [8,9,10]. Some studies report reductions in cumulative CO2 flux, particularly in clay or acidic soils and under certain application rates [14,15,16]. The CO2 reduction in this study reached 9.4%. This strongly demonstrates the superiority of the urea-N activation method used in this study in enhancing the emission reduction efficiency of biochar. Critically, the activation process enables directional optimization of physicochemical properties, thereby addressing the performance decay of conventional biochar during aging. For example, the significant increase in soil MWD under the experimental treatments can be attributed to the “activation” process itself. This process greatly enhanced the specific surface area, pore volume, and nitrogen-containing functional groups of the biochar, which allowed it to act as an efficient binder, adhering fine soil particles together and promoting the formation of large aggregates. The difference in MWD between GAB5 and GAB15 was not significant, which may be due to a “threshold effect” or “saturation effect” in the biochar’s improvement of soil physical structure (i.e., aggregation). Once the activation level reaches that of GAB5, its ability to promote aggregate formation as a physical binder may have approached its maximum. Although the higher activation ratio of GAB15 further enhanced its chemical properties (such as cation exchange capacity, CEC, Figure 6), the additional improvement in MWD became less pronounced, indicating diminishing returns. The mechanisms, comparisons, and limitations within the context of existing literature are discussed below.

4.1. The Mechanism of Soil CO2 Emission

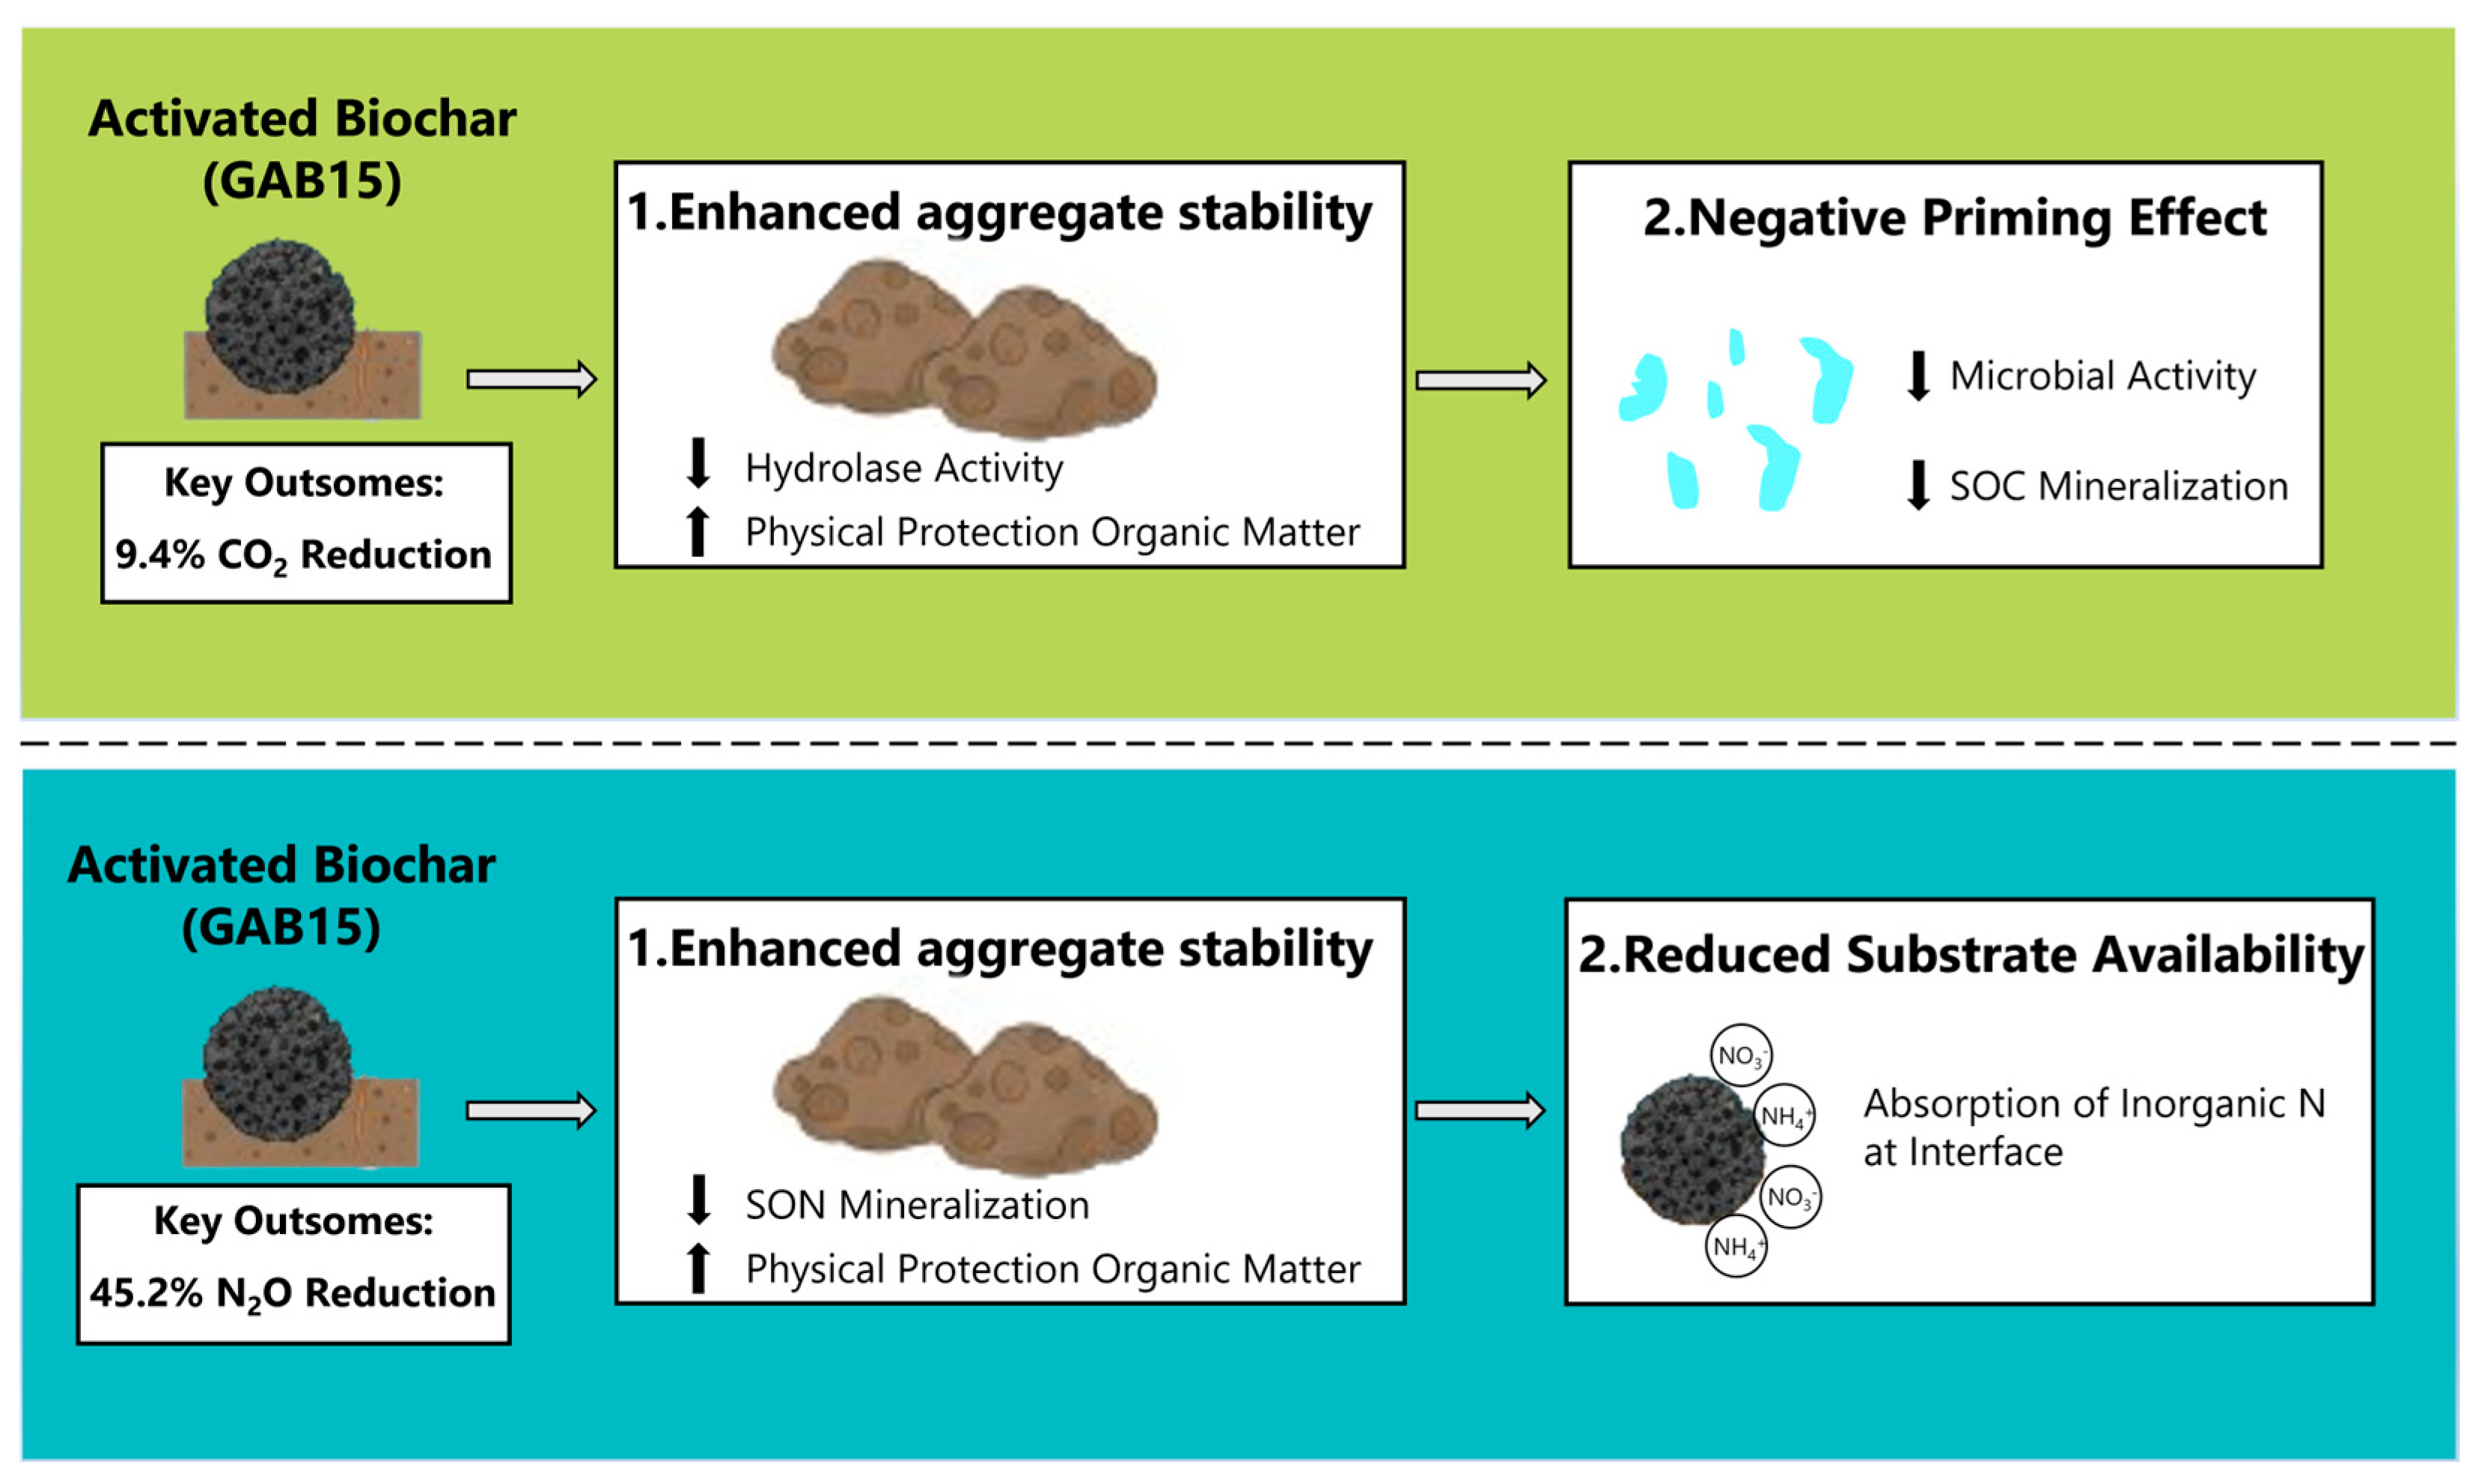
The observed reduction is attributable to two primary mechanisms (Figure 11). First, activated biochar induced a negative priming effect on native SOC mineralization. Microbial biomass analysis revealed that CO2 emissions were positively correlated with MBC and MBN but negatively correlated with MBC/MBN (p < 0.05) (Figure 9). This suggests that the elevated C/N ratio, likely driven by the urea-N activation, limited microbial activity and suppressed carbon mineralization, aligning with the concept of negative priming [56,57]. This mechanism contrasts with studies where dissolved organic carbon (DOC) is reported to drive CO2 increases [31]. Structural equation modeling (SEM) indeed showed a negative relationship between DOC and CO2 emissions in our study (Figure 10A). This apparent contradiction might be resolved by considering microbial carbon assimilation efficiency under nitrogen limitation. Under the high C/N conditions induced by activated biochar, microorganisms encounter abundant carbon sources (high DOC) but face critical nitrogen deficits for synthesizing proteins, enzymes, and cell walls. This nitrogen-starved state can severely impair their ability to assimilate and respire carbon efficiently [58,59], leading to DOC accumulation without proportional CO2 release, thereby explaining the observed negative DOC-CO2 relationship.
Second, activated biochar-enhanced soil aggregate stability, physically protecting organic matter and reducing its accessibility to microbes [60,61]. The formation of large aggregates via adsorption and adhesion between biochar and soil particles limits microbial decomposition activity. Consistent with this physical protection mechanism, the GAB15 treatment exhibited significantly lower carbon and nitrogen hydrolase activities than the GB treatment (p < 0.05) (Table 2). Redundancy analysis (RDA) further linked reduced enzyme activities, particularly β-glucosidase, to increased aggregate stability (p < 0.05) (Figure 9). SEM analysis (Figure 10A) also suggested that large aggregates reduced soil aeration under high-moisture conditions, potentially limiting aerobic decomposition processes.
Compared to conventional biochar (GB) and the broader literature, the unique physicochemical properties of activated biochar (GAB15), characterized by its high surface area and CEC, likely amplified both the negative priming effect (through stronger N-immobilization) and the aggregate protection effect (through enhanced particle binding) (Table 1 and Figure 2). This synergistic enhancement provides a mechanistic explanation for its superior CO2 mitigation efficiency over GB and aligns with the consensus linking high-temperature biochar (>600 °C), which often possess similar properties, to superior GHG mitigation [53,54,55]. Unlike KOH activation, which primarily aims to achieve high specific surface area, the core of urea activation in this study is “surface nitrogen functionalization.” By introducing abundant nitrogen-containing functional groups (such as N-H and C-N bonds, as shown by FTIR analysis), the cation exchange capacity (CEC) of biochar was greatly enhanced, which directly improved its ability to adsorb and retain NH4+-N in the soil (an increase of 88.2%). This is one of the key mechanisms for N2O reduction and represents an advantage that traditional activation methods cannot easily match. The KOH pre-treatment in this study was primarily aimed at “pore expansion,” providing more exposed sites for the nitrogen-containing functional groups introduced by urea, thereby amplifying their functional effect. This “pore expansion + functionalization” synergistic strategy enables the activated biochar to not only possess physical adsorption capabilities but also exhibit efficient chemical adsorption and ion exchange abilities. This is the key factor that makes its emission reduction performance superior to studies using a single activation method. In addition, the noted potential for biochar with labile carbon to increase emissions [34] underscores the critical importance of biochar feedstock and production parameters, necessitating further validation of our activated biochar’s efficacy across diverse soil types and management practices.

4.2. The Mechanism of Soil N2O Emissions

The study found that activated biochar significantly reduced soil N2O emissions by 45.2% with GAB15 (Figure 7). This substantial reduction aligns well with the consensus from meta-analyses and field studies reporting N2O emission reductions typically ranging from 13% to 48% from agricultural soils amended with biochar [8,9,10]. However, it is important to explicitly recognize that exceptions exist, with some studies reporting increased N2O emissions under specific conditions, notably high nitrogen fertilization rates [35,62,63,64]. Our findings demonstrate a strong mitigating effect under the tested nitrogen regime, suggesting that activated biochar can be effective, but its performance may be context-dependent, particularly on N input levels. Additionally, the dynamic changes in pH may be a key factor influencing microbial activity and N2O emissions. The results of soil pH monitored at different growth stages (DAS20, DAS40, DAS60) (as shown in Figure 6) indicated that, compared to the fertilization control (GC), activated-biochar treatments (especially GAB15) significantly and stably increased soil pH. This phenomenon may be attributed to the strong buffering capacity of activated biochar, which effectively counteracts soil acidification potentially caused by fertilization, thereby creating a more stable pH environment for microbial processes. Thus, it can be inferred that this process is one of the mechanisms by which activated biochar regulates the nitrogen cycle and reduces N2O emissions.
Soil N2O is primarily microbially produced via nitrification and denitrification, processes heavily dependent on inorganic nitrogen (NH4+-N and NO3-N) availability. The key mechanism identified here was the reduced substrate availability for these processes (Figure 11). Activated biochar significantly enhanced aggregate stability, which limited organic nitrogen mineralization and reduced mineralization intensity (p < 0.05). This physical encapsulation mechanism, limiting substrate access to microbes, is a commonly cited explanation for biochar’s N2O mitigation [32,65] and was clearly operational in our system.
Furthermore, the GAB15 treatment showed significantly higher NH4+-N levels (Figure 6), attributed to its increased specific surface area and CEC (p < 0.05) (Figure 6 and Table 1). These enhanced properties enabled the activated biochar to adsorb inorganic nitrogen effectively, acting as a sink and restricting its immediate availability for nitrification and denitrification, thereby reducing N2O production [7]. This adsorption mechanism is widely supported in the literature but stands in contrast to studies where biochar might facilitate nitrification under certain conditions. The SEM analysis (Figure 10B) provided an interesting nuance: it indicated that hydrolase enzymes were negatively associated with N2O emissions. This observation differs from some studies where hydrolases (indicating mineralization activity) are often linked to N2O precursor production [62,66,67]. A plausible explanation for the result is that activated biochar’s adsorption might reduce the spatial separation between hydrolases and organic matter within aggregates, enhancing hydrolysis efficiency locally. Simultaneously, the adsorption of inorganic nitrogen (particularly NH4+) at the biochar–soil interface could directly inhibit nitrifying bacteria, the primary N2O producers in many aerobic soils. This highlights the multifunctionality of activated biochar in modulating both enzyme activity spatial dynamics and nitrogen substrate availability at microsites. Activated biochar (especially GAB15) has extremely high CEC and a large specific surface area, which allows it to strongly fix NH4+-N ions generated after fertilization through electrostatic adsorption at the biochar–soil interface. This powerful adsorption capacity has two direct consequences: the adsorbed NH4+-N cannot be immediately utilized by nitrifying microbes, thereby slowing its conversion rate to NO3-N, which reduces the substrates for nitrification and denitrification processes at the source; biochar acts as an “ammonium reservoir,” slowly releasing the adsorbed NH4+-N for crop absorption. This explains why, in the GAB15 treatment, soil NH4+-N concentrations remain at a relatively high stable level for a longer period, rather than rapidly decreasing after a sharp peak as observed with traditional fertilization. Therefore, this “sustained high” dynamic pattern is key evidence of how biochar regulates nitrogen supply and reduces N2O emissions through its adsorption capacity.
In summary, the superior N2O mitigation by activated biochar (GAB15) over conventional biochar (GB) can be mechanistically explained by its amplified ability to (i) physically protect substrates via enhanced aggregate formation and stability, and (ii) chemically immobilize inorganic N via superior adsorption capacity (surface area, CEC). However, the documented potential for increased N2O under high N fertilization emphasizes the need to validate the efficacy and optimal application rates of activated biochar across a wider range of nitrogen management scenarios and soil conditions.

4.3. Practical Implications and Limitations

This study highlights the stability and efficiency of activated biochar, particularly GAB15, in reducing CO2 and N2O emissions. The optimal corn straw-to-urea ratio of 15:1 achieved reductions of 9.4% for CO2 and 45.2% for N2O, offering a robust solution for clean agricultural production. By recycling agricultural waste, this approach mitigates pollution, enhances straw utilization, and addresses greenhouse gas regulation challenges.
Practically, activated biochar can be applied by spraying onto soil surfaces before planting and incorporating into the root zone, akin to fertilization, posing no technical barriers to sustainable agriculture. Its slow-release properties further enhance long-term nutrient management. However, biochar aging may reduce adsorption and aggregation, necessitating studies on long-term effects. The ammonium ions released simultaneously are also likely to be converted into ammonia gas. This study did not directly measure NH3 volatilization. Therefore, it can be inferred that future assessments of the production benefits of activated biochar should consider the impacts of various nitrogen loss pathways, such as NH3 volatilization, N leaching, and runoff losses.
Limitations include the lack of in-depth analysis of microbial community changes, which may influence reduction mechanisms [68]. Additionally, the protective effect on SOC requires quantitative assessment via isotope labeling to clarify negative priming intensity. The study’s focus on a specific soil type calls for validation across diverse soils and climates.
It is important to clarify that chemical activation using KOH and urea is a resource- and energy-intensive process, and its environmental benefits throughout the entire life cycle need to be determined through a more comprehensive assessment. This study did not quantify or assess whether residual alkalis (from KOH) or excess soluble nitrogen (from urea) in the activated biochar might pose potential environmental risks to the soil, such as increasing soil salinity or causing nitrate leaching into groundwater. These are key issues that must be addressed before the technology can move from the laboratory to large-scale application, and future research should include evaluations of these potential risks. Additionally, it should not be overlooked that this study used column/greenhouse conditions with an application rate of 3% (w/w). At a field scale, such application rates may correspond to tens of tons per hectare, which is not realistic. When considering broader applicability, field-specific dosages, costs, and feasibility need to be included in the economic evaluation. In future research, in addition to elucidating the emission reduction mechanisms and stability of activated biochar, the technical feasibility (including optimizing application rates and methods) and economic feasibility (cost–benefit analysis) of applying activated biochar at field scale should be evaluated, with further translational research and comprehensive techno-economic assessments.
In addition, the 60-day duration provided valuable information on the initial effects of activated biochar, but it does not fully capture the dynamic changes in its long-term effects in the soil. Many of biochar’s key benefits, such as stable carbon sequestration, sustained improvements in soil structure, and its profound impacts on microbial communities, typically become fully evident only after multiple growing seasons or even several years of long-term field application. Therefore, the long-term stability of the greenhouse gas reduction effects observed in this study still requires validation. Future research must shift to long-term, field-based trials to assess the persistence and comprehensive environmental benefits of activated biochar in real agricultural ecosystems.

5. Conclusions

This study clearly demonstrates that urea-N activated biochar can effectively mitigate CO2 and N2O emissions from agricultural soils through synergistic physical protection and biochemical regulation. Among the treatments, the activated biochar with a corn stover to urea mass ratio of 15:1 (GAB15) exhibited the highest efficacy. Under the 60-day pot experiment conditions, it significantly reduced cumulative CO2 and N2O emissions by 9.4% and 45.2%, respectively. The emission reduction mechanisms are as follows: (1) physical protection of organic carbon through improved soil aggregate stability, coupled with the negative priming effect triggered by a high microbial biomass carbon-to-nitrogen ratio (MBC/MBN), which inhibits CO2 production; (2) enhancement of aggregate stability to limit nitrogen mineralization, combined with the biochar’s high adsorption capacity to immobilize inorganic nitrogen, thereby reducing substrate availability for nitrification and denitrification and ultimately inhibiting N2O production. This study confirms that targeted activation modification is an effective strategy to overcome the inconsistent efficacy of conventional biochar, providing a solution for the valorization of agricultural waste and the mitigation of agricultural greenhouse gases. Future research should focus on long-term field trials to verify its persistence under realistic agricultural conditions and should also include techno-economic assessments to promote the large-scale application of this technology.

Author Contributions

Data curation, X.L., D.L. and H.W.; Funding acquisition, C.Z. and H.D.; Methodology, C.C., K.L. and H.W.; Resources, P.Y. and H.W.; Software, P.L. and H.W.; Writing—original draft, X.W. and Y.Z. All authors have read and agreed to the published version of the manuscript.

Funding

State Key Laboratory of Efficient Utilization of Agricultural Water Resources, Hengshui Experiment Station; Hebei Province Agricultural Innovation Engineering Project: 2022KJCXZX-HZS-8; Hebei Province Corn Industry System Hengshui Experiment Station.

Data Availability Statement

Data will be available on request.

Conflicts of Interest

The authors declare no conflicts of interest.

References

  1. Qi, L.; Pokharel, P.; Chang, S.X.; Zhou, P.; Niu, H.; He, X.; Wang, Z.; Gao, M. Biochar application increased methane emission, soil carbon storage and net ecosystem carbon budget in a 2-year vegetable–rice rotation. Agric. Ecosyst. Environ. 2020, 292, 106831. [Google Scholar] [CrossRef]
  2. Han, J.; Zhang, A.; Kang, Y.; Han, J.; Yang, B.; Hussain, Q.; Wang, X.; Zhang, M.; Khan, M.A. Biochar promotes soil organic carbon sequestration and reduces net global warming potential in apple orchard: A two-year study in the loess plateau of China. Sci. Total Environ. 2021, 803, 150035. [Google Scholar] [CrossRef] [PubMed]
  3. Zhang, Y.; Mai, H.; Qiu, Q.; Zhu, Y.; Long, J.; Chen, S.; Chen, Y. The responses of c, n, p and stoichiometric ratios to biochar and vermicompost additions differ from alfalfa and a mine soil. Agriculture 2023, 13, 1954. [Google Scholar] [CrossRef]
  4. Qi, L.; Pokharel, P.; Ni, C.; Gong, X.; Zhou, P.; Niu, H.; Wang, Z.; Gao, M. Biochar changes thermal activation of greenhouse gas emissions in a rice–lettuce rotation microcosm experiment. J. Clean. Prod. 2020, 247, 119148. [Google Scholar] [CrossRef]
  5. Huang, R.; Wang, Z.; Xiao, Y.; Yu, L.; Gao, X.; Wang, C.; Li, B.; Tao, Q.; Xu, Q.; Gao, M. Increases of temperature response for CO2 emission in a biochar-amended vegetable field soil. Environ. Sci. Pollut. Res. 2021, 29, 50895–50905. [Google Scholar] [CrossRef]
  6. Lv, L.; Huang, S.; Zhou, H. Performance investigation of biochar/paraffin composite phase change materials in latent heat storage systems: Feasibility of biochar as a thermal conductivity enhancer. J. Energy Storage 2024, 91, 112106. [Google Scholar] [CrossRef]
  7. Rijk, I.; Ekblad, A.; Dahlin, A.S.; Enell, A.; Larsson, M.; Leroy, P.; Kleja, D.B.; Tiberg, C.; Hallin, S.; Jones, C. Biochar and peat amendments affect nitrogen retention, microbial capacity and nitrogen cycling microbial communities in a metal and polycyclic aromatic hydrocarbon contaminated urban soil. Sci. Total Environ. 2024, 936, 173454. [Google Scholar] [CrossRef]
  8. Zhong, L.; Gu, Z.; Song, Y.; Wang, H.; Cai, X.; Xu, X. Biochar reduces N2O emission from fertilized cropland soils: A meta-analysis. Carbon Res. 2024, 4, 31. [Google Scholar] [CrossRef]
  9. Valkama, E.; Tzemi, D.; Esparza-Robles, U.R.; Syp, A.; O’Toole, A.; Maenhout, P. Effectiveness of soil management strategies for mitigation of N2O emissions in European arable land: A meta-analysis. Eur. J. Soil Sci. 2024, 5, 75. [Google Scholar] [CrossRef]
  10. Zhang, Y.; Yan, C.; Wang, T.; Zhang, G.; Bahn, M.; Mo, F. Biochar strategy for long-term N2O emission reduction: Insights into soil physical structure and microbial interaction. Soil Biol. Biochem. 2025, 202, 109685. [Google Scholar] [CrossRef]
  11. Wu, D.; Senbayram, M.; Zang, H.; Ugurlar, F.; Blagodatskaya, E. Effect of biochar origin and soil pH on greenhouse gas emissions from sandy and clay soils. Appl. Soil Ecol. 2018, 129, 121–127. [Google Scholar] [CrossRef]
  12. Wang, B.; Gao, Y.; Lai, X.; LLuo Zhang, X.; Hu, D.; Shen, Z.; Hu, S.; Zhang, L. The effects of biochar derived from feedstock with different Si and Al concentration on soil N2O and CO2 emissions. Environ. Pollut. 2023, 317, 120731. [Google Scholar] [CrossRef] [PubMed]
  13. Aamer, M.; Shaaban, M.; Hassan, M.U.; Guoqin, H.; Ying, L.; Ying, T.H. Biochar mitigates the N2O emissions from acidic soil by increasing the nosZ and nirK gene abundance and soil pH. J. Environ. Manag. 2020, 255, 109891. [Google Scholar] [CrossRef]
  14. Brassard, P.; Godbout, S.; Palacios, J.H.; Jeanne, T.; Hogue, R.; Dubé, P.; Limousy, L.; Raghavan, V. Effect of six engi-neered biochars on GHG emissions from two agricultural soils: A short-term incubation study. Geoderma 2018, 327, 73–84. [Google Scholar] [CrossRef]
  15. Yang, W.; Zhang, L.; Wang, Z.; Zhang, J.; Li, P.; Su, L. Effects of biochar and nitrogen fertilizer on microbial communities, CO2 emissions, and organic carbon content in soil. Sci. Rep. 2025, 15, 9789. [Google Scholar] [CrossRef]
  16. Wang, Y.; Liu, C.; Wang, W. Response mechanisms of agricultural soil biochemical properties and CO2 emissions to field application of modified biochar. J. Soils Sediments 2024, 24, 1194–1205. [Google Scholar] [CrossRef]
  17. Bovsun, M.A.; Castaldi, S.; Nesterova, O.V.; Semal, V.A.; Sakara, N.A.; Brikmans, A.V.; Khokhlova, A.I.; Karpenko, T.Y. Effect of biochar on soil CO2 fluxes from agricultural field experiments in Russian Far East. Agronomy 2021, 11, 1559. [Google Scholar] [CrossRef]
  18. Oladele, S.O.; Adetunji, A.T. Agro-residue biochar and N fertilizer addition mitigates CO2-C emission and stabilized soil organic carbon pools in a rain-fed agricultural cropland. Int. Soil Water Conserv. Res. 2021, 9, 76–86. [Google Scholar] [CrossRef]
  19. Lee, S.I.; Park, H.J.; Jeong, Y.J.; Seo, B.S.; Kwak, J.H.; Yang, H.I.; Choi, W.J. Biochar-induced reduction of N2O emission from East Asian soils under aerobic conditions: Review and data analysis. Environ. Pollut. 2021, 291, 118154. [Google Scholar] [CrossRef]
  20. Alkiewicz, A.; Kalinichenko, K.; Kubaczyński, A.; Brzezińska, M.; Bieganowski, A. Usage of biochar for mitigation of CO2 emission and enhancement of CH4 consumption in forest and orchard Haplic Luvisol (Siltic) soils. Appl. Soil Ecol. 2020, 156, 103711. [Google Scholar] [CrossRef]
  21. Fidel, R.B.; Laird, D.A.; Parkin, T.B. Effect of biochar on soil greenhouse gas emissions at the laboratory and field scales. Soil Syst. 2019, 3, 8. [Google Scholar] [CrossRef]
  22. Case, S.D.; McNamara, N.P.; Reay, D.S.; Stott, A.W.; Grant, H.K.; Whitaker, J. Biochar suppresses N2O emissions while maintaining N availability in a sandy loam soil. Soil Biol. Biochem. 2015, 81, 178–185. [Google Scholar] [CrossRef]
  23. Bai, J.; Moreira, B.R.D.A.; Bai, Y.; Nadar, C.G.; Feng, Y.; Yadav, S. Assessing biochar’s impact on greenhouse gas emissions, microbial biomass, and enzyme activities in agricultural soils through meta-analysis and machine learning. Sci. Total Environ. 2025, 963, 178541. [Google Scholar] [CrossRef]
  24. Gabetto, F.P.; Tenelli, S.; Netto-Ferreira, J.B.; Martins Junior, J.; Almeida, O.A.C.; Cosenza, M.L.; Cosenza, M.L.; Cosenza, M.; Carvalho, J.L.N. Biochar from crop residues mitigates N2O emissions and increases carbon content in tropical soils. Biofuels Bioprod. Biorefin. 2025, 19, 759–775. [Google Scholar] [CrossRef]
  25. Shakoor, A.; Arif, M.S.; Shahzad, S.M.; Farooq, T.H.; Ashraf, M. Does biochar accelerate the mitigation of greenhouse gaseous emissions from agricultural soil?—A global meta-analysis. Environ. Res. 2021, 202, 111789. [Google Scholar] [CrossRef] [PubMed]
  26. Hamad, A.A.A.; Ni, L.; Shaghaleh, H.; Elsadek, E.; Hamoud, Y.A. Effect of carbon con-tent in wheat straw biochar on N2O and CO2 emissions and pakchoi productivity under different soil moisture conditions. Sustainability 2023, 15, 5100. [Google Scholar] [CrossRef]
  27. Borchard, N.; Schirrmann, M.; Cayuela, M.L.; Kammann, C.; Wrage-Mönnig, N.; Estavillo, J.M.; Novak, J. Biochar, soil and land-use interactions that reduce nitrate leaching and N2O emissions: A meta-analysis. Sci. Total Environ. 2019, 651, 2354–2364. [Google Scholar] [CrossRef] [PubMed]
  28. Hao, H.; Dandan, L.; Zhurong, W.; Ze, W.; Zhenghua, H.; Shuyun, Y. Assessment of the straw and biochar application on greenhouse gas emissions and yield in paddy fields under intermittent and controlled irrigation patterns. Agric. Ecosyst. Environ. 2024, 359, 108745. [Google Scholar] [CrossRef]
  29. Jia, F.; Xuhui, Z.; Yanghui, H.; Ruiqiang, L.; Yixian, Y.; Guiyao, Z.; Hongyang, C.; Lingyan, Z.; Yuling, F.; Hosseini, B.S. Co-application of biochar and organic amendments on soil greenhouse gas emissions: A meta-analysis. Sci. Total Environ. 2023, 897, 166171. [Google Scholar] [CrossRef]
  30. Jinze, B.; Jiajie, S.; Danyang, C.; Zhihao, Z.; Qi, Y.; Guangxin, R.; Xinhui, H.; Xiaojiao, W.; Chengjie, R.; Gaihe, Y.; et al. Biochar combined with n fertilization and straw return in wheat-maize agroecosystem: Key practices to enhance crop yields and minimize carbon and nitrogen footprints. Agric. Ecosyst. Environ. 2023, 347, 108366. [Google Scholar] [CrossRef]
  31. Zhang, J.; Li, Q.; Zhang, J.; Liu, H.; Wang, H.; Zhang, J. Enhanced CO2 absorption in amine-based carbon capture aided by coconut shell-derived nitrogen-doped biochar. Sep. Purif. Technol. 2024, 353, 128451. [Google Scholar] [CrossRef]
  32. Huan, Z.; Zifang, W.; Hai, L.; Houjun, X.; Ming, G. Water-stable aggregates and aggregate-associated organic carbon after two years of biochar application. Arch. Agron. Soil Sci. 2023, 69, 2218–2232. [Google Scholar] [CrossRef]
  33. Hematimatin, N.; Igaz, D.; Aydın, E.; Horák, J. Biochar application regulating soil inorganic nitrogen and organic carbon content in cropland in the central europe: A seven-year field study. Biochar 2024, 6, 14. [Google Scholar] [CrossRef]
  34. Wu, J.; Teng, B.; Zhong, Y.; Duan, X.; Gong, L.; Guo, W.; Qi, P.; Haider, F.U.; Cai, L. Enhancing soil aggregate stability and organic carbon in northwestern China through straw, biochar, and nitrogen supplementation. Agronomy 2024, 14, 899. [Google Scholar] [CrossRef]
  35. Ojeda, G.; Gil, J.M.; Mattana, S.; Bachmann, J.; Quenea, K.; Sobral, A.J. Biochar ageing effects on soil respiration, biochar wettability and gaseous CO2 adsorption. Mitig. Adapt. Strateg. Glob. Change 2024, 29, 11. [Google Scholar] [CrossRef]
  36. Thers, H.; Abalos, D.; Dörsch, P.; Elsgaard, L. Nitrous oxide emissions from oilseed rape cultivation was unaffected by flash pyrolysis biochar of different type, rate and field ageing. Sci. Total Environ. 2020, 724, 138140. [Google Scholar] [CrossRef]
  37. Liao, X.; Kang, H.; Haider, G.; Wang, W.; Malghani, S. The impact of biochar on the activities of soil nutrients acquisition enzymes is potentially controlled by the pyrolysis temperature: A meta-analysis. Geoderma 2022, 411, 115692. [Google Scholar] [CrossRef]
  38. Baraket, F.; González, M.; Brahim, N.; Roca, N.; Mbarek, H.; Świtoniak, M.; Chaker, R.; Sánchez bellón, Á.; Rigane, H.; Gargouri, K.; et al. Short and long-term effect of land use and management on soil organic carbon stock in semi-desert areas of north Africa Tunisia. Agriculture 2021, 11, 1267. [Google Scholar] [CrossRef]
  39. Yu, J.; Guo, M.; Faheem, M.; Wang, A.; Zhang, F.; Li, Q.; Zhu, G. One-pot synthesis of highly ordered nitrogen-containing mesoporous carbon with resorcinol–urea–formaldehyde resin for co 2 capture. Carbon 2014, 69, 502–514. [Google Scholar] [CrossRef]
  40. Ouassim, B.; Ahmed, S.; Fouad, G.; Ouafae, A.; Mouad, D.; Tarik, C. CO2 capture using n-containing nanoporous activated carbon obtained from argan fruit shells. J. Environ. Chem. Eng. 2018, 6, 1995–2002. [Google Scholar] [CrossRef]
  41. Zhang, L. Preparation of Activated Carbon Derived from Sugarcane Bagasse for CO2 Adsorption. Master’s Thesis, Wuhan University of Science and Technology, Wuhan, China, 2019. [Google Scholar]
  42. Ismail, I.S.; Singh, G.; Smith, P.; Kim, S.; Vinu, A. Oxygen functionalized porous activated biocarbons with high surface area derived from grape marc for enhanced capture of CO2 at elevated-pressure. Carbon 2020, 160, 113–124. [Google Scholar] [CrossRef]
  43. Qu, J.; Wang, Y.; Tian, X.; Jiang, Z.; Deng, F.; Tao, Y.; Qun, J.; Lei, W.; Ying, Z. Koh-activated porous biochar with high specific surface area for adsorptive removal of chromium (vi) and naphthalene from water: Affecting factors, mechanisms and reusability exploration. J. Hazard. Mater. 2020, 401, 123292. [Google Scholar] [CrossRef]
  44. Ma, Q.; Chen, W.; Jin, Z.; Chen, L.; Jiang, X. One-step synthesis of microporous nitrogen-doped biochar for efficient removal of CO2 and H2S. Fuel 2021, 289, 119932. [Google Scholar] [CrossRef]
  45. Hisse, D.; Bessa, I.A.; Silva, L.P.; da Silva, A.F.; Araujo, J.R.; Archanjo, B.S.; Soares, A.V.H.; Passos, F.B.; Carneiro, J.W.M.; dos Santos, T.C.; et al. Microporous Nitrogen-Doped Activated Biochars Derived from Corn: Use of Husk Waste and Urea for CO2 Capture. J. Braz. Chem. Soc. 2024, 35, e-20240034. [Google Scholar] [CrossRef]
  46. Yuan, X.; Suvarna, M.; Lim, J.Y.; Pérez-Ramírez, J.; Wang, X.; Ok, Y.S. Active learning-based guided synthesis of engineered biochar for CO2 capture. Environ. Sci. Technol. 2024, 58, 6628–6636. [Google Scholar] [CrossRef]
  47. Gao, X.P.; Rajendran, N.; Tenuta, M.; Dunmola, A.; Burton, D.L. Greenhouse gas accumulation in the soil profile is not always related to surface emissions in a prairie pothole agricultural landscape. Soil Sci. Soc. Am. J. 2014, 78, 805–817. [Google Scholar] [CrossRef]
  48. Khan, M.N.; Li, D.; Shah, A.; Huang, J.; Zhang, L.; Núez-Delgado, A.; Han, T.; Du, J.; Ali, S.; Sial, T.A. The impact of pristine and modified rice straw biochar on the emission of greenhouse gases from a red acidic soil. Environ. Res. 2022, 208, 112676. [Google Scholar] [CrossRef] [PubMed]
  49. Sun, Y.P.; Yang, J.S.; Yao, R.J.; Chen, X.B.; Wang, X.P. Biochar and fulvic acid amendments mitigate negative effects of coastal saline soil and improve crop yields in a three year field trial. Sci. Rep. 2020, 10, 8946. [Google Scholar] [CrossRef]
  50. Alef, K.; Nannipieri, P. (Eds.) Methods in Applied Soil Microbiology and Biochemistry; Academic Press: Cambridge, MA, USA, 1995; pp. 569–576. [Google Scholar] [CrossRef]
  51. Eivazi, F.; Tabatabai, M.A. Phosphatases in soils. Soil Biol. Biochem. 1977, 9, 167–172. [Google Scholar] [CrossRef]
  52. Marshall, T.J. The diffusion of gases through porous media. J. Soil Sci. 1959, 10, 79–82. [Google Scholar] [CrossRef]
  53. Sun, H.; Zhang, X.; Zhang, J.; Wang, C.; Zhou, S. Long term comparison of ghg emissions and crop yields in response to direct straw or biochar incorporation in rice-wheat rotation systems: A 10-year field observation. Agric. Ecosyst. Environ. 2024, 374, 109188. [Google Scholar] [CrossRef]
  54. Yang, F.; Lee, X.; Theng, B.K.G.; Wang, B.; Cheng, J.; Wang, Q. Effect of biochar addition on short-term N2O and CO2 emissions during repeated drying and wetting of an anthropogenic alluvial soil. Environ. Geochem. Health 2017, 39, 635–647. [Google Scholar] [CrossRef]
  55. Yangzhou, X.; Ying, L.; Khan, N.N.; Nanthi, B.; Ling, Z.; Siyu, Z.; Jianming, X.; Bin, Y.; Yuan, L. Biochar addition increased soil bacterial diversity and richness: Large-scale evidence of field experiments. Sci. Total Environ. 2023, 893, 164961. [Google Scholar] [CrossRef]
  56. Wang, B.; Li, H.; Du, X.; Cai, Y.; Peng, J.; Zhang, S.; Liu, F. Characteristics of greenhouse gas emissions from constructed wetlands vegetated withmyriophyllum aquatic: The effects of influent c/n ratio and microbial responses. Water 2024, 16, 308. [Google Scholar] [CrossRef]
  57. Wenzhu, Z.; Lan, W.; Qinglong, L.; Honghong, L.; Jingchun, T. Adsorption of pcbs on microplastics mitigated greenhouse gas emission by changing c/n metabolism in freshwater sediment. J. Clean. Prod. 2024, 434, 12. [Google Scholar] [CrossRef]
  58. Li, S.; Wang, S.; Shangguan, Z. Combined biochar and nitrogen fertilization at appropriate rates could balance the leaching and availability of soil inorganic nitrogen. Agric. Ecosyst. Environ. 2019, 276, 21–30. [Google Scholar] [CrossRef]
  59. Zhong, L.; Li, G.; Qing, J.; Li, J.; Xue, J.; Yan, B.; Chen, G.; Kang, X.; Rui, Y. Biochar can reduce N2O production potential from rhizosphere of fertilized agricultural soils by suppressing bacterial denitrification. Eur. J. Soil Biol. 2022, 109, 103391. [Google Scholar] [CrossRef]
  60. Mangalassery, S.; Sjogersten, S.; Sparkes, D.L.; Sturrock, C.J.; Mooney, S.J. The effect of soil aggregate size on pore structure and its consequence on emission of greenhouse gases. Soil Tillage Res. 2013, 132, 39–46. [Google Scholar] [CrossRef]
  61. Jiang, M.; Yang, N.; Zhao, J.; Shaaban, M.; Hu, R. Crop straw incorporation mediates the impacts of soil aggregate size on greenhouse gas emissions. Geoderma 2021, 401, 115342. [Google Scholar] [CrossRef]
  62. Hou, S.; Zhang, R.; Zhang, C.; Wang, L.; Wang, H.; Wang, X. Role of vermicompost and biochar in soil quality improvement by promoting bupleurum falcatum l. Nutrient absorption. Soil Use Manag. 2023, 39, 1600–1617. [Google Scholar] [CrossRef]
  63. Zhang, J.; Sun, H.; Ma, J.; Zhang, X.; Wang, C.; Zhou, S. Effect of straw biochar application on soil carbon, greenhouse gas emissions and nitrogen leaching: A vegetable crop rotation field experiment. Soil Use Manag. 2022, 39, 729–741. [Google Scholar] [CrossRef]
  64. Davys, D.; Rayns, F.; Charlesworth, S.; Lillywhite, R. The effect of different biochar characteristics on soil nitrogen transformation processes: A review. Sustainability 2023, 15, 16446. [Google Scholar] [CrossRef]
  65. Matsumoto, Y.; Yoshida, S.; Okabe, A.; Nishida, K. Impact of clod (aggregate) size on evaporation rate and soil moisture profile during the drying process. Eur. J. Soil Sci. 2023, 74, e13420. [Google Scholar] [CrossRef]
  66. Xuping, Y.; Ding, J.; Xiaoxue, C.; Chuan, Y.; Shuang, W.; Zhixia, H.; Sivakumar, E. Adsorption properties of seaweed-based biochar with the greenhouse gases (CO2, CH4, N2O) through density functional theory. Biomass Bioenergy 2022, 163, 106519. [Google Scholar] [CrossRef]
  67. Zepeng, L.; Yueyao, H.; Jie, Z.; Ying, G.; Liping, Z.; Ping, Y.; Tongtong, Z.; Xingyu, H.; Meng, W.; Hui, G. Enhanced adsorption of congo red from urea/calcium chloride co-modified biochar: Performance, mechanisms and toxicity assessment. Bioresour. Technol. 2023, 388, 129783. [Google Scholar] [CrossRef]
  68. Hy, A.; Cf, B.; Yi, M.B.; Yd, B.; Jian, L.C. Long-term ditch-buried straw return increases functionality of soil microbial communities. Catena 2021, 202, 202. [Google Scholar] [CrossRef]
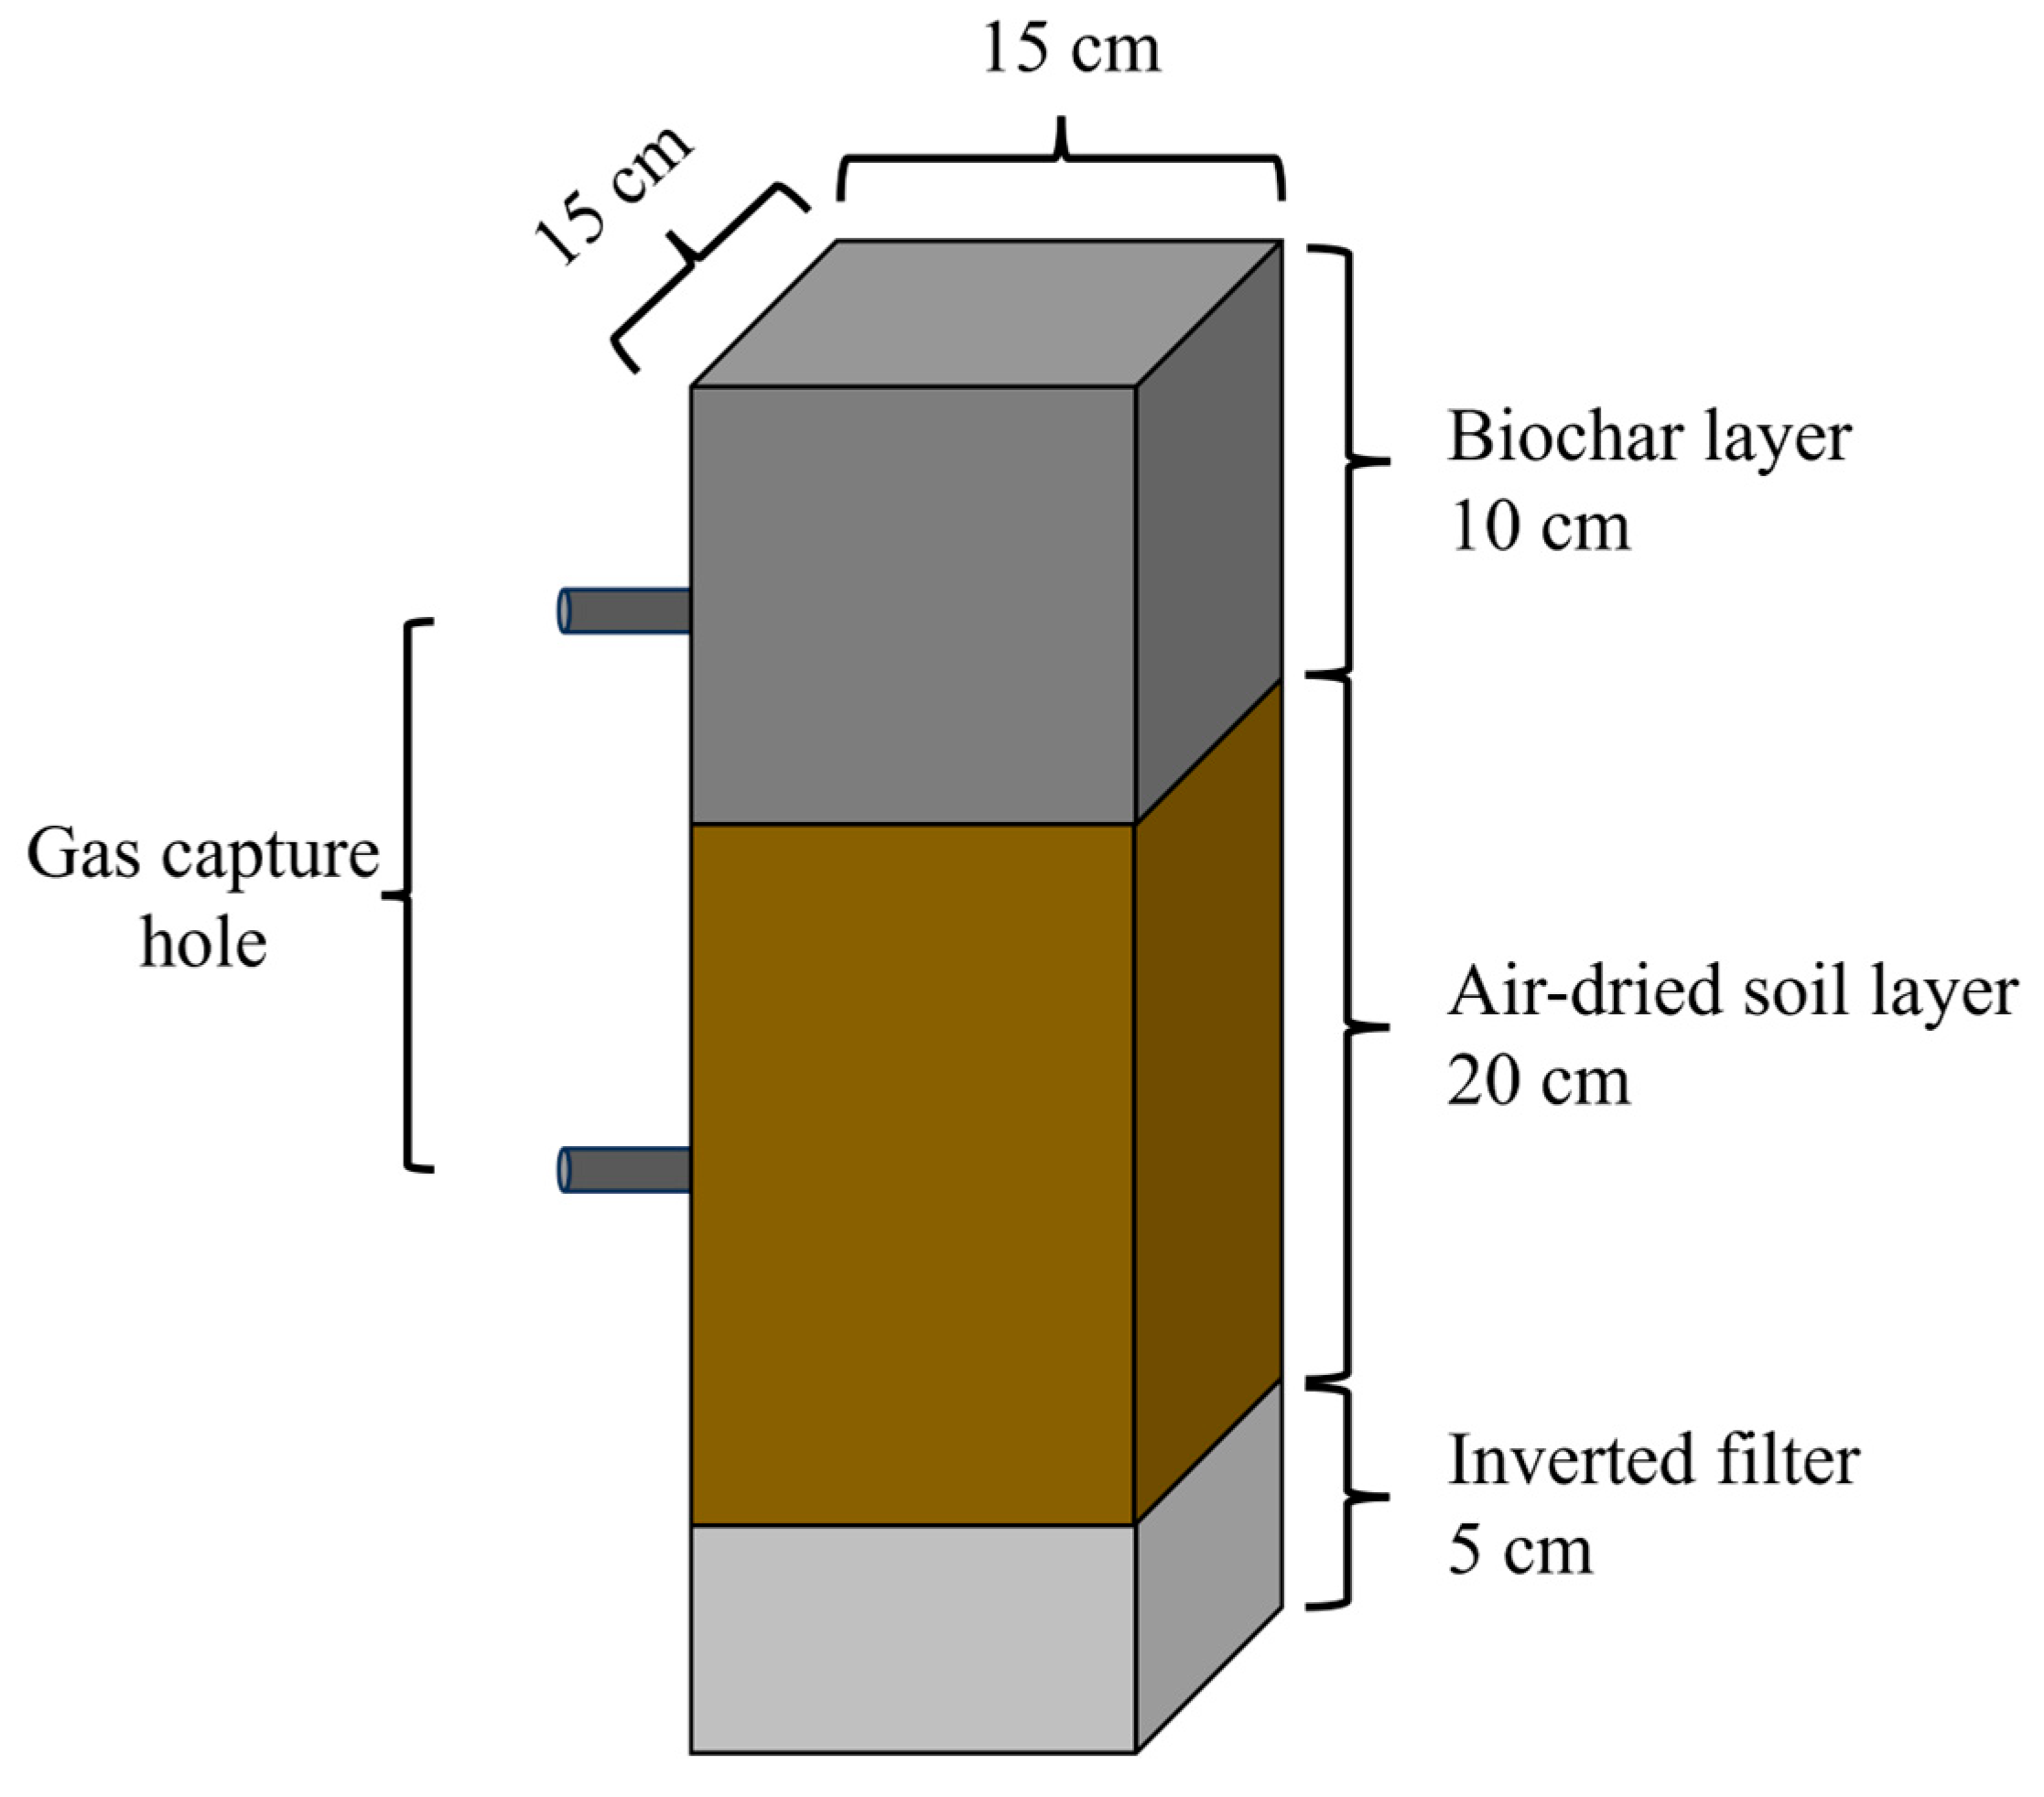
Figure 1. A cuboid plexiglass column used for experiment.
Agronomy 15 02655 g001
Figure 2. Fourier transform infrared spectroscopy analysis. Note: GAB15 refers to the treatment with fertilization + high-N activated biochar, GAB5 refers to the treatment with fertilization + low-N activated biochar, and GB refers to the treatment with fertilization + raw biochar.
Agronomy 15 02655 g002
Figure 3. Soil moisture and temperature during maize growth. Note: CK is the control treatment, GC is the fertilization treatment, GAB15 refers to the treatment with fertilization + high-N activated biochar, GAB5 refers to the treatment with fertilization + low-N activated biochar, and GB refers to the treatment with fertilization + raw biochar.
Agronomy 15 02655 g003
Figure 4. The impact of each treatment on soil aggregates. Note: MWD stands for Mean Weight Diameter; R>0.25mm refers to the content of water-stable aggregates; CK is the control treatment, GC is the fertilization treatment, GAB15 refers to the treatment with fertilization + high-N activated biochar, GAB5 refers to the treatment with fertilization + low-N activated biochar, and GB refers to the treatment with fertilization + raw biochar.
Agronomy 15 02655 g004
Figure 5. The relationship between Ds/D0 and Soil water content. Note: Ds/D0 refers to the gas diffusion coefficient; CK is the control treatment, GC is the fertilization treatment, GAB15 refers to the treatment with fertilization + high-N activated biochar, GAB5 refers to the treatment with fertilization + low-N activated biochar, and GB refers to the treatment with fertilization + raw biochar.
Agronomy 15 02655 g005
Figure 6. Soil chemical properties during maize growth. Note: CK is the control treatment, GC is the fertilization treatment, GAB15 refers to the treatment with fertilization + high-N activated biochar, GAB5 refers to the treatment with fertilization + low-N activated biochar, and GB refers to the treatment with fertilization + raw biochar. pH stands for potential of Hydrogen. CEC is the cation exchange capacity.
Agronomy 15 02655 g006
Figure 7. The dynamic of CO2 and N2O in the soil profile and surface. Note: CK is the control treatment, GC is the fertilization treatment, GAB15 refers to the treatment with fertilization + high-N activated biochar, GAB5 refers to the treatment with fertilization + low-N activated biochar, and GB refers to the treatment with fertilization + raw biochar.
Agronomy 15 02655 g007
Figure 8. The correlation between soil N2O, CO2 emissions, and soil physicochemical property. Note: Pearson was used in the correlation analysis; MBC refers to microbial biomass carbon; MBN refers to soil microbial biomass nitrogen; C/N represents the ratio of MBC to MBN; DOC stands for dissolved organic carbon; MWD denotes Mean Weight Diameter; R>0.25mm represents the content of water-stable aggregates; SM stands for soil moisture; ST refers to soil temperature; Ds/D0 represents the gas diffusion coefficient; β-glu stands for β-glucosidase; Alp refers to alkaline phosphatase; pH denotes potential of Hydrogen; and CEC stands for cation exchange capacity.
Agronomy 15 02655 g008
Figure 9. Redundancy analysis between environmental factors and gas emissions. Note: MBC refers to microbial biomass carbon; MBN refers to soil microbial biomass nitrogen; C/N denotes the ratio of MBC to MBN; DOC stands for dissolved organic carbon; MWD represents Mean Weight Diameter; R>0.25mm indicates the content of water-stable aggregates; SM stands for soil moisture; ST refers to soil temperature; Ds/D0 denotes the gas diffusion coefficient; β-glu represents β-glucosidase; Alp refers to alkaline phosphatase; pH stands for potential of hydrogen; and CEC denotes cation exchange capacity.
Agronomy 15 02655 g009
Figure 10. The path analysis of CO2, N2O emission after biochar application. (A,B) are the path analysis of gas emission and soil properties; (C,D) are the relative importance of the factors affecting the CO2 and N2O emission, respectively. * p < 0.05, ** p < 0.01, *** p < 0.001. Note: SM stands for soil moisture; MWD refers to Mean Weight Diameter; C/N denotes the ratio of MBC to MBN; MBC means microbial biomass carbon; MBN refers to soil microbial biomass nitrogen; Ds/D0 represents the gas diffusion coefficient; DOC stands for dissolved organic carbon; and R>0.25mm indicates the content of water-stable aggregates.
Agronomy 15 02655 g010
Figure 11. Conceptual schematic of the related mechanisms.
Agronomy 15 02655 g011
Table 1. The chemical and physical properties of biochar.
TreatmentBET Surface Aera (m2 g−1)Pore Volume (Micropore)
(m3 g−1 10−6)
Micropore Diameter
(m 10−9)
Ash
(%)
N
(%)
O
(%)
pHEC
(mS cm−1)
GAB1512510.5820.56618.51.115.48.861.65
GAB510910.5010.56947.811.9813.849.012.41
GB3240.110.58457.933.9910.710.513.82
Note: BET surface area refers to the Brunauer–Emmett–Teller surface area; pH stands for the potential of Hydrogen; EC denotes Electrical Conductivity; GAB15 refers to the treatment with fertilization + high-N activated biochar; GAB5 refers to the treatment with fertilization + low-N activated biochar; and GB refers to the treatment with fertilization + raw biochar.
Table 2. Soil enzyme activity dynamics.
Urease
(mg NH4+-N g−1 24 h−1)
β-Glucosidase
(nmol MUB g−1 h−1)
Alkaline Phosphatase
(mg Phenol g−1 24 h−1)
DAS20DAS40DAS60DAS20DAS40DAS60DAS20DAS40DAS60
GAB150.211 b ± 0.0060.341 a ± 0.0430.246 bc ± 0.020127.78 ab ± 12.99128.76 ab ± 1.57126.96 ab ± 12.080.584 bc ± 0.0300.661 b ± 0.0500.617 b ± 0.013
GAB50.241 ab ± 0.0110.328 a ± 0.0150.326 ab ± 0.022131.19 ab ± 5.53138.19 a ± 9.37132.53 ab ± 6.560.629 b ± 0.0480.713 b ± 0.0410.647 b ± 0.045
GB0.254 a ± 0.0220.345 a ± 0.0630.365 a ± 0.021145.36 a ± 8.02140.43 a ± 8.04143.51 a ± 4.750.794 a ± 0.0480.855 a ± 0.0560.833 a ± 0.045
GC0.207 b ± 0.0030.359 a ± 0.0250.272 bc ± 0.046111.72 b ± 10.76117.35 b ± 6.44114.27 b ± 5.590.462 cd ± 0.040.568 bc ± 0.0560.549 b ± 0.102
CK0.158 c ± 0.0100.220 b ± 0.0220.226 c ± 0.03866.86 c ± 8.3878.15 c ± 5.4071.50 c ± 10.310.436 d ± 0.0560.486 c ± 0.0510.465 b ± 0.051
Note: Different letters indicate a significant difference (p < 0.05); The means ± standard error of the mean (n = 3). GAB15 refers to the treatment with fertilization + high-N activated biochar, GAB5 refers to the treatment with fertilization + low-N activated biochar, GB refers to the treatment with fertilization + raw biochar, GC is the fertilization treatment, and CK is the control treatment. DAS20, DAS40, and DAS60 represent the 20th, 40th, and 60th days after sowing, respectively.
Table 3. The dynamics of soil carbon cycle.
MBC (g kg 10−3)MBN (g kg 10−3)C/NDOC (g kg 10−3)
DAS20DAS40DAS60DAS20DAS40DAS60DAS20DAS40DAS60DAS20DAS40DAS60
GAB15147.33 b ± 8.6171.15 ab ± 5.3160.7 a ± 5.420.00 b ± 1.233.35 c ± 0.822.2 bc ± 0.87.4 ab ± 0.35.1 b ± 0.17.2 a ± 0.0161.01 a ± 4.8158.28 a ± 5.0153.98 a ± 3.4
GAB5146.12 b ± 8.5179.66 a ± 6.1168.8 a ± 6.124.06 a ± 2.936.39 b ± 1.525.6 ab ± 1.06.2 c ± 0.94.9 b ± 0.16.6 b ± 0.0148.19 b ± 4.6141.84 b ± 7.1138.19 b ± 8.6
GB141.77 b ± 7.1179.24 a ± 6.3168.4 a ± 6.120.97 b ± 0.939.41 a ± 3.027.8 a ± 3.36.8 bc ± 0.14.6 bc ± 0.46.2 b ± 0.8135.28 c ± 6.1131.34 b ± 5.3125.88 bc ± 5.8
GC159.2 a ± 2.4166.23 b ± 2.2132.4 b ± 4.120.27 b ± 1.621.32 e ± 1.420.9 bc ± 1.47.9 a ± 0.67.8 a ± 0.56.4 b ± 0.2118.28 d ± 3.4111.52 c ± 9.4115.19 c ± 5.5
CK80.3 c ± 6.890.99 c ± 4.080.43 c ± 3.819.37 b ± 1.228.03 d ± 1.516.9 c ± 1.34.2 d ± 0.33.3 d ± 0.34.8 c ± 0.662.56 e ± 14.165.12 d ± 12.464.65 d ± 7.4
Note: The C/N shows MBC/MBN; Different letters indicate a significant difference (p < 0.05); The means ± standard error of the mean (n = 3). GAB15 refers to the treatment with fertilization + high-N activated biochar, GAB5 refers to the treatment with fertilization + low-N activated biochar, GB refers to the treatment with fertilization + raw biochar, GC is the fertilization treatment, and CK is the control treatment. DAS20, DAS40, and DAS60 represent the 20th, 40th, and 60th days after sowing, respectively. MBC refers to microbial biomass carbon; MBN refers to soil microbial biomass nitrogen; C/N refers to the ratio of MBC to MBN; DOC refers to dissolved organic carbon.
Disclaimer/Publisher’s Note: The statements, opinions and data contained in all publications are solely those of the individual author(s) and contributor(s) and not of MDPI and/or the editor(s). MDPI and/or the editor(s) disclaim responsibility for any injury to people or property resulting from any ideas, methods, instructions or products referred to in the content.