Article

Interactive Effects of Mulching Width and Irrigation Management on Cotton Growth and Dynamic Changes in Soil Factors in Arid Regions

1
School of Agricultural Sciences, Zhengzhou University, Zhengzhou 450001, China
2
Key Laboratory of Crop Water Use and Regulation, Ministry of Agriculture and Rural Affairs, Farmland Irrigation Research Institute, Chinese Academy of Agricultural Sciences, Xinxiang 453002, China
3
College of Water Conservancy and Architectural Engineering, Northwest A&F University, Yang Ling 712100, China
4
Shangqiu Agro-Ecological System, National Observation and Research Station, Shangqiu 476000, China
*
Author to whom correspondence should be addressed.
Agronomy 2025, 15(8), 1964; https://doi.org/10.3390/agronomy15081964
Submission received: 8 July 2025 / Revised: 9 August 2025 / Accepted: 13 August 2025 / Published: 14 August 2025
(This article belongs to the Special Issue Crop Management in Water-Limited Cropping Systems)

Abstract

Mulching and irrigation are key practices for improving cotton yield and soil conditions, especially in Xinjiang, China. This study investigated the combined effects of mulching width and irrigation depth on cotton growth and rhizosphere microorganisms. Two mulching widths—conventional (M1) and ultra-wide (M2)—and three irrigation depths, 0.8 ETc (W1), 1.0 ETc (W2), and 1.2 ETc (W3), were tested. The impacts on cotton growth, soil environment, and rhizosphere microbial communities were analyzed. Results showed that under the same irrigation depth, M2 significantly increased soil moisture and reduced salt accumulation. Soil temperature under M2 was higher than M1, with increases of 0.55 °C and 1.65 °C during the budding and flowering–boll stages. M2 also increased root length (3.52–10.72%) and root surface area (5.8–7.51%). The beneficial fungus Cladosporium was enriched, while the pathogen Fusarium was suppressed under M2. With the same mulching width, increasing irrigation improved soil moisture, reduced electrical conductivity, and decreased soil temperature. Root diameter and volume increased by 7.67–47% and 9.43–10.36%, respectively. Mulching width and irrigation depth significantly affected bacterial α-diversity. M2W3 showed the highest microbial richness and functional diversity. This study offers guidance for efficient cotton cultivation in southern Xinjiang.

1. Introduction

Cotton is an important economic crop in China, especially in Xinjiang, where cotton cultivation plays a pivotal role. China’s total cotton production reached 6.164 million tons, an increase of 546,000 tons compared to 2023, representing a growth of 9.7% [1]. Its growth and yield are significantly influenced by cultivation and management practices. However, traditional farming methods can no longer meet the demands of modern high-yield, high-efficiency agriculture. Under mulched drip irrigation, water is not only essential for maintaining normal cotton growth and development but also serves as a key factor in regulating yield and improving water use efficiency [2,3,4]. For instance, Guo and Wu demonstrated that irrigation during critical growth stages promotes root development and enhances root absorption of water and nutrients, ultimately increasing cotton yield [5,6]. Although both mulching and irrigation have been independently confirmed to improve soil water and temperature conditions and promote crop growth, the combined effects of these two factors on cotton root development, soil water–thermal–salt dynamics, and yield formation remain unclear.
Soil moisture, temperature, and salinity are key factors affecting the soil environment and crop growth. Studies have shown that under mulched drip irrigation soil surface salinity is negatively correlated with soil moisture and positively correlated with temperature, although the direct impact of temperature on salt accumulation is limited [7]. Additionally, soil salinity exhibits significant spatial variability, generally following a “surface desalinization–subsoil salinization” trend with increasing depth, and soil salinity decreases as irrigation amounts increase [8,9,10]. While plastic mulching improves soil water retention, regulates soil temperature, and promotes early root growth of cotton [11,12], it also enhances soil temperature by absorbing solar radiation, reducing heat loss, accelerating seed germination, improving emergence rates, and shortening the growth period—all of which contribute to yield improvement [13]. Significant differences in soil temperature are observed in the 0–5 cm layer across various irrigation treatments and positions, with soil temperature under mulch being higher than that of bare soil [14]. In arid regions the complex interactions among soil moisture, temperature, and salinity and their impacts on crop growth require systematic investigation. Therefore, it is necessary to explore the integrated effects of different mulching widths and irrigation depth on the cotton–soil system to optimize water management and cultivation strategies in the cotton fields of southern Xinjiang.
Crop roots are the key organs for water and nutrient uptake, and their development directly affects aboveground growth and final yield. For example, mulched drip irrigation has been shown to promote cotton root growth before the flowering and boll-setting stage, suppress excessive vegetative growth, and subsequently reduce redundant root growth in the later stages, thereby enhancing fine root productivity, boll number per plant, and overall yield [15]. Higher irrigation rates tend to increase root length and biomass density in the 0–30 cm soil layer, while resulting in lower root density in the deeper 30–100 cm layer. Soil moisture is a critical environmental factor influencing root architecture. Variations in water supply affect root growth directly and also regulate the composition and function of rhizosphere microorganisms through root–microbe interactions. The rhizosphere is a special ecological interface where plants, microorganisms, and soil interact [16]. Rhizosphere microorganisms play a central role in regulating carbon and nitrogen cycles in the root microenvironment and driving key biochemical processes [17,18,19]. They are crucial for maintaining the stability of agroecosystem functions and enhancing soil fertility [20]. For example, Zhao [21] found that under conditions of high moisture and nitrogen, optimized water and nitrogen management promoted the enrichment of nitrogen-cycling-related bacterial genera in the rhizosphere, such as Nitrospira and Sphingomonas. Studies have shown that rhizosphere microbial communities are highly sensitive to environmental changes, and their structure and function are significantly influenced by factors such as pH, soil organic carbon content, and aggregate stability [22,23]. However, under the conditions of ultra-wide-film mulched drip irrigation in southern Xinjiang, the regulatory mechanisms of the cotton field soil microenvironment and their influence on cotton growth remain insufficiently understood.
In recent years, ultra-wide-film mulching technology has attracted increasing attention due to its significant yield-enhancing effects. As an effective cultivation measure, ultra-wide-film mulching technology has been proven to enhance crop yield and improve soil conditions [24,25]. Moreover, adopting ultra-wide-film mulching can save 30–60 m3 of water per 667 m2 of land [26]. Previous studies have shown that varying mulch widths can markedly regulate the cotton growing environment by influencing soil temperature and moisture conditions [27]. At the same time, scientifically managed irrigation depths are equally critical for optimizing cotton yield and quality as they help prevent both yield loss caused by water deficits and resource waste due to excessive irrigation [28]. Although many studies have separately investigated the effects of mulching and irrigation on soil conditions and cotton yield [29], the synergistic effects of these two factors—especially their combined influence on root development and rhizosphere microbial communities—remain unclear. In particular, under mulched drip irrigation there is still a lack of systematic research and scientific evidence on how the interaction between mulch width and irrigation depth affects cotton growth, root development, soil water–thermal–salt dynamics, and rhizosphere microbial communities.
It is therefore hypothesized that, compared with conventional film, the superior soil-warming and moisture-conserving properties of ultra-wide film are closely linked to cotton growth and rhizosphere microbial communities. However, further research is needed to determine how different mulch widths and irrigation depths influence soil water–thermal–salt distributions, regulate root development, and coordinate microbial community dynamics. To test these hypotheses, we conducted a field split-plot experiment in southern Xinjiang cotton fields, systematically evaluating the combined effects of two mulch widths and three irrigation depths on cotton growth, soil environment, and rhizosphere microbiota. The main objectives of this study are to: (1) investigate the effects of different mulch widths and irrigation depths on the soil water–thermal–salt environment in cotton fields; (2) examine cotton’s growth responses under varying mulch widths and irrigation depths; (3) elucidate the mechanisms by which mulch width and irrigation depth jointly affect soil properties, agronomic traits, root development, and rhizosphere microbial community structure—thereby providing a theoretical foundation for understanding the yield-enhancement mechanisms of ultra-wide-film mulching and for guiding high-efficiency cotton cultivation in southern Xinjiang.

2. Materials and Methods

2.1. Overview of the Experimental Area

The experiment was conducted at the Xinjiang Alar (Figure 1 Modern Agricultural Comprehensive Experimental Station (81°17′56.52″ E, 40°32′36.90″ N, elevation 1014 m). The test site is located in the plain desert oasis near the confluence of the Aksu River, the Hetian River, and the Yarkand River. It has an extreme continental arid desert climate in the warm temperate zone, with scarce rainfall, intense evaporation, and a large temperature difference between day and night. The diurnal variation characteristics of major meteorological factors during the cotton growing season in 2024 are shown in Figure 2. The proportions of clay, silt, and sand in the 0–100 cm soil layer of the experimental area were 0.21%, 15.06%, and 84.81%, respectively, indicating a sandy loam soil texture. The soil saturated water content was 0.30 cm3·cm−3, the field capacity was 0.25 cm3·cm−3, and the bulk density was 1.57 g/cm3. The basic soil nutrients indicators are shown in Table 1.

2.2. Experimental Design

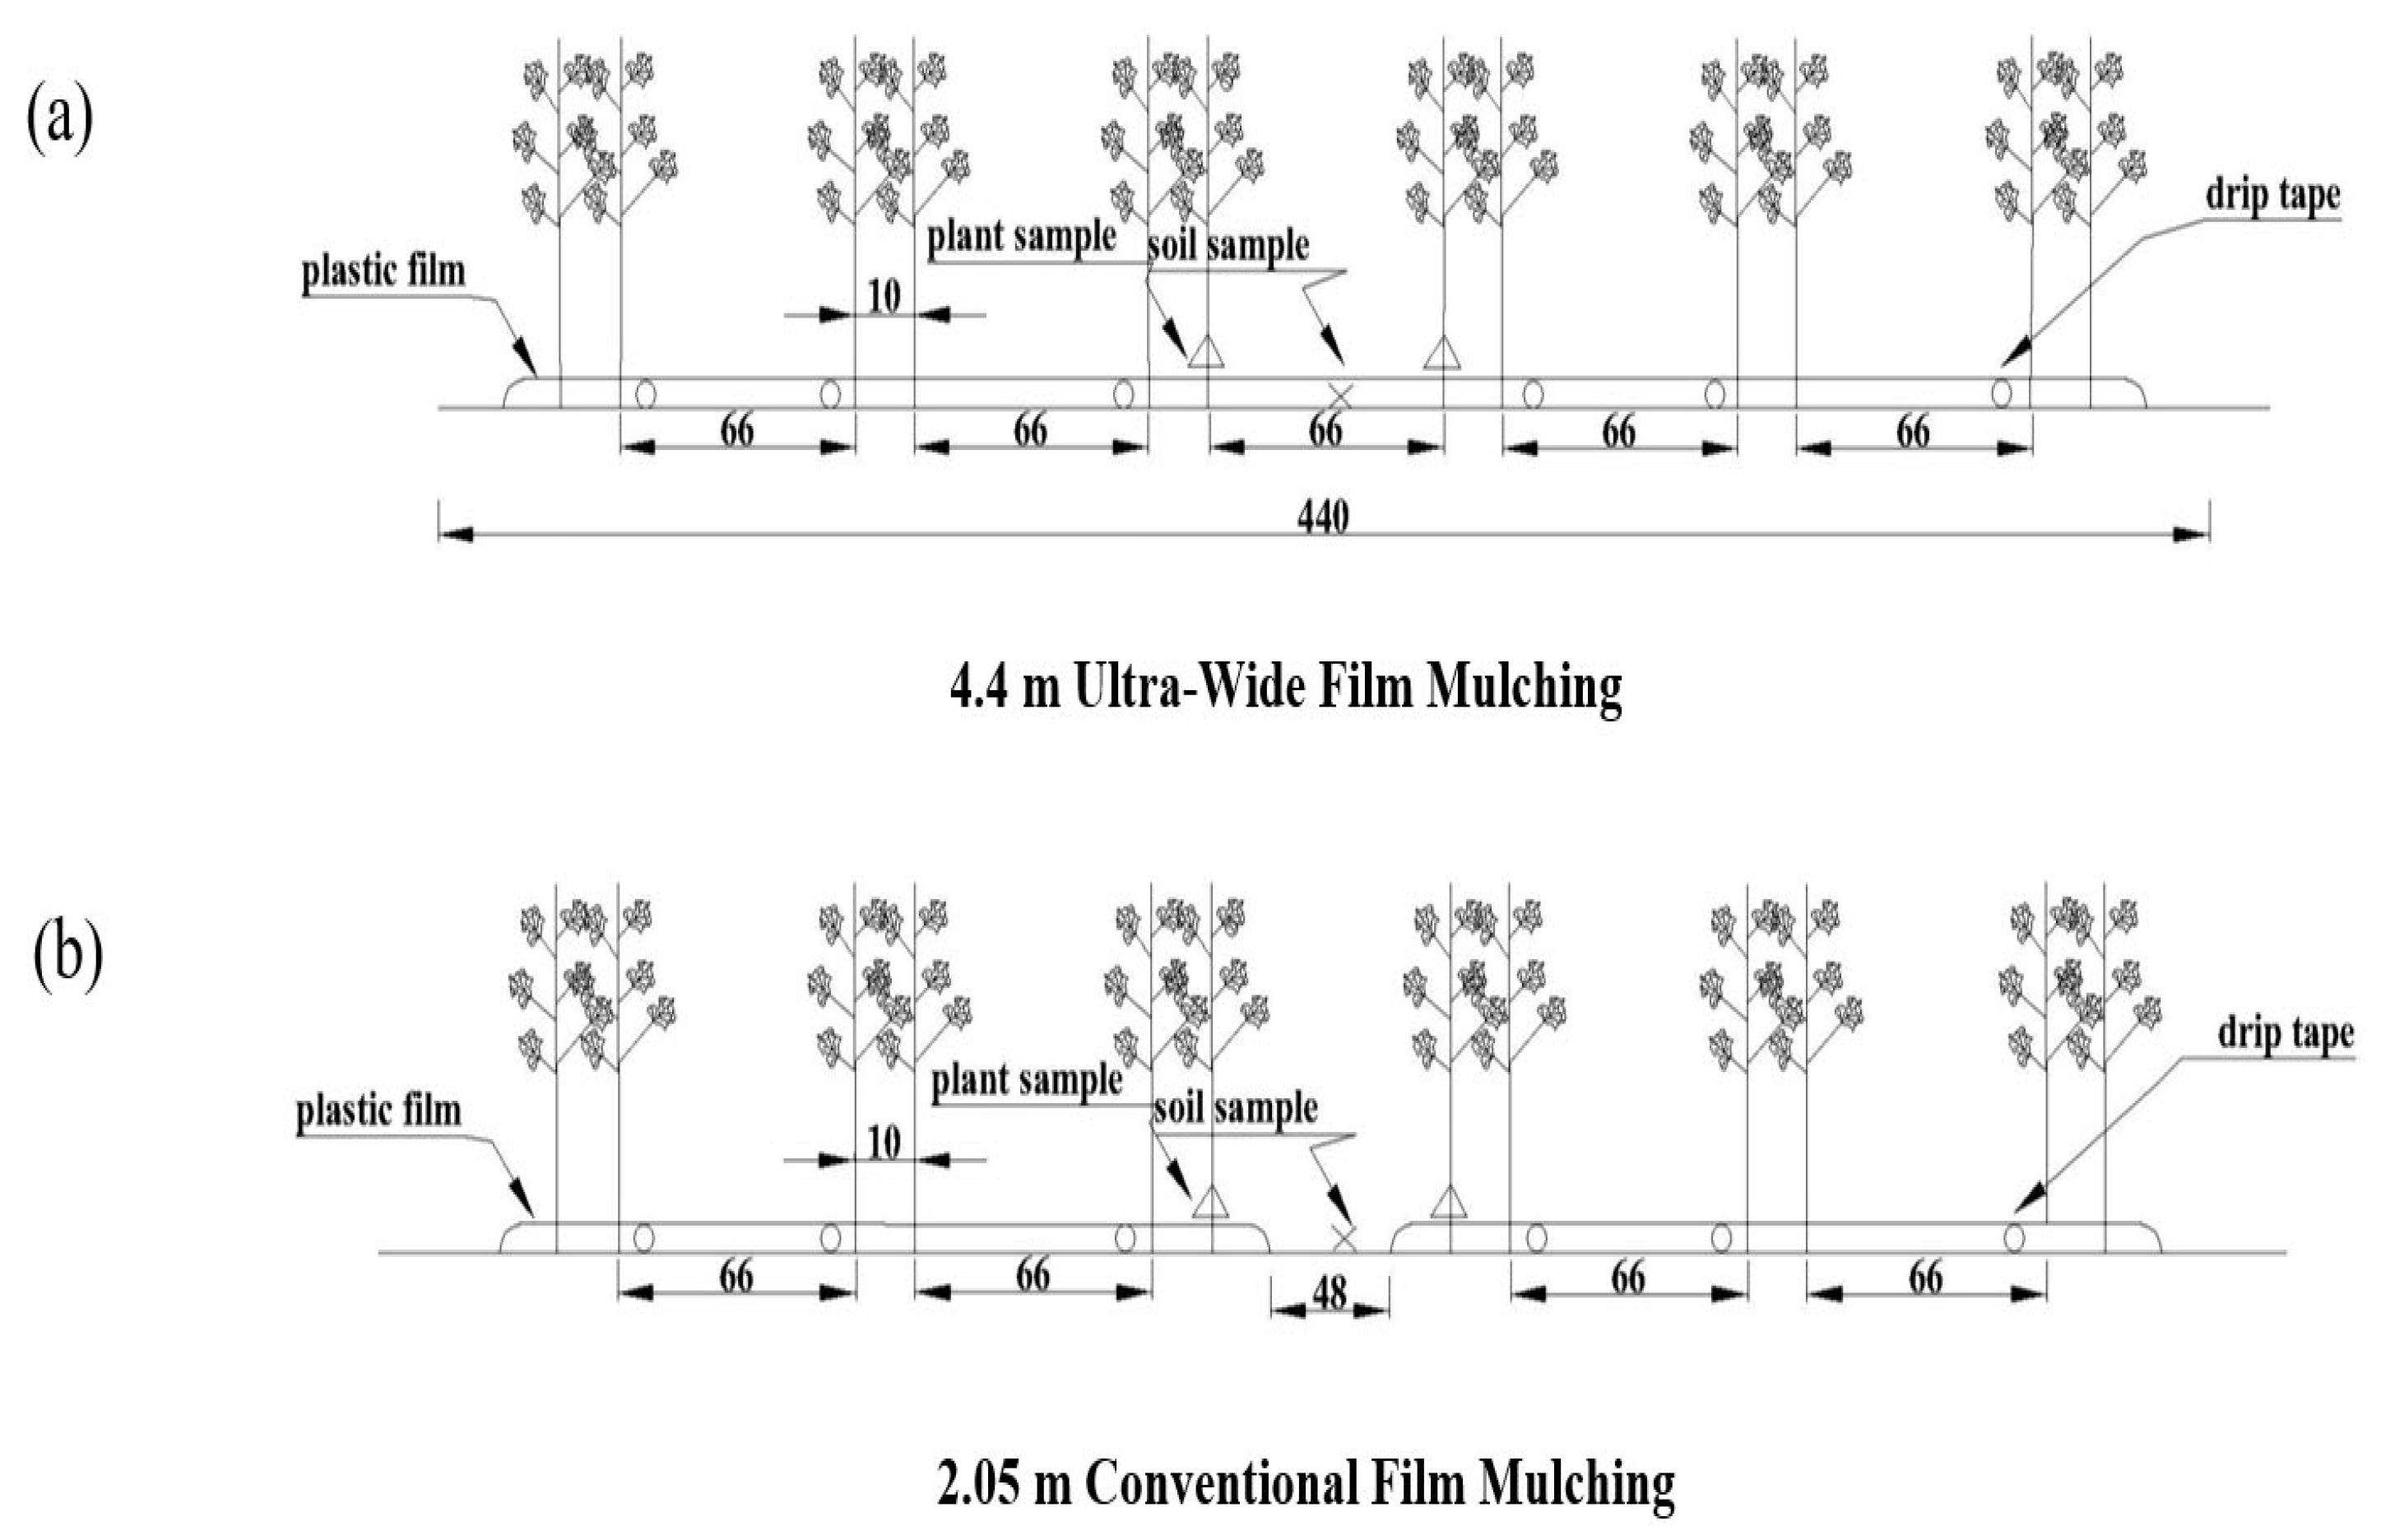
The tested cotton variety was Tahe 2, with a sowing date of 30 April 2024, topping on 23 July, and harvesting on 13 October of the same year. The experiment included two film mulching widths: conventional single-film, six-row mulching (M1, 2.05 m) and ultra-wide, single-film, twelve-row mulching (M2, 4.4 m). Irrigation was applied based on crop evapotranspiration (ETc), which was calculated using the single crop coefficient method recommended and modified in FAO-56. The cotton crop coefficient (Kc) was determined from experimental data collected by the research team in 2021 and 2022. The average Kc ETa/ET0 (where ETa represents actual crop water consumption) was 0.77 during the budding stage and 1.14 during the flowering and boll-setting stage [30]. Each week, meteorological data were used to calculate reference crop evapotranspiration (ET0), which was then combined with crop coefficients to determine crop water demand (ETc). Three irrigation levels were set, 0.8 ETc (W1), 1.0 ETc (W2), and 1.2 ETc (W3), resulting in a total of six treatments (Figure 1). The level 1.2 ETc was used to compare the yield and water use efficiency (WUE) with the other two irrigation treatments, and the analysis of yield and WUE results will be published in a separate paper. The row spacing configuration for the 4.4 m ultra-wide film and 2.05 m conventional film followed a wide–narrow row machine-picking cotton arrangement of (10 + 66 + 10 + 66 + 10) cm. The plant spacing was 10 cm. Drip irrigation belts were arranged on the inner sides of the two edge rows and along the side of the middle row, with a total of three drip irrigation belts (Figure 3). All the treatments were carried out by applying fertilizer through pressure differential fertilizer tanks along with the irrigation water. A pressurized drip irrigation system was adopted, and water meters were installed at the entrances of each plot to accurately measure the irrigation volume. The irrigation water source was well water with a salinity of 1.44 g·L−1.
The irrigation interval was 7 days, with three irrigations during the budding stage and eight during the flowering and boll stage, totaling eleven irrigations. The first irrigation was applied on 10 June. There was no irrigation during the boll and opening stage. Cotton water consumption and irrigation depth during the entire experimental period are shown in Table 2. The irrigation and fertilization plan is shown in Figure 4. Soil sampling was conducted on 12 June 2024 during the budding stage, and on 19 July 2024 during the flowering and boll-setting stage. The experiment included 12 sample groups, with 3 replicates per group.

2.3. Sample Collection and Analysis

Meteorological Data Observation: Meteorological information was recorded by a HOBO automatic weather station set up in the experimental field. The monitored parameters included temperature, solar radiation, wind speed, wind direction, relative humidity, and precipitation, with data recorded every 30 min.

2.3.1. Soil Moisture Content

After irrigation, soil samples were collected using a soil auger at cotton bare soil locations, taking samples at depths of 0–10 cm, 10–20 cm, 20–30 cm, 30–40 cm, and 40–60 cm (0–60 cm) in the vertical direction. The oven-drying method was used to determine soil moisture content. The soil samples collected from the field were placed in aluminum boxes, labeled, and weighed before and after drying in the oven. The soil moisture content at each sampling depth was then calculated.

2.3.2. Soil Electrical Conductivity

The dried soil samples, after measuring soil moisture content, were crushed and 20 g of soil was sieved through a 1 mm mesh. The soil was then placed in a conical flask, and 100 mL of distilled water was added. The mixture was shaken for 5 min, left to stand for 15 min, and then filtered through filter paper to prepare a soil–water extract with a soil-to-water ratio of 5:1. The electrical conductivity of the extract was measured using a DDSJ-308A portable conductivity meter (Shanghai Yidian, Shanghai, China).

2.3.3. Soil Temperature

The measurement sensors (JL-04, measurement accuracy: <±0.2 °C) were buried at six points at the bare soil locations under each treatment, the conventional film bare soil and the ultra-wide-film-covered bare soil, at depths of 0–60 cm (with a probe every 10 cm). Soil temperature data was collected every 30 min.

2.3.4. Plant Dry Matter Accumulation

Three representative cotton plants with normal growth were randomly selected from the edge rows of each treatment. The plants were deactivated in an oven set at 105 °C for 30 min and then dried at 80 °C until they reached a constant weight. The dry matter mass of each cotton part was then weighed.

2.3.5. Cotton Root Distribution

Cotton root samples were collected using the excavation method [31]. During the budding stage and flowering–boll-setting stage, three representative cotton plants with uniform growth were selected from each treatment plot. The aboveground parts were removed, and root samples were collected using a soil auger (auger inner diameter 9 cm, height 20 cm) directly above the cotton plants along the direction of the main root. The sampled soil layers were 0–10 cm, 10–20 cm, 20–30 cm, 30–40 cm, 40–50 cm, and 50–60 cm. After removing dead roots, roots from each layer were scanned using a scanner (Epson V850, Seiko Epson Corporation, Batam, Indonesia). The images were analyzed using root analysis software (WinRhizo Pro Vision 5.0, Regent Instruments Inc, Quebec, QC, Canada) to obtain the root length, root diameter, root surface area, and root volume. After scanning, all root samples were oven-dried at 80 °C to a constant weight to determine root dry weight.

2.3.6. Rhizosphere Soil Microorganisms

The entire cotton plant was excavated using a shovel, and excess soil on the roots was shaken off. The soil that tightly adhered to the surface of the plant roots (approximately 1–2 mm) was collected as rhizosphere soil. A brush was used to remove the soil attached to the roots, and the samples were placed in self-sealing bags and stored at −80 °C for soil microorganism analysis [32]. The remaining soil samples were air-dried and then used for the determination of physicochemical properties. Sampling during the budding stage was conducted on 7 June, and during the flowering and boll-setting stage on 19 July.
A 0.5 g portion of this soil was processed for DNA extraction using an Omega Mag-bind Soil DNA Kit (M5636–02) following the manufacturer’s instructions (Omega BioTek, Norcross, GA, USA).
For PCR amplification of the bacterial 16S V3–V4 region, the forward primer (5′-ACTCCTACGGGAGGCAGCA-3′) and reverse primer (5′-GGACTACHVGGGTWTCTAAT-3′) were used. For amplification of the fungal ITS V1 region, the forward primer (5′-GTGCCAGCMGCCGCGGTAA-3′) and reverse primer (5′-CCGTCAATTCCTTTGAGTTT-3′) were employed.
The PCR mixture contained 5 μL of 5× reaction buffer, 5 μL of 5× GC buffer, 0.25 μL of Fast Pfu DNA Polymerase (5 U/μL), 2 μL of dNTPs (2.5 mmol/L), 1 μL each of forward and reverse primers (10 μmol/L), 1 μL of DNA template, and 9.75 μL of ddH2O.
Paired-end sequencing (2 × 250 bp) was performed on the Illumina NovaSeq 6000 platform (Hayward, CA, USA). Purified amplicons were pooled at equimolar concentrations by Personal Biotechnology Co., Ltd. (Shanghai, China). Sequence quality filtering, denoising, merging, and chimera removal were conducted using the DADA2 plugin [33]. Subsequent analyses were carried out using QIIME2 [34] and R software version 3.2.0.
Amplicon sequence variants (ASVs) were clustered based on representative sequences at a 100% similarity threshold. ASV classification was performed using the classify-sklearn naive Bayes classifier within the feature classifier plugin [34]. Bacterial sequences were classified against SILVA Release 132, and fungal sequences against UNITE Release 8.0. Sequences identified as host ASVs, mitochondrial or chloroplast sequences, and those with fewer than ten reads were filtered out from the bacterial ASV tables. Principal coordinates analysis (PCoA) based on a Bray–Curtis distance matrix was performed using “vegan (v4.0.3)”.

2.3.7. Crop Water Consumption

The crop water consumption of each treatment was calculated based on the water balance equation, as shown in Equation (1):
ET   =   P 0   +   K   +   M     D   +   ( W 0     W t )
where ET: crop water consumption under mulched drip irrigation in cotton fields (mm); P0: effective precipitation (mm); K: groundwater recharge (mm); M: irrigation amount (mm); D: deep percolation loss (mm); and W0 and Wₜ: soil water storage at the beginning and end of the period, respectively (mm). Since the groundwater table in the experimental area is deeper than 7.5 m, groundwater recharge can be neglected and K = 0. Due to the use of small-quota mulched drip irrigation in the experimental field, there is no deep percolation so D = 0. Therefore, Equation (1) can be simplified to Equation (2) as follows:
ET   =   P 0 + M   +   ( W 0     W t )
Soil water storage is calculated using Equation (3):
W   =   10 γ θ h
where W: soil water storage (mm); γ: soil dry bulk density (g/cm3); θ: gravimetric soil water content (%); and h: soil layer thickness (cm).

2.4. Statistical Analysis

SPSS 27.0.1 statistical software was used to analyze the data, calculate the standard deviation for each experimental group, and perform one-way analysis of variance (ANOVA). The least significant difference (LSD) test was used to determine significant differences, with a significance level of p < 0.05. GraphPad Prism 8.0.2 and Origin 2025 were used to generate graphs and conduct statistical analysis.

3. Results Analysis

3.1. Vertical Distribution of Soil Moisture Content Under Different Treatments

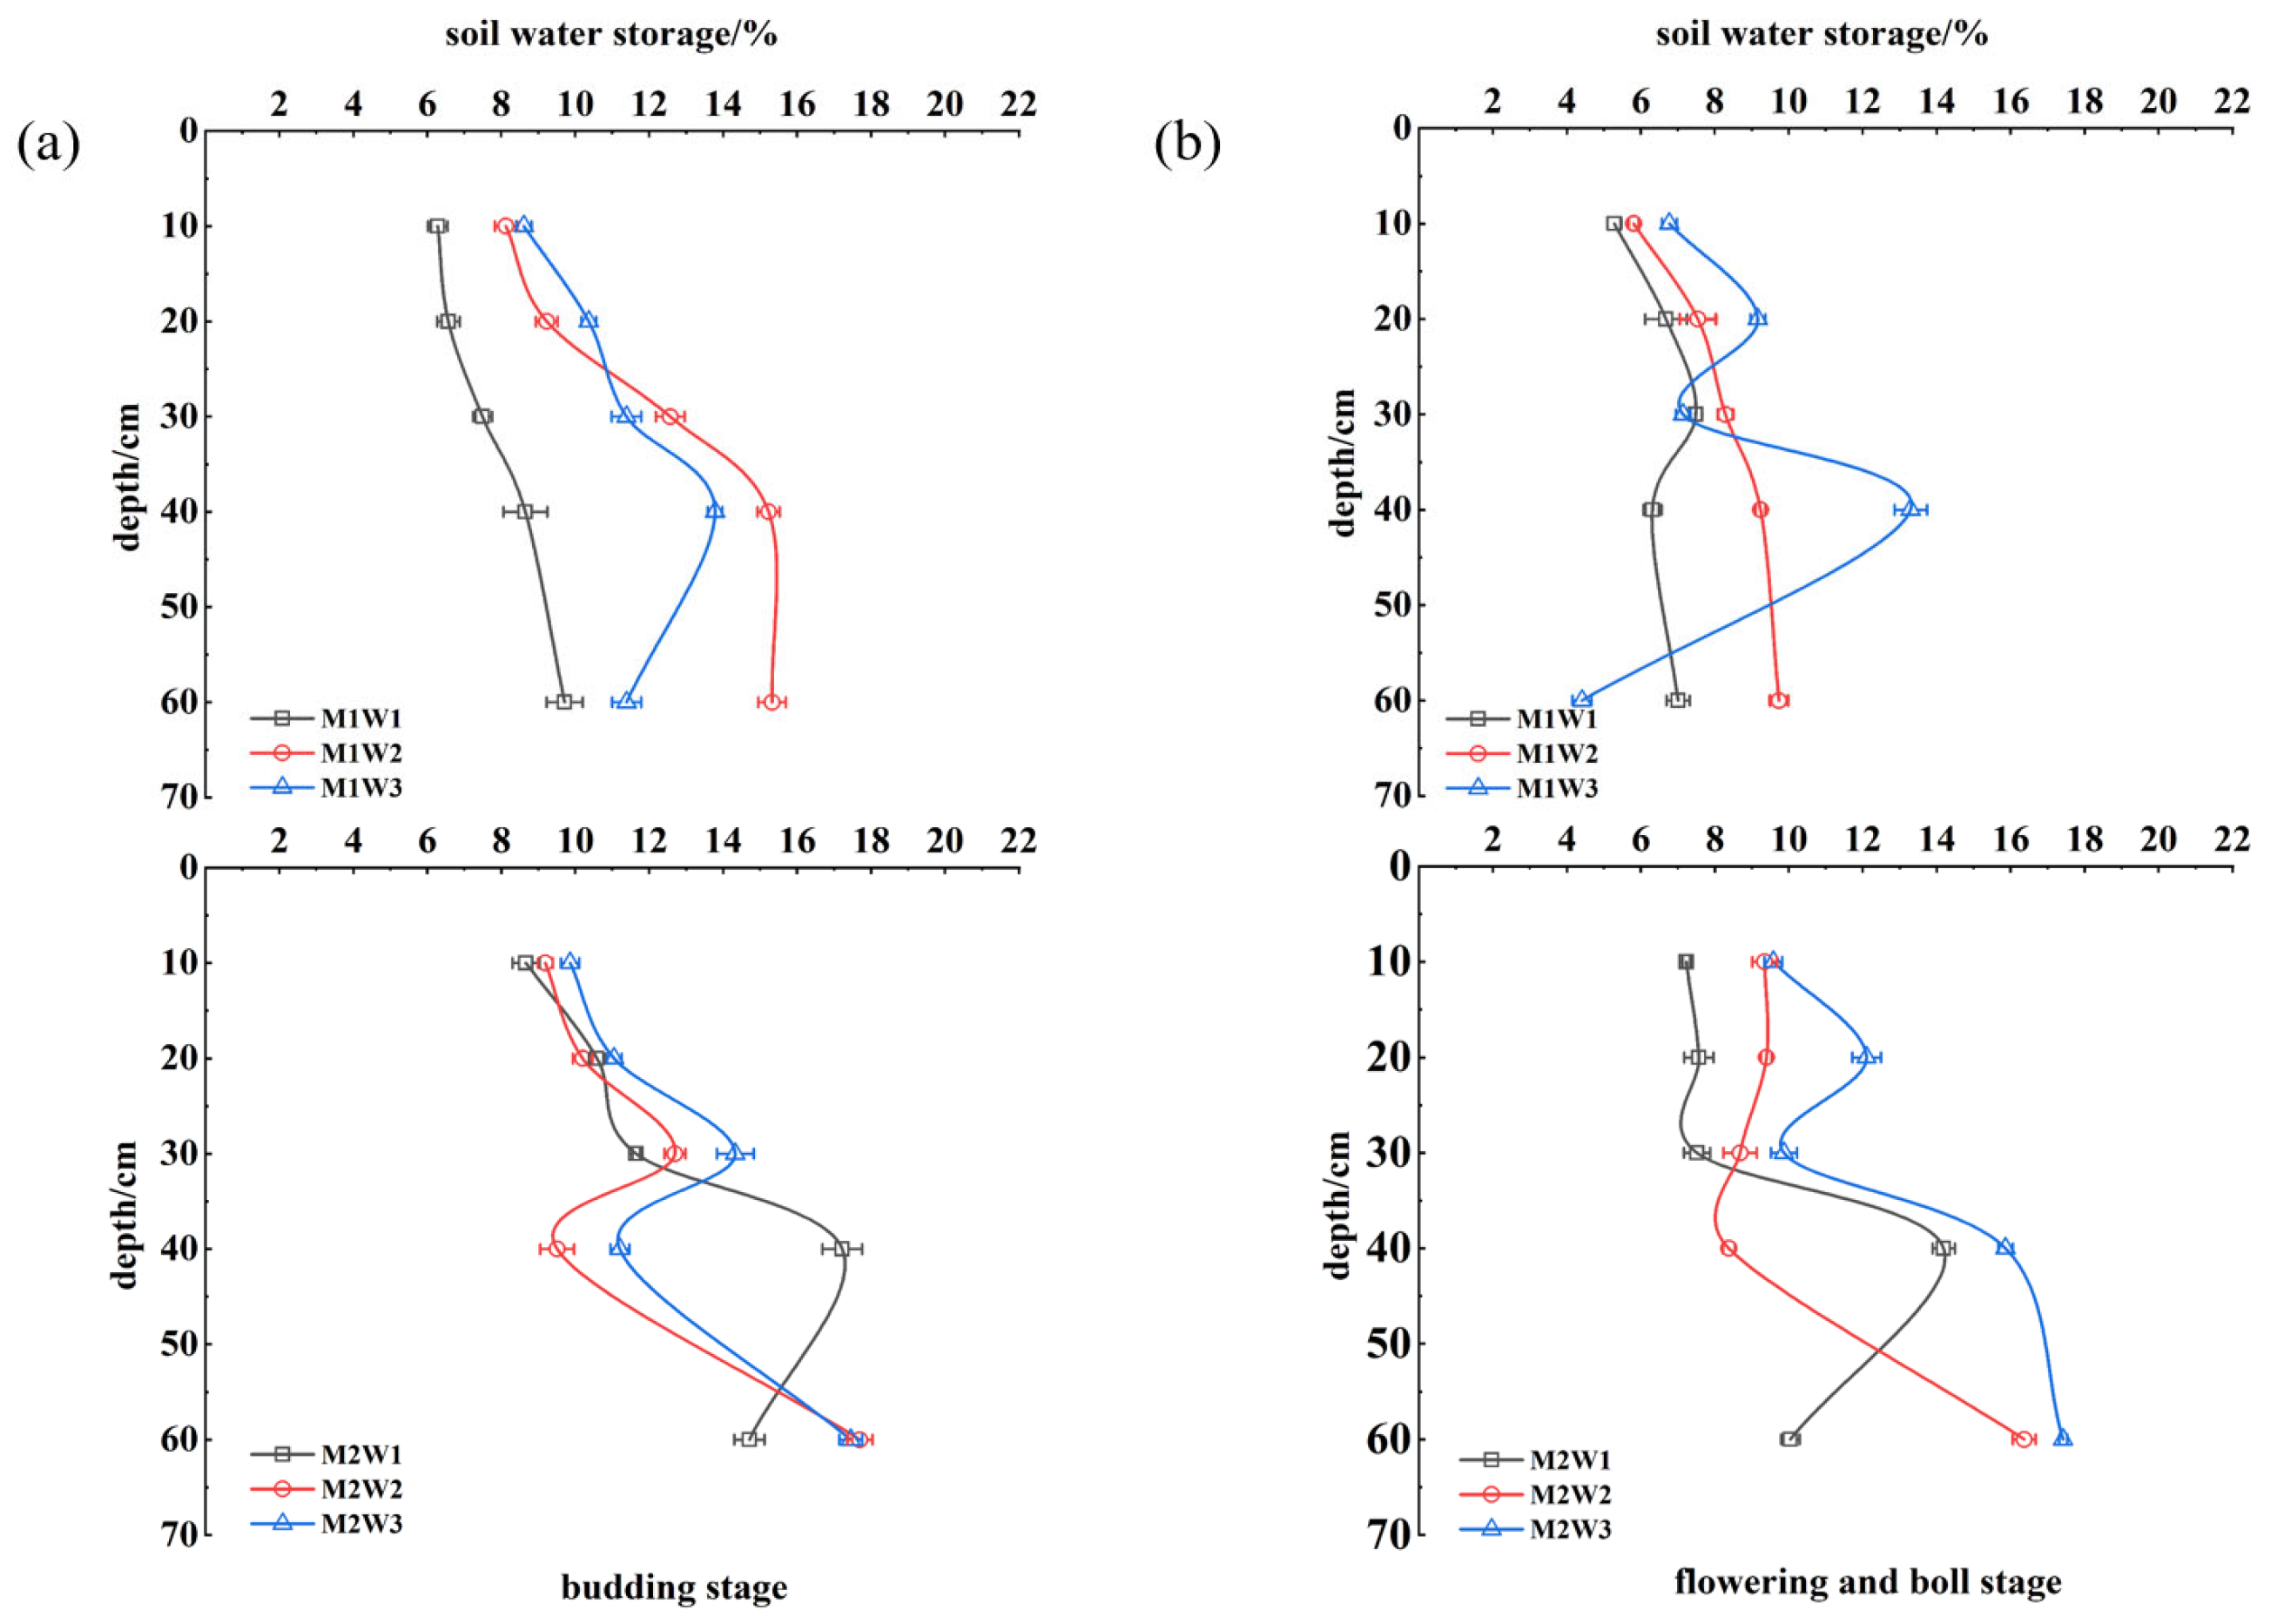
As shown in Figure 5, increasing the irrigation depth significantly improved soil moisture content across different soil layers. During the bud stage, at a depth of 10 cm, the soil moisture content of the M1W3 treatment increased by approximately 8–10% compared to M1W1. In the M2 treatment the improvement was even more pronounced; at a depth of 20 cm, the soil moisture content of M2W3 was about 4–6% higher than that of M1W3. Soil moisture content decreased with increasing soil depth. In the M1W3 treatment the 0–20 cm soil moisture content was about 6–8% higher than that in the 40–60 cm layer. During the flowering and boll-setting stage the effect of irrigation depth on soil moisture became even more apparent. In the M1W3 treatment the soil moisture content in the 0–20 cm layer increased by approximately 10–13% compared to M1W1, and the 40–60 cm layer also increased by about 4–6%. In the M2 treatment the soil moisture contents at both 20 cm and 40–60 cm depths were significantly higher than in M1, with particularly marked differences. The soil moisture content at the 60 cm depth during the flowering and boll-setting stage was moderately higher than during the bud stage, increasing by approximately 2–4% in the M2W3 treatment. Soil moisture content significantly increased with higher irrigation depth, especially in the 0–20 cm layer during the bud stage and the 40–60 cm layer during the flowering and boll-setting stage. The M2 ultra-wide-film treatment consistently showed superior water retention in both stages, with particularly notable improvements in the 40–60 cm soil layer compared to the M1 treatment.

3.2. Vertical Distribution of Soil Electrical Conductivity Under Different Treatments

As shown in Figure 6, soil electrical conductivity (EC) during the bud stage decreased with increasing irrigation depth across all treatments. In the M1 treatment, the W3 irrigation reduced the EC of the 0–20 cm soil layer by approximately 30–50% compared with W1 and W2. However, in the 40–60 cm layer the EC under W3 slightly increased compared with W1. In the M2 treatment, both W2 and W3 significantly reduced the EC of the 0–20 cm and 40–60 cm layers, with W3 showing a particularly marked decrease—about 40–60% in the 0–20 cm layer and 20–30% in the 40–60 cm layer. During the flowering and boll-setting stage, the overall EC values were lower than those in the bud stage. In the M1W3 treatment the EC of the 0–20 cm layer decreased by approximately 35–55% compared with M1W1, while the EC in the 40–60 cm layer also decreased, though to a lesser extent. In the M2 treatment both W2 and W3 significantly reduced the EC, with W3 reducing the 0–20 cm layer by about 50% compared with M2W1, and the deep soil EC dropping by over 30%. Increasing the irrigation depth effectively reduced surface soil EC at both growth stages. Under the M2 ultra-wide-film treatment, the dilution and leaching effects further lowered the EC in the 40–60 cm soil layer during the flowering and boll-setting stage compared to the bud stage. The W3 treatment accelerated the downward movement of salts, and optimized irrigation combined with mulching management helped regulate soil salinity distribution during cotton growth.

3.3. Variations in Soil Temperature Under Different Treatments

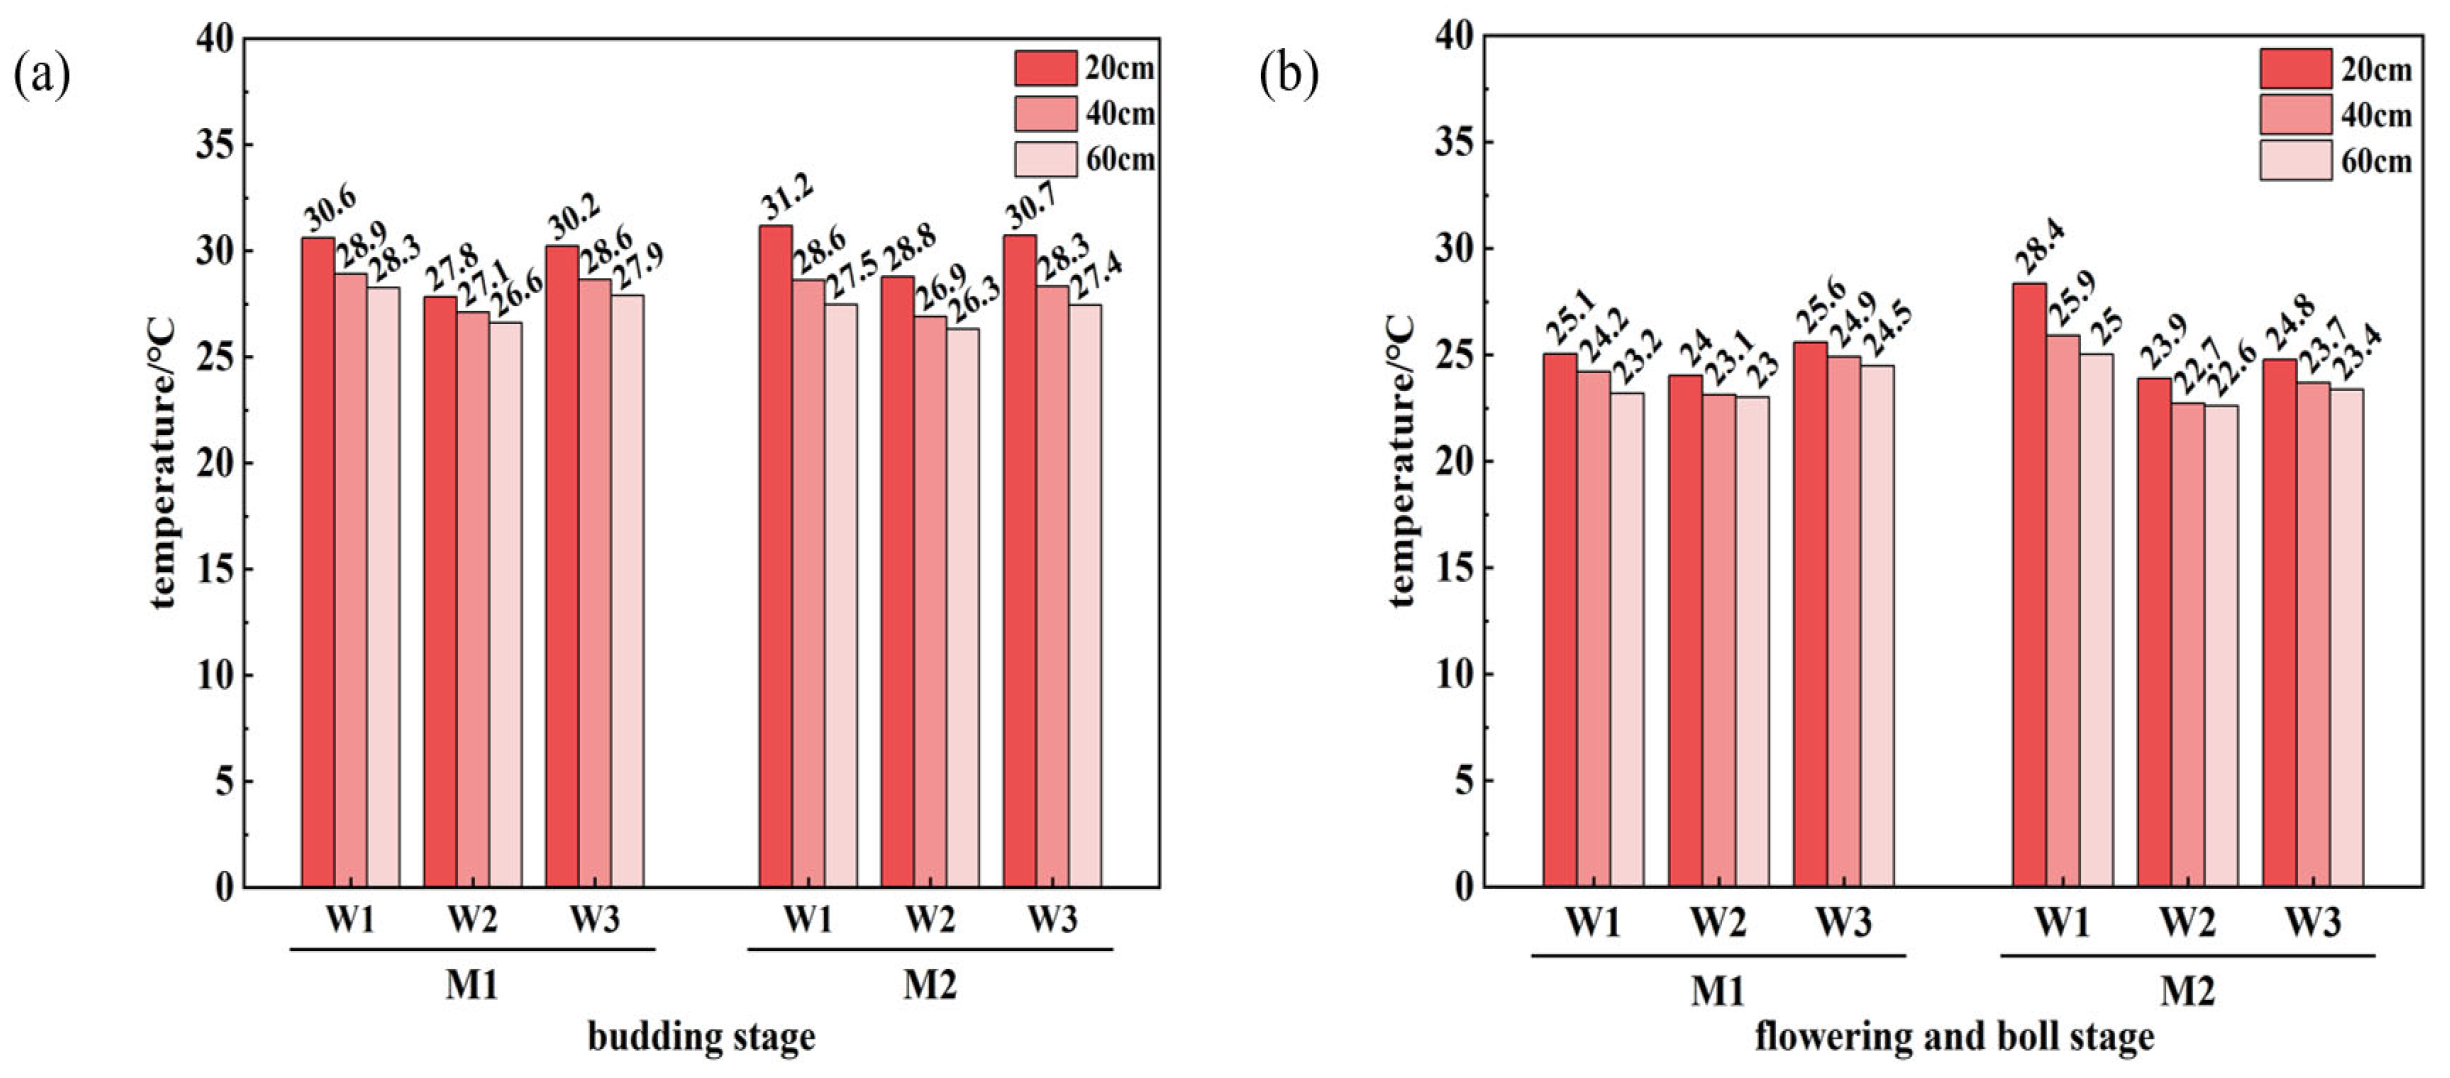
As shown in Figure 7, soil temperature during the bud stage is relatively high, with the temperature at the 20 cm shallow layer significantly higher than that at deeper layers. Under the same irrigation depth, soil temperatures at all depths in the M2 treatment are higher than those in M1, demonstrating better heat retention. At the 20 cm depth during the bud stage, soil temperature under the M2W1 treatment reached 31.2 °C, which was higher than that of M1W1. With increasing irrigation depth soil temperature shows a decreasing trend, with the temperature decline in M2 treatments being slightly less pronounced. Soil temperatures at the 40 cm and 60 cm depths exhibit minor fluctuations. During the flowering–boll stage, overall soil temperatures decreased by 2–3 °C compared to the bud stage, but the 20 cm layer still remained warmer than the deeper layers. At 20 cm depth under M2W1, soil temperature was 28.4 °C, which was higher than M1W1. However, soil temperatures under M2W2 and M2W3 were lower than those under M1W2 and M1W3, respectively.

3.4. Root Distribution of Cotton Under Different Treatments

At the budding stage under the same irrigation depth, cotton root length and root surface area under the M2 treatment were significantly higher than those under M1, with increases of 3.72% and 5.8%, respectively. Under the same mulching width, root length and root surface area increased progressively with the irrigation depth, with W2 and W3 treatments being significantly better than W1. Specifically, root length increased by 5.22% and 4.9%, and root surface area increased by 6.82% and 4.89% under W2 and W3, respectively. The interaction between mulching width and irrigation depth had no significant effect on root length. Root diameter measurements showed no significant differences under the interaction of different mulching widths and irrigation depths. Root volume, however, was significantly affected by both mulching width and irrigation depth individually, with the largest root volume observed under the M2W3 treatment. Entering the flowering–boll stage, under the same irrigation depth the promoting effect of the M2 treatment on root length became more pronounced, with an increase of 10.52% compared to M1. Root surface area under M2 was also significantly higher than that under M1, increasing by 7.51%. Under the same mulching width, the promoting effect of irrigation depth on root length was more evident than at the budding stage. The W3 treatment increased root length by 9.79% and 3.57% compared to W2 and W1, respectively. The interaction between mulching width and irrigation depth remained insignificant. Root diameter did not differ significantly under mulching width, irrigation depth, or their interaction. Root volume showed significant differences under the individual effects of both factors, with the highest value recorded under the M2W3 treatment (Table 3 and Table 4).

3.5. Effects of Different Treatments on Cotton Dry Matter Accumulation

The results showed that under the same irrigation depth the M2 treatment was significantly superior to the M1 treatment, with a 11.22% increase in dry matter per plant. Irrigation depth had a significant effect on dry matter accumulation. Under the same mulching width, dry matter accumulation increased notably with increasing irrigation amount; the W3 treatment increased dry matter by 17.55% and 9.82% compared to W2 and W1, respectively. The interaction between mulching width and irrigation depth had a significant effect on cotton dry matter accumulation. The lowest dry matter accumulation was observed under the M1W1 treatment, while the highest was under the M2W3 treatment, which was significantly higher than all other treatments.
Floral buds and bolls were the main sink organs for dry matter, accounting for 42% to 57% of the total, the highest among all organs. Under the same irrigation depth, compared with the M1 treatment the M2 treatment resulted in a higher proportion of dry matter allocated to floral buds and stems, with increases of 5% and 5.79%, respectively. Under the same mulching width the proportion of dry matter allocated to floral buds increased with the irrigation depth; the W3 treatment increased the proportion by 7.67% and 4.67% compared to W2 and W1, respectively. As the irrigation depth increased, the proportion allocated to leaves decreased, while the proportion allocated to roots remained within the range of 5% to 8%. Increasing irrigation depth significantly promoted dry matter allocation to stems and floral buds, while reducing allocation to leaves and roots (Figure 8).

3.6. Effects of Different Treatments on the Composition of Rhizosphere Soil Microbial Communities

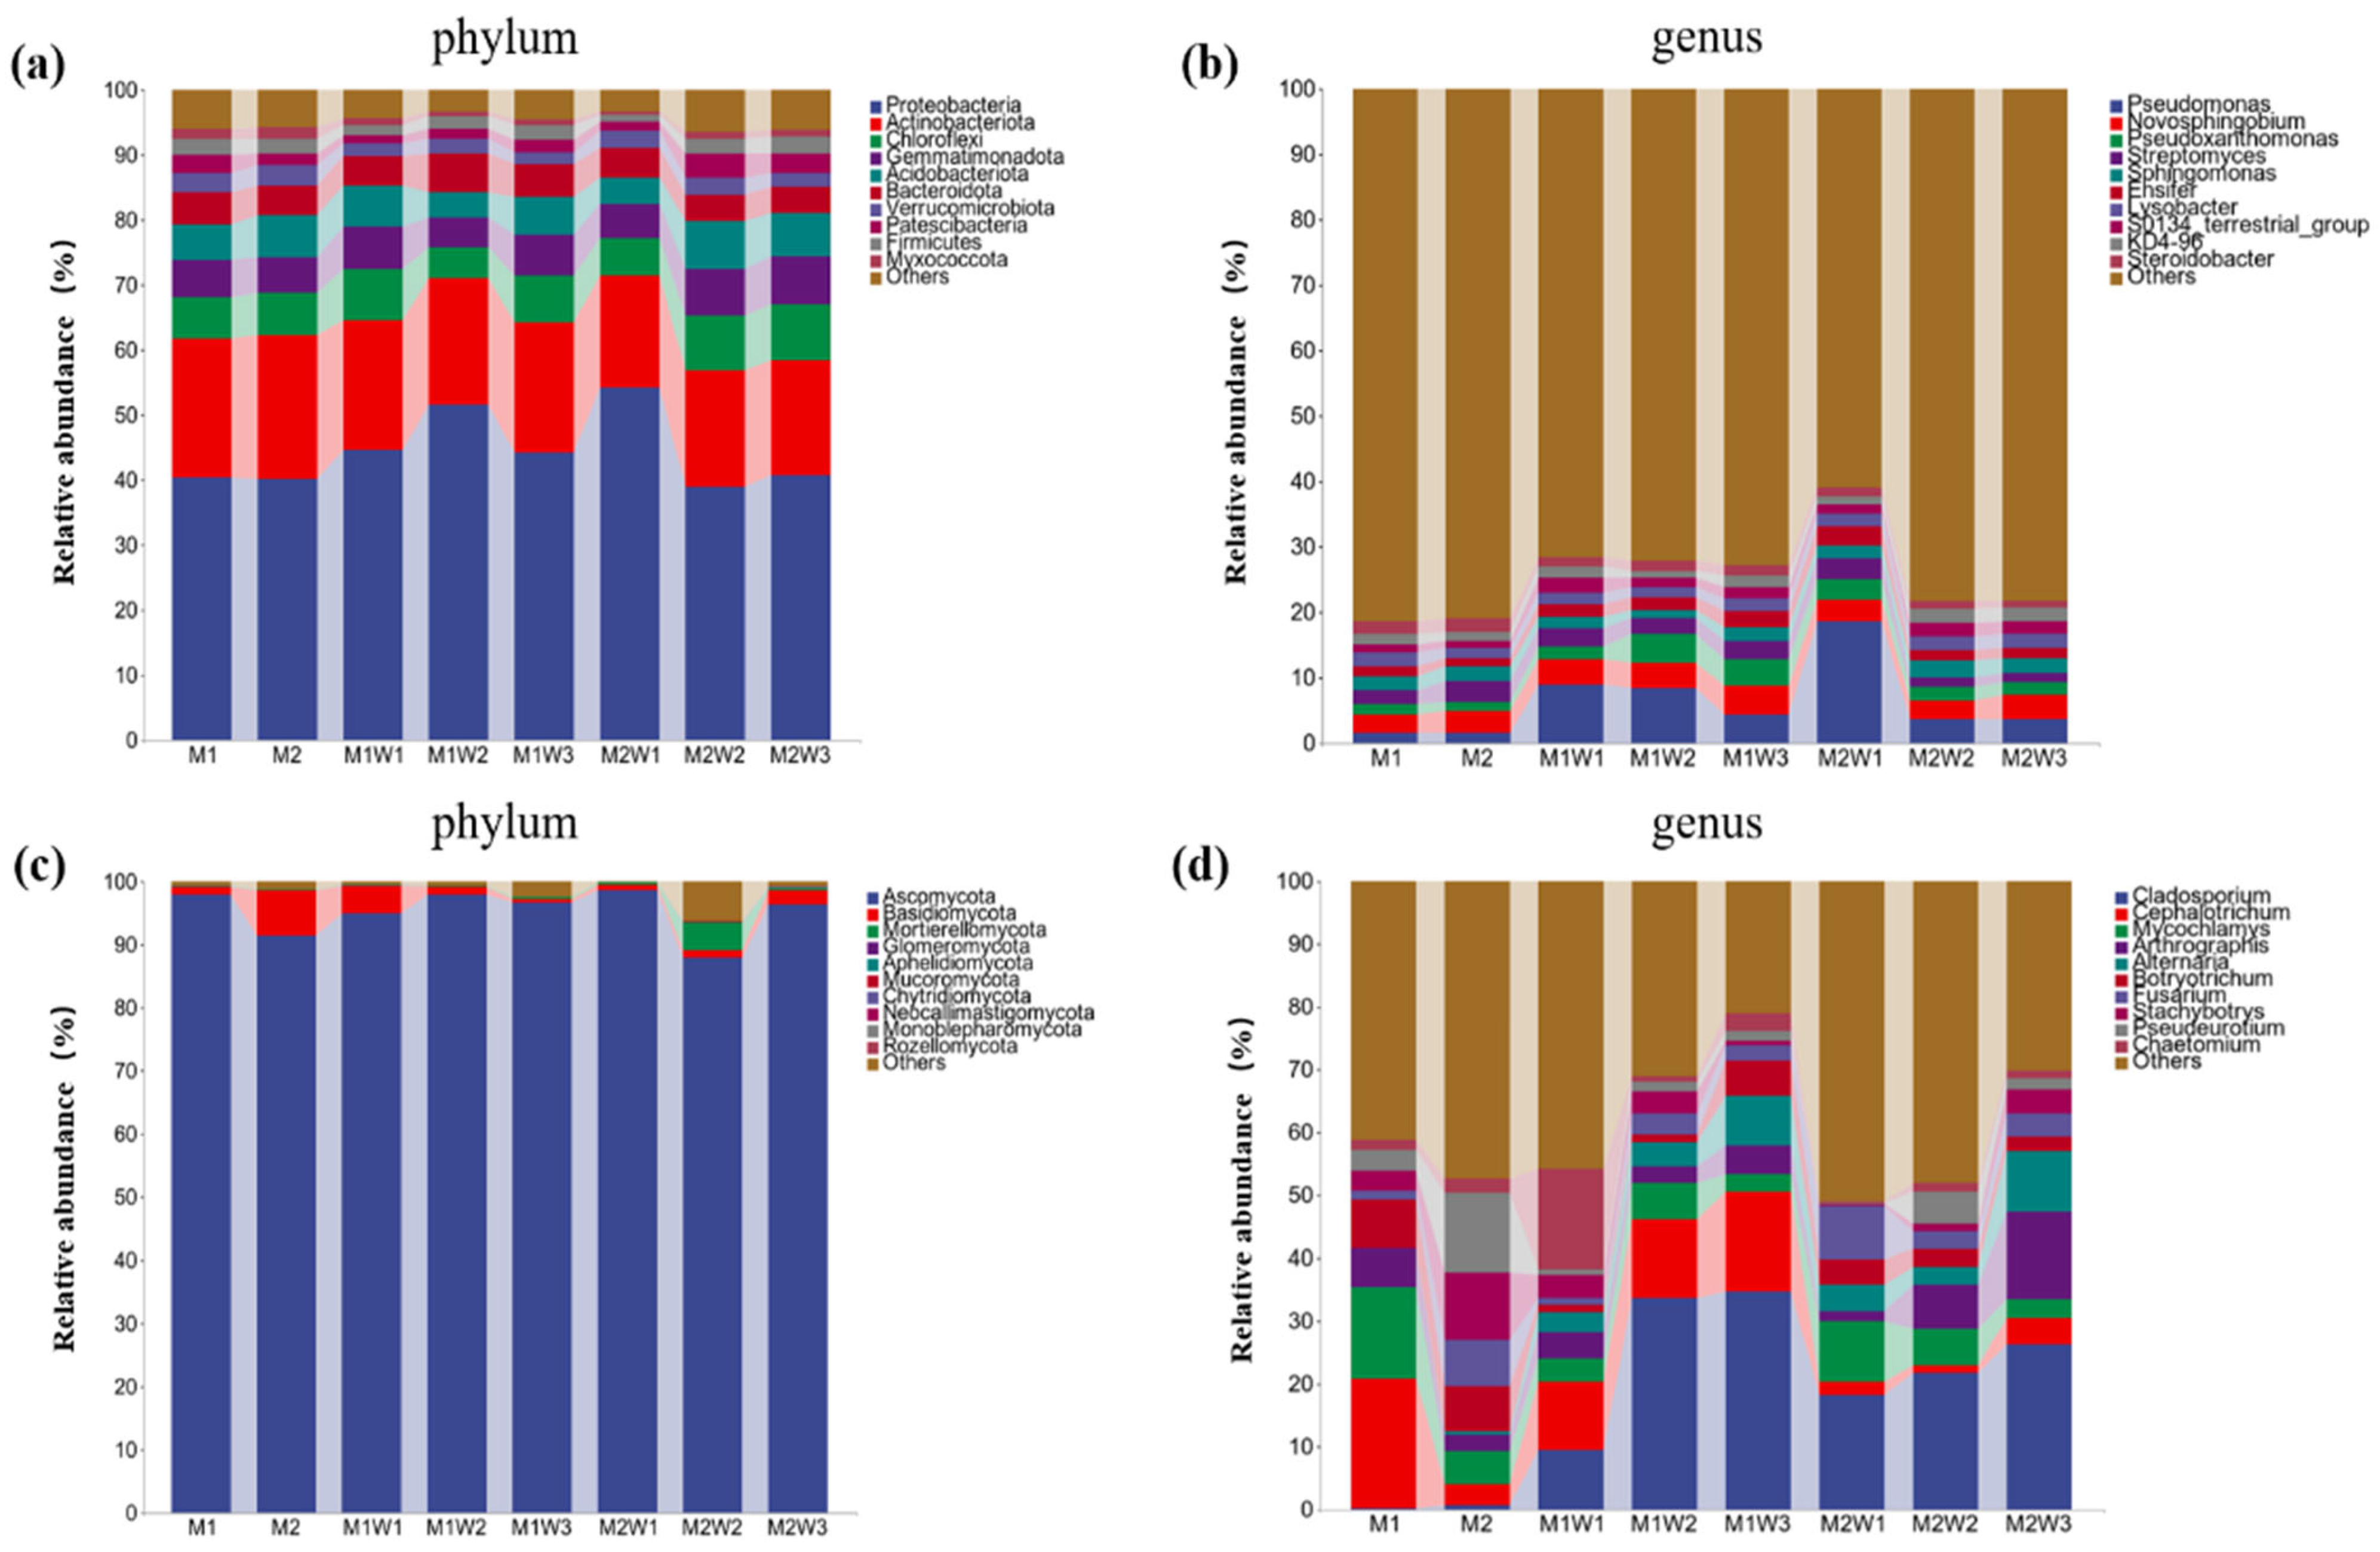
Under different mulching and irrigation treatments, the top 10 most abundant bacterial phyla (Figure 9a) and genera (Figure 9b) were identified, while the remaining groups were categorized as “Others”. At the phylum level, Proteobacteria exhibited the highest relative abundance, reaching 54.30% under the M2W1 treatment, followed by Actinobacteriota (22.13%), Chloroflexi (8.56%), Gemmatimonadota (7.35%), Acidobacteriota (7.33%), Bacteroidota (5.92%), Verrucomicrobiota (M2–3.08%), Patescibacteria (3.72%), Firmicutes (2.68%), and Myxococcota (1.67%). At the genus level, Pseudomonas showed the highest relative abundance (5.42%), followed by Novosphingobium, Pseudoxanthomonas, Streptomyces, Sphingomonas, Ensifer, Lysobacter, S0134-terrestrial-group, KD4-96, and Steroidobacter. A total of 10 fungal phyla were identified under different mulching and irrigation treatments, with the top 10 most abundant phyla (Figure 9c) and genera (Figure 9d) displayed, while other groups were classified as “Others”. At the phylum level, Ascomycota was dominant, reaching 98.64% under M2W1, followed by Basidiomycota, Mortierellomycota, Glomeromycota, Aphelidiomycota, Mucoromycota, Chytridiomycota, Neocallimastigomycota, Monoblepharomycota, and Rozellomycota. At the genus level, the relative abundance of Cladosporium was highest under the M1W3 treatment (34.68%), followed by Cephalotrichum, Mycochlamys, Arthrographis, Alternaria, Botryotrichum, Fusarium, Stachybotrys, Pseudeurotium, and Chaetomium.

3.7. Effects of Different Treatments on the Alpha Diversity of Rhizosphere Soil Microorganisms

As shown in Figure 10, before irrigation at the bud stage the bacterial Chao1 and Shannon indices were higher under the M2 treatment than under M1, and they increased by 7.36% and 3.48%. The Chao1 index of fungi in M2 was 1.72% lower than that in M1, while the Shannon index was 1.6% higher than that in M1. At the flowering and boll-setting stage, the bacterial Chao1 and Shannon indices under the M1 treatment first decreased and then increased with increasing irrigation depth, whereas under the M2 treatment both indices increased continuously as irrigation increased (Figure 10a,b). Although under the W1 treatment the bacterial Chao1 and Shannon indices in M1 were higher than those in M2, under the W2 and W3 treatments the Chao1 and Shannon indices of the bacterial community in M2 were significantly higher than those in M1, increasing by 7.2% and 3.48%, respectively. For the fungal community, both M1 and M2 treatments showed a trend where the Chao1 and Shannon indices first increased and then decreased with increasing irrigation depth. Under the W1 treatment, fungal diversity indices were higher in M1 than in M2. However, under W2 and W3 treatments the fungal Chao1 and Shannon indices were significantly higher in M2 compared to M1 (Figure 10c,d). Analysis of the α-diversity of bacteria and fungi showed that the film mulching width and increased irrigation depth had no significant effect on either the Chao1 index or the Shannon index.

3.8. Effects of Different Treatments on Rhizosphere Soil Microbial β-Diversity

Figure 11 presents beta-diversity based on Bray–Curtis distance analysis, a composite variable constructed from changes in microbial community abundance across multiple samples within different groups. Principal coordinates analysis (PCoA) was used to evaluate the effects of different treatments on the rhizosphere soil microbial community structure. As shown in Figure 11a, for the bacterial community structure the first principal coordinate (PC1) explains 77.1% of the variation and the second principal coordinate (PC2) explains 15.5%, indicating that PC1 is the main driver of changes in the bacterial community structure. The samples under various treatments are relatively clustered in the coordinate space, but there is some degree of separation between different treatments. During the bud stage the sample points for M1 and M2 treatments are widely separated, indicating that mulching width has a significant impact on the bacterial community structure, with its effect being stronger than that of irrigation treatment. At the flowering stage the bacterial community structure shows some variation with increasing irrigation depth, but there is considerable spatial overlap among treatment groups. Figure 11b shows the fungal community structure, where PC1 explains 29.3% of the variation and PC2 explains 16.4%, indicating that fungal community variation is more dispersed and influenced by multiple factors. During the bud stage there is a clear difference in sample point distribution between M1 and M2 treatments. At the flowering stage the distances between sample points of different treatments are larger, and compared to bacteria, fungal communities respond more strongly to mulching width.
Table 5 shows significant differences in the principal component scores of bacterial and fungal communities under different mulching widths and irrigation depths. Bacterial communities mainly varied along PC1 and PC2 dimensions, with mulching width having a greater impact on PC1 and irrigation depth mainly affecting PC2. Fungal communities exhibited variation in both PC1 and PC2 dimensions, with more dispersed scores on PC1 and noticeable differences in scores among treatments.

3.9. The Correlation Analysis of Indicators

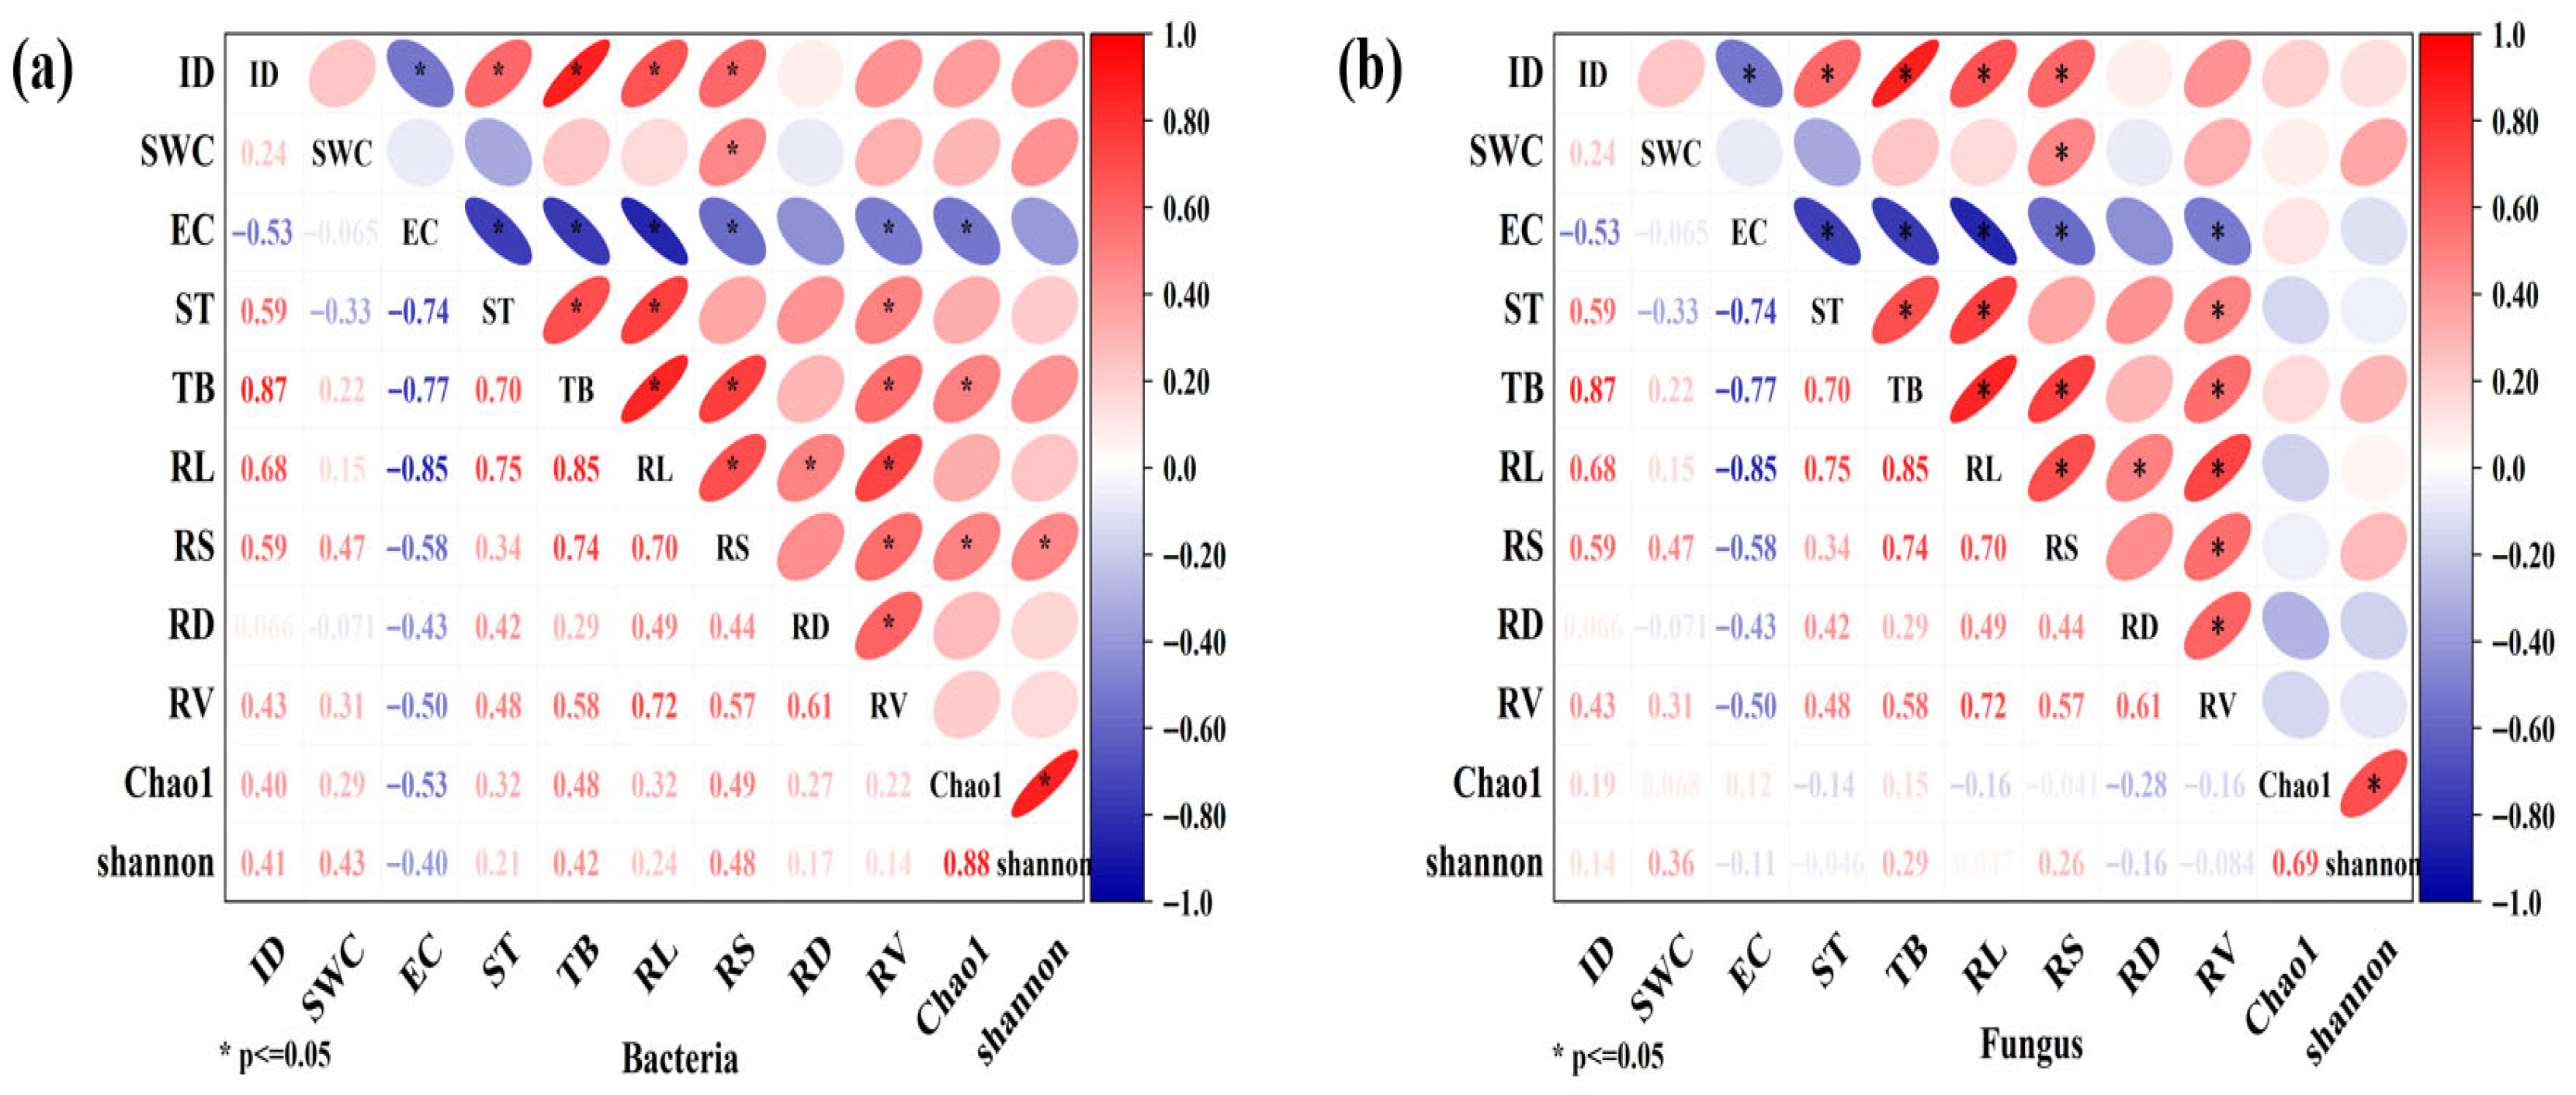
The correlation analyses between the α-diversity indices of rhizosphere bacteria and fungi and soil physicochemical properties as well as growth factors were conducted (see Figure 12). The main findings are as follows: (1) ID was positively correlated with SWC. (2) SWC showed positive correlations with root indicators such as root surface area (RS) and root volume (RV). In addition, SWC was positively correlated with total biomass (TB), as well as bacterial and fungal α-diversity indices (Chao1 and Shannon), while negatively correlated with soil temperature (ST) and electrical conductivity (EC). (3) EC was significantly negatively correlated with root length (RL) and bacterial Chao1 index (p < 0.05) and showed a positive correlation with fungal Chao1 but a negative correlation with fungal Shannon index. (4) ST was significantly positively correlated with TB, RL, and RV (p < 0.05), and was positively correlated with bacterial Chao1 and Shannon indices but negatively correlated with those of fungi. (5) TB was significantly positively correlated with RL, RS, RV, and bacterial Chao1 index (p < 0.05), and also showed positive correlations with bacterial Shannon index and fungal Chao1 and Shannon indices.
In summary, soil water content and rhizosphere microbial α-diversity are closely related to cotton root development and plant biomass. Soil temperature has a positive effect on cotton growth and rhizosphere bacterial communities, while higher electrical conductivity tends to inhibit cotton growth.

4. Discussion

4.1. Effects of Different Treatments on Soil Water, Temperature, and Salinity

Soil moisture content, electrical conductivity (EC), and soil temperature are integrated indicators of the soil’s water–thermal–salt status and directly or indirectly affect crop growth throughout its developmental stages [35]. It was found that soil moisture under ultra-wide mulch was significantly higher than under conventional mulch, and at the same mulch width moisture increased with rising irrigation depth, indicating that ultra-wide mulch has a stronger water-retention capacity than conventional mulch. Properly increasing the irrigation depth effectively boosts moisture in all soil layers to meet cotton’s water demands at different growth stages [36], while ultra-wide mulch coverage reduces evaporation, enhances water retention, and improves the rhizosphere moisture environment—thereby promoting cotton growth and water-use efficiency [37]. In this study, at a given mulch width soil EC declined as the irrigation depth increased. At a fixed irrigation depth, EC under ultra-wide mulch was lower than under conventional mulch, and the average EC during the flowering and boll stage was lower than during the budding stage [38]. This is because during the flowering and boll stage increased irrigation and root uptake dilute or leach soil salts [31], especially under ultra-wide mulch where the marked reduction in EC reflects superior salt regulation under mulched drip irrigation. Regarding irrigation across growth stages, regardless of the quota applied, salt content fluctuations in the 0–40 cm layer exceeded those in the 60–100 cm layer at all stages of cotton development, and lower irrigation depth had limited leaching effects. Consequently, severe surface salt accumulation occurred during the growth period, whereas increasing the irrigation depth helped reduce soil salinity—findings that align with those reported in other regions [39].
During the budding stage, when plant biomass is small, soil temperature is primarily governed by solar radiation. Under the same irrigation depth ultra-wide mulch raises soil temperature more effectively than conventional mulch, with an average increase of 0.69 °C to 1.86 °C. Throughout the entire growing season, as mulch width increases, the accumulated active soil heat units continue to rise, indicating that mulch width directly influences both soil heat accumulation and water storage capacity [27]. During the flowering and boll stage, as plant biomass increases more rapidly, the growth advantage of ultra-wide mulch over conventional mulch becomes pronounced and the effect of mulch width on soil temperature diminishes. In the late growth stages soil temperatures at all depths gradually decline, and the soil under 4.4 m ultra-wide mulch lags behind that under 2.05 m mulch—findings consistent with previous studies [40]. This delay occurs because wider mulch not only increases soil coverage but also reduces water and heat exchange with the atmosphere, ultimately leading to higher soil temperatures and greater soil water storage [41].
In summary, moisture deficit and excess, along with mulch width, are the main factors influencing soil water–thermal–salt dynamics. Proper irrigation levels and mulch widths can maintain optimal soil moisture, raise surface soil temperatures, reduce water consumption, promote cotton growth, and increase yields, thereby delivering greater economic benefits to farmers.

4.2. The Effect of Different Treatments on Cotton Growth

Mulch width and soil moisture distribution both affect the root distribution pattern in the soil. Greater root biomass and length can enhance the plant’s water and nutrient supply, enabling crops to better adapt to semi-arid environments [42]. This study shows that during the budding stage root length and root surface area of cotton grown under conventional mulch first increased and then decreased with increasing irrigation depth. For cotton grown under ultra-wide mulch the root length and root surface area increased as the irrigation depth increased. During the flowering and boll stage root length of cotton under both mulch widths increased with higher irrigation depth, possibly because greater water availability reduces competition for soil moisture among roots and suitable soil moisture promotes root growth. This indicates that soil moisture is highly sensitive for cotton root development [43]. Under conventional mulch, root surface area increased with irrigation depth, while under ultra-wide mulch, root surface area first increased and then decreased as irrigation depth increased. Ultra-wide mulch showed a stronger promoting effect on root growth during both the budding and flowering and boll stages. The highest irrigation depth (W3) significantly increased root length and surface area, especially during the flowering and boll stage [15,44]. Root diameter was insensitive to irrigation and mulch treatments, possibly reflecting a stable root characteristic. Cotton is a thermophilic crop, and different mulch widths and irrigation depths affect soil water–thermal–salt distributions in cotton fields, thereby influencing cotton growth and development. The accumulation rate of cotton dry matter is fastest during the flowering and boll stage, as this is the period of most vigorous growth with high water demand. Ultra-wide mulch’s warming and water-retention effects favor cotton growth [27]. Conversely, conventional mulch, due to narrower width and higher field evaporation, causes part of the soil moisture to evaporate into the atmosphere, negatively impacting cotton growth [24]. The per-plant dry matter accumulation under ultra-wide mulch exceeds that under conventional mulch. Increasing irrigation depth benefits cotton growth and promotes dry matter accumulation by raising soil moisture and reducing salinity in the main root zone [45].
Therefore, future research should further integrate dynamic soil moisture monitoring with detailed root phenotyping to explore the synergistic mechanisms of root distribution and function under different combinations of mulch width and irrigation. At the same time, it is necessary to assess the stability and adaptability of mulch and irrigation management over long periods and under varying climatic conditions. Additionally, attention should be given to the potential contributions of root–microbial interactions to cotton nutrient uptake and growth, providing a more systematic theoretical basis for precise water and fertilizer management of cotton in arid regions.

4.3. Soil Environmental Factors and Rhizosphere Soil Microbial Communities

Mulching and supplemental irrigation affect microbial functional diversity and microbial abundance by altering soil moisture conditions [46,47]. Studies have found that compared to furrow irrigation and seepage irrigation, mulched drip irrigation maintains higher soil microbial activity; however, when the irrigation amount of mulched drip irrigation is half that of furrow irrigation, microbial activities of both methods are basically similar [48]. This study found that Proteobacteria and Pseudomonas are the dominant bacterial groups, with their proportions significantly increased under the ultra-wide mulch treatment, indicating that ultra-wide mulch is more conducive to the growth of beneficial bacteria in the cotton rhizosphere soil [49,50]. Ascomycota and Cladosporium are the main dominant fungal groups, with their proportions varying little among different treatments. Ultra-wide mulch may optimize environmental conditions by suppressing the proportion of potential pathogenic fungus Fusarium [51] and increasing the proportion of antagonistic fungus Cladosporium [52]. Using ultra-wide mulch coverage can significantly optimize the rhizosphere soil microbial community, promote the proliferation of beneficial microbes, suppress potential pathogens, and enhance soil health. The Chao1 and Shannon indices under ultra-wide mulch combined with high irrigation depth are significantly higher than those under conventional mulch, indicating that ultra-wide mulch cultivation can more effectively promote soil microbial species richness under high water conditions [53]. Appropriate irrigation not only promotes microbial diversity but also further improves crop growth and stress resistance, suggesting that moderate irrigation contributes to the healthy development of soil microbes [54]. However, it is important to note that this study did not conduct an in-depth analysis of the metabolic functions of soil microorganisms or their interaction mechanisms with cotton roots. Whether changes in microbial community structure directly translate into improved soil health and enhanced crop stress resistance still requires further verification [55]. Additionally, microbial sequencing data are limited by sample size, timing of sampling, and analytical techniques, which may introduce some randomness and representativeness bias [56]. Future research should focus on the expression characteristics of microbial functional genes and investigate the dynamic changes in microorganisms across multiple time points and under different environmental conditions. This will enable a deeper understanding of the long-term regulatory mechanisms of mulching and irrigation on beneficial and harmful microbial populations. Furthermore, long-term field trials that integrate monitoring of cotton production performance and soil health indicators are expected to systematically evaluate the synergistic effects of ultra-wide mulch and irrigation management on microbial ecology and cotton stress resistance. Such research will provide a more solid scientific basis for efficient and sustainable cotton production in arid regions.
This study found that moderate irrigation promotes the coordinated development of cotton roots which in turn enhances the α-diversity of rhizosphere soil microbial communities, indicating the positive effects of water availability on root growth and the soil microenvironment [57]. Meanwhile, soil temperature benefits root expansion and growth, but increased soil salinity (EC) significantly inhibits root development and rhizosphere microbial diversity. Electrical conductivity was identified as the only significant environmental factor affecting bacterial communities, suggesting that salt stress imposes stronger limitations on the stability and diversity of rhizosphere soil microbial communities [58]. Although soil moisture content positively correlates with root growth indicators and plant dry matter, it shows no significant correlation with salinity and temperature, possibly due to multiple influencing factors such as evaporation rate, soil profile structure, and irrigation methods [59]. These findings indicate that while water availability is a key factor promoting root growth, salt stress may be the primary limiting factor regulating microbial diversity and plant health in complex soil environments. Therefore, rational irrigation management should not only ensure adequate soil moisture but also emphasize controlling salt accumulation and comprehensively managing soil physicochemical properties to promote the stability of the rhizosphere ecosystem and efficient cotton growth.

4.4. Limitations and Future Challenges

This study was based on a single-season trial with limited reproducibility and representativeness, and the generalizability of the results requires further validation through multi-site and multi-year experiments. In addition, the causal relationships among key variables have not been thoroughly analyzed, such as the effects of soil moisture and salinity on root traits, the influence of root traits on dry matter accumulation, and the shaping of microbial communities by dry matter. The current analysis mainly remains at the correlation level and lacks mechanistic investigation. Although this study explored microbial community structure, it did not address the expression of functional genes or the interaction mechanisms between microorganisms and cotton roots [60]. Whether changes in microbial communities can directly promote soil health and enhance crop stress resistance still requires further study. Furthermore, a systematic assessment of long-term environmental impacts—such as plastic mulch residue, irrigation water quality, and soil salinity accumulation—is still lacking. Future research should strengthen long-term monitoring and comprehensively investigate the combined effects of mulching and irrigation management on microbial ecology, soil environment, and crop adaptability.

5. Conclusions

The combination of ultra-wide-film mulching and higher irrigation depth helps to improve soil temperature and water retention, suppress evaporation, reduce surface salt accumulation, and promote salt leaching to deeper soil layers, thereby optimizing the cotton rhizosphere environment. This study showed that regulating mulching width and irrigation depth not only improved soil water–thermal–salt conditions but also promoted cotton growth and dry matter accumulation by influencing the rhizosphere microenvironment. During the flowering and boll-setting stage, cotton under ultra-wide film had significantly higher dry matter accumulation per plant compared to conventional film, and this accumulation further increased with higher irrigation depth, highlighting the importance of proper mulching and irrigation management for yield improvement. Ultra-wide mulching also stimulated the growth of beneficial microorganisms such as Pseudomonas and Cladosporium, further improving the rhizosphere microecology. Overall, the combined application of ultra-wide mulching and appropriate irrigation effectively improves the soil environment, supports the proliferation of beneficial microbes, and enhances cotton growth and yield, providing a scientific basis for efficient and sustainable cotton production in arid regions. Although ultra-wide film has a positive impact on the soil environment and cotton growth, its increased usage may lead to the accumulation of plastic residues and soil degradation. In the future, the use of degradable and environmentally friendly films should be promoted to retain the benefits of ultra-wide mulching while minimizing negative effects on the soil environment. Further research is needed in this area.

Author Contributions

N.L.: Investigation, Formal analysis, Data organization, and Writing—original draft preparation; G.Y.: Methodology; Y.S.: Investigation; W.W.: Investigation; X.Z.: Software; H.L.: Software; H.N.: Writing—review and editing and Funding acquisition. All authors have read and agreed to the published version of the manuscript.

Funding

This work was funded by the Agricultural Science and Technology Innovation Program, and the Central Public-interest Scientific Institution Basal Research Fund (No. CAAS-ZDRW202401).

Data Availability Statement

Data will be made available on request.

Conflicts of Interest

The authors declare that they have no-known competing financial interests or personal relationships that could have appeared to influence the work reported in this paper.

References

  1. Announcement from the National Bureau of Statistics on Cotton Production in 2024. China Information Daily, 2024-12-25. Available online: https://www.stats.gov.cn/english/PressRelease/202412/t20241227_1957916.html (accessed on 1 June 2025).
  2. Li, G. Study on the Effects of Water Regulation Under Mulched Drip Irrigation on Photosynthetic Characteristics and Yield Formation Mechanisms of Machine-Harvested Cotton. Master’s Thesis, Xinjiang Agricultural University, Ürümqi, China, 2017. [Google Scholar]
  3. Ning, S.; Zuo, Q.; Shi, J.; Wang, S.; Liu, Z. Water Use Efficiency and Economic Benefits of Typical Mulched Drip-Irrigated Cotton Planting Patterns in Xinjiang. Trans. Chin. Soc. Agric. Eng. 2013, 29, 90–99. [Google Scholar]
  4. Zhao, X. Experimental Study of Farmland Environment and Maize Growth Under Mulched Drip Irrigation. Master’s Thesis, Shandong University of Technology, Zibo, China, 2016. [Google Scholar]
  5. Guo, C.; Bao, X.; Sun, H.; Zhu, L.; Zhang, Y.; Zhang, K.; Bai, Z.; Zhu, J.; Liu, X.; Li, A.; et al. Optimizing root system architecture to improve cotton drought tolerance and minimize yield loss during mild drought stress. Field Crops Res. 2024, 308, 109305. [Google Scholar] [CrossRef]
  6. Wu, B.; Yang, P.; Zuo, W.; Zhang, W. Optimizing water and nitrogen management can enhance nitrogen heterogeneity and stimulate root foraging. Field Crops Res. 2023, 304, 109183. [Google Scholar] [CrossRef]
  7. Chen, W. Research on the Ratio of Soil Salt Accumulation to Leaching and Its Control Techniques Under Mulched Drip Irrigation. Ph.D. Thesis, Shihezi University, Shihezi, China, 2020. [Google Scholar]
  8. Shi, W.; Ma, Y.; Xu, F.; Wang, Q. Spatial Variability of Soil Water and Salt under Micro-Scale Drip Irrigation in Mulched Cotton Fields. Adv. Water Sci. 2014, 25, 585–593. [Google Scholar]
  9. Ju, L.; Wang, Q.; Wang, L.; Shi, X. Effects of Irrigation Amount on Soil Water and Salt Distribution Characteristics and Winter Wheat Yield in Semi-Arid Regions. Trans. Chin. Soc. Agric. Eng. 2007, 317, 86–90. [Google Scholar]
  10. Bo, L.; Zhao, Y.; Mao, X.; Chen, S. Response and Simulation Study of Soil Water-Salt Transport and Crop Growth under Deficit Drip Irrigation. Trans. Chin. Soc. Agric. Mach. 2021, 52, 248–255. [Google Scholar]
  11. Arora, V.K.; Singh, C.B.; Sidhu, A.S.; Thind, S.S. Irrigation, tillage and mulching effects on soybean yield and water productivity in relation to soil texture. Agric. Water Manag. 2011, 98, 563–568. [Google Scholar] [CrossRef]
  12. Zhang, R.; Shi, J.; Song, R.; Li, W.; Ma, X.; Yu, J.; Wang, W. Experimental Study on the Effects of Mulched Drip Irrigation on Maize Growth and Soil Temperature at Seedling Stage. J. Water Sav. Irrig. 2016, 09, 98–101. [Google Scholar]
  13. Zhai, Z.; Yang, F.; Zhang, X.; Zhu, B. Experimental Demonstration of Supporting Cultivation Technology for Ultra-Wide Film Mulching in Cotton. J. Xinjiang Agric. Reclam. Sci. Technol. 2021, 44, 4–6. [Google Scholar]
  14. Li, X.; Šimůnek, J.; Shi, H.; Yan, J.; Peng, Z.; Gong, X. Spatial distribution of soil water, soil temperature, and plant roots in a drip-irrigated intercropping field with plastic mulch. Eur. J. Agron. 2017, 83, 47–56. [Google Scholar] [CrossRef]
  15. Wang, J.; Du, G.; Tian, J.; Zhang, Y.; Jiang, C.; Zhang, W. Effect of irrigation methods on root growth, root-shoot ratio and yield components of cotton by regulating the growth redundancy of root and shoot. Agric. Water Manag. 2020, 234, 106120. [Google Scholar] [CrossRef]
  16. Zhu, L.; Yan, H.; Liu, P.; Zhang, Z.; Zhang, S.; Guo, S.; Jiang, S.; Duan, J. Research Progress on the Influence of Rhizosphere Microorganisms of Medicinal Plants on Quality Formation and Their Mechanisms of Action. Chin. Herb. Med. 2021, 52, 4064–4073. [Google Scholar]
  17. Li, Z.; Kravchenko, A.N.; Cupples, A.; Guber, A.; Kuzyakov, Y.; Philip, R.G.; Blagodatskaya, E. Composition and metabolism of microbial communities in soil pores. Nat. Commun. 2024, 15, 3578. [Google Scholar] [CrossRef] [PubMed]
  18. Osburn, E.D.; McBride, S.G.; Bahram, M.; Strickland, M.S. Global patterns in the growth potential of soil bacterial communities. Nat. Commun. 2024, 15, 6881. [Google Scholar] [CrossRef]
  19. Tao, F.; Huang, Y.; Hungate, B.A.; Manzoni, S.; Frey, S.D.; Schmidt, M.W.; Reichstein, M.; Carvalhais, N.; Ciais, P.; Jiang, L.; et al. Microbial carbon use efficiency promotes global soil carbon storage. Nature 2023, 618, 981–985. [Google Scholar] [CrossRef]
  20. Gao, C.; Bezemer, T.M.; de Vries, F.T.; van Bodegom, P.M. Trade-offs in soil microbial functions and soil health in agroecosystems. Trends Ecol. Evol. 2024, 39, 895–903. [Google Scholar] [CrossRef]
  21. Zhao, F.; Huang, W.; Zhao, X.; Zhang, L.; Guo, Y.; Wang, H.; Wang, X.; Gao, Y. Enhancing nitrogen fertilizer productivity in cotton fields in southern Xinjiang by improving the soil microen-vironment through water and nitrogen management. Agric. Water Manag. 2025, 312, 109442. [Google Scholar] [CrossRef]
  22. Qin, S.; Zhang, D.; Wei, B.; Yang, Y. Dual roles of microbes in mediating soil carbon dynamics in response to warming. Nat. Commun. 2024, 15, 6439. [Google Scholar] [CrossRef]
  23. Karhu, K.; Auffret, M.D.; Dungait, J.A.J.; Hopkins, D.W.; Prosser, J.I.; Singh, B.K.; Subke, J.; Wookey, P.A.; Agren, G.I.; Sebastià, M.; et al. Temperature sensitivity of soil respiration rates enhanced by microbial community response. Nature 2014, 513, 81–84. [Google Scholar] [CrossRef]
  24. Li, X.; Guo, J.; Chen, L.; Song, H.; Zhang, Z. Effects of Different Mulching Widths on Cotton Growth, Yield, and Quality. Jiangsu Agric. Sci. 2022, 50, 76–80. [Google Scholar]
  25. Li, X. Study on the Impact of Two Mulching Widths on Cotton Growth Environment and Characteristics. Master’s Thesis, Xinjiang Agricultural University, Ürümqi, China, 2022. [Google Scholar]
  26. Lu, X. High-Yield Cultivation Technology for Machine-Picked Cotton with Ultra-Wide Film Mulching. J. Rural Sci. Technol. 2023, 5, 14–17. [Google Scholar]
  27. Ma, Z.; Liu, J.; Zhang, J.; Yin, F.; Guo, L.; Wen, Y.; Song, L.; Zhu, Y.; Liang, Y.; Wang, Z. Ultra-wide film mulching with moderate irrigation water salinity enhances cotton growth under drip irrigation in Xinjiang, China. Field Crops Res. 2024, 315, 109485. [Google Scholar] [CrossRef]
  28. Wang, L.; Liu, H.; Gao, F.; Ning, H.; Han, Q.; Xu, X.; Wang, X.; Li, X. The Effects of Different Planting Patterns and Irrigation Quotas on Cotton Growth and Yield. J. Irrig. Drain. 2023, 42, 16–23. [Google Scholar]
  29. Li, X. Analysis and Research on the Impact of Two Film Widths on the Growth Environment and Traits of Cotton. Master’s Thesis, Xinjiang Agricultural University, Ürümqi, China, 2022. [Google Scholar]
  30. Gao, F. Effects of Drip Irrigation with Spring Irrigation on Soil Water-Heat-Salt Distribution and Cotton Growth in Mulched Fields in Southern Xinjiang. Master’s Thesis, Chinese Academy of Agricultural Sciences, Beijing, China, 2023. [Google Scholar]
  31. Wang, L. Effects of Irrigation Quotas Under Different Planting Patterns on Root-Shoot Growth and Yield of Mechanically Harvested Cotton in Southern Xinjiang. Master’s Thesis, Tarim University, Alar, China, 2023. [Google Scholar]
  32. Wu, J.; Liu, Q.; Li, X.; Wen, T.; Yang, W.; Tang, F. Effects of Mepiquat Chloride and Sodium Nitroprusside on Rhizosphere Soil Enzyme Activities and Bacterial Communities in Cotton Seedlings. Cotton Sci. 2023, 35, 353–364. [Google Scholar]
  33. Callahan, B.J.; McMurdie, P.J.; Rosen, M.J.; Han, A.E.; Johnson, A.J.; Holmes, S.P. DADA2: High-resolution sample inference from Illumina amplicon data. Nat. Methods 2016, 13, 581–583. [Google Scholar] [CrossRef]
  34. Bokulich, N.A.; Kaehler, B.D.; Rideout, J.R.; Dillon, M.; Bolyen, E.; Knight, R.; Huttley, G.A.; Gregory, C.J. Optimizing taxonomic classification of marker-gene amplicon sequences with QIIME 2’s q2-feature-classifier plugin. Microbiome 2018, 6, 90. [Google Scholar] [CrossRef]
  35. Zhang, H.; Wang, X.; Hu, L.; Pang, N.; Gui, H.; Dong, Q.; Ruan, K.; Song, M.; Zhang, X. Effects of Different Mechanically Harvested Cotton Planting Patterns and Planting Densities on Soil Hydrothermal Conditions and Yield in Cotton Fields. J. Agric. Eng. 2020, 36, 39–47. [Google Scholar]
  36. Li, Z.; Wan, S.; Chen, G.; Han, Y.; Lei, Y.; Ma, Y.; Xiong, S.; Mao, T.; Feng, L.; Wang, G.; et al. Effects of irrigation regime on soil hydrothermal microenvironment, cotton biomass, and yield under non-film drip irrigation system in cotton fields in southern Xinjiang, China. Ind. Crops Prod. 2023, 198, 116738. [Google Scholar] [CrossRef]
  37. Liu, C.; Yang, G.; Guo, M.; Jia, W.; Kong, C.; Wang, C.; He, X. The Effects of Irrigation Gradient and Mulching Combination Patterns on the Transpiration and Evaporation Dynamics in Drip-Irrigated Cotton Fields. Res. Agric. Arid Reg. 2024, 42, 172–180. [Google Scholar]
  38. Qi, C.; Cao, H.; He, Z.; Ding, B.; Li, Z. Effects of Surface-Subsurface Relay Drip Irrigation Leaching on Soil Water and Salt Transport and Cotton Yield. Trans. Chin. Soc. Agric. Eng. 2025, 41, 120–133. [Google Scholar]
  39. Yao, B. Study on the Spatiotemporal Migration Patterns and Regulation of Soil Water-Heat-Salt in Winter-Free Spring-Irrigated Cotton Fields in Southern Xinjiang. Ph.D. Thesis, China Agricultural University, Beijing, China, 2017. [Google Scholar]
  40. Li, X.; Guo, J.; Chen, L.; Song, H.; Zhang, Z. Impact of Various Mulching Widths on the Cotton Farmland Environment. J. Xinjiang Agric. Sci. 2023, 60, 1840–1847. [Google Scholar]
  41. Wang, D.; Wang, Z.; Lv, T.; Zong, R.; Zhu, Y.; Zhang, J.; Wang, T. Effects of drip tape modes on soil hydrothermal conditions and cotton yield (Gossypium hirsutum L.) under machine-harvest patterns. PeerJ 2021, 9, e12004. [Google Scholar] [CrossRef] [PubMed]
  42. Sadras, V.O.; Calderni, D.F. Crop Physiology Applications for Genetic Improvement and Agronomy Preface. In Crop Physiology: Applications for Genetic Improvement and Agronomy; Academic Press: New York, NY, USA, 2009; pp. XIII–XIV. [Google Scholar]
  43. Wu, F.; Tang, Q.; Cui, J.; Tian, L.; Guo, R.; Wang, L.; Zheng, Z.; Zhang, N.; Zhang, Y.; Lin, T. Deficit irrigation combined with a high planting density optimizes root and soil water–nitrogen distribution to enhance cotton productivity in arid regions. Field Crops Res. 2024, 317, 109524. [Google Scholar] [CrossRef]
  44. Feng, Q. Investigation of Cotton Water Uptake and Utilization Responses to Water and Salt Stress Based on Stable Hydrogen and Oxygen Isotope Techniques. Master’s Thesis, Chinese Academy of Agricultural Sciences, Beijing, China, 2023. [Google Scholar]
  45. Gao, F.; Wang, L.; Li, X.; Ning, H.; Han, Q.; Liu, H.; Feng, Q. Effects of Different Irrigation Regimes on Soil Water-Salt Distribution and Crop Growth in Cotton Fields of Southern Xinjiang. Xinjiang J. Irrig. Drain. 2023, 42, 54–63. [Google Scholar]
  46. Lan, J. Study on the Rhizosphere and Non-Rhizosphere Soil and Microbial Characteristics of Safflower During Flowering Under Different Irrigation Patterns in Xinjiang. Master’s Thesis, Shihezi University, Shihezi, China, 2018. [Google Scholar]
  47. Li, H.; Cao, J.; Su, H. The Effects of Mulching Cultivation on Soil Enzyme Activity, Soil Microorganisms, and Yield of Rainfed Potato. J. Southwest Agric. 2018, 31, 467–470. [Google Scholar]
  48. Li, W.; Ye, X.; Han, B.; Zhng, X.; Zou, H.; Zhang, Y. Comparison of three soil microbial activity measurement methods under different irrigation methods. Acta Ecol. Sin. 2017, 37, 4084–4090. [Google Scholar]
  49. Kumar, M.; Yadav, A.N.; Saxena, R.; Paul, D.; Tomar, R.S. Biodiversity of pesticides degrading microbial communities and their environmental impact. Biocatal. Agric. Biotechnol. 2021, 31, 101883. [Google Scholar] [CrossRef]
  50. Misra, P.; Archana; Uniyal, S.; Srivastava, A.K. Chapter 8—Pseudomonas for sustainable agricultural ecosystem. In Microbial Syntrophy-Mediated Eco-Enterprising; Pratap Singh, R., Manchanda, G., Bhattacharjee, K., Panosyan, H., Eds.; Academic Press: New York, NY, USA, 2022; pp. 209–223. [Google Scholar]
  51. Han, S.; Wang, M.; Ma, Z.; Ren, M.; Zhao, P.; Liang, J.; Gao, M.; Li, Y.; Wang, J.; Hu, D.; et al. Fusarium diversity associated with diseased cereals in China, with an updated phylogenomic assessment of the genus. Stud. Mycol. 2023, 104, 87–148. [Google Scholar] [CrossRef]
  52. Li, Y.; Wang, Y.; Wang, H.; Shi, T.; Wang, B. The Genus Cladosporium: A Prospective Producer of Natural Products. Int. J. Mol. Sci. 2024, 25, 1652. [Google Scholar] [CrossRef]
  53. Bai, H.; He, S.; Qin, T.; Yan, D.; Weng, B.; Zhao, X.; Li, X.; Bai, Y.; Ma, J. Influences of irrigation amount on the rhizospheric microorganism composition and carbon dioxide flux of maize crops. Geoderma 2019, 343, 1–9. [Google Scholar] [CrossRef]
  54. Zhang, X.; Zhenan ZhangÅgren, G.I.; Wang, F. Effects of Different Sprinkler Irrigation Treatments on Water Consumption Characteristics and Soil Microbial Properties of Purple Alfalfa. Water Resour. Plan. Des. 2021, 08, 90–95. [Google Scholar]
  55. Kong, Y.; Qin, H.; Zhu, C.; Tian, W.; Zhu, X. Research Progress on the Mechanisms by Which Soil Microorganisms Influence Soil Health. Acta Pedol. Sin. 2023, 17, 331–347. [Google Scholar]
  56. Huang, Z.; Qiu, J.; Li, J.; Xu, D.; Liu, Q. Analysis of microbial community diversity based on 16S rRNA gene sequencing. Acta Microbiol. Sin. 2021, 61, 1044–1063. [Google Scholar]
  57. Zhang, X.; Liu, Y.; Zhang, Z.; Liang, Q.; Wang, G. Soil moisture influences wheat yield by affecting root growth and the composition of microbial communities under drip fertigation. Agric. Water Manag. 2024, 305, 109102. [Google Scholar] [CrossRef]
  58. Wang, Q.; Xu, J.; Li, D.; Zhang, J.; Zhao, B. Salinity-induced variations in wheat biomass are regulated by the Na+: K+ ratio, root exudates, and keystone species. Sci. Total Environ. 2024, 947, 174778. [Google Scholar] [CrossRef]
  59. Zhang, X.; Ye, P.; Wu, Y.; Zhai, E. Experimental study on simultaneous heat-water-salt migration of bare soil subjected to evaporation. J. Hydrol. 2022, 609, 127710. [Google Scholar] [CrossRef]
  60. Wen, Z.; Yu, P.; Shen, J.; Lambers, H. Do rhizosphere microbiomes match root functional traits? Trends Ecol. Evol. 2025, 40, 678–690. [Google Scholar] [CrossRef]
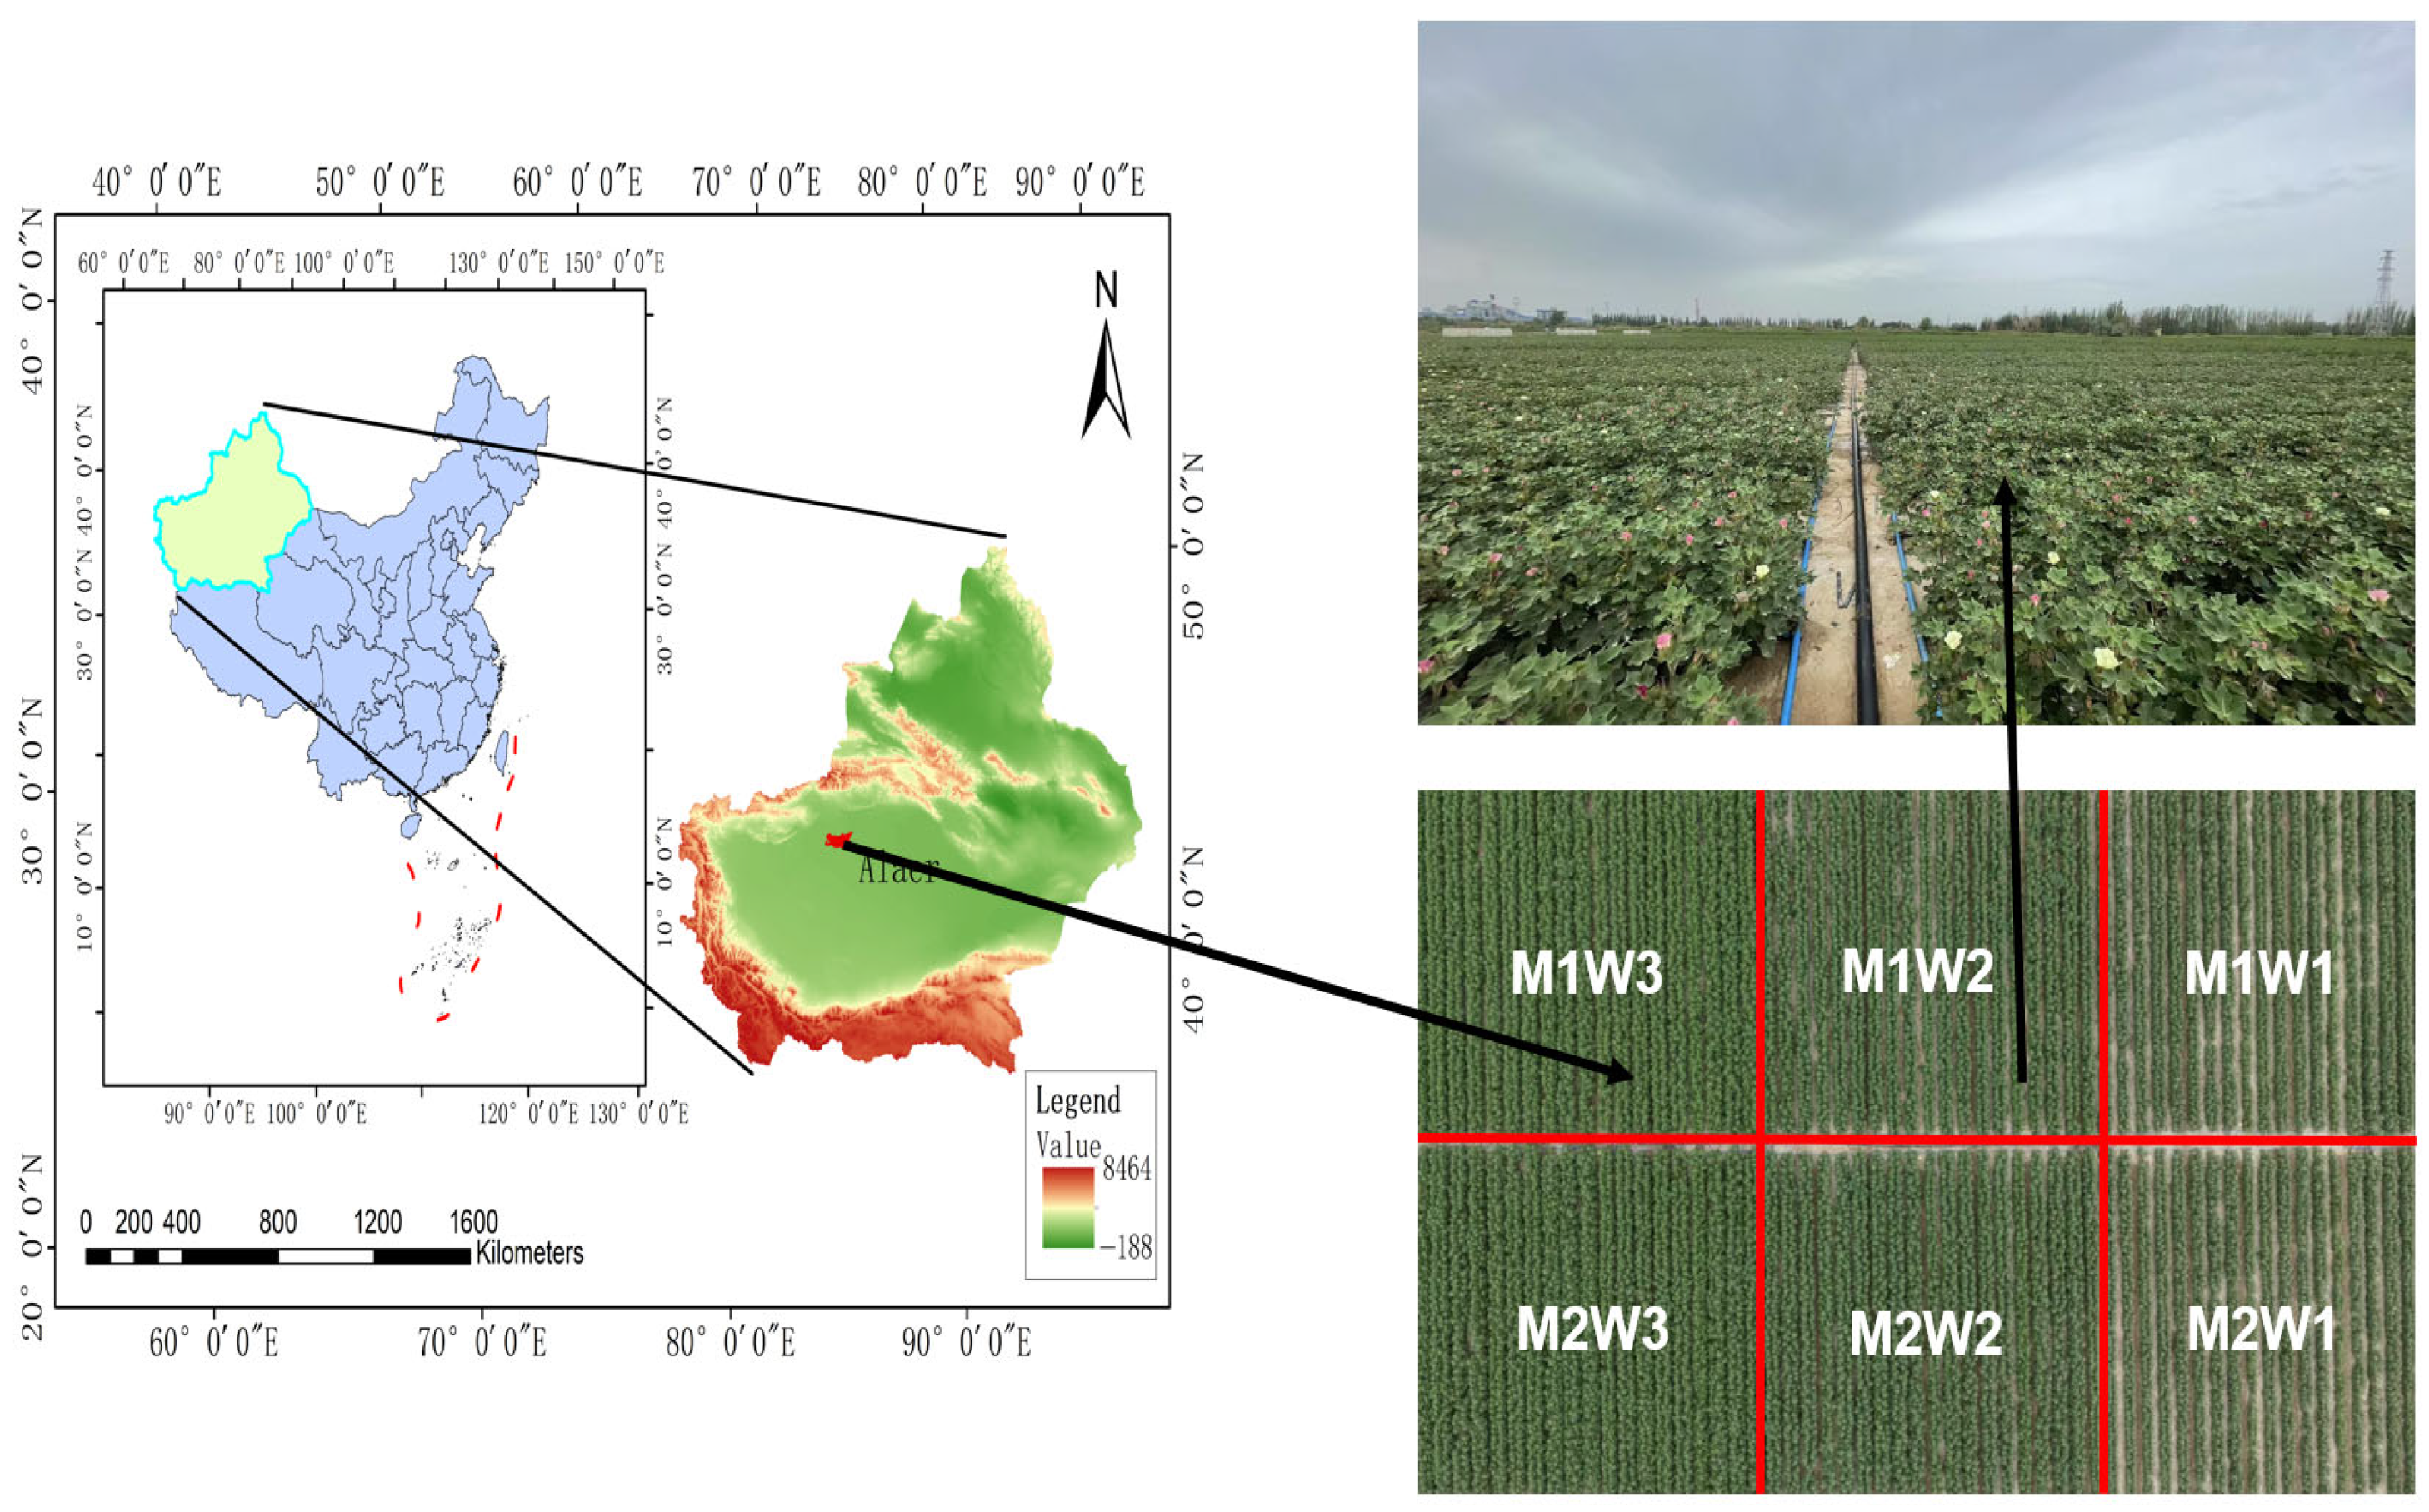
Figure 1. Cross-sectional schematic of the experimental cotton field. M1W1 to M2W3 represent six different experimental treatments.
Agronomy 15 01964 g001
Figure 2. Meteorological data maps. Tmax: Daily maximum temperature; Tmin: daily minimum temperature; Precipitation: daily total rainfall; ET0: reference crop evapotranspiration.
Agronomy 15 01964 g002
Figure 3. Schematic diagram of cotton planting patterns and drip irrigation tape layout. (a) 4.4 m ultra-wide film; (b) 2.05 m conventional film.
Agronomy 15 01964 g003
Figure 4. Irrigation and fertilization regime during the cotton growth period in 2024. W1 to W3 represents three different irrigation depths. N: Urea; P: phosphorus fertilizer; K: potassium fertilizer.
Agronomy 15 01964 g004
Figure 5. Changes in soil moisture content at different growth stages. (a) Soil moisture variation at 0–60 cm depth during the budding stage; (b) soil moisture variation at 0–60 cm depth during the flowering and boll stage.
Agronomy 15 01964 g005
Figure 6. Changes in soil electrical conductivity at different growth stages. (a) Changes in soil EC at 0–60 cm depth during the budding stage; (b) changes in soil EC at 0–60 cm depth during the flowering and boll stage.
Agronomy 15 01964 g006
Figure 7. Changes in average soil temperature at 20 cm, 40 cm, and 60 cm depths during different growth stages. (a) Soil temperature variation during the bud stage; (b) soil temperature variation during the flowering and boll stage.
Agronomy 15 01964 g007
Figure 8. Effects of different treatments on cotton dry matter accumulation and organ distribution ratio. (a): Total dry matter per plant during the flowering and boll stage; (b): proportion of each plant organ during the flowering and boll stage. Different lowercase letters indicate significant differences among treatments at p < 0.05. ** indicates extremely significant differences (p < 0.01).
Agronomy 15 01964 g008
Figure 9. Composition of bacterial and fungal phyla and genera at different growth stages. M1 and M2 represent two mulching widths before the initial irrigation at the budding stage; M1W1–M2W3 represent six different treatments during the flowering and boll stage; (a,b) refer to bacteria, while (c,d) refer to fungi, respectively. At the phylum level the bacterial “others” mainly include Methylomirabilota, Planctomycetota, and Nitrospirota. At the genus level the bacterial “others” mainly include Ilumatobacter, Bacillus, and members of Vicinamibacteraceae. For fungi at the phylum level the “others” mainly consist of some unclassified phyla, while at the genus level the “others” mainly include Botryoderma, Aspergillus, and Cladorrhinum.
Agronomy 15 01964 g009
Figure 10. Effects of different growth stages on rhizosphere soil microbial α-diversity. (a) Bacterial Chao1; (b): bacterial Shannon; (c) fungal Chao1; (d) fungal Shannon. Different colors represent different treatments. Among them, blue: M1; Orange: M2; Green: M1W1; Red: M1W2; Purple: M1W3 Brown: M2W1; Pink: M2W2; Grey: M2W3. ns indicates no significant difference (p > 0.05).
Agronomy 15 01964 g010
Figure 11. Changes in rhizosphere microbial community β-diversity among different groups. PC1 represents the axis corresponding to the greatest variation in the data, while PC2 represents the second largest variation direction, which is orthogonal to PC1 and captures the remaining variation not explained by PC1, together revealing the core structure of the data. (a) Bacterial beta diversity; (b) Fungal beta diversity. Different colors represent different treatments. Among them, blue: M1; Bright red: M2; Light green: M1W1; Deep purple: M1W2 Dark green: M1W3 Deep red: M2W1; Light purple: M2W2; Dark red: M2W3.
Agronomy 15 01964 g011
Figure 12. Correlation analysis between rhizosphere microbial α-diversity and soil environmental and growth factors. (a) Correlation analysis between different indicators and bacterial α-diversity; (b) correlation analysis between different indicators and fungal α-diversity. Irrigation depth: ID; soil moisture content: SWC; electrical conductivity: EC; temperature: ST; total biomass: TB; root length: RL; root surface area: RS; root diameter: RD; root volume: RV.
Agronomy 15 01964 g012
Table 1. Basic chemical properties of soil at 0–100 cm depth.
Soil
Layer
/cm
Total N
/(mg·g−1)
Alkali Hydrolyzable Nitrogen/
(mg·kg−1)
Available Phosphorus/
(mg·kg−1)
Available Potassium/
(mg·kg−1)
Organic Matter/
(g·kg−1)
K+/g·kg−3Ca2+/g·kg−3Mg2+/g·kg−3
0–201.7555.5116.16167.656.030.010.110.03
20–401.6574.1426.05187.555.600.101.210.05
40–600.8547.182.73117.642.490.162.290.05
60–800.6725.812.58110.582.190.152.310.02
80–1000.6831.162.1693.092.490.101.180.10
Table 2. Cotton water consumption and irrigation depth.
Mulching WidthIrrigation TreatmentBudding StageFlowering and Boll StageBoll Opening StageFull Growth Stage
ET
/mm
ET
/mm
ET
/mm
ET
/mm
ETC/mm
M1W111.74224.3649.09285.19325.54
W218.70255.1190.2364.13406.92
W320.52340.3075.51436.33488.30
M2W114.56239.8149.22303.58325.54
W224.72225.28126.98376.98406.92
W314.15364.1368.71446.99488.30
Note: ET: crop water consumption; ETc: crop water requirement.
Table 3. Effects of different treatments on cotton root growth during the budding stage.
Mulching WidthIrrigation Depth/mmLength/cmSurface Area/cm2Diameter/mmVolume/cm3
W12091.48 c181.64 b4.65 b2.62 d
M1W22619.87 ab240.29 a5.71 ab4.20 ab
W32532.38 ab224.84 a7.43 a3.67 bc
W12415.72 b222.47 ab5.79 ab3.46 c
M2W22625.28 ab257.52 a748 a4.03 bc
W32761.53 a246.34 a8.09 a4.77 ab
M**ns**
W*******
M×Wnsnsns*
Note: n = 3 for each treatment. Different lowercase letters indicate significant differences among treatments at p < 0.05. * indicates significant differences (p < 0.05); ** indicates extremely significant differences (p < 0.01); ns indicates no significant difference (p > 0.05).
Table 4. Effects of different treatments on cotton root growth during the flowering and boll stage, as compared to the budding stage in Table 3.
Mulching WidthIrrigation Depth/mmLength/cmSurface Area/cm2Diameter/mmVolume/cm3
W12453.22 c234.17 d5.73 b4.22 b
M1W22735.30 c260.88 c6.41 b4.40 ab
W33604.22 ab275.48 bc7.31 ab4.98 ab
W13223.34 b258.10 c8.40 a4.34 ab
M2W23642.47 ab300.33 a8.05 a5.43 a
W33996.16 a284.77 ab7.18 ab5.20 a
M*******
W****nsns
M×Wnsns*ns
Note: n = 3 for each treatment. Different lowercase letters indicate significant differences among treatments at p < 0.05. * indicates significant differences (p < 0.05); ** indicates extremely significant differences (p < 0.01); ns indicates no significant difference (p > 0.05).
Table 5. Principal component sample scores.
GroupBacterialFungal
PC1PC2PC1PC2
M10.04−0.040.04−0.02
M20.130.05−0.180.00
M1W10.02−0.05−0.22−0.01
M1W20.20−0.01−0.020.21
M1W3−0.06−0.13−0.04−0.09
M2W1−0.08−0.12−0.18−0.04
M2W2−0.130.150.280.00
M2W3−0.110.150.31−0.04
Note: n = 3, and the PC scores are the averages of the three samples. M1 and M2 represent two mulching widths before the initial irrigation at the budding stage; M1W1–M2W3 represent six different treatments during the flowering and boll stage.
Disclaimer/Publisher’s Note: The statements, opinions and data contained in all publications are solely those of the individual author(s) and contributor(s) and not of MDPI and/or the editor(s). MDPI and/or the editor(s) disclaim responsibility for any injury to people or property resulting from any ideas, methods, instructions or products referred to in the content.