Article

Crushed, Squeezed, or Pressed? How Extraction Methods Influence Sap Analysis

1
Escuela de Ciencias Agrícolas y Veterinarias, Universidad Viña del Mar, Viña del Mar 2520000, Chile
2
R&D Department, HortiTech Analytics, Quillota 2260000, Chile
3
Laboratorio de Ecoinformática, Instituto de Conservación, Biodiversidad y Territorio, Universidad Austral de Chile, Valdivia 5090000, Chile
4
Escuela de Agronomía, Facultad de Ciencias Agronómicas y de los Alimentos, Pontificia Universidad Católica de Valparaíso, Quillota 2260000, Chile
5
Escuela de Tecnología Médica, Facultad de Medicina, Universidad de Valparaíso, San Felipe 2170000, Chile
6
Departamento de Producción Vegetal, Facultad de Agronomía, Universidad de Concepción, Concepción 4030000, Chile
*
Author to whom correspondence should be addressed.
Agronomy 2025, 15(11), 2572; https://doi.org/10.3390/agronomy15112572 (registering DOI)
Submission received: 1 October 2025 / Revised: 3 November 2025 / Accepted: 5 November 2025 / Published: 7 November 2025
(This article belongs to the Special Issue Crop Nutrition Diagnosis and Efficient Production)

Abstract

Sap analysis provides a fast and promising approach to diagnosing plant nutritional status, yet methodological gaps remain a crucial obstacle to widespread adoption. Understanding how different extraction methods influence sap composition is key to improving the consistency and diagnostic reliability of this technique. Therefore, five methods were compared based on a range of chemical and physical parameters of broccoli petiole sap. Multiple statistical approaches were used to evaluate method effects on individual parameters and their inter-relationships. Extraction method significantly influenced chemical profiles—altering means, variability and distributional shapes—whereas physical attributes varied less across methods. Relationships among traits were observed; however, the consistency of patterns varied depending on the method. Overall, these results suggest that refining method selection could enhance both diagnostic reliability and the depth of interpretive analysis. This calls for rethinking current sap analysis practices, raising awareness of methodological variability and encouraging the development of robust, standardized approaches for reliable and comparable sap-based diagnostics.

1. Introduction

Improving fertilizer use efficiency is a key goal for achieving sustainable agriculture, as emphasized in the Farm to Fork Strategy adopted by the European Union and the FAO Strategic Framework 2022–2031. It is also indirectly addressed in the 2030 Agenda for Sustainable Development of the United Nations.
One proposed strategy to achieve this goal is the adoption of technological innovations that improve plant nutritional diagnostics and facilitate low-cost, real-time decision-making—commonly referred to as “on-farm quick tests” [1]. These tools aim to increase accessibility by enabling farmers to conduct their own analyses or by facilitating implementation by agricultural extension services, thereby accelerating adoption.
In this context, sap analysis has gained increasing attention among farmers, advisors, and researchers due to its capacity to provide instant assessments of plant nutritional status [2,3]. This innovative method challenges conventional plant analysis techniques, which often involve complex logistics and delays of one to two weeks between field sampling and laboratory results. By delivering rapid and actionable results, sap analysis facilitates the timely and precise application of fertilizers, ultimately improving crop quality while maximizing yields.
Most of the research on sap analysis has focused on refining chemical procedures to determine nutrient concentrations. Early efforts relied on qualitative colorimetric techniques, which later evolved into more straightforward and accessible analytical techniques [4]. A major milestone occurred in the 1960s with the development of portable nutrient analysis equipment, revolutionizing in-field plant diagnostics [5]. Devices such as colorimeters (Hach®), photometers (Hanna®), and ion-selective electrodes (ISEs) (OrionTM, Horiba®) became widely available, significantly expanding the possibilities for real-time nutrient analysis.
Over time, the cost of these instruments has decreased, making them increasingly accessible [6]. Among the most used tools today are ISEs, particularly pocket-sized Cardy/LAQUATwin meters. These devices feature a flat sensor designed for small sample volumes—a key advantage for sap analysis, where the quantity of extracted fluid is often insufficient for traditional submersible electrodes.
As a result, research on sap-based evaluation of crop nutritional status has surged, with several studies suggesting it may be more informative than traditional dry tissue analysis, and more responsive than spectral reflectance tools such as SPAD and NDVI [7,8,9]. Since the early 1970s, over 400 publications—including scientific articles, theses, extension papers, conference proceedings, guidelines, technical manuals, and books—have addressed sap analysis. However, a unified methodological framework remains elusive, as each study has employed distinct procedures.
An essential step in this monitoring strategy is the extraction of sap from fresh plant tissues, which is typically achieved by mechanically crushing them using a range of basic tools such as pliers, cylindrical rods, or mortars. Alternatively, small pieces of tissue are often placed into devices such as syringes, citrus squeezers, and garlic presses. More robust equipment like juicers, bench vises, or hydraulic presses are also commonly used for the collection of sap [3,4,9,10,11,12,13,14,15,16,17,18,19,20,21,22,23,24,25,26,27]. Despite their widespread use, limited research has evaluated whether these different extraction methods produce comparable and representative nutrient measurements.
This issue is further compounded by the fact that a substantial number of publications do not specify the processing technique used, while others provide only vague descriptions—simply stating that a “press” was used or that a device was “typically” employed [28,29,30,31,32]. Such lack of methodological detail limits the ability to determine whether the applied methods influence sap composition, ultimately compromising the reliability and comparability of nutrient diagnostics [33].
Although it has been widely assumed that the type of pressing device and its operation do not affect sap composition [5,34,35,36], this notion remains largely untested. To address this gap, the present study aims to compare nutrient concentrations obtained through different sap extraction methods, using broccoli as a case-study model crop. By assessing commonly used and readily available devices, we seek to uncover method-dependent discrepancies in sap composition, thereby advancing efforts to establish more robust and standardized protocols for crop nutrient monitoring. Furthermore, given the novelty of our results, we examine and discuss underexplored issues central to the standardization of sap analysis, including the identity of the expressed sap and potential stoichiometric relationships among its constituents.

2. Materials and Methods

2.1. Plant Material

The study was conducted using broccoli (Brassica oleracea var. italica), ‘Zafiro’ cultivar from Sakata Seeds. Cultivation took place during the 2024–2025 summer season in an agricultural field located in Quillota, Valparaíso Region, Chile (32°54′32.63″ S, 71°15′24.93″ W). Plants were monitored prior to reaching commercial maturity, corresponding to the phenological stage 49 on the BBCH scale. This stage aligns with the preharvest phase utilized in similar studies [35,37,38,39].
The planting density was 0.40 m between plants within rows and 0.65 m between rows, with an access path every 8 rows, resulting in a population of 35,088 plants per hectare. On average, plants had 23 ± 1.3 leaves, a height of 23 ± 2.0 cm, an inflorescence basal diameter of 54 ± 5.3 mm, and an individual yield of 878 ± 182 g, corresponding to a potential yield of 30.8 tons per hectare.

2.2. Soil and Irrigation

The site soil belongs to the San Isidro series (SDR) and is classified as a Mollisol. It exhibited a clay loam texture, with a pH of 7.68 (1:2.5 soil-to-water suspension), an electrical conductivity (EC) of 1.02 dS m−1 (saturated extract), and an organic matter content of 4.0%, equivalent to an organic carbon content of 2.33%. Available nitrogen (sum of N-NO3 and N-NH4+) was 22.3 mg kg−1, and available potassium was 250 mg kg−1. In accordance with the local practices used at the study site, the crop was irrigated via a drip system using water with a pH of 7.15, an EC of 0.73 dS m−1, a nitrate concentration of 2.85 mmol L−1, and potassium levels below 0.03 mmol L−1.

2.3. Sample Preparation

Over five consecutive days, 720 plants were randomly selected and sampled from a 1000 m2 plot, representing approximately 20% of the total individuals (Figure 1a). Abnormal, damaged, or excessively shaded plants were excluded to avoid potential alterations in the sap nutritional profile [40]. This experimental design ensured representativeness while accounting for the spatial heterogeneity of sap nutrient distribution within the field.
To accurately assess plant nutritional status, the most recently matured leaves (MRML) were collected from each plant. This organ—also referred to in the literature as the largest, newest, uppermost, youngest, fully expanded, elongated, flattened, grown, or unfurled leaf [2,11]—is widely recommended for sap analysis because it combines a consistent developmental stage with active nutrient translocation, making it a highly sensitive index tissue for monitoring plant nutrient status.
To consistently identify this reference leaf in the field, samples were selected based on morphological and morphometric indicators. The targeted leaves exhibited traits characteristic of an intermediate developmental stage, including a blade texture ranging from smooth to slightly rough and a lamina thickness between 300 and 500 μm. On the adaxial side, color shifted from bluish or bluish-green hues in new leaves (7.5 G 3/2, 2.5 G 3/4, 2 BG 4/2), through more vivid greens in MRML (5 G 3/2, 2.5 G 3/4, 2.5 G 4/2), to green-yellowish tones in older leaves (7.5 GY 4/2, 7.5 GY 3/4). In contrast, the abaxial surface showed a progression from dull bluish greens (5 G 5/2) to lighter tones (5 G 6/2, 7.5 G 6/2), and ultimately to more saturated greens (5 G 5/4, 5 G 6/4). As the leaves developed, the insertion angle increased, ranging from 65° to 75° in the MRML.
In most cases, the selected leaf was located as the third or fourth node below the inflorescence, a position commonly associated with this developmental stage in several crops. To account for positional variability, leaves were sampled from all spatial orientations.
The collected leaves were grouped into samples of 15, yielding a total of 48 biological replicates (Figure 1b). This sampling strategy aligns with literature recommendations of 10–15 leaves per sample to ensure robust and representative sap nutrient determinations [34,36,37,41].
Only the petioles were used for sap extraction, following protocols established in previous studies on broccoli [16,37,42]. To minimize potential variability from the stem-petiole junction and the petiole-lamina transition zone, only the central third of each petiole was excised [13,43] (Figure 1c). These sections measured, on average, 16 mm in width, 15 mm in height, and 6.6 cm in length, consistent with dimensions used for sap analysis by Burns and Hutsby [4].
All remaining leaflets were carefully removed to prevent water loss prior to measurement [35,44]. After processing, the average sample weight was 231 g, meeting the minimum bulk mass required for sap analysis according to published guidelines [24,45].
Although there is no consensus on the most appropriate time of day for sap sampling—some studies report negligible effects on nutrient concentrations, while others indicate the opposite (e.g., [23,46,47,48])—most guidelines agree on the importance of sampling consistently within the same daily time window, preferably early in the morning [5,24,34,35]. Accordingly, leaf samples were collected daily between 9:00 and 9:30 a.m. to minimize variability related to environmental conditions such as light intensity and temperature.
Samples were transported to the Escuela de Agronomía of the Pontificia Universidad Católica de Valparaíso, located at 10 km from the field site (32°53′44.29″ S, 71°12′31.22″ W). Petioles were stored in insulated cooling boxes with ice packs (Figure 1d), maintaining a temperature of 4.1 ± 0.7 °C during a transport time of 18 ± 3 min (Figure 1e). Upon arrival, samples were placed in plastic zip-lock bags and stored in darkness at 4.0 ± 0.5 °C until analysis (Figure 1f), following recommendations for preserving broccoli tissue for sap extraction [37]. Throughout the study, the interval between sampling and analysis was consistently kept below 8 h, in line with recommendations from previous studies [12,16,35].

2.4. Sap Extraction Methods

Petioles were removed from cold storage and sliced into segments approximately 5 mm thick, then thoroughly mixed to form a composite sample [7,49]. Sap was extracted from petioles without prior washing to avoid nutrient runoff, which can reduce its nutrient concentrations [22,50].
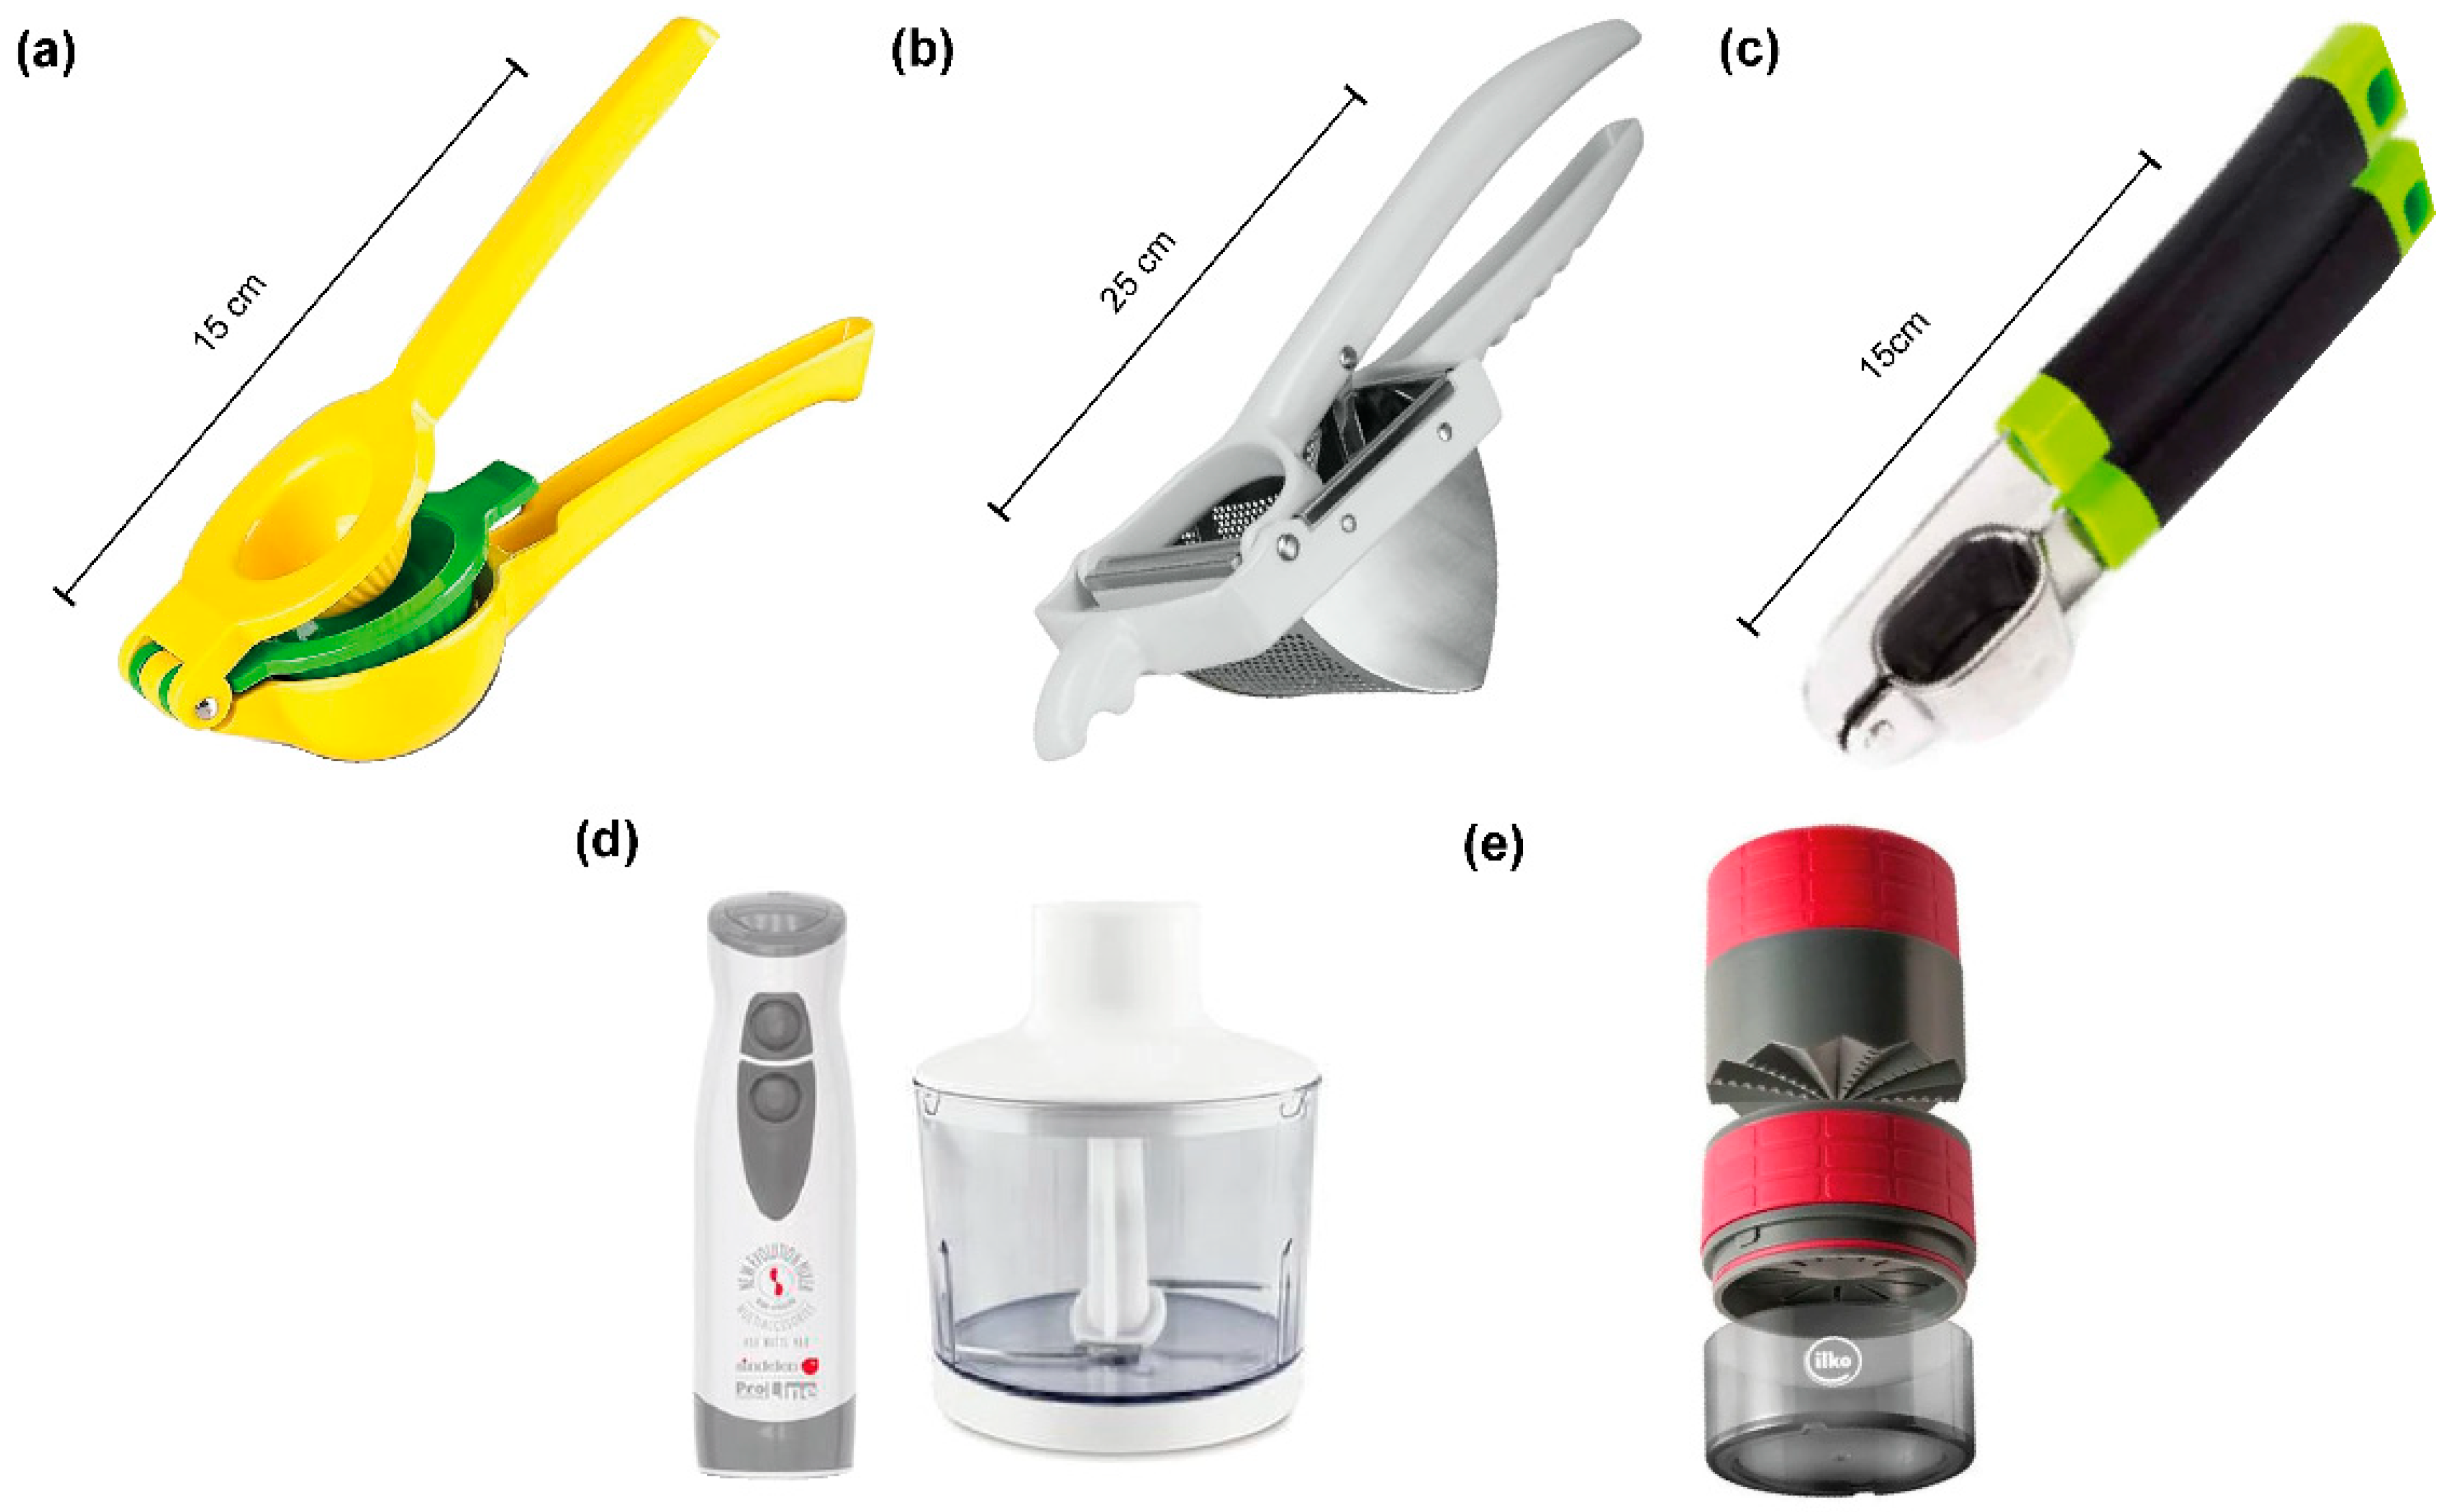
Five different extraction methods were evaluated. These were selected for being commonly cited in the literature and widely used by crop advisors and field technicians due to their simplicity, accessibility, and affordability. The operational approach for each device was defined based on preliminary trials focused on optimizing user-friendliness and obtaining sufficient sap volumes for measurements. Photographic documentation of the evaluated devices is available in Appendix A (Figure A1).
Citrus squeezer. Model: Zulay Kitchen, “2-in-1 Lemon Squeezer”. Painted steel receptacle with an estimated capacity of 90 mL and an effective lever arm length of 15 cm. The total pressing surface area was approximately 76 cm2. The effective compression surface was estimated at ~75.1 cm2 (~98% of the total), excluding the open area from 7 circular holes of 4 mm diameter. The receptacle was completely filled with plant tissue during operation. The processed tissue from each composite sample, hereafter referred to as a subsample, comprised an average of 27 ± 3.7 petiole slices, with a total fresh weight of 30 ± 0.3 g.
Potato press. Model: Metaltex, “Mr Mash”. Stainless steel receptacle with an estimated full capacity of 200 mL and an effective lever arm length of 25 cm. Considering the total pressing surface area of ~52 cm2, the presence of approximately 425 holes of 2 mm diameter (totaling ~13 cm2 of open area), and the partial filling of the receptacle (about 50% of the total surface area), the effective compression surface was estimated at ~13 cm2. The subsamples consisted of 16 ± 2.8 petiole slices (18 ± 1.2 g).
Garlic press. Model: MI Store, “Kitchen Series n°9191”. Stainless steel receptacle with an estimated volume of ~20 mL and an effective lever arm length of 15 cm. The effective compression surface was estimated at ~6.5 cm2 (~87% of the total), excluding open area from 59 circular holes of 1.5 mm diameter. Each subsample included 7.7 ± 1.6 slices (8.7 ± 1.4 g).
Juicer. Model: Sindelen, “BM-490IN 450W”. Plastic receptacle with stainless steel blades. The samples were processed at power level 1 for 5 s, then removed and reintroduced for a second cycle to ensure homogeneity. The chopped tissue was subsequently transferred to the garlic press solely for sap separation from tissue residues. The subsamples consisted of 11 ± 1.7 slices (12 ± 0.3 g).
Garlic grinder. Model: Ilko, “New Line”. Grinder and receptacle made of ABS plastic, with an estimated receptacle volume of 84 mL when fully loaded. Grinding was performed through 40 rotations of 45°, applying constant hand pressure. Each subsample included 16 ± 2.7 slices (18 ± 1.4 g).
The samples were consistently handled by two operators, whose handgrip strength averaged 33 ± 3.5 kg, as measured with a Camry® EH101 dynamometer (Zhongshan Camry Electronic Co., Ltd., Zhongshan, China).

2.5. Histological Analysis

Freshly cut petiole slices, both before and after pressing each sample, were fixed in FAA solution, composed of 50% absolute ethanol (99.7% v/v), 35% distilled water, 10% formaldehyde (37% w/w), and 5.0% glacial acetic acid (99% v/v).
The histological protocol of D’Ambrogio de Argüeso was adapted for the plant material used in this study [51,52]. Samples were dehydrated through a graded ethanol series (96% for 8 h, 99.7% for 16 h), then cleared using a series of absolute ethanol and xylene mixtures in the following proportions and durations: 3:1 for 2 h, 1:2 for 2 h, 1:3 for 1 h, and finally 0:1 (pure xylene) for 19 h. They were then embedded in a xylene-Paraplast® paraffin mixture at 60 °C, using the same proportions and durations. Histological sections were cut at a thickness of 10 μm.
They were later subjected to three consecutive xylene baths of 10 min each, followed by a descending ethanol series (99.7%, 96%, 70%, and 50%), with 5 min in each concentration. Samples were stained with safranin O (CI 50240) for 30 min using a semi-alcoholic solution composed of 0.25% (w/v) safranin in equal parts distilled water and 96% ethanol. Subsequently, samples were counterstained with a brief rinse in fast green FCF (CI 42053), prepared as a 1% (w/v) solution in absolute ethanol, followed by two rinses in absolute ethanol and a final rinse in xylene.
Safranin is a cationic dye that binds to lignin in secondary cell walls, such as those of sclerenchyma and xylem, providing a red coloration that enhances the visualization of lignified tissues. Its fluorescence properties (excitation at ~540–550 nm, emission at ~580–600 nm) also enabled additional observation under epifluorescence microscopy. Fast green FCF, in turn, selectively stained cellulose-rich structures, offering a complementary blue-green contrast.
Lastly, the sections were mounted using Leica CV Mount. Samples were examined under an Olympus CX31 microscope equipped with a U-LH100H6 Hg lamp for excitation (Olympus Corporation, Hachioji, Japan). Images were captured using a QImaging MicroPublisher 3.3 RTV camera and processed with QCapture Pro 5.1 software (QImaging, Surrey, BC, Canada). They were slightly processed to reduce noise and remove unrelated particles using Adobe Photoshop 2025 (v. 26.8).

2.6. Measurements

To characterize the sap chemical profile, five parameters were analyzed: pH, electrical conductivity (EC), nitrate (NO3), potassium (K+), and Brix degrees (°Bx). pH and EC were determined using Horiba® LAQUATwin pocket meters (Horiba, Ltd., Kyoto, Japan), pH-33 with an S010 sensor and EC-33 with an S070 sensor, respectively (Horiba, Ltd., Kyoto, Japan). Ion concentrations were measured using ISEs from the same equipment series, NO3 with the NO3-11 (S040 sensor) and K+ with the K-11 (S030 sensor). To prevent measurement drift caused by the deterioration of the PVC gel-filled membrane of ISEs, new sensors were used. °Bx was assessed with a digital refractometer featuring a measurement range of 0–32°Bx (DR32, Refratec®; Veto y Cia Ltda., Santiago, Chile).
For accurate measurements, all equipment was calibrated prior to each sample analysis, corresponding to every five measurements. Calibration utilized two standard solutions for each parameter: pH at 4.0 and 7.0; EC at 1.41 and 12.9 dS m−1; NO3 and K+ at 150 and 2000 mg L−1—i.e., 2.42 and 32.26 mmol L−1 for NO3, 3.84 and 51.15 mmol L−1 for K+. The refractometer was zeroed using distilled water. To guarantee the proper application of Nernstian slopes, both calibration solutions and sap samples were equilibrated to a consistent temperature of 18.5 °C using an air conditioning system, in accordance with the recommendations of Thompson [6] and Peña-Fleitas et al. [53].
Immediately after pressing the petioles, 300 μL of sap were placed onto the sensor pads of the meters. Then, devices and sensors were rinsed with distilled water and dried with tissue paper between each sample. Clean micropipette tips were used for each measurement.
To characterize the physical profile, sap yield (μL g−1), sap dry matter percentage (S-DMP, %), petiole dry matter percentage (P-DMP, %), sap dry matter content (S-DMC, mg mL−1), and sap color were evaluated. Yield was expressed as the volume of sap extracted per gram of fresh tissue in each subsample. S-DMP and P-DMP were determined from 500 μL of sap and 30 ± 1.8 g of fresh tissue, respectively. Both were dried at 70 °C for 72 h, following widely used protocols. S-DMC was the dry weight used in the S-DMP calculation. Sap color was assessed using the Munsell color chart and characterized using CIELab coordinates (L*, a*, b*).

2.7. Statistical Analyses

All statistical analyses were performed in R Studio® software (v. 4.4.2). To evaluate the influence of extraction methods on sap color, values from CIELab coordinates were subjected to analysis of variance (ANOVA). For the remaining sap traits, linear mixed-effects models (LMMs) were fitted, with extraction method as a fixed effect and sample (i.e., biological replicate) as a random intercept. Tukey’s post hoc comparisons were subsequently conducted to assess pairwise differences between methods. Model selection was guided by comparisons of the Akaike Information Criterion (AIC) and likelihood ratio tests (LRTs). Additionally, the standard deviations (SDs) of the random intercept and the residual term were extracted to estimate the extent of sample-level variability.
Descriptive statistics were used to further characterize trait distributions. The coefficient of variation (CV) was computed for each chemical parameter using a bootstrap resampling approach (10,000 iterations). Both SD and standard errors (SEs) are reported where appropriate: SDs describe variability in raw measurements and SEs accompany model-based estimates such as estimated marginal means (EMMs). Distributional properties of the raw data were assessed using Shapiro–Wilk tests, as well as skewness and kurtosis coefficients.
To explore associations among sap and tissue traits, Spearman’s rank correlations were computed. Principal component analysis (PCA) was then conducted to evaluate the multivariate structure among sap traits. Specific relationships between key parameters were further examined using targeted modeling approaches. To evaluate whether variation in sap EC could be explained by NO3 and K+ concentrations, a predicted EC value was calculated for each sample based on the limiting molar conductivities of both ions. Predicted and measured EC values were then compared using linear regressions for method-specific associations and an LMM for the overall dataset. The same modeling framework was applied to test the influence of P-DMP on S-DMP, their individual effects on yield, and to evaluate whether S-DMP explained variation in sap chemical parameters.
Lastly, to account for potential sources of variability beyond the main study scope, temporal effects on chemical parameters were examined by fitting LMMs to raw, untransformed measurements, with intra-day measurement time and inter-day sampling as fixed effects.
Analyses included up to 48 biological replicates; however, actual sample sizes varied across variables due to differing measurement frequencies and occasional missing values caused by LAQUATwin sensor failures (i.e., “Error 4”). Full details of sample-level data and variable-specific sample sizes are provided in Table S1.

3. Results

3.1. Histological Characterization

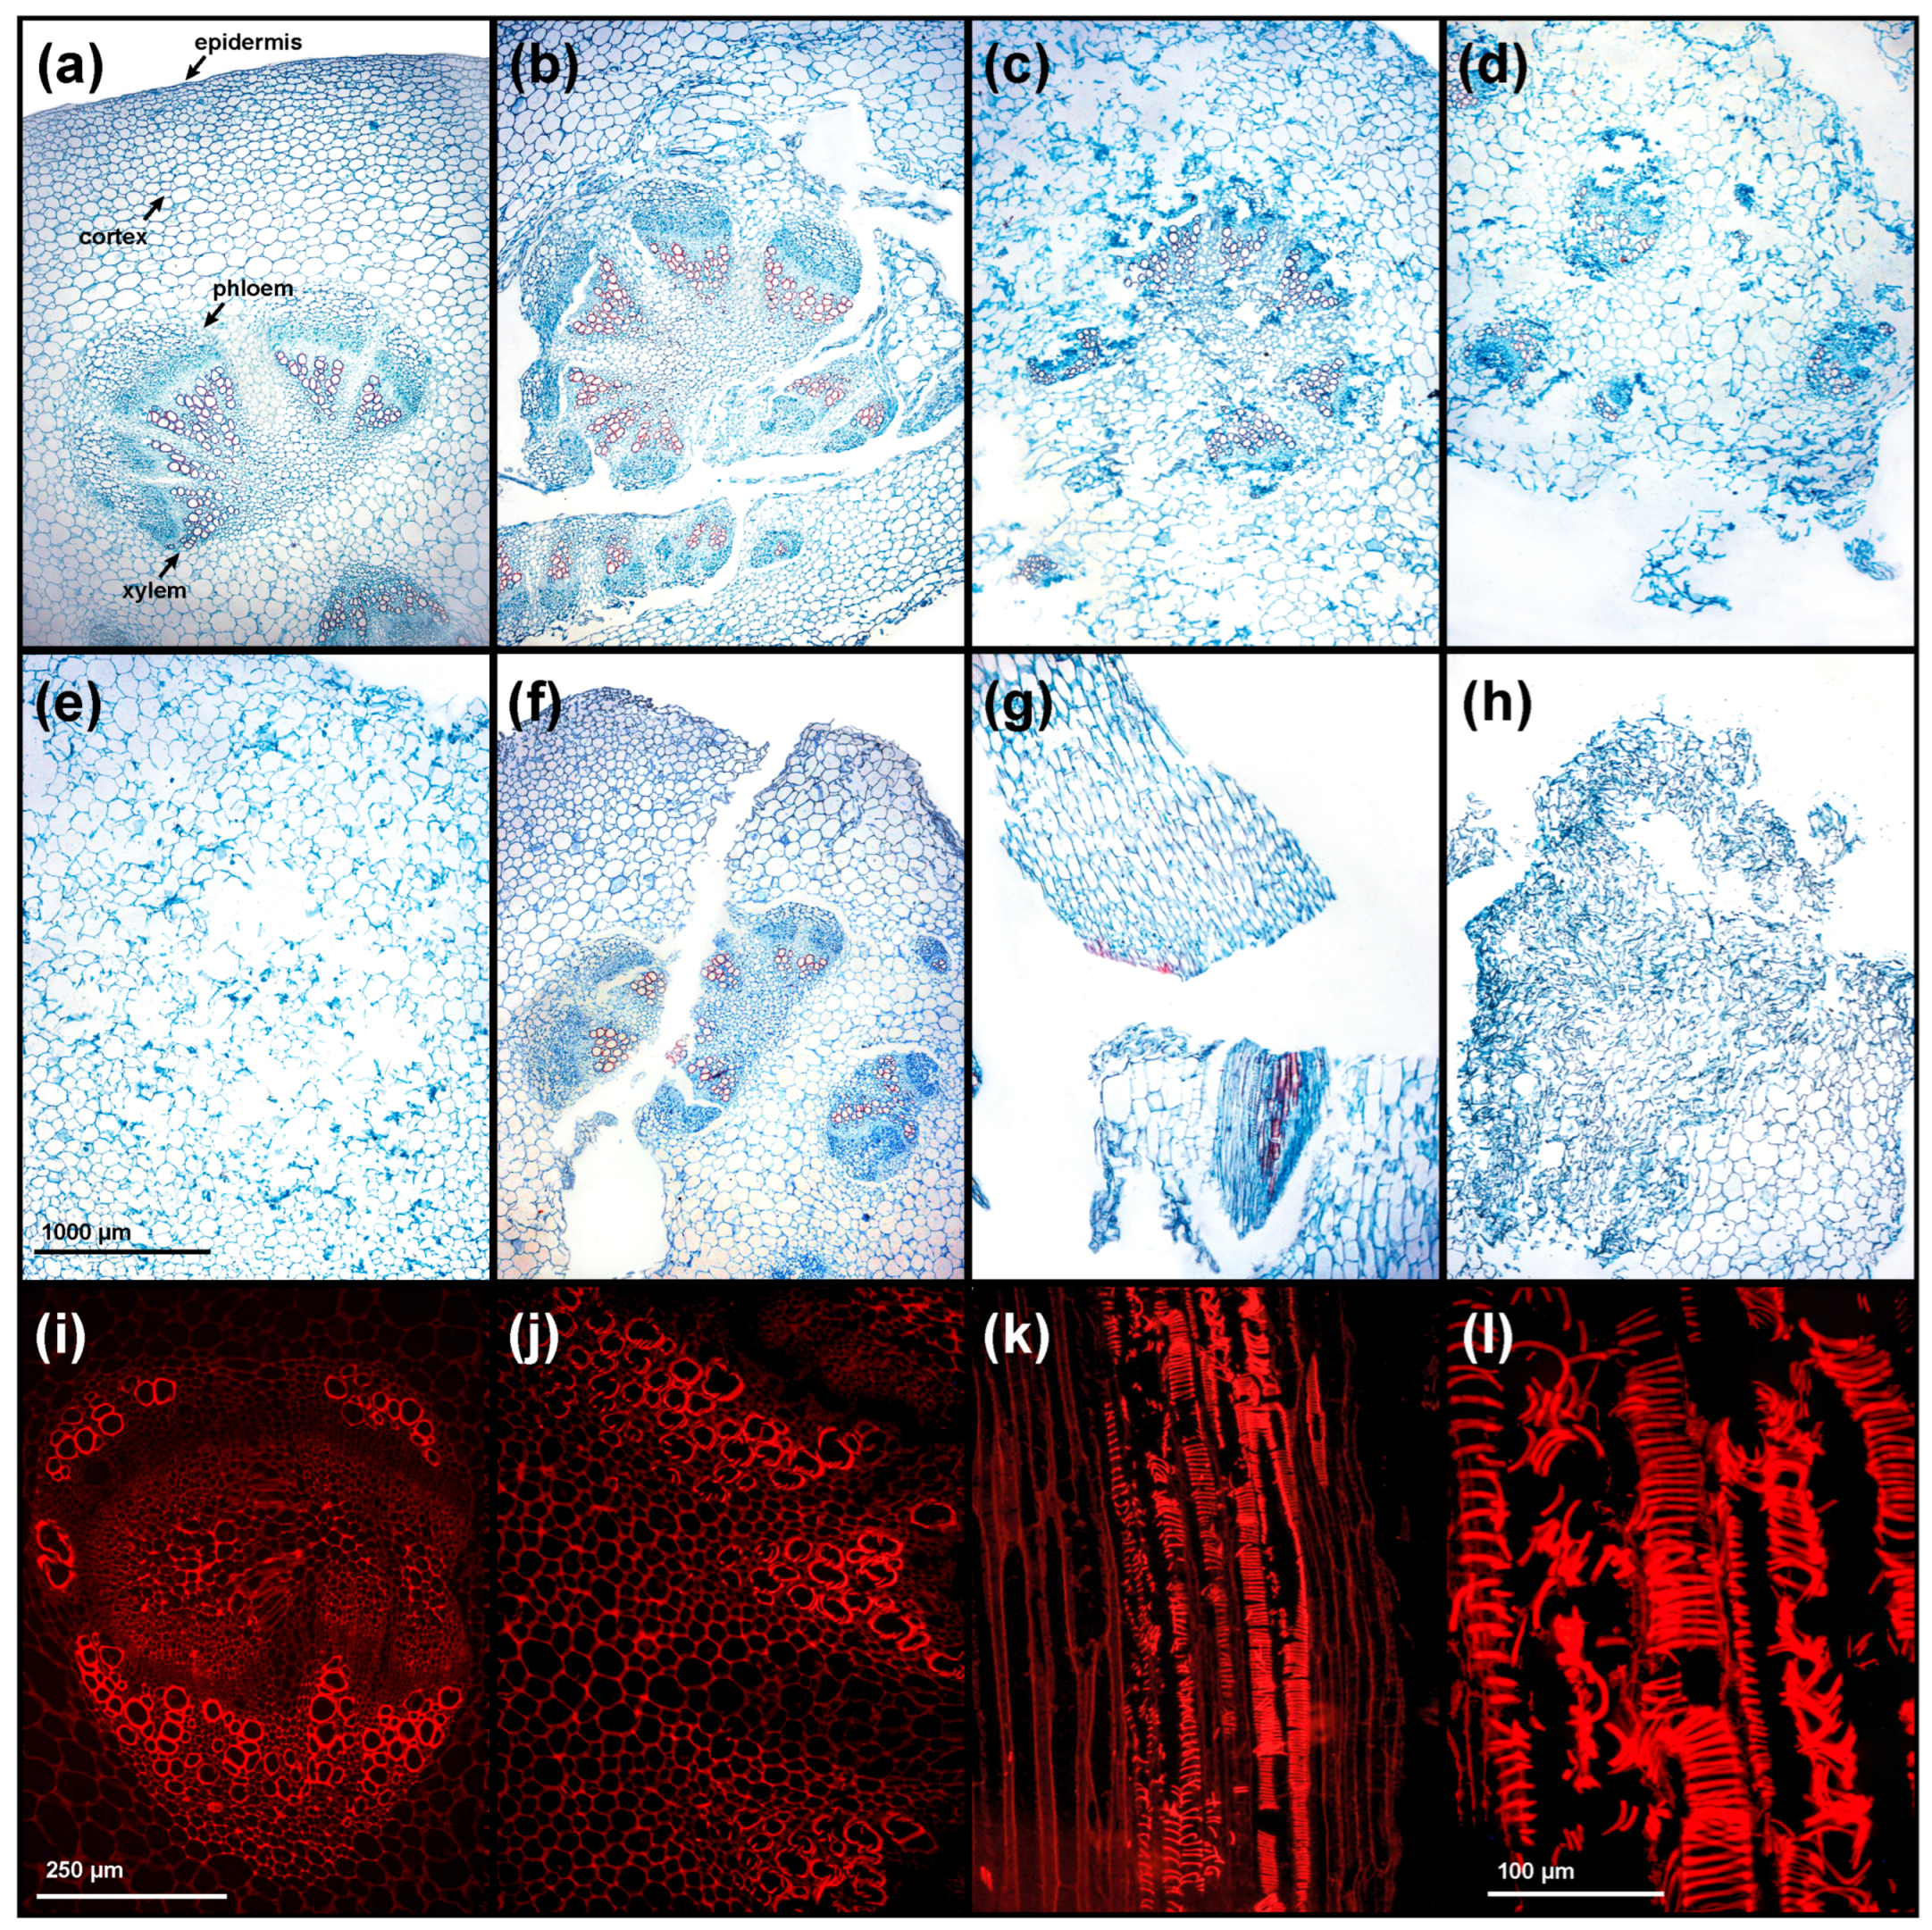
The typical, undisturbed anatomical structure of a broccoli petiole is illustrated in the transverse section shown in Figure 2a. The vascular system consists of 7–10 discrete bundles embedded within a homogeneous cortex. Parenchyma cells exhibit a regular spatial arrangement and clearly defined primary walls (1–2 µm), while the epidermis forms a continuous, smooth outer layer with a thickness of 20–30 µm.
After sap extraction, histological assessment revealed consistent patterns in the type and severity of anatomical damage, depending on the method used. Accordingly, they were classified into two categories: (i) low-impact methods, involving manual pressing tools (citrus squeezer, potato press, and garlic press); and (ii) invasive methods, relying on cutting or mechanical tearing (juicer and garlic grinder).
Low-impact methods typically preserved the overall structure of vascular bundles, with tracheary and sieve elements showing minimal disruption. However, partial detachment of these bundles from the surrounding matrix was frequently observed. These methods also induced localized parenchymal damage, ranging from isolated rupture of individual cells to the disintegration of small cell clusters (Figure 2b–e). Non-uniform compression patterns were common, resulting from the uneven pressure applied by the perforated contact surfaces of the tools.
Within this group, the garlic press induced more pronounced anatomical alterations. This was most evident in the epidermis: while the citrus squeezer and potato press generally preserved the continuity and shape of tissue slices, the garlic press frequently led to partial disintegration of the outer layers, resulting in progressive fragmentation into multiple larger segments (Figure 2f).
In clear contrast, invasive methods inflicted extensive tissue disruption and widespread cell rupture. This occurred either through sharp, linear cuts caused by the high-speed blades of the juicer (Figure 2g), or via tearing produced by the manual grinder. In the former, the tissue was ground into numerous small fragments, with only a few minor portions remaining structurally intact. By contrast, the garlic grinder produced uniform and extensive mechanical damage across the entire sample, leaving virtually no undisturbed regions. In both cases, areas affected by mechanical stress exhibited severe parenchymal collapse, resulting in a heterogeneous assemblage of cellular debris (Figure 2h).
Unlike low-impact methods (Figure 2i), invasive extraction resulted in pronounced damage to vascular tissues (Figure 2j–l), suggesting a greater loss of xylem sap and phloem exudates. Within the xylem, the reticulate thickening patterns of vessel walls were disrupted, indicating that the applied mechanical forces exceeded the tensile strength of these lignified cells. The phloem was similarly affected, exhibiting extensive collapse of sieve elements and companion cells, leading to the breakdown of the conductive architecture and the formation of irregular voids within the vascular tissue.
Taken together, the distinction between low-impact and invasive methods lies not only in the extent of anatomical disruption, but also in the specific tissue compartments affected. While low-impact methods mainly compress parenchyma and preserve vascular integrity, invasive ones compromise the entire tissue structure, releasing fluids from both intracellular storage compartments (e.g., vacuoles and cytoplasm) and vascular conduits. This differential damage profile reflects the magnitude of mechanical stress applied during extraction—an effect that, as demonstrated in subsequent sections, has direct implications for the physicochemical composition of the extracted sap.

3.2. Sap Chemical Characterization

AIC and LRT supported the use of mixed models for all variables, indicating that both fixed and random effects contributed meaningfully to the measurement variation. For parameters such as EC, NO3, and K+, sample SD was greater than residual SD, suggesting that although absolute concentrations varied between replicates, the relative performance of extraction methods remained consistent. In contrast, for pH and °Bx, residual SD exceeded sample SD, indicating less stable method-specific patterns within individual replicates—likely due to their low intrinsic variability, which makes differences among methods more subtle and susceptible to procedural noise (Table A1; Appendix B).
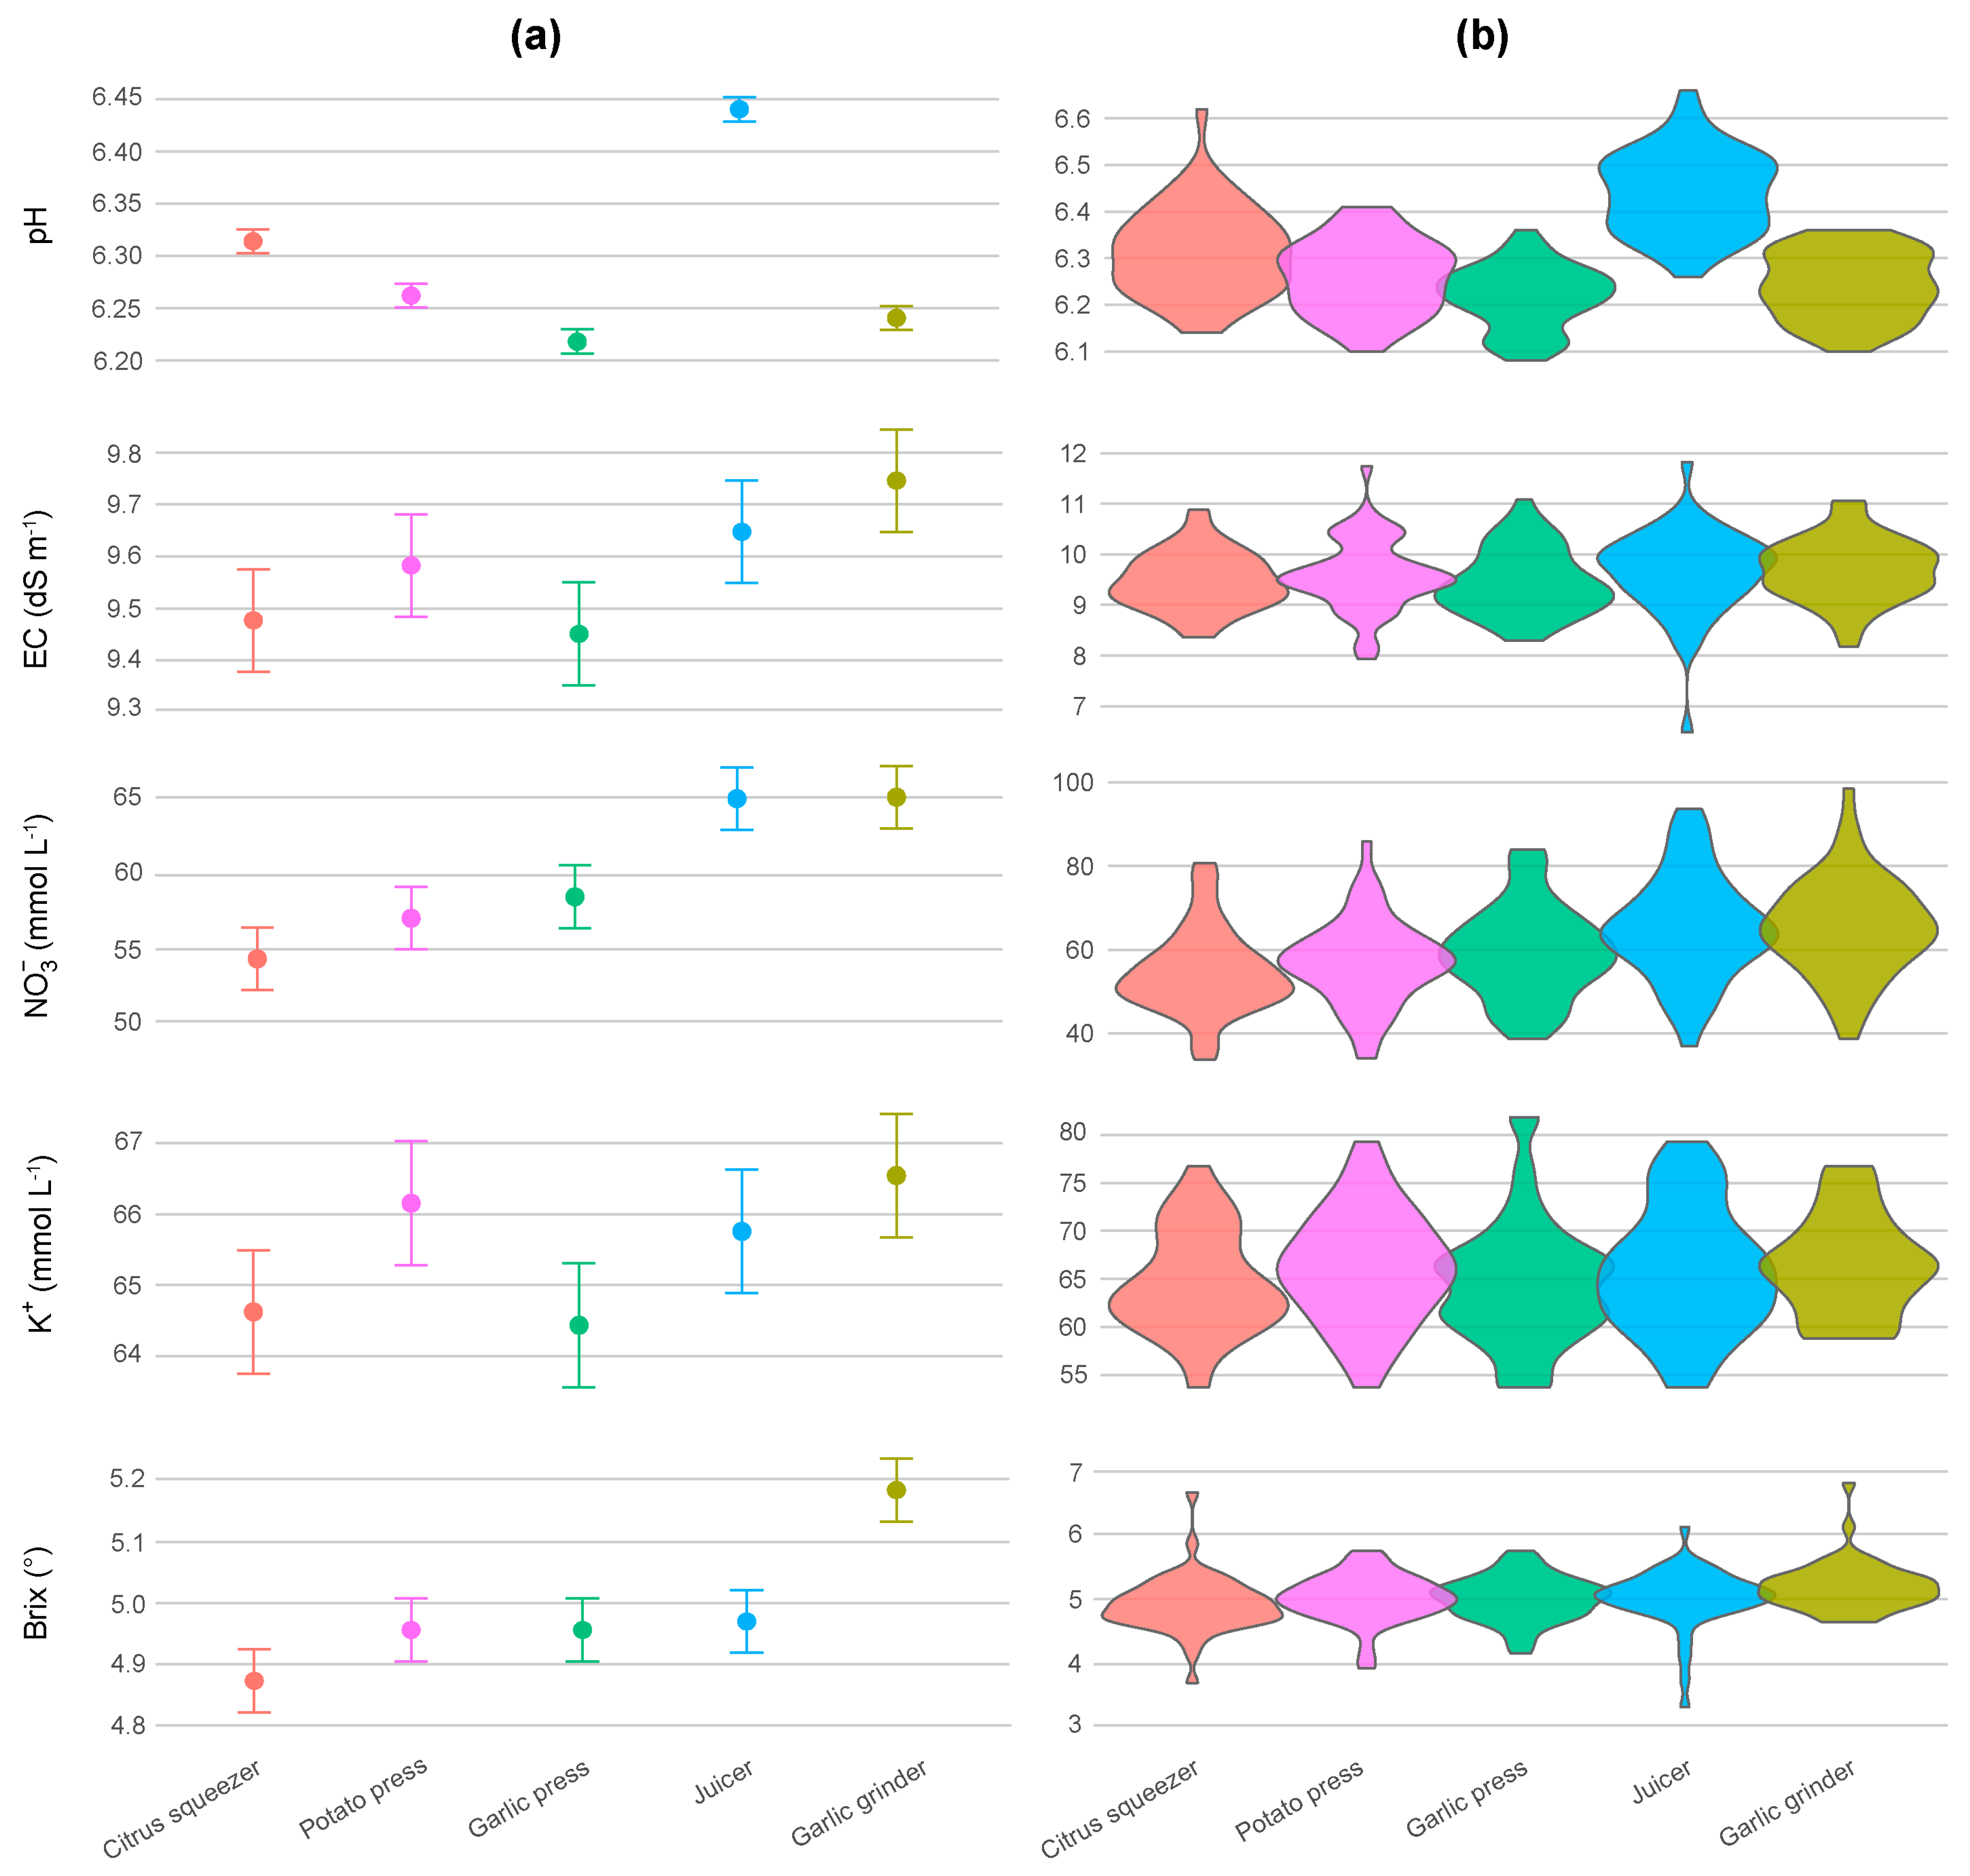
Extraction method significantly affected pH, NO3, and °Bx values (χ2 = 398.46, 118.78, and 27.26, respectively; p < 0.001 in all cases), while its effect on EC was weaker but still statistically significant (χ2 = 16.89, p = 0.002). In contrast, K+ concentrations did not differ among methods (χ2 = 11.85, p = 0.068) (Figure 3a, Table 1). pH reached its maximum in samples obtained with the juicer, whereas the garlic press yielded the most acidic readings, with mean values separated by 0.22 units (p < 0.001). For NO3, both invasive methods yielded markedly elevated concentrations compared to those observed with the citrus squeezer and potato press, with differences reaching up to 10.6 mmol L−1 (>650 mg L−1). In terms of °Bx, the garlic grinder consistently produced significantly higher values than all other methods, averaging an increase of 0.25° (+5.1%). A similar pattern was observed for EC, where the grinder also resulted in higher readings compared to both the citrus squeezer and garlic press (+0.26–0.29 dS m−1).
Beyond differences in means, extraction methods also influenced the distributional properties of chemical measurements (Figure 3b, Table 1). pH, NO3, and EC generally followed approximately normal distributions across methods (Shapiro–Wilk p > 0.05), except for EC values from the juicer (p = 0.010), which exhibited pronounced left skewness (−0.92) and strong leptokurtosis (6.24). Additionally, despite meeting normality assumptions, the citrus squeezer yielded moderately right-skewed distributions for both pH and NO3 (0.62–0.64), while pH values obtained using the garlic grinder exhibited slightly platykurtic behavior (1.89).
In contrast, sap K+ and °Bx displayed greater deviations from normality across extraction methods. For K+, normal distribution was only observed in the potato press and juicer (p = 0.616 and 0.179, respectively). Regarding °Bx, normality was observed exclusively in the garlic press (p = 0.675), which also yielded the only mesokurtic distribution for this parameter. All other methods exhibited markedly leptokurtic patterns, with kurtosis values ranging from 4.14 to 8.30.
These findings underscore the role of the extraction method in determining both central tendencies and distributional behavior of sap chemical parameters commonly used for plant nutritional diagnosis, emphasizing that the choice of extraction method is far from trivial. As further explored in the following section, significant differences were also observed in extraction efficiency and the amount of solids recovered in the sap across methods, offering explanatory insights into the resulting chemical profiles.

3.3. Sap Physical Characterization

On average, sap color ranged from darker yellow-brown tones (L* = 77.70, a* = −22.72, b* = 70.89; juicer) to pale yellow-green (L* = 87.01, a* = −13.66, b* = 42.53; garlic grinder), as reflected in the extremes of the CIELab coordinates (Table A2; Appendix B). However, no statistically significant differences were detected across extraction methods for any of the color metrics (pL* = 0.268; pa* = 0.068; pb* = 0.076), indicating a consistent visual appearance.
By contrast, sap yield, sap dry matter percentage (S-DMP), and sap dry matter content (S-DMC) were significantly influenced by extraction method (Table 2). Yield showed the strongest variation across them (χ2 = 207.23, p < 0.001), with the garlic grinder and garlic press extracting over 230 µL g−1, more than triple that recovered with the citrus squeezer. S-DMP and S-DMC share a common trend, both reaching significantly higher values when using the garlic grinder compared to the citrus squeezer (p = 0.015 and p = 0.025, respectively), corresponding to an increase of 10.6% in S-DMP and 13.4% in S-DMC. Other methods showed intermediate values with partially overlapping statistical groupings.

3.4. Relationships Among Sap Traits

3.4.1. Exploratory Relationships

To explore sap trait associations within each extraction method, pairwise correlation analyses and PCA were performed. These complementary approaches enabled the identification of key interrelationships among sap traits and the assessment of their stability across methods.
  • Pairwise correlations
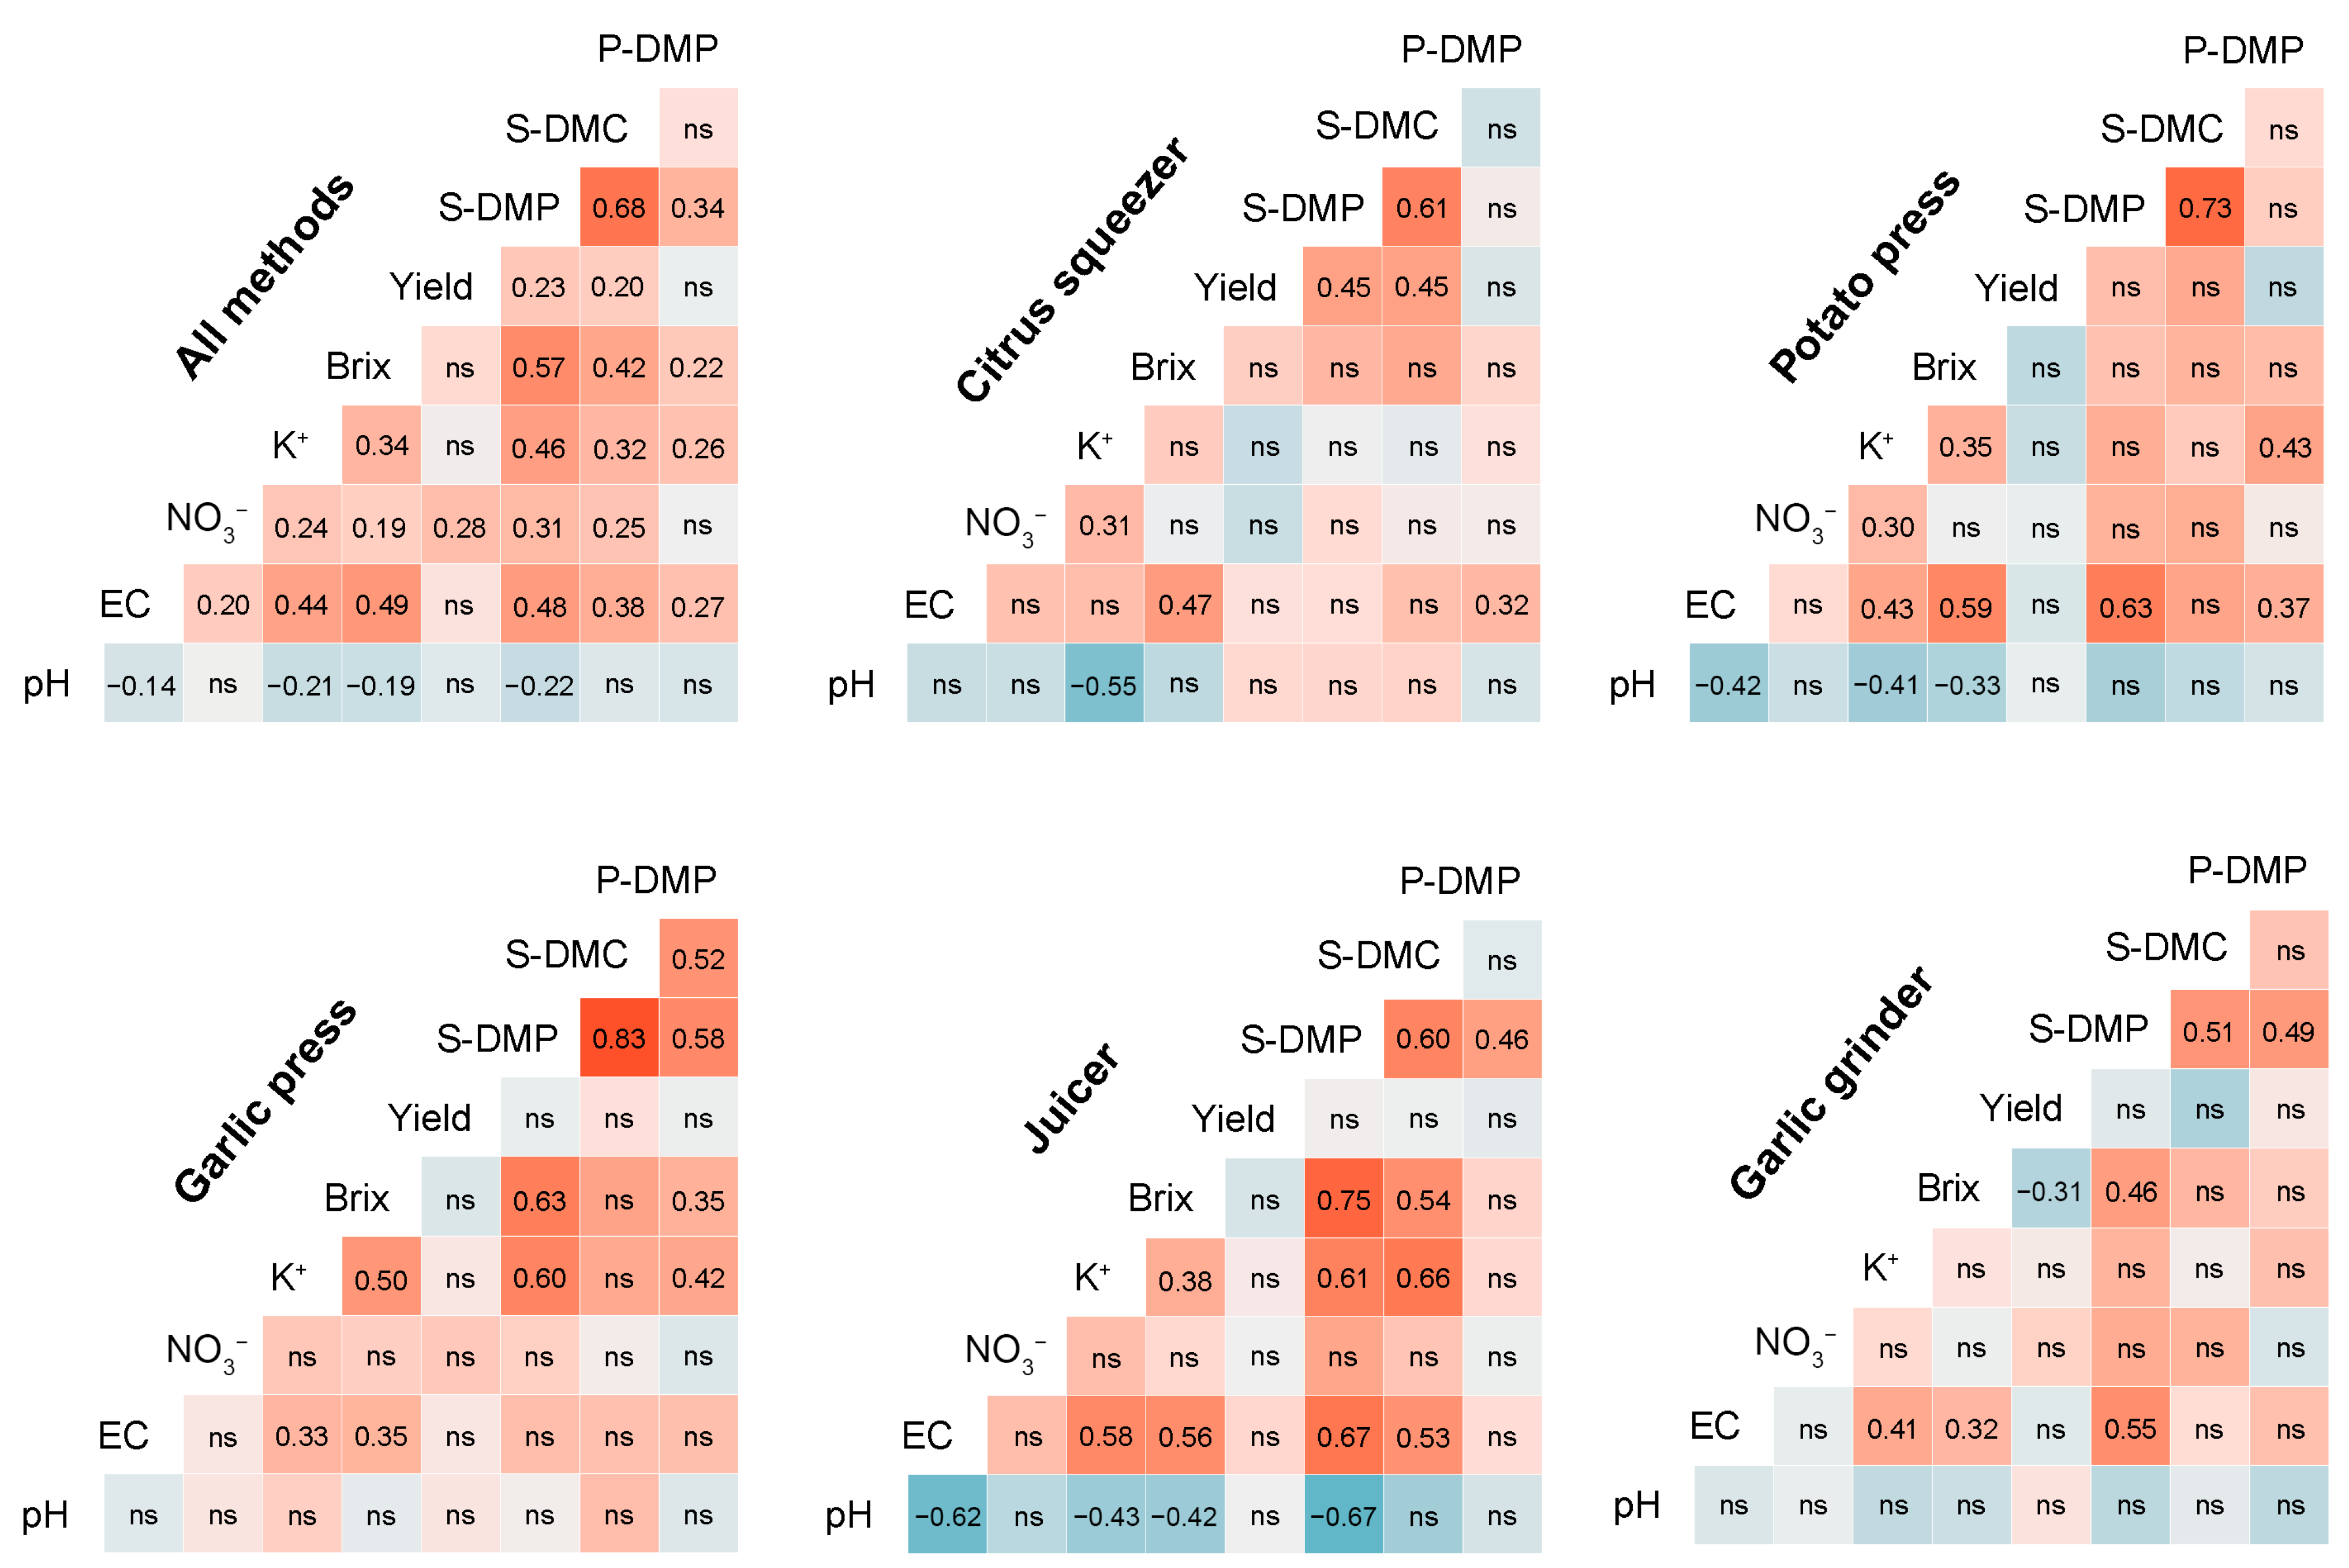
Associations among traits revealed several recurrent and method-specific patterns (Figure 4). The correlation between S-DMP and S-DMC was among the strongest observed, ranging from 0.51 to 0.83 depending on the extraction method. In most cases, S-DMP showed more consistent associations with other traits than S-DMC. Among these, and second only to S-DMC, S-DMP exhibited the highest correlation with °Bx in the overall matrix (ρ = 0.57). However, this relationship was only significant in samples obtained using the garlic press, juicer, and garlic grinder (ρ = 0.46–0.75).
Similarly, P-DMP is associated with EC, K+, and °Bx (overall ρ = 0.22–0.27), but only the low-impact methods yield significant relationships when considered separately (p = 0.005–0.036). EC and K+ also correlated positively with °Bx in the overall matrix (ρ = 0.49 and 0.34, respectively), with at least one of these associations remaining significant across methods. The correlation between EC and K+ was similar in magnitude (overall ρ = 0.44) and consistent in four out of five methods. In contrast, the relationship between EC and NO3 was notably weak (overall ρ = 0.20) and not significant in any individual method (p = 0.053–0.814).
A divergent trend was observed for pH, which was the only parameter that consistently displayed negative correlations with other traits, although these were the weakest in the overall matrix (ρ = −0.14 to −0.22). This trend varied across methods, with a higher incidence of significant associations in samples from the potato press and juicer, whereas no correlations were detected for the garlic press or garlic grinder (p = 0.111–0.855).
Lastly, extraction yield showed minimal and inconsistent associations with chemical parameters. For instance, extraction yield exhibited a single significant correlation in the overall matrix (yield-NO3, ρ = 0.28) and another in the method-specific matrices (yield-°Bx in the garlic grinder, ρ = −0.31), while all other associations involving this variable were not statistically significant (overall p = 0.058–0.799, individual p = 0.078–0.999).
Together, these results reveal the method-dependence of trait correlations and suggest that multivariate approaches may be useful to capture more integrated patterns across extraction methods.
  • Principal Component Analysis (PCA)
The first two principal components explained 53.4% of the total variance in sap profile, with PC1 alone accounting for 39.7% (Figure 5). No clear clustering was observed among most extraction methods, as their ellipses overlapped substantially. However, juicer samples consistently projected toward the negative direction of PC1, closely aligned with the direction of the pH vector, indicating that their separation was primarily driven by this variable rather than by solute-related traits. This method also exhibited the largest ellipse of all, reflecting greater internal variability across samples. Together, these observations suggest that certain extraction methods may influence sap profile consistency, which could be relevant when considering their application in comparative or diagnostic contexts.

3.4.2. Modeled Relationships

Although exploratory analyses offered a general overview of trait associations, specific relationships of interest—selected for their relevance and support in the literature—were subsequently modeled to account for extraction method effects and replicate variability. This approach enabled a more rigorous assessment of expected biological patterns by explicitly accounting for experimental variability.
  • EC and ion concentrations
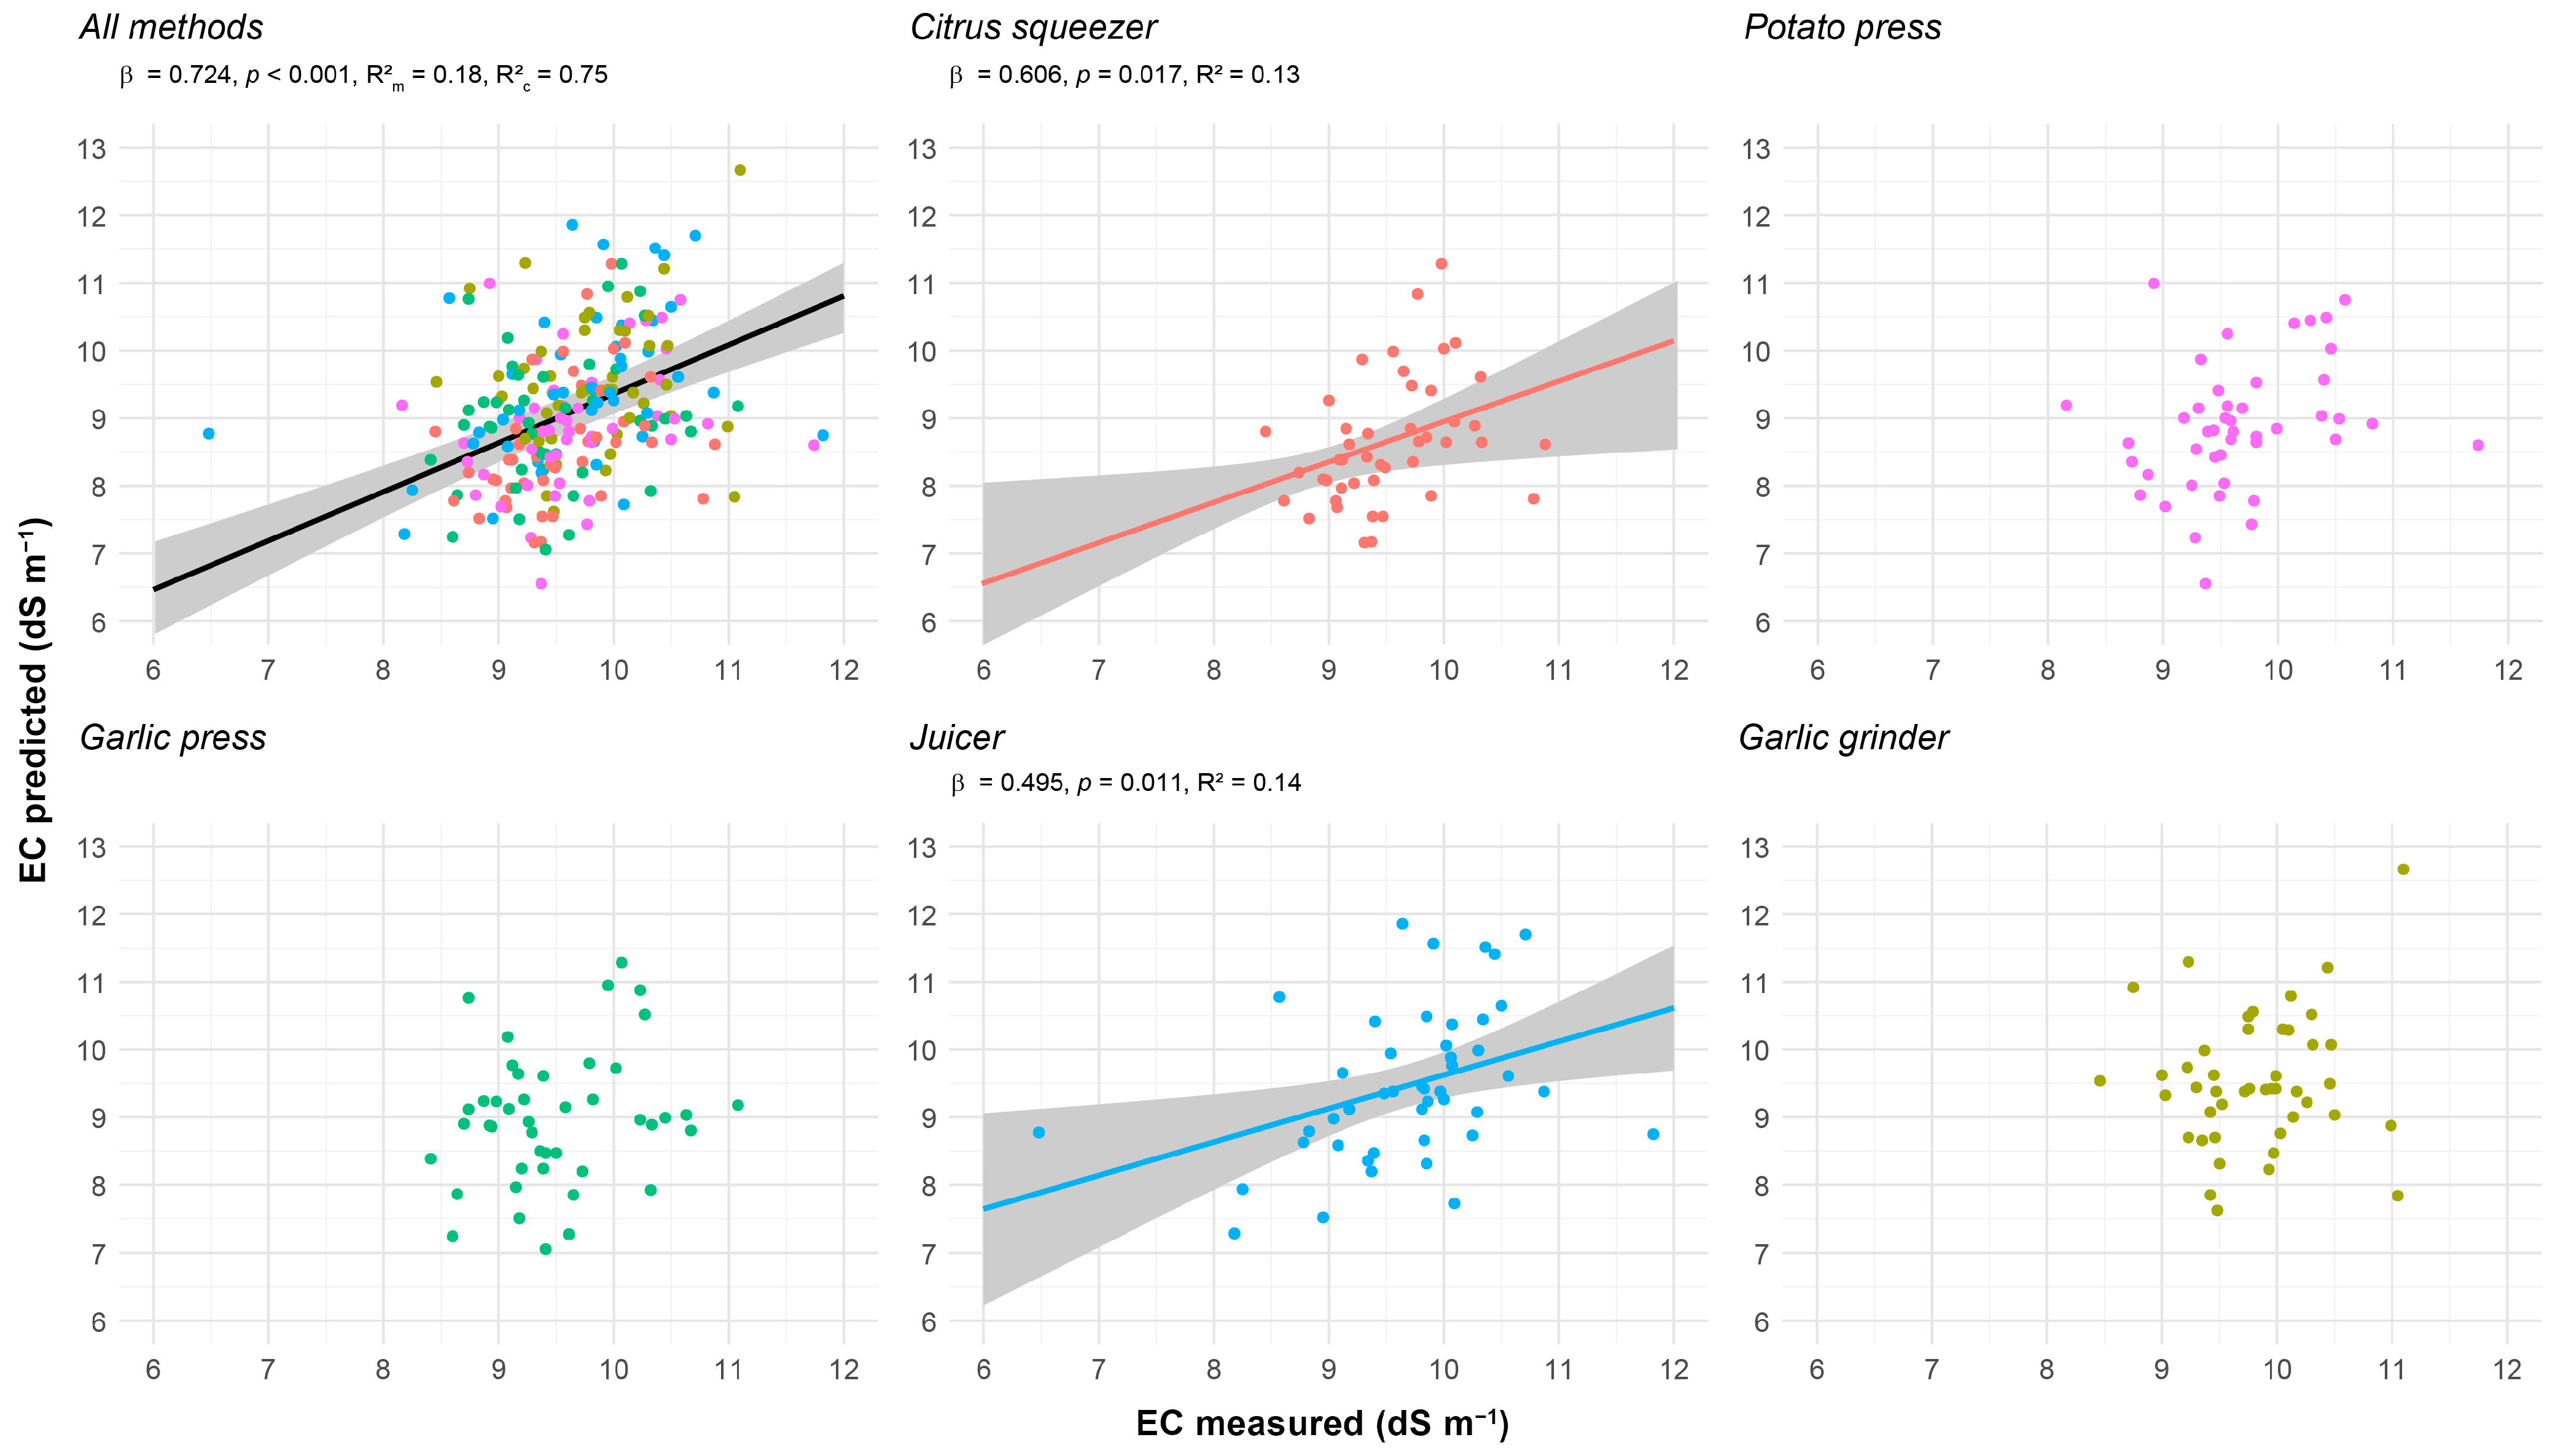
K+ was correlated with EC across extraction methods, while NO3 showed a significant association only in the overall dataset. However, both ions are expected to contribute similarly to EC due to their comparable limiting molar conductivities ( Λ 0 N O 3 = 71.42 and Λ 0 K = 73.48 S cm2 mol−1) and similar concentrations in sap, with a K+:NO3 ratio of ~1.1. Based on this, a combined predictor incorporating both ions was constructed to test a more mechanistic hypothesis regarding EC drivers.
This modeling approach altered the pattern of significance observed in exploratory analyses (Figure 6). For instance, in the citrus squeezer method, no correlation had initially been detected between EC and either ion (p = 0.059–0.069); however, the linear model using the combined predictor revealed a significant association (p = 0.017). In contrast, the juicer method—already showing the strongest exploratory correlation between EC and K+—also produced a significant result in the model (p = 0.011). The estimated slopes were similar in both methods (β = 0.606 and 0.495, respectively), but the variance explained by the models remained modest (R2 = 0.13 and 0.14), indicating limited predictive power at the method-specific level.
In contrast, the overall model yielded a stronger association between predicted EC and its corresponding measured values, with a slightly steeper slope than the individual models (p < 0.001, β = 0.724). While fixed effects alone (R2m) explained less than 20% of the variance, incorporating replicate as a random effect raised the conditional R2 to 75%, supporting the additive contribution of both ions (NO3 and K+) to sap EC.
These findings underscore that, even when exploratory trends vary or weaken at the extraction method level, mixed-effects modeling provides a more accurate and generalizable view of ion contributions to sap EC. However, this approach fundamentally relies on repeated sampling across replicates. When working with data from a single method, random effects can still be incorporated if multiple observations per sample are available—offering a way to enhance the robustness of the resulting inferences.
  • K+ and °Bx
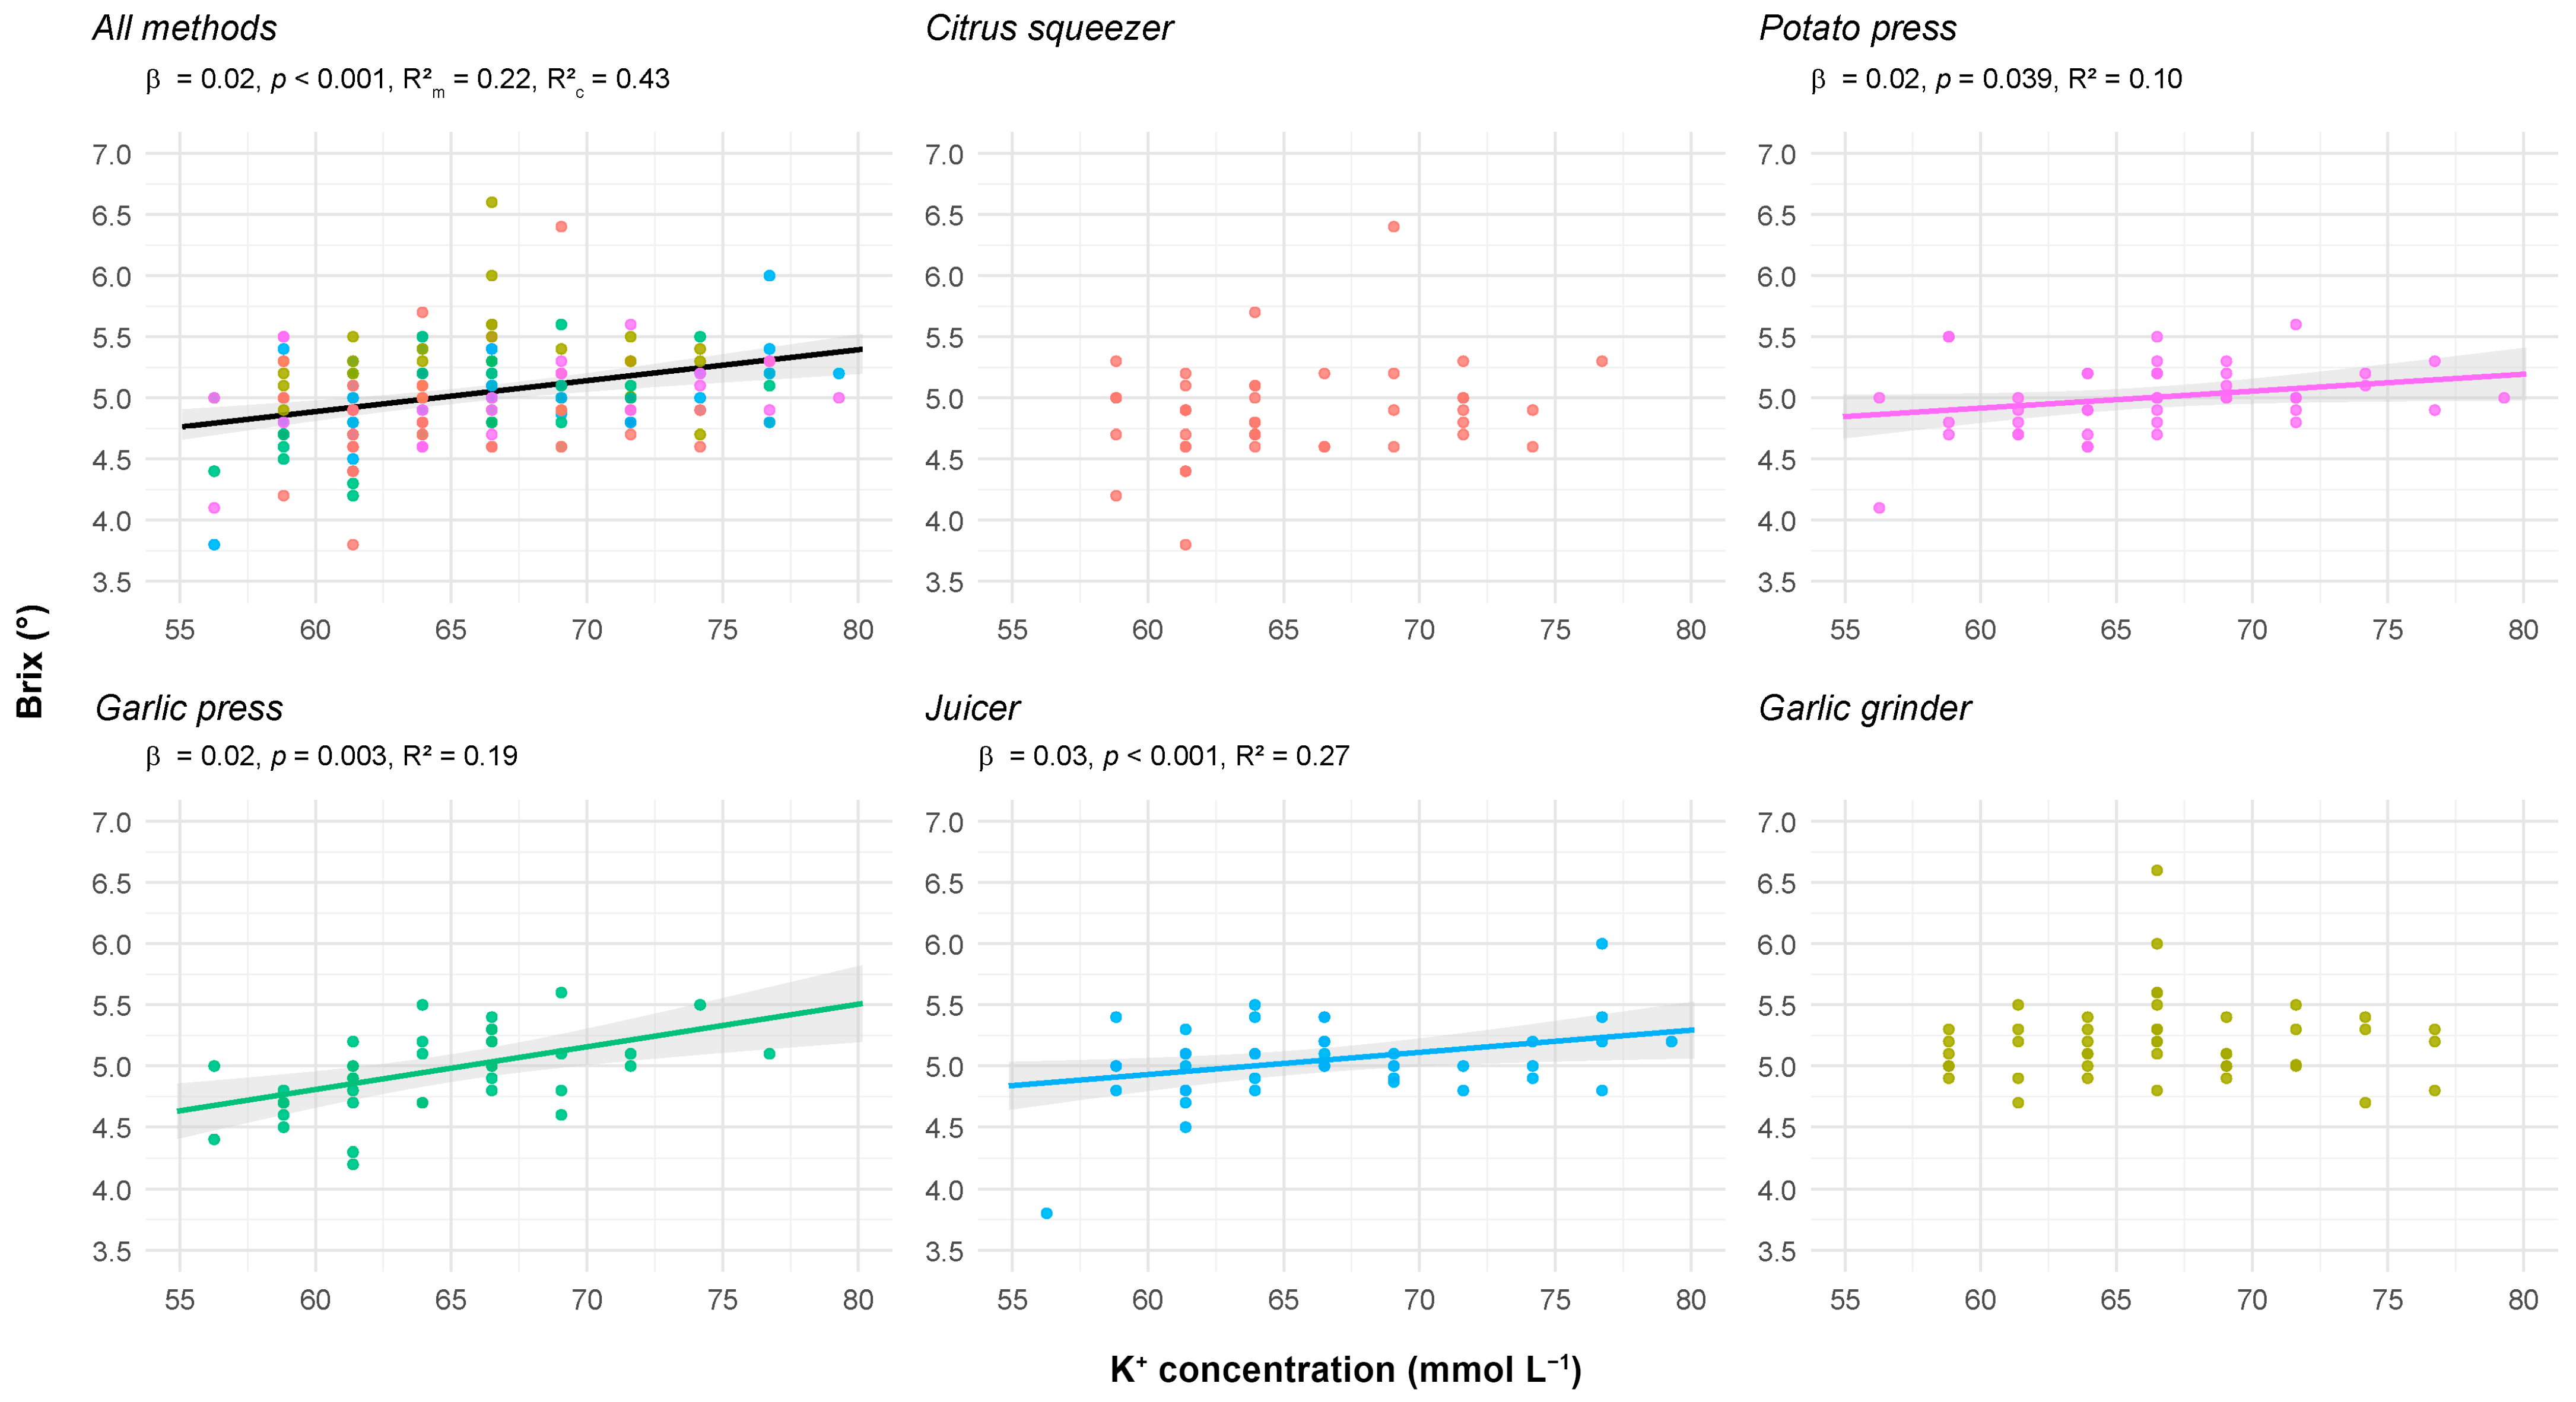
The consistent indications of a relationship between K+ and °Bx both in the overall dataset and in several method-specific correlation matrices, supported further examination through a mixed-effects approach. In contrast to the EC modeling, the patterns identified in the exploratory analysis were largely retained (Figure 7): significant positive relationships were found in the potato press (R2 = 0.10, p = 0.039), garlic press (R2 = 0.19, p = 0.003), and juicer (R2 = 0.27, p < 0.001).
The overall model also reached statistical significance (p < 0.001) and yielded a marginal R2 of 0.22, indicating that the fixed effects accounted for a moderate portion of the variance. While the estimated slopes and levels of explanatory power were similar among all models, the inclusion of random effects led to a notable improvement in the fit of the mixed model (R2c = 0.43). This contrasts with the exploratory analysis, where the overall correlation was weaker than those observed in specific methods, supporting the idea that increasing model complexity can help to uncover biologically meaningful patterns.
  • Physical interactions
Sap yield was evaluated as a potential bridge between P-DMP and S-DMP, but showed no significant relationship with either trait, both across individual extraction methods (p = 0.388–0.812 for P-DMP; p = 0.141–0.889 for S-DMP) and in the overall dataset (p = 0.783 and 0.085, respectively).
In contrast, a positive association between both dry matter variables was identified in two method-specific models (Figure 8). This pattern was consistent with the exploratory results, although the juicer—previously showing a moderate correlation (ρ = 0.46)—no longer reached significance under this modeling framework (p = 0.191).
When extending the analysis to the full dataset, model performance did not improve, and the slope of the association decreased. Furthermore, unlike the EC-ions and K+-°Bx models, the addition of random effects did not affect overall fit (Δ AIC = 0.59; LRT p = 0.236). Thus, increasing complexity provided no clear benefit in explaining the observed variability for this trait pair.
  • S-DMP and Chemical Parameters
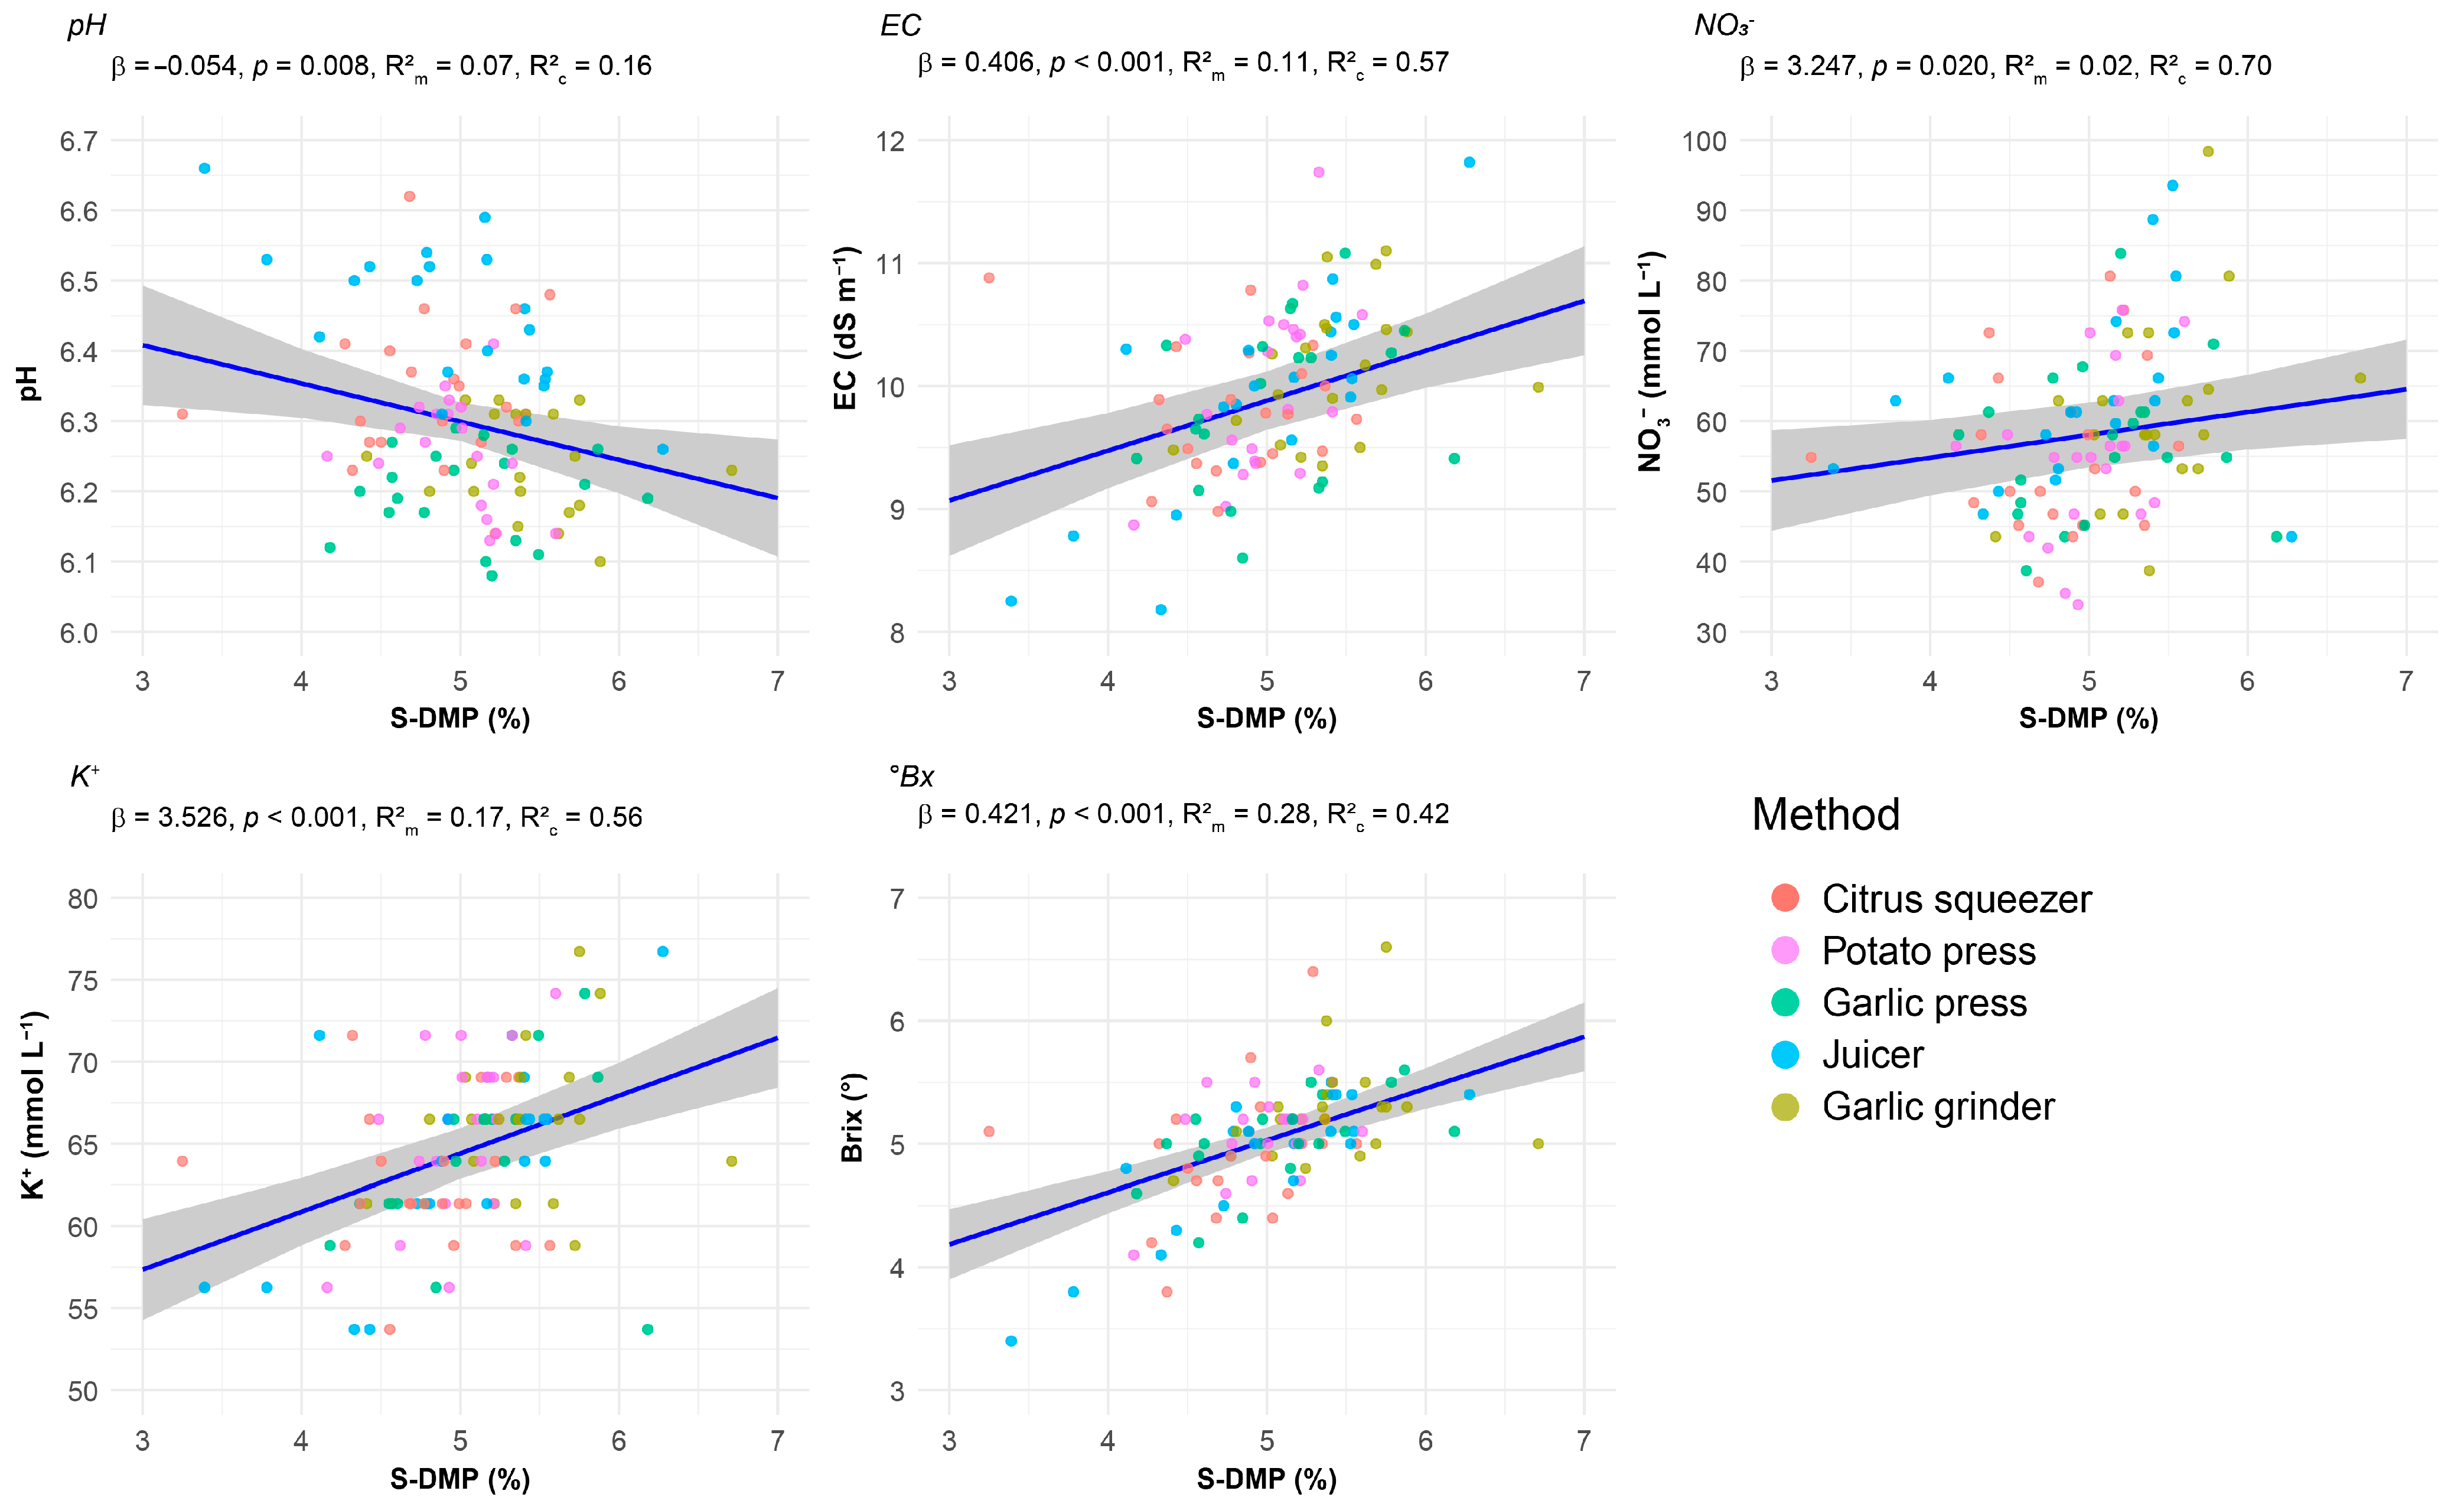
In the exploratory analysis, S-DMP emerged as the physical variable most consistently associated with the chemical parameters, both in the overall dataset and across individual methods. This motivated further modeling to assess whether additional structure could reveal deeper associations.
As in previous analyses, not all methods yielded significant results. The juicer was the only one showing an association between S-DMP and pH (R2 = 0.45, p < 0.001), and, along with the potato press, it also displayed significant relationships with other chemical parameters (EC, K+, and °Bx). R2 values ranged from 0.29 to 0.71 in the juicer, and from 0.17 to 0.28 in the potato press. In contrast, isolated associations were found for the garlic press (°Bx: R2 = 0.31, p = 0.006) and the garlic grinder (EC: R2 = 0.18, p = 0.029), while the citrus squeezer did not reach significance across parameters (p = 0.213–0.978).
Overall models revealed statistically supported associations between S-DMP and all measured chemical parameters, suggesting its potential as a proxy for sap nutritional profile (Figure 9). NO3 and pH showed the weakest correlations with S-DMP (overall ρ = 0.31 and –0.22, respectively), a pattern that aligned with the low explanatory power observed in their corresponding fixed-effects models (R2m = 0.02 and 0.07).
Among all parameters, NO3 exhibited the greatest sample variability. Consequently, incorporating random effects substantially improved model performance, increasing the proportion of explained variance to 70% in the full model. Conversely, pH—characterized by the highest homogeneity across samples—showed negligible improvement in AIC (Δ = −0.69) and no statistical significance in the LRT (p = 0.178), resulting in only a modest increase in explanatory power when considering the conditional R2 (0.16).

3.5. Temporal Effects

Intra-day time had no effect on any of the measured chemical parameters (p = 0.132–0.700), indicating that sap composition remained stable throughout the ~8 h sampling workflow, from tissue collection to sap analysis. In contrast, inter-day sampling significantly impacted pH, EC, K+, and °Bx, although no consistent directional trends emerged across days. The magnitude of these shifts corresponded to 1.5% for pH [1.5–1.5% across extraction methods; i.e., 0.09 pH units], 15.1% for EC [14.8–15.3%; i.e., 1.42–1.47 dS m−1], 9.4% for K+ [9.3–9.6%; i.e., 6.14–6.33 mmol L−1], and 6.0% for Brix [5.7–6.1%; i.e., 0.28–0.30 °Bx], relative to the model-adjusted marginal means of each parameter.

4. Discussion

The findings of this study provide new insights into the methodological and physiological factors that influence sap composition. While numerous studies have investigated the use of sap for crop monitoring, few have addressed how different extraction methods affect the consistency and representativeness of the measured parameters. In this context, the following discussion integrates our observations with existing literature, assessing both the variability of individual parameters and the practical implications of using distinct methods. Particular emphasis is placed on the influence of these factors on key metrics such as nutrient concentration, and their potential relationship to tissue disruption—aspects that are essential for the development of reliable and standardized protocols in plant sap diagnostics.

4.1. Effect of Extraction Method on Sap Chemical Profiles

Among the evaluated parameters, pH exhibited the strongest statistical differences across methods. Each one produced a highly consistent mean value, with minimal variability between samples (CV = 1.1–1.5%). However, despite reaching significance, the actual numerical variation was relatively small. For instance, the difference between the lowest and highest pH means—observed in the garlic press and juicer, respectively—was only 3.4%, corresponding to a shift of 0.22 units (see Table 1).
To our knowledge, no prior studies have examined the impact of different extraction methods on sap pH. However, research on fruit juices has reported comparable findings. Notably, Wilczyński et al. [54] observed only a 3.2% variation in pH between two types of apple presses, while other studies reported no statistically significant differences between methods [55].
Although pH was proposed early on as a potential indicator of crop nutritional status, it has rarely been assessed in sap analysis alongside other chemical parameters. In recent years, however, studies have increasingly incorporated pH into their analytical measurements [31,32,56,57,58], reflecting a growing recognition of its potential diagnostic value. In this context, further investigation is needed to determine whether alternative sap extraction methods might induce greater variation in pH, and if these subtle changes could meaningfully influence the results interpretation.
Furthermore, slight differences were observed in EC among methods, with a magnitude comparable to that of pH—only a 3% shift between the extremes. The garlic grinder yielded the highest EC values, probably due to the extensive tissue disruption it caused. This method tore apart plant tissues, producing the most pronounced damage to conductive structures among all methods (see Figure 2). As a result, it may have promoted the release of a larger volume of fluid from both the parenchyma cytoplasm and within the vascular bundles—compartments known to be rich in dissolved ions. Therefore, extraction methods involving greater mechanical disruption may elevate EC readings, a factor that should be considered when drawing conclusions from sap analysis.
Similarly, both the juicer and garlic grinder extracted higher concentrations of NO3 from the petioles. This observation aligns with the extent of cellular damage associated with their use, which likely led to the rupture of vacuoles—the primary storage site of nitrate within plant cells. Additionally, these methods caused severe rupture of conductive tissues, thereby releasing nitrate ions present in the vascular system directly into the sap solution. Together, these factors explain the increased NO3 levels observed in the extracts obtained using these invasive methods.
In line with Coltman [11], who found no differences in NO3 concentration between two low-impact options (a cylindrical rod and a garlic press), we also observed consistency among some of these. Here, the citrus squeezer, potato press, and garlic press formed a transitional group, yielding partially overlapping concentrations that were lower than those obtained with the more invasive ones.
In the case of K+, no significant differences were observed between methods, with an average of 65.50 mmol L−1 (2562 mg L−1). This contrasts with the only known reference, where Gruener [59] reported discrepancies in K+ concentration when using a conventional garlic press, a hydraulic press, or a self-manufactured hitch press. However, the extent of these differences—whether statistically significant or merely anecdotal—remains unclear, as the data were unpublished and unavailable for review.
Although sap K+ concentrations in sampled plants fell within the sufficiency ranges proposed by Castellanos [42], they remained below the thresholds suggested by Benavides-Mendoza et al. [57] and Padilla [60]. These discrepancies make it difficult to speculate whether K+ availability may have limited the detection of method-related differences. To address this uncertainty, we also assessed the total K+ concentration in random petiole samples, recording an average concentration of 4.1 ± 0.7% (n = 3). While this estimate is based on a limited, exploratory sample set, it aligns with the sufficiency thresholds reported by Castellanos and colleagues (2.8–4.0% for preharvest) and Ankerman and Large [61] (2.0–4.0% for flowering). Taken together and noting that these standards should be interpreted with caution, the evidence suggests that tissue K+ deficiency is unlikely to account for the pattern observed in sap measurements.
Considering the crop’s phenological stage at preharvest, substantial translocation of K+ from the leaves toward the inflorescences may have occurred, leading to an equilibration of cytosolic and vacuolar concentrations, not as a sign of deficiency but as an intrinsic aspect of reproductive development. This physiological adjustment may explain the consistency in K+ concentrations observed across methods, despite the varying degrees and types of tissue disruption. In light of this hypothesis, and considering the observations of Gruener [59], a deeper evaluation of this phenomenon during earlier phenological stages is required.
Regarding °Bx, no statistically significant differences were observed across methods, except for the garlic grinder, which produced values over 5% higher than the average of the others. This increase could result from greater disruption of phloem tissues, which are rich in sugars. Alternatively, since °Bx is a density-based measurement that relies on the refractive index of the solution, the presence of non-sugar solutes may distort the reading and result in artificially high values.
In this context, the release of structural carbohydrates from disrupted cell walls into the sap may have contributed to the elevated readings, a phenomenon previously reported in forage sap studies [62]. Additionally, solutes such as amino acids, pectin, proteins, and organic acids—potentially introduced into the sap through tissue disruption—can influence refractometric measurements. Thus, the choice of extraction method can influence °Bx, not necessarily by releasing more sugars from plant tissues, but also by introducing other dissolved solids that interfere with the readings.
Studies on fruit juices have shown that devices relying solely on tissue pressing typically cause little to no change in soluble solids content [54,55,63], a result that resembles the effects observed in low-impact methods. This may be attributed to the fact that pressing causes less cellular disruption, thereby reducing the release of debris into the solution compared to methods that mill or grind the tissues.
As with pH, there is a renewed interest in using °Bx as a potential diagnostic tool for assessing crop physiological status [31,57]. However, given that mechanical disruption during extraction may introduce structural or metabolic compounds into the sap, it is timely to evaluate the extent to which such differences could affect the diagnostic utility of °Bx measurements.

4.2. Variability Among Extraction Methods

Each sample, composed of 15 petioles with an average total weight of 231 g, was divided into approximately 200 slices of ~5 mm length. However, the amount of plant material used by each extraction method differed substantially, resulting in subsamples of varying sizes that accounted for distinct proportions of the total sample weight. Some authors have reported using, or even recommended, subsampling as a way to simplify the procedure and reduce the processing time that would otherwise be required for handling large tissue samples [12,17]. Nonetheless, our literature review failed to uncover any study that explicitly reported the size of the subsample used, nor provided guidance on the minimum subsample size required to obtain results that accurately represent the whole sample.
Here, sizes varied markedly across methods. The citrus squeezer employed the largest subsample, using on average 27 petiole slices (30 g), which accounted for approximately 13% of the total sample weight. Assuming a random distribution of tissue slices, this equates to roughly 1.8 slices per petiole, likely offering a comprehensive representation of the full sample. In contrast, both the potato press and garlic grinder used approximately 7.8% of the sample, corresponding to about one slice per petiole. The juicer employed an even smaller proportion (5.2%), representing ~0.7 slices per petiole, while the garlic press had the lowest representation, using only 3.8% of the total material—equivalent to a maximum of eight distinct petioles per subsample. However, despite these differences, device capacity was not significantly associated with the coefficient of variation for any of the evaluated parameters (p = 0.17–0.70).
Although the proportion of tissue sampled between methods differed by up to a factor of four, variability remained relatively stable within each chemical parameter, as indicated by statistically significant yet minor differences in CVs (ranging from 0.42% in pH to 2.39% in K+), with no directional pattern observed across methods (see Table 1). These findings are consistent with previous research on fruit juices, which reported that the variability of several parameters was only marginally affected by different pressing devices [54,55].
This apparent lack of association between subsample size and data dispersion suggests that multiple factors may be influencing the results. Variability introduced by different extraction methods may arise from distinct mechanisms, which can, in some cases, offset one another. For instance, methods that process larger tissue volumes may better capture the inherent heterogeneity of the sample, thereby reducing sampling error. However, they may also introduce variability if tissue disruption is inconsistent across replicates. Conversely, methods using smaller portions may be less representative of the overall sample but can partially compensate through greater mechanical precision and more uniform sap extraction—ultimately leading to comparable CVs.
It is also possible that the sample was overrepresented, such that even the smallest subsamples—like those processed with the garlic press—were sufficient to capture most of the variability present in the crop. Under this scenario, the variability observed among extraction methods would likely be driven primarily by differences in mechanical extraction mechanisms rather than by differences in processing capacity. This interpretation is supported by Studstill et al. [41], who reported that the CV for sap NO3 and K+ in pumpkin showed little improvement when more than 10 petioles were included, indicating that a relatively small number of plant organs can be sufficient for reliable sap analysis.
However, despite the large number of replicates used in this study, the CVs for NO3 remained relatively high under all methods (17–18%). Given that the samples encompassed approximately 20% of the plants within a homogeneous crop stand, it is improbable that field-level heterogeneity played a predominant role in this outcome. This suggests that the processing stage itself may have been the primary source of variation, rather than intrinsic differences among the samples.
Supporting this interpretation, our unpublished results indicate that pooling sap from multiple subsamples helps mitigate this issue. However, the effectiveness of such adjustments is method-dependent. Addressing these sources of error will help minimize sample-to-sample variability, enhance measurement consistency, and ultimately result in more reliable diagnostic interpretations in future applications.

4.3. Variability Among Chemical Parameters

The evaluated parameters exhibited different levels of variability (pH < EC = °Bx = K+ < NO3), which were more strongly influenced by the intrinsic nature of each than by the specific extraction method used (see Table 1). An identical CV trend was observed for bananas by Ugarte-Barco et al. [58], while a comparable pattern has also been reported in grapevines and tomatoes, where only NO3 and K+ were assessed [23,64].
However, slightly different hierarchies have been derived from published data on other species. Results from Pantoja-Benavides et al. [32] suggest the order pH < EC < NO3 < K+ in the sap of rice; but it changed when plant growth regulators were applied. Similarly, observations by Díaz-Vásquez and Sandoval-Rangel [56] indicated the order pH < K+ < °Bx < NO3 < EC in the juice of wild tomatoes, though it shifted in response to poultry manure fertilization and the use of different plastic mulch colors. Additionally, Cadahía López [47] noted that the CV of NO3 and K+ can fluctuate depending on the phenological stage of tomato, while Meesters et al. [40] reported that the degree of variability in NO3 and sugars (sucrose, fructose, and glucose) differed among cultivars grown under identical conditions.
Overall, this evidence suggests that sap trait variability is likely shaped by a combination of agronomic practices and genetic factors. As these patterns have only recently emerged in literature, further research is needed to elucidate the mechanisms underlying them.

4.4. The Hidden Complexity Beyond Sap Yield

The mean yield across methods was 179 μL g−1 (73–236 μL g−1) (see Table 2), which falls within the range of 50–385 μL g−1 documented for broccoli by Padilla [60], and is very close to the 200 μL g−1 average reported for horticultural crops by Sánchez-García et al. [45]. These values align with those described by Cadahía López [47] for tomato, but remain below the 325–371 μL g−1 range observed by Padilla and Saritama [65] in banana, suggesting that yield may also be influenced by the plant species. Since it can limit the range of traits measurable from a single sample, the choice of extraction method should aim to ensure sufficient sap volume while meeting the other analytical dimensions addressed in this study.
Research on fruit juices has shown that both yield and chemical composition are influenced not only by press type [54,55,63], but also by structural features such as the size and number of holes in the sieves used [66]. This implies that, although various device types were compared here, design-related differences can affect both sap yield and the resulting chemical profiles.
Such factors may be particularly relevant in the case of the garlic press, the most widely used extraction method. Yet, the scientific literature has historically overlooked technical specifications, with only two publications—both from the same research team—explicitly describing the equipment used [49,67], thereby hindering reproducibility and cross-study comparisons. Even if structural features were consistently reported, the diversity of device designs could still produce complex effects on sap profiles—adding avoidable heterogeneity to a field still in the process of establishing its methodological foundations. Accordingly, standardizing both the type of extraction device and its structural features may represent the most effective way to minimize methodological bias in sap analysis.
A contribution in this direction was made by Spectrum Technologies through the distribution of the Swiss-made Zyliss “Susi” garlic press for sap extraction, which has been used by several researchers in the United States [18]. In Mexico, a similar initiative has taken shape, where the growing availability of hand-held ISEs has been accompanied by a sap extraction device—consisting of a C-clamp and a nylacero tube—commercialized by the company Proain [25].
This trend was mirrored in France with the launch of the JUBIL® toolkit—a registered trademark created jointly by INRAE (France’s National Research Institute for Agriculture, Food and Environment) and a private company in 1993 [48]. Designed for the determination of nitrate content in cereal crops, this kit includes a screw press for sap extraction, that continues to be widely used today among French farmers [68]. However, with the trademark set to expire in 2033, this raises questions about its long-term availability and continued dissemination.
Thus, given these scattered initiatives, there is an urgent need to either (i) develop a specialized and optimized device tailored for sap extraction, (ii) establish a universal and easily replicable method, such as one based on hydraulic presses with defined pressure levels and standardized sample positioning; or (iii) adopt a globally accessible commercial device that ensures consistency and comparability across studies.

4.5. Sap Solids

As would be expected, S-DMC was strongly correlated with S-DMP (overall ρ = 0.68; range 0.51–0.83 across methods), as both are calculated from the same underlying dry matter value, normalized by total sap mass. In addition, each one showed a positive correlation with °Bx (overall ρ = 0.42 for S-DMC and 0.57 for S-DMP), with the latter displaying a linear relationship in which 42% of the variance was explained by a model that included random effects across the full dataset (see Figure 4 and Figure 9). These findings indicate that the soluble compounds estimated as sucrose equivalents through refractometry account for a substantial share of variation in both dry matter indicators. Accordingly, °Bx may serve as a practical and rapid proxy for sap dry matter content, but only if the latter ultimately proves relevant for physiological diagnostics.
Nevertheless, method-specific analysis reveals important distinctions. Only three of them (garlic press, juicer, and garlic grinder) showed significant correlations between °Bx and S-DMP, with the juicer exhibiting the highest correlation (ρ = 0.75). When this association was further explored through linear modeling, the garlic grinder no longer showed a significant relationship (p = 0.184), whereas the potato press emerged as statistically relevant, and the juicer continued to provide the best data fit (R2 = 0.71).
This variability in the relationships observed across extraction methods and statistical approaches suggests that Brix-based estimations of sap dry matter should be interpreted with caution, emphasizing the need to account for method-specific effects in future research and applications.

4.6. What Is “Sap”, Really?

Although the term “sap” is commonly used in the literature to refer the fluid extracted from plant tissues, its anatomical origin is rarely discussed, and no previous study has provided direct empirical evidence of what exactly is being assessed when we refer to this fluid. In the present study, the integration of solids data and histological analysis reveals that the extracted fluid originates from multiple tissue compartments.
To better interpret these findings, it is useful to contextualize the observed values by comparing them with those of well-characterized plant fluids. For instance, the average S-DMC in our samples was 59 mg mL−1 (57–64 mg mL−1 across methods, see Table 2), which falls within the range reported by Pappelis [69] for corn sap (50–100 mg mL−1). These values are substantially higher than those typically found in xylem sap (~1.0 mg mL−1), but lower than the >100–200 mg mL−1 commonly observed in sieve tube exudates. They are also lower than cytoplasmic concentrations, known to exceed 100 mg mL−1 in various organisms, yet considerably higher than expected for apoplastic water, which consists mostly of free water and has an osmotic potential close to that of pure water.
Consistently, the S-DMP observed here (5.0%) exceeded typical xylem sap values (<1.0%), but remained below those of phloem exudates, whose concentrations usually range between 10 and 20%.
Taken together, these observations reflect the heterogeneous composition of the extracted fluid, which comprises intact cells or tissue fragments, along with both intracellular and extracellular components from various cell types, encompassing a broad spectrum of solutes. While phloem exudates and parenchyma cytoplasm likely contribute to the elevated solute content, xylem sap and intercellular water may act as diluting agents, resulting in an overall solute concentration that lies within an intermediate range.
This biochemical and structural complexity has also given rise to a terminological challenge in literature, where multiple terms have been used to refer to similar materials. The term “sap” has become common in the literature to describe these mixed fluids, reflecting a tacit consensus among research groups worldwide [2,47]. Nevertheless, some authors have proposed more specific terms such as “plant solution” or “cellular extract” [42,45], aiming to better capture the complexity of the material obtained. These alternatives, however, remain limited in scope, as the extracted fluids are not composed solely of cytosol, vacuolar content, or vascular exudates, but also include substantial amounts of cell debris and tissue fragments. Other terms, such as “tissue fluids” or “plant juice”, were introduced in earlier studies and may offer a more accurate description for this heterogeneous liquid.
This lack of terminological consistency has hindered efforts to trace and consolidate scientific contributions in this research area, thereby limiting the cumulative advancement of knowledge. We consider the generic term “sap” to be a practical and inclusive descriptor—if studies clearly specify the extraction methods employed. Even so, the tacit agreement surrounding its use must give way to a more intentional and explicitly shared convention, if the field is to establish a coherent conceptual framework and advance collectively.

4.7. Could Sap EC Be Used as a Predictor of NO3 and K+ Concentrations?

Sap EC reflects the total ionic concentration in the fluid, including a variety of nutrients, most notably NO3 and K+, both of which contribute dominantly to its value. In our study, both ions were positively associated with overall EC; however, only the correlations with K+ were statistically significant across methods (see Figure 4). This may suggest the presence of a relationship with NO3 that remains undetected when correlations are calculated separately for each method, potentially due to the lower statistical power associated with the smaller sample sizes within individual groups, as compared to the overall dataset.
To further investigate this, we attempted to estimate EC from NO3 and K+ concentrations using their limiting molar conductivities (see Figure 6). Of the four examined methods, only two (citrus squeezer and juicer) yielded statistically significant relationships between measured and predicted EC (p < 0.05), while a third (potato press) was close to significance (p = 0.057). However, R2 values were low (0.13–0.14), indicating that although a relationship exists, it fails to explain most of the variability in EC, thereby reflecting inherent shortcomings in the estimation model. This was also evident when directly comparing EC values: in 29% of the cases, predictions based solely on both ions exceeded the measured EC—which accounts for the collective contribution of all species present in the sap—pointing to an overestimation of the contribution of NO3 and K+ to total sap EC.
Therefore, the proportion of the predicted EC that could theoretically be attributed to NO3 and K+ was estimated. Using the average ion concentrations in tomato sap reported by Llanderal et al. [64] and their limiting molar conductivities at infinite dilution, we estimate that both ions account for ~46% of the total predicted ionic conductivity (considering the presence of Cl, NO3, Na+, K+, Ca2+, Mg2+, H2PO4, and SO42−). If a similar proportion of NO3 and K+ applies to the plant species and experimental conditions evaluated, 100% of the predicted EC values still exceed the expected range.
This discrepancy likely arises from the nature of limiting molar conductivities, which are defined under conditions of infinite dilution. In contrast, real sap samples contain ions at substantially higher concentrations. As ionic strength increases, molar conductivity decreases due to ion-ion interactions and reduced ionic mobility. Consequently, the contribution of each unit of concentration (mmol L−1) of NO3 and K+ to total EC is lower than what is predicted by theoretical estimates.
Additionally, the presence of other ions, such as those previously mentioned [26,27,64], complicates interpretation. These unaccounted ions not only contribute directly to total EC but also influence ionic interactions within the solution, potentially altering the molar conductivity of individual species present in the mixture. Furthermore, several authors have reported that these coexisting ions may interfere with ISE measurements of NO3 and K+ themselves, thereby limiting the reliability of sap ion data interpretation [70,71].
Variations in the extraction efficiency of these additional ions across different methods may also help explain why the combined concentrations of NO3 and K+ do not consistently account for measured EC. The citrus squeezer and juicer were the only methods that produced statistically significant models, suggesting that these devices may allow for a more uniform release of additional ions into the sap. This could reduce variability in the overall ionic composition and improve the consistency of EC predictions based on partial ion data.
Collectively, these findings highlight the limitations of using EC as a stand-alone proxy for specific ion concentrations. Future studies aiming to model these relationships should incorporate a more comprehensive characterization of the complete ionic composition of sap. This would enable the development of more robust stoichiometric models that account for the full range of contributing ions and their interactions under physiologically realistic concentrations.

4.8. Nutrient Relations

The overall correlation between the two measured nutrients (NO3 and K+) was 0.24. However, this association was not consistent across extraction methods (see Figure 4). Three methods showed non-significant associations, while moderate values were found in the remaining two (ρ = 0.30–0.31). As noted previously for sap solids and °Bx, this inconsistency may reflect both the increased sensitivity of the Spearman test when applied to the full dataset and the proxy-dependent nature of these relationships.
Interestingly, the methods that yielded statistically significant NO3-K+ correlations were also those associated with lower sap NO3 levels, suggesting a tighter coupling in the extraction dynamics of both ions. In contrast, more invasive methods that produced higher NO3 yields showed that increases in its concentration were not accompanied by proportional increases in K+ levels. A plausible explanation for this pattern is the prior hypothesis of K+ homogenization within cells, which could lead sap K+ concentrations stabilizing around a relatively uniform baseline across samples. This would reduce its potential to co-vary with NO3 in methods where its concentrations are greater, ultimately resulting in non-significant correlations. A comparable observation was reported by Chareo-Benítez et al. [72], who found no correlation between these parameters in the sap of Persian cucumbers extracted using a hydraulic press.
By contrast, the significant NO3-K+ correlations observed in certain methods align with long-established patterns in literature. From early observations by Pettinger [73] to more recent studies, their co-occurrence has frequently been described as synergistic. Chrudimsky [74] reported a correlation of 0.38 between these ions in sorghum sap during anthesis, whereas a strong linear relationship (R2 = 0.99, p < 0.01) was reported centuries later by Rangel-Lucio et al. [75] in the same species. More recently, Mota et al. [27] documented a similar correlation (r = 0.36) in the sap of apple trees at 45 and 95 days after full bloom, and Peuke [76] also observed a comparable association in xylem fluid. Collectively, this body of evidence reinforces the notion that NO3 and K+ often exhibit coordinated dynamics in plants, supporting their proposed functional interdependence in transport and assimilation.
A similar trend was observed between K+ and °Bx, with an overall correlation of 0.34 and a model explaining 43% of the variance, with three extraction methods (potato press, garlic press, and juicer) yielding significant associations in both cases. These modest yet stable patterns likely reflect the integrative role of K+ in physiological processes that directly influence sugar dynamics. Beyond its osmotic function, this ion plays a key role in regulating stomatal aperture, thereby optimizing CO2 assimilation during photosynthesis and promoting carbohydrate accumulation. Furthermore, K+ facilitates sugar translocation via phloem loading and supports multiple enzymatic pathways involved in sucrose metabolism, contributing to both source and sink processes of carbon partitioning [77].
On the other hand, no significant correlations were observed between NO3 and °Bx across methods. This contrasts with the findings of Rangel-Lucio et al. [75], who reported a very strong relationship between these variables in sorghum sap (R2 = 0.996; p < 0.01). However, the extraction method used in that study was not specified, which limits the ability to speculate on the potential contribution of this factor compared to others such as crop species, developmental stage, or NO3 availability.
In this context, it remains essential to clarify whether the variability observed between methods arises from the extraction procedure itself or reflects intrinsic differences related to the crop and its nutritional status. Disentangling these factors is critical to determining whether ion relationships derived from sap analysis genuinely reflect underlying physiological processes or are instead confounded by methodological artifacts.

4.9. Tissue Moisture and Nutrients

P-DMP was positively correlated with EC, K+, and °Bx in the overall dataset, suggesting that petioles with higher dry matter produce more concentrated sap in terms of nutrients and sugars (see Figure 4). However, these correlations were consistent only when using low-impact extraction methods, with no statistical significance observed under the invasive ones (juicer: p = 0.331–0.481; garlic grinder: p = 0.073–0.200), aligning with previous findings using a garlic press [46,78].
Building on this idea, Hartz et al. [37] proposed that sap measurements could be corrected based on petiole moisture. However, our results suggest that such corrections may increase the variability of chemical parameters. Specifically, when EC, K+, and °Bx values were adjusted for P-DMP using the two methods with the best correlation fits, we observed an average increase of 51% in the CVs—with individual increases of 27% for K+, 54% for EC, and 73% for °Bx, thereby challenging the effectiveness of this approach. In agreement, Kubota et al. [38] cautioned against relying on dry matter corrections, as their findings showed that tissue moisture was not consistently related to nutrient concentrations when comparing samples from different broccoli fields.
Given this evidence, it appears that correcting sap chemical values based on tissue water parameters does not necessarily improve the robustness of the resulting measurements. We therefore urge future research to critically assess the validity and practical relevance of such adjustments, to determine whether they effectively enhance the accuracy and consistency of sap-based diagnostics.

4.10. Deriving Sap Sufficiency Thresholds Based on Nutrient Concentrations in Dry Tissue

Exploring the relationship between nutrient concentrations in sap (mg L−1) and those in dry tissues (mg kg−1) has long been a central goal in sap analysis research, with numerous studies consistently documenting such associations across a wide range of plant species. These consistent patterns have prompted several authors to propose converting pre-established dry tissue sufficiency thresholds into sap-based equivalents [28,38,67].
Nonetheless, our findings suggest that sap nutrient concentrations can vary within the same sample depending on the extraction method employed, indicating that the slope of such relationships with corresponding dry tissue values may not remain consistent across them. Furthermore, certain methods (e.g., those with higher sample variability) could impair model fit, undermining their reliability for real-world applications—where conversions based on weak relationships risk substantial inaccuracies, particularly given the common reliance on single measurements.
In addition, these relationships appear not only to be method-specific, but also tissue-dependent. Sonneveld and De Bes [43] demonstrated that the slope of the sap-to-dry tissue nutrient relationship differed by more than a factor of two between petioles and leaf blades, despite both showing similarly strong statistical associations (R2 = 0.99 and 0.98). This underscores that even well-fitted models may yield divergent interpretations depending on the tissue selected for analysis. Therefore, without rigorous standardization of both the sap extraction method and the sampled tissue, deriving sufficiency thresholds from dry tissue values has reduced practical utility and may contribute more to diagnostic ambiguity than to actionable decision-making.
Given these limitations and considering that sap has consistently demonstrated greater sensitivity than dry tissue to variations in nutrient availability and crop performance [8,21], sufficiency thresholds should ideally be developed directly from sap-based measurements. This approach has been increasingly embraced by recent research [9,19,20,30], signaling a transition toward more robust and field-applicable diagnostic standards.

4.11. Practical Implications

The differences observed across extraction methods not only underscore the relevance of methodological inconsistencies in the literature but also raise important considerations for the practical implementation of sap analysis. The following examples illustrate how variations in pH, NO3, and °Bx readings, depending on the method used (see Table 1), may lead to different interpretations when compared against current nutritional standards.
Here, broccoli sap pH averaged 6.29, showing slight variation among extraction methods (6.22 to 6.44). While these values align with the thresholds proposed by Padilla [60], they exceed the optimal range suggested by Benavides-Mendoza et al. [57]. However, a notable case is observed when compared to the standards used by farms and consultants in South Africa and the United States, who apply a universal sap pH standard of 6.40 for all plant species [79]. According to this criterion, only the juicer produced a mean pH value within the ideal range in this study (6.44).
A similar trend was observed for NO3. Its mean concentration was 60.17 mmol L−1, with values ranging from 54.67 to 65.26 mmol L−1 (3390–4047 mg L−1), depending on the extraction method. These concentrations fall within the sufficiency ranges proposed for broccoli during the pre-harvest stage by several authors [24,34,35], while exceeding the desirable thresholds suggested by others [28,38,42,60].
However, when comparing our results with the most robust broccoli standards developed in Mexico—namely, those proposed by Castellanos et al. [39] (35.69–57.11 mmol L−1; 2213–3541 mg L−1) and Benavides-Mendoza et al. [57] (49.19–59.27 mmol L−1; 3050–3675 mg L−1)—only the values obtained using the two methods that yielded the lowest concentrations in our study (citrus squeezer and potato press) fell within the recommended ranges.
Lastly, only the garlic grinder, which produced mean °Bx values of 5.2°, fell within the reference range of 5.0–6.0° proposed by Benavides-Mendoza et al. [57], while the other methods resulted in deficient levels of soluble solids.
In brief, this emphasizes the extent to which methodological choice can bias interpretation: while the juicer would have met the standard for pH, the citrus squeezer and potato press the one for NO3, and the garlic grinder for °Bx—all other methods fell outside the recommended ranges. A concern that becomes particularly relevant considering that none of the studies used as inconclusive reference points specify the extraction method employed to establish their sap thresholds, making it unclear whether current comparisons are even compatible. In real-world scenarios, such ambiguity could introduce substantial variation in the interpretation of a crop’s nutritional profile, potentially affecting the type of fertilizer applied, along with its dosage and scheduling, as well as broader agronomic decision-making.

4.12. Was There Noise in the Findings and Dataset?

  • Interpretation considerations for combined models
In all tested relationships, extraction methods differed in correlation strength and model fit across sap traits. Although pooling data across methods yielded stronger results (Figure 4, Figure 6, Figure 7, Figure 8 and Figure 9), likely due to greater statistical power, it may inflate apparent relationships when inter-method contrasts—rather than within-method patterns—drive the associations, leading to spurious conclusions, a phenomenon known as the ecological fallacy and Simpson’s paradox.
While no evidence of this was observed in the findings, the experimental design was not originally intended to support the construction of combined models across different methods. Therefore, they should be interpreted with caution—particularly when aiming to identify generalized biological patterns. As this is the first study to explore this phenomenon in the context of sap analysis, further validation using larger datasets stratified by extraction method is needed to determine whether the observed patterns reflect true biological relationships or artifacts introduced by methodological and interpretative factors. Clarifying this distinction could ultimately inform the selection of methods that yield more reliable and biologically meaningful results.
b.
Temporal effects
As anticipated under proper handling conditions, sap chemical composition did not exhibit any consistent trend across the <8 h daily window between field collection and laboratory analysis, reflecting the effectiveness of the preservation protocols applied (e.g., [12,16,35,37]). However, sampling day had a significant effect on four out of the five evaluated parameters (pH, EC, K+, and °Bx), highlighting its potential role as a source of background noise.
Although research on this issue remains limited, there is general agreement on the presence of day-to-day variability in sap composition. This notion is reflected in practical guidelines advising against sampling after irrigation or rainfall, as well as in a few studies that provided direct evidence of daily shifts [24,44,80].
Despite not being the primary focus of this study, the size and structure of the dataset allowed for the evaluation of inter-day variation, providing novel evidence of fluctuations in sap composition across consecutive days for multiple chemical parameters. As discussed in the previous section, variability between extraction methods could lead to inaccurate fertilization decisions, particularly for pH, NO3, and °Bx. While the effect of sampling day was less pronounced than the method effect for the first two parameters, it showed a comparable magnitude for °Bx, with a maximum method difference of 0.32° and a day-to-day variation of up to 0.30°. In contrast, for EC and K+, the effect of sampling day exceeded the method effect by factors of five and three, respectively.
These effects were accounted for in our statistical design through the use of linear mixed-effects models, which treated individual sample variability as a random effect. This approach helped minimize background noise and maintain focus on the central research objective of determining whether the extraction method influences the physicochemical properties of plant sap. Nevertheless, day-to-day fluctuations still introduced variability into the dataset, increasing the overall dispersion of nutrient concentrations. Ideally, all measurements would have been taken simultaneously to reduce this source of variation; however, such an approach is rarely feasible due to the logistical challenges of processing numerous samples within a limited time frame, unless supported by a large team and sufficient equipment.
In light of these limitations, we encourage the scientific community and agricultural advisors to explicitly consider day-to-day variation when designing experiments and applying sap analysis in practice. Neglecting this source of variability could lead to flawed fertilizer recommendations and ultimately undermine the primary goal of sap diagnostics: improving nutrient use efficiency.

5. Conclusions

Growing demand for rapid and reliable nutrient diagnostics has positioned sap composition as a promising indicator, but its practical value depends on adopting rigorous protocols. Current practices—from tissue collection to sap measurement—are often variable and insufficiently documented, undermining comparability across studies and datasets. Our results show that even minor procedural differences in sap extraction, such as the choice of method, can substantially shift chemical measurements and inter-trait relationships. For instance, higher-impact extraction methods yielded greater readouts of up to 0.29 dS m−1 in EC, 10.59 mmol L−1 NO3, and 0.32 °Bx relative to lower-impact alternatives, magnitudes sufficient to change nutrient diagnoses and, consequently, fertilizer decisions. This calls for rethinking current sap analysis practices, raising awareness of methodological variability and encouraging the development of robust, standardized approaches for reliable and comparable sap-based diagnostics.

Supplementary Materials

The supporting information can be downloaded at: https://www.mdpi.com/article/10.3390/agronomy15112572/s1, Table S1: Sample-level dataset.

Author Contributions

Conceptualization, J.S.C., M.A. and P.P.; Methodology, J.S.C., D.C. and K.V.; Software, J.S.C. and D.C.; Validation, J.S.C., D.C. and I.H.; Formal analysis, J.S.C., D.C. and S.V.; Investigation, J.S.C., D.C., C.C., P.C. and H.A.; Resources, J.S.C., S.V., M.A., H.A., K.V. and P.P.; Data curation, J.S.C., D.C. and S.V.; Writing—original draft preparation, J.S.C., D.C., H.A. and P.P.; Writing—review and editing, J.S.C., D.C. and K.V.; Visualization, J.S.C., D.C. and I.H.; Supervision, J.S.C. and P.P.; Project administration, J.S.C. and M.A.; Funding acquisition, J.S.C., D.C., S.V. and M.A.; All authors have read and agreed to the published version of the manuscript.

Funding

J.S.C. and M.A. received research support from the Fondo Interno de Investigación: Línea Investigación en Ciencia, Tecnología y Conocimiento (project FII-CTC-2306) of Universidad Viña del Mar. J.S.C. and D.C. were awarded funding through the InES I+D initiative of the Vicerrectoría de Investigación, Creación e Innovación at Pontificia Universidad Católica de Valparaíso (project PUCV TPI 02-INID230010). J.S.C. and S.V. were supported by ANID MSc scholarships (No. 22231615 and No. 22241938, respectively). Additionally, J.S.C. received funding from project ND-26, financed through the Tesis para Impactar el Territorio program by Nodo CIV-VAL, as well as from the Match Maker program of the Dirección General de Vinculación con el Medio at PUCV.

Data Availability Statement

The original contributions presented in this study are included in the article and Supplementary Material. Further inquiries can be directed to the corresponding author.

Acknowledgments

We would like to thank our assistants, Javiera Cortés, Constanza Gautier, Aanisa Amín, and Bastián Unamuno, for their dedicated contributions to the experimental and analytical work. We are also grateful to our laboratory interns, Antonella Carrillo, Áurea Chinchay, Rafaela Jara and Vicente Piwonka, for their valuable support throughout the course of this study. Finally, we acknowledge the generous collaboration of José Luis Céspedes, who kindly granted access to his field, enabling the realization of this research.

Conflicts of Interest

The authors declare no conflicts of interest.

Abbreviations

The following abbreviations are used in this manuscript:
°BxDegrees Brix (soluble solids)
AICAkaike information criterion
ANOVAAnalysis of variance
BBCHBBCH phenological scale
CIELab (L*, a*, b*)CIELab color coordinates
CVCoefficient of variation
ECElectrical conductivity
EMM(s)Estimated marginal mean(s)
ISE(s)Ion-selective electrode(s)
K+Potassium (ion)
LMM(s)Linear mixed-effects model(s)
LRTLikelihood ratio test
MRMLMost recently matured leaves
NO3Nitrate (ion)
PCAPrincipal component analysis
P-DMPPetiole dry matter percentage
R2m/R2cMarginal/conditional R-squared
SDStandard deviation
S-DMCSap dry matter content
S-DMPSap dry matter percentage
SEStandard error
Δ AICChange in AIC between models
ρ (rho)Spearman correlation coefficient

Appendix A

Figure A1. Devices used for sap extraction in this study. (a) Citrus squeezer; (b) Potato press; (c) Garlic press; (d) Juicer; (e) Garlic grinder.
Agronomy 15 02572 g0a1

Appendix B

Table A1. Model selection metrics and variance components for sap chemical parameters across extraction methods.
Parameterχ2 (EM)p-ValueReplicate SDResidual SDΔ AICLRT p-Value
pH398.46<0.0010.0520.062210.54<0.001
EC16.890.0020.5470.4088.510.002
NO3118.78<0.0019.1736.20485.88<0.001
K+11.850.0684.6383.5773.720.020
°Bx27.26<0.0010.1720.31318.00<0.001
Table A2. Sap color metrics (CIELab coordinates) across extraction methods.
MethodL* (Lightness)a* (Green-Red)b* (Blue-Yellow)
Citrus squeezer77.65−22.1667.97
Potato press81.57−22.9770.81
Garlic press81.57−22.9770.81
Juicer77.70−22.7270.89
Garlic grinder87.01−13.6642.53

References

  1. Gallardo, M.; Peña-Fleitas, M.T.; Padilla, F.M.; Cedeño, J.; Thompson, R.B. Prescriptive-Corrective Irrigation and Macronutrient Management in Greenhouse Soil-Grown Tomato Using the VegSyst-DSS v2 Decision Support Tool. Horticulturae 2023, 9, 1128. [Google Scholar] [CrossRef]
  2. Esteves, E.; Locatelli, G.; Bou, N.A.; Ferrarezi, R.S. Sap Analysis: A Powerful Tool for Monitoring Plant Nutrition. Horticulturae 2021, 7, 426. [Google Scholar] [CrossRef]
  3. Mahal, N.K.; Miguez, F.E.; Sawyer, J.E.; Dong, L.; Schnable, P.S.; Castellano, M.J. Stalk Sap Nitrate Test as a Potential Tool for Nitrogen Fertilizer Recommendations for Maize. Field Crops Res. 2024, 310, 109330. [Google Scholar] [CrossRef]
  4. Burns, I.G.; Hutsby, W. Development and Evaluation of Rapid Tests for the Estimation of Phosphate and Potassium in Plant Sap. Commun. Soil Sci. Plant Anal. 1984, 15, 1463–1480. [Google Scholar] [CrossRef]
  5. Rosen, C.J.; Errebhi, M. A Field Sap Test for Determining Petiole Nitrate-Nitrogen; University of Wisconsin-Madison: Madison, WI, USA, 1992. [Google Scholar]
  6. Thompson, R.B.; Fernández Fernández, M.M.; Cánovas Fernández, G.; Gallardo, M. Aplicaciones Prácticas de Sistemas de Análisis Rápido de Nutrientes Para Mejorar El Manejo Del Nitrógeno En Cultivos de Invernadero. In Mejora en la Eficiencia del Uso de Agua y Fertilizantes en Agricultura; Gázquez, J.C., Ed.; Cajamar Caja Rural: Almería, Spain, 2018; pp. 181–202. ISBN 978-84-95531-88-9. [Google Scholar]
  7. Olsen, J.; Lyons, D. Petiole Sap Nitrate is Better than Total Nitrogen in Dried Leaf for Indicating Nitrogen Status and Yield Responsiveness of Capsicum in Subtropical Australia. Aust. J. Exp. Agric. 1994, 34, 835–843. [Google Scholar] [CrossRef]
  8. Peña-Fleitas, M.T.; Gallardo, M.; Thompson, R.B.; Farneselli, M.; Padilla, F.M. Assessing Crop N Status of Fertigated Vegetable Crops Using Plant and Soil Monitoring Techniques. Ann. Appl. Biol. 2015, 167, 387–405. [Google Scholar] [CrossRef]
  9. Kremper, R.; Juhász, E.K.; Novák, T.; Kincses, I.; Sándor, Z.; Tállai, M.; Béni, Á.; Szabó, A.; Szarvas, S.; Balla Kovács, A. Assessment of Spring Oat Nitrogen Supply Based on Plant Sap Nitrate Concentration and SPAD Values. Nitrogen 2025, 6, 19. [Google Scholar] [CrossRef]
  10. de Almeida, L.H.C.; Fratoni, M.M.J.; Fregonezi, G.A.d.F.; Takahashi, H.W. Nutritional Assessment of Potassium in Tomato (Lycopersicon esculentum Mill.) by Direct Reading of Fruit Sap. Afr. J. Agric. Res. 2016, 11, 1245–1256. [Google Scholar] [CrossRef]
  11. Coltman, R.R. Sampling Considerations for Nitrate Quick Tests of Greenhouse-Grown Tomatoes. J. Am. Soc. Hort. Sci. 1987, 112, 922–927. [Google Scholar] [CrossRef]
  12. Panique, E.; Kelling, K.A.; Schulte, E.E. Establishment of Potassium Tissue and Sap Critical Values; University of Wisconsin-Madison: Madison, WI, USA, 1996. [Google Scholar]
  13. Yosoff, S.F.; Mohamed, M.T.M.; Parvez, A.; Ahmad, S.H.; Ghazali, F.M.; Hassan, H. Production System and Harvesting Stage Influence on Nitrate Content and Quality of Butterhead Lettuce. Bragantia 2015, 74, 322–330. [Google Scholar] [CrossRef]
  14. Buajaila, F.; Cowan, J.S.; Inglis, D.; Carpenter-Boggs, L.; Miles, C. Tomato Growth, Yield, and Quality Response to Mixed Chemical–Organic Fertilizers and Grafting Treatments in a High Tunnel Environment. Can. J. Plant Sci. 2022, 102, 33–48. [Google Scholar] [CrossRef]
  15. Rosolem, C.A.; Van Mellis, V. Monitoring Nitrogen Nutrition in Cotton. Rev. Bras. Ciênc. Solo 2010, 34, 1601–1607. [Google Scholar] [CrossRef]
  16. Hochmuth, G.J. Efficiency Ranges for Nitrate-Nitrogen and Potassium for Vegetable Petiole Sap Quick Tests. HortTechnology 1994, 4, 218–222. [Google Scholar] [CrossRef]
  17. Zhang, H.; Smeal, D.; Arnold, R.N.; Gregory, E.J. Potato Nitrogen Management by Monitoring Petiole Nitrate Level. J. Plant Nutr. 1996, 19, 1405–1412. [Google Scholar] [CrossRef]
  18. Lu, Q.; Miles, C.; Tao, H.; DeVetter, L. Evaluation of Real-Time Nutrient Analysis of Fertilized Raspberry Using Petiole Sap. Front. Plant Sci. 2022, 13, 918021. [Google Scholar] [CrossRef]
  19. Kurtz, C.; Pauletti, V.; Gervini de Menezes, F.O., Jr.; Mora, C. Diagnóstico de Nitrogênio Pelo Índice de Clorofila e Nitrato na Seiva para Cebola em Sistema de Semeadura Direta. Revista Thema 2022, 21, 92–114. [Google Scholar] [CrossRef]
  20. Dong, Z.; Liu, Y.; Li, M.; Ci, B.; Feng, X.; Wen, S.; Lu, X.; He, Z.; Ma, F. Establishment of an NPK Nutrient Monitor System in Yield-Graded Cotton Petioles under Drip Irrigation. Plant Methods 2023, 19, 97. [Google Scholar] [CrossRef] [PubMed]
  21. Rodríguez, A.; Peña-Fleitas, M.T.; Padilla, F.M.; Gallardo, M.; Thompson, R.B. Effect of Cultivar on Measurements of Nitrate Concentration in Petiole Sap and Leaf N Content in Greenhouse Soil-Grown Cucumber, Melon, and Sweet Pepper Crops. Sci. Hortic. 2023, 320, 112200. [Google Scholar] [CrossRef]
  22. Ikeda, H.; Urushima, M.; Oi, S.; Toi, K.; Oka, J.; Inubushi, Y.; Moriyama, T.; Wada, T. Diagnosis and Recommendation Integrated System by Sap Analysis for Horticultural Crops (Part 1): A Study on the Standardization of Preparing Samples for Analysis. Hort. J. 1998, 6, 413–419. [Google Scholar] [CrossRef]
  23. Nagarajah, S. A Petiole Sap Test for Nitrate and Potassium in Sultana Grapevines. Aust. J. Grape Wine Res. 1999, 5, 56–60. [Google Scholar] [CrossRef]
  24. Matthäus, D.; Gysi, C. Plant-Sap Analysis in Vegetables—A Tool to Decide on Nitrogen Top Dressing. Acta Hortic. 2001, 563, 93–102. [Google Scholar] [CrossRef]
  25. Castellanos, J.Z.; Ojodeagua, J.L. Manejo de La Fertirrigación Del Tomate de Invernadero En Suelo. In Manual de Producción de Tomate en Invernadero; Castellanos, J.Z., Ed.; Instituto de Tecnología Agrícola: Celaya, Mexico, 2009; pp. 187–204. [Google Scholar]
  26. Llanderal, A.; García-Caparrós, P.; Contreras, J.I.; Segura, M.L.; Lao, M.T. Evaluation of the Nutrients Variability in Sap of Different Petiole Samples in Tomato Plant. Commun. Soil Sci. Plant Anal. 2018, 49, 745–750. [Google Scholar] [CrossRef]
  27. Mota, M.; Martins, M.J.; Sprey, L.; Maurício, A.; Rosa, C.; Faria, J.; Martins, M.B.; De Sousa, M.L.; Santos, R.; De Sousa, R.M.; et al. Analysis of Petiole Sap Nutrients Using Rapid and Standard Methods and Its Relation to Leaf Analysis of Fertilized Malus domestica cv. Gala. Horticulturae 2023, 10, 36. [Google Scholar] [CrossRef]
  28. Thompson, T.L.; Kubota, A.; Doerge, T.A.; Godin, R.E.; McCreary, T.W. Petiole Sap Nitrate Tests for Determining Nitrogen Status of Broccoli and Cauliflower. Veg. Res. 1996, 104, 217–225. [Google Scholar]
  29. Altland, J.E.; Gilliam, C.H.; Keever, G.J.; Sibley, J.L.; Fare, D.C. Rapid Determination of Nitrogen Status in Potted Pansy Production©. In Combined Proceedings-International Plant Propagators Society; International Plant Propagators’ Society (IPPS): Chipley, FL, USA, 2001; Volume 51, pp. 558–563. [Google Scholar]
  30. Roacho-Cortés, E.; Castellanos Ramos, J.Z.; Etchevers-Barra, J.D. Técnicas de Diagnóstico En Campo Para Determinar Nitrógeno En Maíz. Terra Latinoam. 2021, 39, e820. [Google Scholar] [CrossRef]
  31. Benavides-Mendoza, A.; De Alba Romenus, K.; León De La Rocha, J.F.; Narváez Ortiz, W.A.; Francisco Francisco, N. Ionic Sufficiency of the Nutrient Solution and Effects on the Total Soluble Solid’s Concentration in Mini Tomatoes. Nova Sci. 2022, 14, 1–11. [Google Scholar] [CrossRef]
  32. Pantoja-Benavides, A.D.; Garces-Varon, G.; Restrepo-Díaz, H. Foliar Cytokinins or Brassinosteroids Applications Influence the Rice Plant Acclimatization to Combined Heat Stress. Front. Plant Sci. 2022, 13, 983276. [Google Scholar] [CrossRef] [PubMed]
  33. Santa Cruz, J.; Calbucheo, D.; Valdebenito, S.; Vásquez, V.; Aguilar, M.; Peñaloza, P.; Allendes, H.; Vidal, K. Forgotten Science: How 1900s Studies Challenge the Current Research on Sap Analysis. Int. Agric. Biol. Eng. 2025, 18, 317–318. [Google Scholar] [CrossRef]
  34. Rosen, C.J.; Eliason, R. Nutrient Management for Commercial Fruit & Vegetable Crops in Minnesota; University of Minnesota Extension Service: Minneapolis, MN, USA, 2005; 40p. [Google Scholar]
  35. Schulbach, K.; Smith, R.; Hartz, T.K.; Jackson, L. Guide to Nitrogen Quick-Test for Vegetables with the “Cardy” Nitrate Meter; California Department of Food and Agriculture: Sacramento, CA, USA, 2007. [Google Scholar]
  36. Havlin, J.L.; Tisdale, S.L.; Nelson, W.L.; Beaton, J.D. Soil Fertility and Fertilizers. An Introduction to Nutrient Management, 8th ed.; Pearson India: Tamil Nadu, India, 2017; 520p, ISBN 978-93-325-8603-1. [Google Scholar]
  37. Hartz, T.K.; Smith, R.; Schulbach, K.; LeStrange, M. On-Farm Nitrogen Tests Improve Fertilizer Efficiency, Protect Groundwater. Calif. Agric. 1994, 48, 29–32. [Google Scholar] [CrossRef]
  38. Kubota, A.; Thompson, T.L.; Doerge, T.A.; Godin, R.E. A Petiole Sap Nitrate Test for Broccoli. J. Plant Nutr. 1997, 20, 669–682. [Google Scholar] [CrossRef]
  39. Castellanos, J.Z.; Villalobos, S.; Delgado, J.A.; Muñoz-Ramos, J.; Sosa, A.; Vargas, P.; Lazcano, I.; Alvarez-Sanchez, E.; Enriquez, S.A. Use of Best Management Practices to Increase Nitrogen Use Efficiency and Protect Environmental Quality in a Broccoli-Corn Rotation of Central Mexico. Commun. Soil Sci. Plant Anal. 2001, 32, 1265–1292. [Google Scholar] [CrossRef]
  40. Meesters, C.; Cialdella, L.; Ingels, R.; Jacquemyn, H.; Lievens, B. Cultivar-Dependent Effects of Plant-Beneficial Fungi on Plant Nutrient Composition and Feeding Damage by Nesidiocoris tenuis. Plant Soil 2023, 492, 177–190. [Google Scholar] [CrossRef]
  41. Studstill, D.W.; Simonne, E.H.; Hutchinson, C.M.; Hochmuth, R.; Dukes, M.D.; Davis, W.E. Petiole Sap Testing Sampling Procedures for Monitoring Pumpkin Nutritional Status. Commun. Soil Sci. Plant Anal. 2003, 34, 2355–2362. [Google Scholar] [CrossRef]
  42. Castellanos, J.Z. Nutrición de Cultivos Bajo Sistemas de Fertigación. Inf. Agronómicas 1999, 35, 5–11. Available online: https://es.scribd.com/document/258134428/Nutricion-de-cultivos-pdf (accessed on 30 September 2025).
  43. Sonneveld, C.; De Bes, S.S. Relationship between Analytical Data of Plant Sap and Dried Material of Glasshouse Crops. Commun. Soil Sci. Plant Anal. 1983, 14, 75–87. [Google Scholar] [CrossRef]
  44. Papastylianou, I. Diurnal Variation of Nitrate Concentration in Cereals Grown under Rainfed Mediterranean Conditions. Commun. Soil Sci. Plant Anal. 1995, 26, 1121–1131. [Google Scholar] [CrossRef]
  45. Sánchez-García, P.; Molinos, C.; Alcántar-González, G.; Sandoval-Villa, M. Diagnóstico Nutrimental En Plantas. In Nutrición de Cultivos; Alcántar-González, G., Trejo-Téllez, L.I., Gómez-Merino, F.C., Eds.; Colegio de Postgraduados y Mundi-Prensa: Texcoco, Mexico, 2016; pp. 183–217. Available online: https://es.scribd.com/document/537956120/Nutricion-vegetal-1 (accessed on 30 September 2025).
  46. Delgado, J.A.; Follett, R.F. Sap Test to Determine Nitrate-nitrogen Concentrations in Aboveground Biomass of Winter Cover Crops. Commun. Soil Sci. Plant Anal. 1998, 29, 545–559. [Google Scholar] [CrossRef]
  47. Cadahía López, C. El Análisis de Savia Como Índice de Fertilización En Tomate. Ph.D. Thesis, Universidad Complutense de Madrid, Madrid, Spain, 1964. [Google Scholar]
  48. Justes, E.; Meynard, J.M.; Mary, B.; Plénet, D. Diagnosis Using Stem Base Extract: JUBIL Method. In Diagnosis of the Nitrogen Status in Crops; Lemaire, G., Ed.; Springer: Berlin/Heidelberg, Germany, 1997; pp. 163–187. ISBN 978-3-642-64506-8. [Google Scholar]
  49. Williams, C.M.J.; Maier, N.A. Use of Petiolar Sap Nitrate for Assessing Nitrogen Status of Irrigated Brussel Sprout Crops. J. Plant Nutr. 2002, 25, 1291–1301. [Google Scholar] [CrossRef]
  50. Farneselli, M.; Simonne, E.H.; Studstill, D.W.; Tei, F. Washing and/or Cutting Petioles Reduces Nitrate Nitrogen and Potassium Sap Concentrations in Vegetables. J. Plant Nutr. 2006, 29, 1975–1982. [Google Scholar] [CrossRef]
  51. Valdebenito, S.; Rubio, A.; Moller, A.; Santa Cruz, J.; Castillo, P.; Providell, M.L.; Cáceres, C.; Calbucheo, D.; Hernández, I.; Peñaloza, P. Histological and Immunolabeling Techniques in Arabidopsis thaliana: A Practical Guide and Standardization Roadmap. Agronomy 2025, 15, 2357. [Google Scholar] [CrossRef]
  52. Darricarrere, V.; Santa Cruz, J.; Calbucheo, D.; Valdebenito, S.; Providell, M.; Cisternas, M.; Muena, V.; Peñaloza, P. Storage-Induced Fruit Breakdown in Cryptocarya alba: Implications for the Conservation of a Keystone Mediterranean Recalcitrant Species. Plants 2025, 14, 3307. [Google Scholar] [CrossRef]
  53. Peña-Fleitas, M.T.; Grasso, R.; Gallardo, M.; Padilla, F.M.; De Souza, R.; Rodríguez, A.; Thompson, R.B. Sample Temperature Affects Measurement of Nitrate with a Rapid Analysis Ion Selective Electrode System Used for N Management of Vegetable Crops. Agronomy 2022, 12, 3031. [Google Scholar] [CrossRef]
  54. Wilczyński, K.; Kobus, Z.; Dziki, D. Effect of Press Construction on Yield and Quality of Apple Juice. Sustainability 2019, 11, 3630. [Google Scholar] [CrossRef]
  55. Kobus, Z.; Nadulski, R.; Anifantis, A.S.; Santoro, F. Effect of Press Construction on Yield of Pressing and Selected Quality Characteristics of Apple Juice. ERDev 2018, 53, 652–657. [Google Scholar] [CrossRef]
  56. Díaz-Vázquez, F.A.; Sandoval-Rangel, A. Influencia del Acolchado y Gallinaza en Producción de Tomate Silvestre (Solanum lycopersicum var. cerasiforme (Dunal)). Ecosistemas Recur. Agropecu. 2023, 10, e3605. [Google Scholar] [CrossRef]
  57. Benavides-Mendoza, A.; De Alba-Romenus, K.; Francisco-Francisco, N. Relation between Soil Solution Composition and Petiole Cellular Extract of Crops in Western Mexico. Terra Latinoam. 2021, 39, e873. [Google Scholar] [CrossRef]
  58. Ugarte-Barco, F.A.; Zhiñin-Huachun, I.A.; Hernández-Pérez, R. Influencia de Bioestimulantes Sobre Caracteres Morfológicos y Agroquímicos del Banano (Musa AAA cv. Williams). Terra Latinoam. 2022, 40, e1456. [Google Scholar] [CrossRef]
  59. Gruener, C.E. Determination of Critical Y-Leaf-Potassium Concentrations across Reproductive Growth Stages for Direct-Seeded Delay-Flooded Rice. Master’s Thesis, University of Arkansas, Fayetteville, NC, USA, 2020. [Google Scholar]
  60. Padilla, W. Guía de Interpretación de Análisis de ECP. In Respuesta del Brócoli (Brassica oleracea var. italica) Híbrido Fantástico a la Fertilización con Cinco Fuentes de Azufre Aplicadas a Dos Dosis, Mulaló, Cotopaxi; Sánchez Ayala, B.L., Ed.; UCE: Quito, Ecuador, 2013; Available online: https://www.dspace.uce.edu.ec/entities/publication/ffb7a914-2034-4383-b651-201fc6ea2f02 (accessed on 30 September 2025).
  61. Ankerman, D.; Large, R. Agronomy Handbook; Fall 2019 Edition; Midwest Laboratories: Omaha, NE, USA, 2019; 132p. [Google Scholar]
  62. Billman, E.D.; Soder, K.J.; Horst, J.; Hafla, A.; Balk, K. Validation of Brix for Predicting Sugar Concentrations of Alfalfa and Orchardgrass. Appl. Anim. Sci. 2024, 40, 437–445. [Google Scholar] [CrossRef]
  63. Takenaka, M.; Nanayama, K.; Isobe, S.; Ozaki, K.; Miyagi, K.; Sumi, H.; Toume, Y.; Morine, S.; Ohta, H. Effect of Extraction Method on Yield and Quality of Citrus depressa Juice. Food. Sci. Technol. Int. 2007, 13, 281–285. [Google Scholar] [CrossRef]
  64. Llanderal, A.; García-Caparrós, P.; Segura, M.L.; Contreras, J.I.; Lao, M.T. Nutritional Changes in Petiole Sap over Space and Time in a Tomato Crop Greenhouse. J. Plant Nutr. 2019, 42, 1205–1217. [Google Scholar] [CrossRef]
  65. Padilla, W.; Saritama, A.S. El Análisis Del Extracto Celular de La Planta de Banano Como Herramienta Para Identificar Potenciales Problemas de Producción. 2008. Available online: https://es.scribd.com/document/623804296/Washington-Padilla-El-Extracto-Celular-en-Banano (accessed on 30 September 2025).
  66. Wilczyński, K.; Kobus, Z.; Guz, T. Analysis of Efficiency and Particles Size Distribution in Apple Juice Obtained with Different Methods. J. Res. Appl. Agric. Eng. 2018, 63, 140–143. [Google Scholar]
  67. Williams, C.M.J.; Maier, N.A. Determination of the Nitrogen Status of Irrigated Potato Crops: II. A Simple on Farm Quick Test for Nitrate-nitrogen in Petiole Sap. J. Plant Nutr. 1990, 13, 985–993. [Google Scholar] [CrossRef]
  68. Lemaire, G.; Tang, L.; Bélanger, G.; Zhu, Y.; Jeuffroy, M.-H. Forward New Paradigms for Crop Mineral Nutrition and Fertilization towards Sustainable Agriculture. Eur. J. Agron. 2021, 125, 126248. [Google Scholar] [CrossRef]
  69. Pappelis, A.J. Nature of Resistance to Diplodia Stalk Rot of Corn. Ph.D. Thesis, Iowa State College, Ames, IA, USA, 1957. [Google Scholar]
  70. Di Gioia, F.; Simonne, E.H.; Gonnella, M.; Santamaria, P.; Gazula, A.; Sheppard, Z. Assessment of Ionic Interferences to Nitrate and Potassium Analyses with Ion-Selective Electrodes. Commun. Soil Sci. Plant Anal. 2010, 41, 1750–1768. [Google Scholar] [CrossRef]
  71. Silva-Pumarada, G.; Di Gioia, F. Assessing the Reliability of Portable Ion-Selective Electrodes Proposed for the on-Farm Management of Nutrient Solutions and Fertigation of Horticultural Crops. Acta Hortic. 2023, 1377, 801–808. [Google Scholar] [CrossRef]
  72. Chareo-Benítez, I.; Yam-Tzec, J.A.; Ramírez-Seañez, A.R.; Gutiérrez-Hernández, J.O.; Hernández-Hernández, H. Application of Two Levels of Calcium Nitrate on Sap Nutrients, Growth and Yield of Persian Cucumber. Trop. Subtrop. Agroecosyst. 2024, 27, 13. [Google Scholar] [CrossRef]
  73. Pettinger, N.A. The Expressed Sap of Corn Plants as an Indicator of Nutrient Needs. J. Agric. Res. 1931, 43, 95–119. [Google Scholar]
  74. Chrudimsky, W.W. A Study of the Influence of Nitrogen, Phosphorus and Potassium Concentrations. Master’s Thesis, Oklahoma State University, Stillwater, OK, USA, 1969. Available online: https://es.scribd.com/document/939759975/Chrumdimsky-1963-A-Study-of-the-Influence-of-Nitrogen-Phosphorous-and-Potassium-Concentrations?_gl=1*12vtab*_gcl_au*MTg0NDIzOTQ3OC4xNzYxNjc3MzkyLjE5OTEzOTk3My4xNzYxNjg0MTkxLjE3NjE2ODQxOTA (accessed on 30 September 2025).
  75. Rangel-Lucio, J.A.; Alcántar González, G.; Castellanos, R.; García-Moya, E.; Trejo López, C.; Vaquera Huerta, H. Comparación de Dos Pruebas Para Diagnosticar Nitrógeno En Sorgo. Terra Latinoam. 2002, 20, 383–390. [Google Scholar]
  76. Peuke, A.D. Correlations in Concentrations, Xylem and Phloem Flows, and Partitioning of Elements and Ions in Intact Plants. A Summary and Statistical Re-Evaluation of Modelling Experiments in Ricinus communis. J. Exp. Bot. 2010, 61, 635–655. [Google Scholar] [CrossRef]
  77. Shah, I.H.; Jinhui, W.; Li, X.; Hameed, M.K.; Manzoor, M.A.; Li, P.; Zhang, Y.; Niu, Q.; Chang, L. Exploring the Role of Nitrogen and Potassium in Photosynthesis Implications for Sugar: Accumulation and Translocation in Horticultural Crops. Sci. Hortic. 2024, 327, 112832. [Google Scholar] [CrossRef]
  78. Hodges, S.C.; Baker, S. Correlation of Plant Sap Extracts of Nitrate-N and K with Dried Petiole Extracts. In Proceedings of the Beltwide Cotton Conferences, New Orleans, LA, USA, 10–14 January 1993. [Google Scholar]
  79. Taurayi, S. An Investigation of Natuurboerdery (Natural Farming) Approach: A ZZ2 Case Study. Master’s Thesis, Stellenbosch University, Stellenbosch, South Africa, 2011. [Google Scholar]
  80. Santa Cruz, J.; Calbucheo, D.; Valdebenito, S.; Cortés, J.; Gautier, C.; Amín, A.; Hernández, I.; Allendes, H.; Peñaloza, P. Inter-Day Instability in Plant Sap Composition Undermines Single-Day Diagnostics. Agronomy 2025, 15, 2509. [Google Scholar] [CrossRef]
Figure 1. (af) Schematic workflow for sample collection and handling used in this study.
Agronomy 15 02572 g001
Figure 2. Anatomical integrity of petiole tissue under different sap extraction methods. (a) Representative transverse section prior to sap extraction; (be) Partial detachment of vascular bundles and localized parenchymal damage induced by low-impact methods, shown in increasing order of severity; (f) Fragmentation of epidermal and cortical tissues following the use of a garlic press; (g) Linear cuts caused by the high-speed blades of the juicer; (h) Severe parenchymal disintegration resulting from invasive mechanical disruption; (i) Vascular bundles preserved after sap extraction with low-impact methods, indistinguishable from unprocessed tissue; (jl) Typical xylem damage induced by juicer and garlic grinder extraction, shown in transverse (j) and longitudinal views (k,l). Images are shown at three different size scales, corresponding to (ah), (ik), and (l).
Agronomy 15 02572 g002
Figure 3. Visual summary of sap chemical parameters across extraction methods. (a) EMM ± SE; (b) Violin plots of raw data distribution.
Agronomy 15 02572 g003
Figure 4. Spearman correlation matrices among sap traits. Results are shown for the overall dataset (“All methods”) and for each extraction method individually. Color intensity represents the strength and direction of the correlations (red = positive; blue = negative), with only statistically significant associations displayed (p < 0.05; ns = non-significant).
Agronomy 15 02572 g004
Figure 5. PCA biplot of traits across extraction methods. Arrows represent the loading vectors of each variable on the first two principal components. Colored symbols denote individual samples by method, with ellipses indicating the 95% confidence region. Group centroids are shown as enlarged symbols.
Agronomy 15 02572 g005
Figure 6. Relationships between measured sap EC and predicted EC based on NO3 and K+ concentrations across extraction methods. Significant linear regression lines (p < 0.05) with 95% confidence intervals (shaded ribbons) are shown for each method individually, as well as for the overall dataset (“All methods”). For the second, the regression line corresponds to the predicted trends from the full mixed-effects model. Regression coefficients (β), significance levels (p), and R2 values—marginal and conditional where applicable—are reported within each panel.
Agronomy 15 02572 g006
Figure 7. Relationships between K+ concentration and °Bx in sap across extraction methods.
Agronomy 15 02572 g007
Figure 8. Relationships between P-DMP and S-DMP across extraction methods.
Agronomy 15 02572 g008
Figure 9. Relationships between S-DMP and chemical parameters. Predicted trends from the mixed-effects models (blue lines) and their 95% confidence intervals (shaded ribbons) are shown.
Agronomy 15 02572 g009
Table 1. Descriptive and distributional statistics of sap chemical parameters across extraction methods.
ParameterMethodEMM ± SESDCI 95%RangeCV (%)Shapiro–WilkSkewnessKurtosis
pHCitrus squeezer6.31 ± 0.01 (c)0.09[6.29, 6.34][6.14, 6.62]1.48 (e)0.1960.6383.726
Potato press6.26 ± 0.01 (b)0.08[6.24, 6.28][6.10, 6.41]1.22 (c)0.5810.0042.192
Garlic press6.22 ± 0.01 (a)0.07[6.20, 6.24][6.08, 6.36]1.06 (a)0.261−0.1972.428
Juicer6.44 ± 0.01 (d)0.09[6.42, 6.47][6.26, 6.66]1.34 (d)0.5620.1812.523
Garlic grinder6.24 ± 0.01 (ab)0.07[6.22, 6.26][6.10, 6.36]1.12 (b)0.075−0.0891.887
Mean6.29 ± 0.01 1.24 (A)
EC
(dS m−1)
Citrus squeezer9.48 ± 0.10 (a)0.56[9.31, 9.64][8.36, 10.88]5.85 (a)0.7290.3552.885
Potato press9.58 ± 0.10 (ab)0.71[9.38, 9.79][7.93, 11.74]7.35 (d)0.2600.2673.831
Garlic press9.45 ± 0.10 (a)0.64[9.27, 9.64][8.30, 11.08]6.69 (c)0.2380.4932.579
Juicer9.65 ± 0.10 (ab)0.84[9.40, 9.89][6.48, 11.82]8.41 (e)0.010−0.9186.237
Garlic grinder9.74 ± 0.10 (b)0.63[9.56, 9.93][8.22, 11.10]6.33 (b)0.849−0.0282.990
Mean9.58 ± 0.10 6.94 (B)
NO3
(mmol L−1)
Citrus squeezer54.67 ± 1.60 (a)10.05[51.75, 57.59][33.87, 80.65]18.05 (b)0.0590.6173.497
Potato press56.65 ± 1.60 (ab)10.09[53.72, 59.58][33.87, 85.48]17.46 (a)0.4270.2033.634
Garlic press59.03 ± 1.60 (b)10.88[56.14, 62.53][38.71, 83.87]18.13 (b)0.2920.3312.799
Juicer65.22 ± 1.60 (c)12.45[61.61, 68.84][37.10, 93.55]18.81 (c)0.7000.1982.894
Garlic grinder65.26 ± 1.60 (c)11.58[61.89, 68.62][38.71, 98.39]17.49 (a)0.6970.2303.522
Mean60.17 ± 1.60 17.98 (C)
K+
(mmol L−1)
Citrus squeezer64.62 ± 0.87 (a)5.33[63.02, 66.22][53.71, 76.72]8.13 (b)0.0280.2972.581
Potato press66.16 ± 0.87 (a)5.76[64.42, 67.89][53.71, 79.28]8.61 (c)0.6160.0832.661
Garlic press64.43 ± 0.87 (a)6.48[62.55, 66.49][53.71, 81.84]9.95 (e)0.0250.7063.709
Juicer65.76 ± 0.87 (a)6.47[63.81, 67.70][53.71, 79.28]9.75 (d)0.1790.2442.393
Garlic grinder66.50 ± 0.87 (a)5.14[64.95, 68.04][58.82, 76.73]7.56 (a)0.0310.2882.349
Mean65.50 ± 0.87 8.74 (B)
Bx
(°)
Citrus squeezer4.87 ± 0.05 (a)0.39[4.76, 4.99][3.80, 6.40]7.75 (d)<0.0010.9647.539
Potato press4.96 ± 0.05 (a)0.32[4.84, 5.04][4.00, 5.60]6.42 (c)0.029−0.6304.136
Garlic press4.96 ± 0.05 (a)0.30[4.86, 5.04][4.20, 5.60]6.04 (a)0.675−0.2172.992
Juicer4.97 ± 0.05 (a)0.42[4.85, 5.09][3.40, 6.00]8.26 (e)<0.001−1.3856.994
Garlic grinder5.19 ± 0.05 (b)0.33[5.09, 5.28][4.70, 6.60]6.23 (b)<0.0011.7238.303
Mean4.99 ± 0.05 6.94 (B)
Lowercase letters within the same parameter indicate significant differences in EMMs and bootstrapped coefficients of variation (CV) among extraction methods (p < 0.05). Uppercase letters denote significant differences in CV among chemical parameters (p < 0.05). Shapiro–Wilk p-values assess overall normality: p > 0.05 indicates no significant deviation from a normal distribution. Skewness quantifies distributional shape: values near 0 indicate symmetry, positive values indicate right-skewness (a longer tail to higher values), and negative values indicate left-skewness (a longer tail to lower values). Kurtosis reflects tail heaviness relative to a normal distribution, where values around 3 are considered normal (mesokurtic); >3 indicates heavier tails (leptokurtic), while <3 indicates flattened distributions (platykurtic). Overall means are unadjusted and provided for reference only.
Table 2. EMM ± SE of sap physical parameters across extraction methods.
MethodYield (µL g−1)S-DMP (%)S-DMC (mg mL−1)
Citrus squeezer72.58 ± 8.02 (a)4.79 ± 0.12 (a)56.52 ± 1.77 (a)
Potato press138.91 ± 8.02 (b)5.00 ± 0.12 (ab)59.65 ± 1.77 (ab)
Garlic press234.63 ± 8.02 (c)5.04 ± 0.12 (ab)58.05 ± 1.77 (ab)
Juicer213.22 ± 8.02 (c)4.96 ± 0.12 (ab)60.76 ± 1.77 (ab)
Garlic grinder236.45 ± 8.02 (c)5.30 ± 0.12 (b)64.10 ± 1.77 (b)
Mean179.16 ± 5.465.02 ± 0.0659.28 ± 1.02
Lowercase letters within the same parameter indicate significant differences in EMMs among extraction methods (p < 0.05). Overall means are unadjusted and provided for reference only.
Disclaimer/Publisher’s Note: The statements, opinions and data contained in all publications are solely those of the individual author(s) and contributor(s) and not of MDPI and/or the editor(s). MDPI and/or the editor(s) disclaim responsibility for any injury to people or property resulting from any ideas, methods, instructions or products referred to in the content.