Abstract
To address the limitations of traditional cotton leaf nitrogen content estimation methods, which include low efficiency, high cost, poor portability, and challenges in vegetation index acquisition owing to environmental interference, this study focused on emerging non-destructive nutrient estimation technologies. This study proposed an innovative method that integrates multi-color space fusion with deep and machine learning to estimate cotton leaf nitrogen content using smartphone-captured digital images. A dataset comprising smartphone-acquired cotton leaf images was processed through threshold segmentation and preprocessing, then converted into RGB, HSV, and Lab color spaces. The models were developed using deep-learning architectures including AlexNet, VGGNet-11, and ResNet-50. The conclusions of this study are as follows: (1) The optimal single-color-space nitrogen estimation model achieved a validation set R2 of 0.776. (2) Feature-level fusion by concatenation of multidimensional feature vectors extracted from three color spaces using the optimal model, combined with an attention learning mechanism, improved the validation R2 to 0.827. (3) Decision-level fusion by concatenating nitrogen estimation values from optimal models of different color spaces into a multi-source decision dataset, followed by machine learning regression modeling, increased the final validation R2 to 0.830. The dual fusion method effectively enabled rapid and accurate nitrogen estimation in cotton crops using smartphone images, achieving an accuracy 5–7% higher than that of single-color-space models. The proposed method provides scientific support for efficient cotton production and promotes sustainable development in the cotton industry.
1. Introduction
Cotton is an important economic crop worldwide that contributes to the textile industry and agricultural economy [1]. Nitrogen, a key nutrient regulating cotton growth and development, directly influences leaf photosynthetic efficiency, biomass accumulation, and final yield [2]. Therefore, accurately monitoring nitrogen content in cotton plants is crucial to achieve high-yield cultivation [3]. However, traditional nitrogen monitoring methods exhibit notable limitations: visual estimation is highly subjective with error rates ranging from 30% to 40% [4]; chemical titration is labor-intensive and destroys samples [5]. Additionally, specialized instruments, despite their precision, are associated with high costs, operational complexity, and sensitivity to field environmental conditions [6]. In contrast, digital image-based monitoring technology has emerged as a potential solution for precise nitrogen assessment in cotton, providing non-contact detection, operational simplicity, and cost-effectiveness [7]. Recent advancements predominantly integrate digital imaging with deep learning to enable non-destructive crop nutrient monitoring. The rapid development of smartphone camera technology has considerably enhanced the accessibility of high-resolution imaging devices, establishing a robust hardware foundation for rapid field diagnostics.
Nutrient deficiencies in crops result in sequential physiological responses in leaf color, texture, and morphology. Nitrogen deficiency inhibits chlorophyll synthesis, leading to leaf chlorosis, while excessive accumulation causes dark-green leaves and canopy closure [8]. Digital images capture these subtle chromatic variations using RGB three-channel data, enabling quantitative nutrient status evaluation through algorithmic analysis. For example, ref. [9] developed a cotton nitrogen inversion model using unmanned aerial vehicle (UAV) imagery, achieving R2 = 0.80 precision. Similarly, ref. [10] effectively estimated rice nitrogen nutrition indices across various growth stages using UAV-RGB images and six machine learning algorithms (R2 = 0.88–0.96). However, single RGB images inherently limit the extraction of nitrogen-sensitive features owing to restricted visible spectral information. Consequently, data fusion techniques have gained prominence in agricultural monitoring. Integrating multidimensional information sources enhances the comprehensiveness and accuracy of crop assessments [11]. Recent studies demonstrate progress in this domain: [12] improved cotton nitrogen monitoring precision by fusing hyperspectral, chlorophyll fluorescence, and digital image data through feature-level, decision-level, and hybrid fusion models. Ref. [13] enhanced maize yield prediction by combining optical image features with spectral vegetation indices. Ref. [14] achieved superior summer maize leaf nitrogen estimation using UAV-RGB-derived plant height, canopy coverage, and vegetation indices compared to those of single-data approaches. However, multi-sensor fusion systems need complex instrumentation and data acquisition processes, hindering practical field applications that require portability and rapid diagnostics. With the widespread popularity of smartphones, research on crop estimation using smartphone cameras has become an important branch in the field of precision and digital agriculture. Ref. [15] proposed an image-based method for estimating SPAD values and chlorophyll concentrations using smartphones, and the method exhibited favorable performance. The results showed that the image-based method could predict SPAD values with an error within ±1.2 units of mean absolute error (MAE), while the error in chlorophyll concentration estimation was within 7.2% of mean absolute percentage error (MAPE) relative to laboratory results. Ref. [16] combined convolutional neural networks (CNNs) with shallow machine learning methods to achieve the prediction of above-ground biomass (AGB) of pearl millet using smartphone cameras. Ref. [17] demonstrated that RGB imaging cameras of smartphones can be applied to assess whether the fresh weight of green and red lettuce can be predicted through leaf color (i.e., green intensity measured via RGB) under different fertilizer treatments. These studies indicate that farmers and practitioners can utilize smartphones as a non-destructive method for diagnosing and estimation crop nutritional status.
Emerging deep-learning technologies provide innovative solutions for multi-source data fusion. Convolutional neural networks (CNNs) autonomously extract hierarchical features to capture nonlinear relationships between target parameters and different color spaces. Notably, HSV and Lab color spaces demonstrate enhanced analytical capabilities for luminance-sensitive regions and human visual perception differences, respectively. Consequently, color space conversion alone facilitates the extraction of multidimensional features necessary for fusion. For example, in marine resource measurement, ref. [18] achieved superior underwater image quality by combining RGB and HSV features. Attention mechanism-based feature fusion strategies amplify critical color channel contributions. This single-image-source multidimensional analysis approach eliminates multi-sensor complexity while employing deep networks to uncover implicit color-nutrient correlations, providing theoretical support for portable estimation system development.
This study addresses the challenge of balancing operational simplicity and accuracy in cotton leaf nitrogen content estimation by employing smartphone-captured digital images as the primary data source. After basic preprocessing, multi-color-space fusion techniques were implemented to (1) select optimal models (AlexNet, VGGNet-11, and ResNet-50) for individual color spaces (RGB, HSV, and L*a*b*), (2) concatenate feature vectors from these models with attention mechanisms for feature-level fusion, and (3) perform decision-level fusion by integrating predictions from single-space models into multi-source datasets. This approach aims to achieve precise and convenient nitrogen estimation through smartphone imaging, attaining the dual objectives of operational accessibility and measurement accuracy.
2. Materials and Methods
2.1. Experimental Design
The field experiment was conducted at the Shihezi University Experimental Farm (85°59′41″ E, 44°19′54″ N) in Xinjiang, China. The cotton cultivar “Xinluzao 53,” a locally dominant variety, was cultivated under five nitrogen application levels: N0 (0 kg/ha), N1 (120 kg/ha), N2 (240 kg/ha), N3 (360 kg/ha), and N4 (480 kg/ha). Urea (46% nitrogen) was drip-applied throughout the growth cycle, supplemented with phosphorus and potassium fertilizers (monopotassium phosphate) at 150 kg/ha. The planting pattern followed a “one film, three drip tapes, six rows” configuration with 10 cm + 66 cm + 10 cm plant spacing. Each nitrogen treatment was replicated three times across 15 plots (150 m2 each) arranged in a randomized block design. Protective rows surrounded all plots, and field management followed local high-yield cultivation practices.
2.2. Leaf Image Acquisition
All cotton plants were measured at 10-day intervals starting from the squaring stage. Three representative plants with uniform growth were randomly selected from each experimental plot for digital image acquisition and destructive sampling, and finally 374 original images of cotton leaves and the corresponding samples were obtained. A custom-designed leaf imaging auxiliary chamber (Figure 1) was employed to ensure portable and non-destructive image collection when collecting image data. This light-controlled chamber eliminates interference from ambient light, background variations, and shooting angles on leaf color characteristics while preserving sample integrity. A customized ColorChecker Classic 24 color card was integrated for image color standardization, mitigating RGB color deviations caused by uneven illumination intensity. This calibration module can be embedded into the estimation system to enhance model generalizability across environmental conditions and smartphone models.
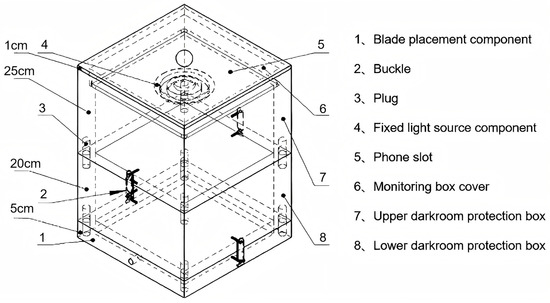
Figure 1.
Leaf imaging chamber schematic.
The operational protocol included the following steps: Opening the hinged base to position the color card or leaf on a black platform. Aligning leaf petioles with soft sponge apertures in the mold. Closing the chamber and activating the ring-shaped LED illumination. Capturing images using an iPhone 14 Pro Max (48 MP rear camera) fixed in a dedicated slot. All images were stored as JPEG files (Figure 2).

Figure 2.
Color-calibrated leaf image examples.
2.3. Image Preprocessing
During the dataset acquisition of cotton leaf images, the imaging chamber-assisted capture resulted in raw images where cotton leaves occupied a limited spatial proportion relative to extraneous background regions. The direct utilization of raw images as input data introduces extraneous interference and notably compromises feature extraction fidelity. To address these limitations, the following preprocessing pipeline was implemented prior to color space conversion:
2.3.1. Threshold Segmentation
This study employed a threshold-based segmentation approach using Otsu’s method [19] to dynamically determine optimal thresholds. Threshold segmentation relies on a specific color component from a given color space. The most suitable color component for segmentation was identified for each of the three color spaces: RGB, HSV, and L*a*b*. Figure 3 shows the Otsu-based segmentation workflow.
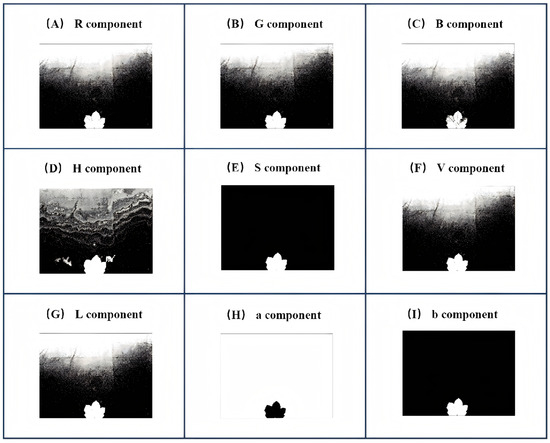
Figure 3.
Foreground segmentation across color components.
Figure 3 shows the Otsu-based segmentation results for nine color components from the RGB (R, G, and B), HSV (H, S, and V), and L*a*b* (L*, a*, and b*) color spaces. Comparative analysis revealed that the b* component in the L*a*b* color space outperformed other components in effectively isolating cotton leaf regions from background interference. Consequently, the b* component was selected to generate the initial binary mask for leaf segmentation, as shown in Figure 3I.
2.3.2. Morphological Processing
The initial binary mask was subjected to morphological processing [20] to refine segmentation accuracy. First, a minimum bounding rectangle algorithm was applied to crop extraneous background regions, ensuring maximal retention of leaf pixels. Subsequently, opening operations (erosion followed by dilation) eliminated rough edges and small protrusions, while closing operations (dilation followed by erosion) filled minor internal voids. Figure 4 shows this workflow.

Figure 4.
Morphological processing workflow.
Figure 4C represents the final binary mask template obtained through morphological processing. This mask was applied to the original image using a bitwise AND operation to generate the segmented cotton leaf target image.
2.3.3. Size Normalization
The resize method from the Python Imaging Library (PIL) was used to uniformly adjust the image dimensions, resizing the cotton leaf images to 224 × 224 pixels, with the default algorithm set as the bilinear interpolation algorithm.
2.3.4. Dataset Augmentation
To address the problem of the insufficient size of the original dataset for the feature extraction of the comprehensive multi-space convolutional neural network on cotton leaves, data augmentation techniques including 180-degree clockwise rotation and mirror flipping were implemented. These techniques enabled two enhanced images to be generated for each original image, so as to expand the diversity of the dataset and meet the demand of deep learning for large-scale data. These image processing operations have made the dataset contain 1122 images.
2.4. Acquisition of Cotton Leaf Nitrogen Content
Fresh leaf mass was measured immediately after collection. Subsequently, leaves were enzyme-inactivated at 105 °C for 30 min, then oven-dried at 85 °C until a constant weight was achieved. The dried leaf sample (0.1000 g) was precisely weighed using a 0.0001 g precision analytical balance. The sample underwent digestion via the H2SO4-H2O2 method, and the total nitrogen content was determined using the Kjeldahl distillation technique. The nitrogen content was calculated as follows:
where C is the concentration of the dilute sulfuric acid solution (mol/L); V and V0 are the volumes of dilute sulfuric acid consumed in the sample and blank titration, respectively (mL); 0.014 represents the molar mass of nitrogen (kg/mol); ts is the dilution factor, defined as the ratio of the total constant volume to the aliquot volume; 10−3 corresponds to the conversion factor between kilograms and grams; and m indicates the mass of the weighed sample (g).
Determination of leaf nitrogen accumulation (LNA):
where N% represents the nitrogen content of cotton leaves, and m represents the dry mass of cotton leaves (g).
2.5. Color Space Conversion Methods
A color space is a mathematical model that describes colors in an image, defining how color information is represented and organized. In digital image processing, colors are represented numerically, with specific definitions and arrangements within the color space. The RGB color space is a widely used standard based on the additive mixing of three primary light sources: red (R), green (G), and blue (B). The HSV color space models colors in a manner more aligned with human perception compared to that of RGB. HSV comprises three components: Hue (H), Saturation (S), and Value (V). The Lab color space is a three-dimensional system that includes lightness (L) and two chromaticity axes: A (green-red axis) and B (blue-yellow axis).
2.6. Convolutional Neural Network Models
AlexNet, VGGNet, and ResNet were selected to construct cotton leaf nitrogen content estimation models. These models were adapted for regression tasks by modifying their output layers to produce a single continuous value representing nitrogen content.
2.6.1. AlexNet Architecture and Principles
AlexNet employs the nonlinear, non-saturating ReLU activation function, which alleviates gradient vanishing more effectively than traditional saturating functions such as sigmoid and tanh. Although ReLU does not require input normalization, the inclusion of Local Response Normalization (LRN) layers enhanced generalization by inducing lateral inhibition [21].
2.6.2. VGGNet Architecture and Principles
VGGNet replaces LRN layers with smaller 3 × 3 convolutional kernels stacked sequentially. This design achieves larger receptive fields with fewer parameters while maintaining deeper network structures. Similar to AlexNet, ReLU activation and fully connected layer configurations were retained.
2.6.3. ResNet Architecture and Principles
ResNet-50 uses residual blocks with batch normalization (BN) and skip connections to mitigate network degradation, thereby enabling deeper architectures with enhanced feature extraction capabilities [22].
2.7. Traditional Machine Learning Model
To integrate the nitrogen content prediction results of single-color-space models and realize decision-level fusion, this study employed four traditional machine learning models, namely Ridge Regression, Backpropagation Neural Network (BPNN), Adaptive Boosting (AdaBoost), and Bagging, with their core characteristics and application roles in this research as follows:
Ridge Regression: As a regularized linear regression technique, it mainly addresses the issues of multicollinearity among prediction features from different color spaces and overfitting of the fusion model, laying a foundation for stable initial fusion of prediction results.
Backpropagation Neural Network (BPNN): A foundational machine learning model capable of handling both classification and regression tasks, it forms the basis of many deep-learning architectures [23]. In this study, its strong nonlinear fitting ability is utilized to capture the complex correlation between multi-source prediction results and actual nitrogen content, serving as a key model for decision-level fusion.
Adaptive Boosting (AdaBoost): This model iteratively combines weak classifiers (e.g., decision trees) into a strong classifier by reweighting misclassified samples [24]. It helps improve the sensitivity of the fusion model to samples with large prediction deviations from single-color-space models, thereby enhancing the overall prediction accuracy.
Bagging: It generates multiple training datasets through bootstrap sampling, trains individual models on each subset, and aggregates final predictions via averaging (for regression tasks). This approach effectively reduces the variance of the fusion model and enhances the robustness of decision-level fusion results.
2.8. Multi-Color Space Fusion Model Frameworks
2.8.1. Feature-Level CNN Fusion
Feature-level fusion will concatenate the feature vectors extracted from the fully connected layers of models trained on different color spaces. A 1D-MultiHeadAttention network has been constructed to regress the fused features, and its structure is shown in the Feature-level fusion module in Figure 5.
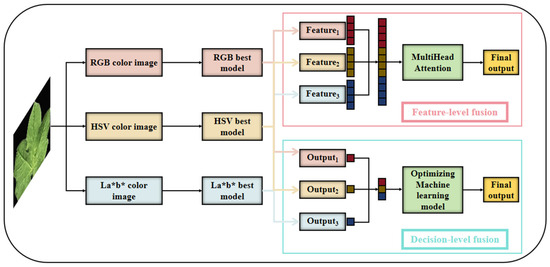
Figure 5.
Schematic diagram of feature-level fusion and decision-level fusion.
2.8.2. Decision-Level CNN Fusion
Decision-level fusion combines predictions from color space-specific models using Ridge Regression, BPNN, AdaBoost, and Bagging. The optimal algorithm was selected based on performance, and its structure is shown in the Decision-level fusion module in Figure 5.
2.9. Model Evaluation Methods
In the present study, the root mean square error (RMSE) and the coefficient of determination (R2) were employed as evaluation criteria for model performance.
2.9.1. RMSE (Root Mean Square Error)
The RMSE measures the average magnitude of deviation between the model’s predicted values and the corresponding ground truth labels. A smaller RMSE value indicates higher prediction accuracy. The RMSE is calculated as follows:
2.9.2. R2 (R-Squared)
The R2 metric quantifies the proportion of variance in the target variable that is explainable by the model. Its value ranges from 0 to 1, where values closer to 1 represent superior model fit, while values approaching 0 indicate poor fitting performance. The R2 is mathematically expressed as follows:
In these equations represents the true label of the i-th sample; represents the predicted value for the i-th sample; is the mean value of all true labels; N is the total number of samples.
3. Results
3.1. Evaluation of Single Color Spaces
Prior to model construction and training on the cotton leaf image dataset, the dataset was partitioned into training and validation sets at an 8:2 ratio. All models were configured with ImageNet pre-trained weights and set to 50 training epochs. After iterative training until model convergence, the steady-state mean values of evaluation metrics for models across different color spaces were obtained, as presented in Table 1.

Table 1.
Regression models for cotton leaf nitrogen content across color spaces.
For all evaluated color spaces, ResNet-50 exhibited superior fitting performance than those of AlexNet and VGGNet-11, primarily because of the limited feature abstraction capabilities of AlexNet and VGGNet-11 in the convolutional layers, which hindered the effective extraction of nitrogen-related features from the cotton leaf images. In contrast, ResNet-50′s residual blocks preserved original image features during the convolutional operations while enabling deeper hierarchical representations, resulting in optimal performance for all color spaces. Specifically, in the RGB color space, ResNet-50 achieved training (R2 = 0.945, RMSE = 2.429 g/kg) and validation set metrics (R2 = 0.776, RMSE = 5.348 g/kg). In the HSV color space, it exhibited training (R2 = 0.935, RMSE = 2.634 g/kg) and validation set metrics (R2 = 0.772, RMSE = 5.655 g/kg); and in the L*a*b* color space, it attained training (R2 = 0.954, RMSE = 2.214 g/kg) and validation set metrics (R2 = 0.760, RMSE = 5.496 g/kg). The decoupling of luminance (L*) from chromaticity (a* and b*) in the L*a*b* space potentially weakened joint illumination-color cues critical for nitrogen prediction. In contrast, HSV’s separation of hue (H), saturation (S), and value (V) reduced sensitivity to subtle hue variations, such as green intensity gradients. RGB’s superior validation performance highlighted its robustness in preserving photometric relationships essential for nitrogen estimation. Model predictions based on steady-state R2 values across color spaces are shown in Figure 6.

Figure 6.
Model fitting plots for cotton leaf nitrogen content across individual color spaces. Subplots (A–C) represent the ground truth vs. predicted value fitting diagrams of optimal models in the RGB, HSV, and L*a*b* color spaces, respectively.
3.2. Evaluation of Feature-Level Fusion in Multi-Color Space Convolutional Neural Networks
The model was equipped with a MultiHeadAttention module to capture complex inter-feature dependencies within the input data, followed by sequential fully connected layers for progressive information refinement, ultimately enabling accurate prediction of nitrogen content (g/kg). The results of the feature-level fusion model are shown in Table 2.

Table 2.
Regression models for cotton nitrogen content with feature-level fusion.
The comparative analysis revealed that the prediction results obtained through feature-level fusion modeling outperformed those from single-color-space modeling, with the three-color-space fusion model achieving the best performance (validation set R2 = 0.827). This improvement is attributed to the multi-color-space feature extraction and fusion methods employed in this study, which compensated for the limitations of individual color spaces, enabling the model to better interpret and use color information from cotton leaf images and capture more nitrogen-related color features, thereby enhancing model performance and accuracy. The superior performance of three-color-space fusion over those of two-color-space combinations further demonstrates that extracting and fusing more color features from cotton leaf images facilitates a more comprehensive inversion of leaf nitrogen content. Additionally, the single L*a*b* color space model exhibited poor validation performance, and fusion models incorporating L*a*b* also showed relatively weaker results. This suggests that the excessively high training performance of the L*a*b* model (R2 = 0.954) may indicate it learned dataset-specific spurious features, such as noise or irrelevant color characteristics, whose inclusion during fusion likely contaminated the shared representation space and reduced model generalizability, resulting in limited improvement for fusion configurations containing L*a*b*. The nitrogen content estimation results using the final 2D and 3D color space feature-level fusion models are shown in Figure 7.
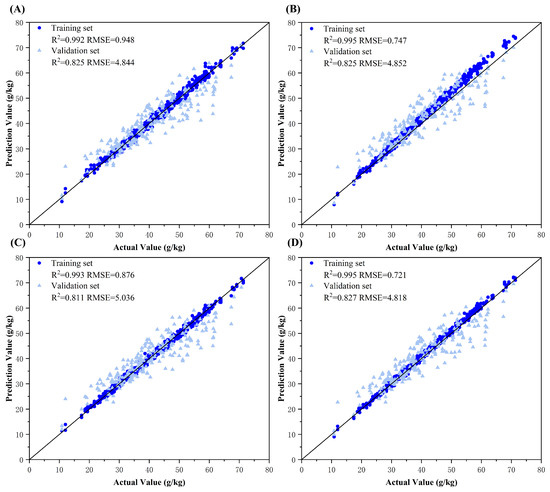
Figure 7.
Model fitting plots for feature-level fusion models. Subplots (A–D) represent the ground truth vs. predicted value fitting diagrams of the optimal models for RGB-HSV fusion, RGB-L*a*b* fusion, HSV-L*a*b* fusion, and triadic RGB-HSV-L*a*b* fusion, respectively.
3.3. Evaluation of Decision-Level Fusion in Multi-Color Space Convolutional Neural Networks
This study implemented decision-level fusion modeling using dual-source datasets (predictions from any two color spaces) and tri-source datasets (predictions from three color spaces). First, the final models trained on different color spaces were separately used to predict cotton leaf nitrogen content, generating input data for fusion. Four machine learning algorithms—Ridge regression, Backpropagation (BP) neural network, Adaboost, and Bagging—were employed for decision-level fusion. All the results of decision-level fusion and the scatter plots are shown in Figure 8, Figure 9, Figure 10 and Figure 11.
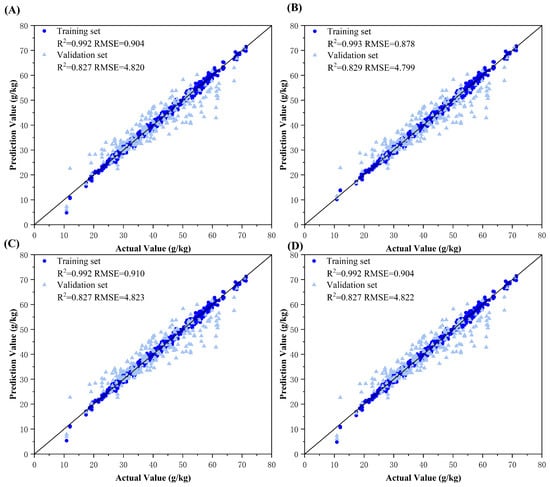
Figure 8.
Model fitting plots for decision-level fusion models between RGB and HSV color spaces. Subplots (A–D) represent the ground truth vs. predicted value fitting diagrams using Ridge regression, Backpropagation (BP) neural network, Adaboost ensemble learning, and Bagging ensemble learning fusion models, respectively.
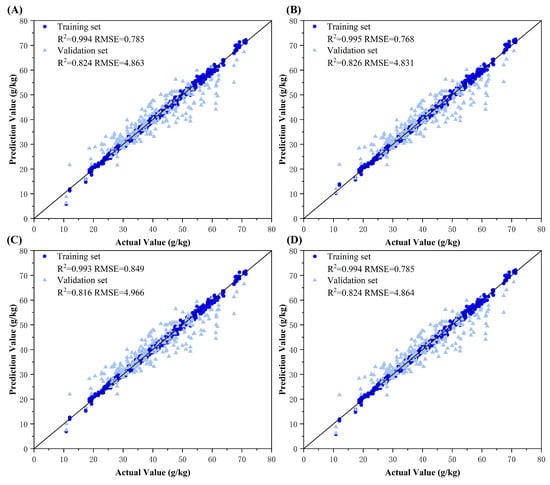
Figure 9.
Model fitting plots for decision-level fusion models between RGB and L*a*b* color spaces. Subplots (A–D) represent the ground truth vs. predicted value fitting diagrams using Ridge regression, Backpropagation (BP) neural network, Adaboost ensemble learning, and Bagging ensemble learning fusion models, respectively.
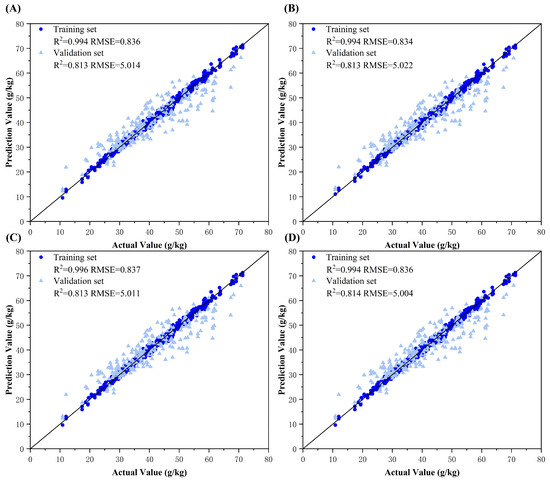
Figure 10.
Model fitting plots for decision-level fusion models between HSV and L*a*b* color spaces. Subplots (A–D) represent the ground truth vs. predicted value fitting diagrams using Ridge regression, Backpropagation (BP) neural network, Adaboost ensemble learning, and Bagging ensemble learning fusion models, respectively.
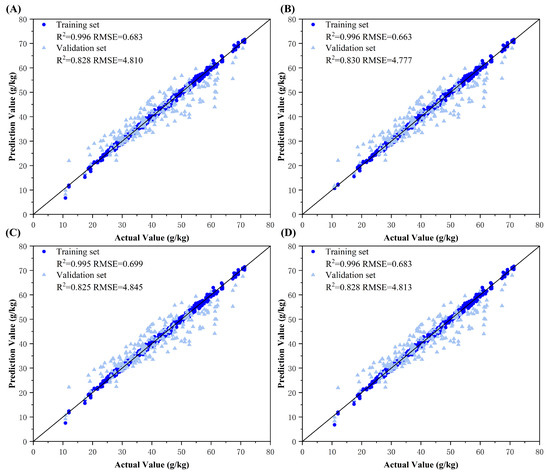
Figure 11.
Model fitting plots for decision-level fusion models among RGB, HSV, and L*a*b* color spaces. Subplots (A–D) represent the ground truth vs. predicted value fitting diagrams using Ridge regression, Backpropagation (BP) neural network, Adaboost ensemble learning, and Bagging ensemble learning fusion models, respectively.
The results demonstrated that decision-level fusion strategies with two or more color spaces achieved superior predictive performance on both training and validation sets compared to those of single-color-space models. This improvement can be attributed to the ability of ResNet-50 model to capture distinct color information emphases across different color spaces, producing diverse predictions. By integrating these model outputs through optimized machine learning methods, the fusion process synthesized complementary advantages, mitigated individual model errors, and enhanced decision precision. Notably, the BP neural network consistently exhibited optimal fusion performance on tri-source datasets, likely owing to its capacity to use an additional reference dimension for error correction between predicted and ground truth values. The BP architecture effectively processes continuous feature vectors by refining outputs through weight and bias adjustments, enabling effective learning of complex relationships in nitrogen estimation. Ridge regression exhibited limited adaptability, primarily relying on regularization to prevent overfitting. In comparison, Adaboost and Bagging, dependent on base learners such as decision trees, proved more suitable for classification tasks. Ridge’s linear combinations could not capture intricate feature interactions. The tri-source fusion achieved peak performance, with the optimal decision-level fusion model yielding a training set RMSE = 0.663 g/kg (R2 = 0.996) and validation set RMSE = 4.777 g/kg (R2 = 0.830), quantitatively confirming its robustness.
4. Discussion
This study developed a practical and precise crop nitrogen estimation approach using smartphone-captured RGB images through multi-color-space transformations, enabling both feature-level and decision-level fusion strategies that enhance field applicability.
Manual visual assessment can only roughly distinguish the nitrogen status of crops and lacks the ability of quantification [4]. However, the method proposed in this study can output the specific nitrogen content by taking pictures of leaves with a smartphone, providing a basis for precise fertilization. The chemical titration method for detecting the nitrogen in crops has complicated steps, is time-consuming and destructive [5]. The smartphone-based method in this study can complete the nitrogen estimation within 3 s and achieve on-site, instant and non-destructive assessment. The nitrogen estimation methods based on spectral imaging or unmanned aerial vehicle (UAV) remote sensing are costly, have high operational thresholds and require strong professionalism, making it difficult for non-professional agricultural personnel to apply them [6,9]. The method in this study relies on smartphones with a high popularity rate and low-cost imaging chambers, which can be used without professional knowledge and can cover a wide range of agricultural practitioners.
The color space conversions underscored distinct image characteristics: RGB directly encodes red-green-blue spectral components; HSV better captures hue and saturation variations [25]; and Lab* decouples color from luminance to enhance chromatic discriminability [26]. These transformations diversified feature extraction and critically improved the detection of subtle color changes associated with cotton leaf nitrogen dynamics [27]. Feature-level fusion focuses on nitrogen-sensitive features (such as the G channel of RGB and the S component of HSV) through the Attention mechanism to make up for the one-sidedness of single spatial features, which is consistent with Trivedi et al. (2025), who demonstrated feature fusion’s efficacy in precision agriculture [28]. Decision-level fusion integrates the predicted values of multiple models through the Back Propagation Neural Network (BPNN) to reduce the errors of a single model (for example, the problem of overfitting that is prone to occur in the Lab space model)consistent with Zhang et al. (2025) on fusion-enhanced stability [29]. This study verified the effectiveness of the “feature-decision” dual fusion in agricultural image analysis.
However, it is important to acknowledge the study’s limitations: The data collection relies on a controlled-light imaging auxiliary device, and the impact of dynamic lighting and complex backgrounds in actual field environments on model stability remains to be verified. In the future, this study plans to use multi-exposure fusion and brightness layering processing combined with a pixel-level standard reference color palette to eliminate the influence of illumination. Meanwhile, future studies will focus on using the method of combining semantic segmentation with texture feature filtering to achieve leaf segmentation under complex backgrounds. Non-color features such as leaf texture (e.g., vein distribution, surface roughness) and morphology (e.g., geometric shape, curling degree) were not integrated [30]. These features can supplement structural signals of nitrogen stress, and future studies can explore color-texture-morphology multimodal data fusion to enhance the universality and accuracy of estimation models.
5. Conclusions
This study used smartphone rear-camera-captured cotton leaf images to achieve high-precision nitrogen content estimation using two methods: (1) feature-level fusion by concatenating feature vectors from multiple color spaces (RGB, HSV, and L*a*b*) combined with attention mechanisms, and (2) decision-level fusion by integrating predictions from single-color-space models using machine learning algorithms. Both methods demonstrated that smartphone-based imaging enables accurate nitrogen assessment, providing technical support for portable, non-destructive crop nutrient detection.
The key conclusions are as follows:
- (1)
- Among the single-color-space models (AlexNet, VGGNet-11, and ResNet-50), ResNet-50 exhibited superior performance for all color spaces: RGB (validation R2 = 0.776, RMSE = 5.348 g/kg), HSV (R2 = 0.771, RMSE = 5.655 g/kg), and L*a*b* (R2 = 0.765, RMSE = 5.496 g/kg).
- (2)
- Multi-color-space fusion increased accuracy by 5–7% compared to those of single-space models: feature-level fusion achieved validation R2 = 0.827 (RMSE = 4.833 g/kg), whereas decision-level fusion using BP neural network on tri-source data attained an R2 of 0.830 (RMSE = 4.777 g/kg).
Overall, this study achieved high-precision estimation of cotton leaf nitrogen content using smartphone imaging. By integrating the model and the color correction steps, and combined with low-cost portable light control chambers to achieve low-cost, rapid, and simple accurate estimation of the nitrogen content in cotton leaves, it has provided farmers with practical and low-cost crop nutrient diagnosis tools, helping to achieve precise fertilization, and also provided new methods and ideas for agronomists to conduct regional nitrogen nutrition estimation.
Author Contributions
Conceptualization, methodology, validation, formal analysis, investigation, data curation, writing—original draft, S.C.; formal analysis, methodology, investigation, resources, writing—original draft, S.Q.; formal analysis, investigation, validation, data curation, Y.W.; conceptualization, project administration, supervision, resources, writing—review & editing, funding acquisition, L.M.; supervision, resources, writing—review & editing, funding acquisition, X.L. All authors have read and agreed to the published version of the manuscript.
Funding
This research was funded by the major projects in the Corps, including the Xinjiang Uygur Autonomous Region’s “Tianchi Talents” Introduction Plan—Ma Lulu, grant number CZ006040; the Smart Breeding Project for Corps Cotton Research on Corps Cotton Breeding AI Model, grant number 2023AA008; 2023 Talent Development Special Project—Corps Talent Support Program Leading Talent—Lv Xin, grant number CZ005111 and Shihezi University High level Talent Research Launch Project, grant number RCZK202342. The authors are grateful to the Xinjiang Production and Construction Crops Oasis Eco-Agriculture Key Laboratory for their contribution to this study.
Data Availability Statement
The original contributions presented in the study are included in the article. Further inquiries can be directed to the corresponding authors.
Acknowledgments
The authors are grateful to the Xinjiang Production and Construction Crops Oasis Eco-Agriculture Key Laboratory for their contribution to this study.
Conflicts of Interest
The authors declare no competing interests. The research was conducted in the absence of any commercial or financial relationships that could be construed as a potential conflict of interest.
References
- Najib, D.C.S.; Fei, C.; Dilanchiev, A.; Romaric, S. Modeling the impact of cotton production on economic development in Benin: A technological innovation perspective. Front. Environ. Sci. 2022, 2022, 10. [Google Scholar] [CrossRef]
- Snider, J.; Harris, G.; Roberts, P.; Meeks, C.; Chastain, D.; Bange, M.I.; Virk, G. Cotton physiological and agronomic response to nitrogen application rate. Field Crops Res. 2021, 270, 108194. [Google Scholar] [CrossRef]
- Chalise, D.P.; Snider, J.L.; Virk, G. Assessing the effects of cultivar and nitrogen application rate on seedling vigor and early-season canopy growth in cotton. Agron. J. 2023, 115, 713–725. [Google Scholar] [CrossRef]
- Huang, C.; Zhang, Z.; Zhang, X.; Jiang, L.; Hua, X.; Ye, J.; Yang, W.; Song, P.; Zhu, L. A novel intelligent system for dynamic observation of cotton Verticillium Wilt. Plant Phenomics 2023, 5, 0013. [Google Scholar] [CrossRef]
- Mádlíková, M.; Krausová, I.; Mizera, J.; Táborský, J.; Faměra, O.; Chvátil, D. Nitrogen assay in winter wheat by short-time instrumental photon activation analysis and its comparison with the Kjeldahl method. J. Radioanal. Nucl. Chem. 2018, 317, 479–486. [Google Scholar] [CrossRef]
- Li, L.; Guo, J.; Wang, Q.; Wang, J.; Liu, Y.; Shi, Y. Design and experiment of a portable near-infrared spectroscopy device for convenient prediction of leaf chlorophyll content. Sensors 2023, 23, 8585. [Google Scholar] [CrossRef]
- Lee, H.; Wang, J.; Leblon, B. Intra-field canopy nitrogen retrieval from unmanned aerial vehicle imagery for wheat and corn fields. Can. J. Remote Sens. 2020, 46, 454–472. [Google Scholar] [CrossRef]
- Ahmad, I.; Zhu, G.; Zhou, G.; Song, X.; Hussein Ibrahim, M.E.; Ibrahim Salih, E.G. Effect of N on growth, antioxidant capacity, and chlorophyll content of sorghum. Agronomy 2022, 12, 501. [Google Scholar] [CrossRef]
- Kou, J.; Duan, L.; Yin, C.; Ma, L.; Chen, X.; Gao, P.; Lv, X. Predicting leaf nitrogen content in cotton with UAV RGB images. Sustainability 2022, 14, 9259. [Google Scholar] [CrossRef]
- Qiu, Z.; Ma, F.; Li, Z.; Xu, X.; Ge, H.; Du, C. Estimation of nitrogen nutrition index in rice from UAV RGB images coupled with machine learning algorithms. Comput. Electron. Agric. 2021, 189, 106421. [Google Scholar] [CrossRef]
- Xu, H.-Y.; Yue, Z.-H.; Wang, C.; Dong, K.; Pang, H.-S.; Han, Z. Multi-source data fusion study in scientometrics. Scientometrics 2017, 111, 773–792. [Google Scholar] [CrossRef]
- Qin, S.; Ding, Y.; Zhou, Z.; Zhou, M.; Wang, H.; Xu, F.; Yao, Q.; Lv, X.; Zhang, Z.; Zhang, L. Study on the nitrogen content estimation model of cotton leaves based on “image-spectrum-fluorescence” data fusion. Front. Plant Sci. 2023, 14, 1117277. [Google Scholar] [CrossRef]
- Geipel, J.; Link, J.; Claupein, W. Combined spectral and spatial modeling of corn yield based on aerial images and crop surface models acquired with an unmanned aircraft system. Remote Sens. 2014, 6, 10335–10355. [Google Scholar] [CrossRef]
- Lu, J.; Cheng, D.; Geng, C.; Zhang, Z.; Xiang, Y.; Hu, T. Combining plant height, canopy coverage and vegetation index from UAV-based RGB images to estimate leaf nitrogen concentration of summer maize. Biosyst. Eng. 2021, 202, 42–54. [Google Scholar] [CrossRef]
- Anderson, J.; Boonyaves, K.; Okamoto, H.; Karaket, N.; Chuekong, W.; Garvie, M.; Chabang, N.; Osorio, D.; Supaibulwatana, K. Image-based leaf SPAD value and chlorophyll measurement using a mobile phone: Enabling accessible and sustainable crop management. bioRxiv 2025. [Google Scholar] [CrossRef]
- Dhawi, F.; Ghafoor, A.; Almousa, N.; Ali, S.; Alqanbar, S. Predictive modelling employing machine learning, convolutional neural networks (CNNs), and smartphone RGB images for non-destructive biomass estimation of pearl millet (Pennisetum glaucum). Front. Plant Sci. 2025, 16, 1594728. [Google Scholar] [CrossRef] [PubMed]
- Won, H.S.; Lee, E.; Lee, S.; Nam, J.-H.; Jung, J.; Cho, Y.; Evert, T.; Kan, N.; Kim, S.; Kim, D.S. Image analysis using smartphones: Relationship between leaf color and fresh weight of lettuce under different nutritional treatments. Front. Plant Sci. 2025, 16, 1589825. [Google Scholar] [CrossRef] [PubMed]
- Liu, C.; Shu, X.; Pan, L.; Shi, J.; Han, B. Multiscale underwater image enhancement in RGB and HSV color spaces. IEEE Trans. Instrum. Meas. 2023, 72, 1–14. [Google Scholar] [CrossRef]
- Yang, P.; Song, W.; Zhao, X.; Zheng, R.; Qingge, L. An improved Otsu threshold segmentation algorithm. Int. J. Comput. Sci. Eng. 2020, 22, 146–153. [Google Scholar] [CrossRef]
- Gao, M.; Yang, F.; Wei, H.; Liu, X. Automatic monitoring of maize seedling growth using unmanned aerial vehicle-based RGB imagery. Remote Sens. 2023, 15, 3671. [Google Scholar] [CrossRef]
- Krizhevsky, A.; Sutskever, I.; Hinton, G.E. ImageNet classification with deep convolutional neural networks. Commun. ACM 2017, 60, 84–90. [Google Scholar] [CrossRef]
- Chen, D.; Hu, F.; Nian, G.; Yang, T. Deep residual learning for nonlinear regression. Entropy 2020, 22, 193. [Google Scholar] [CrossRef]
- Wang, L.; Wang, P.; Liang, S.; Qi, X.; Li, L.; Xu, L. Monitoring maize growth conditions by training a BP neural network with remotely sensed vegetation temperature condition index and leaf area index. Comput. Electron. Agric. 2019, 160, 82–90. [Google Scholar] [CrossRef]
- Dou, P.; Chen, Y. Remote sensing imagery classification using AdaBoost with a weight vector (WV AdaBoost). Remote Sens. Lett. 2017, 8, 733–742. [Google Scholar] [CrossRef]
- Zhang, L.; Song, X.; Niu, Y.; Zhang, H.; Wang, A.; Zhu, Y.; Zhu, X.; Chen, L.; Zhu, Q. Estimating winter wheat plant nitrogen content by combining spectral and texture features based on a low-cost UAV RGB system throughout the growing season. Agriculture 2024, 14, 456. [Google Scholar] [CrossRef]
- Bai, X.D.; Cao, Z.G.; Wang, Y.; Yu, Z.H.; Zhang, X.F.; Li, C.N. Crop segmentation from images by morphology modeling in the CIE L*a*b* color space. Comput. Electron. Agric. 2013, 99, 21–34. [Google Scholar] [CrossRef]
- Khan, M.A.; AlGhamdi, M.A. An intelligent and fast system for detection of grape diseases in RGB, grayscale, YCbCr, HSV and L*a*b* color spaces. Multimed. Tools Appl. 2023, 83, 50381–50399. [Google Scholar] [CrossRef]
- Trivedi, A.K.; Mahajan, T.; Maheshwari, T.; Mehta, R.; Tiwari, S. Leveraging feature fusion ensemble of VGG16 and ResNet-50 for automated potato leaf abnormality detection in precision agriculture. Soft Comput 2025, 29, 2263–2277. [Google Scholar] [CrossRef]
- Zhang, J.; Guo, Z.; Ma, C.; Jin, C.; Yang, L.; Zhang, D.; Yin, X.; Du, J.; Fu, P. Novel decision-level fusion strategies combined with hyperspectral imaging for the detection of soybean protein content. Food Chem. 2025, 469, 142552. [Google Scholar] [CrossRef] [PubMed]
- Fan, Y.; Feng, H.; Yue, J.; Jin, X.; Liu, Y.; Chen, R.; Bian, M.; Ma, Y.; Song, X.; Yang, G. Using an optimized texture index to monitor the nitrogen content of potato plants over multiple growth stages. Comput. Electron. Agric. 2023, 212, 108147. [Google Scholar] [CrossRef]
Disclaimer/Publisher’s Note: The statements, opinions and data contained in all publications are solely those of the individual author(s) and contributor(s) and not of MDPI and/or the editor(s). MDPI and/or the editor(s) disclaim responsibility for any injury to people or property resulting from any ideas, methods, instructions or products referred to in the content. |
© 2025 by the authors. Licensee MDPI, Basel, Switzerland. This article is an open access article distributed under the terms and conditions of the Creative Commons Attribution (CC BY) license (https://creativecommons.org/licenses/by/4.0/).