Article

Study on the Spatiotemporal Patterns and Influencing Factors of Maize Planting in Hunan Province

1
College of Public Administration and Law, Hunan Agricultural University, Changsha 410128, China
2
College of Landscape Architecture and Art Design, Hunan Agricultural University, Changsha 410128, China
*
Author to whom correspondence should be addressed.
Agronomy 2025, 15(10), 2339; https://doi.org/10.3390/agronomy15102339
Submission received: 10 August 2025 / Revised: 28 September 2025 / Accepted: 1 October 2025 / Published: 5 October 2025

Abstract

Maize, one of the world’s three major food crops, plays a vital role in global food security. Analyzing the spatiotemporal patterns of maize cultivation in Hunan Province and their influencing factors contributes to enhancing planting quality and efficiency, optimizing production patterns, and supporting provincial food security initiatives. Utilizing maize cultivation data from Hunan Province (2001–2023), this study employed the standard deviation ellipse, center of gravity shift model, and principal component analysis to examine production patterns and their drivers. Key findings include the following: (1) The maize planting area exhibited an overall increasing trend from 2001 to 2023, with a spatial convergence from the northwest towards the east. Cultivation hot spots were identified in Shaoyang, Loudi, and Changde. Maize cultivation was predominantly concentrated in areas with gentle slopes (0–3°) and gradually shifted eastward towards similar terrain. (2) The provincial maize production center of gravity followed a “Z”-shaped trajectory, moving eastward and southward with Loudi City as its core. While the spatial distribution pattern shifted from “northwest–southeast” to “west–east”, the core concentration area maintained its “northwest–southeast” orientation. Concurrently, the fragmentation of cultivated land within the maize planting landscape increased. (3) Maize planting hot spots expanded from the northwest towards the central and eastern regions, extending southward. Cold spot areas shifted from the central region towards the northeast. By the study’s end, the central region had emerged as the core maize planting area. (4) Agricultural production conditions and policy factors were identified as the main drivers of spatiotemporal changes in maize acreage within Hunan Province.

1. Introduction

Food security is the foundation of human survival and national security. According to data from the Food and Agriculture Organization of the United Nations (FAO), nearly 10% of the global population is expected to suffer from hunger in 2020 [1]. Practices to improve grain yield, such as indiscriminate reclamation, excessive application of chemical fertilizers, and intensive farming, have led to environmental pollution, soil degradation, and resource waste in recent decades [2]. In particular, climate change and land use change have seriously affected the planting structure, distribution boundary, phenology, and yield of food crops in China, thus seriously threatening food security in China and even the world [3,4,5,6]. As one of the widely planted cereal crops in the world, maize has become the most important food crop in China [7]. With the continuous improvement in people’s living standards in China, the types of maize consumed have become more diversified, and the proportion of feed consumption and industrial consumption is also rising. China is now at the forefront of the world in terms of maize planting area, maize yield, and total maize consumption [8]. Therefore, understanding the temporal and spatial pattern of maize planting is an important basis for optimizing the planting structure and rational distribution of crops and is of great significance for improving the sustainability and productivity of agriculture [9,10].
In recent years, the spatial pattern of crop planting has become an important topic in agricultural geography and sustainable development research [11]. As an important food crop, maize’s production pattern has also been widely studied. With the increase in temperature and the extension of the growing season, the agricultural conditions in high-latitude and high-altitude areas have improved, which has promoted the spread of maize planting distribution to the north [12,13]. Since the 1950s, the maize-producing areas in China have shown a trend of “retreating from the south to the north”, and maize production is now mainly concentrated in Northeast and North China [14]. At present, scholars mainly research remote sensing monitoring of maize planting [15,16], temporal and spatial distribution simulation, yield prediction, climate suitability assessment, drought risk assessment, production and consumption pattern analysis, regional comparative advantage, carbon footprint, and economic benefit evaluation [8,17,18,19,20,21,22,23,24,25,26,27,28].
With the acceleration of urbanization in China, the contradiction between man and land has become increasingly prominent. The application of chemical fertilizers, the use of artificial irrigation, the popularization of agricultural mechanization, and the breeding of crop varieties have significantly changed the temporal and spatial layout of crop planting areas [29]. The temporal and spatial pattern of maize planting is driven by both natural and human factors. Natural factors, such as rainfall, accumulated temperature, soil properties, and topography, constitute the basic conditions for crop growth and distribution [30,31,32,33,34,35], while human factors, including the policy system, farming methods, labor force, scientific and technological level, economic development, etc., play a significant regulatory role in the evolution of planting structure and regional distribution [36,37,38,39]. To quantitatively analyze the role of driving factors, scholars use geographical detectors [40,41], geographically weighted regression [42,43], the spatial dobbin model [44], the spatial error regression model [45], the structural equation model [46], factor analysis and regression analysis [47], meta-analysis [48], DEA-TOB [49], and non-parametric test methods [50] to identify driving factors and assess their effects [51]. Therefore, considering national policies and other factors, we ask the following questions: How does the distribution pattern of maize planting in Hunan Province evolve? How should we plan the spatial layout of maize planting in this area in the future? To answer these questions, it is necessary to carry out a comprehensive study on the temporal and spatial variation characteristics of maize crop planting in this area at the regional level.
Therefore, this study focuses on Hunan Province, taking 30 m × 30 m as the grid unit. With the help of the advantages of agricultural remote sensing big data in large-area and long-time sequence crop planting analysis, we discusses the interannual change in the maize planting area and its topographic distribution characteristics from 2001 to 2023. The purpose of this study is as follows: (1) to explore the spatial and temporal distribution pattern of maize planting in Hunan Province using GIS analysis tools, kernel density analysis tools, and the center of gravity migration model; (2) to divide the maize planting in Hunan Province into high-aggregation and low-aggregation zones using cold hot spot analysis tools; and (3) to explore the influencing factors and mechanism of maize planting using correlation analysis and principal component analysis. Systematic analysis of the spatiotemporal pattern and driving mechanism of maize planting provides decision support for improving maize production efficiency and building a food production safety guarantee system.

2. Materials and Methods

2.1. Overview of the Study Area

The superior hydrothermal conditions in Hunan Province provide a good environment for maize cultivation. As one of China’s 13 major grain-producing provinces and the main sales area of maize “north grain south transfer,” the cultivated area for grain crops remains stable at around 700,000 hectares throughout the year, yielding approximately 30 million tons. In recent years, in order to optimize the agricultural industrial structure, Hunan Province has promoted soybean and maize strip compound planting and double harvest in one place. With the support of national policies, the sown area and yield of maize in Hunan Province are increasing, and the yield has great potential to increase. The location conditions of Hunan Province are shown in Figure 1.

2.2. Data Sources and Research Methods

2.2.1. Data Sources

The data and sources used in this study are as follows: Maize planting data from 2001 to 2023 are in raster format, obtained from the National Science and Technology Resource Sharing Service Platform (http://www.nesdc.org.cn, accessed on 16 March 2025). These data have a spatial resolution of 30 m. The raster distributions of maize planting in China from 2001 to 2020 were generated based on a MODIS/Landsat NDVI fusion dataset, while the data for 2021–2023 were generated using a Landsat/Sentinel-2 NDVI fusion dataset. Elevation data were sourced from GEBCO (https://www.gebco.net, accessed on 18 March 2025) and have a spatial resolution of 30 m. Administrative boundary vector data were obtained from the National Geographic Information Resources Catalog Service System (https://www.webmap.cn, accessed on 18 March 2025). Statistical data, such as per capita GDP and rural population, were collected from the Hunan Statistical Yearbook (http://tjj.hunan.gov.cn, accessed on 28 March 2025). All raster datasets were uniformly projected to the WGS 1984 UTM coordinate system and resampled to a spatial resolution of 30 m.

2.2.2. Research Methodology

(1) Center of gravity shift model
The center of gravity of a certain attribute of a large area composed of n sub-regions, as well as the distance it moves, is calculated. The formula is as follows [52]:
X = i = 1 n M i X i / i = 1 n M i , Y = i = 1 n M i Y i / i = 1 n M i
D i j = R X i X j 2 + Y i Y j 2 ( i > j )
where Xi and Yi represent the geographical coordinates of the geometric midpoint of the i-th sub-region; Mi is the quantitative value of a certain attribute in the sub-region (such as maize yield); and Xi and Yi are the geographical coordinates of the center of gravity of a certain attribute in the large area. Di-j represents the distance (in km) moved by the center of gravity from year j to year i; (Xi, Yi) and (Xj, Yj) represent the geographical coordinates of the center of gravity in years i and j, respectively; and R takes the constant 111.13, which represents the coefficient of the conversion of the spherical latitude and longitude coordinates into plane distances.
(2) Standard deviation ellipse
The standard deviation ellipse describes the direction and degree of dispersion of spatial data. It calculates the standard deviation of spatial data, generating an ellipse to represent the distribution, direction, and degree of dispersion of the data. The formula is as follows [47]:
δ x = k = 1 n A k X ¯ k cos θ A k Y ¯ k sin θ k = 1 n A K 2
δ y = k = 1 n A k X ¯ k sin θ A k Y ¯ k cos θ k = 1 n A K 2
where δx is the standard deviation of the major axis; δy is the standard deviation of the short axis; and θ is the azimuth of the ellipse. The long semi-axis of the standard deviation ellipse is used to characterize the dominant direction of the spatial distribution of maize planting, while the short half-axis reflects the spatial distribution range of maize planting. The overall size of the ellipse reveals the degree of agglomeration of the spatial distribution of maize planting.
(3) Evaluation of the fragmentation of the maize planting landscape
In view of the fact that the landscape index can quantitatively represent the distribution, structure, scale, and other changes in different landscape types, the following six landscape indices were selected as evaluation indices for the fragmentation of the crop planting landscape [53,54].
1) Number of patches (NP) is calculated as follows:
N P = N
where N is the total number of patches in the landscape.
2) The edge (ED) density index represents the length of the edge of the plaque per unit area. The higher the value, the greater the degree of fragmentation. The calculation formula is as follows:
E D = E A
where E is the total edge length of the patch; and A is the total area of the landscape.
3) The mean patch size (MPS) represents the average area of patches in the landscape. The smaller the value, the smaller the average area of the plaque and the greater the degree of fragmentation. The calculation formula is as follows:
M P S = A N
where A is the landscape area; and N is the number of patches.
4) The patch density (PD) indicates the number of patches per unit area. The higher the value, the greater the degree of fragmentation as follows:
P D = N A
5) The mean Euclidean nearest-neighbor distance (MNN) represents the average distance between patches. The higher the value, the higher the degree of fragmentation. The calculation formula is as follows:
M N N = i = 1 N h i N
where hi is the distance between the i-th plaque and its nearest plaque.
6) The area-weighted mean shape index (AWMSI) represents the average shape complexity of the patch. The higher the value, the higher the degree of fragmentation. The calculation formula is as follows:
A W M S I = i = 1 N 0.25 P i a i a i A
where Pi is the circumference of the i-th plaque; ai is the area of the i-th plaque; and A is the total area of the plaque.
(4) Hot and cold analysis
Hot and cold analysis (Getis-0rd G i ) is a spatial clustering analysis tool used to identify statistically significant high (hot spots) and low values (cold spots). The magnitude and sign of the z-score jointly indicate the significance of spatial clustering for high or low values. The higher the z-score, the greater the degree of clustering. If the z-score is close to zero, this means that there is no obvious spatial clustering. The calculation formula is as follows [55]:
G i = j = 1 n w i j x j X ¯ j = 1 n w i j S n j = 1 n w i j 2 j = 1 n w i j 2 n 1
X ¯ = i = 1 n x j n
S = j = 1 n x j 2 n 1 ( X ¯ ) 2
G i is the statistically significant Z-value score, where Getis-0rd is the G i statistic. When the G i > is 1.96, this area us a hot spot; that is, the higher maize plantings in this area are spatially clustered. When the G i < is 1.96, the area is a cold spot; that is, the lower maize plantings in this area are spatially clustered. xj is the maize sown area in the J area; wij is the spatial weight matrix; n is the number of regions; S is the standard deviation of the sample; and X ¯ is the mean of the sample.
(5) Panel model
The influencing factor panel model is a statistical model used to analyze multi-dimensional data, which can comprehensively reveal influencing factors by considering both time and individual effects. The calculation formula is as follows:
Y i t = α + β X i t + μ i + λ t + ϵ i t
where Yit is the dependent variable, the maize planting area, which represents the observation value of the ith individual at the t time point; Xit is an independent variable (such as population, urbanization rate, etc.), which represents the characteristics of the i-th individual at the t time point; α is a constant term; β is the coefficient of the independent variable, which represents the marginal effect of the influencing factor on the dependent variable; μi is the fixed feature of individual effects, such as counties; λt is the fixed feature of the time effect, such as the year; and òit is the random error term.
(6) Correlation Analysis
In this paper, the Pearson correlation coefficient was used to measure the linear relationship between maize planting area and various influencing factors and to explore the degree of correlation. The calculation formula is as follows:
r = i = 1 n ( X i X ¯ ) ( Y i Y ¯ ) i = 1 n ( X i X ¯ ) 2 i = 1 n ( Y i Y ¯ ) 2
where Xi and Yi represent the observed values of the two variables, X ¯ and Y ¯ represent the mean of the two variables, and n is the number of samples.
(7) Principal component analysis
Principal component analysis (PCA) is a commonly used dimensionality reduction technique that aims to simplify data structures and reveal the intrinsic relationships between variables by transforming raw variables into a handful of unrelated principal components through linear transformations. The steps and formula are as follows [56]:
1) Data standardization eliminates dimensional differences, calculated as follows:
Z i j = X i j μ j σ j
where Xij is the original value of the j-th variable of the i-th sample; μj is the mean of the j-th variable; σj is the standard deviation of the j-th variable; and Zij is the normalized value.
2) The covariance matrix is calculated as follows:
C = 1 n 1 Z T Z
where Z is the standardized data matrix; n is the number of samples; and ZT is the transpose matrix of Z.
3) The eigenvalue decomposition of the covariance matrix C is performed to obtain eigenvalues and eigenvectors. The formula for eigenvalue decomposition is as follows:
C = V Λ V T
where V is the eigenvector matrix and Λ is the diagonal matrix.
4) Select the main ingredient
The variables with the most significant impact on the overall model are selected from many variables, and the top k most important features are selected as the main influencing factors by comparing the size of each feature value.
5) Calculate principal component scores
The formula for calculating principal component scores is as follows:
Y = Z V
where V is the eigenvector matrix; Y is the principal component scoring matrix; and Z is the standardized data matrix.
6) Interpretation of principal components
According to the correlation coefficient between the principal component and the original variable, i.e., the load coefficient, we explain the meaning of the principal component. The calculation formula is as follows:
L i j = V i j λ j
where Lij is the load coefficient of the i-th original variable on the j-th principal component; Vij is the coefficient of the i-th original variable on the j eigenvector; and λj is the j eigenvalue.
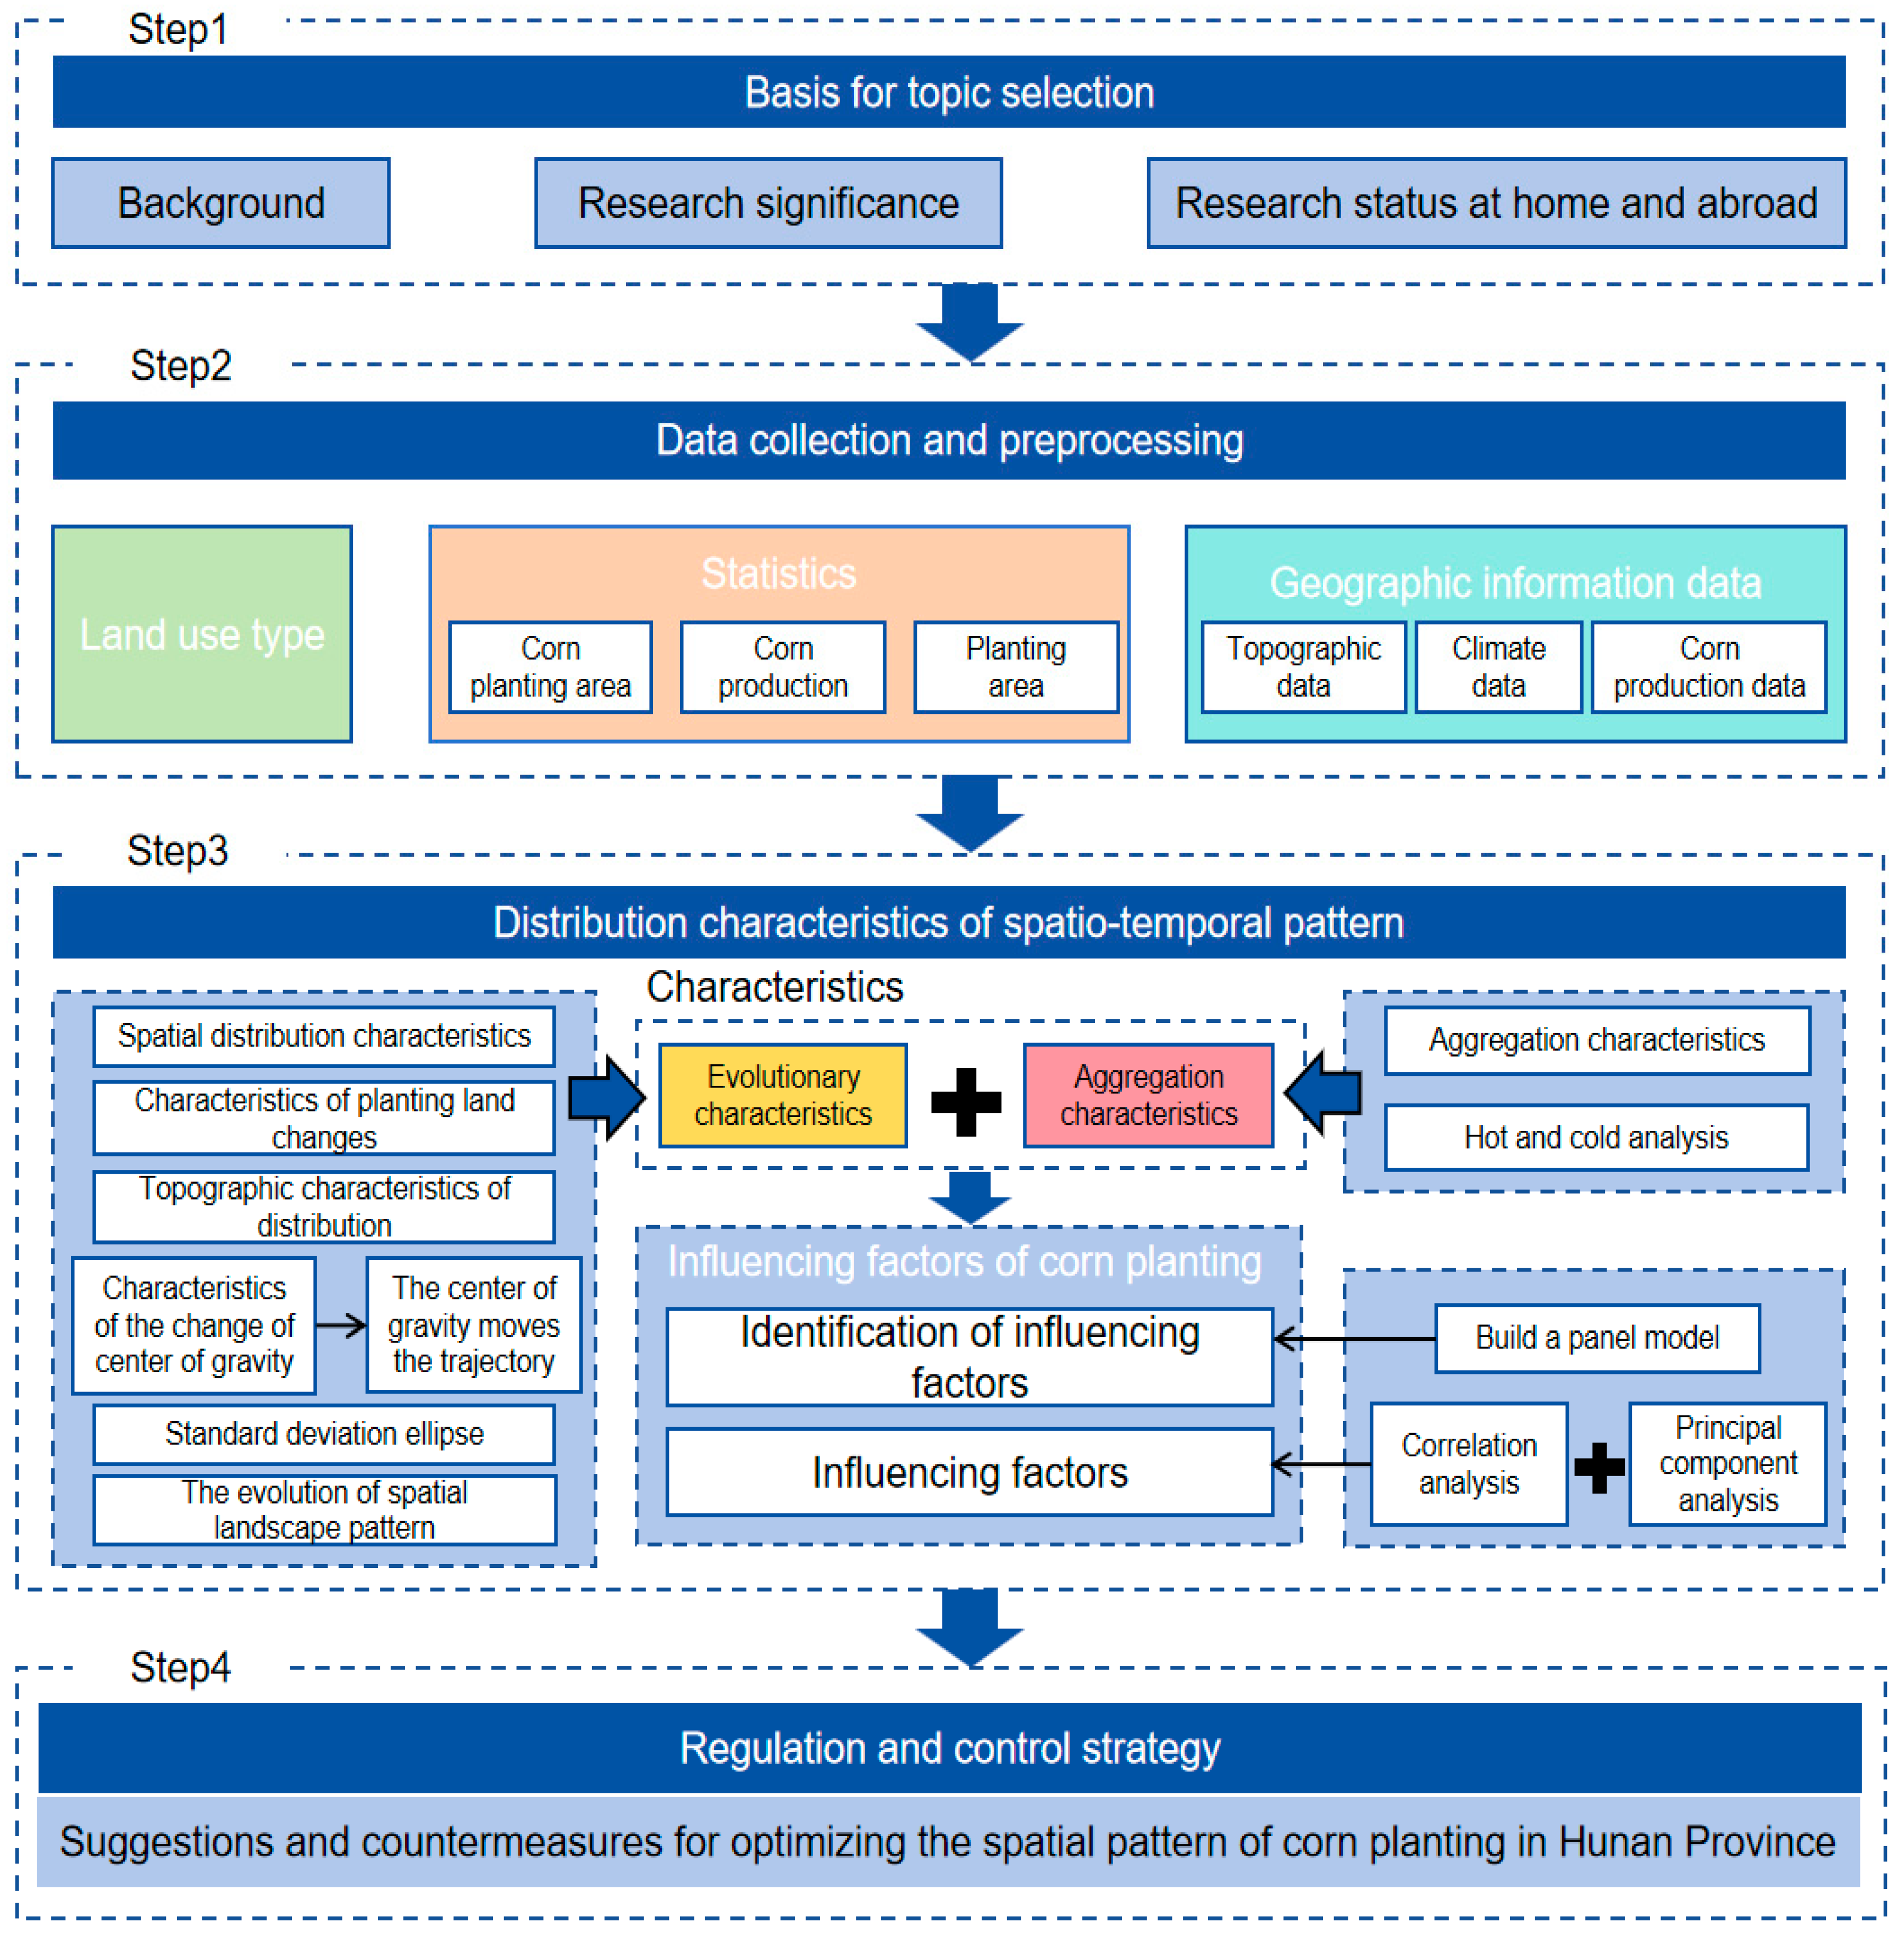
The technical route is shown in Figure 2.

3. Results

3.1. Evolution Characteristics of Maize Planting Spatial Pattern

3.1.1. Overview of Maize Planting in Hunan Province

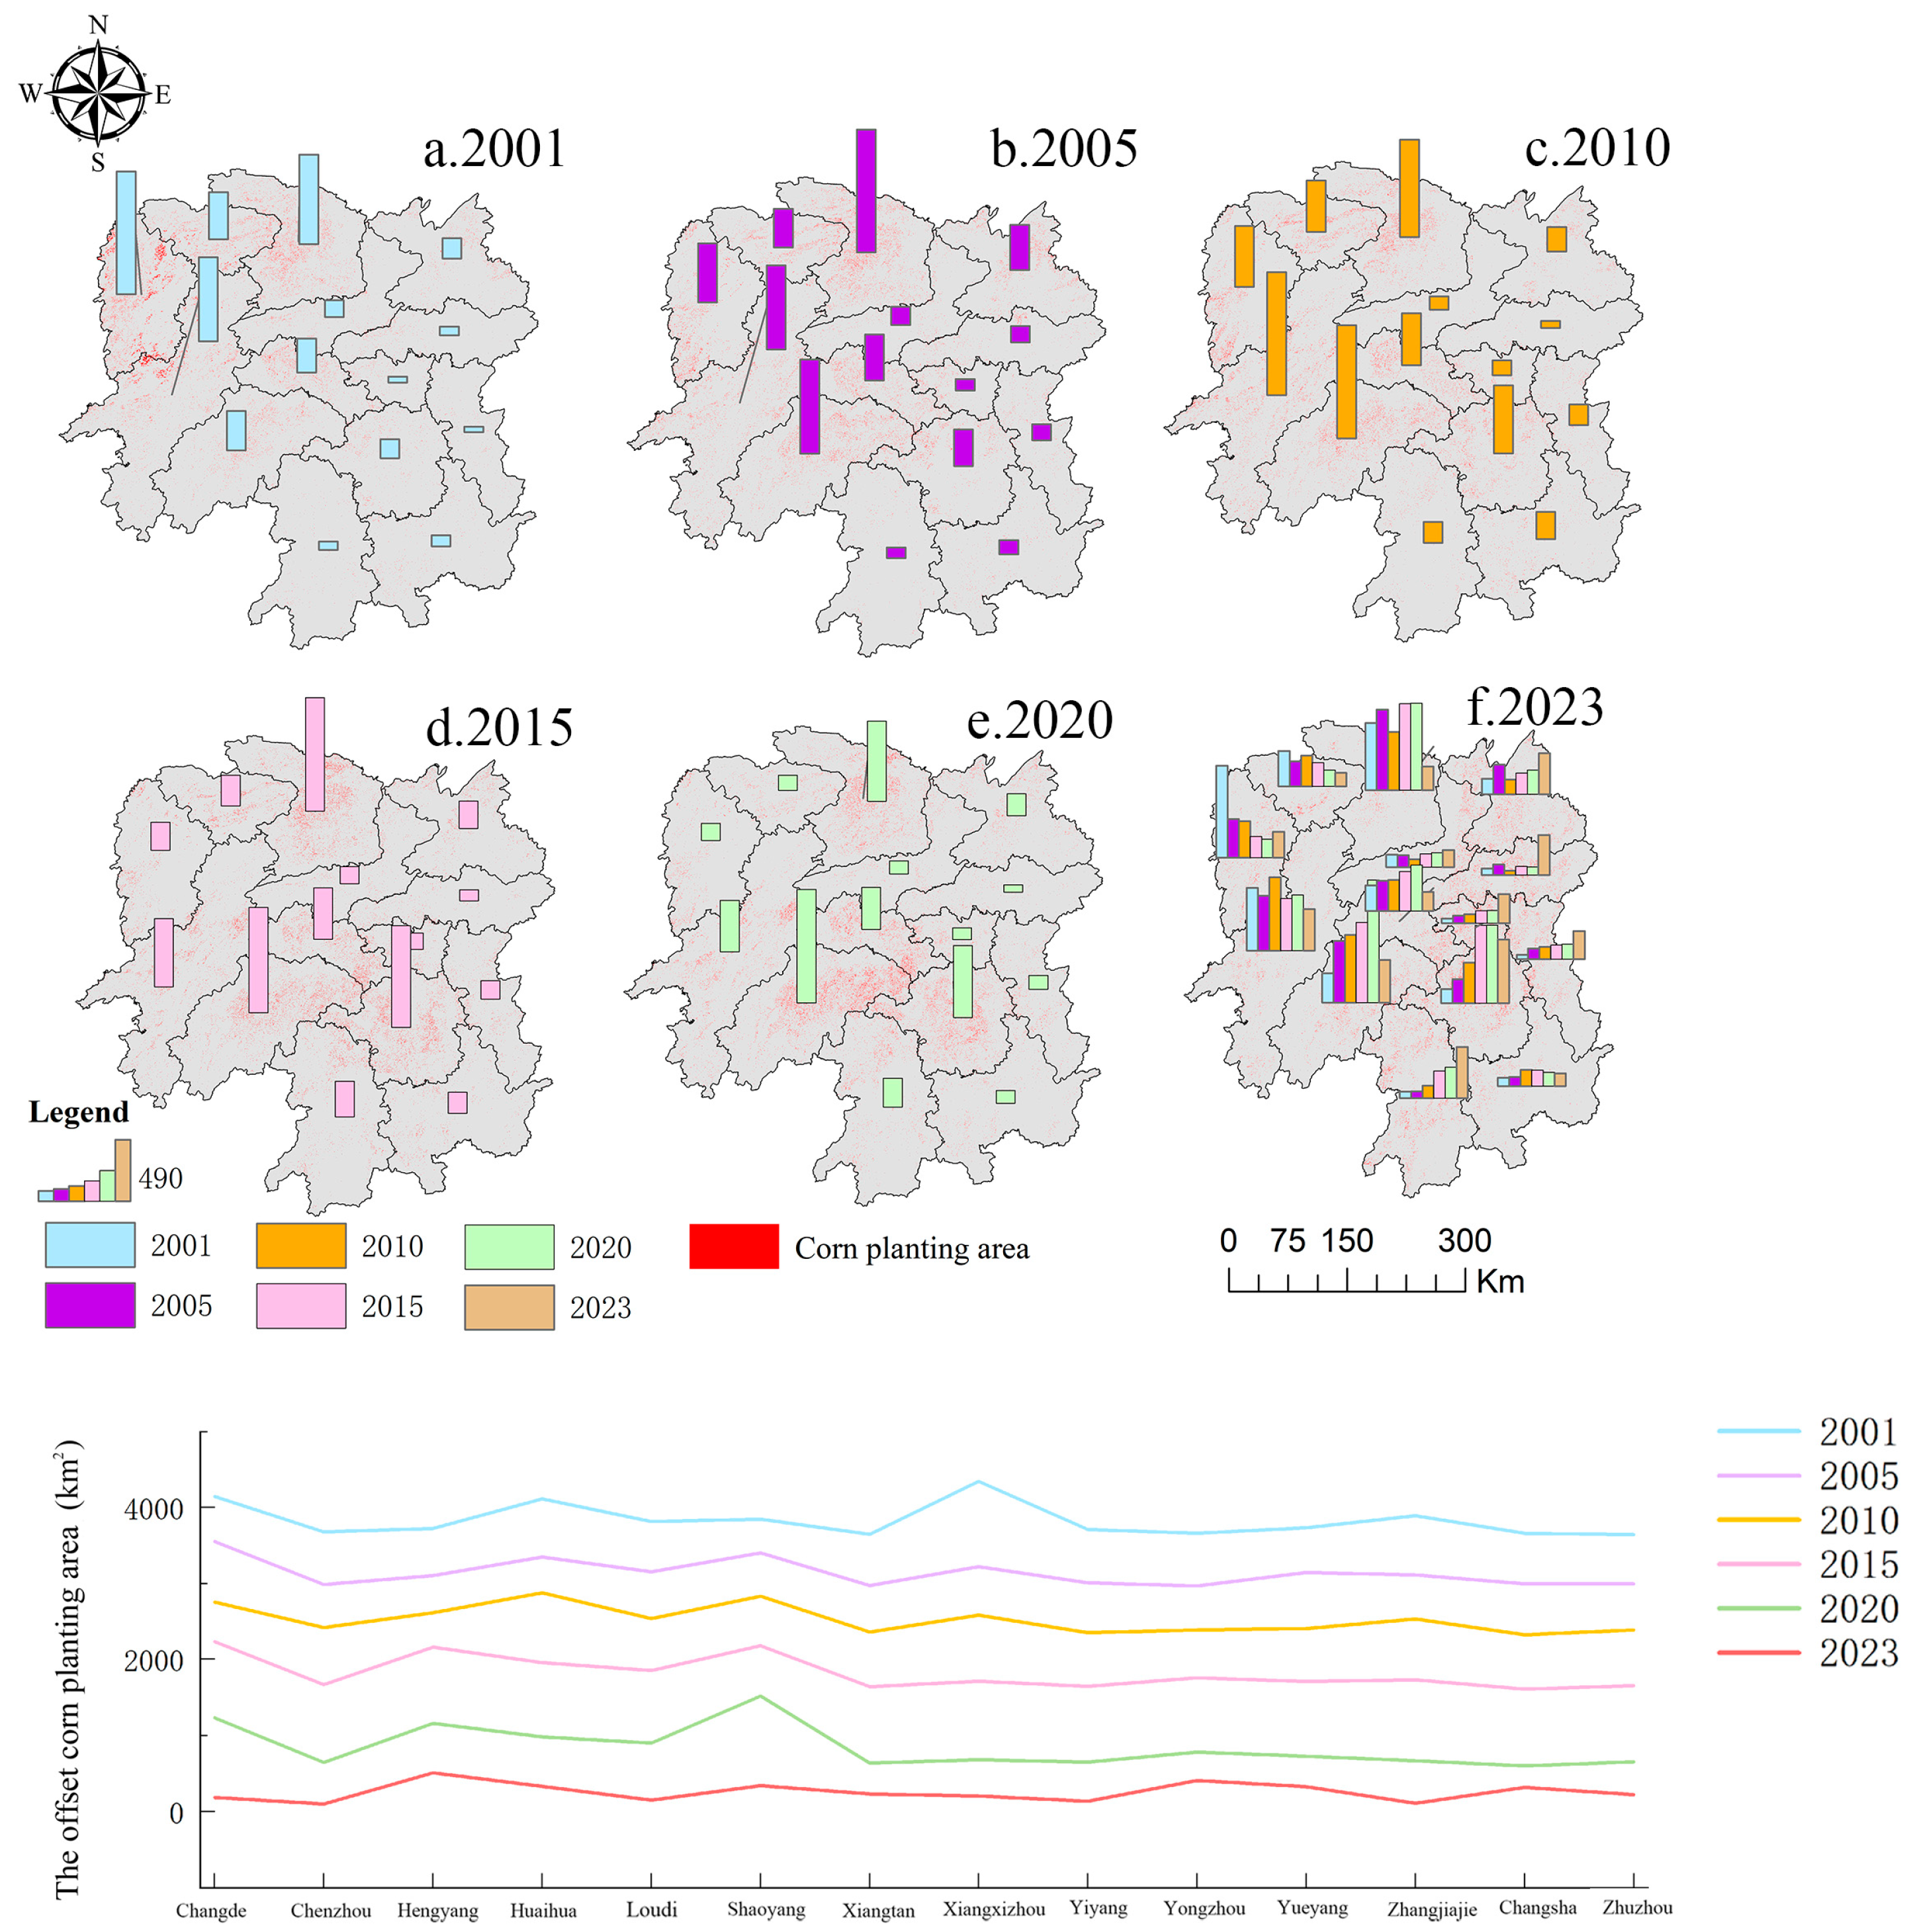
From 2001 to 2023, the maize planting area in Hunan Province showed an overall growth trend, showing a trend of first increasing and then decreasing in the time series, while in terms of spatial distribution, it showed the characteristics of gradual aggregation from northwest to east. From Figure 3, it can be seen that for the change in the maize planting area in Hunan Province, 2019 was the turning point; the maize planting area from 2000 to 2019 showed a fluctuating and upward trend, and the planting area was small. After 2019, the planting area demonstrates a downward trend, and the change in planting area has tended to be flat since 2021, indicating that the planting pattern of maize is gradually stabilizing. Overall, the planting area of maize in Hunan Province increased from 2798.34 km2 in 2001 to 3272.56 km2, an increase of 16.95%, which it peaked, with a planting area of 3988.49 km2, in 2019. This trend is consistent with the results of An Yue [57] et al.; that is, the planting area of maize in Hunan Province showed a significant increase during this period. According to Figure 4, from 2000 to 2023, the maize planting areas in the Shaoyang, Changde, Hengyang, and Huaihua cities were relatively large, indicating that the maize planting scale of these three prefecture-level cities was large.

3.1.2. Characteristics of Change in Maize Planting Area

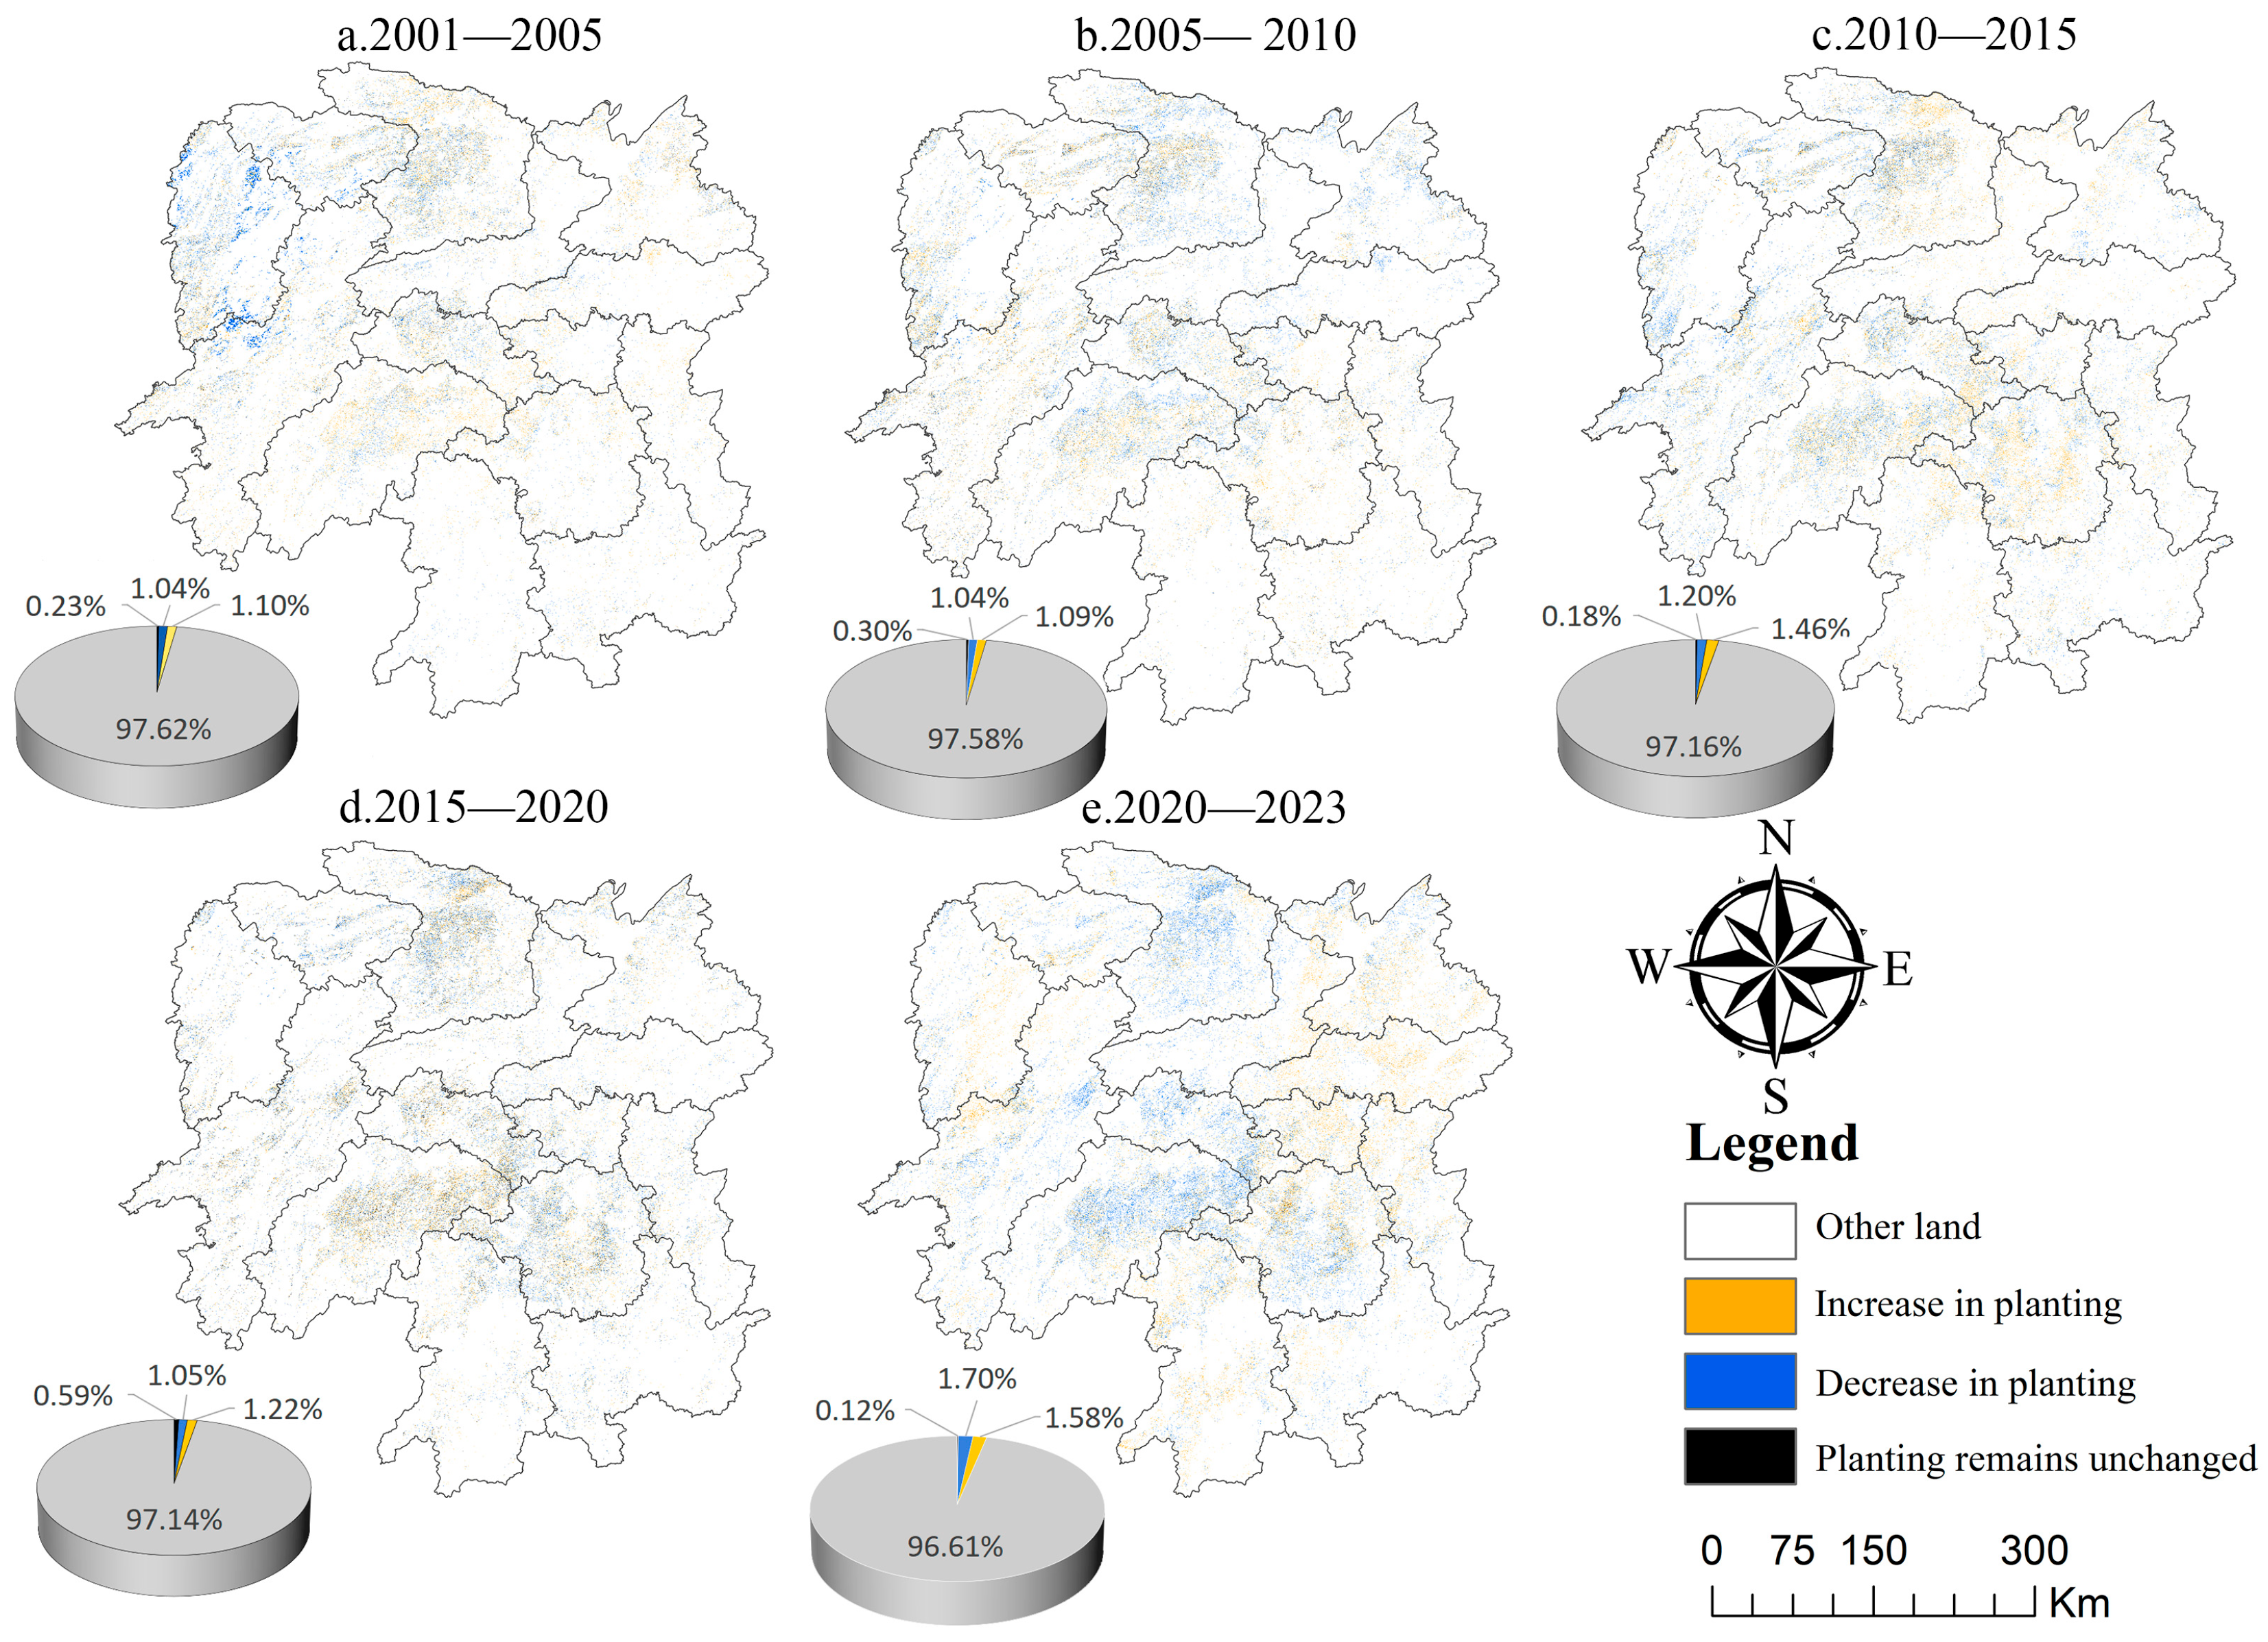
From 2001 to 2020, the expansion trend of the maize planting area was obvious, while from 2020 to 2023, there was a slight decline, and the spatial distribution showed obvious regional agglomeration characteristics, with Shaoyang, Loudi, and Changde as conversion hot spots. From Figure 5 and Table 1, it can be seen that the maize planting area in Hunan Province showed a significant growth trend from 2001 to 2020, while it declined slightly from 2020 to 2023. Specifically, from 2001 to 2005, the land use conversion was characterized by the conversion of 2408.97 km2 to maize planting land, mainly concentrated in Shaoyang City and Loudi City in the central part of Hunan Province and Changde City in the north. In addition, the area of maize planting land converted to other land was 2286.61 km2, and the reduction area was mainly concentrated in the western part of Hunan Province. From 2005 to 2010, the intensity of land use conversion decreased relatively weakly, and the area of other land converted to maize planting land decreased slightly to 2380 km2, while the area of maize planting land converted to other land was 2274.74 km2, indicating that land use conversion tended to be stable during this period. From 2010 to 2015, the area of other land converted to maize planting land increased significantly to 3194.8 km2, reflecting the obvious expansion trend of maize planting at this stage. From 2015 to 2020, the hot areas of land use conversion were mainly concentrated in Hengyang, Shaoyang, and Changde, and the area of other land converted to maize planting land fell slightly to 2661.47 km2, showing that the expansion rate has slowed down. From 2020 to 2023, the land use conversion showed the characteristics of wide spatial distribution and high intensity, with the area of other land converted to maize planting land being 3059.27 km2, while the area of maize planting land converted to other land reached 3282.63 km2.

3.1.3. Topographic Distribution Characteristics of Maize Planting

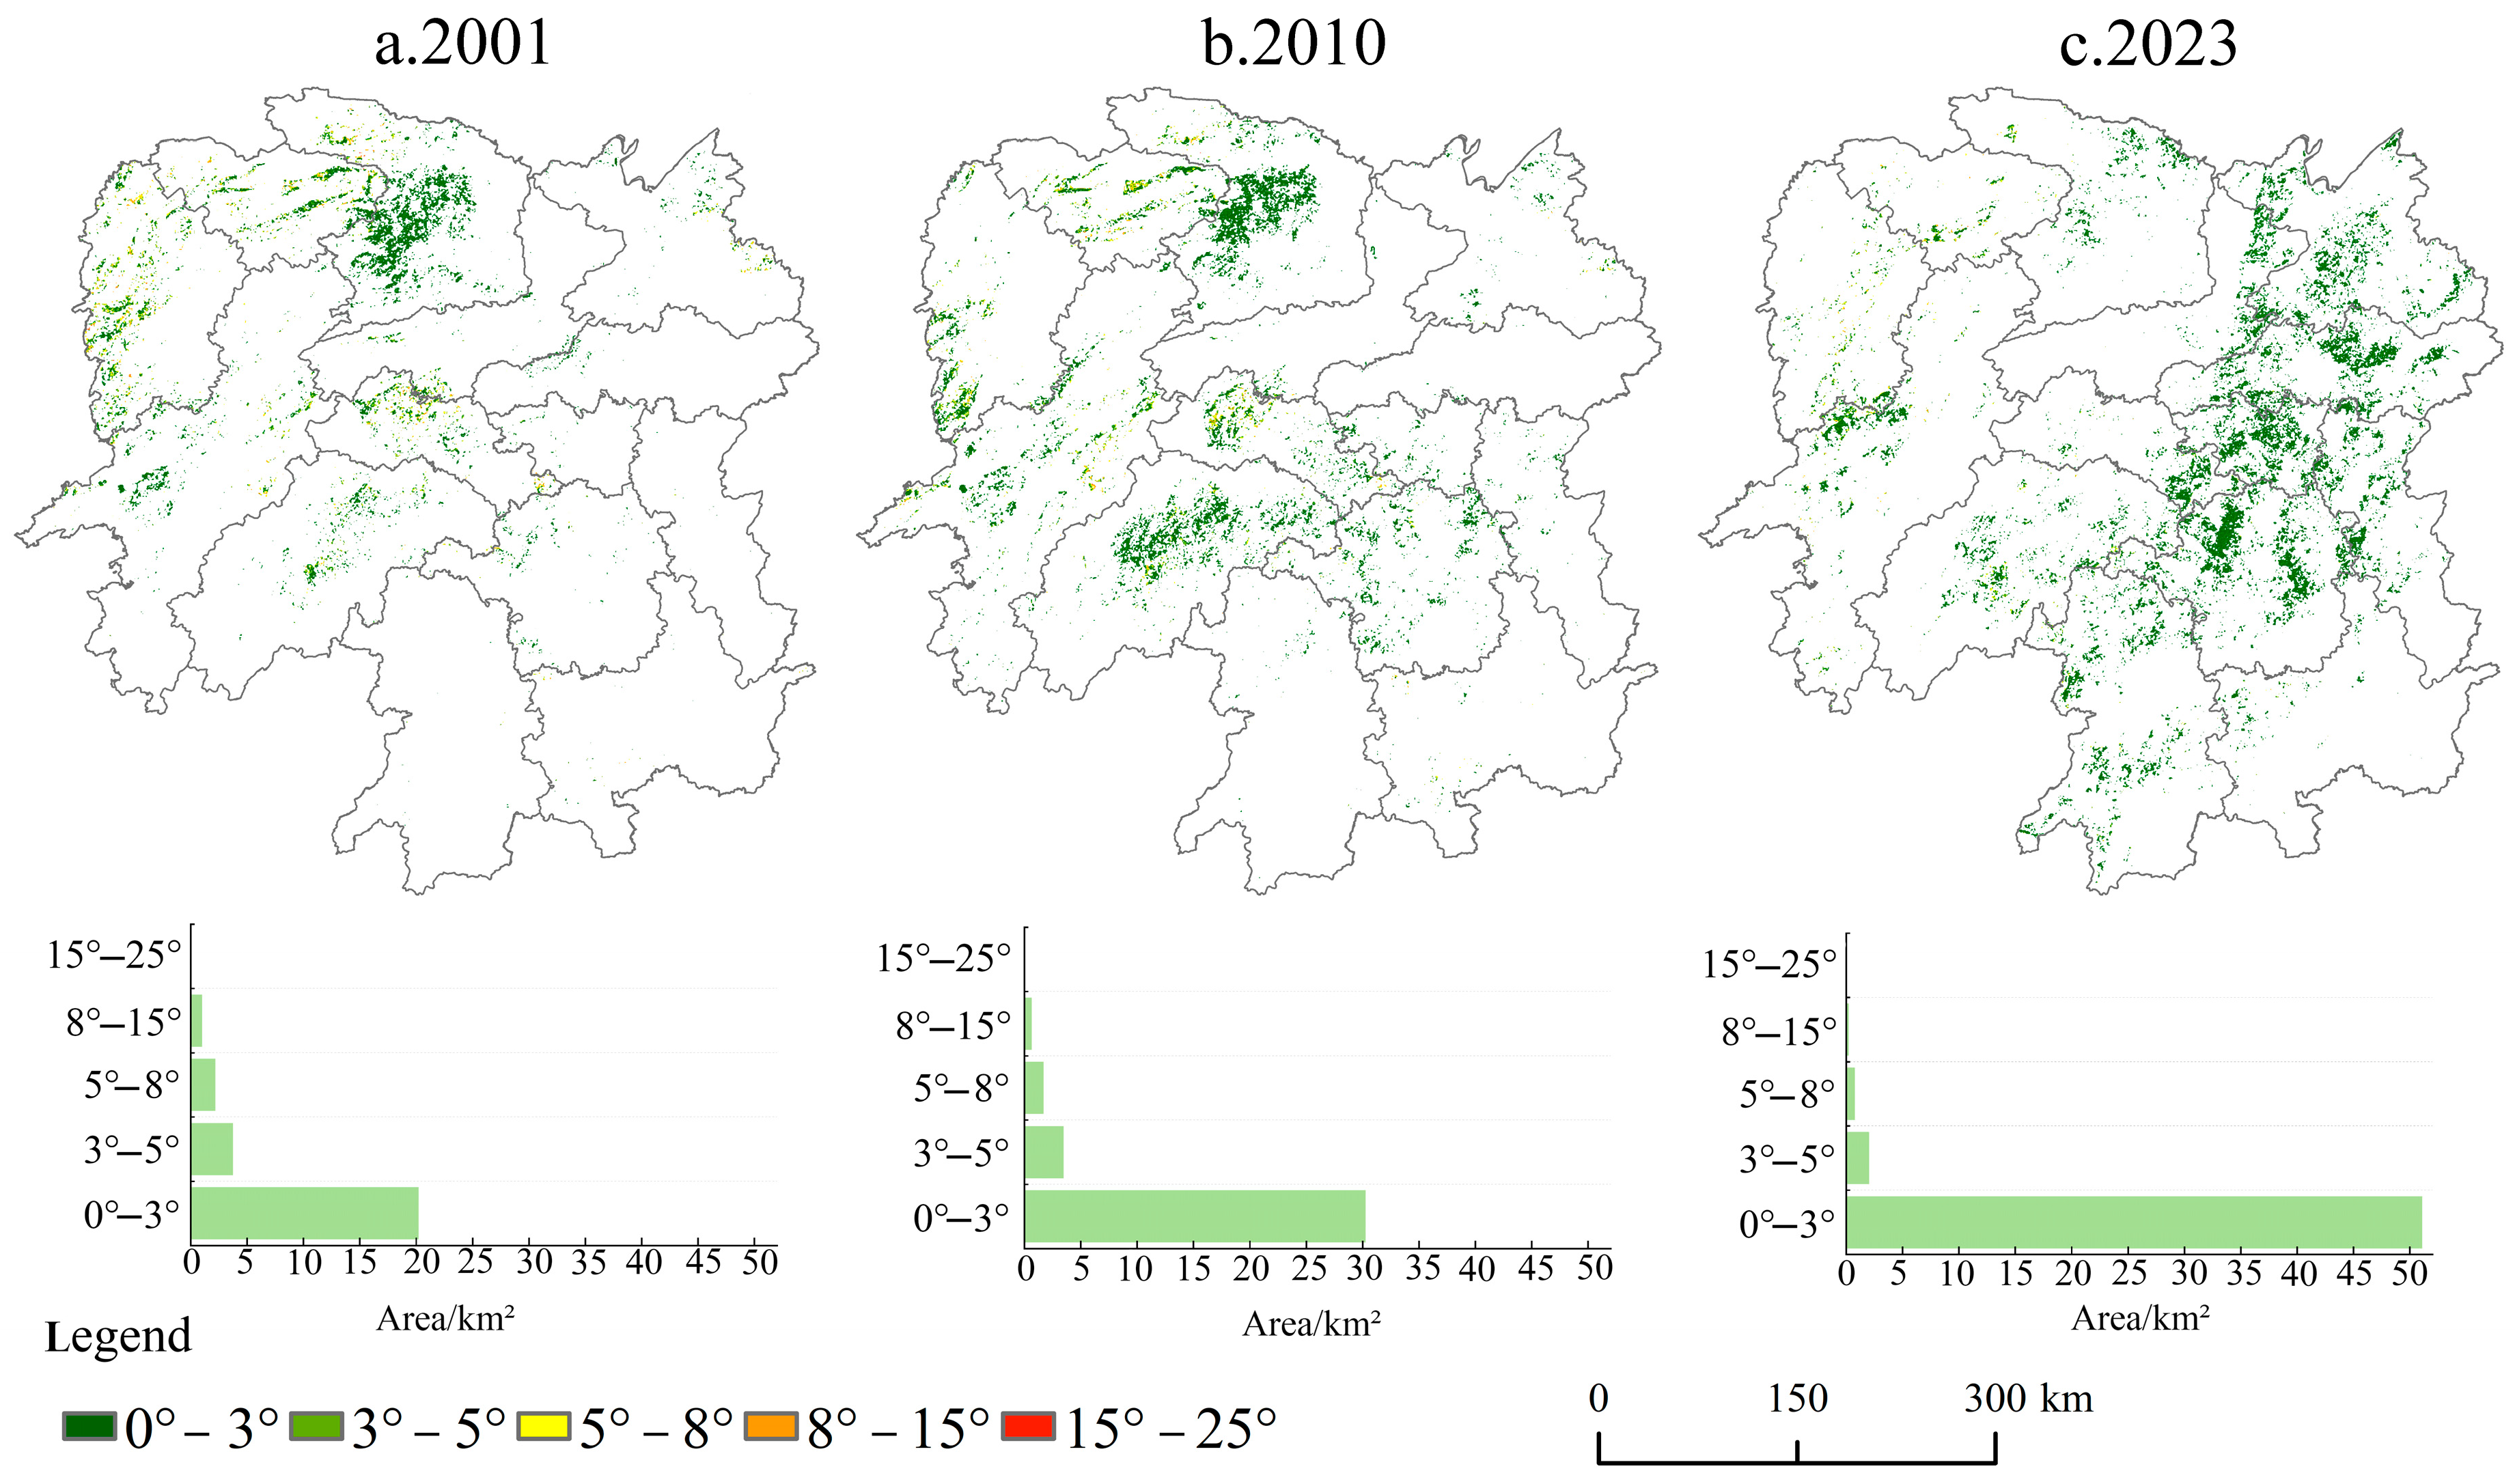
The spatial pattern of maize planting in Hunan Province has significant topographic distribution characteristics, mainly concentrated in the gentle terrain area of 0–3°, and the planting area gradually shifted to the eastern gentle area from 2001 to 2023. According to the “Soil Erosion Classification and Grading Standard” (SL 190-2007), the slope is divided into five grades: 0–3°, 3–5°, 5–8°, 8–15°, and 15–25°. The spatial distribution analysis based on Figure 6 shows that the spatial distribution of maize planting in Hunan Province has significant topographic selectivity characteristics, which is mainly concentrated in the gentle terrain area of 0–3°. From the perspective of time series, maize planting in 2001 and 2005 was mainly distributed in the northern and central terrain slopes of Hunan Province. In 2023, the spatial distribution pattern of maize planting will change, showing a trend of shifting to the gentle areas of eastern Hunan Province. It is worth noting that in the slope range of 8–25°, maize planting showed sporadic distribution characteristics.

3.1.4. The Standard Deviation Ellipse and Center of Gravity Shift in Maize Planting

From 2001 to 2023, the center of gravity of maize production in Hunan Province moved eastward and southward in a “Z” shape, with Loudi City as the core, and the planting agglomeration area maintained the northwest–southeast distribution characteristics. From the perspective of the center of gravity movement trajectory (Figure 7), the center of gravity of maize production generally moves in the southeast direction, which is roughly “Z” shaped, showing a trend of “moving east to south,” indicating that the contribution rate of eastern Loudi City to maize production in Hunan Province has increased. Specifically, it can be divided into three stages: from 2001 to 2005, the center of gravity of maize production shifted to the southeast; from 2010 to 2015, the center of gravity of production shifted to the southwest; and from 2010 to 2023, the center of gravity of production shifted to the southeast. The center of gravity obtained from Table 2 does not change much, fluctuating between 111.2932° E~111.956328° E and 27.6955° N~28.1657° N, all of which are located in Loudi City, of which the migration speed is the slowest from 2015 to 2020, moving only 5.88 km. From the calculation results and spatial distribution of the standard deviation ellipse, the standard deviation ellipse of grain production did not change much during the study period, with Loudi City as the center. The scope roughly covered Yiyang, Changsha, Shaoyang, and other areas in central Hunan Province, and the planting agglomeration area was roughly distributed from northwest to southeast.

3.1.5. Changes in the Landscape Pattern of Maize Planting

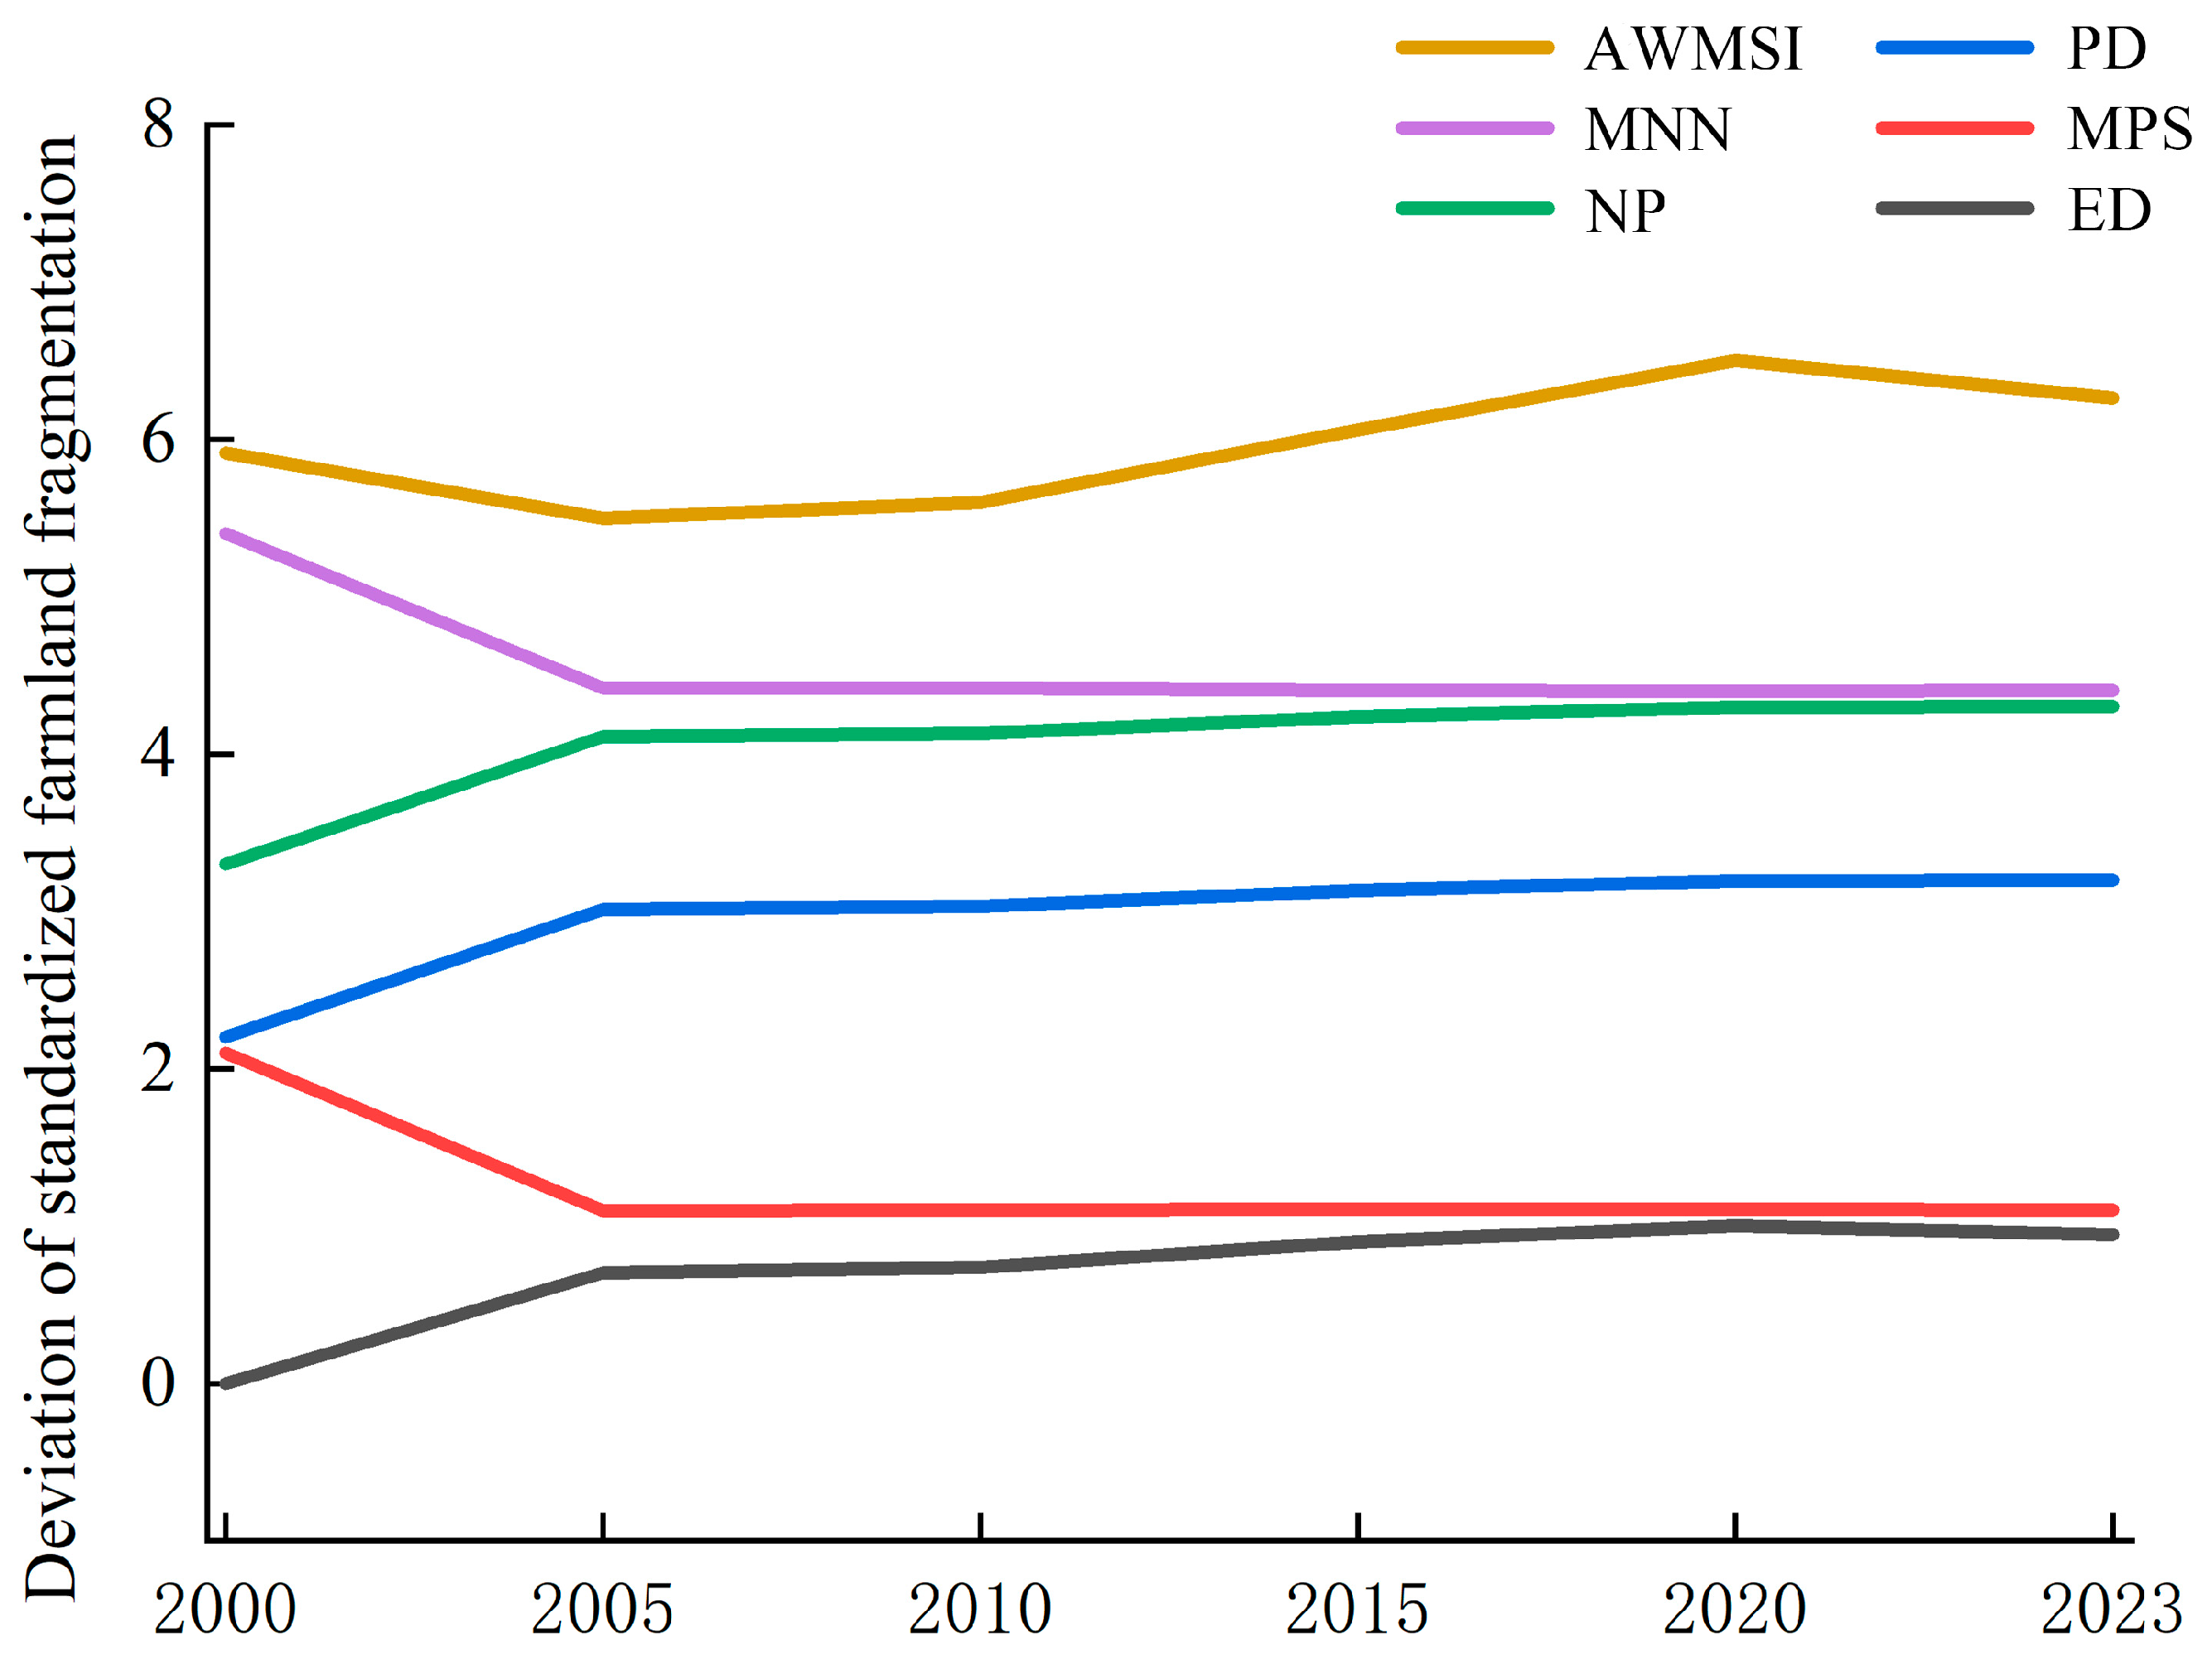
From 2001 to 2023, the cultivated land fragmentation degree of the maize planting landscape in Hunan Province showed an increasing trend. From Figure 8 and Table 3, it can be seen that from 2001 to 2023, the landscape pattern of maize planting in Hunan Province showed the characteristics of dynamic change. In terms of area edge index, from 2001 to 2020, the patch boundary density index (ED) showed an upward trend, and the patch boundary density index jumped from 0.7689 to 4.1928. The average patch area (MPS) decreased sharply from 2001 to 2005, i.e., from 50.0672 to 3.2185, and the average patch area index showed a slight increasing trend from 2005 to 2023. It decreased slightly from 3.6028 to 3.3761, which indicated that the degree of maize landscape fragmentation increased from 2001 to 2023. In terms of convergence and divergence indices, the patch density (PD), the number of patches (NP), and the mean Euclidean nearest neighbor (MNN) index all showed a continuous upward trend, with the patch density index climbing from 0.0257 to 0.5021, the patch number index surging from 5474 to 106,479, and the average Euclidean nearest distance dropping sharply from 2001 to 2005. It decreased from 2582.748 m to 577.179 m and then slightly decreased to 541.6392 m in 2023, indicating that the number of plaques increased from 2001 to 2023, and the distribution tended to be dispersed and fragmented. In terms of shape indicators, the area-weighted average patch shape index (AWMSI) showed a fluctuating trend of “down–up–down,” decreasing from 1.1922% to 1.1649% from 2001 to 2010 and then increasing to 1.2231% in 2023. With the acceleration of urbanization, the fragmentation of cultivated land for maize planting is affected by human activities such as social and economic activities and urban construction, and the area of construction land is an important driving force affecting the degree of cultivated land fragmentation [58].

3.2. Analysis of Planting Space Agglomeration Characteristics

Based on a county-scale Getis-Ord Gi* analysis (Figure 9), the spatiotemporal distribution of maize planting in Hunan Province from 2001 to 2023 exhibited clear and dynamic evolution. Hot spots, initially concentrated in the northwest, demonstrated a marked directional migration, expanding southeastward to establish a consolidated core in the central region by the terminus of the study period. Concurrently, cold spots shifted from a central to a northeastern orientation.
This reorganization was characterized not merely by spatial translation but by significant fluctuations in the clustering intensity and statistical significance of identified counties. The period witnessed numerous categorical changes—counties were upgraded or downgraded in significance level (e.g., from significant to extremely significant hot spots), emerged as new clusters, or reverted to spatial randomness. By 2023, this culminated in a more simplified and polarized spatial structure, featuring a reduced number of highly significant hot spots alongside a contracted, yet distinct, northeastern cold spot zone.
In conclusion, the analysis reveals a coherent spatiotemporal transition, defined by the systematic southeastward propagation of maize cultivation hot spots and a countervailing northeastern shift in cold spots, reflecting underlying agronomic, economic, or environmental drivers reshaping the agricultural landscape of Hunan Province.

3.3. Analysis of Influencing Factors

3.3.1. Influencing Factors Panel Analysis

In terms of natural factors, topographic characteristics, water and fertilizer flow, irrigation, and terrain undulation and slope are closely related [59]. Meteorological conditions are important indicators by which to measure the suitability of maize planting, which has a direct and far-reaching impact on the whole process of maize growth and development and the final yield. Soil conditions, such as soil fertility and organic matter content, are also regarded as core factors in evaluating maize planting adaptability. In addition, the input of agricultural production factors is a key variable driving the evolution of crop planting patterns [30], such as the scale of agricultural labor, the total power of agricultural mechanization, and the amount of chemical fertilizer application, which not only directly affect production efficiency and quality but also are the core supporting conditions for ensuring high and stable grain yield. At the same time, government policy intervention also has a guiding and regulatory role [60], such as through the optimization and adjustment of planting structure and economic subsidy policies, which can effectively guide farmers to adjust the crop planting structure and optimize the production pattern.
Based on the research results and data acquisition of scholars, 13 indicators were selected from four aspects—socioeconomy, agricultural production conditions, population, and policy—to analyze their impact on the spatiotemporal dynamics of maize planting in the city. From the perspective of social and economic dimensions, indicators such as urbanization rate (UR), GDP, primary industry gross output value (PIGOV), and agricultural output value (AOV) are selected. The urbanization rate can intuitively reflect the development process of urbanization. GDP is a key indicator to measure the overall economic development level of the region. The PIGOV and the AOV are directly related to the vitality of the agricultural economy. These indicators reflect the direct or indirect impact of urbanization and regional economic development on maize planting from different aspects. The dimension of agricultural production conditions includes indicators such as the total agricultural machinery power (TAMP), effective irrigation area (EIA), chemical fertilizer application (CFA), mechanized cultivation area (MCA), and the number of reservoirs (NR). The TAMP is an important indicator to measure the level of agricultural mechanization. The EIA and the NR reflect the perfection of local water conservancy facilities, and the CFA and the MCA reflect the input level of agricultural production. In terms of population size, the rural population (RP) and the primary industry employment (PIE) were selected as analysis indicators. The RP and PIE directly reflect the scale and supply of rural labor resources, and the sufficiency of labor is crucial to the sustainability of maize planting. Policy factors reflect the government’s support for agriculture through fiscal expenditure (FE) and fiscal revenue (FR), and policy support can create favorable conditions for the expansion of the maize planting area through capital investment and infrastructure construction.

3.3.2. Analysis of Driving Factors of Crop Production Pattern Change

(1) Correlation analysis of influencing factors of maize planting in Hunan Province
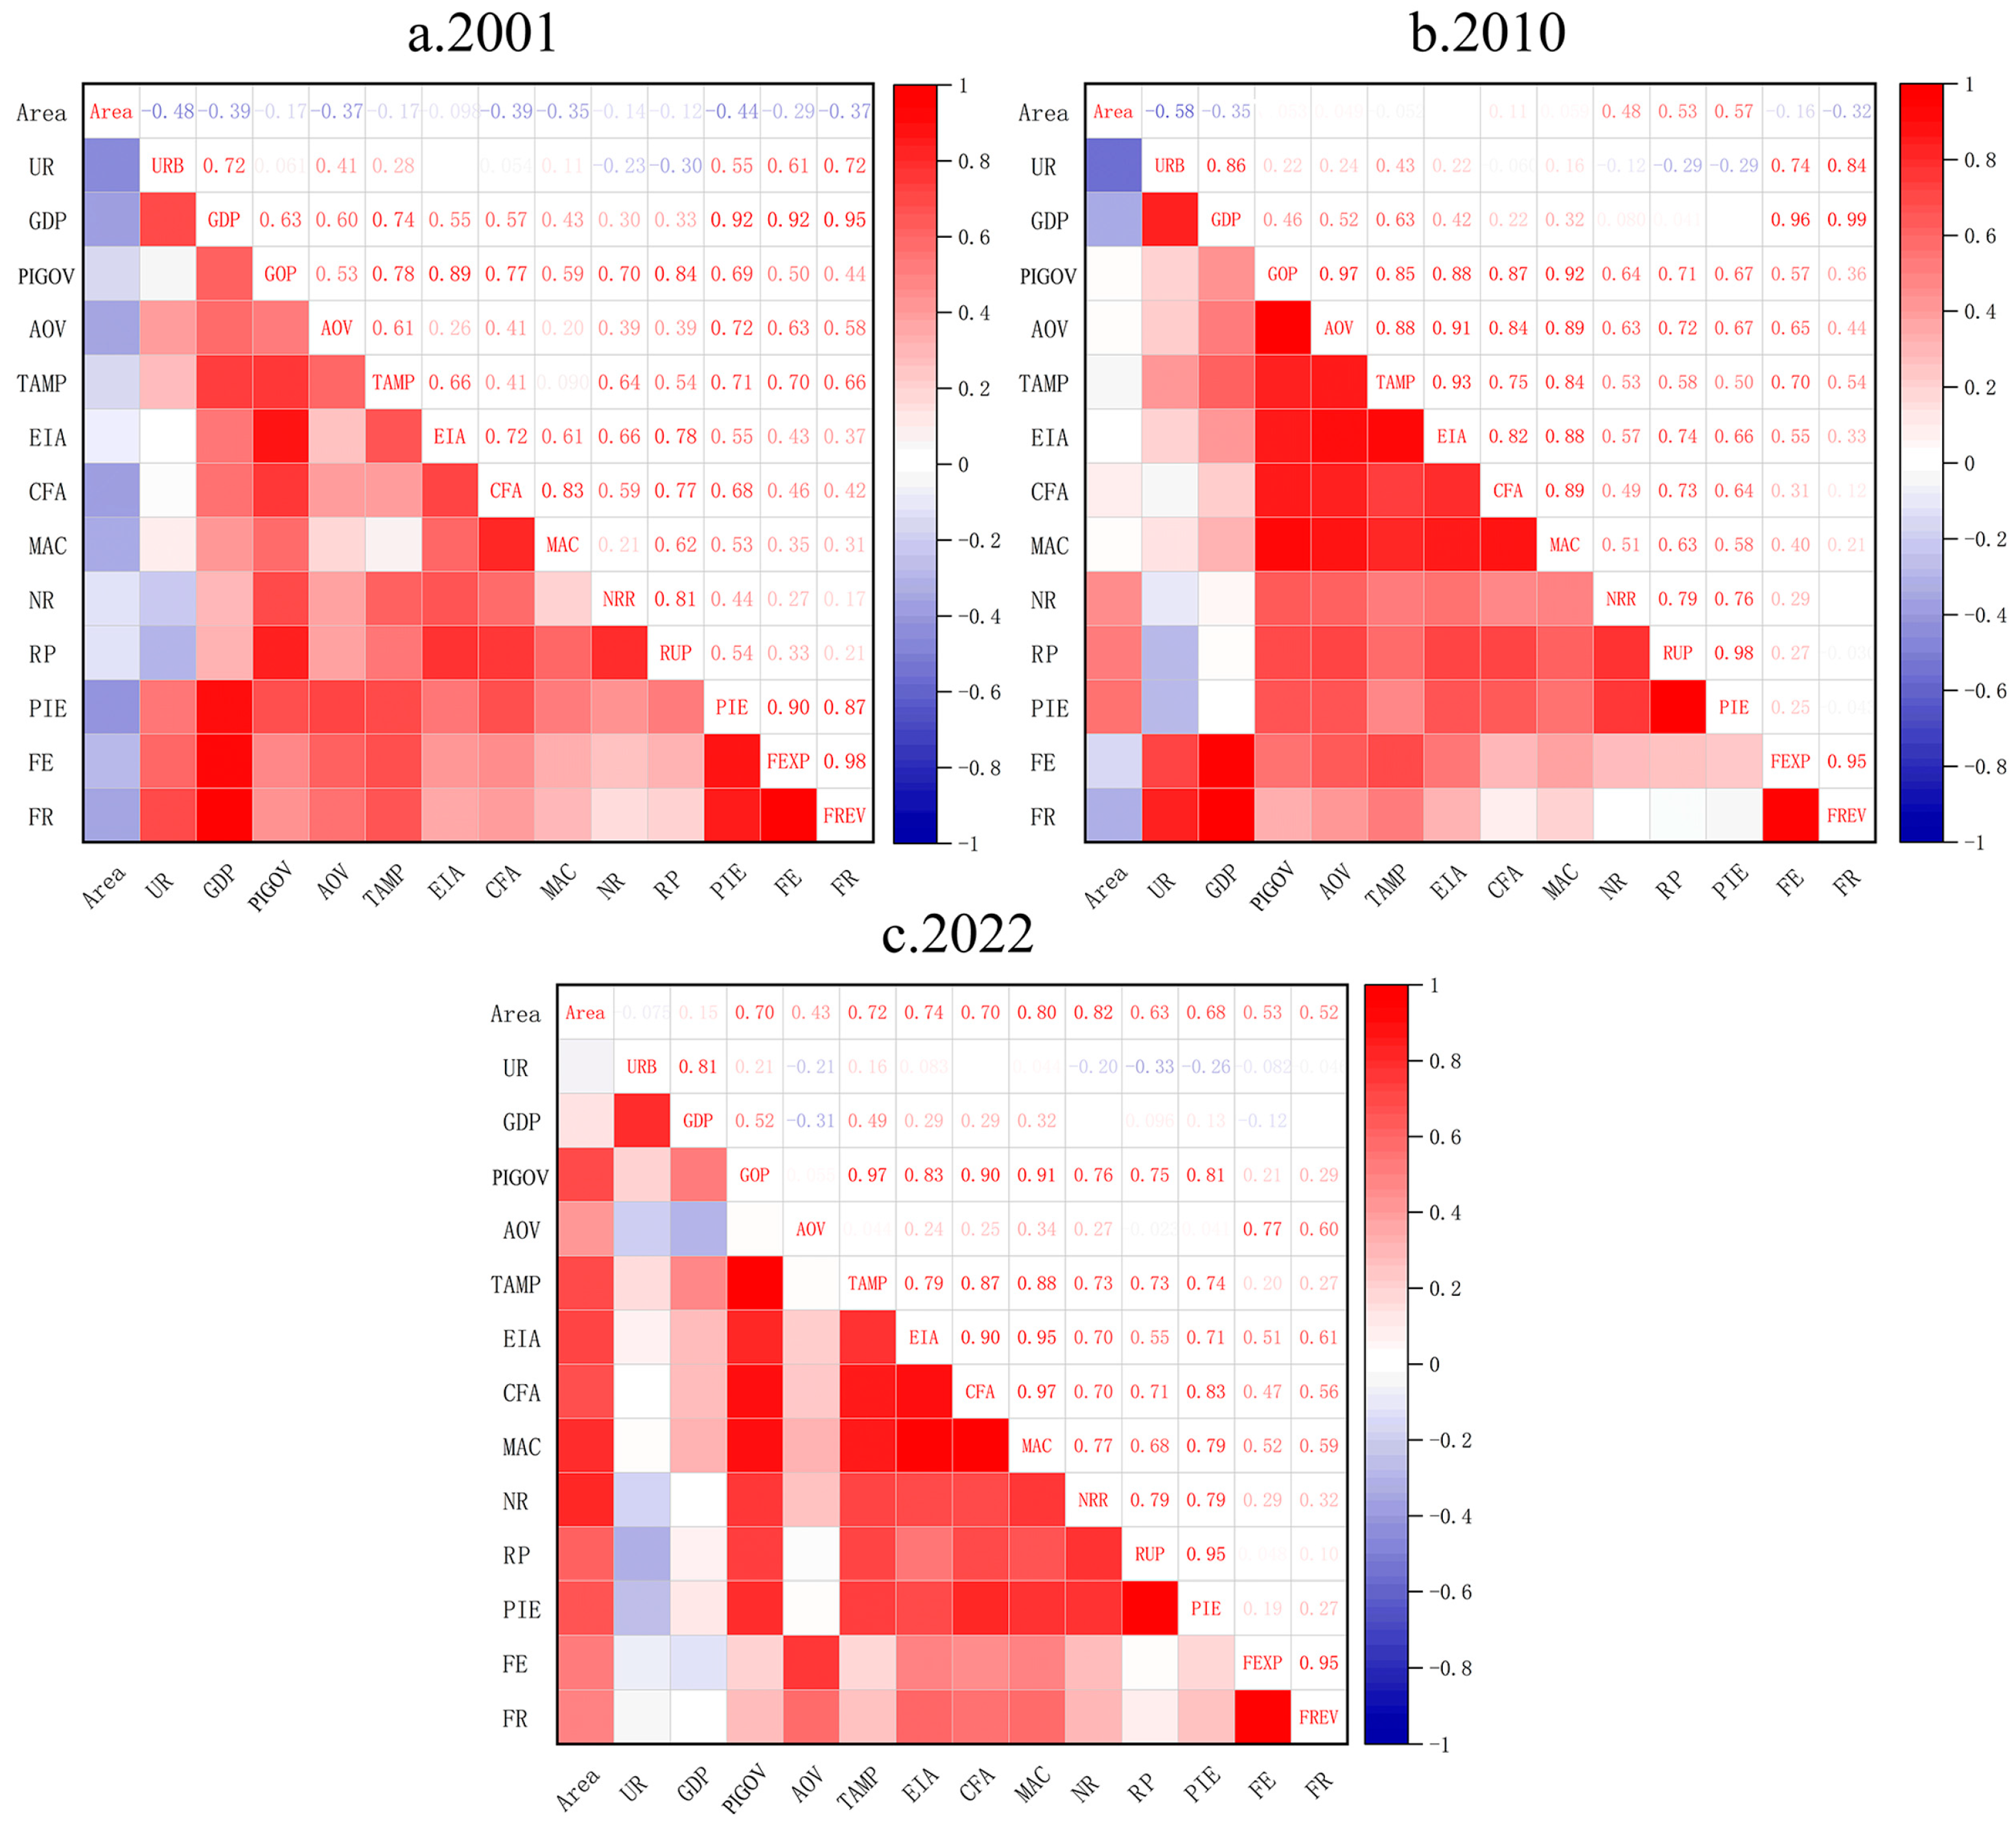
As shown in Figure 10, in 2001, most influencing factors exhibited negative correlations with maize cultivation area, with UR and PIE showing moderate-to-strong negative associations (r < −0.4). This pattern reflected the accelerated urbanization and industrialization in China, which drove sustained rural labor outmigration and exerted a crowding-out effect on agricultural production. Concurrently, economic growth and fiscal resources were increasingly directed toward non-agricultural sectors, leaving traditional grain cultivation relatively under-supported. Agricultural modernization inputs also showed negative or weak correlations with cultivation area, indicating low adoption rates and limited effectiveness.
By 2010, a structural shift emerged. Indicators directly linked to agricultural production efficiency began to display weak positive correlations, with significant positive relationships for NR (0.48), RP (0.53), and PIE (0.57). Strengthened agricultural policy support, together with initial gains from mechanization and technological advancement, contributed positively to stabilizing cultivated area. The positive correlations with rural population and agricultural labor may reflect regional heterogeneity or structural adjustment effects. Nonetheless, negative correlations with urbanization, macroeconomic, and fiscal indicators persisted, underscoring transitional tensions.
By 2022, modernization-related factors became dominant drivers, with TAMP (0.72), EIA (0.74), CFA (0.70), and MAC (0.80) exhibiting strong positive correlations with maize cultivation area. Positive associations with agricultural infrastructure, labor availability, and policy support were markedly strengthened. This stage represents a fundamental transformation in cultivation dynamics, with advanced modernization emerging as the primary sustaining force. Robust national agricultural support policies have yielded substantial results, fostering a virtuous cycle between production efficiency and cultivation scale. The inhibitory effect of urbanization has largely dissipated, and GDP has shifted to a weak positive correlation, reflecting a structural repositioning of agriculture within the broader economic system.
(2) Analysis of principal components of influencing factors of maize planting in Hunan Province
From the load coefficient in Table 4, the first principal component is mainly reflected in agricultural production conditions such as MCA and EIA, and the influence of agricultural production conditions is increasing year by year. For example, the load coefficient of the mechanized cultivation area increased significantly, and the load coefficient in 2001 was only 0.60, which indicated that the influence of agricultural production conditions in 2001 was weak, and the agricultural production conditions at that time had a limited role in promoting maize planting. It continued to increase to 0.98 in 2022, indicating that the continuous strengthening of agricultural production conditions has become a key factor for the growth of the maize planting area in Hunan Province. At the same time, the load coefficient of the TAMP remained at a high level. In terms of water conservancy facilities, the load coefficient of the NR increased from 0.62 to 0.83 in 2022, and the load coefficient of the EIA increased, all of which showed that the construction and improvement in farmland water conservancy facilities played a continuing role in promoting maize planting. These changes show that the continuous improvement in agricultural infrastructure, the rapid improvement in agricultural mechanization, and the development of water conservancy facilities play an important role in expanding the planting area of maize from 2001 to 2022.
The second main component is mainly reflected in policy factors. Specifically, Both the load coefficients of fiscal expenditure and fiscal income have increased, indicating that the role of policy support on maize planting continues to increase. In 2010, the FE and FR load factors increased significantly, indicating that the government has significantly promoted the development of maize cultivation through various policy support and financial subsidies.

4. Discussion

4.1. Deciphering the 2023 Maize Planting Decline in Hunan’s Core Regions

The observed anomalous decline in maize planting area in Shaoyang and Changde in 2023, despite these regions traditionally being hot spots with favorable gentle slopes (0–3°), can be attributed to a combination of climatic extremes and strategic agricultural policy shifts. In 2023, Hunan Province experienced significant climatic disruptions, including increased rainfall variability and flooding during key planting periods, particularly affecting low-lying and slope-vulnerable areas. These conditions likely discouraged maize planting in parts of Changde and Shaoyang, where waterlogging and soil erosion risks are heightened even on gentle slopes due to saturated soil conditions. Concurrently, provincial agricultural policies increasingly promoted crop diversification and high-value horticultural crops to enhance farmer incomes and ensure sustainable land use. Government incentives for switching to economically advantageous crops, such as vegetables, fruits, or specialty grains, may have accelerated the conversion of maize fields in these economically developed regions. This shift is consistent with broader trends in China, where urbanizing regions prioritize diversified agriculture over traditional staple crops to meet evolving market demands and optimize economic returns. Furthermore, the fragmentation of cultivated land, as indicated by rising landscape indices in the study, suggests that small-scale land conversions contributed to the reduction in maize area. This fragmentation may be driven by decentralized decision-making responding to local economic opportunities and environmental constraints. Thus, the anomalous 2023 data reflect a transient response to extreme weather events and a longer-term structural adjustment in agricultural strategy, emphasizing economic resilience and sustainable practices. This interpretation aligns with the principal component analysis results, which highlight the growing influence of policy and production conditions on maize planting dynamics.

4.2. Discussion on Influencing Factors

The dynamic change in maize planting area in Hunan Province is influenced by many factors, including agricultural production conditions, socioeconomic factors, and policy support. Through correlation analysis and principal component analysis, the influence degree and changing trend of different factors on the maize planting area were revealed, which provided a scientific basis for understanding the evolution of the regional agricultural planting structure.
In the correlation analysis, agricultural production conditions have the most significant influence on the maize planting area. The correlation coefficients between the number of reservoirs, mechanized farming area, EIA, TAMP, PIGOV, and maize planting area are all high, indicating that water conservancy facilities and mechanization level are the core factors to promote the expansion of maize planting area. Principal component analysis further confirms this view. The first principal component takes the area of mechanized cultivation and effective irrigation as the main indicators, and its load coefficient keeps increasing from 2001 to 2022, which shows that the continuous improvement in agricultural infrastructure and the rapid improvement in the mechanization level in Hunan Province have increasingly promoted maize planting. By strengthening the construction of farmland water conservancy, Hunan Province has effectively alleviated the dependence of maize planting on natural precipitation, thus providing a guarantee for the stable growth of planting areas.
Among the socioeconomic factors, the urbanization rate is negatively correlated with the maize planting area, indicating that the urbanization process may lead to the reduction in agricultural land or the loss of the labor force, thus inhibiting the expansion of the maize planting scale. The positive correlation between agricultural output value and maize planting area is weak, indicating that economic factors have limited direct influence on planting decisions, which is different from the planting model driven by market demand in the Huang–Huai–Hai region [61], which may be because maize planting in Hunan Province depends more on local agricultural production conditions than on external markets.
In terms of policy factors, although the positive impact of fiscal expenditure and fiscal revenue on maize planting area is significantly lower than that of agricultural production conditions, its role is increasing year by year, which shows that the government has effectively promoted the sustainable development of maize planting through financial subsidies and special support. This discovery is similar to the groundwater control policy of Hebei Province [61], indicating that policy intervention plays an important role in adjusting planting structure and ensuring food security.

4.3. Limitations and Future Research

While this study provides a comprehensive analysis of the spatiotemporal evolution of maize planting patterns in Hunan Province and their influencing factors, several limitations should be acknowledged. First, the spatial analysis was conducted primarily at the provincial, municipal, and county levels, without incorporating broader multi-scale comparisons (e.g., regional or national), which may constrain the generalizability of the findings.
Second, due to data availability constraints, the analysis focuses mainly on macro-level economic indicators such as GDP, urbanization rate, and fiscal policy, with less attention to micro-level drivers such as farmers’ decision-making behavior and crop substitution effects that may shape planting structure. Future research will place greater emphasis on social survey data to examine the influence of farmers’ socioeconomic decision-making processes, land tenure systems, and market dynamics on maize planting area changes.
Third, this study primarily employs correlation analysis and principal component analysis to identify influencing factors. While these methods capture linear relationships and overall trends, they are less effective in detecting spatial heterogeneity and nonlinear interactions among variables. For example, the effect of urbanization on maize cultivation may vary substantially across regions. In future work, we will adopt spatial statistical approaches such as geographically weighted regression and spatial Durbin models to better investigate the spatially varying and nonlinear interactions among influencing factors.
By addressing these limitations, through multi-scale comparative analysis, the incorporation of micro-level drivers, and the application of advanced spatial econometric methods, future research can provide a more nuanced understanding of maize planting dynamics and more robust guidance for sustainable agricultural planning.

4.4. Suggestions

At present, the spatiotemporal changes in maize planting in Hunan Province are mainly affected by agricultural production conditions and policy factors. The potential of maize production should be improved, the economic benefits of farmers should be increased, agricultural production conditions should be improved, and policies should play guiding role in promoting the sustainable development of maize planting.
(1) Optimizing agricultural production conditions, such as mechanized cultivation area and effective irrigation area, are important factors affecting the planting area of maize in Hunan Province. Agricultural infrastructure should be further improved, the level of mechanization of maize planting should be improved, the coverage rate of mechanized operations should be improved, the construction of agricultural mechanization should be strengthened, and the proportion of large-scale planting should be expanded by increasing subsidies for the purchase of agricultural machinery. Further, the construction of water conservancy infrastructure and irrigation and drainage systems should be improved, efficient water-saving irrigation technology should be promoted, the efficient irrigation area should be increased, drought resistance and moisture retention ability should be enhanced in order to cope with natural disasters, intelligent irrigation systems should be supported, water and fertilizer integration technology should be promoted, and the goal of water and fertilizer saving should be achieved. We should also optimize fertilization management, improve fertilizer utilization, and strictly control the amount of fertilizer application per unit area. At the same time, we will improve the current maize planting fragmentation situation, promote the construction of high-standard farmland, promote the “multi-planning in one” farmland improvement project, promote the circulation and integration of scattered plots, carry out high-standard farmland construction, and create a large-scale maize production demonstration area.
(2) We should aim to achieve the following: strengthen the policy-driven role, further increase support for maize production in Hunan Province, increase subsidies and improve the maize price protection mechanism, improve the subsidy standard for maize production, ensure the basic income of farmers, increase farmers’ maize planting income, maintain and enhance farmers’ enthusiasm for maize planting, and improve infrastructure investment policies, focusing on improving agricultural machinery traffic conditions and water-saving irrigation facilities. At the same time, the implementation of the maize industry chain subsidy policy provides strong support for ensuring national food security and promoting increases in farmers’ income.
The area of maize planting land converted to other land was 2286.61 km2, and the reduction area was mainly concentrated in the western part of Hunan Province, among which the Xiangxi Tujia area and Miao Autonomous Prefecture were the most significant.

5. Conclusions

Spatiotemporal big data-based analysis of crop planting changes is crucial for achieving agricultural sustainability. This study examined the spatial evolution and driving factors of maize cultivation in Hunan Province from 2001 to 2023. Over the past two decades, the maize planting area in Hunan has generally increased, showing a temporal trend of initial growth followed by decline. Spatially, planting was progressively concentrated from the northwest toward the east, with Shaoyang, Loudi, and Changde identified as key hot spots for planting and conversion. Maize cultivation was primarily distributed in gently sloping terrain (0–3°), gradually shifting toward the eastern low-slope areas. The production center of gravity moved eastward and southward in a “Z”-shaped trajectory, centered on Loudi, while planting clusters maintained a northwest–southeast distribution pattern. The fragmentation of cultivated land in maize landscapes showed an upward trend. Over the same period, hot spots expanded from the northwest to the central and eastern regions and extended southward, while cold spots shifted from the central region to the northeast, eventually making the central region the core maize-producing area. In addition, agricultural production conditions and policy factors were the primary drivers of the spatiotemporal dynamics of maize cultivation. Continuous improvements in production capacity became the key factor promoting expansion, while strengthened policy support provided strong guarantees for the sustainable development of China’s maize industry.

Author Contributions

Conceptualization, X.L.; methodology, Q.X.; software, Q.X.; validation, J.M. and L.Z.; formal analysis, Q.X. and K.G.; investigation, Q.X. and S.Z.; writing—original draft preparation, Q.X.; writing—review and editing, Q.X.; visualization, X.L. and J.M.; project administration, X.L. All authors have read and agreed to the published version of the manuscript.

Funding

This work is financed by the Youth Fund Project of Hunan Provincial Natural Science Foundation (No. 2023JJ40329).

Informed Consent Statement

Informed consent was obtained from all subjects involved in this study.

Data Availability Statement

The raw data supporting the conclusions of this article will be made available by the authors on request.

Conflicts of Interest

The authors declare no conflicts of interest.

References

  1. FAO. World Food and Agriculture—Statistical Yearbook 2021; FAO: Rome, Italy, 2021. [Google Scholar]
  2. Xu, X.; Pei, J.; Xu, Y.; Wang, J. Soil organic carbon depletion in global Mollisols regions and restoration by management practices: A review. J. Soils Sediments 2020, 20, 1173–1181. [Google Scholar] [CrossRef]
  3. He, Q.; Zhou, G.; Lü, X.; Zhou, M. Climatic suitability and spatial distribution for summer maize cultivation in China at 1.5 and 2.0 °C global warming. Sci. Bull. 2019, 64, 690–697. [Google Scholar] [CrossRef] [PubMed]
  4. Lesk, C.; Rowhani, P.; Ramankutty, N. Influence of extreme weather disasters on global crop production. Nature 2016, 529, 84–87. [Google Scholar] [CrossRef]
  5. Liu, Y.; Zhang, J.; Qin, Y. How global warming alters future maize yield and water use efficiency in China. Technol. Forecast. Soc. Chang. 2020, 160, 120229. [Google Scholar] [CrossRef]
  6. Schillerberg, T.; Tian, D. Changes in crop failures and their predictions with agroclimatic conditions: Analysis based on earth observations and machine learning over global croplands. Agric. For. Meteorol. 2023, 340, 109620. [Google Scholar] [CrossRef]
  7. Hou, P.; Liu, Y.; Liu, W.; Yang, H.; Xie, R.; Wang, K.; Ming, B.; Liu, G.; Xue, J.; Wang, Y.; et al. Quantifying maize grain yield losses caused by climate change based on extensive field data across China. Resour. Conserv. Recycl. 2021, 174, 105811. [Google Scholar] [CrossRef]
  8. Cao, Y.; Yang, Y.; Wang, G. Spatial-temporal Pattern Evolution and Matching Analysis of Maize Production and Consumption in China. J. Agric. Sci. Technol. 2024, 26, 1–10. [Google Scholar]
  9. Peter, B.G.; Messina, J.P.; Lin, Z.; Snapp, S.S. Crop climate suitability mapping on the cloud: A geovisualization application for sustainable agriculture. Sci. Rep. 2020, 10, 15487. [Google Scholar] [CrossRef]
  10. Akpoti, K.; Kabo-bah, A.T.; Zwart, S.J. Agricultural land suitability analysis: State-of-the-art and outlooks for integration of climate change analysis. Agric. Syst. 2019, 173, 172–208. [Google Scholar] [CrossRef]
  11. Tang, H.-J.; Wu, W.-B.; Yang, P.; Zhou, Q.-B.; Chen, Z.-X. Recent Progresses in Monitoring Crop Spatial Patterns by Using Remote Sensing Technologies. Sci. Agric. Sin. 2010, 43, 2879–2888. [Google Scholar]
  12. Franke, J.A.; Müller, C.; Minoli, S.; Elliott, J.; Folberth, C.; Gardner, C.; Hank, T.; Izaurralde, R.C.; Jägermeyr, J.; Jones, C.D.; et al. Agricultural breadbaskets shift poleward given adaptive farmer behavior under climate change. Glob. Chang. Biol. 2022, 28, 167–181. [Google Scholar] [CrossRef]
  13. Guga, S.; Bole, Y.; Riao, D.; Bilige, S.; Wei, S.; Li, W.; Zhang, J.; Tong, Z.; Liu, X. The challenge of chilling injury amid shifting maize planting boundaries: A case study of Northeast China. Agric. Syst. 2025, 222, 104166. [Google Scholar] [CrossRef]
  14. Chen, H.; Wang, Q.-Z.; Zhou, H. Empirical Analysis of Corn Spatial Distribution Variation in China. Econ. Geogr. 2015, 35, 165–171. [Google Scholar] [CrossRef]
  15. Huang, Y.; Qiu, B.; Yang, P.; Wu, W.; Chen, X.; Zhu, X.; Xu, S.; Wang, L.; Dong, Z.; Zhang, J.; et al. National-scale 10 m annual maize maps for China and the contiguous United States using a robust index from Sentinel-2 time series. Comput. Electron. Agric. 2024, 221, 109018. [Google Scholar] [CrossRef]
  16. Wang, Y.; Luo, S.; Huang, X.; Liu, X.; Du, L. A dynamic correction method for the influence of SAR observation incidence angle based on the corn crop phenology information. Int. J. Remote Sens. 2025, 46, 2909–2929. [Google Scholar] [CrossRef]
  17. Lv, T.; Peng, S.; Liu, B.; Liu, Y.; Ding, Y. Planting suitability of China’s main grain crops under future climate change. Field Crops Res. 2023, 302, 109112. [Google Scholar] [CrossRef]
  18. Zhao, Y.; Xiao, D.; Bai, H.; Tang, J.; Liu, D. Future projection for climate suitability of summer maize in the North China Plain. Agriculture 2022, 12, 348. [Google Scholar] [CrossRef]
  19. Bastola, R.; Shrestha, S.; Mohanasundaram, S.; Loc, H.H. Climate change-induced drought and implications on maize cultivation area in the upper Nan River Basin, Thailand. J. Water Clim. Chang. 2024, 15, 628–651. [Google Scholar] [CrossRef]
  20. Wang, Y.; Wu, Y.; Ji, L.; Zhang, J.; Meng, L. Assessing the Spatial–Temporal Pattern of Spring Maize Drought in Northeast China Using an Optimised Remote Sensing Index. Remote Sens. 2023, 15, 4171. [Google Scholar] [CrossRef]
  21. Li, X.; Lyu, Y.; Zhu, B.; Liu, L.; Song, K. Maize yield estimation in Northeast China’s black soil region using a deep learning model with attention mechanism and remote sensing. Sci. Rep. 2025, 15, 12927. [Google Scholar] [CrossRef]
  22. Liu, H.; Wan, W.; Zheng, M.; Li, J.; Liu, S.; Lv, W.; Zhou, Y.; Liu, Z. Study on climate suitability for maize and technical implementation strategies under conservation tillage in Northeast China. Soil Tillage Res. 2025, 249, 106473. [Google Scholar] [CrossRef]
  23. Pei, Z.; Wu, B. Spatial-temporal characteristics of spring maize drought in Songnen plain, Northeast China. Water 2023, 15, 1618. [Google Scholar] [CrossRef]
  24. Gao, N.; Wei, Y.; Zhang, W.W.; Yang, B.; Shen, Y.; Yue, S.; Li, S. Carbon footprint, yield and economic performance assessment of different mulching strategies in a semi-arid spring maize system. Sci. Total Environ. 2022, 826, 154021. [Google Scholar] [CrossRef]
  25. Tan, J.; Li, Z.; Yang, P.; Liu, Z.; Li, Z.; Zhang, L.; Wu, W.; You, L.; Tang, H. Spatiotemporal changes of maize sown area and yield in Northeast China between 1980 and 2010 using spatial production allocation model. Acta Geogr. Sin. 2014, 69, 353–364. [Google Scholar]
  26. Wang, Y.; Lv, J.; Wang, Y.; Sun, H.; Hannaford, J.; Su, Z.; Barker, L.; Qu, Y. Drought risk assessment of spring maize based on APSIM crop model in Liaoning province, China. Int. J. Disaster Risk Reduct. 2020, 45, 101483. [Google Scholar] [CrossRef]
  27. Zhi, F.; Zhang, J.; Bao, Y.; Bao, Y.; Dong, Z.; Tong, Z.; Liu, X. Assessment of waterlogging hazard during maize growth stage in the Songliao plain based on daily scale SPEI and SMAI. Agric. Water Manag. 2024, 304, 109081. [Google Scholar] [CrossRef]
  28. Yang, H.-L.; Wang, H.-N.; Han, X.-D.; Zhen, F.-T. Comparative advantage and the spatial distribution of China’s corn producing areas: Based on the data of 18 provinces from 1996 to 2015. Res. Agric. Mod. 2017, 38, 921–929. [Google Scholar]
  29. Zhang, Y.; Wang, Y.; Niu, H. Spatio-temporal variations in the areas suitable for the cultivation of rice and maize in China under future climate scenarios. Sci. Total Environ. 2017, 601, 518–531. [Google Scholar] [CrossRef]
  30. Yao, B. Study on Temporal and Spatial Dynamics of Winter Wheat Planting in Huang-Huai-Hai Plain. Master’s Thesis, Chinese Academy of Agricultural Sciences, Beijing, China, 2022. [Google Scholar]
  31. Yan, C.-J.; Wang, W.-B.; Cao, Y.-Q.; Sun, X.-G.; Song, S.-H.; Wang, C.-L.; Zhang, L.-J. Response of Physiological Characteristics of Different Drought-tolerant Soybean Varieties to Different Rainfall Climatic Conditions. Soybean Sci. 2018, 37, 359–365. [Google Scholar]
  32. Wei, D.; Cai, S.-S.; Wang, W.; Ding, J.-L.; Jin, L.; Li, Y.-M.; Li, Y.; Hu, Y. Path Analysis on Black Soil Fertility via Soybean Yield and Quality. Soybean Sci. 2021, 40, 89–97. [Google Scholar]
  33. Hou, S.; Cui, Y.; Meng, L.; Wu, D.; Qian, L.; Bao, Y.; Ye, Q.; Liu, H. Effects of terrain on soybean yields in rolling hilly black soil areas. Trans. Chin. Soc. Agric. Eng. 2020, 36, 88–95. [Google Scholar]
  34. Wang, X.; Zhang, S.; Feng, L.; Zhang, J.; Deng, F. Mapping Maize Cultivated Area Combining MODIS EVI Time Series and the Spatial Variations of Phenology over Huanghuaihai Plain. Appl. Sci. 2020, 10, 2667. [Google Scholar] [CrossRef]
  35. Rounsevell, M.-D.; Pedroli, B.; Erb, K.-H.; Gramberger, M.; Busck, A.-G.; Haberl, H.; Kristensen, S.; Kuemmerle, T.; Lavorel, S.; Lindner, M. Challenges for land system science. Land Use Policy 2012, 29, 899–910. [Google Scholar] [CrossRef]
  36. Zhang, Y.; Zhang, Y.; Gao, Y.; McLaughlin, N.-B.; Huang, D.; Wang, Y.; Chen, X.; Zhang, S.; Liang, A. Effects of tillage practices on environment, energy, and economy of maize production in Northeast China. Agric. Syst. 2024, 215, 103872. [Google Scholar] [CrossRef]
  37. Chen, P.; Gu, X.; Li, Y.; Qiao, L.; Li, Y.; Fang, H.; Yin, M.; Zhou, C. Effects of different ridge-furrow mulching systems on yield and water use efficiency of summer maize in the Loess Plateau of China. J. Arid. Land 2021, 13, 947–961. [Google Scholar] [CrossRef]
  38. Praveen, K.V.; Aditya, K.S.; Anbukkani, P.; Kumar, P.; Kar, A. Spatial Diversity in Indian Wheat and its Determinants. Agric. Econ. Res. Rev. 2017, 30, 213–222. [Google Scholar] [CrossRef]
  39. Zhang, Z.; Qin, H. Spatiotemporal Differentiation of Carbon Emission Efficiency and Influencing Factors in the Five Major Maize Producing Areas of China. Agriculture 2025, 15, 1621. [Google Scholar] [CrossRef]
  40. Tu, S.; Jian, D.; Long, H.; Li, T.; Zhang, Y. Evolution characteristics and mechanism of major crops production patterns in Guangxi. Acta Geogr. Sin. 2022, 77, 2322–2337. [Google Scholar]
  41. Jiang, H.; Chen, Y.; Liu, Z. Spatiotemporal Pattern and Influencing Factors of Grain Production Resilience in China. Econ. Geogr. 2023, 43, 126–134. [Google Scholar]
  42. Zhang, B.-R.; Zhang, J.-Y. Spatiotemporal evolution characteristics and driving factors of production of major oil crops in China from 2000 to 2020. Southwest China J. Agric. Sci. 2024, 37, 1377–1385. [Google Scholar]
  43. Xia, S.; Zhao, Y.; Xu, X.; Wen, Q.; Sun, Q.; Wang, L. Spatiotemporal Pattern and Driving Factors of Grain Production in Jiangsu Province. Econ. Geogr. 2018, 38, 166–175. [Google Scholar]
  44. Li, Z.; He, X. Influencing Factors and Optimization Countermeasures of Spatial and Temporal Evolution Patterns of Soybean Production in China. Soybean Sci. 2024, 43, 782–792. [Google Scholar]
  45. Wang, R.; Liu, X.; Jia, L.; Zhang, F.; Liu, S. Study on spatial-temporal changes and influencing factors of grain crops in rocky desertification area of Southwest China. Acta Agric. Univ. Jiangxiensis 2024, 46, 1–12. [Google Scholar] [CrossRef]
  46. Ji, Z.-X.; Pei, T.-T.; Chen, Y.; Hou, Q.-Q.; Xie, B.-P.; Wu, H.-W. Spatial-Temporal Variation and Driving Factors of Grassland NDVI in the Qinghai-Tibet Plateau from 2001 to 2020. Acta Agric. Sin. 2022, 30, 1873–1881. [Google Scholar]
  47. Wang, C.; Chu, L.; Yang, Z.; Yang, Z.-H.; Zhang, X.-Y.; Wang, T.-W.; Cai, C.-F. Spatial heterogeneity and determinants of soybean yield in Northeast China. Trans. Chin. Soc. Agric. Eng. 2023, 39, 108–119. [Google Scholar]
  48. Li, R.; Chen, X.; Shi, L. On factors influencing the acreage of staple crops in China: Evidence from a meta-analysis. Sci. Technol. Rev. 2024, 42, 76–83. [Google Scholar]
  49. Xu, H.; Dong, X.; Peng, H.; Liu, H.; Yu, Z. Production efficiency of soybean—Maize relay strip intercropping system and influencing factors—Based on the questionnaire of Huang—Huai—Hai, Southwest and Northwest China. J. Beijing Univ. Agric. 2024, 39, 73–78. [Google Scholar]
  50. Jiang, S.; Yu, J.; Li, S.; Liu, J.; Yang, G.; Wang, G.; Wang, J.; Song, N. Evolution of Crop Planting Structure in Traditional Agricultural Areas and Its Influence Factors: A Case Study in Alar Reclamation. Agronomy 2024, 14, 580. [Google Scholar] [CrossRef]
  51. Mottet, A.; Ladet, S.; Coqué, N.; Gibon, A. Agricultural land-use change and its drivers in mountain landscapes: A case study in the Pyrenees. Agric. Ecosyst. Environ. 2005, 114, 296–310. [Google Scholar] [CrossRef]
  52. Hu, L.; Jiang, C.Y.; Li, Z.B.; Zhang, X.; Li, P.; Wang, Q.; Zhang, W.J. Evolution Path Analysis of Economic Gravity Center and Air Pollutants Gravity Center in Shaanxi Province. Adv. Mater. Res. 2012, 361, 1359–1363. [Google Scholar] [CrossRef]
  53. Chen, Z.; Shi, D.; He, W.; Xia, J.; Jin, H.; Lou, Y. Spatio-temporal distribution and evolution characteristics of slope farmland resources in Yunnan from 1980 to 2015. Trans. Chin. Soc. Agric. Eng. 2019, 35, 256–265. [Google Scholar]
  54. Ye, L.; Guo, L.; Wang, F.; Li, S.; Jiang, G.; Zhao, Y. Research on the temporal and spatial changes of crop planting landscape and fragmentation—Taking Yutian county in Tangshan as an example. Sci. Surv. Mapp. 2021, 46, 83–92. [Google Scholar]
  55. Zhao, W.; Dong, X.; Zhang, Z. On Potential and Model of Rural Residential Lands Consolidation Based on Cold-Hot Spot Analysis. J. Southwest China Norm. Univ. (Nat. Sci. Ed.) 2022, 47, 63–71. [Google Scholar]
  56. Bro, R.; Smilde, A.K. Principal component analysis. Anal. Methods 2014, 6, 2812–2831. [Google Scholar] [CrossRef]
  57. An, Y.; Tan, X.; Tan, J.; Yu, H.; Wang, Z.; Li, W. Evolution of Crop Planting Structure in Traditional Agricultural Areas and Its Influence Factors: A Case Study in Hunan Province. Econ. Geogr. 2021, 41, 156–166. [Google Scholar]
  58. Zhang, R.; Xiao, M.; Liu, Z. Spatio-temporal Heterogeneity and Driving Factors of Landscape Fragmentation in Beijing-Tianjin-Hebei Region. Ecol. Environ. Sci. 2025, 34, 461–473. [Google Scholar]
  59. Dang, H.; Deng, Y.; Hai, Y.; Chen, H.; Wang, W. Characterization of spatio-temporal evolution of grain production and identification of its heterogeneity drivers in Sichuan Province based on Geodetector and GWR models. Front. Sustain. Food Syst. 2025, 9, 1561910. [Google Scholar] [CrossRef]
  60. Ding, L. A Study on the Spatial and Temporal Variation of Crop Cultivation Scale and Driving Forces in Zhejiang Province. Master’s Thesis, Zhejiang Ocean University, Zhoushan, China, 2023. [Google Scholar]
  61. Iqbal, M.A.; Shen, Y.; Stricevic, R.; Pei, H.; Sun, H.; Amiri, E.; Rio, S. Evaluation of the FAO AquaCrop model for winter wheat on the North China Plain under deficit irrigation from field experiment to regional yield simulation. Agric. Water Manag. 2014, 135, 61–72. [Google Scholar] [CrossRef]
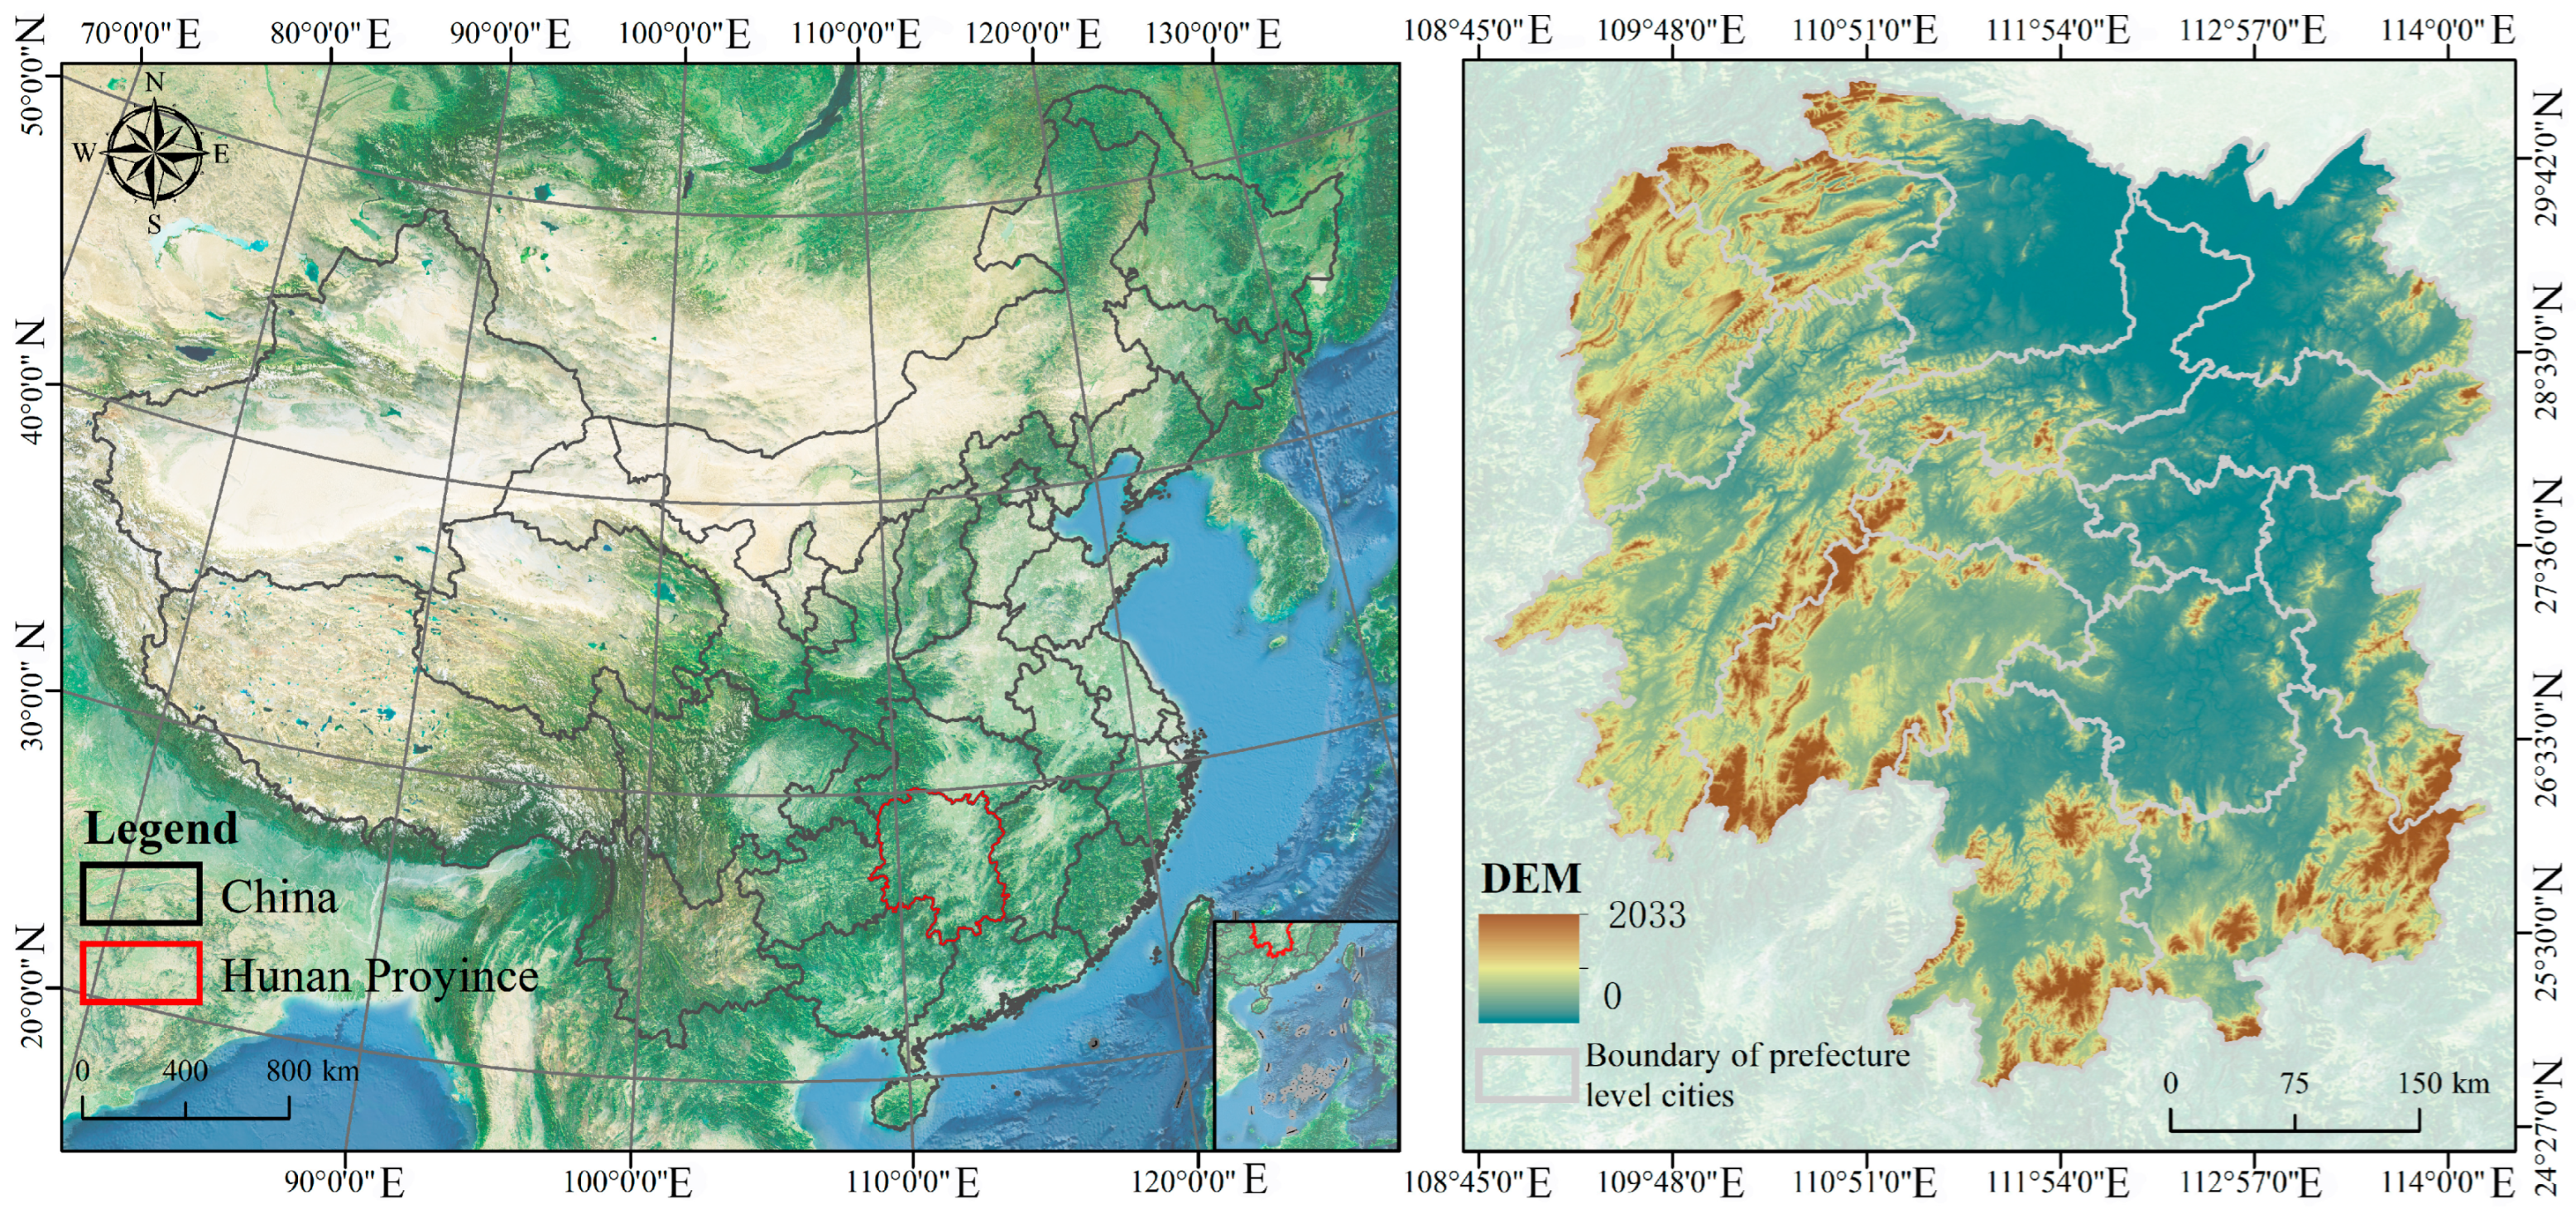
Figure 1. Geographical location of Hunan Province. Note: Based on the standard map review number of the Ministry of Natural Resources standard map service website with GS (2019) No. 1822, the base map boundary has not been modified.
Agronomy 15 02339 g001
Figure 2. Technology roadmap.
Agronomy 15 02339 g002
Figure 3. Maize acreage in Hunan Province.
Agronomy 15 02339 g003
Figure 4. Overview of maize cultivation in Hunan Province.
Agronomy 15 02339 g004
Figure 5. Spatial and temporal distribution and change in maize cultivation in Hunan Province, 2001–2023.
Agronomy 15 02339 g005
Figure 6. Topographic features of maize cultivation distribution.
Agronomy 15 02339 g006
Figure 7. Standard deviation ellipse and center of gravity shift in maize planting in Hunan Province, 2001–2023.
Agronomy 15 02339 g007
Figure 8. Standardized cropland fragmentation offset.
Agronomy 15 02339 g008
Figure 9. Characterization of spatial cold and hot spots of maize cultivation in Hunan Province, 2001–2023.
Agronomy 15 02339 g009
Figure 10. Correlation analysis of influencing factors on maize cultivation, 2000–2022. Explanatory text: urbanization rate (UR), primary industry gross output value (PIGOV), agricultural output value (AOV), total agricultural machinery power (TAMP), effective irrigation area (EIA), chemical fertilizer application (CFA), mechanized cultivation area (MCA), the number of reservoirs (NR), rural population (RP), primary industry employment (PIE), fiscal expenditure (FE).
Agronomy 15 02339 g010
Table 1. Changes in maize acreage in Hunan Province, 2001–2023.
YearPlanting Area (km2)YearThe Planting Area Has IncreasedThe Planting Area Is Reduced
In 20012798.352001–2005 2408.972286.61
In 20052920.712005–20102380.062274.74
In 20103026.032010–2015 3194.802624.59
In 20153596.242015–2020 2661.472296.55
In 20203959.112020–2023 3059.273282.63
In 20233272.56
Table 2. Coordinates of the center of gravity of maize production in Hunan Province, 2001–2023.
YearLongitude (°E)Latitude (°N)PlaceTiming StageDistance Traveled (km)Direction of Movement
2001111.29324728.165704Loudi City2001–200516.88Southeast
2005111.43250728.07655Loudi City2005–201030.43Southwest
2010111.38272427.806423Loudi City2010–201530.20Southeast
2015111.6889627.786867Loudi City2015–20205.88Southeast
2020111.71385727.738761Loudi City2020–202324.35Southeast
2023111.95632827.695455Loudi City2001–202383.53Southeast
Table 3. Changes in the maize landscape index in Hunan Province, 2001–2023.
Evaluation ElementsIndexIn 2001In 2005In 2010In 2015In 2020In 2023
Area edge indicatorED (km/km2)0.76893.17293.29083.85644.19284.0228
MPS (km2/patch)50.06723.21853.25173.48063.60283.3761
Convergence indicatorsPD (patch)0.02570.41160.42270.47090.49970.5021
NP (patch/km2)547487,28189,63299,851106,038106,479
MNN (m)2582.748577.179572.9158544.4744536.6999541.6392
Shape indicatorsAWMSI (%)1.19221.1561.16491.20531.2441.2231
Table 4. Loading coefficients of factors affecting maize cultivation in Hunan Province, 2001–2022.
2001Commonality
(Common Factor Variance)
2010Commonality
(Common Factor Variance)
2022Commonality
(Common Factor Variance)
Load FactorLoad FactorLoad Factor
Principal Component 1Principal Component 2Principal Component 1Principal Component 2Principal Component 1Principal Component 2
UR0.390.820.860.310.890.89−0.01−0.510.93
GDP0.890.420.970.580.80.970.3−0.680.92
PIGOV0.87−0.380.910.95−0.10.920.93−0.330.98
AOV0.690.230.60.97−0.050.950.280.80.74
TAMP0.820.050.930.930.150.890.9−0.320.91
EIA0.78−0.440.80.94−0.110.890.920.050.87
CFA0.79−0.370.90.83−0.320.790.9700.93
MCA0.6−0.30.980.88−0.170.80.980.040.98
NR0.62−0.550.860.66−0.410.610.830.030.79
RP0.72−0.650.940.76−0.550.880.78−0.20.93
PIE0.940.240.940.7−0.550.80.87−0.130.92
FE0.830.460.90.710.640.910.480.760.96
Notes: If the numbers in the table are colored, blue indicates that the absolute value of the loading coefficient is greater than 0.4.
Disclaimer/Publisher’s Note: The statements, opinions and data contained in all publications are solely those of the individual author(s) and contributor(s) and not of MDPI and/or the editor(s). MDPI and/or the editor(s) disclaim responsibility for any injury to people or property resulting from any ideas, methods, instructions or products referred to in the content.