Abstract
Long-term greenhouse operations face a critical challenge in the form of soil quality degradation, yet the key intervention periods and underlying mechanisms of this process remain unclear. This study aims to quantify the effects of greenhouse lifespan on the evolution of soil quality and to identify critical periods for intervention. We conducted a systematic survey of greenhouse operations in a representative area of Yunnan Province, Southwest China, and adopted a space-for-time substitution design. Using open-field cultivation (OF) as the control, we sampled and analyzed soils from vegetable greenhouses with greenhouse lifespans of 2 years (G2), 5 years (G5), and 10 years (G10). The results showed that early-stage greenhouse operation (G2) significantly increased soil temperature (ST) by 8.38–19.93% and soil porosity (SP) by 16.21–56.26%, promoted nutrient accumulation and enhanced aggregate stability compared to OF. However, as the greenhouse lifespan increased, the soil aggregates gradually disintegrated, particle-size distribution shifted toward finer clay fractions, and pH changed from neutral to slightly alkaline, exacerbating nutrient imbalances. Compared with G2, G10 exhibited reductions in mean weight diameter (MWD) and soil organic matter (SOM) of 2.41–5.93% and 24.78–30.93%, respectively. Among greenhouses with different lifespans, G2 had the highest soil quality index (SQI), which declined significantly with extended operation; at depths of 0–20 cm and 20–40 cm, the SQI of G10 was 32.59% and 38.97% lower than that of G2, respectively (p < 0.05). Structural equation modeling (SEM) and random forest analysis indicated that the improvement in SQI during the early stage of greenhouse use was primarily attributed to the optimization of soil hydrothermal characteristics and pore structure. Notably, the 2–5 years was the critical stage of rapid decline in SQI, during which intensive water and fertilizer inputs reduced the explanatory power of soil nutrients for SQI. Under long-term continuous cropping, the reduction in MWD and SOM was the main reason for the decline in SQI. This study contributes to targeted soil management during the critical period for sustainable production of protected vegetables in southern China.
1. Introduction
Greenhouses serve as agricultural production systems that enable artificial regulation of crop growth environments by efficiently integrating light, heat, water, and nutrient resources, demonstrating significant potential in mitigating agricultural risks posed by climate change [1]. In particular, greenhouses can enable off-season cultivation, enhance vegetable yields, and improve economic returns, leading to their rapid expansion worldwide [2]. However, the enclosed, high-temperature and high-humidity conditions tend to accelerate soil organic matter (SOM) mineralization and nutrient loss. Meanwhile, prolonged and high-rate chemical fertilizer inputs contribute to nutrient imbalances, secondary salinization, and increased greenhouse gas emissions, posing serious threats to soil health and system sustainability [3,4,5]. Therefore, systematic evaluation of soil quality in greenhouse systems is essential for optimizing management strategies and promoting the sustainable development of protected agriculture.
Soil quality refers to the soil’s capacity to maintain productivity, mitigate environmental degradation, and promote ecosystem health [6]. Assessing soil quality involves the quantitative characterization of its inherent properties. Selecting appropriate evaluation indicators and establishing a reasonable assessment system are primary prerequisites for accurately evaluating soil quality [7]. For a long time, the soil quality index (SQI) method has been widely used because of its ability to quantify the level and grade of soil quality [8,9]. Among them, the SQI based on the weighted sum method was once the mainstream method [10,11]. However, this method is easily affected by subjective weight settings, resulting in deviations in the evaluation results. To overcome this limitation, the SQI area method has gradually replaced the traditional weighted sum method and gained increasing attention in soil quality assessment [12,13]. Unlike the weighted sum approach, this method calculates values based on the relative metrics of soil indicators without requiring manual weighting, thereby reducing uncertainties caused by differences in individual indicator sensitivities and enabling more efficient, objective comparisons of soil parameters and overall changes, ultimately providing a more accurate reflection of soil quality status [14].
The physicochemical properties of soil are key indicators for assessing soil quality [15]. With the rapid development of facility agriculture, the study of soil quality evolution and regulation mechanisms in greenhouses has received increasing attention from the academic community. Compared to open-field farmland (OF), greenhouse farmland experiences more pronounced changes in soil physicochemical properties due to the barrier of covering materials, the lack of leaching, and intense anthropogenic activities such as high-water input, heavy fertilization, and intensive cropping [16,17]. Numerous studies have shown that long-term intensive management of greenhouse farmland generally leads to excessive accumulation of nutrients, especially the large enrichment of elements such as nitrogen, phosphorus, and potassium, which can easily trigger soil salinization and heavy metal pollution, and may cause surface water or groundwater pollution through irrigation [18,19]. Meanwhile, excessive accumulation of nutrients reduced soil aeration and water retention capacity, inhibited soil microbial activity, and hindered the sequestration of soil carbon stocks, thereby threatening the sustainability of agricultural production [20,21]. Previous studies have also indicated that under higher temperature and humidity, and high-frequency irrigation, microbial communities and associated enzyme activities become more sensitive; the mineralization rate of SOM increases, aggregate stability and pore structure weaken, and structural indicators are more responsive to management changes [22,23]. Notably, as greenhouse lifespan increases, these changes tend to be cumulative or to intensify in distinct stages [24]. To address the above degradation issues, prior studies have attempted to mitigate them through measures such as fertigation and the combined application of organic and inorganic fertilizers. These approaches have partially improved the soil microenvironment and enhanced nutrient use efficiency [25,26]. However, these measures are unable to fundamentally eliminate the negative effects on soil physicochemical properties that accumulate over long-term land use as greenhouse age increases [27,28]. Currently, the severity of greenhouse soil quality degradation is widely recognized (Figure 1f) [29,30], but existing studies largely focus on revealing the degradation phenomena or proposing management measures; the critical intervention windows and underlying drivers remain unclear, limiting evidence-based improvement and scientific management of greenhouse environments.Constrained by natural geographical conditions and economic development levels, about 80% of China’s greenhouse vegetable cultivation is concentrated in the Bohai Rim, the Huang–Huai region, and the middle and lower reaches of the Yangtze River [31]. In contrast, the southwest region (e.g., Yunnan) started later, but has developed rapidly in recent years with advances in the regional economy and technology and rising market demand. By 2020, Yunnan’s vegetable planting area had stabilized at 1.3333 million hm2, with total output exceeding 23 million tons, making it an important national supply base of “healthy, green, and ecological” vegetables and playing a prominent role in securing supply regionally and nationwide [32]. To achieve high and stable yields, long-term intensive water and fertilizer inputs have become relatively common, placing soils under sustained heavy loads [33,34]. Nevertheless, most existing studies have primarily focused on investigating common soil issues in greenhouse systems in northern or eastern China [35,36]. For southern China, comprehensive reports on the long-term dynamics of greenhouse farmland SQI and its relationship with soil physicochemical properties remain scarce.
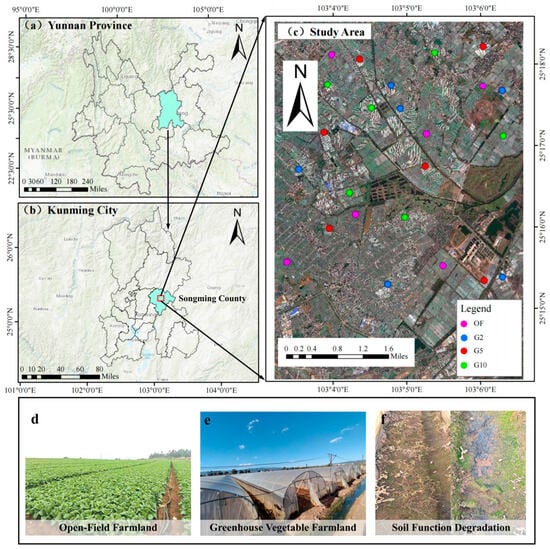
Figure 1.
Study area and distribution of sampling points. (a) Provincial boundaries of the study area; (b) County boundaries of the study area; (c) Distribution of sampling sites in the study area; (d) Schematic of open-field farmland; (e) Schematic of greenhouse vegetable farmland; (f) Schematic of soil function degradation. Abbreviations: OF: open-field farmland; G2, G5, and G10 represent greenhouse lifespans of 2 years, 5 years, and 10 years, respectively.
Considering the cumulative effects of land use intensity arising from long-term, intensive greenhouse operations, we hypothesize that early greenhouse use may transiently improve soil conditions, whereas with increasing greenhouse lifespans the degradation of soil physicochemical properties will accelerate, producing phased changes in the SQI. We further posit that high-intensity water and nutrient management may diminish the explanatory power of soil nutrient metrics for SQI [28,37]. To examine this hypothesis, this study uses open-field farmland (OF) as the control, selecting greenhouse vegetable farmland soils with different lifespans (2 years, 5 years, and 10 years) as the research object. The study aims to achieve the following three objectives: (1) to quantify the changes in soil physicochemical properties and the SQI of greenhouse soils under different lifespans and soil layer depths; (2) to identify critical periods of soil quality decline and the key drivers of degradation; and (3) to propose targeted soil management strategies for greenhouse cultivation systems in southern China, based on the above findings. The findings are intended to address the research gap concerning soil quality dynamics in greenhouse vegetable production systems in southern China, to provide a scientific basis for effective management and sustainable improvement of greenhouse vegetable soils in the region, and ultimately to promote the sustainable development of protected agriculture.
2. Materials and Methods
2.1. Description of the Study Area
The study site is located in Songming County, Kunming City, Yunnan Province, China (102°54′–103°19′ E, 25°27′–25°51′ N), at an elevation of 1770.5–2840.0 m. It is located on the western edge of the Yungui Plateau, in the central part of the province (Figure 1a,b). The unique geographical and climatic advantages provide a solid natural foundation for regional vegetable production and agricultural development. The area has a typical mixed type of temperate, warm temperate, and northern subtropical climate, with abundant solar and thermal resources, exhibiting hot and humid conditions in summer and autumn and dry and cool conditions in winter and spring. The long-term average temperature is 14 °C, with an annual effective accumulated temperature above 10 °C totaling 4163 °C. The average annual rainfall is 999 mm, the average annual sunshine duration is 2073 h, and the frost-free period reaches 222 d. The soil type is mainly red soil, which is classified as Ferralsols in the Food and Agriculture Organization of the United Nations (FAO) taxonomy [38]. Its soil texture tends to be clay-heavy, with generally low SOM content and weak nutrient retention capacity [39]. To promote the modernization of plateau characteristic agriculture, the General Office of Yunnan Provincial People’s Government actively supports the development of facility agriculture such as greenhouses [40]. Currently, vegetable production in the county is mainly conducted in greenhouses, with a cultivation area of approximately 42,800 hm2, and the greenhouse lifespan is mainly concentrated in 2–10 years. The vegetables produced are primarily sold in foreign markets, including Europe, America, Japan, South Korea, and Southeast Asia. As a key county in China′s vegetable industry, the county plays a key role in ensuring a continuous supply of agricultural and sideline products and promoting the sustainable development of ecological agriculture. The greenhouse-grown vegetables in the study area are mainly leafy vegetables, such as lettuce (Lactuca sativa Linn.), celery (Apium graveolens L.), cabbage (Brassica rapa ssp. pekinensis), and spinach (Spinacia oleracea L.). Under greenhouse conditions, vegetables can achieve 4–6 rotations per year, while open-field cultivation is usually 3–4 rotations.
2.2. Sample Collection and Measurement
This study employed a space-for-time substitution design [41,42]. We selected greenhouse plots with broadly comparable initial soil conditions and management intensity but with different greenhouse lifespans to approximate a single-site long-term sequence (temporal), thereby evaluating the temporal evolution of soil properties in vegetable planting areas. Specifically, in July 2023, based on farmer interviews and field investigations in greenhouse vegetable planting areas in Xiaojie Town and Yanglin Town, Songming County, Kunming City, greenhouse farmland plots with different lifespans that had the same soil type, crop type, irrigation method, production technology, and number of crops planted per year, and were in the same fallow period were selected for soil sampling. During the soil sampling process, local continuous tillage farmland that had not been used for greenhouse (open-field, OF) was used as a control (Figure 1d), and farmland with greenhouse lifespans of 2 years (G2), 5 years (G5), and 10 years (G10) were selected for soil sample collection (Figure 1e). To ensure the reliability of the experimental results, a total of 24 farm plots were selected in this study, six for each greenhouse lifespan. All plots were drawn from distinct management units. The distribution of sampling areas is detailed in Figure 1c, and the planting and field management models for each plot are shown in Table 1.

Table 1.
Characteristics of soil sampling fields based on greenhouse lifespan.
During the sampling process, a stainless-steel auger with a diameter of 8 cm was used at each sampling point to collect soil from two soil layers at depths of 0–20 cm and 20–40 cm from five randomly selected locations. The five subsamples from the same soil layer were mixed evenly to obtain a mixed soil sample, each weighing approximately 2 kg, for a total of forty-eight mixed soil samples. While collecting the mixed soil samples, the soil temperature (ST) was measured at different soil layer depths at each sampling point. In addition, representative sampling points were selected in each plot to excavate soil profiles, and 100 cm3 core samples and aluminum box samples were collected at depths of 0–20 cm and 20–40 cm, with three replicates for each soil profile. After sampling, they were placed in plastic boxes and brought back to the laboratory to determine soil porosity (SP), bulk density (BD), and field water capacity (FWC). The collected mixed soil samples were first passed through a 10 mm sieve to remove fine roots and stones, then divided into two portions and placed in sterile sealed bags. One portion was placed in a refrigerator at 4 °C for the determination of ammonium nitrogen (NH4+-N) and nitrate nitrogen (NO3–-N); the remaining portion was air-dried at room temperature (25 °C) for the determination of soil aggregates, texture, and chemical properties.
Soil parameters were measured according to standard agrochemical analytical methods [43]. ST was measured using a temperature meter (LD-SW, Lanende, China). BD, SP, and FWC were determined using the core sampling method combined with the oven-drying method (dried at 105 °C for 12 h) [15]. Soil texture was analyzed using a specific gravity method, and particle sizes were classified according to the international standard into sand (0.02–2 mm), silt (0.002–0.02 mm), and clay (<0.002 mm) [44]. The pH was determined by preparing a 1:2.5 soil-water mass ratio solution, which was then measured using a pH meter (PHS-3C, Yidian Scientific Instruments, China). SOM and soil total nitrogen (TN) content were measured using the potassium dichromate-dilution heating method and the micro-Kjeldahl method, respectively [45]. NH4+-N and NO3−-N were extracted using potassium sulfate and measured using a flow analyzer (Auto Analyzer 3, Seal, Germany) [46]. Available phosphorus (AP) and available potassium (AK) were measured using the sodium bicarbonate-molybdenum-antimony spectrophotometric method and the neutral ammonium acetate extraction flame photometric method, respectively [47].
Soil mechanical stability aggregates and water-stable aggregates were determined using the dry sieving method and wet sieving method, respectively, with sieve sizes of 5, 2, 1, 0.5, and 0.25 mm [48]. The particle size distribution data obtained from both dry and wet sieving were used to calculate the mean weight diameter (MWD), geometric mean diameter (GMD), water-stable aggregate stability ratio (WSAR), and fractal dimension (D) [15,49,50]. The calculation formulas are as follows:
where xi represents the mean diameter of each particle size fraction (mm), and mi denotes the percentage (%) of each particle size fraction relative to the total sample. WR0.25 and DR0.25 refer to the weight percentages (%) of water-stable aggregates and mechanically stable aggregates larger than 0.25 mm, respectively. xmax indicates the mean diameter (mm) of the largest size fraction of soil aggregates, m(δ<xi) is the cumulative mass (g) of soil aggregates with diameters smaller than xi, and m represents the total weight of the soil sample (g).
2.3. Soil Quality Assessment Methods
2.3.1. Standardization of Assessment Indicators
By establishing the membership function for the assessment indicators, the indicators are standardized, converting those with different units into dimensionless values ranging from 0 to 1. Based on the relationship between soil physicochemical indicators and soil production functions, the membership functions are classified into the following three categories [45]. Formulas (5) and (6) represent the “more is better” scenario for indicators such as ST, SP, FWC, MWD, GMD, WSAR, SOM, TN, AP, and AK. Conversely, the “less is better” scenario applies to BD and a D. Other assessment indicators are determined using Formula (7).
where P(Xi) represents the membership degree of the i-th assessment indicator, Ximax and Ximin denote the maximum and minimum values of the i-th indicator, respectively. Xij is the observed value of the various assessment indicators, and XiA and XiB are the lower and upper limits of the optimal value for the i-th indicator. The values for the upper and lower limits are obtained based on previous research, with the optimal ranges set at pH 6.5–7.0 and Clay 20–30% [15,45].
2.3.2. Construction of the Minimum Data Set (MDS)
Soil assessment indicators are selected from four aspects: soil hydrothermal characteristics and pore structure, texture, aggregate stability, and nutrient properties. The normalized data undergoes principal component analysis (PCA) combined with Norm value methods to filter out representative and mutually independent assessment indicators to establish an MDS [51]. Based on the framework of soil quality assessment, indicators with eigenvalues greater than 1, insignificant correlations, or low correlation coefficients (r < 0.6) are selected, as well as those within 90% of the maximum Norm value of each principal component calculation. These indicators represent those sensitive to soil quality in the greenhouse [52]. The calculation method for the Norm values of the assessment indicators is as follows [10].
where Nik represents the composite loading of the i-th assessment indicator on the first k principal components with eigenvalues greater than 1, uik refers to the loading value of the i-th assessment indicator on the k-th principal component, and λk denotes the eigenvalue of the k-th principal component.
2.3.3. Soil Quality Index (SQI) Area Method
The SQI area method involves comparing the area of the radar chart with the contributions of all soil parameters to the SQI [14]. The area of the radar chart (SQI area) is equal to the sum of the areas of the individual triangles that comprise the total area [47]. This method employs radar charts and area comparisons to illustrate soil quality under different greenhouse lifespans.
where n represents the number of assessment indicators selected in the MDS, and π is 3.14.
2.4. Data Analysis
Data analysis and plotting were performed using IBM SPSS 22.0, Origin 2022, and R 4.4.1. Before data analysis, the logarithmic transformation was applied to data that did not satisfy the normality and homogeneity of variance assumptions. One-way analysis of variance (ANOVA) was conducted, followed by Duncan’s test to compare the differences in soil quality assessment indicators under different years of greenhouse operation (p < 0.05), with results reported as mean ± standard deviation [53]. Pearson correlation analysis was employed to assess the relationships among soil physicochemical properties. At the same time, the Mantel Test analyzed the effects of greenhouse lifespan and soil layer depth on soil physicochemical properties. Random forest and significance level analysis among predictors were performed using the “randomForest” and “rfPermute” packages. The study area map was created using ArcGIS 10.5, and the structural equation model was analyzed using Amos Graphics for modeling.
3. Results
3.1. Soil Hydrothermal Characteristics and Pore Structure
With increased greenhouse lifespans, the trends in soil hydrothermal characteristics and pore structure were generally consistent across farms in both the 0–20 cm and 20–40 cm soil layers (Figure 2). Compared to OF, the early stages of greenhouse operation (G2) demonstrated a significant improvement in soil hydrothermal characteristics and pore structure. Specifically, G2 had higher FWC, a significantly reduced BD, and ST and SP increased by 8.38–19.93% and 16.21–56.26%, respectively (p < 0.05). However, this improvement effect gradually weakened with the increase in greenhouse lifespan. BD gradually increased, SP and FWC gradually decreased, and ST did not change significantly (p > 0.05). From G2 to G10, the BD at G10 increased by 6.82–19.09% (p < 0.05), while SP and FWC decreased by 19.40–27.20% and 18.80–23.28%, respectively (p < 0.05). In addition, there were also significant differences in soil hydrothermal characteristics and pore structure between different soil layers (p < 0.01).
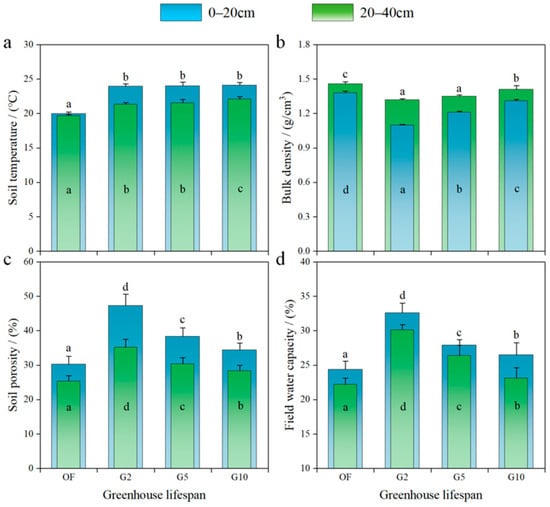
Figure 2.
Soil hydrothermal characteristics and pore structure under different greenhouse lifespans. (a) Soil temperature; (b) Bulk density; (c) Soil porosity; (d) Field water capacity. Note: In the figure, different lowercase letters indicate significant differences between soil layers at the same greenhouse lifespan (p < 0.05).
3.2. Soil Texture
The soil texture of farmland in the study area at 0–40 cm depth is predominantly silt, with content ranging from 52.55% to 65.69% (Figure 3). Greenhouses operation significantly affected soil particle size distribution; compared to OF, clay content in G2 soils decreased by 13.22–28.08%. Moreover, as the greenhouse lifespan increased, silt content declined significantly, while clay content continued to rise. Specifically, from G2 to G10, silt content in G10 soils decreased by 6.53–12.19%. Across different soil layers, clay content is highest in G10, representing increases of 33.99–58.04% and 10.48–11.33% compared to G2 and G5, respectively.
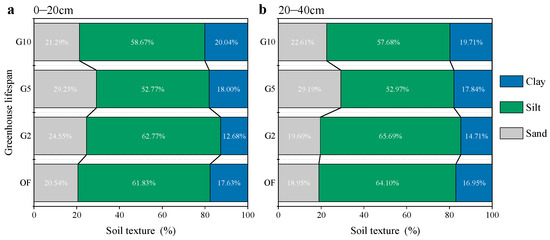
Figure 3.
Soil texture under different greenhouse lifespans. (a) 0–20 cm; (b) 20–40 cm.
3.3. Soil Aggregate Structure
3.3.1. Soil Mechanical Stability Aggregate Size Distribution
In the study area, the content of mechanically stable aggregates in the 0–40 cm of agricultural soil was dominated by macroaggregates (0.25–10 mm), with its content much higher than that of microaggregates (0–0.25 cm) (Figure 4). Among macroaggregates, content was mainly concentrated in the >5 mm and 2–5 mm size ranges. Compared to OF, the content of mechanically stable macroaggregates in G2 increased by 3.94–6.68%. However, the macroaggregate content gradually decreased with the increase in greenhouse lifespan. Among the different greenhouse lifespans, G2 had the highest content of soil mechanically stable macroaggregates, while G10 decreased by 2.41–5.93% compared to G2.
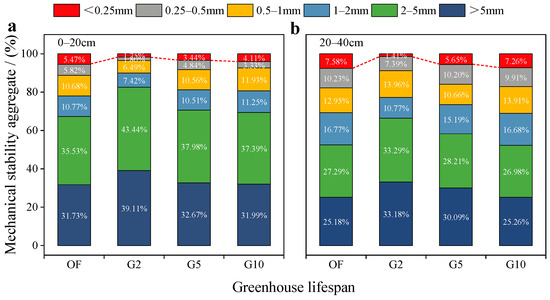
Figure 4.
Soil mechanical stability distribution characteristics under different greenhouse lifespans. (a) 0–20 cm; (b) 20–40 cm.
3.3.2. Soil Water-Stable Aggregate Size Distribution
After wet sieving treatment, the content of soil macroaggregates decreased sharply, especially in the >5 mm and 2–5 mm size ranges, which exhibited the most pronounced downward trends (Figure 5). This indicates that soil in the study area is more sensitive to water erosion damage from micro-sprinkler irrigation than to mechanical disruption. In the 0–40 cm layer of agricultural soil, water-stable aggregates still showed a higher content of macroaggregates compared to microaggregates. However, microaggregates were the dominant size class, accounting for 29.42–49.08% of the total. The content of water-stable macroaggregates in G2 increased by 28.81–38.62% compared to OF. Among the different greenhouse lifespans, G2 had the highest content of soil water-stable macroaggregates. As the greenhouse lifespan increased, the content of soil macroaggregates significantly decreased. Compared to G2, G10 decreased by 19.71–23.60%.
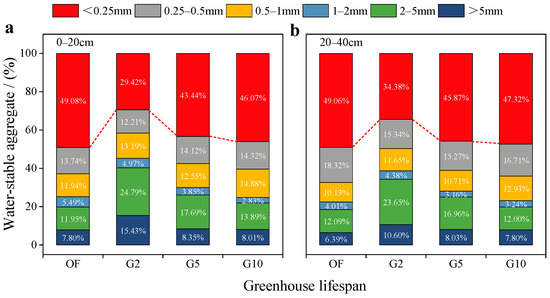
Figure 5.
Soil water-stable aggregate distribution characteristics under different greenhouse lifespans. (a) 0–20 cm; (b) 20–40 cm.
3.3.3. Soil Aggregate Stability
With increased greenhouse lifespans, the trends in soil aggregate stability were generally consistent across farms in both the 0–20 cm and 20–40 cm soil layers (Figure 6). Compared to OF, G2 significantly improved soil aggregate stability, with MWD, GMD, and WSAR significantly increasing, while D decreased by 0.35–0.61% (p < 0.05). Significant differences were also observed in various aggregate stability indicators among greenhouses with different lifespans (p < 0.05). Except for the D value, the other aggregate stability indicators gradually decreased as the greenhouse lifespan increased, consistent with the trends observed in SP and FWC. Specifically, compared to G2, the MWD, GMD, and WSAR in G10 decreased by 32.18–40.71%, 38.93–48.65%, and 14.64–27.71%, respectively (p < 0.05), while the D value increased by 3.10–4.15% (p < 0.05).
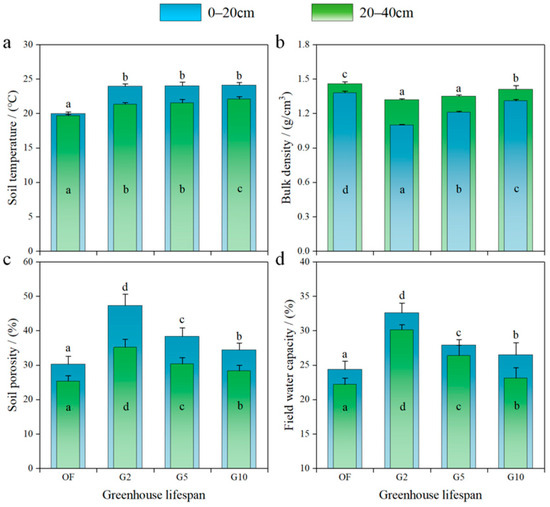
Figure 6.
Soil aggregate stability characteristics under different greenhouse lifespans. (a) Mean weight diameter; (b) Geometric mean diameter; (c) Water-stable aggregate stability ratio; (d) Fractal dimension. Note: In the figure, different lowercase letters indicate significant differences between soil layers at the same greenhouse lifespan (p < 0.05).
3.4. Soil Nutrient
With increased greenhouse lifespans, the trends in soil nutrient contents were generally consistent across farms in both the 0–20 cm and 20–40 cm soil layers (Figure 7). Compared to OF, the AK content in greenhouses decreased by 18.41–40.61%, while the other nutrient indicators significantly increased (p < 0.05). Among these, the contents of SOM and TN in greenhouses increased by 1.69–47.23% and 23.64–50.30%, respectively, compared to OF (p < 0.05). In addition, significant differences were observed in each nutrient indicator among greenhouses of varying lifespans (p < 0.05). As the greenhouse lifespan increased, the overall soil pH, TN, NO3−-N, NH4+-N, and AP gradually increased. At the same time, SOM and AK continuously decreased, leading to a gradual decline in the supply capacity of carbon and potassium. Specifically, the soil acidity evolved from neutral to slightly alkaline. In G10, TN, NO3−-N, NH4+-N, and AP increased by 14.81–16.23%, 35.00–162.01%, 40.86–71.63%, and 121.41–140.68%, respectively, compared to G2 (p < 0.05), while SOM and AK decreased by 24.78–30.93% and 12.38–27.21%, respectively (p < 0.05).
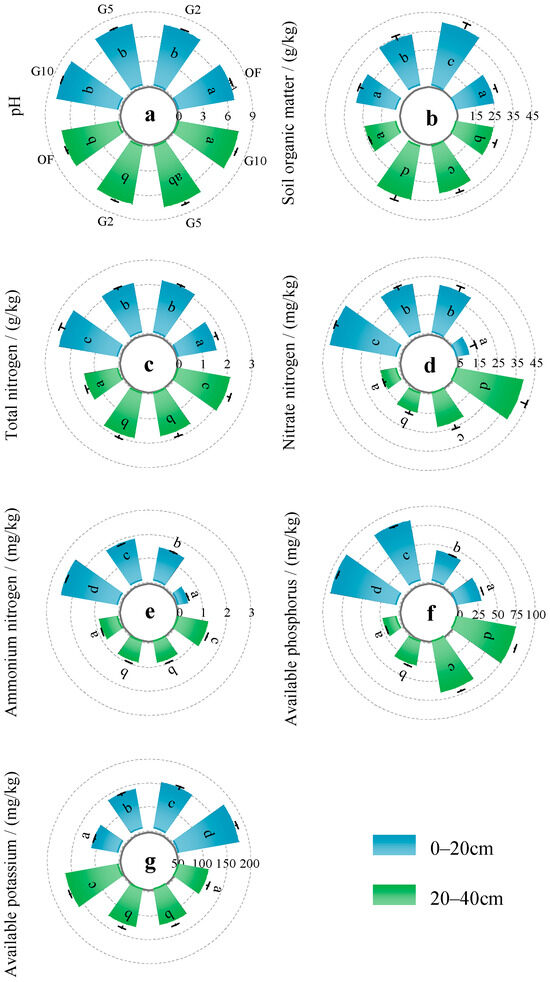
Figure 7.
Soil nutrient content characteristics under different greenhouse lifespans. (a) pH; (b) Soil organic matter; (c) Total nitrogen; (d) Nitrate nitrogen; (e) Ammonium nitrogen; (f) Available phosphorus; (g) Available potassium. Note: In the figure, different lowercase letters indicate significant differences between different greenhouse lifespans within the same soil layer (p < 0.05).
3.5. Comprehensive Evaluation of Soil Quality
Principal component analysis was performed on 18 initially selected evaluation indicators. Combined with Norm values, six indicators—ST, Silt, MWD, SOM, AP, and AK—were selected to establish an MDS. This MDS encompasses soil hydrothermal characteristics, pore structure, texture, aggregate stability, and nutrient properties. Radar chart analysis revealed that the range of variation in soil quality evaluation indicators was greater in the 0–20 cm soil layer than in the 20–40 cm layer (Figure 8a,b).
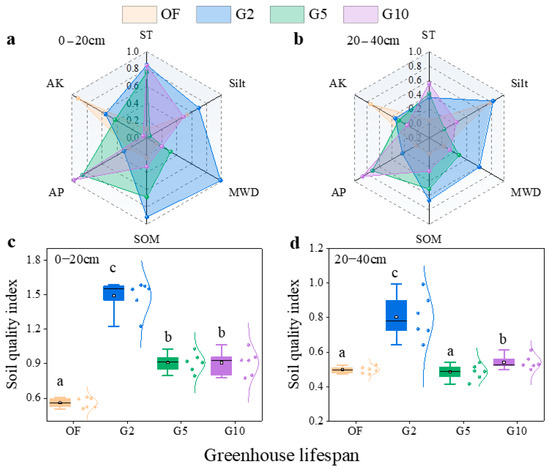
Figure 8.
Soil quality index characteristics under different greenhouse lifespans. (a) Soil indicators at 0–20 cm; (b) Soil indicators at 20–40 cm; (c) Soil quality at 0–20 cm; (d) Soil quality at 20–40 cm. Note: In the figure, different lowercase letters indicate significant differences between different greenhouse lifespans within the same soil layer (p < 0.05). Abbreviations: ST: soil temperature; MWD: mean weight diameter; SOM: soil organic matter; AP: available phosphorus; AK: available potassium.
The area of the radar charts, representing the quantified parameters influencing soil quality, was used to characterize the SQI of greenhouses with varying lifespans (Figure 8c,d). Greenhouse operation significantly affected SQI. The initial phase of greenhouse operation improved soil quality, with G2 exhibiting the highest SQI among different greenhouse lifespans and the greatest dispersion. Compared to OF, the SQI for G2 increased by 166.11% and 61.55% in the 0–20 cm and 20–40 cm soil layers, respectively (p < 0.05). The largest increase was observed in the surface soil layer. As the greenhouse lifespan increased, the SQI in both soil layers gradually declined. Specifically, compared to G2, the SQI in G10 decreased by 32.59% and 38.97% in the 0–20 cm and 20–40 cm layers, respectively (p < 0.05).
4. Discussion
4.1. Variations in Soil Physicochemical Properties Under Different Greenhouse Lifespan
The greenhouse lifespan is an important factor affecting the physicochemical properties of the soil [27,54]. Mantel test analysis shows that, except for BD, SP, GMD, and D, the remaining soil physicochemical property indicators are significantly positively correlated with the greenhouse lifespan (p < 0.05, Mantel’s r ≥ 0.25). Soil layer depth is only significantly positively correlated with NH4+-N, NO3−-N, BD, SP, ST, GMD, and D (p < 0.05, Mantel’s r ≥ 0.25, Figure 9). This shows that, compared with soil layer depth, the greenhouse lifespan has a more significant impact on the soil’s physicochemical properties, especially the soil nutrients and soil texture are most significantly affected by the greenhouse lifespan.
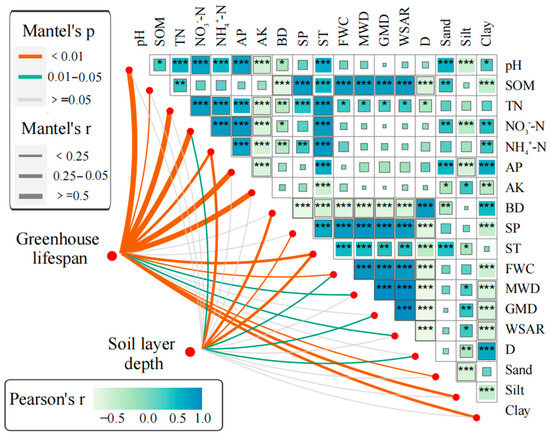
Figure 9.
Correlation between greenhouse lifespan, soil layer depth, and soil physicochemical properties. Note: *, **, and *** respectively denote the correlation being statistically significant at p < 0.05, p < 0.01, and p < 0.001. Abbreviations: SOM: soil organic matter; TN: total nitrogen; NO3−-N: nitrate nitrogen; NH4+-N: ammonium nitrogen; AP: available phosphorus; AK: available potassium; BD: bulk density; SP: soil porosity; ST: soil temperature; FWC: field water capacity; MWD: mean weight diameter; GMD: geometric mean diameter; WSAR: water-stable aggregate stability ratio; D: fractal dimension.
Compared to OF, G2 significantly increased the proportion of large soil aggregates (Figure 4 and Figure 5), leading to improved aggregate stability and increased nutrient content (Figure 6 and Figure 7). Consequently, soil aeration porosity was enhanced, and overall soil physicochemical properties were improved (Figure 2). These results are consistent with the findings of Liu et al. (2024) [37]. These improvements can be attributed to increased ST associated with greenhouse operation and relatively high soil microbial abundance [55]. Elevated ST levels can stimulate microbial activity, facilitating the decomposition and transformation of nutrients from organic fertilizers, thereby enhancing soil fertility. Furthermore, the metabolic activities of microorganisms can generate gel-like substances that enhance the cohesion between soil particles [56,57], contributing to increased soil aggregate stability and improved soil structure.
Farmlands under long-term greenhouse operations commonly exhibit elevated levels of nitrogen and phosphorus, along with nutrient accumulation (Figure 7). This phenomenon is primarily due to the frequent application of commercial organic fertilizers and nitrogen and phosphorus fertilizers by farmers seeking to enhance production efficiency [18]. Notably, SOM and AK significantly decrease as the greenhouse lifespan increases (Figure 7). This decline is mainly attributed to the alteration of the micro-ecological environment within greenhouses by high temperature, high humidity, and frequent tillage, which accelerates the breakdown of soil aggregates, as well as the mineralization and decomposition of SOM [22]. Secondly, the excessive accumulation of soil nutrients is detrimental to forming and maintaining soil carbon pools [21], resulting in reduced SOM. Simultaneously, farmers often prioritize nitrogen fertilizer application during topdressing, while neglecting potassium fertilizer replenishment, and the soil in the study area exhibits a low potassium retention capacity [58]. The combination of these factors and the high frequency of irrigation readily leads to the leaching of soluble SOM and nutrients and collectively accelerates the loss of both AK and SOM.
With increased greenhouse lifespans, key soil structural parameters such as MWD, GMD, and WSAR significantly decreased (Figure 6a–c), and the soil texture also exhibited a trend of transformation from silt towards finer clay particles (Figure 3). This trend was primarily because frequent tilling and compaction in greenhouses, which readily disrupted the original soil aggregate structure, breaking large aggregates into smaller aggregates or even single-grain structures. Simultaneously, the reduction in SOM weakened the binding forces between soil particles [59], and the long-term high-humidity environment may accelerate the hydrolysis and dispersion of soil aggregates, further exacerbating the degradation of soil structure. Secondly, as the greenhouse lifespan increased, the soil pH gradually increased, and the soil pH evolved from neutral to slightly alkaline (Figure 7). The result can be attributed to excessive nutrient application leading to a decline in the soil buffering capacity. Incompletely matured organic fertilizers or ammonium bicarbonate release alkaline ions during the ammonification process, accompanied by an increase in Na+ content, causing the soil to exhibit a slightly alkaline trend [60,61].
4.2. Drivers of Soil Quality Degradation Under Long-Term Greenhouse Operation
The SEM analysis revealed that pH, soil nutrients, soil texture, aggregate stability, and soil hydrothermal characteristics and pore structure accounted for 85.0% of the variance in SQI (Figure 10a). Except for pH, all other soil quality evaluation indicators exerted a highly significant positive direct effect on soil quality (p < 0.01). Among these, soil hydrothermal characteristics and pore structure had the most substantial impact, followed by soil nutrients and aggregate stability, with soil texture displaying the smallest impact. It is worth noting that the results of this study differ from previous research, which generally identifies soil nutrients as the primary determinant of soil quality [62,63,64]. This discrepancy may arise from the negative impacts of excessive tillage and fertilization in greenhouses on soil physicochemical properties and biodiversity [65,66], leading to soil nutrient imbalances. Furthermore, the alkaline pH will further limit the effective absorption and utilization of nutrients by plants by influencing key processes such as nutrient form, solubility, and microbial activity [67,68]. Together, these factors weaken the decisive role of nutrients in soil quality, which also verifies our hypothesis. In this context, a favorable hydrothermal environment and pore structure can regulate soil quality by improving root aeration, promoting nutrient transport, and regulating microbial activity, thereby playing a more important role in maintaining soil quality in greenhouses.
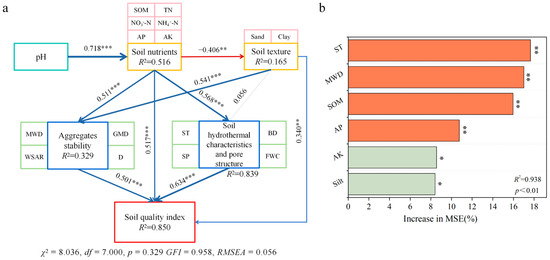
Figure 10.
Structural equation model of the impact of soil physicochemical properties on soil quality in the greenhouse. (a) Pathways of the effects of soil physicochemical properties on soil quality; (b) Independent contributions of soil physicochemical properties to soil quality. Note: *** indicates significance at the p < 0.001 level; ** indicates significance at the p < 0.01 level; * indicates significance at the p < 0.05 level. The blue and red arrows represent positive and negative effects, respectively; solid lines and dashed lines indicate significant and non-significant effects, respectively; numbers denote standard path coefficients; arrow width is proportional to the strength of the relationship; R2 represents the proportion of variance explained. Abbreviations: SOM: soil organic matter; TN: total nitrogen; NO3−-N: nitrate nitrogen; NH4+-N: ammonium nitrogen; AP: available phosphorus; AK: available potassium; BD: bulk density; SP: soil porosity; ST: soil temperature; FWC: field water capacity; MWD: mean weight diameter; GMD: geometric mean diameter; WSAR: water-stable aggregate stability ratio; D: fractal dimension.
Random forest model analysis results indicated that ST, MWD, SOM, and AP had a highly significant impact on SQI (p < 0.01), while AK and silt content showed a significant effect (p < 0.05) (Figure 10b). Among these, ST emerged as the primary factor influencing soil quality, followed by MWD and SOM, with the remaining indicators collectively explaining only 27.7% of the variance in SQI. Mainly because ST is a key driver of soil biogeochemical processes [55], influencing soil health by regulating microbial metabolic activity, enzyme activity, and nutrient transformation rates.
In this study, compared with OF, G2 exhibited the highest soil quality index (SQI), whereas SQI declined significantly with increasing greenhouse lifespan (Figure 6c,d). This pattern can be attributable to the alternating impacts of rainy-season erosion and seasonal drought under extreme climatic conditions in southern regions, which intensify the sensitivity of soil nutrient characteristics and microbial activity to ST [69,70]. In such environments, greenhouses exhibited stronger thermal retention than OF, and a relatively stable ST helped to maintain soil biological activity and chemical reaction rates, thereby benefiting soil quality. However, the positive effect was offset by long-term, high-intensity tillage and fertilization. Prolonged intensive tillage and fertilization in greenhouses severely degraded soil structure, leading to decreases in MWD and substantial losses of SOM (Figure 6a and Figure 7). These changes not only reduced the soil′s nutrient holding capacity and decreased aeration porosity, but more importantly, the long-term excessive application of nitrogen and phosphorus fertilizers often leads to the relative scarcity of trace elements (such as zinc and iron) in the soil [71,72], thereby disrupting the nutrient balance. This nutrient imbalance may further inhibit the absorption and utilization of nutrients by crops, reduce fertilizer utilization efficiency, and even trigger the toxicity of certain elements. Therefore, during the operation of greenhouses, emphasis should be placed on improving soil structure, supplementing SOM, and rationally balancing various nutrients according to crop needs to enhance the sustainable utilization capacity of greenhouse soil.
4.3. Targeted Soil Quality Improvement Strategies for Greenhouse
The quality of vegetables is crucial for human health, and a healthy soil environment is the foundation for the sustainable, green, and high-quality development of vegetable production [73,74]. Research indicates that soil degradation in greenhouses under intensive continuous cropping conditions can lead to problems such as reduced biological activity in the rhizosphere and increased pest and disease incidence, resulting in a significant reduction in vegetable yield and quality [75,76]. For example, the accumulation of nitrates in leafy vegetables and the decline in the content of trace elements such as iron and zinc in agricultural products can deteriorate their nutritional quality [77]. Therefore, improving soil quality to enhance vegetable quality has become a primary task in the current development of facility agriculture [78]. Given the current state of soil quality degradation in greenhouses in the study area, there is an urgent need to formulate and implement corresponding solutions to restore and enhance the health and functionality of the soil.
During 2–5 years of greenhouse operation, the SQI decreased significantly (Figure 8c,d). In the management of greenhouses, a key timeframe to focus on is the 2–5 years period, during which comprehensive regulation and control measures should be used to improve soil quality. This study emphasizes that maintaining a suitable hydrothermal environment and pore structure is a key strategy for improving soil quality and ensuring crop productivity. Specifically, soil pore structure can be improved and soil aeration enhanced, through measures such as combining deep plowing and loosening of the soil with biochar [19,79]. At the same time, regular soil nutrient testing should be carried out, and precise fertilization should be implemented based on the test results to avoid nutrient excess or deficiency and maintain soil nutrient balance. When necessary, applying microbial agents and bio-fertilizers can be combined to improve fertilizer utilization and the soil microbial environment [80,81]. In addition, ventilation management should be strengthened, and covering materials should be used reasonably to regulate the microclimate in the greenhouse and reduce pests and diseases caused by excessive soil moisture. However, this study mainly focuses on improving soil physicochemical properties and lacks an in-depth analysis of changes in microbial community structure and function. Future research should strengthen the analysis of interaction mechanisms among microclimate regulation, soil pore structure, microbial communities, and nutrient cycling within greenhouses, while conducting comparative analysis and validation against relevant international findings. These efforts will provide a more rigorous theoretical foundation for improving soil quality in long-term continuous-cropping greenhouses.
5. Conclusions
This study applied the space-for-time substitution method to investigate the impact of greenhouse lifespan on the soil quality of vegetable farmlands. The results indicate that the effect of greenhouse lifespan on soil physicochemical properties is significantly greater than that of soil layer depth (p < 0.05), and soil quality changes exhibit distinct stage characteristics. In the early stages of greenhouse operation (G2), the soil had a higher nutrient content, significantly improving ST, SP, FWC, and aggregate stability, causing the highest SQI among different greenhouse lifespans. However, as the greenhouse lifespan increased, SP, FWC, aggregate stability, SOM, and AK consistently declined, while soil pH gradually shifted from neutral to slightly alkaline. The excessive application of chemical fertilizers significantly increased nitrogen and phosphorus accumulation in the soil, leading to nutrient imbalances and a gradual decline in SQI over time. Structural equation modeling analysis revealed that high-intensity water and fertilizer management weakens the explanatory power of soil nutrients on the SQI, making soil hydrothermal characteristics and pore structure the primary factors influencing soil quality in greenhouses. Random forest model analysis further demonstrated that ST is the most critical parameter affecting soil quality, with its thermal retention capacity serving as the key to improving SQI. The observed reductions in MWD and SOM as greenhouse lifespans increased were identified as fundamental reasons for the decline in SQI. Therefore, we believe that in long-term continuous cropping greenhouses, special attention should be paid to the critical period of 2–5 years of greenhouse operation, emphasizing the protection of soil structure and the improvement of SOM, regulating soil nutrient balance, to maintain a more sustainable future development of the greenhouse vegetable industry.
Author Contributions
Conceptualization, X.Z., J.L. and Q.D.; methodology, K.Y. and X.M.; software, Z.C.; validation, K.Y. and X.M.; formal analysis, X.Z., Z.C. and Y.H.; investigation, K.Y., X.M. and Y.H.; resources, J.L. and Q.D.; data curation, K.Y. and X.M.; writing—original draft preparation, K.Y. and X.M.; writing—review and editing, X.Z. and Z.C.; visualization, K.Y. and X.M.; supervision, J.L., Q.D., and Z.C.; funding acquisition, Z.C. All authors have read and agreed to the published version of the manuscript.
Funding
This research was funded by the Youth Talent Project of the Talent Introduction Program for Yunnan Province (XDYC-QNRC-2022-0171), the Yunnan Fundamental Research Projects (202201AT070272, 202301BD070001-033).
Data Availability Statement
The original contributions presented in this study are included in the article. Further inquiries can be directed to the corresponding author(s).
Conflicts of Interest
The authors declare no conflicts of interest.
References
- Bisbis, M.; Gruda, N.; Blanke, M. Potential impacts of climate change on vegetable production and product quality–A review. J. Clean. Prod. 2018, 170, 1602–1620. [Google Scholar] [CrossRef]
- Chen, W.; Xu, Y.M.; Zhang, Z.; Yang, L.; Pan, X.B.; Jia, Z. Mapping agricultural plastic greenhouses using Google Earth images and deep learning. Comput. Electron. Agric. 2021, 191, 106552. [Google Scholar] [CrossRef]
- Li, J.; Wang, G.; Allison, S.; Mayes, M.; Luo, Y. Soil carbon sensitivity to temperature and carbon use efficiency compared across microbial-ecosystem models of varying complexity. Biogeochemistry 2014, 119, 67–84. [Google Scholar] [CrossRef]
- Zhou, W.; Wang, Q.; Chen, S.; Chen, F.; Lv, H.; Li, J.; Chen, Q.; Zhou, J.; Liang, B. Nitrate leaching is the main driving factor of soil calcium and magnesium leaching loss in intensive plastic-shed vegetable production systems. Agric. Water Manag. 2024, 293, 108708. [Google Scholar] [CrossRef]
- Hu, Y.; Song, Z.; Lu, W.; Poschenrieder, C.; Schmidhalter, U. Current soil nutrient status of intensively managed greenhouses. Pedosphere 2012, 22, 825–833. [Google Scholar] [CrossRef]
- Gao, M.; Hu, W.; Li, M.; Wang, S.; Chu, L. Network analysis was effective in establishing the soil quality index and differentiated among changes in land-use type. Soil Tillage Res. 2025, 246, 106352. [Google Scholar] [CrossRef]
- Jin, H.; Shi, D.; Lou, Y.; Zhang, J.; Ye, Q.; Jiang, N. Evaluation of the quality of cultivated-layer soil based on different degrees of erosion in sloping farmland with purple soil in China. CATENA 2021, 198, 105048. [Google Scholar] [CrossRef]
- Wang, C.; Ma, Y.; Hai, H.; Kuzyakov, Y.; Bol, R.; Chen, H.; Fan, M. Soil quality and ecosystem multifunctionality after 13-year of organic and nitrogen fertilization. Sci. Total Environ. 2024, 931, 172789. [Google Scholar] [CrossRef]
- Vasu, D.; Tiwari, G.; Sahoo, S.; Dash, B.; Jangir, A.; Sharma, R.; Naitam, R.; Tiwary, P.; Karthikeyan, K.; Chandran, P. A minimum data set of soil morphological properties for quantifying soil quality in coastal agroecosystems. CATENA 2021, 198, 105042. [Google Scholar] [CrossRef]
- Li, F.; Zhang, X.; Zhao, Y.; Song, M.; Liang, J. Soil quality assessment of reclaimed land in the urban-rural fringe. CATENA 2023, 220, 106692. [Google Scholar] [CrossRef]
- Zhu, Z.; Chen, J.; Hu, H.; Zhou, M.; Zhu, Y.; Wu, C.; Zhu, L.; Jiang, X.; Wang, J. Soil quality evaluation of different land use modes in small watersheds in the hilly region of southern Jiangsu. Ecol. Indic. 2024, 160, 111895. [Google Scholar] [CrossRef]
- Feng, W.; Sánchez-Rodríguez, A.; Bilyera, N.; Wang, J.; Wang, X.; Han, Y.; Ma, B.; Zhang, H.; Li, F.; Zhou, J.; et al. Mechanisms of biochar-based organic fertilizers enhancing maize yield on a Chinese Chernozem: Root traits, soil quality and soil microorganisms. Environ. Technol. Innov. 2024, 36, 103756. [Google Scholar] [CrossRef]
- Huo, R.; Wang, J.; Wang, K.; Zhang, Y.; Ren, T.; Li, X.; Cong, R.; Lu, J. Long-term straw return enhanced crop yield by improving ecosystem multifunctionality and soil quality under triple rotation system: An evidence from a 15 years study. Field Crops Res. 2024, 312, 109395. [Google Scholar] [CrossRef]
- Kuzyakov, Y.; Gunina, A.; Zamanian, K.; Tian, J.; Luo, Y.; Xu, X.; Yudina, A.; Aponte, H.; Alharbi, H.; Ovsepyan, L. New approaches for evaluation of soil health, sensitivity and resistance to degradation. Front. Agric. Sci. Eng. 2020, 7, 282–288. [Google Scholar] [CrossRef]
- Jin, H.; Zhong, Y.; Shi, D.; Li, J.; Lou, Y.; Li, Y.; Li, J. Quantifying the impact of tillage measures on the cultivated-layer soil quality in the red soil hilly region: Establishing the thresholds of the minimum data set. Ecol. Indic. 2021, 130, 108013. [Google Scholar] [CrossRef]
- Sun, Y.; Chang, X.; Zhao, L.; Zhou, B.; Weng, L.; Li, Y. Comparative study on the pollution status of organochlorine pesticides (OCPs) and bacterial community diversity and structure between plastic shed and open-field soils from northern China. Sci. Total Environ. 2020, 741, 139620. [Google Scholar] [CrossRef]
- Wu, G.; Zhao, M.; Liu, B.; Wang, X.; Yuan, M.; Wang, J.; Chen, X.; Wang, X.; Sun, Y. Environmental impact and mitigation potentials in Greenhouse tomatoes production system in Yangtze River Delta. Plant Soil 2024, 509, 289–300. [Google Scholar] [CrossRef]
- Hu, W.; Zhang, Y.; Huang, B.; Teng, Y. Soil environmental quality in greenhouse vegetable production systems in eastern China: Current status and management strategies. Chemosphere 2017, 170, 183–195. [Google Scholar] [CrossRef] [PubMed]
- Zhu, R.; Zhang, P.; Li, X.; Duan, Z. How to remediate sulfate-nitrate salinized greenhouse soil? An optimal combination of organic amendment, fertilizer and irrigation. Sci. Hortic. 2023, 321, 112264. [Google Scholar] [CrossRef]
- Yu, Q.; Xu, L.; Wang, M.; Xu, S.; Sun, W.; Yang, J.; Shi, Y.; Shi, X.; Xie, X. Decreased soil aggregation and reduced soil organic carbon activity in conventional vegetable fields converted from paddy fields. Eur. J. Soil Sci. 2022, 73, e13222. [Google Scholar] [CrossRef]
- Zong, M.; Lin, C.; Li, S.; Li, H.; Duan, C.; Peng, C.; Guo, Y.; An, R. Tillage activates iron to prevent soil organic carbon loss following forest conversion to cornfields in tropical acidic red soils. Sci. Total Environ. 2021, 761, 143253. [Google Scholar] [CrossRef]
- Obour, A.; Holman, J.; Simon, L.; Assefa, Y. Nitrogen fertilizer and tillage intensity affected winter wheat macronutrient uptake and utilization efficiencies. Agrosystems Geosci. Environ. 2023, 6, 20334. [Google Scholar] [CrossRef]
- Zeglin, L.; Dahm, C.; Barrett, J.; Gooseff, M.; Fitpatrick, S.; Takacs-Vesbach, C. Bacterial Community Structure Along Moisture Gradients in the Parafluvial Sediments of Two Ephemeral Desert Streams. Microb. Ecol. 2011, 61, 543–556. [Google Scholar] [CrossRef] [PubMed]
- An, J.; Zheng, L.; Ma, L.; Ma, X.; Ma, J. Effects of Different Mulched Drip Irrigation Levels on the Soil Microorganisms and Yield of Greenhouse Tomatoes (Solanum lycopersicum L.). Horticulturae 2025, 11, 204. [Google Scholar] [CrossRef]
- Zhao, Y.; Mao, X.; Zhang, M.; Yang, W.; Di, H.; Ma, L.; Liu, W.; Li, B. Response of soil microbial communities to continuously mono-cropped cucumber under greenhouse conditions in a calcareous soil of north China. J. Soils Sediments 2020, 20, 2446–2459. [Google Scholar] [CrossRef]
- Hou, M.; Tang, S.; Zhu, Q.; Chen, J.; Ying, X.; Qiu, J.; Zhong, F. Long-term fermented organic fertilizer application reduce urea nitrogen-15 loss from plastic shed agricultural soils. Ann. Agric. Sci. 2023, 68, 108–117. [Google Scholar] [CrossRef]
- Xie, X.; Pu, L.; Wang, Q.; Zhu, M.; Xu, Y.; Zhang, M. Response of soil physicochemical properties and enzyme activities to long-term reclamation of coastal saline soil, Eastern China. Sci. Total Environ. 2017, 607, 1419–1427. [Google Scholar] [CrossRef]
- Nabi, F.; Yang, G.; Sajid, S.; Chen, H.; Kaleri, A.; Chen, T.; Wang, X.; Hu, Y. Linking soil microbial community with the changes in soil physicochemical properties in response to long-term agricultural land use change of different chronosequences and depth layers. Ecol. Indic. 2022, 145, 109727. [Google Scholar] [CrossRef]
- Wang, X.; Yang, M.; Gao, L.; Li, Y.; Liang, W.; Zhang, X. Continuous cropping obstacles: Insights from the community composition and the imbalance carbon fluxes within soil nematode food web. Geoderma 2024, 451, 117060. [Google Scholar] [CrossRef]
- Ahmad, N.; Virk, A.; Hafeez, M.; Ercisli, S.; Golokhvast, K.; Qi, Y.; Guo, X.; Zhang, Y.; Wang, R.; Wang, X.; et al. Effects of different tillage and residue management systems on soil organic carbon stock and grain yield of rice-wheat double cropping system. Ecol. Indic. 2024, 158, 111452. [Google Scholar] [CrossRef]
- Gong, D.; Wang, Z.; Zhang, Y. Spatial-temporal variation characteristics of greenhouse-vegetable land in Lhasa of Tibet from 2008 to 2018. Trans. Chin. Soc. Agric. Eng. 2020, 36, 233–241. (In Chinese) [Google Scholar]
- Zhang, J.; Liu, Y. Research on the evolution and driving factors of vegetable production agglomeration pattern in China’s provinces. J. Shenyang Agric. Univ. 2024, 55, 605–615. (In Chinese) [Google Scholar]
- Wang, X.; Dou, Z.; Shi, X.; Zou, C.; Liu, D.; Wang, Z.; Guan, X.; Sun, Y.; Wu, G.; Zhang, B.; et al. Innovative management programme reduces environmental impacts in Chinese vegetable production. Nat. Food 2021, 2, 47–53. [Google Scholar] [CrossRef] [PubMed]
- Kalkhajeh, Y.K.; Huang, B.; Hu, W.Y.; Ma, C.; Gao, H.J.; Thompson, M.L.; Hansen, H.C.B. Environmental soil quality and vegetable safety under current greenhouse vegetable production management in China. Agric. Ecosyst. Environ. 2021, 307, 107230. [Google Scholar] [CrossRef]
- Zhao, F.; Zhang, Y.; Dong, W.; Zhou, C.; Zhang, G.; Yang, L. Effects of amendments on base cation and micronutrient availabilities in soils planted with tomato in a solar greenhouse. Soil Sci. Plant Nutr. 2018, 64, 782–792. [Google Scholar] [CrossRef]
- Li, X.; Quan, Z.; Huang, K.; Kang, R.; Su, C.; Liu, D.; Ma, J.; Chen, X.; Fang, Y. High soil nitrous oxide emissions from a greenhouse vegetable production system in Shouguang, Northern China. Atmos. Environ. 2024, 319, 120264. [Google Scholar] [CrossRef]
- Liu, B.; Wen, Y.; Lin, L.; Wen, X.; Gao, R.; Zhang, B.; Li, T.; Yao, S. Variations in soil quality indicators under different cultivation ages and slope positions of arable land in the Mollisol region of China. CATENA 2024, 246, 108418. [Google Scholar] [CrossRef]
- Yu, W.; Zhao, P.; Li, C.; Wang, D.; Ming, C.; Chen, L.; Zhou, L.; Zhu, Q.; Tang, L.; Zhou, Y.; et al. Intercropping achieves long-term dual goals of yield gains and soil N2O emission mitigation. Resour. Environ. Sustain. 2025, 20, 100210. [Google Scholar] [CrossRef]
- Zhang, Y.; Wu, T. Effects of water temperature on soil aggregate stability between soils developed from different parent materials in the subtropical hilly area of China. CATENA 2024, 241, 108080. [Google Scholar] [CrossRef]
- General Office of Yunnan Provincial People’s Government. Notice of Yunnan Provincial People’s Government on Printing and Distributing the ‘14th Five-Year Plan’ for Agricultural and Rural Modernization Development in Yunnan Province. Available online: https://www.yn.gov.cn/zwgk/zcwj/yzf/202204/t20220418_240826.html (accessed on 21 May 2022).
- Zhang, W.; Wu, J.; Xu, M.; Ma, T.; Lu, J.; Zhu, J.; Ren, T.; Cong, R.; Lu, Z.; Zhang, Y.; et al. Rice-crayfish farming increases soil organic carbon sequestration by promoting aggregate protection and microbial necromass accumulation. Agric. Ecosyst. Environ. 2025, 383, 109519. [Google Scholar] [CrossRef]
- Du, L.; Zheng, Z.; Li, T.; Wang, Y.; Huang, H.; Yu, H.; Ye, D.; Liu, T.; Zhang, X. Aggregate-associated carbon compositions explain the variation of carbon sequestration in soils after long-term planting of different tea varieties. Sci. Total Environ. 2023, 856, 159227. [Google Scholar] [CrossRef]
- Bao, S. Soil Agrochemical Analysis, 3rd ed.; China Agriculture Press: Beijing, China, 2000. (In Chinese) [Google Scholar]
- Corral-Pazos-de-Provens, E.; Rapp-Arraras, I.; Domingo-Santos, J. Estimating textural fractions of the USDA using those of the International System: A quantile approach. Geoderma 2022, 416, 115783. [Google Scholar] [CrossRef]
- Wang, G.; Dong, Y.; Rong, L.; Yang, W.; Duan, X. The influence of vegetation restoration on soil quality in abandoned farmlands in the Yuanjiang dry-hot valley. CATENA 2024, 242, 108109. [Google Scholar] [CrossRef]
- Huang, X.; Wang, B.; Li, P.; Chen, A.; Cui, J.; Chen, Y.; Gao, W. Organic management promotes nitrogen transformation in tea plantations soil: A case study from southwestern China. Appl. Soil Ecol. 2025, 206, 105878. [Google Scholar] [CrossRef]
- Wei, L.; Li, Y.; Zhu, Z.; Wang, F.; Liu, X.; Zhang, W.; Xiao, M.; Li, G.; Ding, J.; Chen, J.; et al. Soil health evaluation approaches along a reclamation consequence in Hangzhou Bay, China. Agric. Ecosyst. Environ. 2022, 337, 108045. [Google Scholar] [CrossRef]
- Wang, X.; Zhong, Z.; Li, W.; Liu, W.; Zhang, X.; Wu, S.; Ren, Z.; Wu, Q.; Shen, Z.; Ren, C.; et al. Effects of Robinia pseudoacacia afforestation on aggregate size distribution and organic C dynamics in the central Loess Plateau of China: A chronosequence approach. J. Environ. Manag. 2020, 268, 110558. [Google Scholar] [CrossRef]
- Ye, L.; Tan, W.; Fang, L.; Ji, L. Spatial analysis of soil aggregate stability in a small catchment of the Loess Plateau, China: II. Spatial prediction. Soil Tillage Res. 2019, 192, 1–11. [Google Scholar] [CrossRef]
- Wu, T.; Zhang, Y.; Wang, Y.; Wang, S.; Lei, L. Factors affecting the stability of soil aggregates of plinthosols in the middle reaches of the Yangtze River. CATENA 2023, 228, 107159. [Google Scholar] [CrossRef]
- Nabiollahi, K.; Golmohamadi, F.; Taghizadeh-Mehrjardi, R.; Kerry, R.; Davari, M. Assessing the effects of slope gradient and land use change on soil quality degradation through digital mapping of soil quality indices and soil loss rate. Geoderma 2018, 318, 16–28. [Google Scholar] [CrossRef]
- Nakajima, T.; Lal, R.; Jiang, S. Soil quality index of a crosby silt loam in central Ohio. Soil Tillage Res. 2015, 146, 323–328. [Google Scholar] [CrossRef]
- Yang, J.; Xin, X.; Zhang, X.; Zhong, X.; Yang, W.; Ren, G.; Zhu, A. Effects of soil physical and chemical properties on phosphorus adsorption-desorption in fluvo-aquic soil under conservation tillage. Soil Tillage Res. 2023, 234, 105840. [Google Scholar] [CrossRef]
- Lin, L.; Han, S.; Zhao, P.; Li, L.; Zhang, C.; Wang, E. Influence of soil physical and chemical properties on mechanical characteristics under different cultivation durations with Mollisols. Soil Tillage Res. 2022, 224, 105520. [Google Scholar] [CrossRef]
- Peng, J.; Yang, Q.; Zhang, C.; Ni, S.; Wang, J.; Cai, C. Aggregate pore structure, stability characteristics, and biochemical properties induced by different cultivation durations in the Mollisol region of Northeast China. Soil Tillage Res. 2023, 233, 105797. [Google Scholar] [CrossRef]
- Xu, L.; Zhou, Y.; Miao, C.; Chen, H.; Zhang, J.; Qian, H.; Hou, P.; Ding, Y.; Liu, Z.; Li, W.; et al. Long-term straw return increases fungal residual contribution to soil microaggregate nitrogen pool: An eco-enzymatic stoichiometric study. Soil Tillage Res. 2024, 244, 106278. [Google Scholar] [CrossRef]
- Liu, Y.; Wang, P.; Ding, Y.; Lu, H.; Li, L.; Cheng, K.; Zheng, J.; Filley, T.; Zhang, X.; Zheng, J.; et al. Microbial activity promoted with organic carbon accumulation in macroaggregates of paddy soils under long-term rice cultivation. Biogeosciences 2016, 13, 6565–6586. [Google Scholar] [CrossRef]
- Jin, H.; Huang, S.; Shi, D.; Li, J.; Li, J.; Li, Y.; Zhu, H. Effects of different tillage practices on soil stability and erodibility for red soil sloping farmland in Southern China. Agronomy 2023, 13, 1310. [Google Scholar] [CrossRef]
- Tang, X.; Qiu, J.; Xu, Y.; Li, J.; Chen, J.; Li, B.; Lu, Y. Responses of soil aggregate stability to organic C and total N as controlled by land-use type in a region of south China affected by sheet erosion. CATENA 2022, 218, 106543. [Google Scholar] [CrossRef]
- Ren, Q.; Sun, R.; Zheng, K.; Liu, Y.; Ruan, X.; Wang, Y. Soil properties, heavy metal accumulation, and ecological risk in vegetable greenhouses of different planting years. Huanjing Kexue 2022, 43, 995–1003. [Google Scholar] [CrossRef] [PubMed]
- Rastinfard, A.; Dalisson, B.; Barralet, J. Aqueous decomposition behavior of solid peroxides: Effect of pH and buffer composition on oxygen and hydrogen peroxide formation. Acta Biomater. 2022, 145, 390–402. [Google Scholar] [CrossRef] [PubMed]
- Cao, Y.; Ai, Z.; Dang, X.; Hou, M.; Liu, H.; Li, Q.; Yao, Y.; Deng, Y.; Zhu, S.; Xiao, L. Effects of different reclamation measures on soil quality restoration in open-pit mines: A meta-analysis based on the Chinese Loess Plateau. Ecol. Eng. 2024, 203, 107257. [Google Scholar] [CrossRef]
- Sheng, Y.; He, P.; Xu, X.; Liu, Y. A large-scale assessment on spatial variability of potato yield and soil chemical properties in northern China. Soil Tillage Res. 2023, 231, 105743. [Google Scholar] [CrossRef]
- Visscher, A.; de Carvalho da Silva Pereira, M.; Kuyper, T.; Lavres, J., Jr.; Pellegrino Cerri, C.; Zarate do Couto, H.; Righi, C. Moderate swidden agriculture inside dense evergreen ombrophilous forests can sustain soil chemical properties over 10–15 year cycles within the Brazilian Atlantic Forest. CATENA 2021, 200, 105117. [Google Scholar] [CrossRef]
- Zhang, J.; Wang, P.; Tian, H.; Xiao, Q.; Jiang, H. Pyrosequencing-based assessment of soil microbial community structure and analysis of soil properties with vegetable planted at different years under greenhouse conditions. Soil Tillage Res. 2019, 187, 1–10. [Google Scholar] [CrossRef]
- Zheng, S.; Bian, T.; Wang, S.; Zhang, X.; Li, X.; Zhang, Y.; Fu, H.; Sun, Z. Decoupling of P from C, N, and K elements in cucumber leaves caused by nutrient imbalance under a greenhouse continuous cropping system. Horticulturae 2021, 7, 528. [Google Scholar] [CrossRef]
- Cheng, J.; Zhao, M.; Cong, J.; Qi, Q.; Xiao, Y.; Cong, W.; Deng, Y.; Zhou, J.; Zhang, Y. Soil pH exerts stronger impacts than vegetation type and plant diversity on soil bacterial community composition in subtropical broad-leaved forests. Plant Soil 2020, 450, 273–286. [Google Scholar] [CrossRef]
- Wang, Z.; Meng, Y.; Zhu-Barker, X.; He, X.; Horwath, W.; Luo, H.; Zhao, Y.; Jiang, X. Responses of nitrification and ammonia oxidizers to a range of background and adjusted pH in purple soils. Geoderma 2019, 334, 9–14. [Google Scholar] [CrossRef]
- Li, J.; Yan, K.; Duan, Q.; Li, J.; Chen, Z. Effects of tillage practices on water storage and soil conservation in red soil slope farmland in Southern China. Sci. Rep. 2024, 14, 28781. [Google Scholar] [CrossRef]
- Tu, A.; Xie, S.; Mo, M.; Song, Y.; Li, Y. Water budget components estimation for a mature citrus orchard of southern China based on HYDRUS-1D model. Agric. Water Manag. 2021, 243, 106426. [Google Scholar] [CrossRef]
- Gupta, N.; Yadav, K.; Kumar, V.; Kumar, S.; Chadd, R.; Kumar, A. Trace elements in soil-vegetables interface: Translocation, bioaccumulation, toxicity and amelioration-A review. Sci. Total Environ. 2019, 651, 2927–2942. [Google Scholar] [CrossRef]
- Zhou, S.; Su, S.; Meng, L.; Liu, X.; Zhang, H.; Bi, X. Potentially toxic trace element pollution in long-term fertilized agricultural soils in China: A meta-analysis. Sci. Total Environ. 2021, 789, 147967. [Google Scholar] [CrossRef]
- Umeohia, U.; Olapade, A. Physiological processes affecting postharvest quality of fresh fruits and vegetables. Asian Food Sci. J. 2024, 23, 1–14. [Google Scholar] [CrossRef]
- Du, L.; Zhang, Z.; Chen, Y.; Wang, Y.; Zhou, C.; Yang, H.; Zhang, W. Heterogeneous impact of soil acidification on crop yield reduction and its regulatory variables: A global meta-analysis. Field Crops Res. 2024, 319, 109643. [Google Scholar] [CrossRef]
- Zhang, G.; Zheng, C.; Wang, Y.; Li, Y.; Xin, Y. Soil organic carbon and microbial community structure exhibit different responses to three land use types in the North China Plain. Acta Agric. Scand. Sect. B—Soil Plant Sci. 2015, 65, 341–349. [Google Scholar] [CrossRef]
- Li, Y.; Niu, W.; Xu, J.; Zhang, R.; Wang, J.; Zhang, M. Aerated irrigation enhancing quality and irrigation water use efficiency of muskmelon in plastic greenhouse. Trans. Chin. Soc. Agric. Eng. 2016, 32, 147–154. (In Chinese) [Google Scholar]
- Dong, J.; Gruda, N.; Lam, S.; Li, X.; Duan, Z. Effects of elevated CO2 on nutritional quality of vegetables: A review. Front. Plant Sci. 2018, 9, 00924. [Google Scholar] [CrossRef]
- Zoghlami, R.; Toukabri, W.; Boudabbous, K.; Hechmi, S.; Barbouchi, M.; Oueriemmi, H.; Moussa, M.; Bahri, H. Assessment of earthworm viability and soil health after two years of raw and composted de-Inking paper sludge amendment. Agriculture 2023, 13, 547. [Google Scholar] [CrossRef]
- Ji, C.; Ye, R.; Yin, Y.; Sun, X.; Ma, H.; Gao, R. Reductive soil disinfestation with biochar amendment modified microbial community composition in soils under plastic greenhouse vegetable production. Soil Tillage Res. 2022, 218, 105323. [Google Scholar] [CrossRef]
- Kour, D.; Rana, K.; Yadav, A.; Yadav, N.; Kumar, M.; Kumar, V.; Vyas, P.; Dhaliwal, H.; Saxena, A. Microbial biofertilizers: Bioresources and eco-friendly technologies for agricultural and environmental sustainability. Biocatal. Agric. Biotechnol. 2020, 23, 101487. [Google Scholar] [CrossRef]
- Atieno, M.; Herrmann, L.; Nguyen, H.; Phan, H.; Nguyen, N.; Srean, P.; Than, M.; Zhiyong, R.; Tittabutr, P.; Shutsrirung, A.; et al. Assessment of biofertilizer use for sustainable agriculture in the Great Mekong Region. J. Environ. Manag. 2020, 275, 111300. [Google Scholar] [CrossRef]
Disclaimer/Publisher’s Note: The statements, opinions and data contained in all publications are solely those of the individual author(s) and contributor(s) and not of MDPI and/or the editor(s). MDPI and/or the editor(s) disclaim responsibility for any injury to people or property resulting from any ideas, methods, instructions or products referred to in the content. |
© 2025 by the authors. Licensee MDPI, Basel, Switzerland. This article is an open access article distributed under the terms and conditions of the Creative Commons Attribution (CC BY) license (https://creativecommons.org/licenses/by/4.0/).