Article

Tillage Management Alters Carbon Sink Capacity in Arid Phaeozems: Insights from a Carbon Balance Perspective

1
School of Water Conservancy and Civil Engineering, Northeast Agricultural University, Harbin 150030, China
2
Key Laboratory of Efficient Utilization of Agricultural Water Resources, Ministry of Agriculture and Rural Affairs, Northeast Agricultural University, Harbin 150030, China
3
School of Public Administration and Law, Northeast Agricultural University, Harbin 150030, China
*
Authors to whom correspondence should be addressed.
These authors contributed equally to this work.
Agronomy 2025, 15(10), 2285; https://doi.org/10.3390/agronomy15102285
Submission received: 14 August 2025 / Revised: 18 September 2025 / Accepted: 25 September 2025 / Published: 26 September 2025
(This article belongs to the Section Farming Sustainability)

Abstract

To comprehensively explore the net carbon balance within cropland systems subject to diverse tillage practices (Down-slope cultivation (CK), Subsoiling tillage (SF), Ridge to district field (RF), Ridge to district field + subsoiling tillage (RF-S), Transverse slope planting (TP), Transverse slope planting + ridge to district field (TP-R), Transverse slope planting + subsoiling tillage (TP-S)), a series of well-designed field experiments were meticulously carried out. The CO2 emission intensity of soil heterotrophic respiration, CH4 emission intensity, carbon loss in runoff, carbon emissions from farmland materials, dry matter mass and carbon content of different crop organs after harvest were measured for the six different tillage practices. Moreover, the annual and seasonal variations in farmland soil carbon pools under different treatments were analyzed using the net carbon flux (NCF) of the cropland system. The results indicated that, under different tillage practices, the CO2 emission intensity of soil heterotrophic respiration in each regime across different years generally exhibited a pattern of increasing initially and then decreasing, reaching its peak during the filling stage (pod-setting stage). The RF regime significantly reduced the CO2 emissions from soil heterotrophic respiration (p < 0.05). The CH4 emissions in each regime across different years also demonstrated an overall tendency of rising initially and subsequently declining, with an alternating positive–negative pattern, reaching its peak during the jointing stage (branching stage). The SF regime significantly decreased the CH4 emissions (p < 0.05). The regimes with cross-slope tillage significantly reduced the carbon loss in runoff (p < 0.05). Throughout every year, the NPP of crops under the TP-S regime attained its peak value (p < 0.05). The RF regime effectively increased the NPP of crops, reduced the soil heterotrophic respiration CO2 emissions and the carbon loss in runoff, and its NCF value reached the maximum level (p < 0.05), presenting a weak carbon “source”. Overall, ridged-field (RF) effectively curbs greenhouse gas emissions, boosts farmland carbon sequestration, and mitigates soil fertility decline.

Graphical Abstract

1. Introduction

Global climate change represents a grave challenge to the sustainable development of human society. Moreover, it is a global concern that has captured the focus of governments and scientific circles worldwide [1,2,3,4,5]. In accordance with the 5th evaluation reports of the IPCC, from 1880 to 2012, the global average surface temperature exhibited a linear upward tendency, with an increment of approximately 0.85 °C. GHGs such as CO2, CH4, and N2O have ascended to the highest level witnessed in the past 800,000 years. Since the pre-industrial era (1850~1900), the concentration of CO2 has increased by 40%. Moreover, the contribution rate of CO2 to the intensification of the greenhouse effect has reached 60%, rendering carbon cycle research a prominent topic in the realm of climate change studies [6]. Global climate change is not merely demonstrated by the rise in temperature and the increase in greenhouse gas concentration. Additionally, the environmental and ecological issues engendered by these changes are remarkably severe. These problems pose a grave threat to human survival and sustainable development [7,8]. Consequently, investigating the processes and mechanisms of the carbon cycle within the soil-vegetation–atmosphere continuum, assessing the carbon sequestration capabilities of diverse ecosystems, elucidating the distribution of carbon sources and sinks in terrestrial ecosystems, uncovering unknown carbon sinks, and forecasting the trajectory of global climate change have emerged as pivotal topics in the scientific community [9,10].
The steadily growing human demand for food has propelled the continuous expansion of the global cultivated land area. Correspondingly, the carbon emissions from cropland ecosystems have been on a gradual upward trajectory. The question of how to manage the carbon emissions of cropland ecosystems so as to alleviate the greenhouse effect has attracted substantial attention from a multitude of researchers. Annually, approximately 5–20% of atmospheric CO2 and 15–30% of atmospheric CH4 originate from soil carbon emissions. Among these, farmland soil carbon emissions constitute one of the crucial wellsprings of soil carbon emissions [11,12]. The farmland ecosystem constitutes a crucial component of the terrestrial ecosystem. Moreover, it stands as one of the most significant ecosystems for humans in their efforts to address global climate change [13]. The carbon pool in the farmland ecosystem is not only the most dynamic part of the global carbon pool but also the one most prone to disruption from human activities. This specific carbon pool plays a crucial role in maintaining the global carbon balance [8]. When compared with natural ecosystems such as forests, grasslands, and wetlands, investigation into the carbon balance within farmland ecosystems is notably insufficient. Current research predominantly focuses on irrigated farmland ecosystems, with a dearth of studies on dryland farmland ecosystems. Notably, drylands encompass 70% of the global cultivated soil area, and 65% of the world’s food production is sourced from these regions. Consequently, there is an urgent need to intensify research on the carbon balance of dryland farmland ecosystems.
Tillage represents one of the primary agricultural practices implemented to ensure crop growth and boost grain yields. Moreover, it is the most direct means of perturbing the soil and altering the crop-growth environment [14]. As the global population continues to grow steadily, the demand for food has increased proportionally. Concurrently, the conflict between food production capacity and the ecological environment has become more acute [15]. In the context of contemporary research, seeking rational farming methods that can safeguard the ecological environment while ensuring food production capacity has emerged as a prominent focus. Human activities, characterized by the improper utilization and over-cultivation of farmland, have given rise to detrimental consequences, including soil erosion, soil degradation, a decline in crop yields, and an elevation in greenhouse gas discharges originating in agrarian system. Conversely, adopting appropriate tillage practices holds the potential to mitigate greenhouse gas emissions from farmland, control soil erosion, enhance the soil’s carbon sequestration capabilities, boost crop productivity, and preserve arable land resources [16,17,18,19,20,21].
In the past few years, a growing number of scholars have utilized three evaluation frameworks, namely soil carbon emission efficiency (CEE), net ecosystem productivity (NEP), and net soil carbon budget (NSCB), to assess and analyze carbon sequestration and emissions in agricultural systems. However, these three evaluation frameworks are not without certain drawbacks. The CEE evaluation system often leads to an underestimation of the soil carbon sequestration effect. The NSCB evaluation system, demarcated by the soil system, fails to account for the carbon sequestration of above-ground plants [22]. As for the NEP evaluation system, it neglects the assessment of carbon losses resulting from methane emissions within greenhouse gases and CO2 emissions from root respiration, thus being unable to clearly define the carbon sequestration level of the ecosystem [23]. Net ecosystem carbon balance (NECB), serving as a more precise evaluation system for the status of ecosystem carbon sources and sinks, has been extensively utilized by researchers in recent years [24,25,26]. Building upon the NECB evaluation system, this research takes into account the carbon emissions from farmland materials and introduces a Net Carbon Balance (NCF) evaluation system tailored specifically for the farmland ecosystem. This NCF system enables a more comprehensive and intuitive representation of the seasonal or inter-annual variations in the carbon budget within the agroecosystem.
A field experiment was carried out to assess the effects of diverse tillage practices on soil heterotrophic respiration-associated CO2 and CH4 emissions. Additionally, this experiment aimed to analyze the NPP of crops, NEP, NECB, and the NCF under various tillage measures. The study also focused on uncovering the change patterns of the carbon balance within the cropland system, with the objective of identifying tillage practices that could reduce greenhouse gas emissions from farmland, enhance the carbon sequestration capacity in farmland, mitigate the decline in soil fertility, and ultimately provide an effective farmland management strategy for attaining the goals of black soil protection and carbon peak.

2. Materials and Methods

2.1. Description of the Study Area

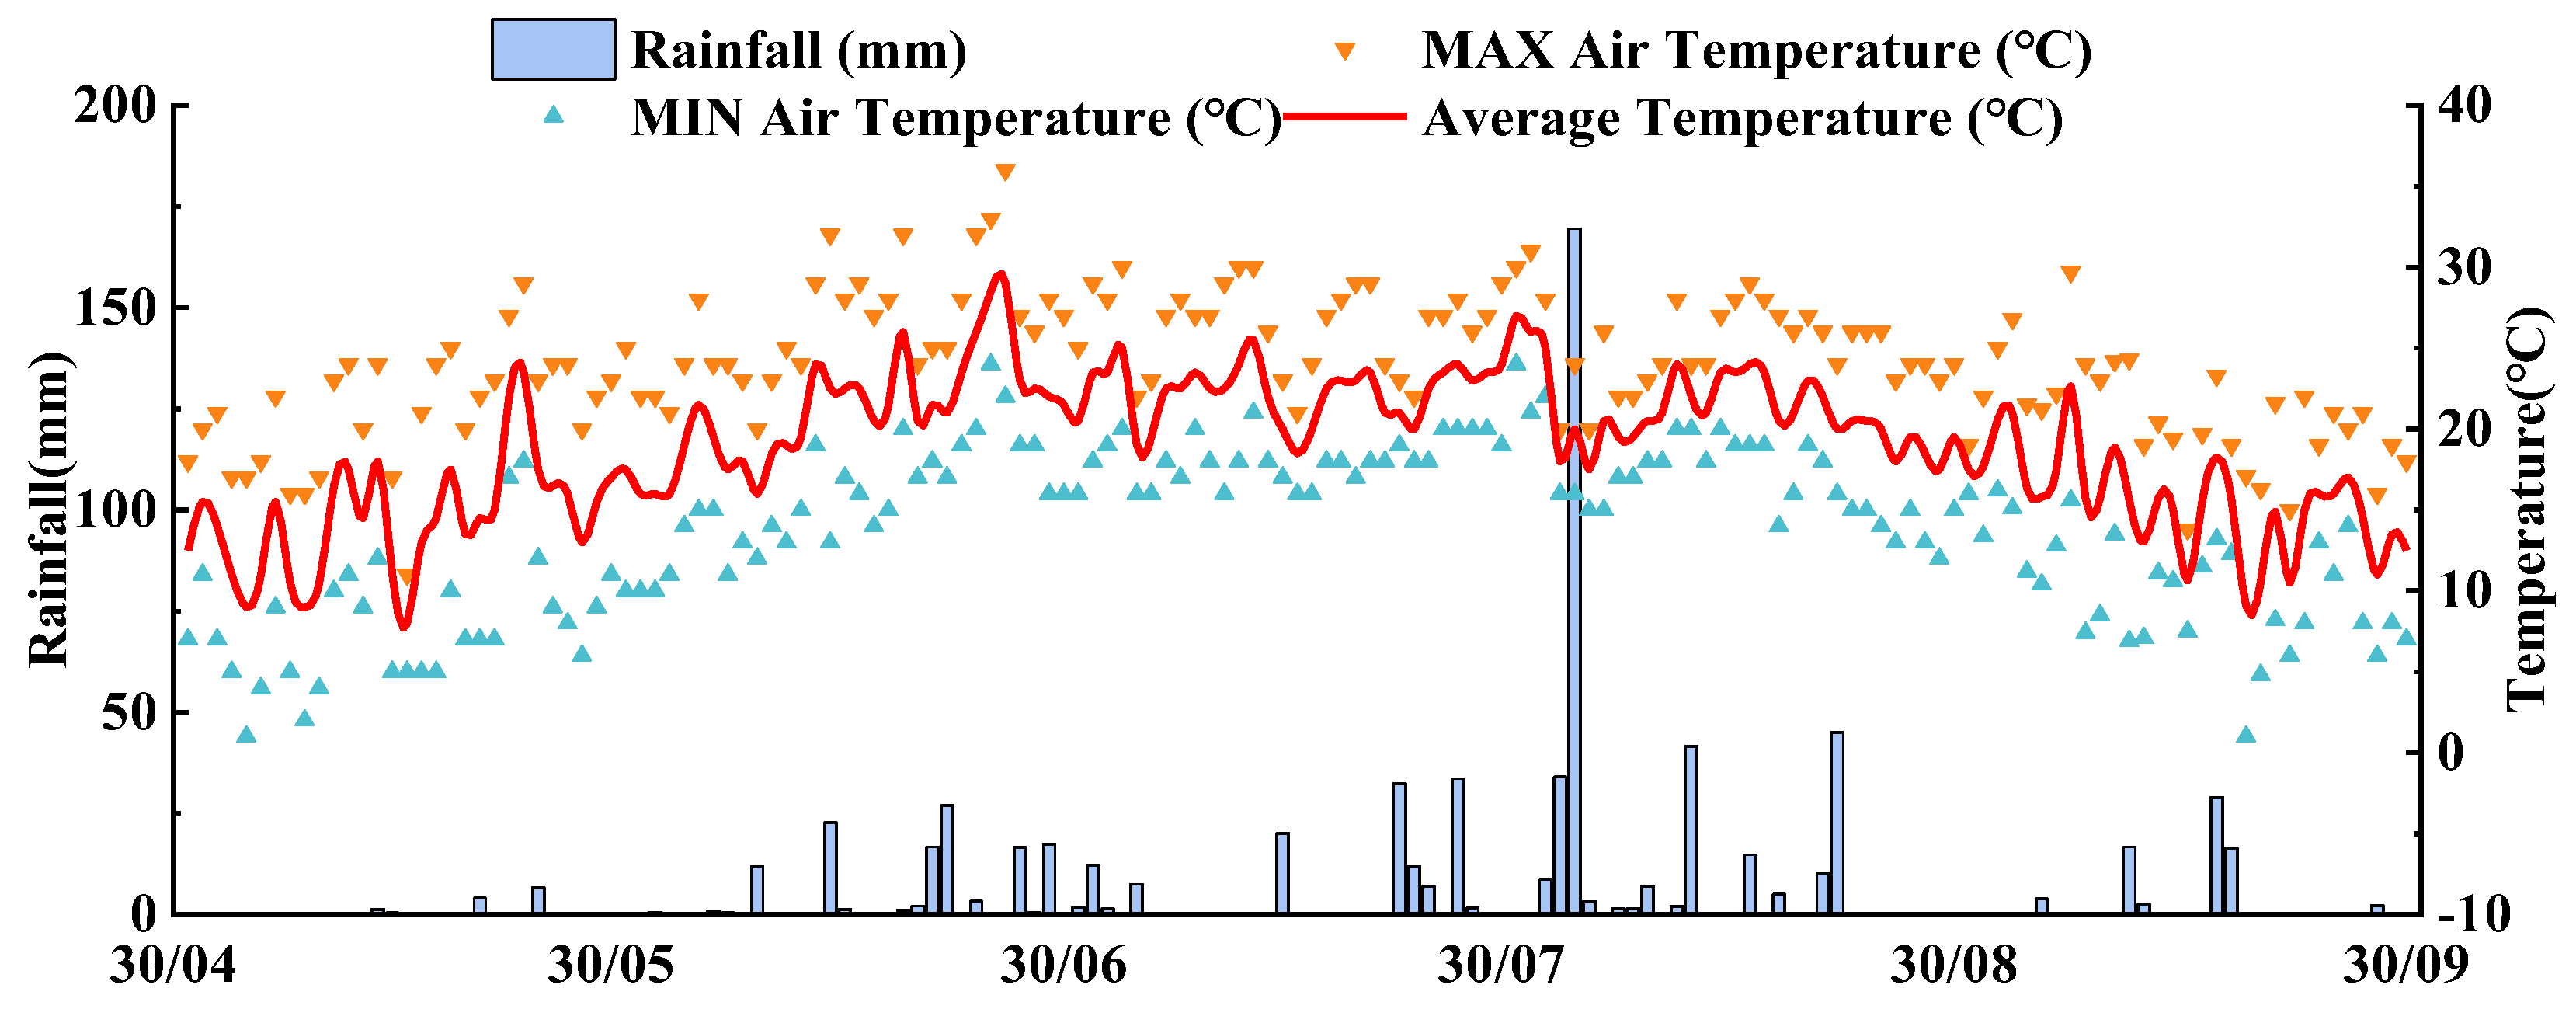
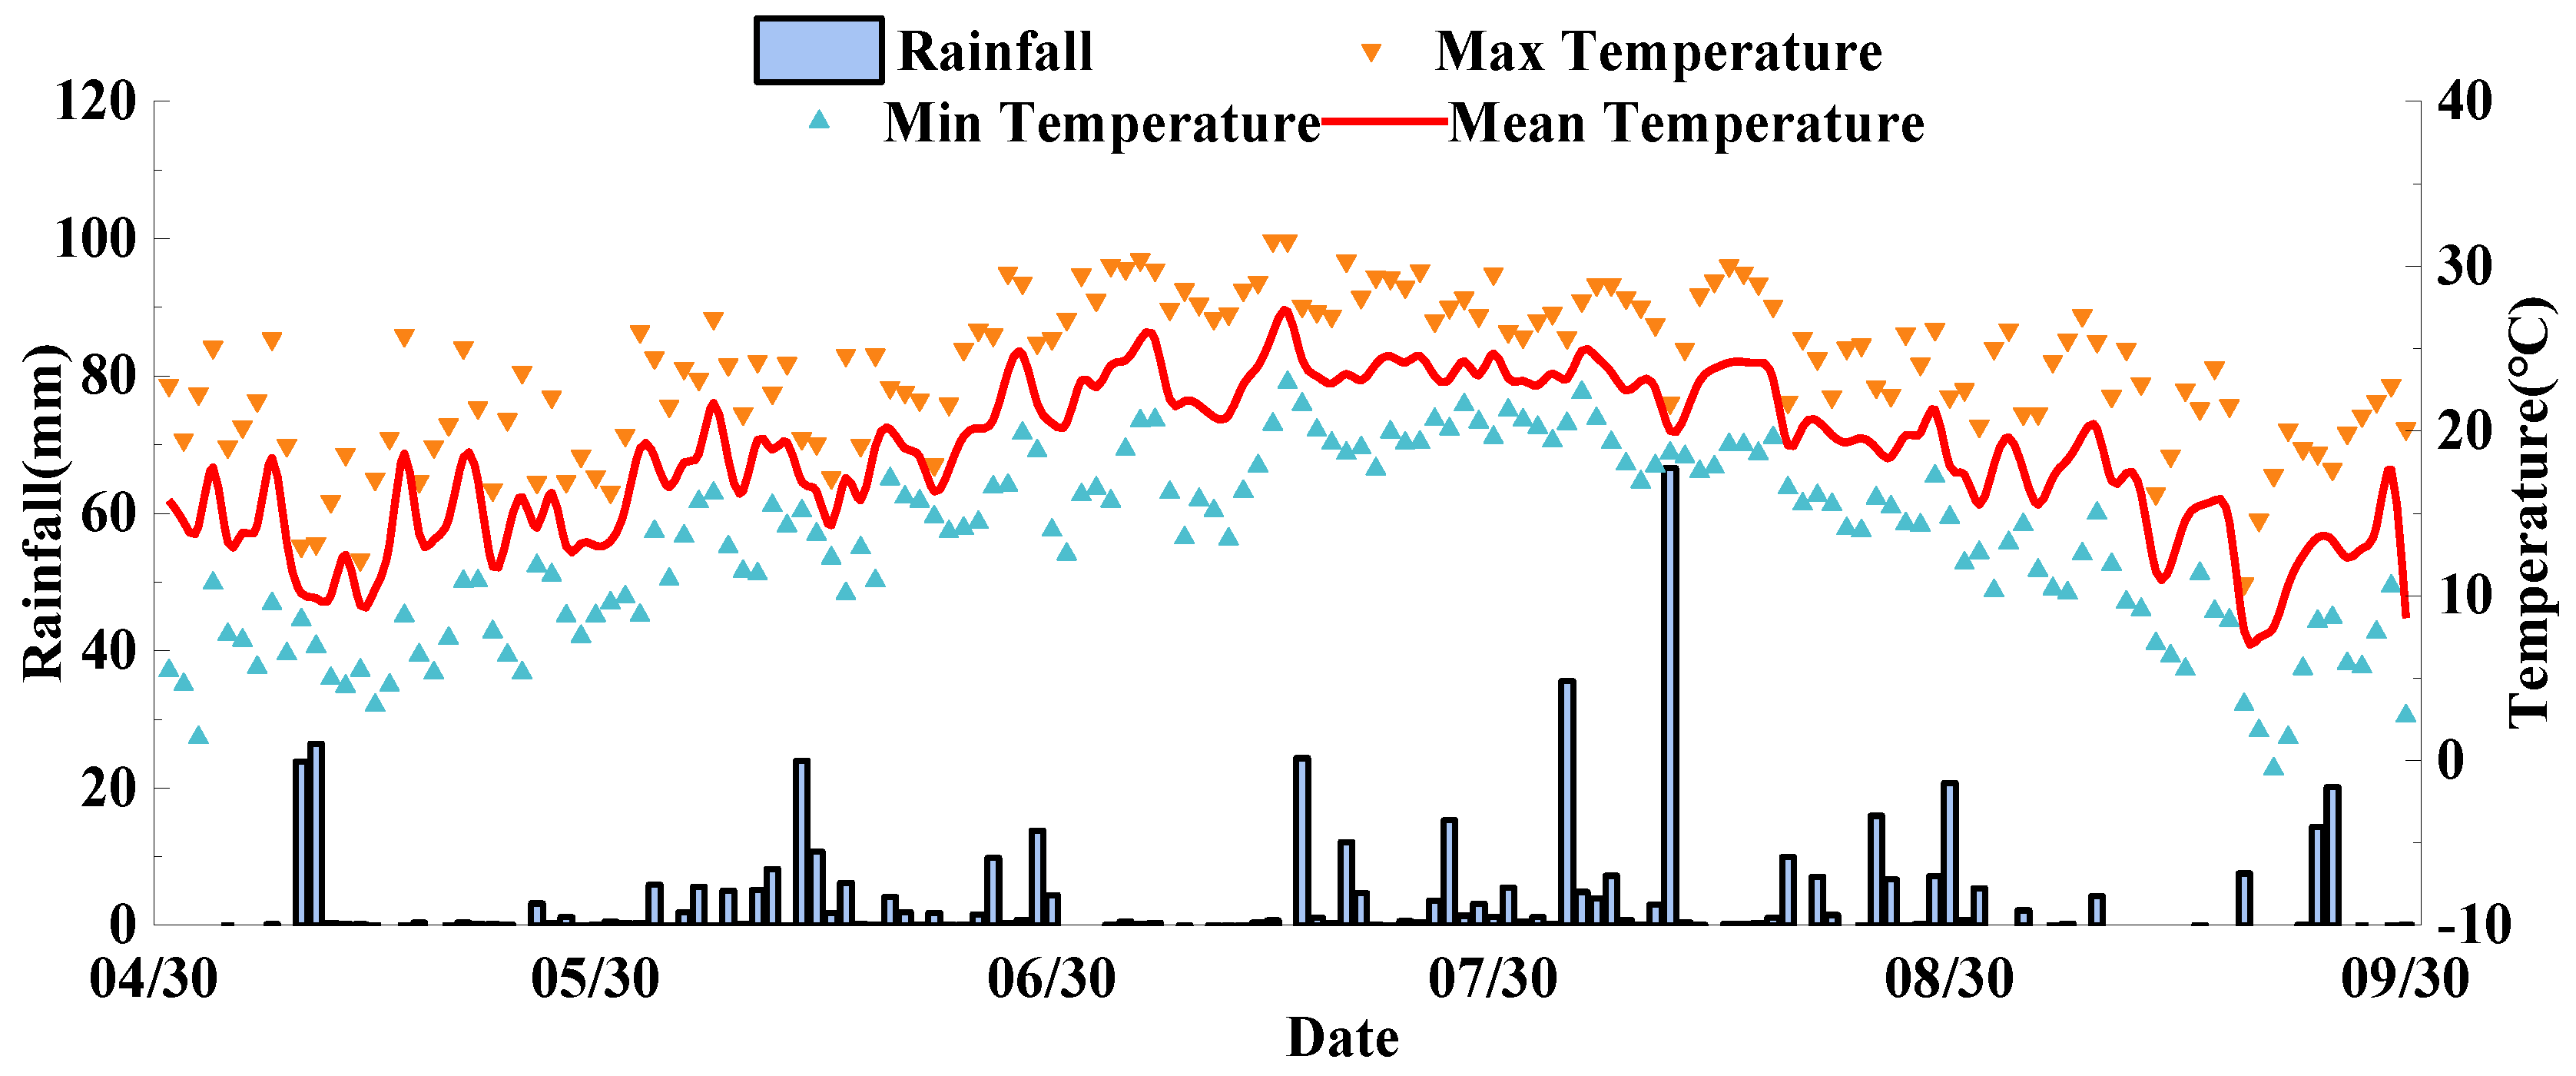
The study area is situated in Guangrong Village, Hailun City, Heilongjiang Province, China (47°22′38″ N, 126°51′4″ E). The main cultivated land type in this area is sloping farmland with a plow layer thickness of 30 cm. The soil type is Phaeozems. The main planted crops are soybeans and maize. The annual average temperature in the experimental area ranges from 4 °C to 5 °C, and the annual precipitation is 400–650 mm. The variations in precipitation and temperature during the experimental period of each year are presented in Figure 1, Figure 2 and Figure 3. The basic properties of the tested soil in the test area are shown in Table 1.

2.2. Plant Material

In this experimental area, a maize–soybean–maize system is employed for the experiment. Maize was chosen as the experimental crop in 2022 and 2024, while soybean was selected as the experimental crop in 2023. The selection of crop varieties and fertilization standards are presented in Table 2.

2.3. Experimental Design and Regimes

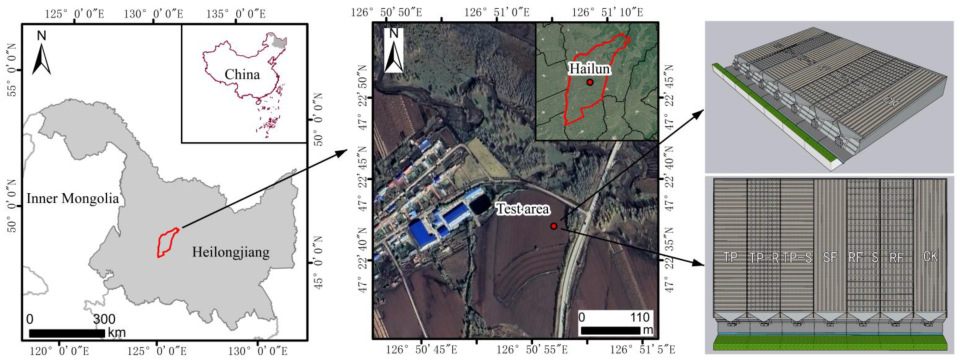
With consistent agronomic measures ensured, the tillage practices in this experiment were configured as presented in Table 3. The experiment was carried out using standard runoff plots, each measuring 5 × 20 m. There were a total of seven regimes, and each regime was replicated three times. The slope was 5°. The geographic position and spatial arrangement of the experimental site are depicted in Figure 4. LSB-SL1 Precision Digital Soil-Water Loss Monitoring System (Panjin, China) was utilized for the collection of Overland flow and Silt. In the span of the three-year experimental endeavor, all above-ground crop straws were removed from the fields.

2.4. Collection and Determination of CO2 Emission and CH4 Emission

The emissions of carbon dioxide and methane were measured using the “static chamber-gas chromatography method”. The static box sampling system should be covered with a shading cloth to avoid sunlight exposure. During the measurement, the surface to be measured is covered with a box, and the gas in the box (0 min, 10 min, 20 min, 30 min) is extracted every 10 m for concentration measurement. The sampling equipment is divided into a sampling box and a ground box, both of which are cylinders. Gas was collected every 7 days from the second day after crop planting, and the gas collection time was 10:00–12:00. In case of rainfall, the time was delayed for sample collection. After the gas within the sampling system was uniformly distributed using a mini-fan, gas samples were extracted with a syringe at 0, 10, 20, and 30 min and then injected into sample bags. After the samples were brought back to the laboratory, the detection and analysis of carbon dioxide and methane were conducted using a gas chromatograph (Shimadzu GC-2010 Plus, Kyoto, Japan). The measurement of soil heterotrophic respiration CO2 emission should be carried out separately in an empty chamber at the bare land position in the test area, and the living plants in the chamber should be cleaned regularly. The emission flux calculation are as follows:
F = ρ × h × d c / d t × 273 / ( 273 + T )
where F is the emission fluxes of CO2 and CH4 (mg·m−2·h−1); ρ is the density of CO2 and CH4 in standard state (CO2 is 1.997 kg·m−3, CH4 is 0.717 kg·m−3); h is the effective height in static box (m3); dc/dt is the gas concentration difference (cm3·m−3·h−1); T is the average air temperature in the static chamber during sampling (°C).
The total amount of discharge are as follows:
T = i = 1 n F i + 1 + F i / 2 × ( D i + 1 D i ) × 24 / 100
where T is the total amount (kg·hm−2); Fi is the emission fluxes of CO2 and CH4 at the (i)th sampling time (mg·m−2·h−1); Fi+1 is the emission fluxes of CO2 and CH4 at the (i + 1)th sampling time (mg·m−2·h−1); Di is the (i)th sampling time (d); Di+1 is the (i + 1)th sampling time (d).

2.5. Dry Matter Mass, Carbon Content, Runoff Carbon Loss and Net Primary Productivity (NPP) of Each Organ After Harvest Were Measured

After the collection of surface runoff and sediment samples, the determination and calculation of runoff carbon loss were carried out using a total organic carbon analyzer (Elementar vario TOC, Darmstadt, Germany). At the crop maturity stage, ten representative plants were randomly sampled from each plot. The organs of the crop were separated and washed with deionized water, and then put into the drying oven at 85 °C and blasted for 96 h to a constant quality, and weighed. Upon drying, the samples were pulverized with a ball mill and subsequently sieved through a 100-mesh sieve. Following the mixing process, the carbon content was quantified using a total organic carbon analyzer (Elementar vario TOC, Darmstadt, Germany), and the carbon sequestration capacity of each crop organ was computed. The NPP of maize was calculated according to 5.67 plants per square meter, and the NPP of soybean was calculated according to 28 plants per square meter [27]. The NPP (kg·ha−1) is as follows:
N P P = K × U C + L C + i n m i ω i
where K is the number of crops per hectare; U−C is the carbon input of root exudates, the carbon input of crop root exudates is equivalent to the total carbon content of roots during harvest [28]; L−C is the carbon input from litterfall, it was measured by harvesting the litterfall from a 1 m2 plot using nylon mesh bags during the crop maturity period; mi is the dry matter mass of various crop organs (g); ωi is the carbon content in different organs of crops (%).

2.6. Net Ecosystem Productivity (NEP), Net Ecosystem Carbon Balance (NECB) and Net Ecosystem Carbon Balance (NCF) Were Calculated

The NEP (kg·ha−1) is as follows:
N E P = N P P R h C
where Rh−C is the soil heterotrophic respiration carbon emissions (kg·ha−1).
The carbon balance of farmland ecosystem (NECB) are as follows [29]:
N E C B = N E P H C F C V O C C D C C H 4 C E C + I C
where D−C is the carbon loss resulting from leaching. Given its low content, it is generally excluded from the calculation (kg·ha−1) [30]; F−C is the carbon loss caused by fire is negligible (kg·ha−1); VOC−C is the loss of volatile organic carbon, due to its low content, is negligible (kg·ha−1); I−C represents exogenous added organic carbon. In this experiment, as there was no exogenous organic carbon addition, it can thus be neglected (kg·ha−1).
The simplified calculation of net carbon balance (NECB) of farmland ecosystem are as follows:
N E C B = N E P H C C H 4 C E C
where H−C is the amount of carbon converted from biomass taken away by crop harvest (kg·ha−1); CH4−C is the carbon lost from the CH4 emissions (kg·ha−1); E−C is the carbon loss caused by soil erosion (kg·ha−1).
Since the contribution of agronomic measures in the greenhouse effect cannot be ignored, the impact of carbon emissions caused by agricultural inputs should be considered in the analysis of carbon balance. Based on the existing net carbon balance formula (NECB), the net carbon balance (NCF) of agricultural system is calculated by Equation (7). A positive value of NCF indicates that the cropland system functions as a carbon sink, while a negative value implies that the cropland system acts as a carbon source [31]. The net carbon balance (NCF) are as follows:
N C F = N E C B C A P
where CAP is the carbon emissions of farmland materials (kg·ha−1).
The carbon emissions of farmland materials (CAP) are as follows:
C A P = i = 1 n Q A P i × m i
where QAPi is the consumption of certain agricultural materials (kg·ha−1), mi is the carbon emission parameters of a certain agricultural input material (kgC·kg−1).
The farmland input carbon emission coefficient is shown in Table 4:

2.7. Data Regime and Statistical Analysis

In the present experiment, data processing was carried out using Excel. For mapping purposes, Origin Pro 2021 software was employed. Statistical analysis was conducted with SPSS 27.0. To evaluate the significance of disparities across multiple sample groups, Duncan’s multiple range test was employed. The threshold for statistical significance was set at p = 0.05.

3. Results

3.1. Soil Heterotrophic Respiration CO2 Emission and CH4 Emission Under Different Tillage Measures

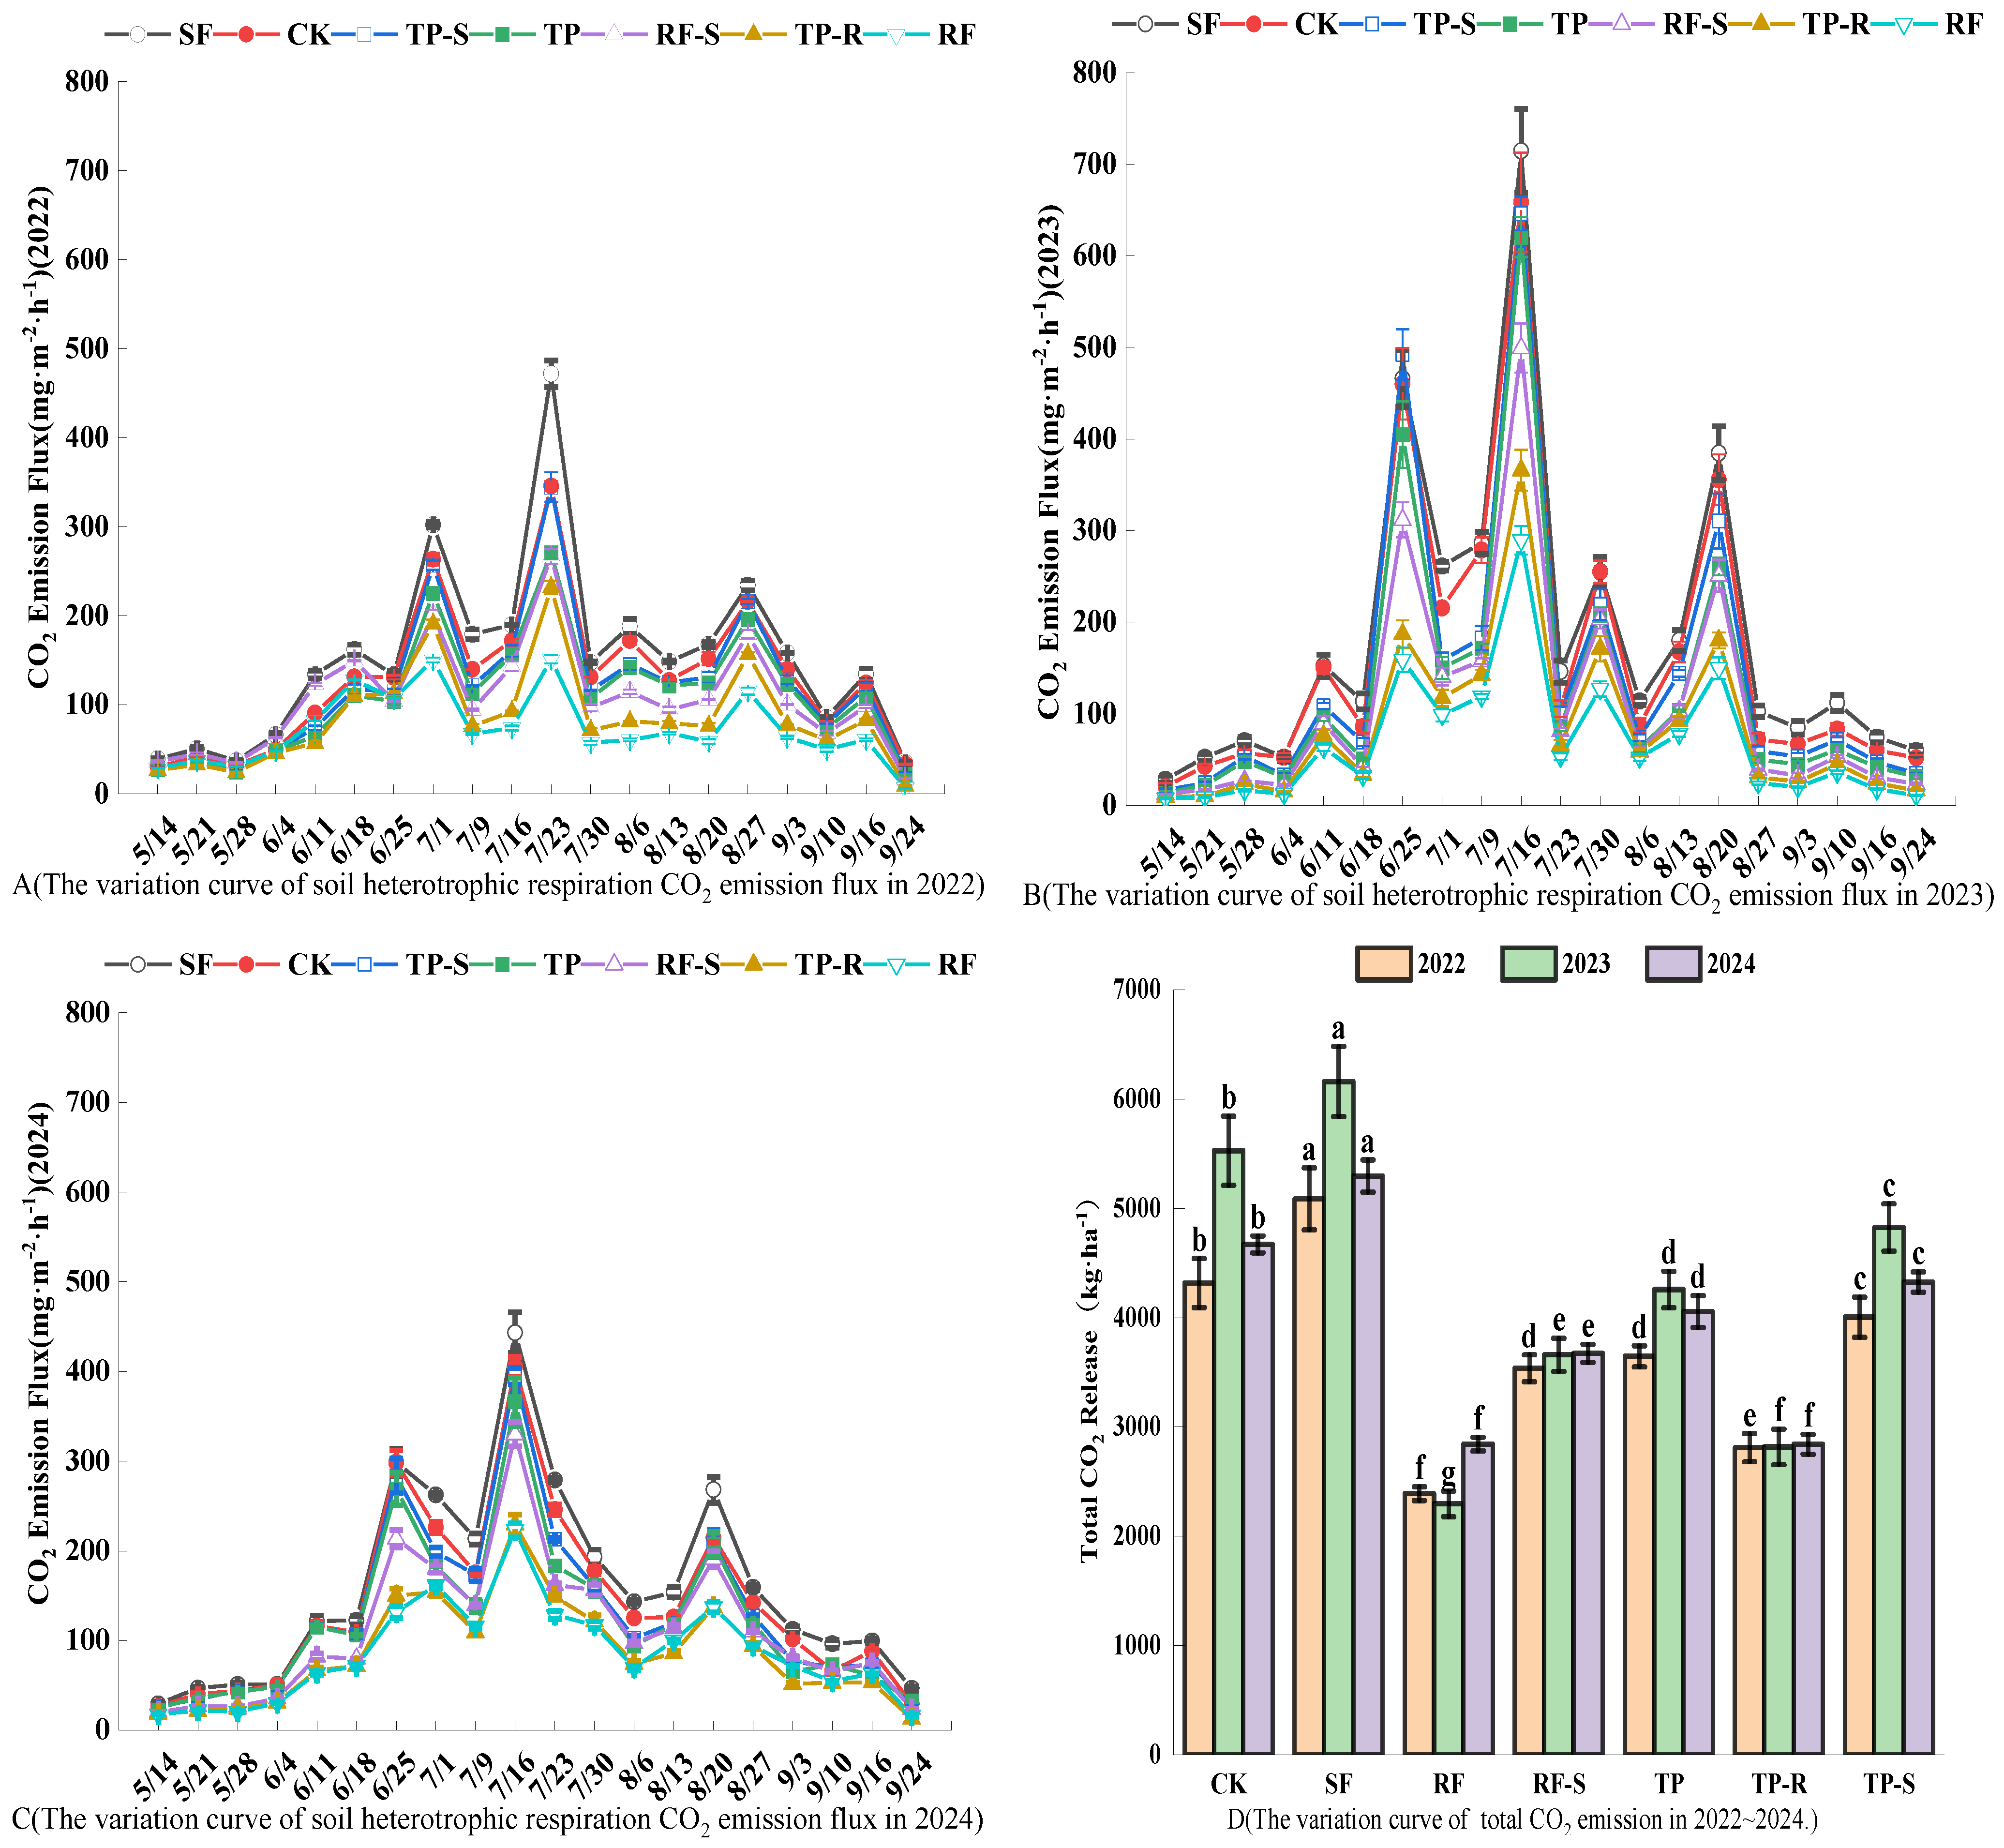
The dynamic changes in the CO2 emission flux of soil heterotrophic respiration under different tillage practices are presented in Figure 5. The findings indicated that, across each year, the CO2 emission flux of every regime exhibited a similar variation trend during the entire growth period. It generally shows a trend of first increasing and then decreasing in each year. Commencing from the seedling stage, as a result of the rise in soil temperature and the impact of fertilizer application, the CO2 emission flux of soil respiration commenced to increase, reaching its peak value during the maize-filling stage and the soybean-podding stage. Among the three years, the peak values of the CO2 emission flux in the SF regime were the highest, registering at 471.72 mg·m−2·h−1, 714.65 mg·m−2·h−1, and 443.30 mg·m−2·h−1, respectively. In contrast, the peak values of the CO2 emission flux in the RF regime were the lowest in the three-year period, amounting to 151.24 mg·m−2·h−1, 289.61 mg·m−2·h−1, and 223.06 mg·m−2·h−1, respectively.
Calculated according to Formula (2), the total amount of CO2 emissions from soil heterotrophic respiration for each regime in each year is presented in Figure 5. Sub-soiling tillage improves soil aeration and permeability, thereby enhancing the respiration rate of soil microorganisms. As a result, in each year, the total amount of CO2 emissions from soil heterotrophic respiration in the sub-soiling tillage regimes is higher than that in the non-sub-soiling tillage regimes. On the other hand, the ridge-tillage regimes have a better effect on rainwater interception and higher soil water storage capacity. This reduces soil aeration and permeability, decreases the oxygen content in the soil, and suppresses microbial activity. Consequently, these regimes exhibit a lower total amount of CO2 emissions. In 2022, the total soil heterotrophic respiration CO2 emissions of each regime followed a descending order: SF > CK > TP-S > TP > RF-S > TP-R > RF. In comparison with the CK regime, the emissions in each of the remaining regimes exhibited decreases of −17.86%, 7.24%, 15.53%, 18.07%, 34.93%, and 44.65%, respectively (p < 0.05). In 2023, the order was also SF > CK > TP-S > TP > RF-S > TP-R > RF, and the decreases compared with the CK regime were 11.46%, 12.72%, 22.99%, 33.80%, 49.03%, and 58.47%, respectively (p < 0.05). In 2024, the order was SF > CK > TP-S > TP > RF-S > RF > TP-R, and the decreases relative to the CK regime were 13.42%, 7.37%, 13.16%, 21.34%, 39.11%, and 39.16%, respectively (p < 0.05).
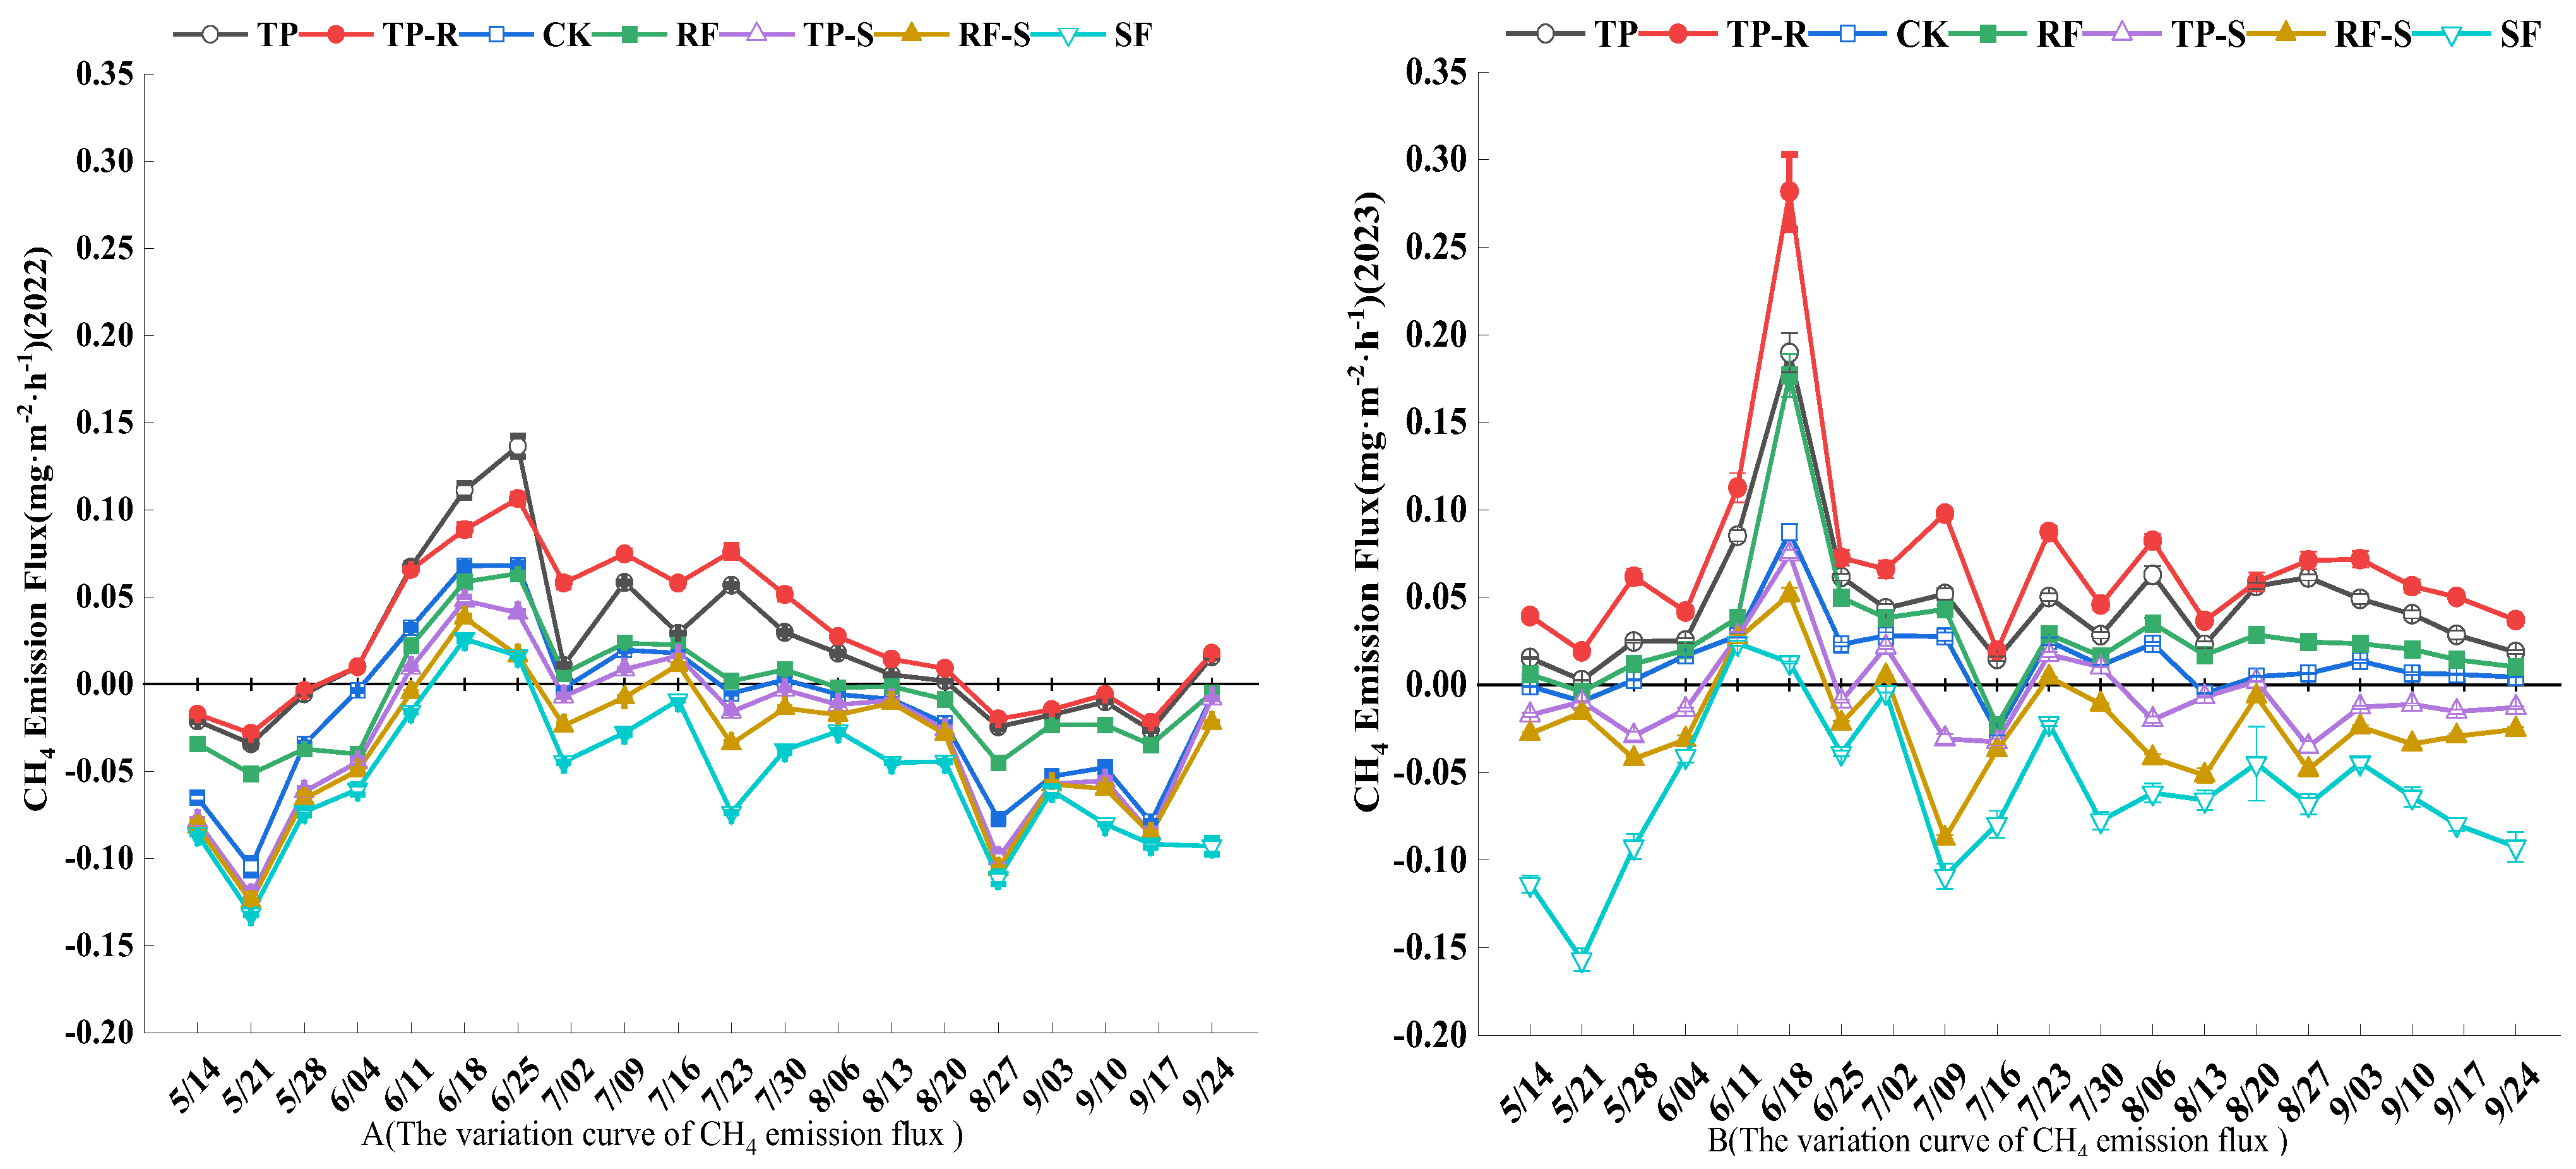
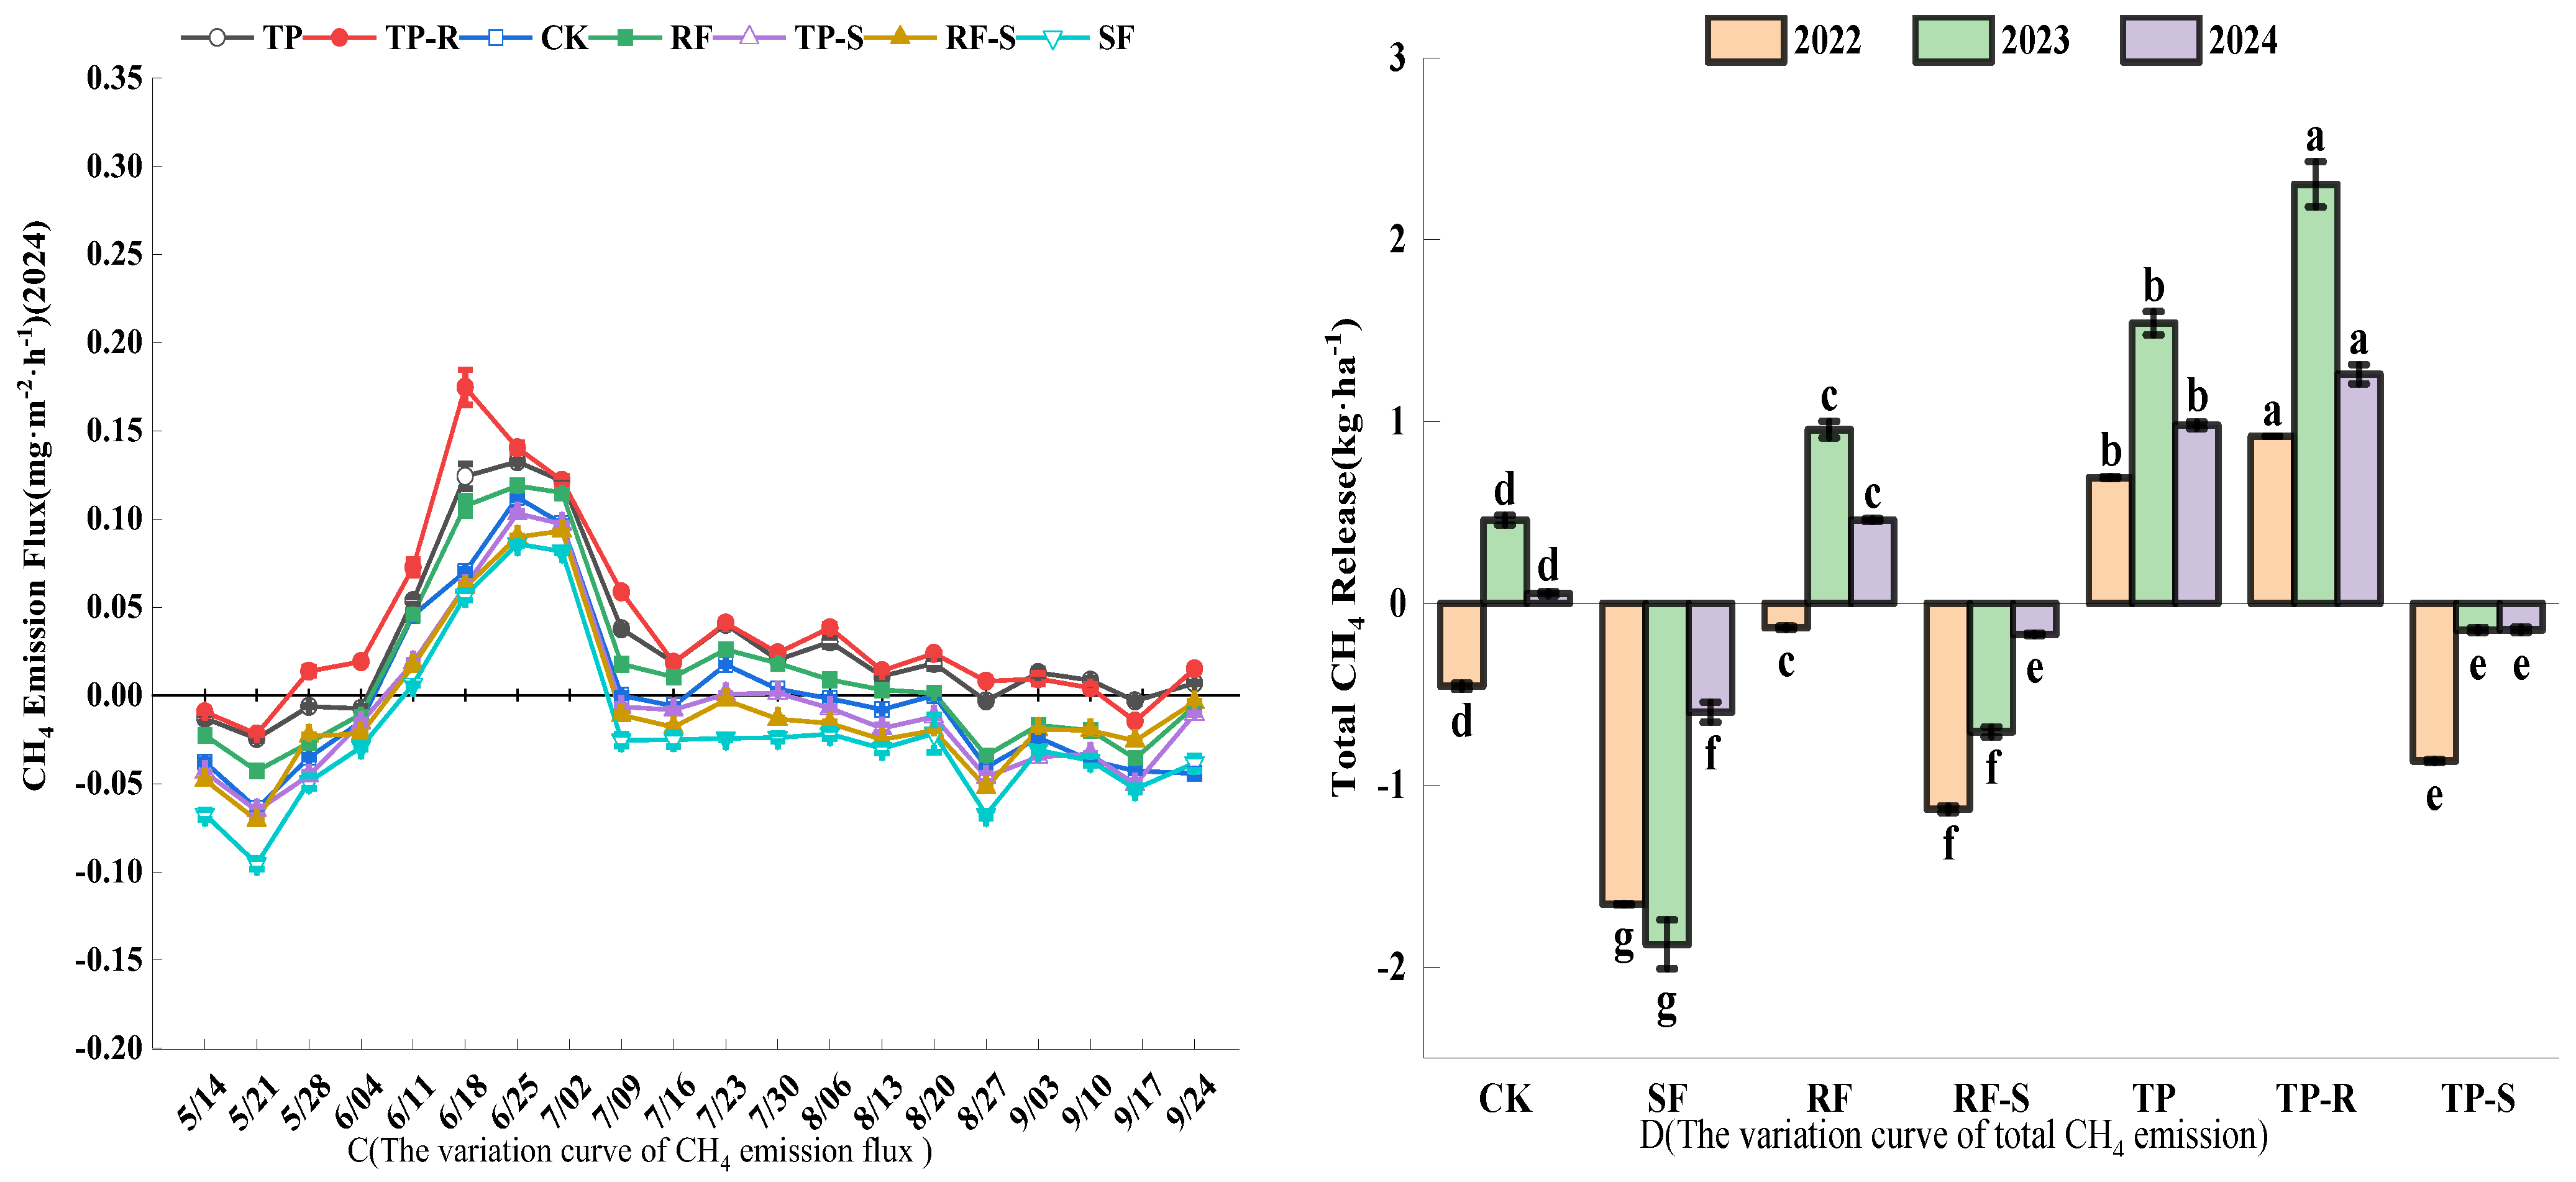
The CH4 emission fluxes of soil during the entire growth period in each year under different tillage practices are presented in Figure 6. The experimental findings reveal that, for each regime across different years, the CH4 emission fluxes exhibit a similar variation trend during the entire growth phase. The flux values alternate between positive and negative throughout the growth period, generally showing an overall pattern of increasing initially and then decreasing, with peaks attained during the maize jointing stage and the soybean branching stage. In the SF regime, the peak values of CH4 emission fluxes are the lowest over the three-year period. In 2022, the TP regime has the highest peak value of CH4 emission flux, reaching 0.14 mg·m−2·h−1. In the TP-R regime, the peak values of CH4 emission fluxes in 2023 and 2024 are the highest, amounting to 0.28 mg·m−2·h−1 and 0.18 mg·m−2·h−1, respectively.
Calculated in accordance with Formula (2), the total amounts of soil CH4 emissions for each regime in each year are presented in Figure 6. Given that soil CH4 emissions primarily stem from methanogens, which are anaerobic bacteria, an increase in rainfall causes a rise in soil moisture content. The majority of soil pores are filled with water, a condition that impedes gas exchange with the atmosphere, reduces the oxygen content within the soil, and promotes the activity of methanogens. Consequently, the total amounts of soil CH4 emissions in the three years, in descending order, are 2023 > 2024 > 2022, demonstrating a positive correlation with the annual rainfall. In the three sub-soiling tillage regimes, sub-soiling improves soil aeration and permeability, increasing the oxygen content. Consequently, the activity of soil methanogens is severely inhibited, and thus, the total amounts of CH4 emissions in the three-year experiment are all negative, indicating a weak carbon sink. The TP-R and TP regimes, due to their good water-retention capacity, maintain a relatively high soil moisture content and a low oxygen content. As a consequence, the total amounts of CH4 emissions in the three-year experiment are all positive, presenting a certain carbon source.

3.2. Dry Matter Quality, Carbon Content, Net Primary Productivity (NPP) and Runoff Carbon Loss (E-C) of Different Organs After Crop Harvest Under Different Tillage Measures Were Studied

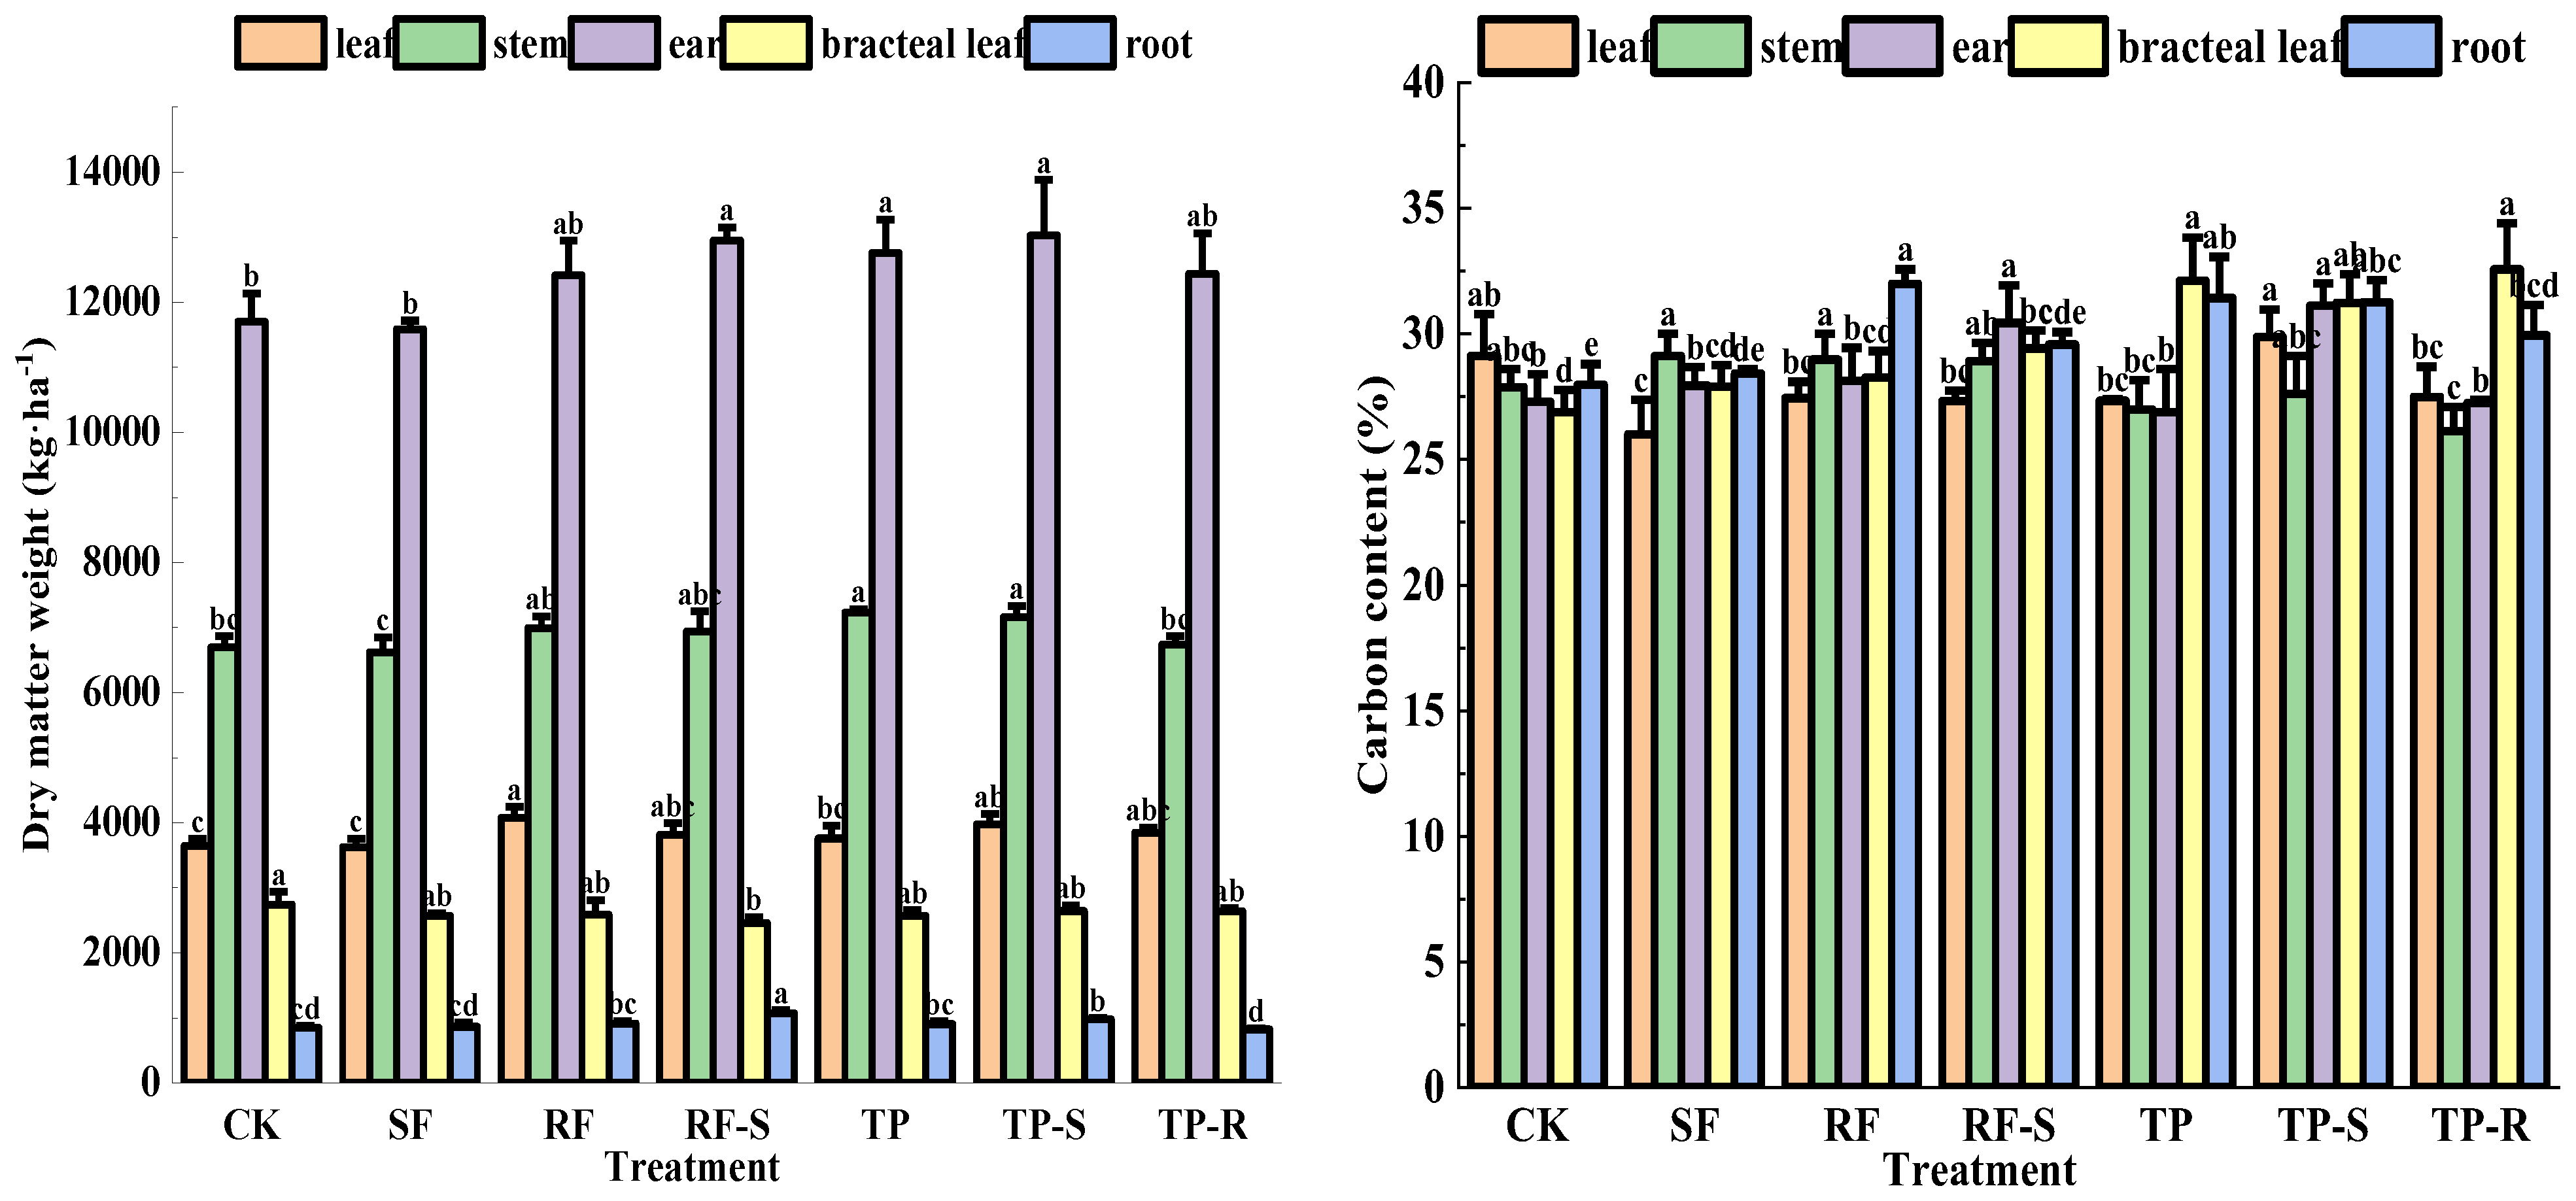
Figure 7 illustrates the dry matter mass of various organs and their carbon contents following crop harvest under different tillage practices in 2022. Experimental results indicate that the dry matter mass of leaves after harvest was the highest in the CK and SF (p < 0.05). Upon harvest, the dry matter mass of stems reached its maximum value in the RF-S and RF regime groups (p < 0.05). Upon harvest, the dry matter mass of bracts reached its maximum value in the TP (p < 0.05). After harvest, the dry matter mass of ears in the TP-S, TP-Rand TP regime groups was markedly greater than that in the RF, SF, and CK regime groups (p < 0.05). However, when compared to the TP regime, no significant difference was observed (p > 0.05). After harvest, the dry matter mass of roots in the TP-S and TP regime groups was substantially greater than that in the remaining regime groups (p < 0.05). In terms of the carbon content in leaves, following harvest, no significant difference was detected between the TP-S regime and the CK regime (p > 0.05). However, the carbon content in leaves of the TP-S regime was markedly higher than that in the other regimes (p < 0.05). After harvest, the carbon content of stems reached its maximum in the SF regime (p < 0.05). In the case of bracts, the cross-slope tillage regime exhibited the highest carbon content, presenting a significant disparity compared to the other regimes (p < 0.05).
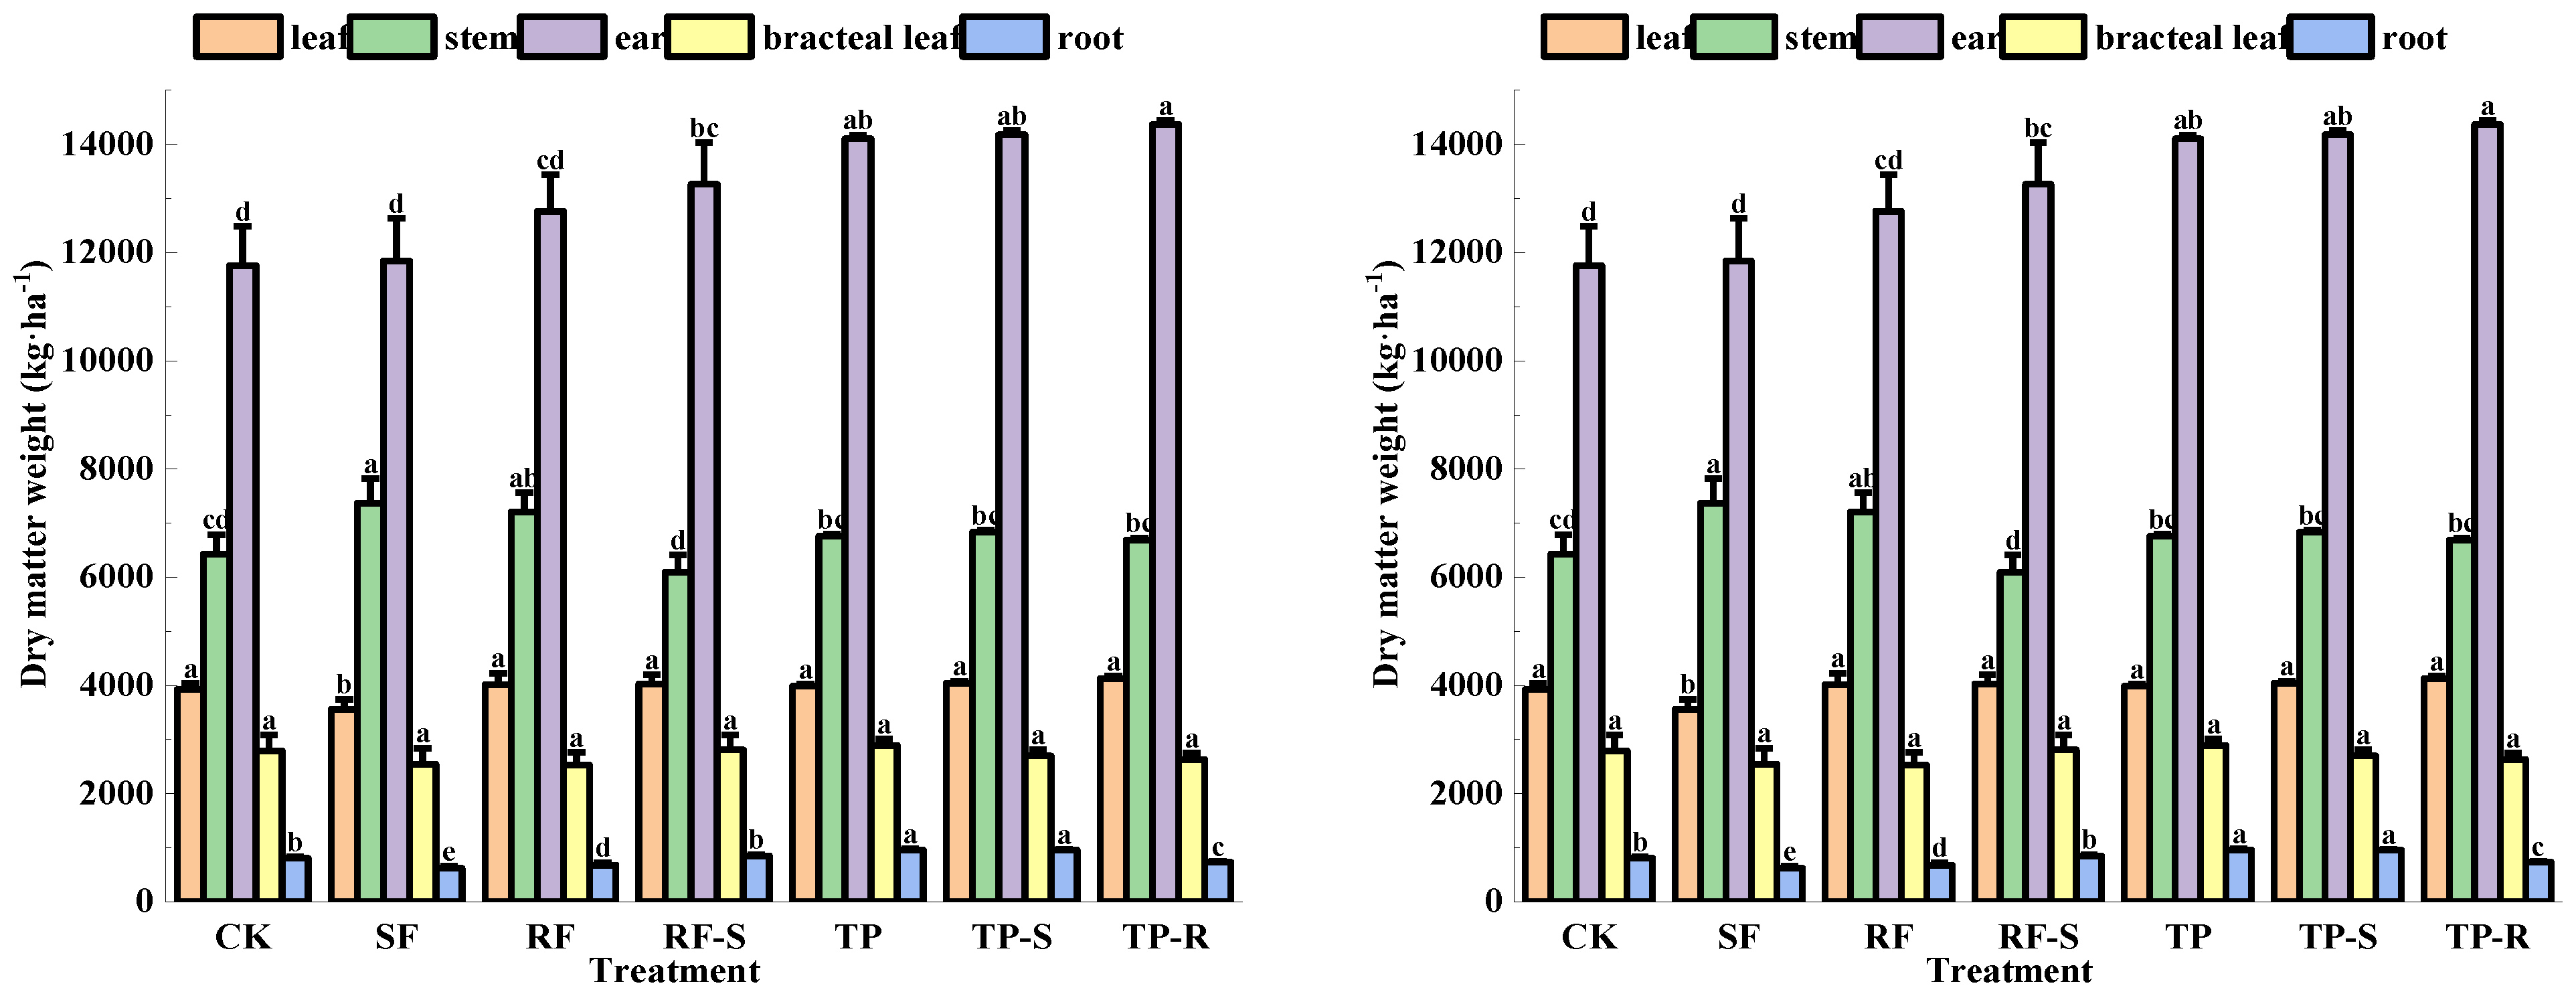
Figure 8 illustrates the dry matter mass of various organs and their carbon contents following crop harvest under different tillage practices in 2023. The experimental findings indicated that, following harvest, the leaf dry matter mass in the TP-S, RF-S, and TP regimes was at its maximum, displaying a significant divergence from that in the other regimes (p < 0.05). In contrast, no significant variation was detected in the post-harvest stem dry matter masses across all regimes (p > 0.05). The shell dry matter mass was highest in the TP regime, presenting a significant difference as compared to that in the TP-S, RF-S, TP-R, and CK regimes (p < 0.05). Regarding the post-harvest grain dry matter mass, no significant difference was noted between the TP-S and RF-S regimes and the TP and TP-R regimes (p > 0.05), while it was significantly greater than that in the remaining regimes (p < 0.05). After harvest, the root dry matter mass was highest in the TP-S regime, yet it did not differ significantly from that in the RF-S and SF regimes (p > 0.05). The carbon content in the leaves after harvest was lowest in the TP-S and CK regimes (p < 0.05). The carbon content in the stems after harvest reached its peak in the RF regime, showing a significant difference from that in the RF-S regime (p < 0.05). There was no significant difference in the post-harvest shell carbon content among all regimes (p > 0.05). The carbon content of post-harvest grains was maximized in the TP-R regime, demonstrating a significant contrast relative to that in the RF-S and RF regimes (p < 0.05). The carbon contents of post-harvest roots in the TP-S and SF regimes were notably higher than those in the TP regime (p < 0.05), and no significant difference was observed when compared to the other regimes (p > 0.05).
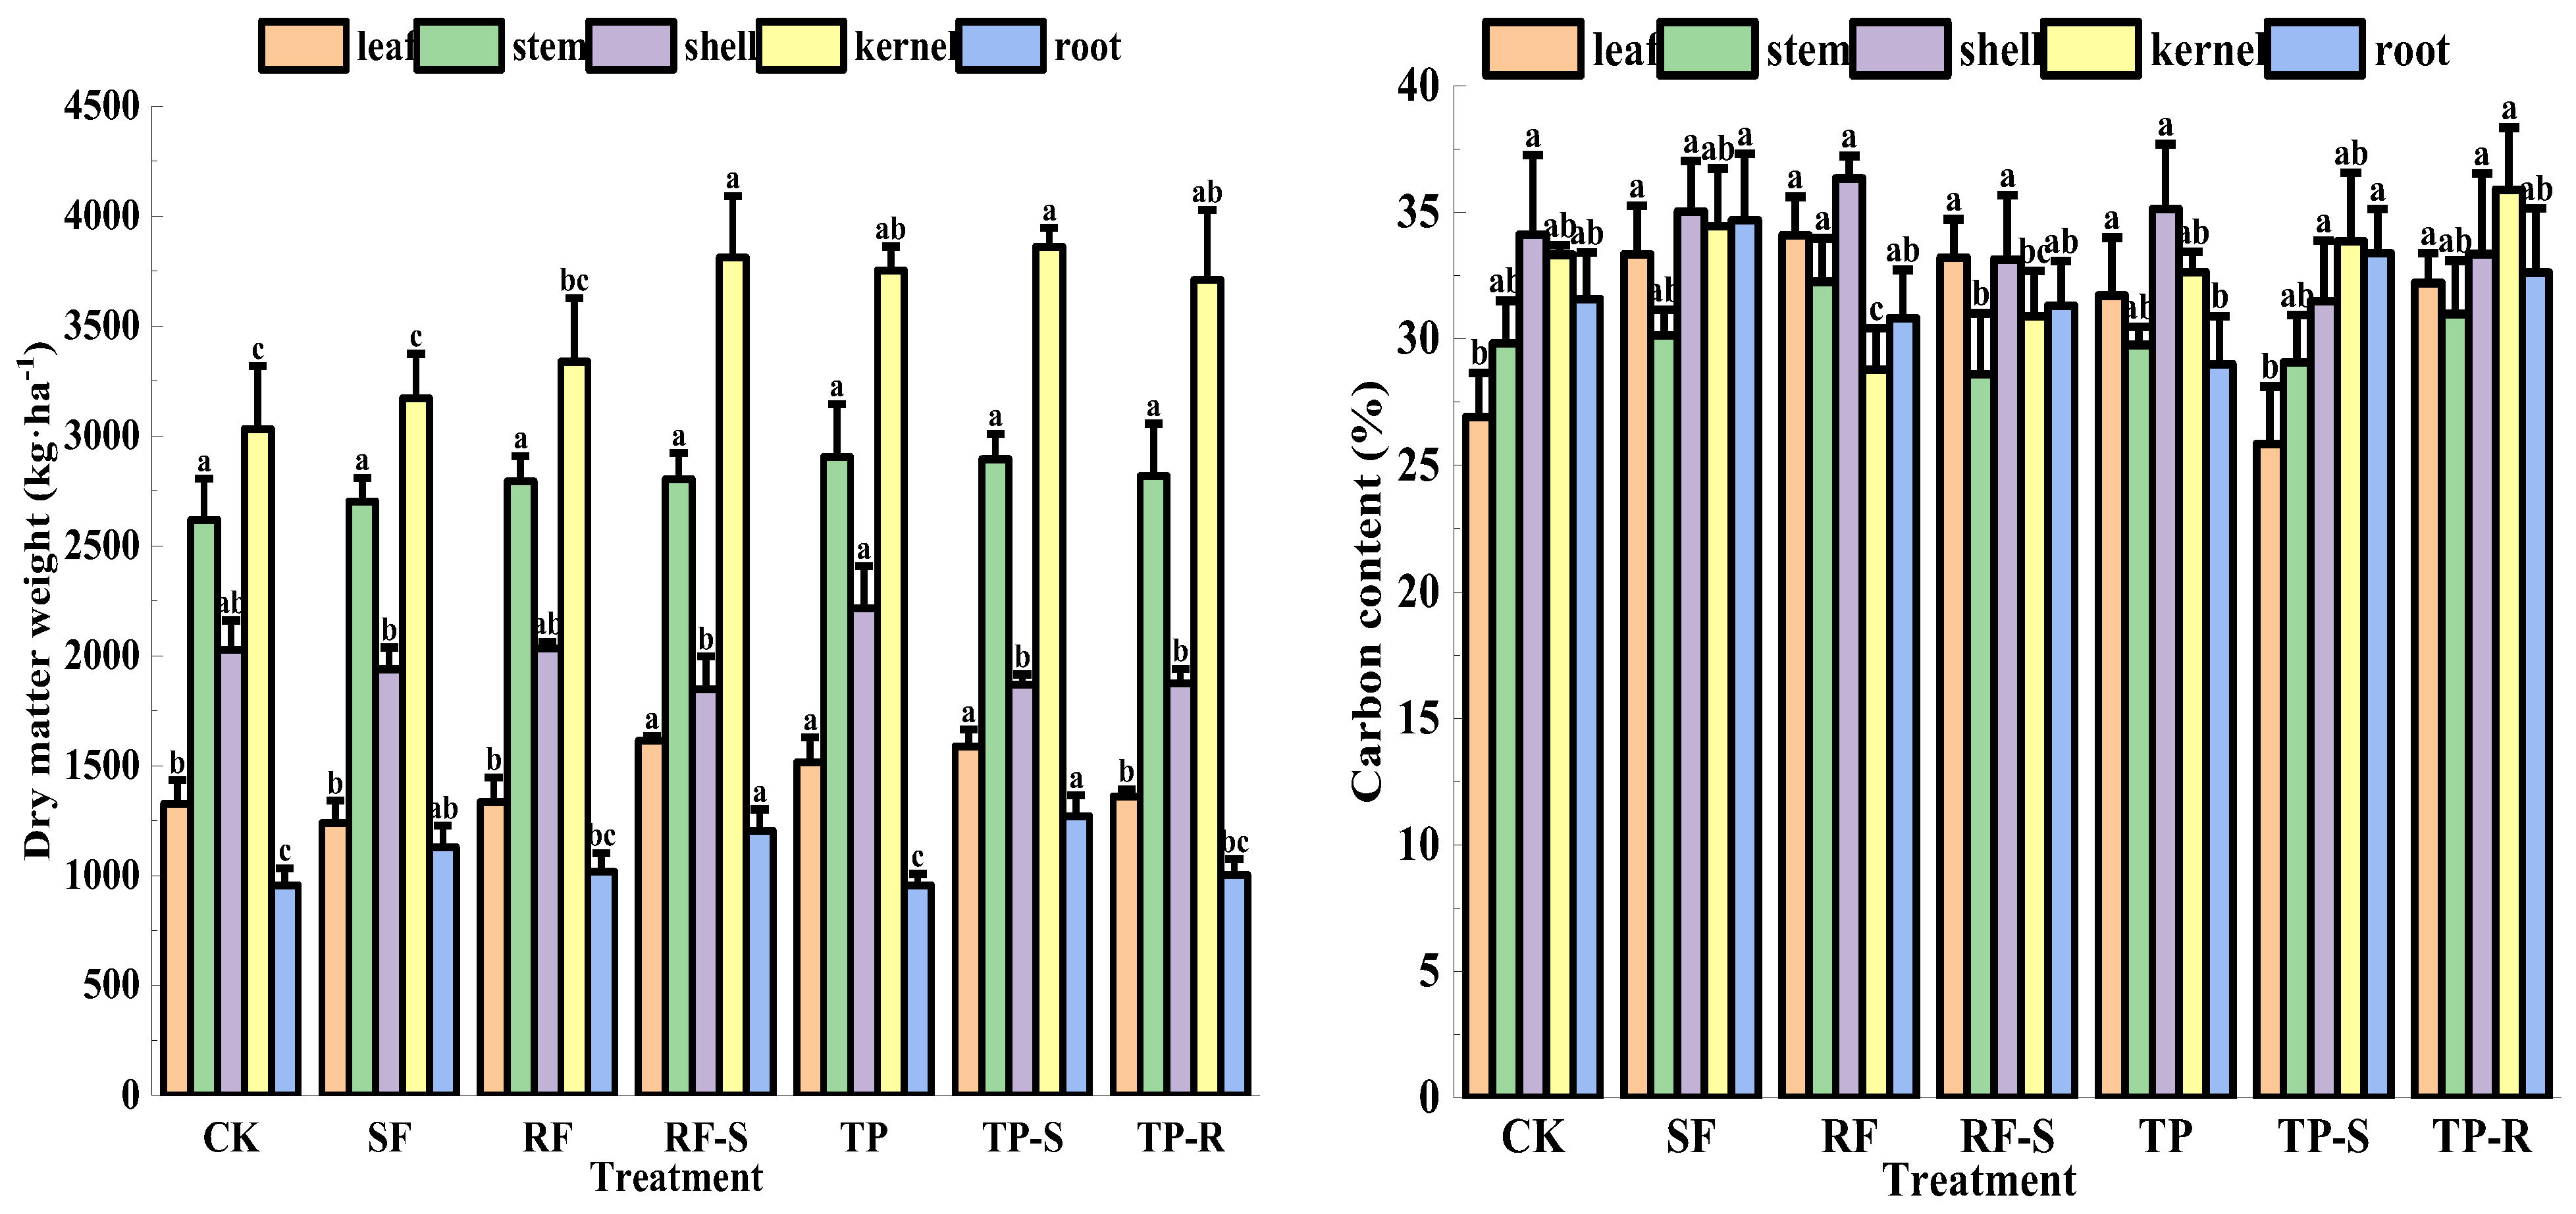
Figure 9 illustrates the dry matter mass of various organs and their carbon contents following crop harvest under different tillage practices in 2024. After harvest, the leaf dry matter mass in the RF regime was at its maximum, showing a significant difference from that in the CK, SF, and TP regimes (p < 0.05). The post-harvest stem dry matter mass was greatest in the TP regime, with a significant divergence from that in the CK, SF, and TP-R regimes (p < 0.05). For ears, the dry matter mass after harvest was maximized in the TP-S regime, presenting a significant disparity relative to that in the SF and CK regimes (p < 0.05). Regarding bracts, the post-harvest dry matter mass was highest in the CK regime, being significantly greater than that in the RF-S regime (p < 0.05) and showing no significant variation from the other regimes (p > 0.05). As for roots, the post-harvest dry matter mass was largest in the RF-S regime, manifesting a significant difference compared to the other regimes (p < 0.05). Upon harvest, the carbon content in the leaves of the TP-S regime attained the maximum value. There was no significant difference between this value and that in the CK regime (p > 0.05), while it was significantly distinct from that in the remaining regimes (p < 0.05). For the post-harvest stems, the carbon content was at its peak in the SF regime, demonstrating a significant divergence when compared to that in the TP and TP-R regimes (p < 0.05). With respect to the post-harvest ears, the carbon content was maximized in the TP-S regime. It displayed no significant variation from that in the RF-S regime (p > 0.05), yet was markedly different from that in the other regimes (p < 0.05). In the case of the post-harvest bracts, the carbon content was highest in the TP-R regime. It manifested no significant difference from that in the TP and TP-S regimes (p > 0.05), while being significantly dissimilar to that in the remaining regimes (p < 0.05). For the post-harvest roots, the carbon content was highest in the RF regime. It showed no significant disparity from that in the TP and TP-R regimes (p > 0.05), but was significantly different from that in the other regimes (p < 0.05).
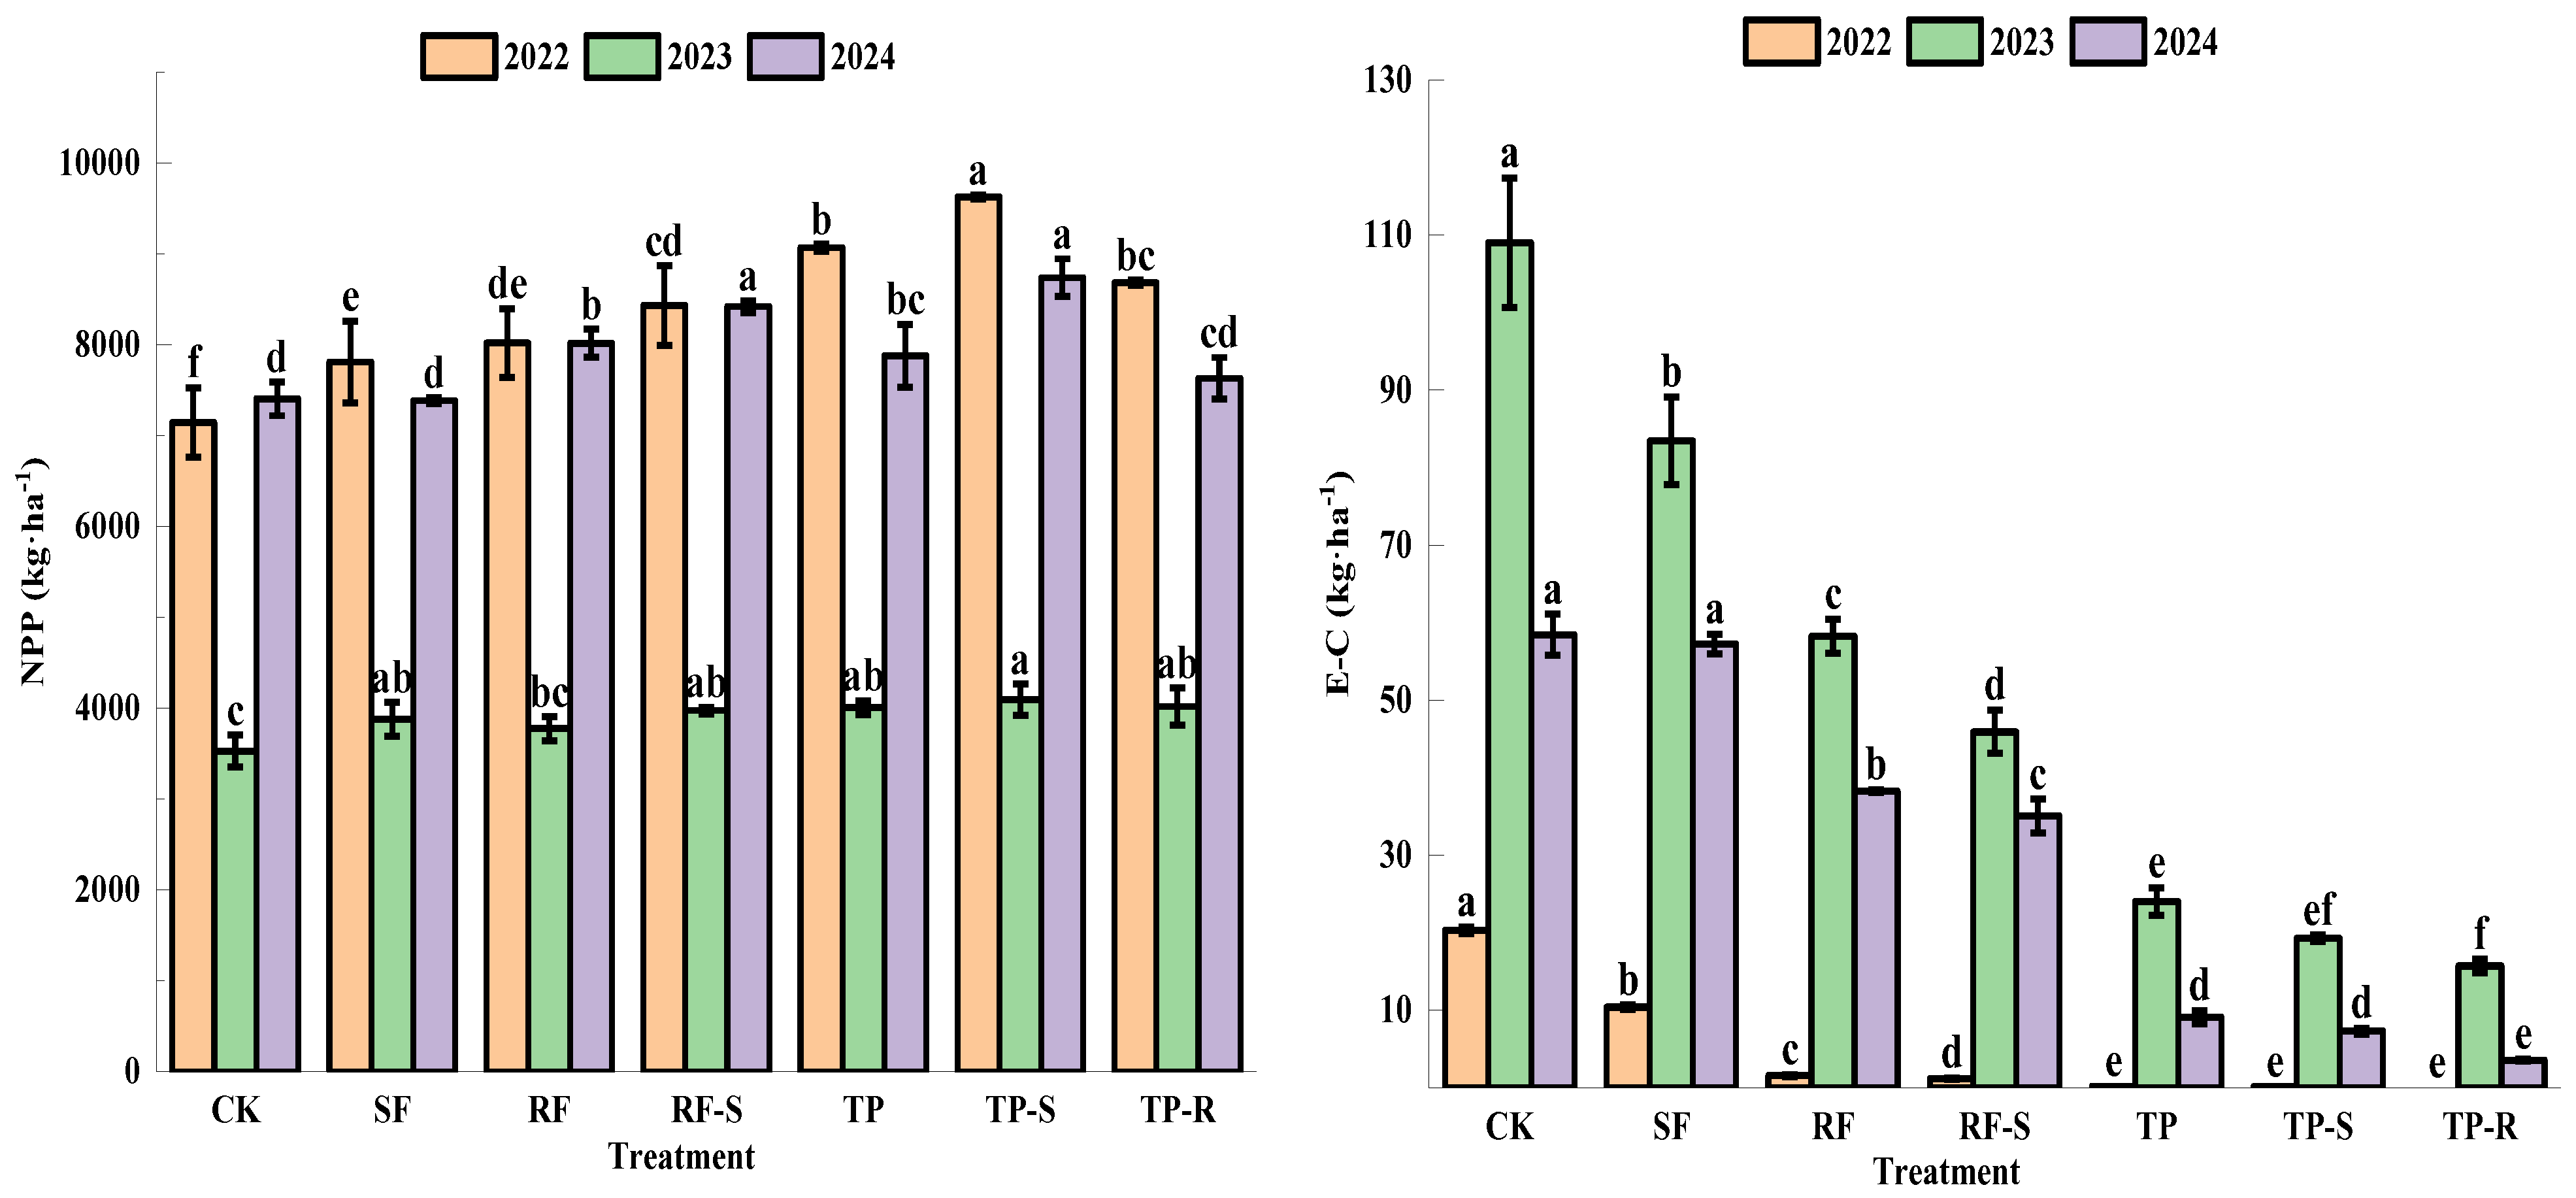
The net primary productivity (NPP) of crops after harvest and the carbon loss in runoff (E-C) under different tillage practices in each year are presented in Figure 10.
In 2022, the net primary productivity of crops in the TP-S regime was the highest, showing a substantial difference compared to that in the other regimes (p < 0.05). Compared with the CK regime, the increases in the TP-S, TP, TP-R, RF-S, RF, and SF regimes were 34.73%, 26.92%, 21.54%, 18.04%, 12.25%, and 9.31%, respectively. The carbon loss in runoff associated with the TP-S, TP, and TP-R regimes was markedly lower than that associated with the other regimes (p < 0.05). Compared with the CK regime, the increases in the SF, RF, RF-S, TP, TP-S and TP-R regimes were 48.92%, 92.45%, 94.21%, 99.29%, 99.60%, and 100.00%, respectively.
In 2023, the net primary productivity of crops under the TP-S regime reached the maximum value. There was no significant difference between this value and that of the TP and R -S regimes (p > 0.05), while it was significantly different from that of the remaining regimes (p < 0.05). Compared with the CK regime, the increases in the TP-S, TP-R, TP, RF-S, RF, and SF regimes were 16.00%, 13.84%, 13.51%, 12.61%, 6.98%, and 9.88%, respectively. The carbon loss in runoff associated with the TP-S and TP regimes was markedly lower than that associated with the other regimes (p < 0.05). Compared with the CK regime, the increases in the SF, RF, RF-S, TP, TP-S and TP-R regimes were 23.44%, 46.57%, 57.90%, 77.99%, 82.34%, and 85.61%, respectively.
In 2024, the net primary productivity of crops in the TP-S regime was the highest, showing a substantial difference compared to that in the other regimes (p < 0.05). Compared with the CK regime, the increases in the TP-S, RF-S, RF, TP, TP-R, and SF regimes were 18.00%, 13.71%, 8.26%, 6.40%, 3.05%, and −0.25%, respectively. The carbon loss in runoff associated with the TP-S and TP regimes was markedly lower than that associated with the other regimes (p < 0.05). Compared with the CK regime, the increases in the SF, RF, RF-S, TP, TP-S and TP-R regimes were 2.07%, 34.57%, 40.05%, 84.46%, 87.52%, and 93.96%, respectively.

3.3. Net Ecosystem Productivity (NEP) and Net Ecosystem Carbon Balance (NECB) Under Different Tillage Practices

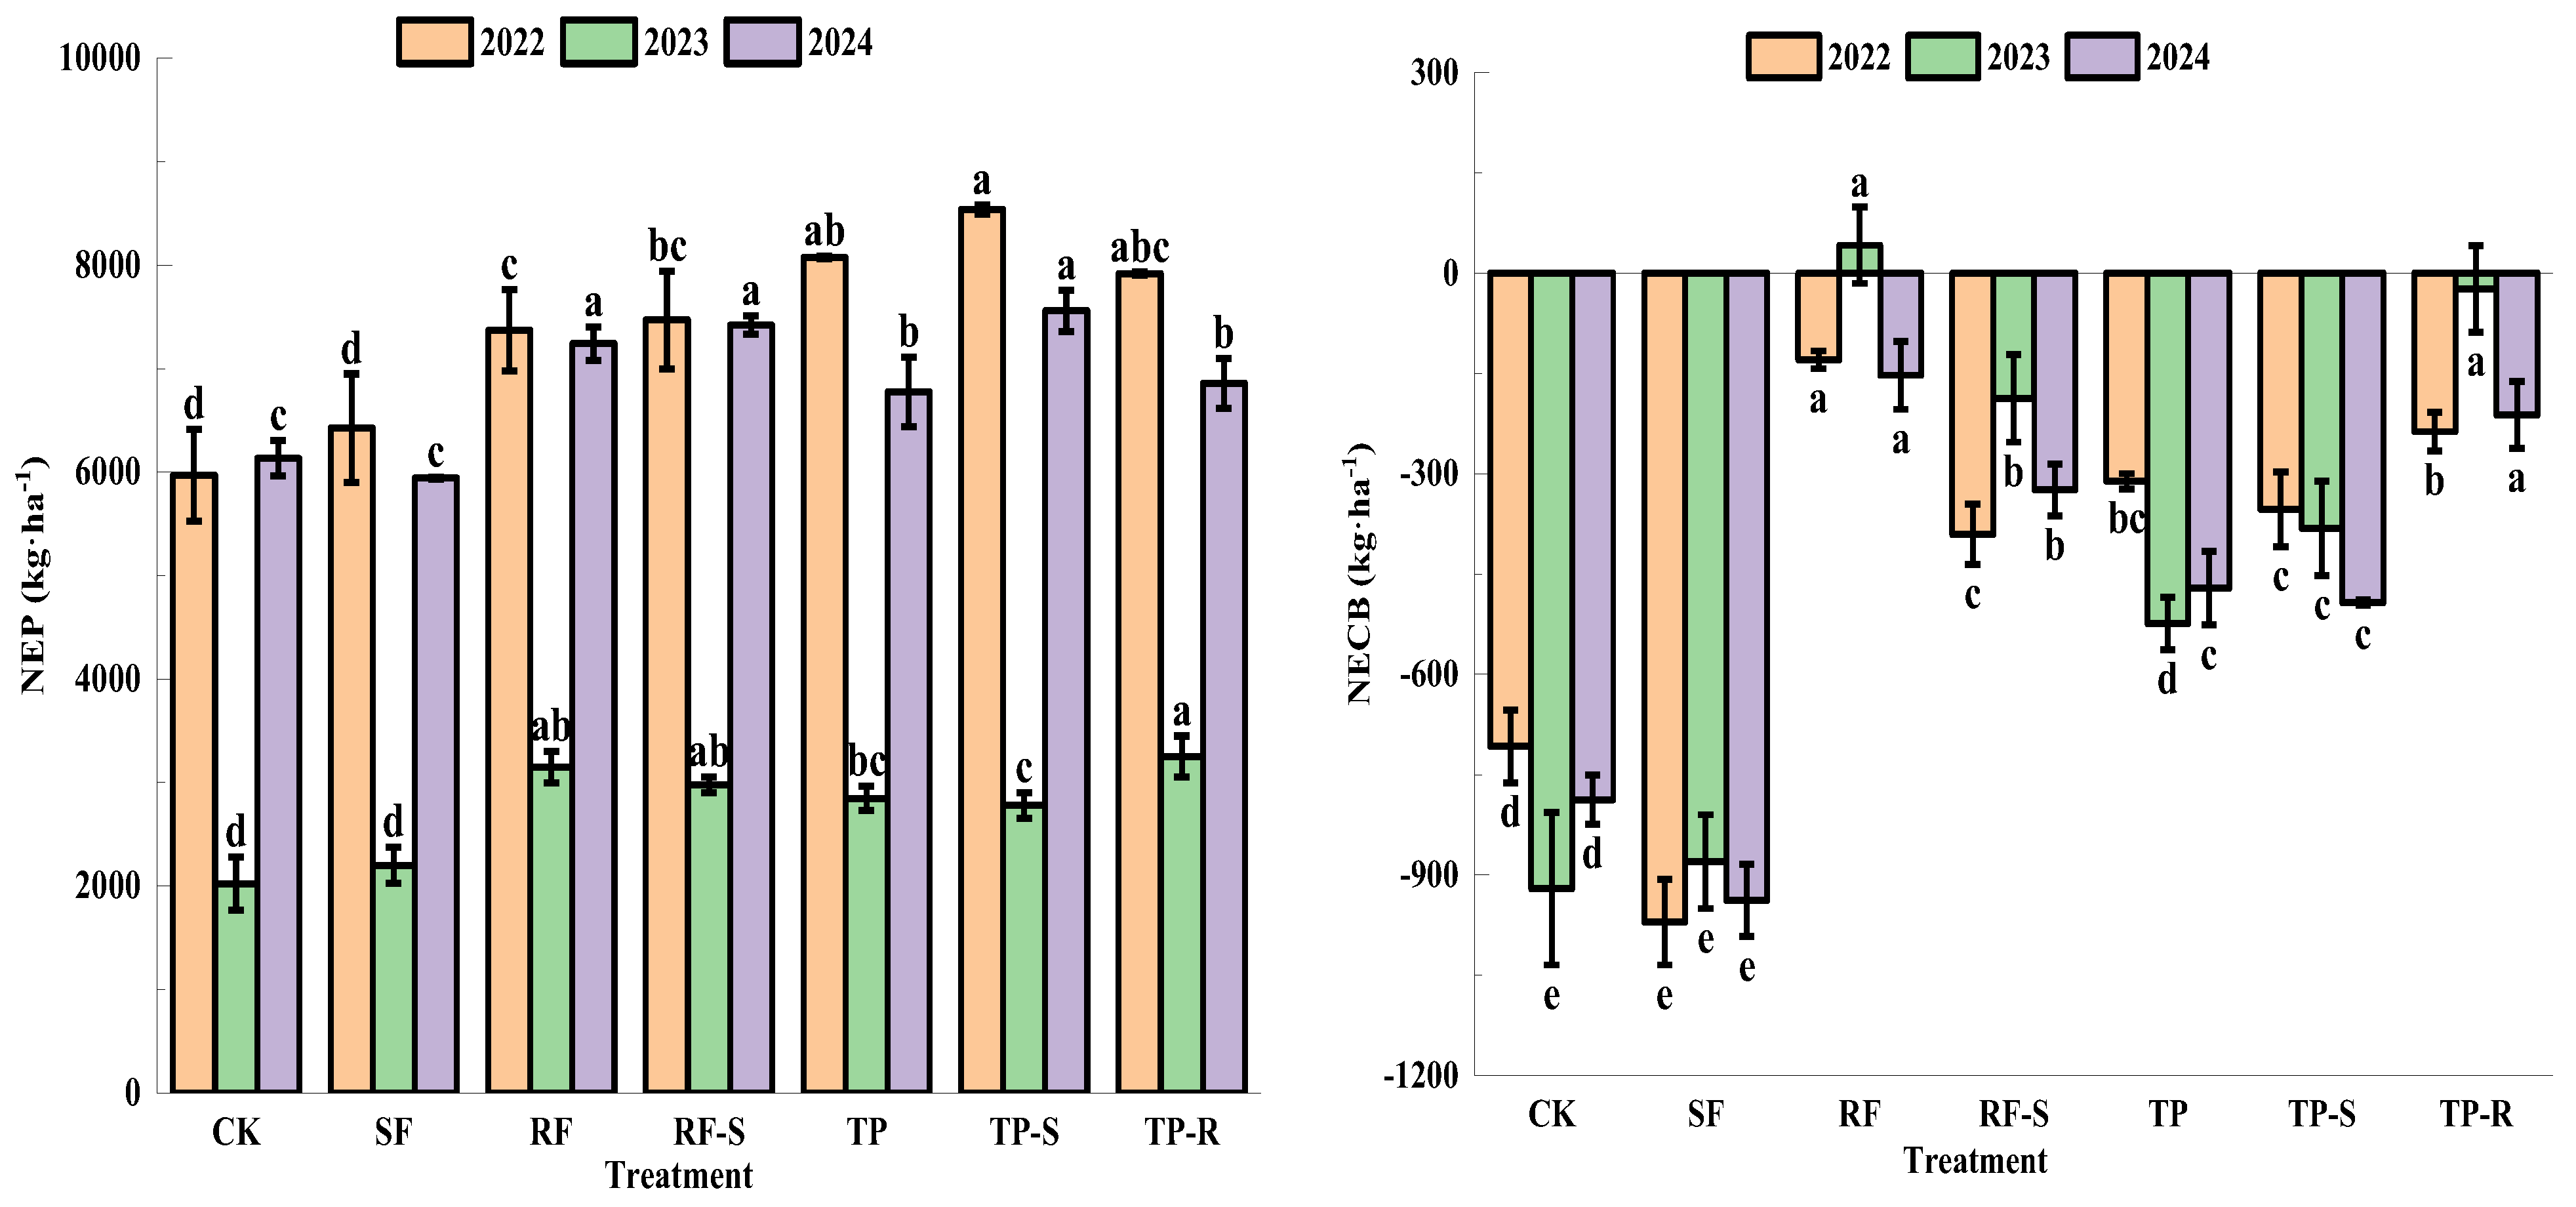
The NEP and NECB of farmland under different tillage practices in each year are depicted in Figure 11.
In 2022, the net ecosystem productivity under the TP-S regime reached the maximum value. There was no significant difference between this value and that of the TP regimes (p > 0.05), while it was significantly different from that of the remaining regimes (p < 0.05). Compared with the CK regime, the increases in the TP-S, TP, TP-R, RF-S, RF and SF regimes were 43.01%, 35.29%, 32.67%, 25.16%, 23.47%, and 7.63%, respectively. The net ecosystem carbon balance under the RF regime reached the maximum value, showing a significant divergence from that of the remaining regimes (p < 0.05). The net ecosystem carbon balance of each regime, in descending order, was RF > TP-R > TP > TP-S > RF-S > CK > SF.
In 2023, the net ecosystem productivity under the TP-R regime reached the maximum value. There was no significant difference between this value and that of the RF and RF-S regimes (p > 0.05), while it was significantly different from that of the remaining regimes (p < 0.05). Compared with the CK regime, the increases in the TP-R, RF, RF-S, TP, TP-S and SF regimes were 60.69%, 55.72%, 47.18%, 40.70%, 37.40%, and 8.71%, respectively. The net ecosystem carbon balance of the RF regime was positive, while those of the remaining regimes were negative. The net ecosystem carbon balance of each regime, in descending order, was RF > TP-R > RF-S > TP-S > TP > SF > CK.
In 2024, the net ecosystem productivity under the TP-S regime reached the maximum value. There was no significant difference between this value and that of the RF and RF-S regimes (p > 0.05), while it was significantly different from that of the remaining regimes (p < 0.05). Compared with the CK regime, the increases in the TP-S, RF-S, RF, TP-R, TP and SF regimes were 23.27%, 20.99%, 18.10%, 11.81%, 10.46%, and −3.09%, respectively. Under the RF regime, the net carbon balance of the ecosystem reached its maximum value. There was no significant difference between this value and that under the TP-R regime (p > 0.05), while it was significantly different from that under the remaining regimes (p < 0.05). The net ecosystem carbon balance of each regime, in descending order, was RF > TP-R > RF-S > TP > TP-S > CK > SF.

3.4. Net Carbon Balance (NCF) of Cropland System Under Different Tillage Measures

The carbon emissions from farmland inputs under different tillage practices in each year are presented in Table 5 and Table 6. In 2022 and 2024, the carbon emissions from inputs such as fertilizers, seeds, pesticides, and herbicides were the same for all regimes. The TP and CK regimes only involved plowing; the TP-R and RF regimes included plowing and ridge-tillage in the ridged-field zone; the SF and TP-S regimes involved plowing and sub-soiling; and the RF-S regime included plowing, ridge-tillage in the ridged-field zone, and sub-soiling. The carbon emissions from farmland inputs for each regime, in descending order, were RF-S > TP-S = SF > TP-R = RF > TP = CK. In 2023, the carbon emissions from fertilizers, seeds, pesticides, and herbicides were also identical for all regimes. The farming operation methods in each regime were consistent with those in 2022 and 2024. The carbon emissions from farmland inputs for each regime, in descending order, were RF-S > TP-S = SF > TP-R = RF > TP = CK.
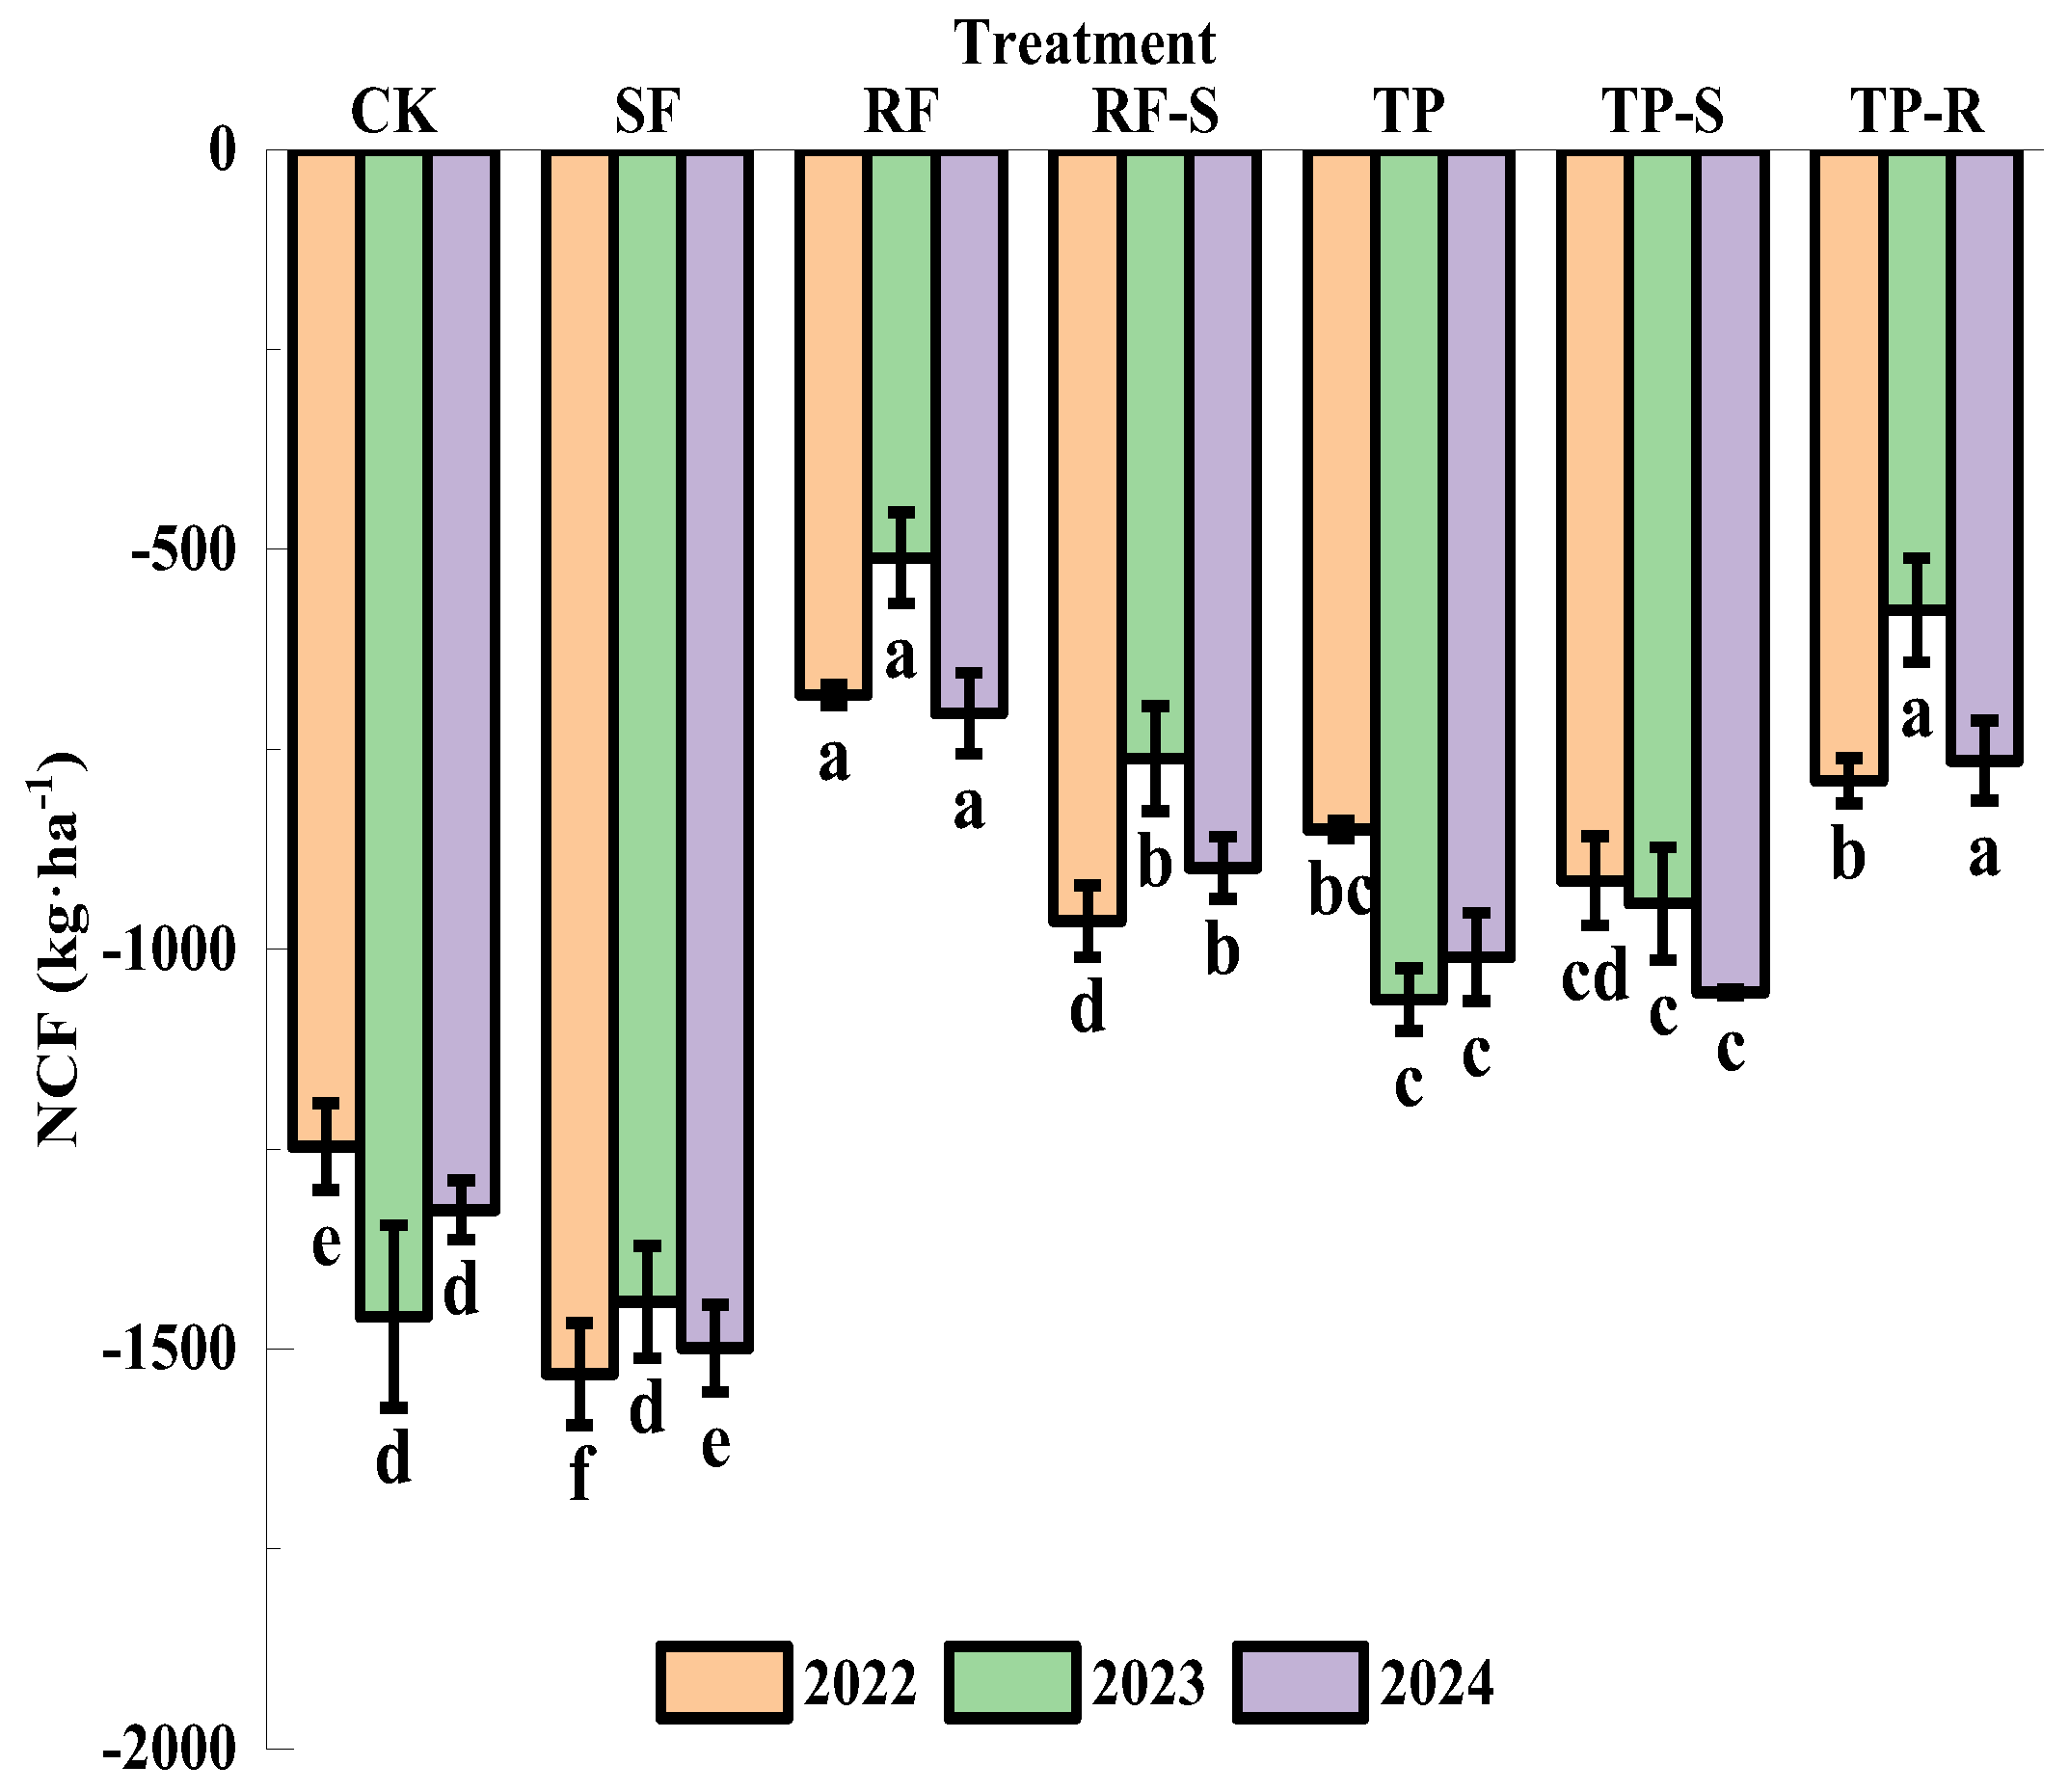
The net carbon balance of the cropland system under different tillage practices is depicted in Figure 12. The experimental results indicate that, across all years and regimes, the net carbon balance of the cropland system was negative, signifying that the cropland system served as a carbon source.
Throughout the three-year experimental period, the net carbon balance of the cropland system under the RF regime consistently ranked the highest across all years. In 2022, it exhibited a significant elevation compared to that of the other regimes (p < 0.05). In 2023 and 2024, no significant divergence was observed between the RF regime and the TP-R and RF-S regimes (p > 0.05), while it was significantly greater than that of the remaining regimes (p < 0.05). In 2022, the net carbon balance of the farmland system for each regime followed a descending order: RF > TP-R > TP > TP-S > RF-S > CK > SF. In 2023, the order of the net carbon balance of the farmland system for each regime in descending order was RF > TP-R > RF-S > TP-S > TP > SF > CK. In 2024, the descending order of the net carbon balance of the farmland system for each regime was RF > TP-R > RF-S > TP > TP-S > CK > SF.

4. Discussion

Under undisturbed conditions, the carbon cycle between the atmosphere and terrestrial ecosystems typically maintains a relatively stable equilibrium [35]. However, due to the ever-increasing human demand for food, the over-utilization of vast amounts of farmland has caused a rapid augment in carbon emissions from the farmland ecosystem, thus disrupting this equilibrium. The carbon pool of the cropland ecosystem is a indispensable portion of the global carbon pool, exerting a substantial influence on global climate change and the global carbon neutrality initiative. The carbon cycling process within the farmland ecosystem mainly encompasses the absorption and fixation of CO2 by crops, as well as the emissions of CO2 and CH4 arising from the microbial respiration of edaphic microorganisms and crops themselves. As important components of greenhouse gases, CH4 and CO2 contribute as much as 63% and 18%, respectively, to the greenhouse effect [36]. Therefore, to achieve the expected goals of carbon neutrality and carbon peak, for farmland, it is essential to further enhance its carbon sequestration capacity and reduce carbon emissions.
Soil heterotrophic respiration, a key component within the farmland carbon cycle, essentially represents the process wherein soil microbes break down organic substances and emit CO2. This process is affected by a plethora of factors. These factors encompass vegetation types, the composition and functionality of soil microbes, soil moisture levels, as well as the cycling mechanisms of soil nutrients. As the main net carbon output pathway in terrestrial ecosystems, it is also a key determinant of the ecosystem’s carbon source/sink status [37]. The findings of this research suggest that during the three-year duration, the maximum CO2 emission fluxes of soil heterotrophic respiration for each regime were centered around the mid-growth phase of the crops. This could be attributed to the abundant rainfall and high temperatures, which provided favorable soil moisture conditions, enhanced soil microbial activity, and promoted the growth of crop roots, thus causing a sudden increase in the intensity of soil heterotrophic respiration CO2. The three sub-soiling tillage regimes (SF, RF-S, TP-S) exhibited higher peak CO2 emissions and total emissions of soil heterotrophic respiration in the three-year experiment. This might be because sub-soiling tillage increased soil porosity, leading to an increase in the soil gas phase volume, a rise in soil oxygen content, an enhancement of aerobic microbial activity, and an increase in microbial respiration intensity, thereby increasing the CO2 emissions from soil heterotrophic respiration. Over the course of the three-year experimental study, the CO2 emission fluxes of soil heterotrophic respiration in every regime experienced an upsurge to a certain degree towards the conclusion of the growth period. This phenomenon could be attributed to the progressive accumulation of litter, including dead and fallen leaves, as the crops grew. The litter served as a source of carbon input to the soil, enhancing the activity of soil microorganisms, thereby leading to an augmentation in the CO2 emissions from soil heterotrophic respiration [38].
Farmland represents one of the principal sources of CH4 emissions, and the emissions of CH4 have a substantial influence on global climate change. The formation of CH4 in farmland mainly occurs through the anaerobic reactions of methanogenic bacteria groups. In this experiment, due to the relatively low soil moisture content in dry-farming farmland, the soil has numerous internal pores and a high oxygen content. This enhances the activity of methane-oxidizing bacteria groups, thereby increasing the soil’s absorption of CH4. Further, intermittent high-intensity rainfall can cause a short-term increase in soil moisture content, which enhances the activity of methanogens and increases CH4 emissions. Consequently, in the three-year experiment, there was a certain alternation between positive and negative CH4 emissions. The overall pattern of CH4 emissions in each year exhibited a single-peak change, reaching its peak during the maize jointing stage (or the soybean branching stage). This is because during this period, the crop roots develop rapidly, and the increased root-respiration intensity generates CO2, which provides a certain anaerobic environment and reaction substrates for methanogens. Additionally, the increase in root exudates resulting from root development supplies abundant reaction substrates to the methanogenic bacteria groups, enhancing their activity and leading to an increase in CH4 emissions until it reaches the peak. As the temperature rises and the crop’s water-utilization intensity increases during the maize filling stage (or the soybean pod-setting stage), the soil moisture content decreases, soil aeration is enhanced, the activity of methanogens is reduced, and the crops are affected to varying degrees. As a result, CH4 emissions gradually decrease in the later growth period.
In recent years, researchers have frequently employed methods such as soil carbon emission efficiency (CEE), net ecosystem productivity (NEP), net soil carbon budget (NSCB), and net ecosystem carbon budget (NECB) to evaluate the carbon budget of ecosystems. Some of these methods have also been introduced into the farmland ecosystem. CEE is calculated using the ratio between carbon emissions and carbon absorption, representing the balance efficiency between soil carbon emission and absorption. It can intuitively reflect the role and capacity of soil in the carbon cycle. However, to some extent, it may lead to an underestimation of the soil carbon sequestration effect [39]. NEP is calculated by subtracting the carbon emissions from the respiration of the farmland ecosystem from the total amount of organic matter produced by the farmland ecosystem within a certain period. During the calculation, the consideration of the organic carbon contained in rhizosphere sediments and litter may be lacking, resulting in a lower NEP. Further, CH4 emissions from farmland and the carbon amount leaving the field are also major factors influencing the carbon balance of the farmland ecosystem. Nevertheless, the calculation of NEP often lacks the consideration of this part, thus causing an overestimation of the carbon budget value of the farmland ecosystem, presenting a carbon “sink” state [40]. NSCB, based on the change in soil organic carbon (SOC) stock, is an effective method to determine the soil carbon budget in the short term [41]. Compared with NEP, it can more intuitively reflect the increase or decrease in organic carbon in farmland soil. However, since it does not consider the runoff carbon loss caused by soil erosion and the input of organic carbon into the soil from plant roots and crop residues, it may lead to an underestimation of the carbon budget value of the farmland ecosystem [42]. Compared with the above-mentioned three evaluation systems, NECB takes a more comprehensive consideration of the carbon input and emission pathways of the farmland ecosystem. It is widely used as a more reliable method for evaluating the ecosystem carbon budget in the short term [43,44]. Nevertheless, NECB only evaluates the direct carbon input and output of the farmland ecosystem, ignoring the impact of indirect carbon input and output on the carbon budget of the farmland ecosystem, thus causing an overestimation of the carbon budget of the farmland ecosystem. Therefore, in this study, based on NECB, the net carbon balance of the cropland system (NCF) was proposed to address this issue. In this study, the NCF of each regime in the three-year period was negative, presenting a carbon “source” state. The ridged-field (RF) regime, to some extent, exacerbated the CH4 emissions from farmland soil, but the emission amount was relatively low. Moreover, it significantly reduced the CO2 emissions from soil heterotrophic respiration and increased the net primary productivity of crops, making the NCF value significantly higher than that of the other regimes, presenting a weak carbon “source”. Due to the complexity of carbon “source” and “sink” boundary definition, management measures, research methods, and data, there remains a high degree of uncertainty in the estimation of carbon “sources” and “sinks” [45,46,47,48,49,50]. In dryland agriculture, a portion of crop residues (straw) is often left during the harvesting operation. This part of the residues returns to the soil with the plowing operation in the following year. If the impact of this part of the residues on the farmland carbon pool is considered, it may lead to a reduction in the farmland carbon “source” or even a transformation into a carbon “sink”. However, due to the differences in farmland management measures in different regions, the amount of residues retained varies. Therefore, how to determine the impact of this part of the residues on the farmland carbon pool remains to be studied. In addition, the duration and stability of organic carbon fixed in farmland soil are still controversial. Coupled with differences in planting structures, research areas, and farmland management measures, the uncertainty in the estimation of carbon “sources” and “sinks” of farmland soil is further increased. Consequently, the evaluation methods for the carbon balance of the cropland system require further research and in-depth exploration.

5. Conclusions

Through three consecutive years of experiments, it was found that the RF regime significantly reduced the CO2 emissions from soil heterotrophic respiration in farmland, the SF regime significantly decreased the CH4 emissions from farmland, the TP-S regime significantly increased the net primary productivity of crops, and the regimes with cross-slope tillage (TP, TP-S, TP-R) significantly reduced the carbon loss in farmland runoff.
Calculated by the NCF, the net carbon balance of the cropland system under different tillage practices was negative, presenting a carbon “source” state. In comparison with other regimes, the RF regime remarkably increased the NCF. Further, it significantly enhanced the NPP of crops compared to the CK regime, demonstrating a strong yield-increasing effect. Consequently, it has the capacity to efficiently decrease the net carbon emissions within the cropland system, all the while guaranteeing crop yields.
Compared with the NECB evaluation system, the Net Carbon Balance of the Cropland system (NCF) evaluation system adopted in this study takes into account the impact of indirect carbon emissions, such as those from labor, materials, and machinery during crop cultivation, on the total carbon emissions of the farmland. This enables a comprehensive evaluation of the carbon balance of the cropland system, presenting a more comprehensive and intuitive view of the seasonal or inter-annual changes in the carbon budget of the cropland system.

6. Limitations and Future Perspectives

6.1. Limitations

This investigation contributed novel insights into the impacts of diverse tillage practices on net carbon flux (NCF) within black soil rainfed agroecosystems. Nevertheless, critical gaps were detected in the current NCF assessment framework. Atmospheric deposition and other unaccounted factors may lead to the omission of indirect carbon exchanges in cropland carbon budget calculations, resulting in systematic overestimation of net ecosystem carbon balance. Spatiotemporal variations in crop residue retention caused by differential management strategies and planting configurations further complicate the quantification of agricultural carbon sources and sinks. The three-year duration of this field experiment imposes inherent limitations on understanding long-term trends and stability patterns in soil carbon dynamics.

6.2. Future Perspectives

Enhancing carbon accounting methodologies through the integration of both direct and indirect carbon fluxes should be prioritized to develop a more robust evaluation system. Extending experimental durations and conducting multi-regional comparative studies are essential for elucidating the interactive effects of management practices and environmental factors on carbon balance trajectories, which will inform the formulation of science-based carbon neutrality policies. Additionally, comprehensive assessments of co-benefits from integrated management approaches (e.g., straw retention, organic amendment, precision irrigation) are required to identify optimal strategies that reduce net carbon emissions while maintaining crop productivity and enhancing soil carbon sequestration resilience. These efforts will provide critical theoretical support to achieve national carbon neutrality objectives.

Author Contributions

Conceptualization, P.Y., M.D. and G.L.; methodology, P.Y. and Z.Q.; software, M.D., G.L. and M.L.; validation, P.Y., M.D. and G.L.,; formal analysis, M.L. and X.Z.; investigation, G.L.; resources, X.Z.; data curation, P.Y. and Z.Q.; writing—original draft preparation, P.Y., M.D. and Z.Z.; writing—review and editing, P.Y., M.D., Z.Z. and M.L.; visualization, X.Z.; supervision, Z.Z.; project administration, Z.Z.; funding acquisition, Z.Z. All authors have read and agreed to the published version of the manuscript.

Funding

This work was supported by the China National key research and development program (2021YFD1500802).

Data Availability Statement

Data will be made available on request.

Conflicts of Interest

The authors declare that they have no known competing financial interests or personal relationships that could have appeared to influence the work reported in this paper.

References

  1. Kerr, R.A. Climate change-Reducing uncertainties of global warming. Science 2002, 295, 29–31. [Google Scholar] [CrossRef] [PubMed]
  2. Kerr, R.A. Global warming is changing the world. Science 2007, 316, 188–190. [Google Scholar] [CrossRef] [PubMed]
  3. Stone, R.; Bohannon, J. Global warming-UN conference puts spotlight on reducing impact of climate change. Science 2006, 314, 1224–1225. [Google Scholar] [CrossRef] [PubMed]
  4. Moss, R.H.; Edmonds, J.A.; Hibbard, K.A.; Manning, M.R.; Rose, S.K.; van Vuuren, D.P.; Carter, T.R.; Emori, S.; Kainuma, M.; Kram, T.; et al. The next generation of scenarios for climate change research and assessment. Nature 2010, 463, 747–756. [Google Scholar] [CrossRef]
  5. Vermeulen, S.J.; Aggarwal, P.K.; Ainslie, A.; Angelone, C.; Campbell, B.M.; Challinor, A.J.; Hansen, J.W.; Ingram, J.S.I.; Jarvis, A.; Kristjanson, P.; et al. Options for support to agriculture and food security under climate change. Environ. Sci. Policy 2011, 15, 136–144. [Google Scholar] [CrossRef]
  6. Nakicenovic, N.; Alcamo, J.; Davis, G.; DeVries, B.; Fenhann, J.; Gaffin, S.; Gregory, K.; Grübler, A.; Jung, T.Y.; Kram, T. Special Report on Emissions Scenarios, Working Group III, Intergovernmental Panel on Climate Change (IPCC); Cambridge University Press: Cambridge, UK, 2000; 595p, ISBN 92-9169-113-5. [Google Scholar]
  7. IPCC. Impacts, Adaptation and Vulnerability; Contribution of Working Group II to the Fifth Assessment Report of the Intergovernmental Panel on Climate Change; Cambridge University Press: Cambridge, UK, 2014. [Google Scholar]
  8. Yu, G.R.; Ren, W.; Chen, Z.; Zhang, L.M.; Wang, Q.F.; Wen, X.F.; He, N.P.; Zhang, L.; Fang, H.J.; Zhu, X.J.; et al. Construction and progress of Chinese terrestrial ecosystem carbon, nitrogen and water fluxes coordinated observation. J. Geogr. Sci. 2016, 26, 803–826. [Google Scholar] [CrossRef]
  9. Fan, S.; Gloor, M.; Mahlman, J.; Pacala, S.; Sarmiento, J.; Takahashi, T.; Tans, P. A large terrestrial carbon sink in north america implied by atmospheric and oceanic carbon dioxide data and models. Science 1998, 282, 442–446. [Google Scholar] [CrossRef]
  10. Fang, C.; Moncrieff, J.B. The dependence of soil CO2 efflux on temperature. Soil Biol. Biochem. 2001, 33, 155–165. [Google Scholar] [CrossRef]
  11. Hansen, J.E.; Lacis, A.A. Sun and dust versus greenhouse gases: An assessment of their relative roles in global climate change. Nature 1990, 346, 713–719. [Google Scholar] [CrossRef]
  12. Melillo, J.M.; Steudler, P.A.; Aber, J.D.; Newkirk, K.; Lux, H.; Bowles, F.P.; Catricala, C.; Magill, A.; Ahrens, T.; Morrisseau, S. Soil Warming and Carbon-Cycle Feedbacks to the Climate System. Science 2002, 298, 2173–2176. [Google Scholar] [CrossRef]
  13. Vermeulen, S.J.; Campbell, B.M.; Ingram, J.S.I. Climate change and food systems. Annu. Rev. Environ. Resour. 2012, 37, 195–222. [Google Scholar] [CrossRef]
  14. Yu, P.Z.; Yang, T.Q.; Zhang, Z.X.; Zhou, X.; Qi, Z.J.; Yin, Z.H.; Li, A. Soil and water conservation effects of different tillage measures on phaeozems sloping farmland in northeast China. Land Degrad. Dev. 2024, 35, 1716–1733. [Google Scholar] [CrossRef]
  15. FAO. FAOSTAT; Food and Agriculture Organization of the United Nations: Rome, Italy, 2015. [Google Scholar]
  16. Rong, L.; Duana, X.W.; Zhang, G.L.; Gu, Z.J.; Feng, D.T. Impacts of tillage practices on ephemeral gully erosion in a dry-hot valley region in southwestern China. Soil Tillage Res. 2019, 187, 72–84. [Google Scholar] [CrossRef]
  17. Basci, F.; Kisic, I.; Mesic, M.; Nestory, O.; Butorac, A. Tillage and crop management effects on soil erosion in central Croatia. Soil Tillage Res. 2004, 78, 197–206. [Google Scholar] [CrossRef]
  18. Nouchi, I.; Yonemura, S. CO2, CH4 and N2O fluxes from soybean and barley double-cropping in relation to tillage in Japan. Phyton-Ann. Rei Bot. 2005, 45, 327–338. [Google Scholar]
  19. Pelster, D.E.; Matteau, J.P.; Farrell, R.; Hernandez, R.G. Tillage effects on growing season nitrous oxide emissions in Canadian cropland soils. Can. J. Soil Sci. 2023, 104, 1–10. [Google Scholar] [CrossRef]
  20. Della, L.D.; Brye, K.R.; Slayden, J.M.; Henry, C.G.; Wood, L.S. Relationships among soil factors and greenhouse gas emissions from furrow-irrigated Rice in the mid-southern, USA. Geoderma Reg. 2021, 24, e00365. [Google Scholar]
  21. Kern, J.S.; Johnson, M.G. Conservation Tillage Impacts on National Soil and Atmospheric Carbon Levels. Soil Sci. Soc. Am. J. 1993, 57, 200–210. [Google Scholar] [CrossRef]
  22. Sun, M.; Zhan, M.; Zhao, M.; Tang, L.L.; Qin, M.G.; Cao, C.G.; Cai, M.L.; Jiang, Y.; Liu, Z.H. Maize and rice double cropping benefits carbon footprint and soil carbon budget in paddy field. Field Crops Res. 2019, 243, 107620. [Google Scholar] [CrossRef]
  23. Li, X.D.; Fu, H.; Guo, D.; Li, X.D.; Wan, C.G. Partitioning soil respiration and assessing the carbon balance in a Setaria italica (L.) Beauv. Cropland on the Loess Plateau, Northern China. Soil Biol. Biochem. 2010, 42, 337–346. [Google Scholar] [CrossRef]
  24. Hu, M.; Qu, Z.Y.; Li, Y.; Xiong, Y.W.; Huang, G.H. Contrasting effects of different straw return modes on net ecosystem carbon budget and carbon footprint in saline-alkali arid farmland. Soil Tillage Res. 2024, 239, 106031. [Google Scholar] [CrossRef]
  25. Ji, C.; Wang, J.D.; Xu, C.; Gu, Y.; Yuan, J.; Liang, D.; Wang, L.; Ning, Y.W.; Zhou, J.; Zhang, Y.C. Amendment of straw with decomposing inoculants benefits the ecosystem carbon budget and carbon footprint in a subtropical wheat cropping field. Sci. Total Environ. 2024, 923, 171419. [Google Scholar] [CrossRef] [PubMed]
  26. Wang, K.C.; Xu, J.Z.; Guo, H.; Min, Z.H.; Wei, Q.; Chen, P.; Sleutel, S. Reuse of straw in the form of hydrochar: Balancing the carbon budget and rice production under different irrigation management. Waste Manag. 2024, 189, 77–87. [Google Scholar] [CrossRef] [PubMed]
  27. Cao, Y.; Wen, X.P.; Wang, Y.X.; Zhao, X.T. The Analysis of NPP Changes under Different Climatic Zones and under Different Land Use Types in Henan Province, 2001–2020. Sustainability 2024, 16, 8096. [Google Scholar] [CrossRef]
  28. Bolinder, M.A.; Angers, D.A.; Giroux, M.; Laverdiere, M.R. Estimating C inputs retained as soil organic matter from corn (Zea mays L.). Plant Soil 1999, 215, 85–91. [Google Scholar] [CrossRef]
  29. Chapin, F.S.; Woodwell, G.M.; Randerson, J.T.; Rastetter, E.B.; Lovett, G.M.; Baldocchi, D.D.; Clark, D.A.; Harmon, M.E.; Schimel, D.S.; Valentini, R.; et al. Reconciling carbon-cycle concepts, terminology, and methods. Ecosystems 2006, 9, 1041–1050. [Google Scholar] [CrossRef]
  30. Hounkpatin, O.K.; Welp, G.; Akponikpè, I.P.; Rosendahl, I.; Amelung, W. Carbon losses from prolonged arable cropping of Plinthosols in Southwest Burkina Faso. Soil Tillage Res. 2018, 175, 51–61. [Google Scholar] [CrossRef]
  31. Page, K.L.; Dang, Y.P.; Dalal, R.C. The Ability of Conservation Agriculture to Conserve Soil Organic Carbon and the Subsequent Impact on Soil Physical, Chemical, and Biological Properties and Yield. Front. Sustain. Food Syst. 2020, 4, 31. [Google Scholar] [CrossRef]
  32. Lal, R. Agricultural activities and the global carbon cycle. Nutr. Cycl. Agroecosystems 2004, 70, 103–116. [Google Scholar] [CrossRef]
  33. West, O.T.; Marland, G. A synthesis of carbon sequestration, carbon emissions, and net carbon flux in agriculture: Comparing tillage practices in the United States. Agriculture. Ecosyst. Environ. 2002, 91, 217–232. [Google Scholar] [CrossRef]
  34. Lu, F.; Wang, X.K.; Han, B.; Ouyang, Z.Y.; Duan, X.M.; Zheng, H. Assessment on the availability of nitrogen fertilization in improving carbon sequestration potential of China’s cropland soil. Chin. J. Appl. Ecol. 2008, 19, 2239–2250. [Google Scholar]
  35. Raich, J.; Schlesinger, W.H. The global carbon dioxide flux in soil respiration and its relationship to vegetation and climate. Tellus B 1992, 44, 81–99. [Google Scholar] [CrossRef]
  36. IPCC. Climate Change 2007: The Physical Science Basis; Cambridge University Press: Cambridge, UK, 2007. [Google Scholar]
  37. Knorr, W.; Prentice, I.C.; House, J.I.; Holland, E.A. Long-term sensitivity of soil carbon turnover to warming. Nature 2005, 433, 298–301. [Google Scholar] [CrossRef] [PubMed]
  38. Ryan, M.G.; Law, B.E. Interpreting, measuring, and mod-eling soil respiration. Biogeochemistry 2005, 73, 3–27. [Google Scholar] [CrossRef]
  39. Li, J.J.; Li, S.W.; Liu, Q.; Ding, J.L. Agricultural carbon emission efficiency evaluation and influencing factors in Zhejiang province, China. Front. Environ. Sci. 2022, 10, 1005251. [Google Scholar] [CrossRef]
  40. Huang, Y.T.; Wang, F.; Zhang, L.J.; Zhao, J.F.; Zheng, H.; Zhang, F.; Wang, N.; Gu, J.K.; Zhao, Y.F.; Zhang, W.S. Changes and net ecosystem productivity of terrestrial ecosystems and their influencing factors in China from 2000 to 2019. Front. Plant Sci. 2023, 14, 1259137. [Google Scholar] [CrossRef]
  41. Pete, S.; Gary, L.; Werner, L.K.; Nina, B.; Werner, E.; Marc, A.; Eric, C.; Pierre, B.; Jagadeesh, B.Y.; Bruce, O.; et al. Measurements necessary for assessing the net ecosystem carbon budget of croplands. Agric. Ecosyst. Environ. 2010, 139, 302–315. [Google Scholar] [CrossRef]
  42. Arevalo, C.B.M.; Bhatti, J.S.; Chang, S.X.; Sidders, D. Land use change effects on ecosystem carbon balance: From agricultural to hybrid poplar plantation. Agric. Ecosyst. Environ. 2011, 141, 342–349. [Google Scholar] [CrossRef]
  43. Li, T.C.; Nie, T.Z.; Chen, P.; Zhang, Z.H.; Lan, J.X.; Zhang, Z.X.; Qi, Z.J.; Han, Y.; Jiang, L.L. Carbon Budget of Paddy Fields after Implementing Water-Saving Irrigation in Northeast China. Agronomy 2022, 12, 1481. [Google Scholar] [CrossRef]
  44. Swain, C.K.; Bhattacharyya, P.; Singh, N.R.; Neogi, S.; Sahoo, R.K.; Nayak, A.K.; Zhang, G.; Leclerc, M.Y. Net ecosystem methane and carbon dioxide exchange in relation to heat and carbon balance in lowland tropical rice. Ecol. Eng. 2016, 95, 364–374. [Google Scholar] [CrossRef]
  45. Li, M.; Peng, J.Y.; Lu, Z.X.; Zhu, P.Y. Research progress on carbon sources and sinks of farmland ecosystems. Resour. Environ. Sustain. 2023, 11, 100099. [Google Scholar] [CrossRef]
  46. Wu, H.; Guo, S.H.; Guo, P.; Shan, B.Y.; Zhang, Y. Agricultural water and land resources allocation considering carbon sink/source and water scarcity/degradation footprint. Sci. Total Environ. 2022, 819, 152058. [Google Scholar] [CrossRef]
  47. Cui, Y.; Khan, S.U.; Sauer, J.; Zhao, M.J. Exploring the spatiotemporal heterogeneity and influencing factors of agricultural carbon footprint and carbon footprint intensity: Embodying carbon sink effect. Sci. Total Environ. 2022, 846, 157507. [Google Scholar] [CrossRef]
  48. Liu, J.X.; Wang, Z.; Duan, Y.F.; Li, X.R.; Zhang, M.Y.; Liu, H.Y.; Xue, P.; Gong, H.B.; Wang, X.; Chen, Y.; et al. Effects of land use patterns on the interannual variations of carbon sinks of terrestrial ecosystems in China. Ecol. Indic. 2023, 146, 109914. [Google Scholar] [CrossRef]
  49. Fan, J.L.; McConkey, B.G.; Liang, B.C.; Angers, D.A.; Janzen, H.H.; Kröbel, R.; Cerkowniak, D.D.; Smith, W.N. Increasing crop yields and root input make Canadian farmland a large carbon sink. Geoderma 2019, 336, 49–58. [Google Scholar] [CrossRef]
  50. Qian, R.; Guo, R.; Naseer, M.A.; Zhang, P.; Chen, X.L.; Ren, X.L. Long-term straw incorporation regulates greenhouse gas emissions from biodegradable film farmland, improves ecosystem carbon budget and sustainable maize productivity. Field Crops Res. 2023, 295, 108890. [Google Scholar] [CrossRef]
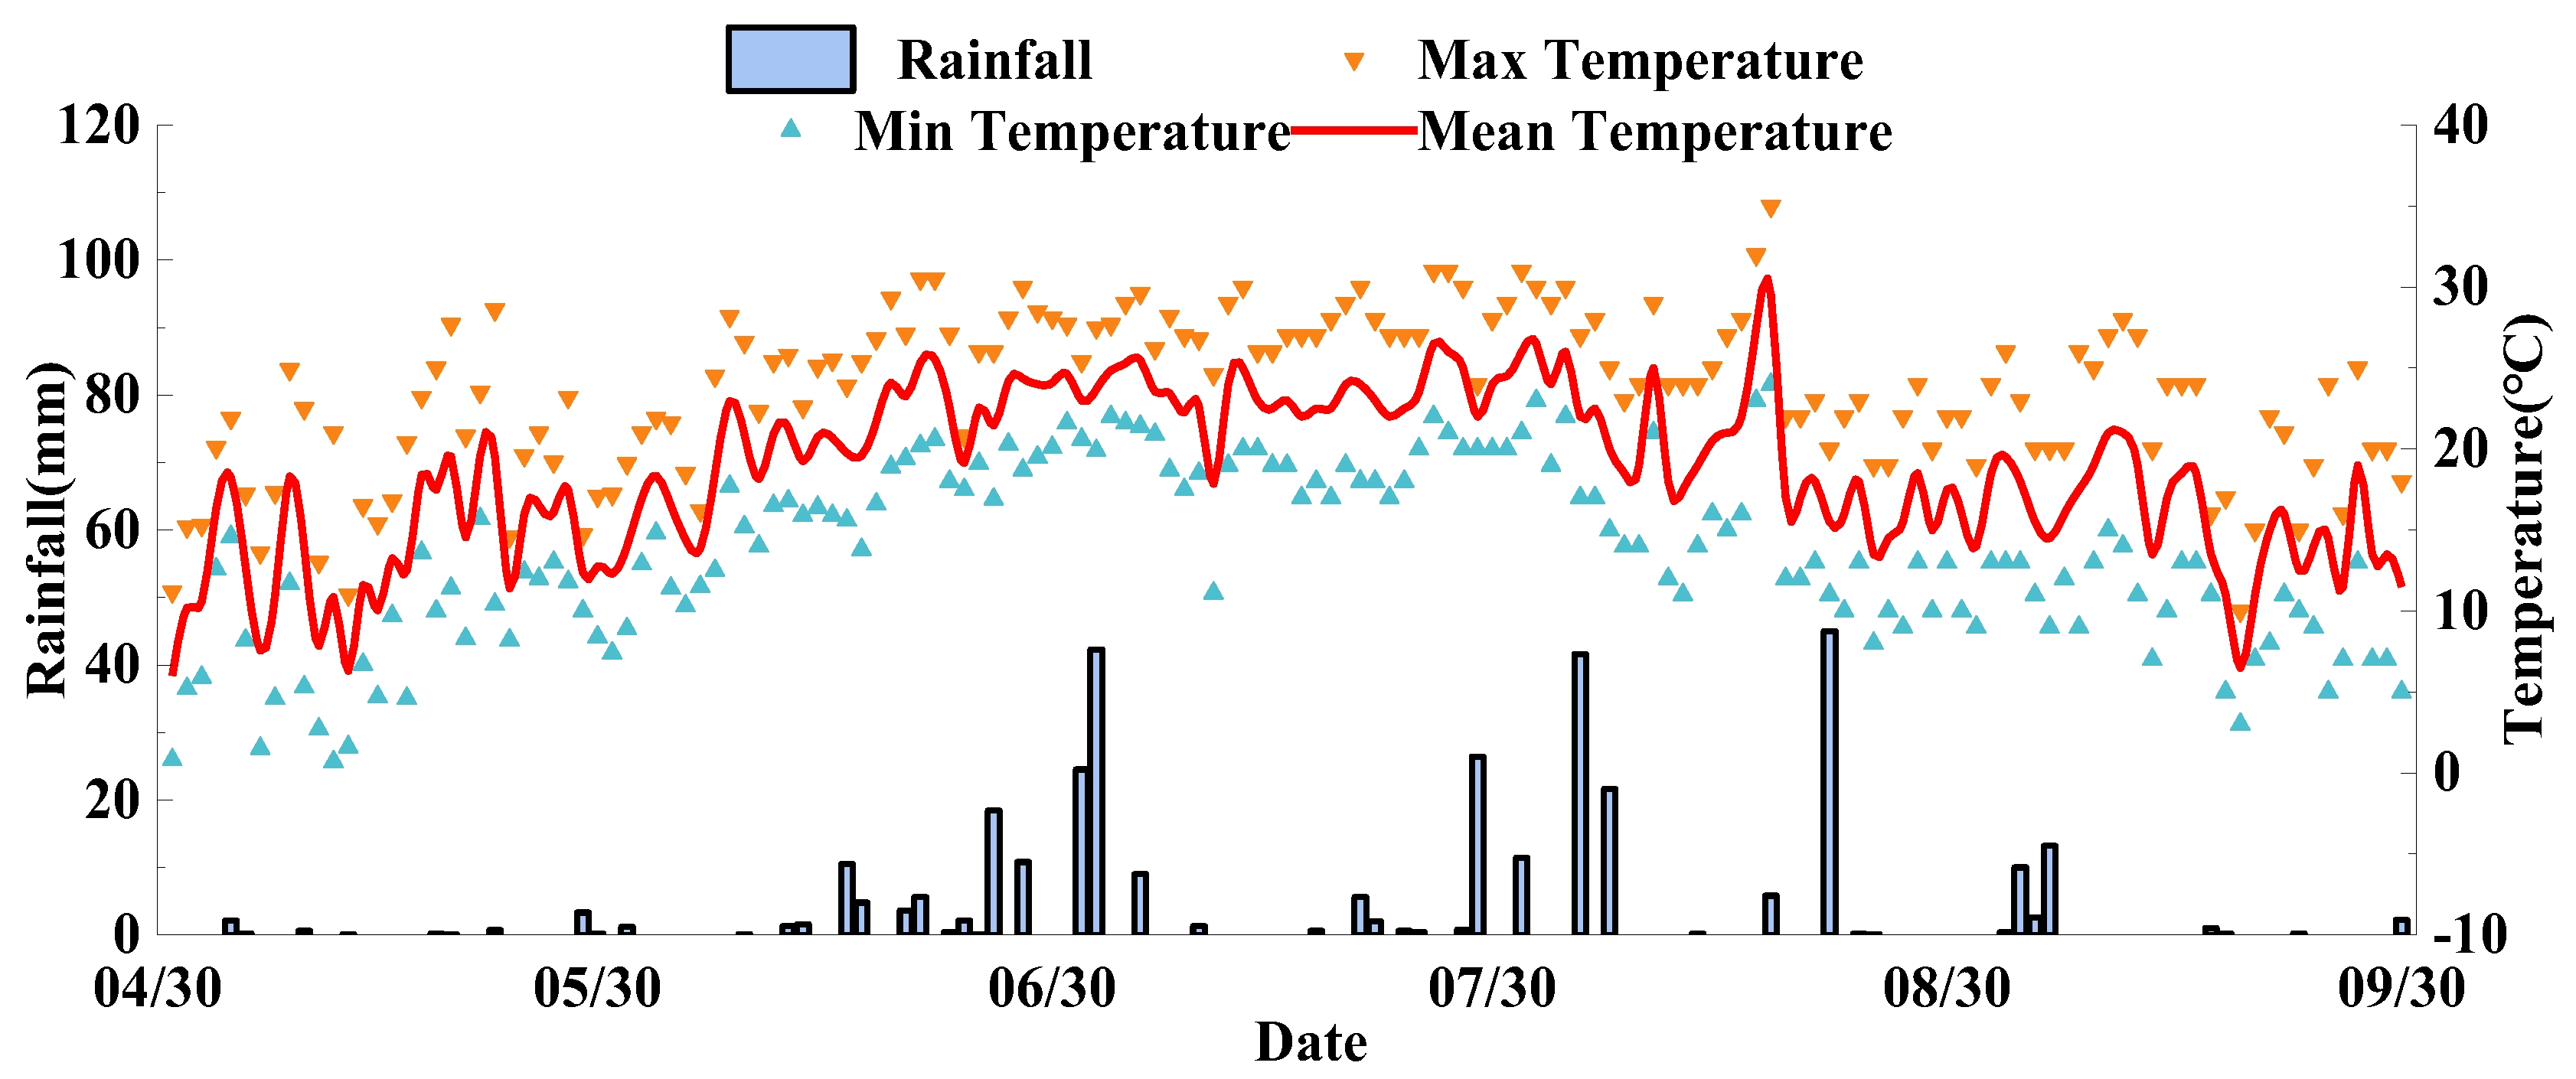
Figure 1. Precipitation and temperature variations (2022).
Agronomy 15 02285 g001
Figure 2. Precipitation and temperature variations (2023).
Agronomy 15 02285 g002
Figure 3. Precipitation and temperature variations (2024).
Agronomy 15 02285 g003
Figure 4. Geospatial Position and Spatial Arrangement of the Experimental Site. (Reprinted with permission from Ref. [14]. Copyright 2024 WILEY).
Agronomy 15 02285 g004
Figure 5. The variation curve of soil heterotrophic respiration CO2 emission flux and total CO2 emission. Note: Values are means (±SE), and the mean values with the same letter are not significantly different at p < 0.05. CK: Downslope cultivation, SF: Subsoiling tillage, RF: ridge tillage and pitting field, RF-S: ridge tillage and pitting field + subsoiling tillage, TP: contour tillage, TP-S: contour tillage + subsoiling tillage, and TP-R: contour tillage + ridge tillage and pitting field.
Agronomy 15 02285 g005
Figure 6. The variation curve of CH4 emission flux and total CH4 emission. Note: Values are means (±SE), and the mean values with the same letter are not significantly different at p < 0.05. CK: Downslope cultivation, SF: Subsoiling tillage, RF: ridge tillage and pitting field, RF-S: ridge tillage and pitting field + subsoiling tillage, TP: contour tillage, TP-S: contour tillage + subsoiling tillage, and TP-R: contour tillage + ridge tillage and pitting field.
Agronomy 15 02285 g006aAgronomy 15 02285 g006b
Figure 7. Dry matter weight and carbon content of different organs after maize harvest under different tillage measures (2022). Note: Values are means (±SE), and the mean values with the same letter are not significantly different at p < 0.05. CK: Downslope cultivation, SF: Subsoiling tillage, RF: ridge tillage and pitting field, RF-S: ridge tillage and pitting field + subsoiling tillage, TP: contour tillage, TP-S: contour tillage + subsoiling tillage, and TP-R: contour tillage + ridge tillage and pitting field.
Agronomy 15 02285 g007
Figure 8. Dry matter weight and carbon content of different organs after soybean harvest under different tillage measures (2023). Note: Values are means (±SE), and the mean values with the same letter are not significantly different at p < 0.05. CK: Downslope cultivation, SF: Subsoiling tillage, RF: ridge tillage and pitting field, RF-S: ridge tillage and pitting field + subsoiling tillage, TP: contour tillage, TP-S: contour tillage + subsoiling tillage, and TP-R: contour tillage + ridge tillage and pitting field.
Agronomy 15 02285 g008
Figure 9. Dry matter weight and carbon content of different organs after maize harvest under different tillage measures (2024). Note: Values are means (±SE), and the mean values with the same letter are not significantly different at p < 0.05. CK: Downslope cultivation, SF: Subsoiling tillage, RF: ridge tillage and pitting field, RF-S: ridge tillage and pitting field + subsoiling tillage, TP: contour tillage, TP-S: contour tillage + subsoiling tillage, and TP-R: contour tillage + ridge tillage and pitting field.
Agronomy 15 02285 g009
Figure 10. Net primary productivity and the carbon loss in runoff under different tillage measures. Note: Values are means (±SE), and the mean values with the same letter are not significantly different at p < 0.05. CK: Downslope cultivation, SF: Subsoiling tillage, RF: ridge tillage and pitting field, RF-S: ridge tillage and pitting field + subsoiling tillage, TP: contour tillage, TP-S: contour tillage + subsoiling tillage, and TP-R: contour tillage + ridge tillage and pitting field.
Agronomy 15 02285 g010
Figure 11. Net ecosystem productivity and net ecosystem carbon balance under different tillage measures. Note: Values are means (±SE), and the mean values with the same letter are not significantly different at p < 0.05. CK: Downslope cultivation, SF: Subsoiling tillage, RF: ridge tillage and pitting field, RF-S: ridge tillage and pitting field + subsoiling tillage, TP: contour tillage, TP-S: contour tillage + subsoiling tillage, and TP-R: contour tillage + ridge tillage and pitting field.
Agronomy 15 02285 g011
Figure 12. Net carbon balance of cropland system under different tillage measures (NCF). Note: Values are means (±SE), and the mean values with the same letter are not significantly different at p < 0.05. CK: Downslope cultivation, SF: Subsoiling tillage, RF: ridge tillage and pitting field, RF-S: ridge tillage and pitting field + subsoiling tillage, TP: contour tillage, TP-S: contour tillage + subsoiling tillage, and TP-R: contour tillage + ridge tillage and pitting field.
Agronomy 15 02285 g012
Table 1. Basic properties of soil tested in the experimental area.
Total Nitrogen g·kg−1Alkaline Hydrolysis Nitrogen mg·kg−1Total Phosphorus g·kg−1Available Phosphorus mg·kg−1Available Potassium mg·kg−1Organic Matter g·kg−1pH
2.3154.40.940.1376.842.17.3
Table 2. Crop variety selection and fertilization standard.
Crop PlantCultivarNPK
MaizeDika 1563250 kg·ha−190 kg·ha−1120 kg·ha−1
SoybeanDongsheng 1735 kg·ha−160 kg·ha−130 kg·ha−1
Table 3. Tillage setting.
Cultivation TechniqueConcrete Operation
Down-slope cultivation (CK)Downslope Ridge-Tillage Integrated with Rotary Cultivation
Optimal tillage depth range for rotary cultivators: 12–16 cm
Subsoiling tillage (SF)Triple-Integrated Subsoiling, Rotary Cultivation, and Downslope Ridge-Tillage System
Cultivation Recommended Subsoiling Depth Range for Agricultural Operations: 35–45 cm
Optimal tillage depth range for rotary cultivators: 12–16 cm
Ridge to district field (RF)Triple-Integrated Rotary Cultivation, Downslope Ridge-Tillage, and Ridge Closure System
Optimal tillage depth range for rotary cultivators: 12–16 cm
Spacing maintained at ca. 75 cm with ridge closure finalized in late June
Ridge to district field + subsoiling tillage (RF-S)Quadruple-Integrated Subsoiling, Rotary Cultivation, Downslope Ridge-Tillage, and Ridge Closure System
Recommended Subsoiling Depth Range for Agricultural Operations: 35–45 cm
Optimal tillage depth range for rotary cultivators: 12–16 cm
Spacing maintained at ca. 75 cm with ridge closure finalized in late June
Transverse slope planting (TP)Integrated Rotary Tillage and Contour Ridge-Tillage System
Optimal tillage depth range for rotary cultivators: 12–16 cm
Transverse slope planting + ridge to district field (TP-R)Triple-Integrated Rotary Tillage, Contour Ridge-Tillage, and Ridge Closure System
Optimal tillage depth range for rotary cultivators: 12–16 cm
Spacing maintained at ca. 75 cm with ridge closure finalized in late June
Transverse slope planting + subsoiling tillage (TP-S)Triple-Integrated Subsoiling, Rotary Cultivation, and Contour Ridge-Tillage System
Cultivation Recommended Subsoiling Depth Range for Agricultural Operations: 35–45 cm
Optimal tillage depth range for rotary cultivators: 12–16 cm
Table 4. Farmland input carbon emission coefficient.
Agricultural Material InputsDischarge Ratio (kg C·kg−1)Source of Parameters
Maize seed1.05Lal, R [32]
Soybean seed0.25West and Marland [33]
Diesel oil0.94West and Marland [33]
Nitrogen fertilizer (N)1.74Lu, F [34]
Phosphate fertilizer (P2O5)0.2Lal, R., West and Marland [32,33]
Potash fertilizer (K2O)0.15Lal, R., West and Marland [32,33]
Pesticide4.93West and Marland [33]
Herbicide6.3Lal, R [32]
Table 5. Farmland input carbon emissions in 2022 and 2024 (maize).
RegimeCAPi (kg·ha−1)CAP (kg·ha−1)
Diesel OilNitrogen FertilizerPhosphate FertilizerPotash FertilizerMaize SeedPesticideHerbicide
TP-S56.4435.018.018.023.82.57.6561.2
TP34.3435.018.018.023.82.57.6539.1
RF-S69.6435.018.018.023.82.57.6574.4
TP-R47.5435.018.018.023.82.57.6552.3
RF47.435.018.018.023.82.57.6552.3
SF56.4435.018.018.023.82.57.6561.2
CK34.3435.018.018.023.82.57.6539.1
Table 6. Farmland input carbon emissions in 2023 (soybean).
RegimeCAPi (kg·ha−1)CAP (kg·ha−1)
Diesel OilNitrogen FertilizerPhosphate FertilizerPotash FertilizerSoybean SeedsPesticideHerbicide
TP-S56.460.912.04.515.92.56.6158.8
TP34.360.912.04.515.92.56.6136.7
RF-S69.660.912.04.515.92.56.6172.0
TP-R47.560.912.04.515.92.56.6149.9
RF47.560.912.04.515.92.56.6149.9
SF56.460.912.04.515.92.56.6158.8
CK34.360.912.04.515.92.56.6136.7
Disclaimer/Publisher’s Note: The statements, opinions and data contained in all publications are solely those of the individual author(s) and contributor(s) and not of MDPI and/or the editor(s). MDPI and/or the editor(s) disclaim responsibility for any injury to people or property resulting from any ideas, methods, instructions or products referred to in the content.