Article

Cytosolic Fructose-1,6-bisphosphate Aldolases Modulate Primary Metabolism and Phytohormone Homeostasis in Soybean

1
College of Life Sciences, Fujian Agriculture and Forestry University, Fuzhou 350002, China
2
Guangdong Provincial Key Laboratory of Plant Adaptation and Molecular Design, Innovative Center of Molecular Genetics and Evolution, School of Life Sciences, Guangzhou University, Guangzhou 510006, China
3
FAFU-UCR Joint Center for Horticultural Biology and Metabolomics, Haixia Institute of Science and Technology, Fujian Agriculture and Forestry University, Fuzhou 350002, China
4
College of Resources and Environment, Fujian Agriculture and Forestry University, Fuzhou 350002, China
*
Author to whom correspondence should be addressed.
Agronomy 2023, 13(5), 1383; https://doi.org/10.3390/agronomy13051383
Submission received: 9 April 2023 / Revised: 10 May 2023 / Accepted: 14 May 2023 / Published: 16 May 2023
(This article belongs to the Special Issue New Advances in Soybean Molecular Biology)

Abstract

:
Fructose-1,6-bisphosphate aldolase (FBA) is an important catalytic enzyme in carbon metabolism and plays an important role in plant growth and development. Currently, the biological functions of FBA in soybean (Glycine max) remain unknown. In this study, we conducted research on FBA in soybean and identified 14 GmFBA genes. Among them, GmFBAc1 and GmFBAc2 are broadly expressed in different tissues. Double mutant lines of GmFBAc1 and GmFBAc2 were obtained by CRISPR-Cas9 gene editing technology. Compared with the wild type, the double-gene homozygous mutant gmfbac1gmfbac2 exhibited dwarf seedlings and narrow leaflets, indicating that GmFBAc1 and GmFBAc2 are critical for soybean growth and development. The gmfbac1gmfbac2 metabolomic analysis revealed that compared to the wild type, carbohydrate metabolism was reduced and amino acid metabolism was enhanced in gmfbac1gmfbac2 mutant leaves. Transcriptomic analysis showed that genes in IAA signaling and JA signaling were downregulated and upregulated, respectively. Our study demonstrates an important role of GmFBAc1 and GmFBAc2 in modulating carbon metabolism and phytohormone homeostasis.

1. Introduction

Glycolysis is a fundamental pathway catalyzing the conversion of glucose to pyruvate, providing substrates and energy for downstream reactions. Plants have duplicated glycolytic pathways in plastid and cytoplasm [1]. In plants, glycolytic genes play important roles in regulating growth and development [2,3,4]. Fructose-1,6-bisphosphate aldolase (EC 4.1.2.13, FBA) is an important glycolytic enzyme in plant [5]. FBA catalyzes a reversible conversion of fructose-1,6-bisphosphate (FBP) to glyceraldehyde-3-phosphate (G3P) and dihydroxyacetone phosphate (DHAP), which is the unique reaction in the glycolysis pathway that involves a change in carbon chain length [5].
FBA gene family has a crucial role in physiological and biochemical processes influencing crop yield and quality [6]. Eight FBA genes were involved in FBA family of Arabidopsis thaliana, three AtFBA genes (AtFBA1-AtFBA3) were located in the plastid and five AtFBA genes (AtFBA4-AtFBA8) were located in the cytoplasm [7]. The fba1 mutant had slight phenotypic differences compared to the wild type (WT), while both the fba2 and fba3 mutants exhibit significant reductions in biomass [8]. When both AtFBA1 and AtFBA2 were simultaneously knocked out, photosynthetic autotrophic growth was blocked and the mutant was lethal. Overexpression of AtFBA2 in Arabidopsis plants enhanced photosynthetic capacity and biomass production [9]. In tomato, eight FBA genes were identified, and the expression of SlFBA7 increased the rate of photosynthesis and biomass [10]. There were four genes encoding FBA protein in Camellia oleifera, and preliminary evidence were obtained through overexpression or RNAi inhibition of CoFBA1 in Arabidopsis thaliana and Brassica napus, indicating that plastidial CoFBA1 can promote plant growth [11]. In potato, significant inhibition of plant growth and yield, as well as leaf curling and premature aging, could be observed when the activity of FBA was reduced [12]. Three FBA genes were identified in Chlamydomonas reinhardtii, which is different from higher plants in that there are no two sets of glycolytic pathways located in the cytoplasm and plastids, and CrFBAs are located only in the plastid [13]. Overexpression of CrFBA1 promotes starch degradation and accumulation of fatty acids, indicating that CrFBA plays an important regulatory role in starch accumulation [13,14]. These indicated that plastidic FBA mainly affects plant growth by regulating photosynthesis.
In contrast to plastidial FBA, the function of cytosolic FBA is more complex and variable. In Arabidopsis, after knocking out AtFBA8 the mutant plants also showed retarded growth [15]. AtFBA8 could interact with actin to participate in the opening and closing of guard cells in response to changes in environmental humidity, and this process was independent of its catalytic activity. Moreover, although lacking a typical nuclear localization sequence, AtFBA6 could enter the nucleus by interacting with thioredoxin [16]. In response to heat stress, AtFBA6 played an irreplaceable role in the memory of heat stress in the shoot apical meristem of Arabidopsis [17]. These results indicated that cytosolic FBAs have diverse functions in plants, but the research on cytosolic FBA is rare. As cytosolic FBA plays an important role in the glycolysis, the phenotypic changes caused by its mutation were conventionally attributed to impaired energy metabolism, but the specific mechanism behind this has not been fully elucidated.
Soybean (Glycine max (L.) Merr.) is a very important crop for food and oil production in the world. In reference to other plants, FBAs are good candidates for improving yield, but limited information of GmFBAs is known [9,10,18,19]. In this study, we characterized the GmFBA gene family, and identified 14 FBA genes in the soybean genome. We found that GmFBAc1 and GmFBAc2 are widely expressed among tissues. The GmFBAc1 and GmFBAc2 double mutant showed a dwarf seedlings phenotype with narrow leaflet. Metabolomic and transcriptomic analyses revealed that the disruption of primary metabolism balance and disturbance of plant hormone homeostasis are associated with the aberrant leaf growth in the double mutants of GmFBAc1 and GmFBAc2. This study serves as a foundation for subsequent theoretical research and production breeding.

2. Materials and Methods

2.1. Plant Material and Growth Conditions

Soybean (Glycine max) cultivar Huachun-6 was used in this study. Seeds were surface sterilized by the chlorine gas method and germinated on sterilized and soaked vermiculite. The seedlings were watered with nutrient solution every two days. The composition of nutrient solution is as follows: Ca(NO3)2 0.12 mM, KNO3 0.19 mM, MgCl2 2.5 µM, MgSO4 0.5 mM, K2SO4 1 mM, MnSO4 0.5 µM, ZnSO4 1.5 µM, CuSO4 0.5 µM, (NH4)·Mo7O24 0.15 µM, KH2PO4 0.25 mM, NaB4O7 0.25 µM, Fe·EDTA 0.04 mM, (NH4)2SO4 0.05 mM, and CaCl2 1.2 mM. The pH was adjusted to pH 5.8 with 1 M KOH. Soybean plants were grown in a growth chamber under the following conditions: light intensity of 450 µmol photons m−2 s−1, 14 h light at 28 °C and 10 h dark at 24 °C, humidity 65%. The second compound leaf from the top downwards of 20-days-old seedlings was obtained for the comparative experiments between wild type and mutants. Two genotypes of homozygous gmfbac1gmfbac2 double mutants were used in this study.

2.2. Genome-Wide Identification of FBA Gene Family and Phylogenetic Analysis

The FBA gene family information was collected using the Arabidopsis Information Resource (TAIR) (https://www.arabidopsis.org/ (accessed on 30 August 2022)) for A. thaliana. The JGI Phytozome website (https://phytozome-next.jgi.doe.gov/ (accessed on 7 May 2023)) was used to compare the homology of amino acids, candidate FBA proteins of soybean, Medicago truncatula and Lotus japonicus with high homologous correlation with A. thaliana FBA proteins [20,21]. Moreover, the FBA genes were identified via the NCBI database (https://www.ncbi.nlm.nih.gov/ (accessed on 7 May 2023)) BLAST feature. The amino acid sequences of FBAs proteins from G. max, A. thaliana, Medicago truncatula and Lotus japonicus were selected to test the most suitable model using the online tool MAFFT version 7 (https://mafft.cbrc.jp/alignment/server/ (accessed on 7 May 2023)) to construct a maximum likelihood model [22]. The robustness of each tree node was calculated using 100 bootstrap replicates, with default remaining parameters.

2.3. Analysis of Expression Pattern and Subcellular Localization

Different tissues of soybean seedling were obtained for testing GmFBAs expression, and the expression results were obtained through quantitative real time PCR (RT-qPCR). Total RNA was extracted from plant tissues using E.Z.N.A.® RNA Extraction Kit (OMEGA Bio-Tek, Norcross, GA, USA) according to the manufacturer`s instructions. Oligo dT-primed cDNA was synthesized from 1 µg of total RNA using the PrimeScriptTM RT Reagent Kit with gDNA Eraser (Takara, Beijing, China). RT-qPCR analysis was performed with the SYBR® Premix Ex TaqTM II ROX Plus Kit (Takara). The relative levels of each transcript were calculated after normalization to the GmTefs1 (Glyma.17G186600) endogenous reference gene, and relative expression levels in comparative experiments were calculated using the 2−ΔΔCT method. The primers used for qPCR analyses are provided in Supplementary Table S1. GV3101 harboring pGWB505 inserted GmFBAc1/GmFBAc2 CDS fragments were used for tobacco leaves transient transfection. For fluorescence imaging, square pieces of tobacco leaves were mounted in water and then examined using a water-immersion lens on a Zeiss LSM 880 laser scanning confocal microscope.

2.4. Vector Construction and Plant Transformation

Expression vector construction of GmFBAc1 and GmFBAc2 was using Gateway technology (Invitrogen, Waltham, MA, USA). Entry vectors were generated in the pDonr221 vector, and pGWB505 vectors were used for 35S:GmFBAc-GFP fusion. For mutant creation, one sgRNA were designed targeting both of GmFBAc1 and GmFBAc2 coding regions. Vector construction were performed as described with pGES201 [23]. With respect to soybean stable transformation, plasmids were transformed into Agrobacterium tumefaciens strain GV3101. The Agrobacterium tumefaciens-mediated transformation procedure of the soybean cultivar Huachun-6 followed a previously published protocol [24]. Three genotypes of gmfbac1gmfbac2 double mutants were isolated from three independent transgenic lines and validated by Sanger sequencing.

2.5. Determination of FBA Enzyme Activity and Observation of Epidermal Cells of Leaves

Kit (FBA-2-G) (Suzhou Comin Biotechnology Co., Suzhou, China) was used to determine FBA enzyme activity. Observation of epidermal cells of leaves followed Meizi Xu`s method [25]. Using a mixture of ethanol and acetic acid as a solvent (ethanol:acetic acid = 4:1) decolorized the leaves, and then treated them with a 60% ethanol solution containing 7% sodium hydroxide. Rinsed the leaves with a 40% ethanol solution and observed the epidermal cells of the leaves by using a DIC microscope. Image J software was used to measure the epidermal cells area of leaves.

2.6. Metabolomic Analysis and Determination of Phytohormone Content

For metabolomic analysis, sample extraction was performed as previously described [26]. A 10 mg lyophilized leaves samples were added with 1 mL extraction buffer of chloroform, methanol and water (5:2:2 = v:v:v), then 12 μL ribitol (1 mg/mL) was added as inner standard. For each genotype, 5 biological replicates were analyzed. Among every 5 tested samples, 1 quality control sample (mixture of all tested samples) was also injected. GC-TOF-MS profiling was performed using a 1 μL injection by auto-sampler onto a capillary column (Restek Rxi®-5Sil MS (30 m × 0.25 μm × 0.25 μm)) (RESTEK Co., Bellefonte, PA, USA), and Agilent 7890B gas chromatograph (Agilent Co., Santa Clara, CA, USA) mounted to a Pegasus HT time-of-flight mass spectrometer (LECO Co., Saint Joseph, MI, USA). KEGG pathway enrichment of differential metabolites utilized MBROLE 2.0 (http://csbg.cnb.csic.es/mbrole2/index.php (accessed on 30 December 2022)) [27]. Phytohormone extraction and measurement were performed as described previously with modifications [28]. Briefly, fresh leaf material was ground into powder in liquid nitrogen. A 50 mg of the powder was weighed into a 1.5 mL centrifuge tube and mixed with 900 μL of ethyl acetate and 100 μL of isotopic internal standards (final concentration of 10 ng/mL [2H6]-JA, 10 ng/mL [2H4]-SA, 10 ng/mL [2H6]-ABA, and 2.5 ng/mL [13C6]-IAA). After the sample was thoroughly mixed, it was sonicated at 4 °C and then centrifuged at 14,000× g for 3 min at 4 °C. The supernatant was evaporated to complete dryness using a cold trap concentrator. The dried extract was reconstituted in 200 μL of 70% (v/v) methanol and filtered through a 0.22 μm PVDF filter and analyzed by UPLC-QqQ MS for data acquisition.

2.7. Transcriptomic Analysis

Total RNA was used as input material for the RNA sample preparations. Sequencing libraries were generated using NEBNext® UltraTM RNA Library Prep Kit for Illumina® (NEB, USA) following manufacturer’s recommendations and index codes were added to attribute sequences to each sample. The qualified libraries were pooled and sequenced on Illumina platforms with PE150 strategy. Trimmomatic v0.39 was used to assess the quality control of raw RNA-seq reads, trim adapter sequences, and remove low-quality reads [29]. The clean reads were aligned to the cultivated soybean Wm82 v4 reference genome using HISAT2 v2.1.0 [30,31]. The number of reads mapping to each gene and normalized expression value (FPKM) was calculated by StringTie v1.3.6 [32]. Read count was used to perform differentially expression analysis using DESeq2 v1.34 with a false discovery rate (FDR) < 0.05 and |log2(fold-change)| ≥ 1 between treatment and control groups [33]. The online platform KOBAS was applied to perform KEGG enrichment analysis [34].

3. Results

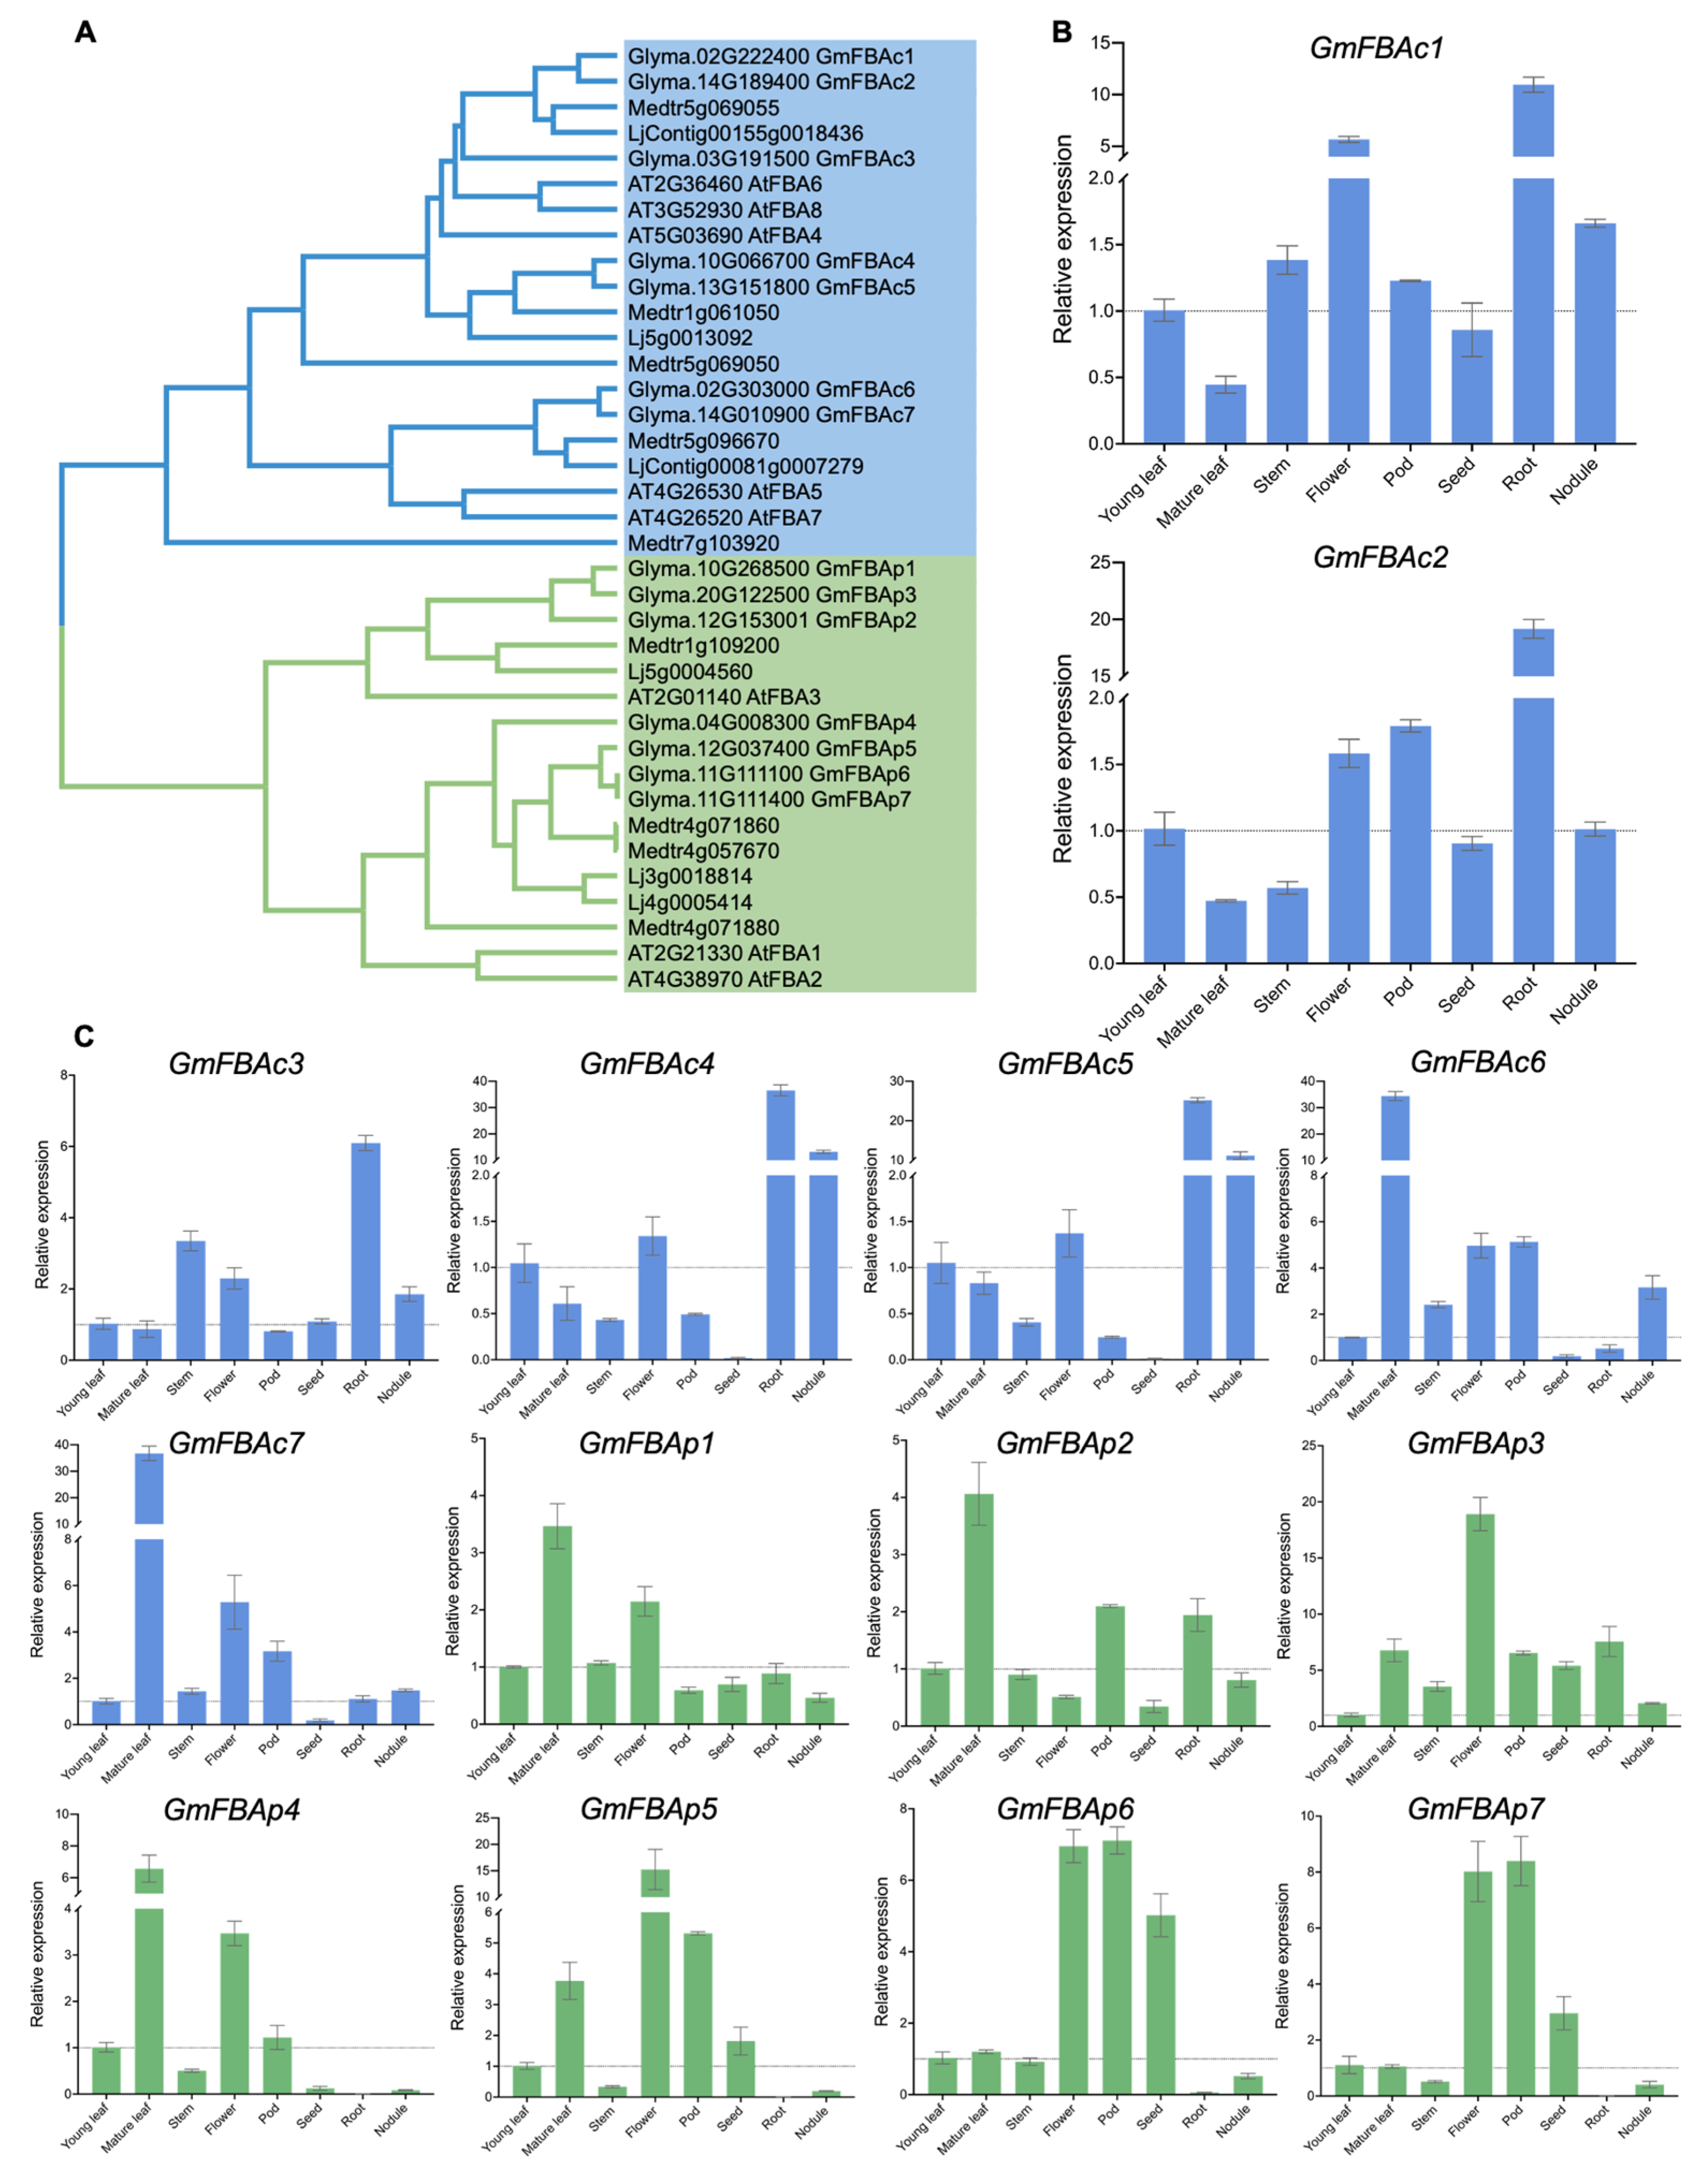
3.1. Identification and Phylogenetic Analysis of GmFBAs Gene Family

We identified 14 GmFBA gene family members in the soybean genome using BLAST against the Phytozome v.13 database. From the alignments of predicted FBA proteins, an unrooted phylogenetic tree was constructed. All FBA members were clustered into two groups, cytosolic FBA and plastid FBA. GmFBAc1 to GmFBAc7 and GmFBAp1 to GmFBAp7 were designated in accordance with the tree (Figure 1A). In these GmFBAs genes, excepting GmFBAp2, the coding proteins are composed of 357 to 399 amino acids in length. GmFBAp2 consisting of 153 amino acids is due to early termination of translation (Figure S1). Hence, GmFBAp2 may not have complete aldolase function.

3.2. Differential Expression Profiles of GmFBAs Genes

RT-qPCR was used to determine 14 GmFBAs expression in these materials. As shown in Figure 1B, GmFBAc1 and GmFBAc2 were broadly expressed in most tissues. GmFBAc4 and GmFBAc5 were specifically expressed in roots and root nodules, and GmFBAc6 and GmFBAc7 were mainly expressed in mature leaf (Figure 1C). In addition, GmFBAps were primarily expressed in photosynthetic tissues and reproductive organs (Figure 1C). These results suggested various expression pattern and potential biological function of GmFBA isoforms.

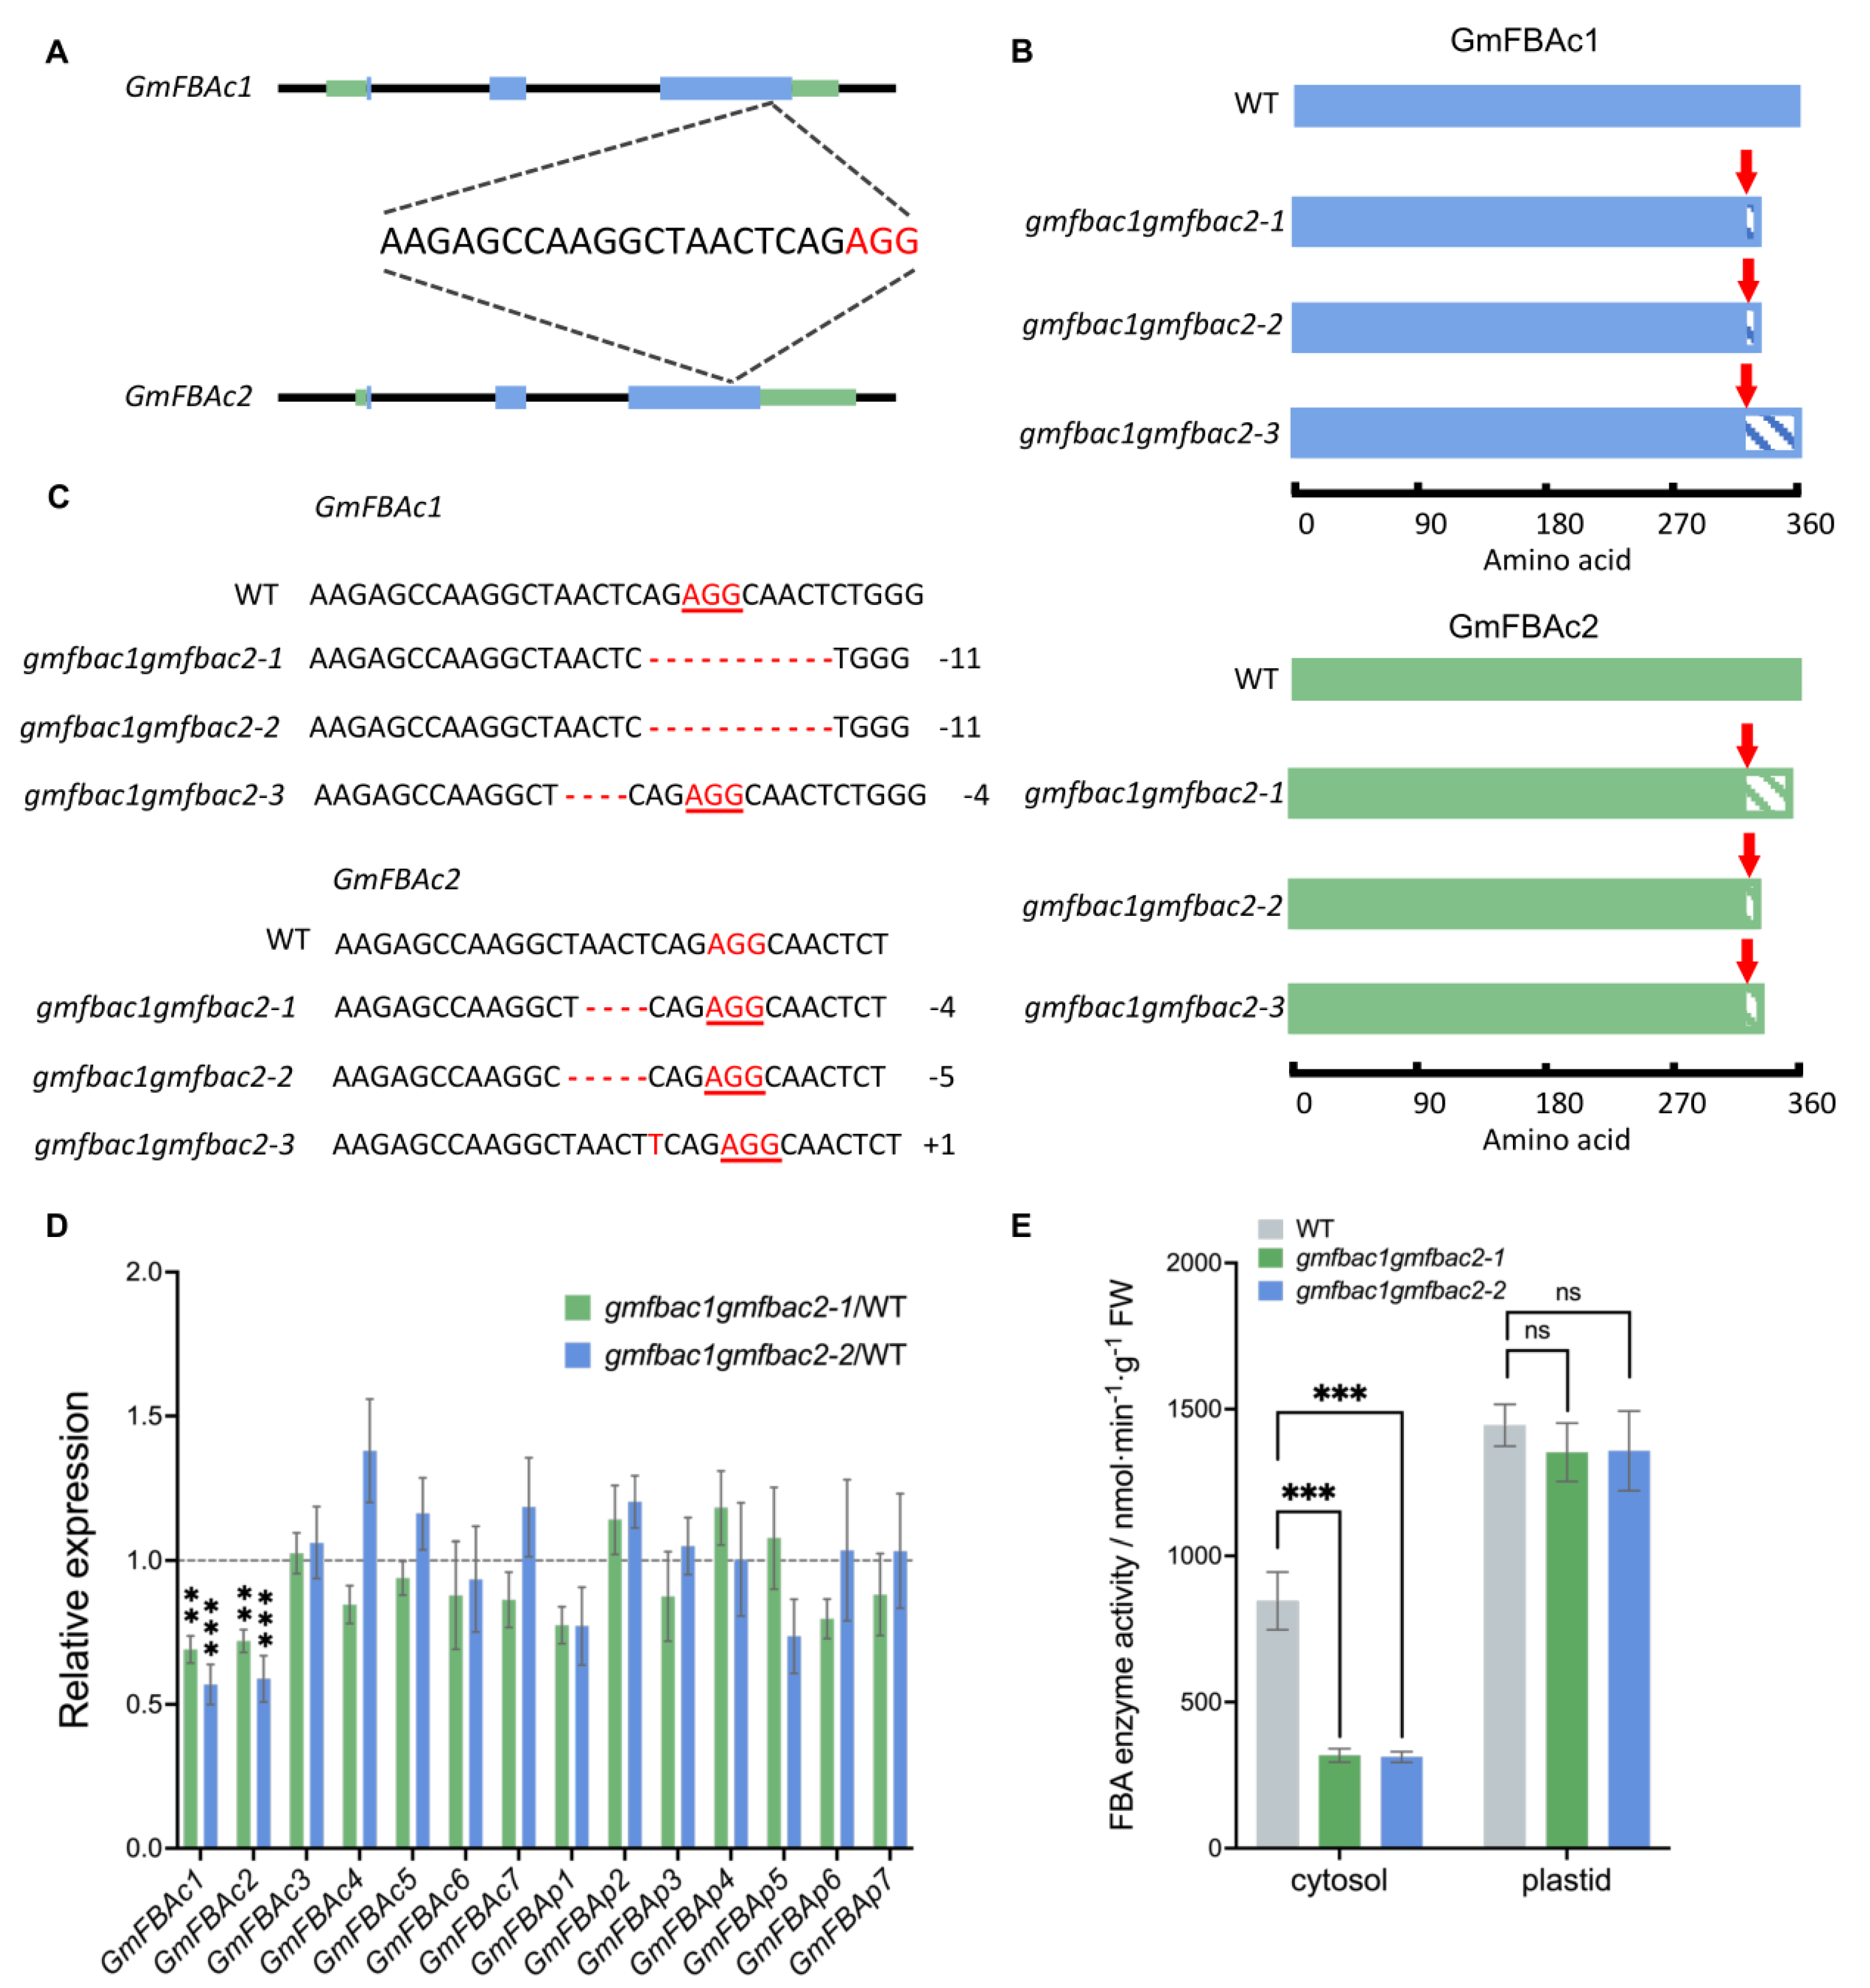
3.3. Generation of gmfbac1gmfbac2 Double Mutants

We next focused on elucidating the function of the two predominant cytosolic GmFBAs, GmFBAc1 and GmFBAc2. The subcellular localization of GmFBAc1 and GmFBAc2 were validated by GFP fusion and transient expression in tobacco epidermal cells (Figure S2). Considering the high homology of these two genes, we performed CRISPR-Cas9 to generate double mutants of GmFBAc1 and GmFBAc2 (Figure 2A). A single sgRNA targeting the conserved domain of GmFBAc1 and GmFBAc2 was designed and stable transformation was performed with Huachun-6 cultivar (Figure 2C). In T2 progenies, three gmfbac1gmfbac2 lines were obtained with frameshift mutations in the highly conserved C-terminus domain that is necessary for the catalytic activity of eukaryotic FBA (Figure 2B) [35,36]. The gmfbac1gmfbac2-1 carried 11 bp deletion in GmFBAc1 and 4 bp deletion in GmFBAc2. The gmfbac1gmfbac2-2 carried 11 bp deletion in GmFBAc1 and 5 bp deletion in GmFBAc2. The gmfbac1gmfbac2-3 carried 4 bp deletion in GmFBAc1 and 1 bp insertion in GmFBAc2. The RT-qPCR results showed that the expression of GmFBAc1 and GmFBAc2 was decreased in the gmfbac1gmfbac2 leaves (Figure 2D), and the enzyme activity of FBA in gmfbac1gmfbac2 leaves was decreased comparing to enzyme activity of FBA in WT leaves (Figure 2E). Additionally, the potential off-target sites of sgRNA were sequenced, and no off-target event was detected. Therefore, we generated gmfbac1gmfbac2 mutant lines by CRISPR-Cas9 for functional characterization.

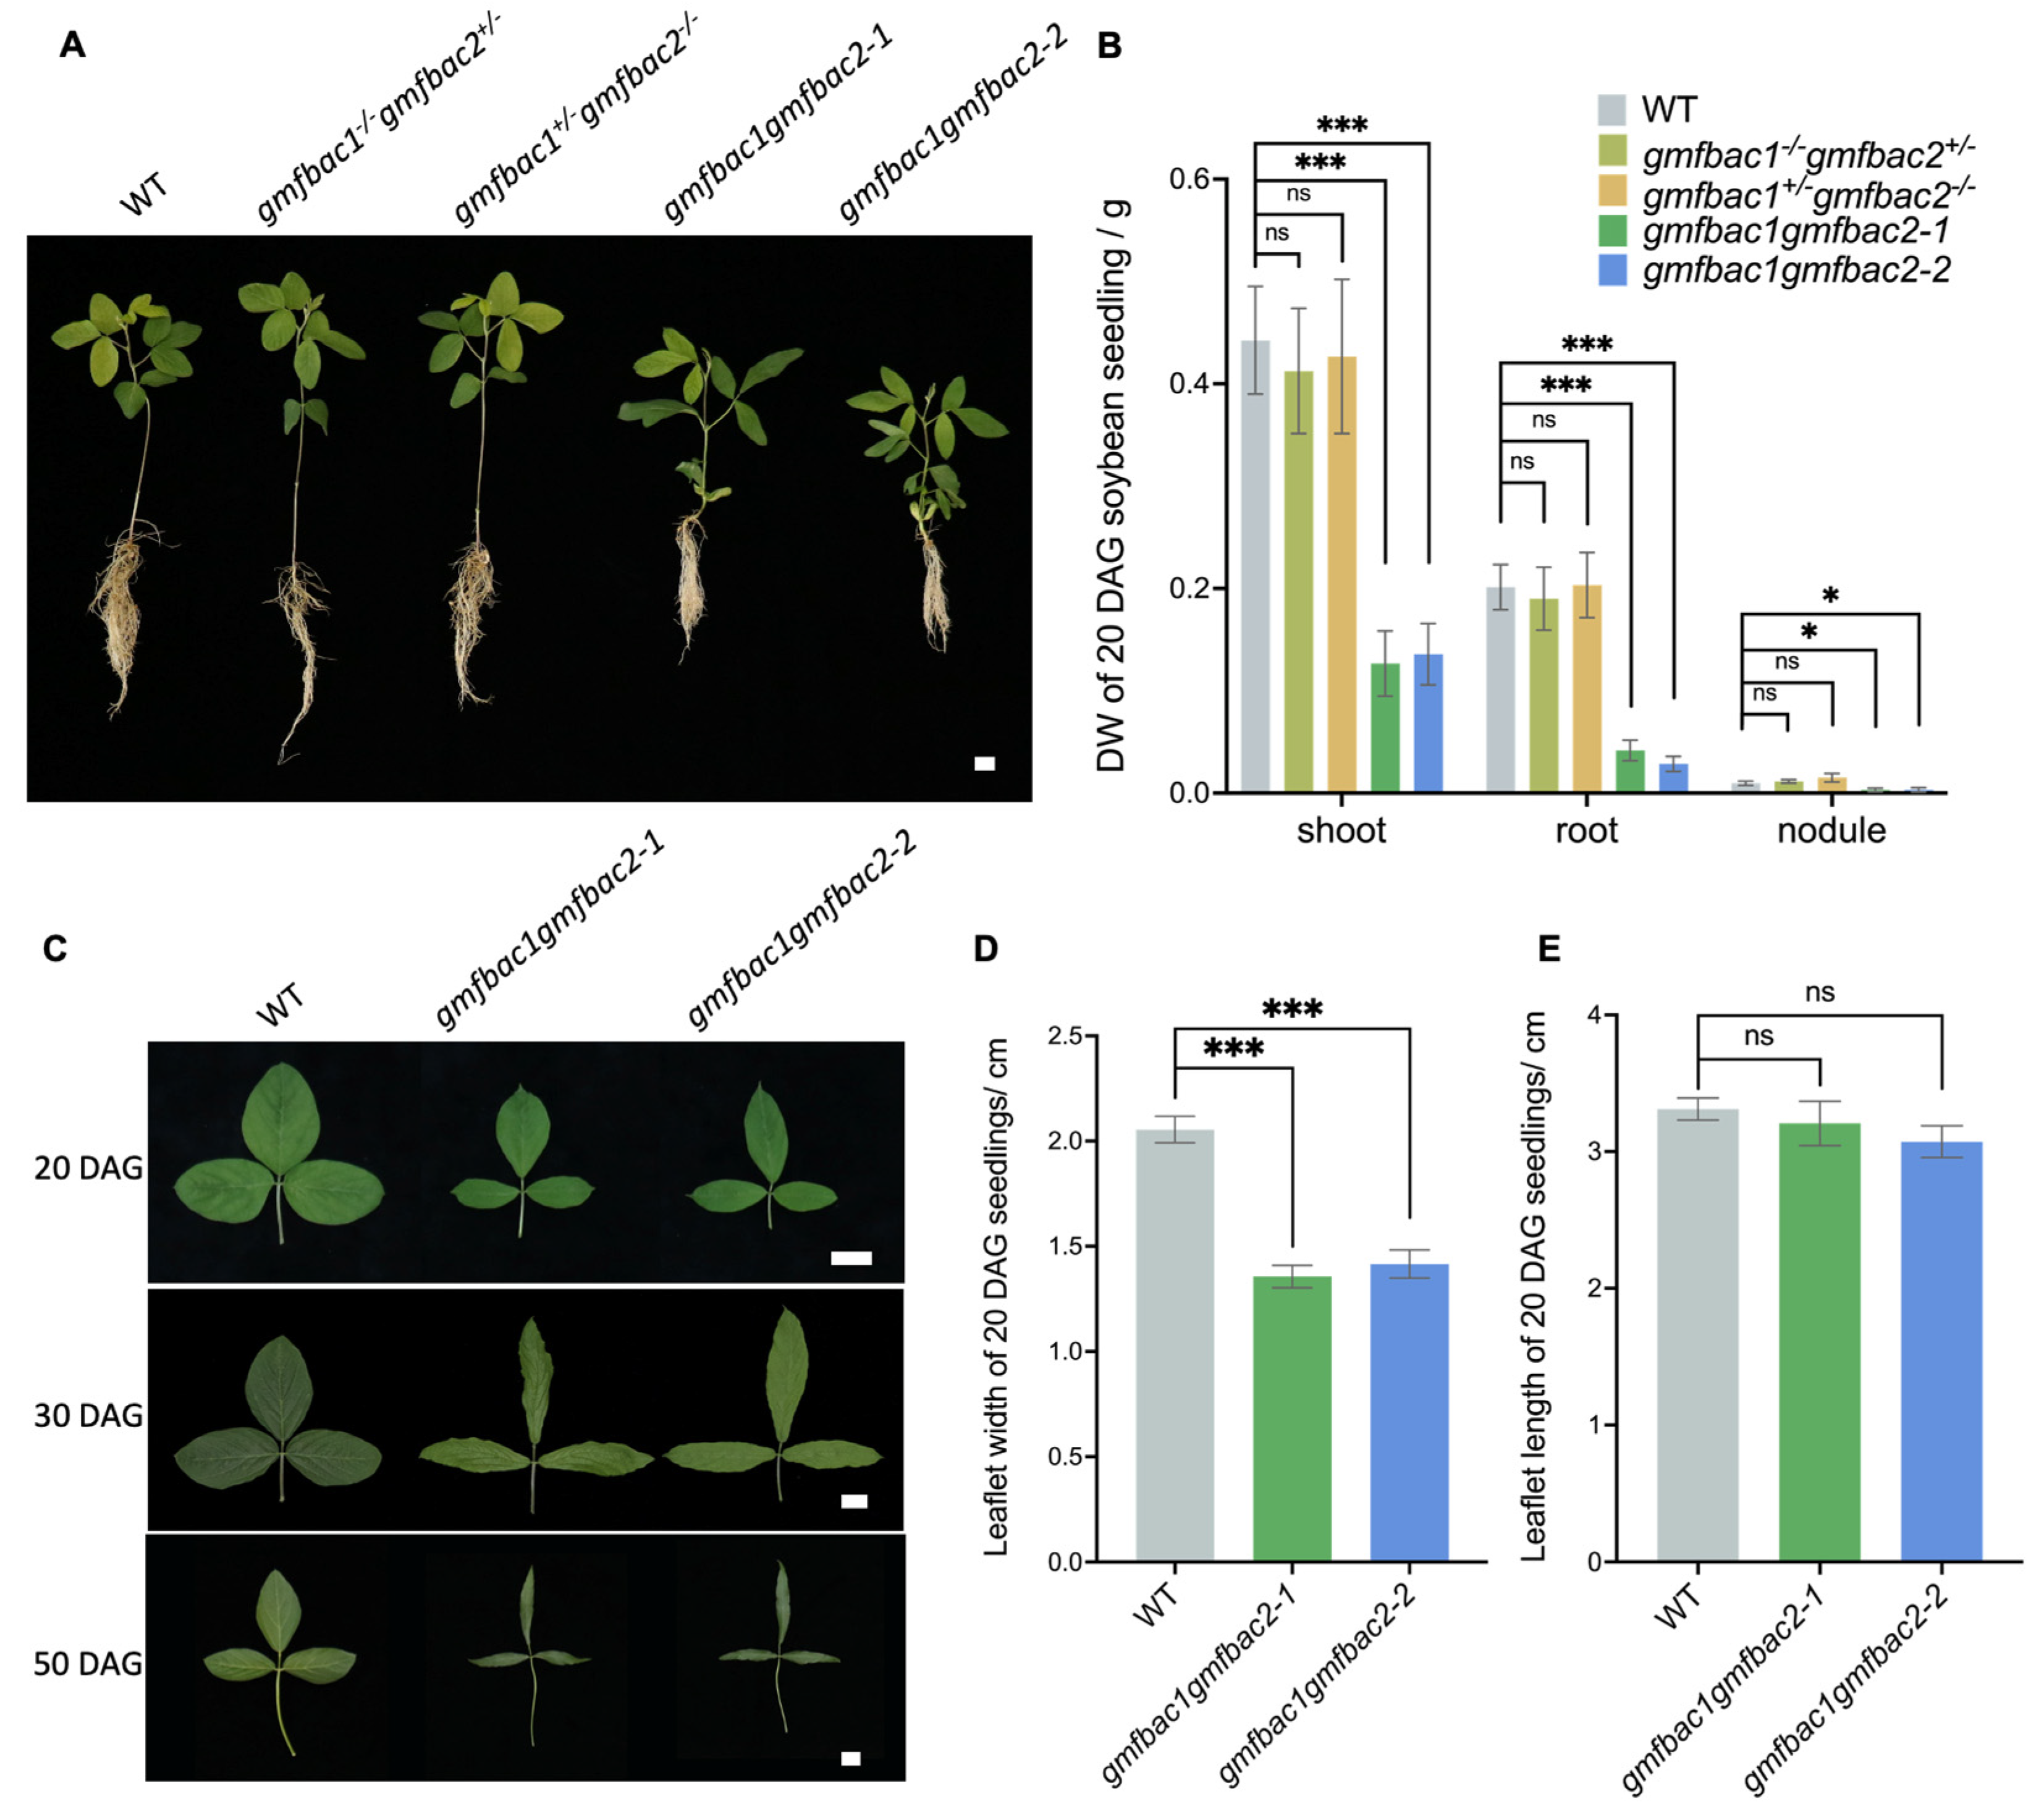
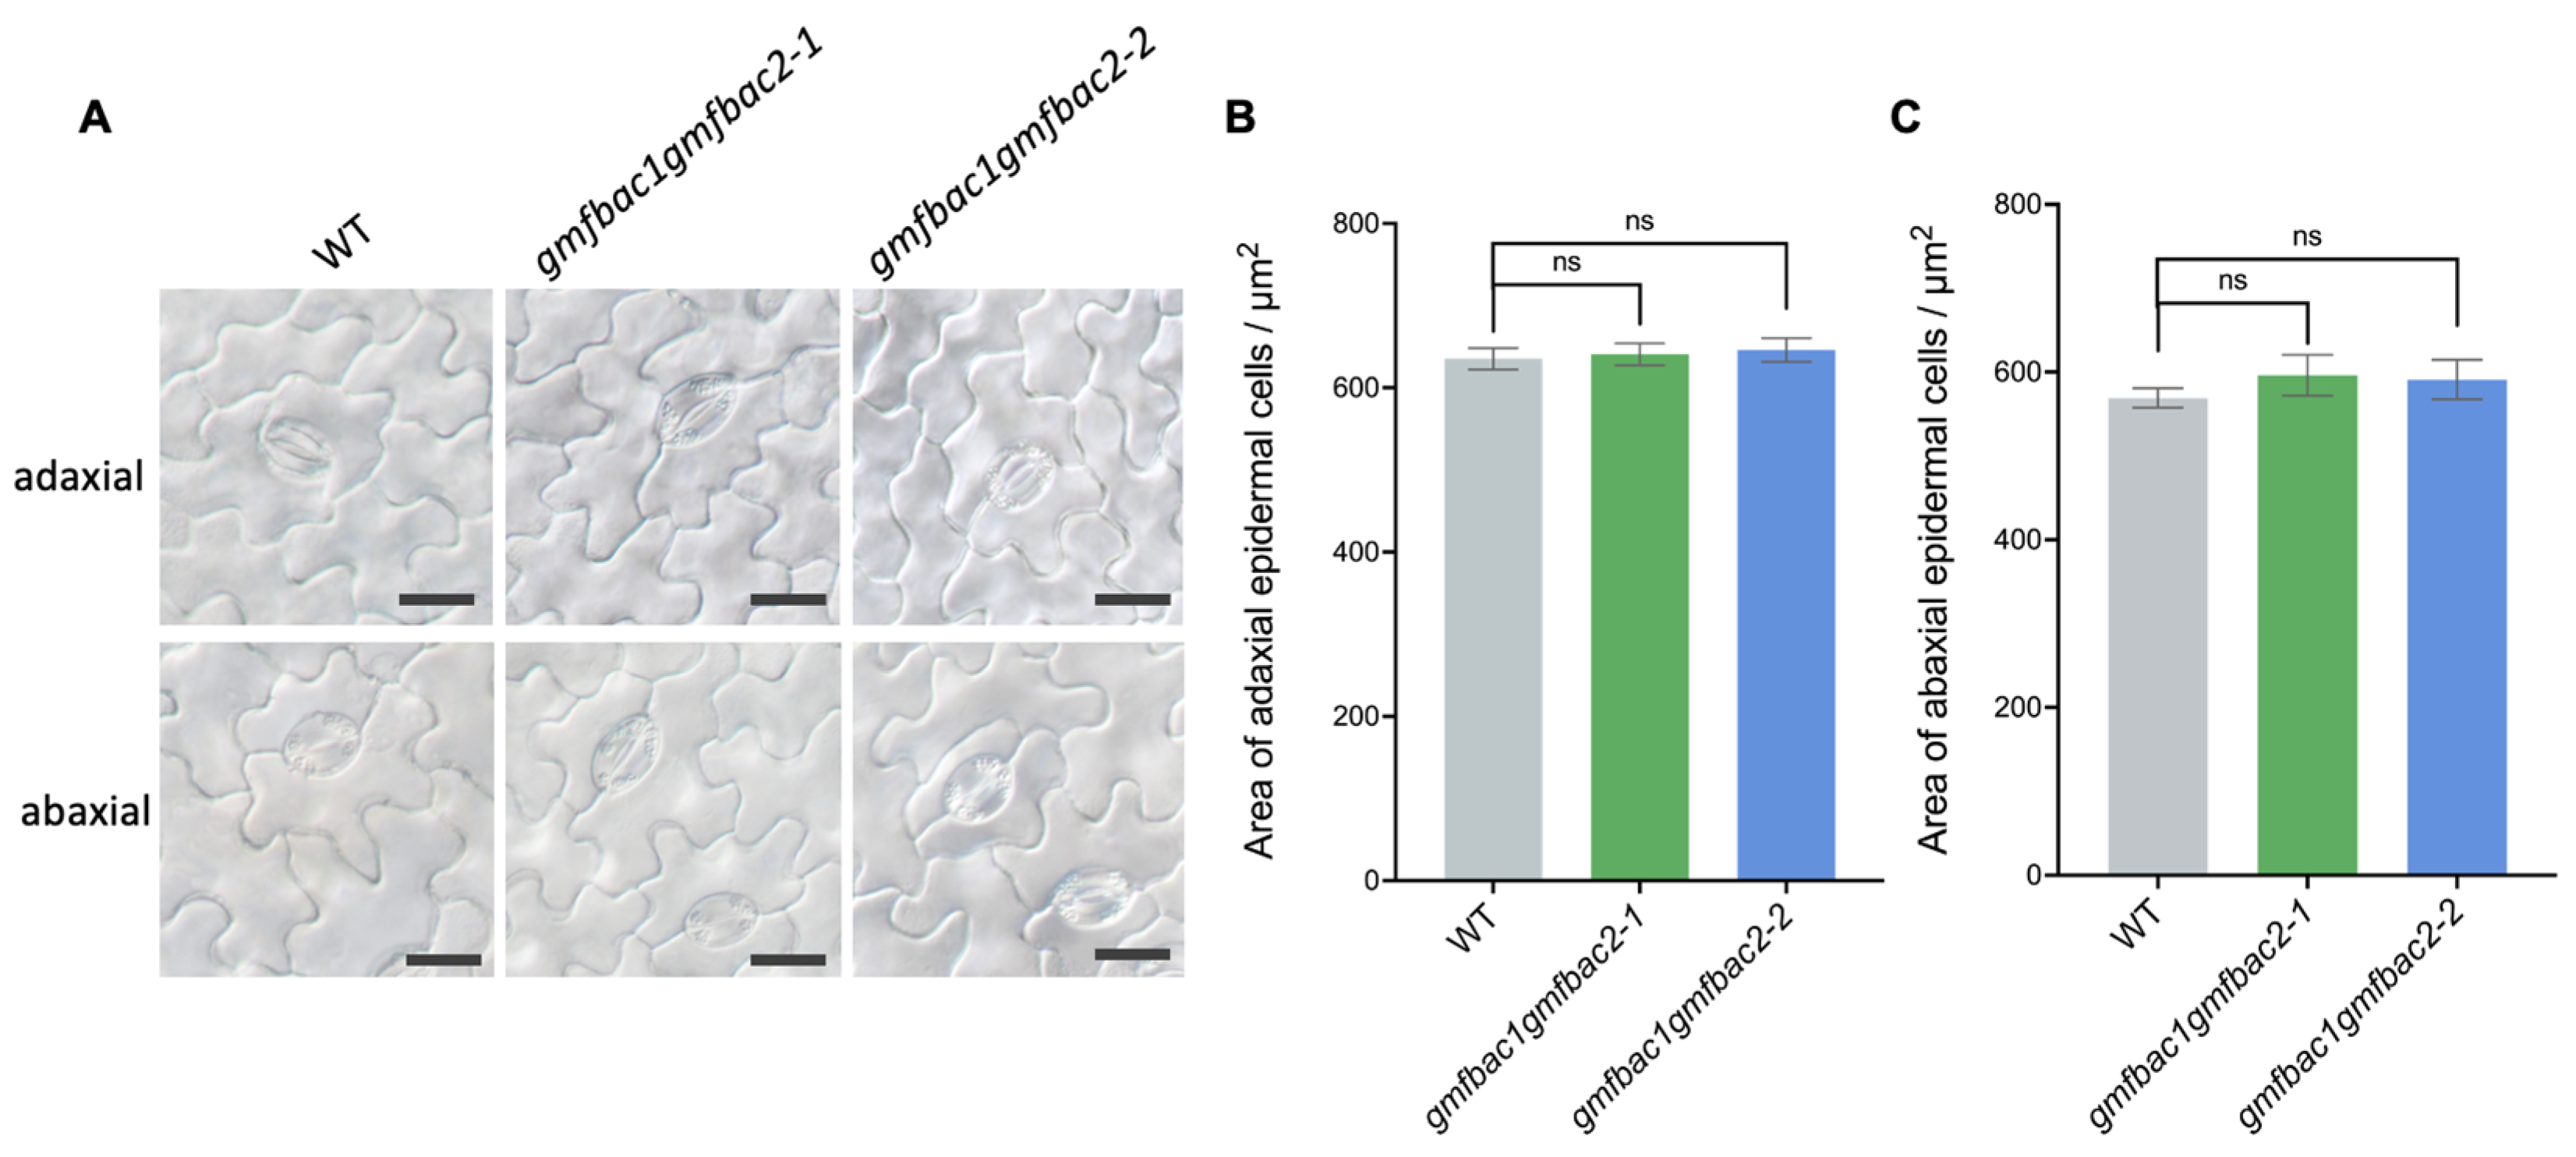
3.4. Phenotypes of Retarded Vegetative Growth in gmfbac1gmfbac2

The homozygous mutant gmfbac1gmfbac2 showed stunted growth after germination. At 5 days after germination (DAG), the WT seedlings grew the first pair of leaves, while the cotyledons of the gmfbac1gmfbac2 seedlings were still not fully expended (Figure S3). At 20 DAG gmfbac1gmfbac2 seedlings showed a dwarf phenotype, and the biomass was significantly lower than that of WT (Figure 3A,B). Moreover, the leaflets of gmfbac1gmfbac2 were narrower than leaflets of WT (Figure 3C and Figure S4). The leaflet length was similar between gmfbac1gmfbac2 and WT (Figure 3D,E). These phenotypes were observed in homozygotes gmfbac1gmfbac2, but not in heterozygote gmfbac1+/−gmfbac2−/− and gmfbac1−/−gmfbac2+/−, indicating that GmFBAc1 and GmFBAc2 play a redundant role in modulating soybean growth.
To elucidate whether the narrowing of the leaflets of gmfbac1gmfbac2 is caused by the reduced cell size or cell proliferation, we observed the morphology of adaxial and abaxial epidermal cells of leaflets by DIC microscope. Compared with the WT, there was no significant change in the morphology or the area of single epidermal cells in the narrow leaflets of gmfbac1gmfbac2 (Figure 4A–C). Therefore, the narrow leaflet of gmfbac1gmfbac2 mutant may be caused by a reduced cell number, rather than the reduction in cell sizes.

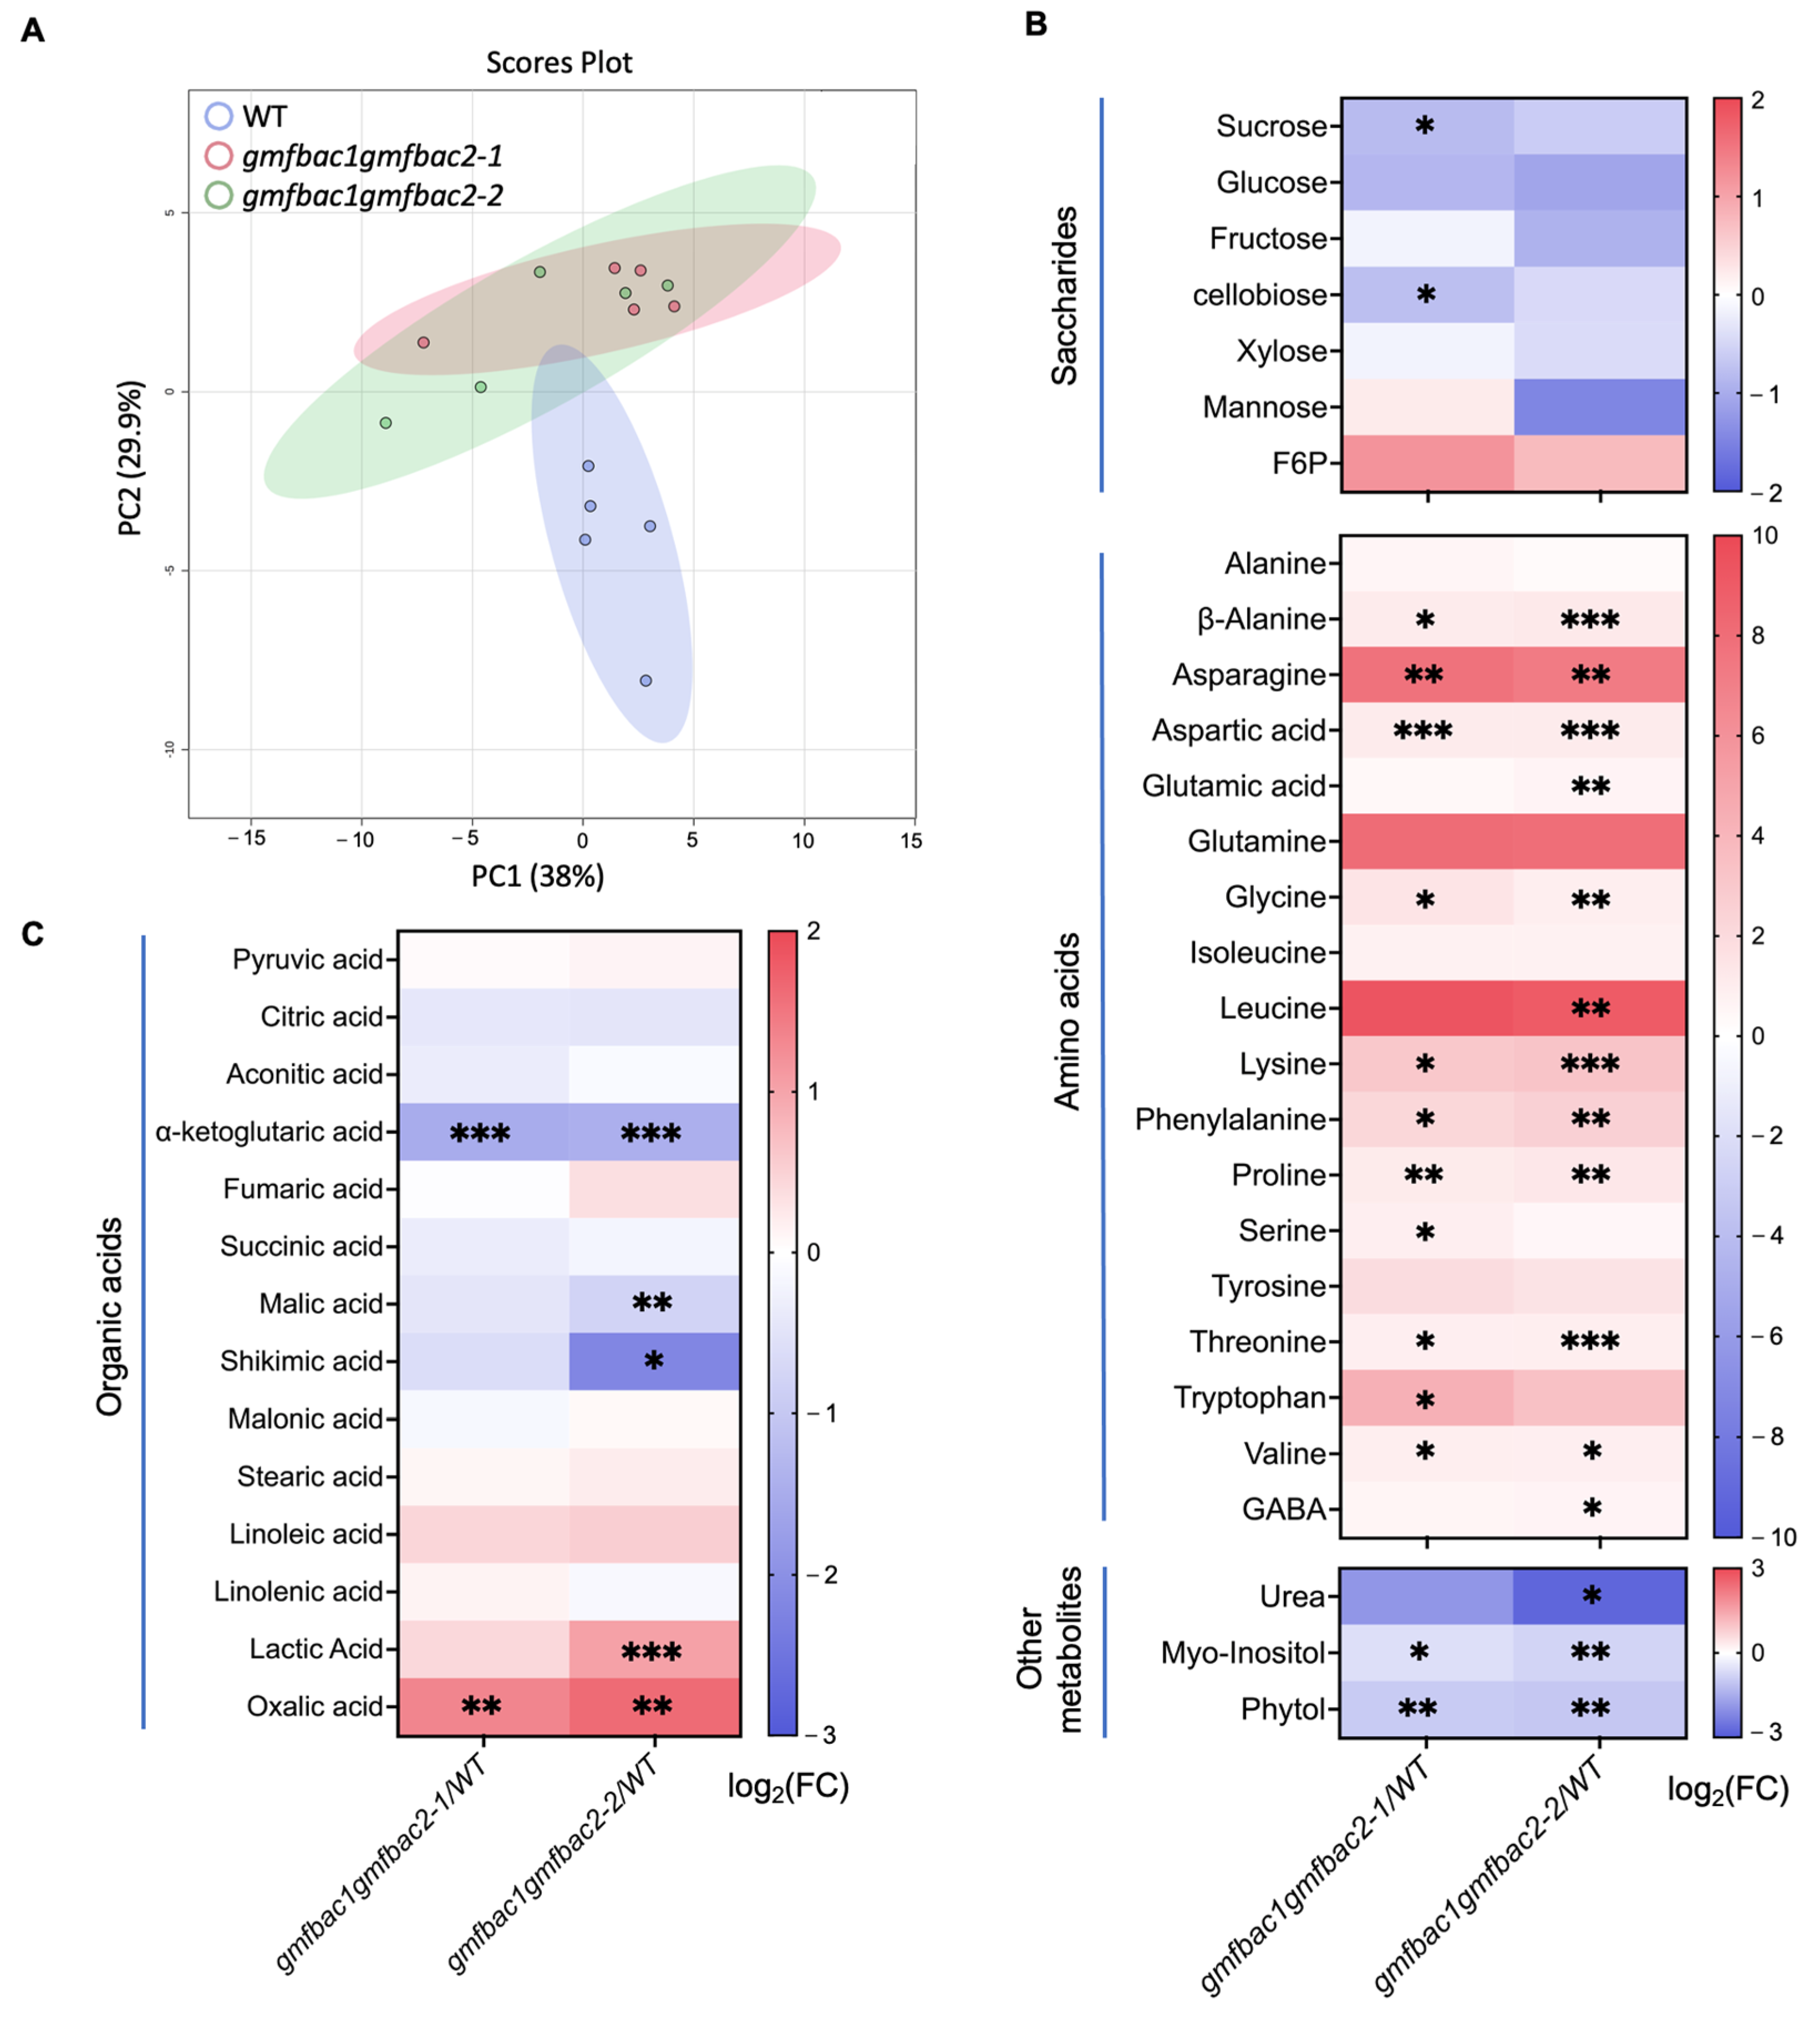
3.5. Metabolomic and Phytochemical Analysis Reveal Altered Primary Metabolism and Phytohormones Contents in gmfbac1gmfbac2 Mutants

We performed metabolomic analysis with gmfbac1gmfbac2 and WT leaves with GC-TOF-MS (Figure 5A–C). PCA of metabolome showed that the content of metabolites was highly similar in two different lines of gmfbac1gmfbac2, but significantly different from the WT (Figure 5A).
In univariant analysis, a total of 42 metabolites were successfully identified. Among them, the content of 17 metabolites was significantly changed in gmfbac1gmfbac2-1, and the content of 20 metabolites was significantly changed in gmfbac1gmfbac2-2 comparing to the WT. The content of fructose-6-phosphate mildly increased in the gmfbac1gmfbac2 (Figure 5B), which was consistent with the disrupted turnover catalyzed by GmFBAc1 and GmFBAc2, but it was not changed significantly. The content of saccharides in gmfbac1gmfbac2 mutants was slightly lower than that of WT, and the decrease in sucrose and cellobiose was significant in gmfbac1gmfbac2-1 (Figure 5B). The content of α-ketoglutarate involved in the TCA cycle significantly decreased in the both lines of gmfbac1gmfbac2, and most of the organic acids involved in the TCA showed a decreasing trend in content (Figure 5C). Downstream of glycolysis, the content of shikimate also showed a significant decrease in gmfbac1gmfbac2-2. Moreover, the results showed that the content of free fatty acids in gmfbac1gmfbac2 leaves did not change significantly (Figure 5C). Fatty acids are mainly synthesized in plastids, the mutation of cytosolic FBA might not affect their contents in soybean leaves [1]. By contrast, the content of oxalate and lactate was increased, which did not directly participate in primary carbon metabolism. Myo-inositol is an important signal substance, whose content also decreased in gmfbac1gmfbac2 leaves comparing to that in the WT significantly, suggesting that signal transduction might be injured in the double mutant leaves (Figure 5B) [37,38]. Phytol decreased in both lines of double mutants, which is usually employed for synthesis of chlorophyll, vitamin E and vitamin K [39]. These results indicated that the glycolytic pathway and TCA cycle were impaired in the leaves of gmfbac1gmfbac2 mutants. Hence, the energy supplied to plant cells of gmfbac1gmfbac2 leaves would be reduced, and substances for downstream reactions were affected as well.
Interestingly, the content of most amino acids detected was significantly higher in both of gmfbac1gmfbac2 leaves than WT leaves (Figure 5B), including β-alanine, asparagine, aspartate, glycine, lysine, phenylalanine, proline, threonine and valine. Together with the decrease in urea content, we speculated that the metabolic pathways toward amino acids biosynthesis maybe were up-regulated in gmfbac1gmfbac2.

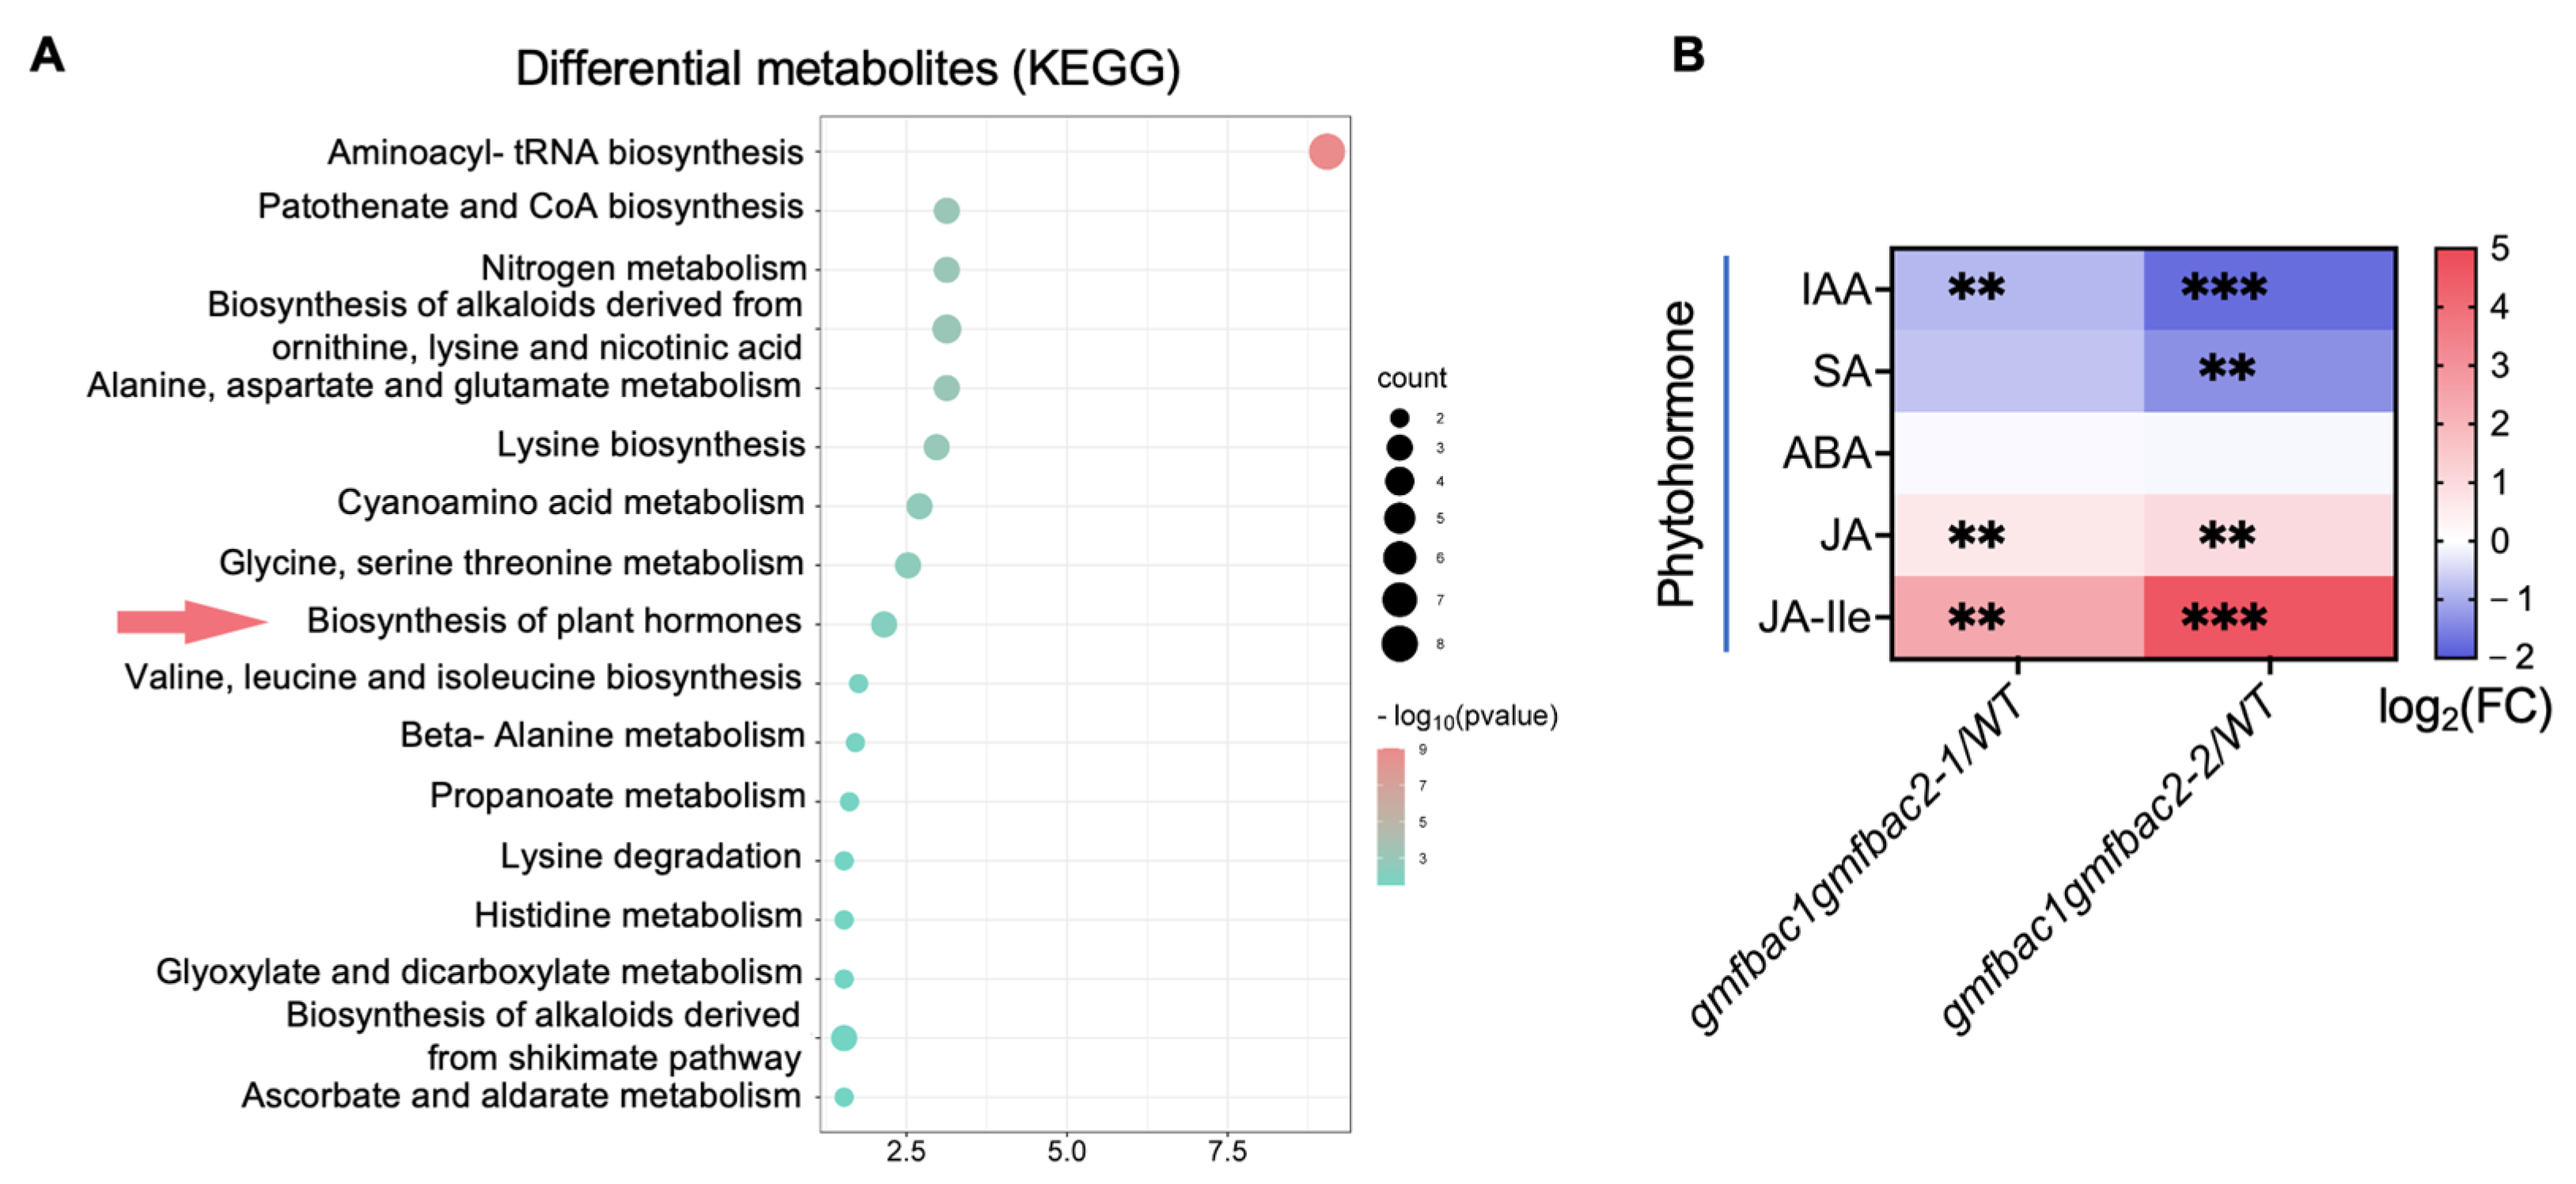
3.6. The gmfbac1gmfbac2 Mutation Affects Auxin and Jasmonic Acid Content and Signaling

KEGG analysis (Figure 6A, Table S2) of differential metabolites showed that the pathway of plant hormone synthesis was significantly enriched, indicating that the phytohormones biosynthesis might be affected in the gmfbac1gmfbac2 leaves. We then measured the content of indole acetic acid (IAA), abscisic acid (ABA), salicylic acid (SA), jasmonic acid (JA) and jasmonoyl-L-isoleucine (JA-Ile) (Figure 6B). Among them, the IAA and SA content decreased while JA and JA-Ile content increased. These suggests that the mutations in GmFBAc1 and GmFBAc2 have an impact on plant hormones.
We next performed RNA-seq with WT and two lines of gmfbac1gmfbac2 mutants. In total, 718 and 755 differentially expressed genes (DEGs) were found in the gmfbac1gmfbac2-1/WT and gmfbac1gmfbac2-2/WT comparison group, respectively (Figure S5), and among them, 552 DEGs were common between the two groups (Table S3). Comparing to the WT, 254 genes and 298 genes were down- and up-regulated in gmfbac1gmfbac2 leaves, respectively. According to the KEGG pathway analyses, the genes upregulated and downregulated in gmfbac1gmfbac2 leaves are both enriched in the plant hormone signal transduction pathway (Figure 7A,B and Table S4 and Table S5). Moreover, the upregulated genes in gmfbac1gmfbac2 leaves were also enriched in multiple amino acid metabolic pathways and nitrogen metabolism (Figure 7B), consistent with the metabolic profiling results, further confirming amino acid metabolism was enhanced in gmfbac1gmfbac2 mutant leaves. Among them, the downregulated genes related to plant signal transduction pathways included auxin response genes (SMALL AUXIN-UP RNA (SAUR), AUXIN RESPONSE FACTOR (ARF), and XYLOGLUCAN ENDOTRANSGLYCOSYLASES/HYDROLASES (XTH)) and cytokinin related genes (HISTIDINE-CONTAINING PHOSPHOTRANSFER PROTEIN (HPT)) (Figure 7C) [40,41,42,43]. In addition, the upregulated genes in gmfbac1gmfbac2 included five JAZ (JASMONATE ZIM-DOMAIN) and one JAI1 (JASMONATE INSENSITIVE1), which respond to JA signaling (Figure 7D) [44]. These results were consistent with the contents of IAA and JA. We performed RT-qPCR to validate the expression of the downregulated GmARF and its homologous genes and some upregulated GmJAZs, and the expression trends were consistent with the RNA-seq results (Figure S6).

4. Discussion

FBA is an important metabolic enzyme and participating glycolysis, gluconeogenesis and Calvin cycle [5,7]. In this study, 14 GmFBA were identified, and they showed differentiated expression patterns. GmFBAc1 and GmFBAc2 were broadly expressed in tissues. In addition, we show that the double mutants of GmFBAc1 and GmFBAc2 lead to reduced growth and aberrant leaflet morphology. Single or heterozygous mutants of GmFBAc1/GmFBAc2 were similar to WT (Figure 3A). This was consistent with the highly similar expression patterns and protein sequences of GmFBAc1 and GmFBAc2, which indicated that the functions of these two genes are highly redundant.
As critical enzymes in cytosolic glycolysis, mutations of GmFBAc1 and GmFBAc2 affected carbon metabolism, leading to reduced sugars content and organic acids content in the TCA cycle. Meanwhile, the content of free amino acids in gmfbac1gmfbac2 leaves significantly increased, and the corresponding amino acid metabolism genes and nitrogen metabolism genes were upregulated, indicating imbalance of carbon and nitrogen metabolism. Leaf serves as a source of carbon and a sink of nitrogen in plants, whose balance of carbon and nitrogen is crucial for plants, and the source and sink balance determine growth [45]. Therefore, the mutations in GmFBAc1 and GmFBAc2 caused an imbalance C/N metabolism, leading to retarded growth of the gmfbac1gmfbac2.
In various plant species, attenuation of the auxin signaling pathway was found to result in aberrant cell expansion and cell division [46,47]. Therefore, the reduction in IAA content in the leaves of the gmfbac1gmfbac2 mutant might contribute to the narrow leaf phenotype. However, it is currently unknown about the mechanism of causing the decreased IAA in gmfbac1gmfbac2. In our study, there were no significant changes in the expression levels of IAA biosynthesis genes. As a precursor of IAA biosynthesis, the tryptophan content in gmfbac1gmfbac2 leaves was significantly higher than that in the WT, which was inconsistent with lowered IAA content. IAA synthesis involves tryptophan-dependent and -independent pathways [48]. Previous studies using 15N-labeled tryptophan to culture the Lemna gibba showed that even though 98% of the tryptophan in the plant was labeled, only a small amount of IAA was labeled with 15N [49]. Studies on tryptophan mutants trp2 and trp3 in Arabidopsis suggested the existence of efficient IAA biosynthesis pathways that do not involve tryptophan [48,50]. Hence, it is possible that tryptophan-independent IAA biosynthesis pathways may be affected by GmFBAc1/GmFBAc2. Moreover, upstream of the tryptophan, IAA and SA biosynthesis pathway, the content of shikimate decreased in the gmfbac1gmfbac2 leaves, which could be one of the reasons for the reduction in IAA and SA levels [51,52]. In addition, previous research mentioned that the decrease in hexose content would downregulate the entire shikimate pathway, thereby reducing the ability to synthesize auxins [47]. Therefore, the mutations in GmFBAc1 and GmFBAc2 attenuated the carbon metabolism, and further affected the synthesis of IAA. Combining the downregulation of phytohormone response genes such as GmXTHs and GmHPT4s in gmfbac1gmfbac2 leaves, we assumed that cell proliferation and cell wall restructuring were inhibited, resulting in a decrease in the number of leaf cells [42,43,53].
JA could repress cell proliferation in Arabidopsis leaf, which was indicated by the seedlings treated with Me-JA [54]. Increase in JA content in plant leaves may inhibit leaf growth while improving stress resistance. Overexpression of the JA signal pathway gene CmJAZ1-like in Chrysanthemum morifolium resulted in transgenic plants with smaller petals and leaves [55]. Therefore, enhancement of the JA signaling pathway might be another reason contributing to the morphological changes in the leaves of the gmfbac1gmfbac2 mutant. The precursor for JA synthesis comes from fatty acids synthesized in the plastids, and the cytoplasmic GmFBAc1 and GmFBAc2 mutations did not hinder fatty acid synthesis. Metabolomic results showed no significant change in detected content of free fatty acids. However, fatty acids in other forms were not detected in this study, which might contribute to the increase in JA content.

5. Conclusions

GmFBAc1 and GmFBAc2 play a critical redundant role in soybean growth, and their mutations would cause multiple changes in leaf cells, such as disrupting the balance of carbon and nitrogen metabolism, disturbing phytohormone homeostasis, and ultimately leading to narrow leaflets and dwarf seedlings.

Supplementary Materials

The following supporting information can be downloaded at: https://www.mdpi.com/article/10.3390/agronomy13051383/s1, Figure S1: Gene structure of GmFBA family; Figure S2: Subcellular localization of GmFBAc1 and GmFBAc2; Figure S3: Phenotype of 5 DAG soybean seedlings of wild type and gmfbac1gmfbac2 mutants; Figure S4: Leaflet area of 20 DAG wild type and gmfbac1gmfbac2 seedlings; Figure S5: Venn plot of DEGs in two lines of gmfbac1gmfbac2 vs wild type, respectively; Figure S6: Relative expression of GmARF and GmJAZ in gmfbac1gmfbac2 leaves was verified by RT-qPCR; Table S1: List of primers used for RT-qPCR analysis, genotyping and CDS cloning; Table S2: KEGG category of differential metabolites in gmfbac1gmfbac2 vs wild type; Table S3: 552 DEGs in gmfbac1gmfbac2 vs wild type; Table S4: KEGG category of downregulated DEGs in gmfbac1gmfbac2 vs wild type; Table S5: KEGG category of upregulated DEGs in gmfbac1gmfbac2 vs wild type.

Author Contributions

Y.G. and X.Z. designed and revised the manuscript; Z.Q. carried out most of the experiments in this research and wrote the manuscript; M.B. performed genome editing; H.K. did the soybean transformation experiment; X.W. analyzed the transcriptomic data; X.Y. designed method and provided platform for metabolomic analysis and determination of phytohormone content. All authors have read and agreed to the published version of the manuscript.

Funding

This research was funded by Fujian Agriculture and Forestry University Scientific Research Project for Prominent Talent to Xiangbin Zhong (KXJQ21010).

Data Availability Statement

The data presented in this study are available in the Supplementary Materials.

Acknowledgments

We gratefully acknowledge Xiaxia Wang and Ruimei Wu for their assistance in the metabolomic analysis and determination of phytohormones content.

Conflicts of Interest

The authors declare no conflict of interest.

References

  1. Joyard, J.; Ferro, M.; Masselon, C.; Seigneurin-Berny, D.; Salvi, D.; Garin, J.; Rolland, N. Chloroplast proteomics highlights the subcellular compartmentation of lipid metabolism. Prog. Lipid Res. 2010, 49, 128–158. [Google Scholar] [CrossRef] [PubMed]
  2. Li, R.; Qiu, Z.; Wang, X.; Gong, P.; Xu, Q.; Yu, Q.; Guan, Y. Pooled CRISPR/Cas9 reveals redundant roles of plastidial phosphoglycerate kinases in carbon fixation and metabolism. Plant J. Cell. Mol. Biol. 2019, 98, 1078–1089. [Google Scholar] [CrossRef] [PubMed]
  3. Yang, L.; Wang, Z.; Zhang, A.; Bhawal, R.; Li, C.; Zhang, S.; Cheng, L.; Hua, J. Reduction of the canonical function of a glycolytic enzyme enolase triggers immune responses that further affect metabolism and growth in Arabidopsis. Plant Cell 2022, 34, 1745–1767. [Google Scholar] [CrossRef] [PubMed]
  4. Aguilera-Alvarado, G.P.; Sánchez-Nieto, S. Plant Hexokinases are Multifaceted Proteins. Plant Cell Physiol. 2017, 58, 1151–1160. [Google Scholar] [CrossRef]
  5. Cai, B.; Qiang, Y.; Yang, L.; Bi, H.; Ai, X. Genome-wide analysis of the fructose 1,6-bisphosphate aldolase (FBA) gene family and functional characterization of FBA7 in tomato. Plant Physiol. Biochem. 2016, 108, 251–265. [Google Scholar] [CrossRef]
  6. Zhao, Y.; Jiao, F.; Tang, H.; Xu, H.; Zhang, L.; Wu, H. Genome-wide characterization, evolution, and expression profiling of FBA gene family in response to light treatments and abiotic stress in Nicotiana tabacum. Plant Signal. Behav. 2021, 16, 1938442. [Google Scholar] [CrossRef]
  7. Lu, W.; Tang, X.; Huo, Y.; Xu, R.; Qi, S.; Huang, J.; Zheng, C.; Wu, C. Identification and characterization of fructose 1,6-bisphosphate aldolase genes in Arabidopsis reveal a gene family with diverse responses to abiotic stresses. Gene 2012, 503, 65–74. [Google Scholar] [CrossRef]
  8. Carrera, D.; George, G.M.; Fischer-Stettler, M.; Galbier, F.; Eicke, S.; Truernit, E.; Streb, S.; Zeeman, S.C. Distinct plastid fructose bisphosphate aldolases function in photosynthetic and non-photosynthetic metabolism in Arabidopsis. J. Exp. Bot. 2021, 72, 3739–3755. [Google Scholar] [CrossRef]
  9. Simkin, A.J.; Lopez-Calcagno, P.E.; Davey, P.A.; Headland, L.R.; Lawson, T.; Timm, S.; Bauwe, H.; Raines, C.A. Simultaneous stimulation of sedoheptulose 1,7-bisphosphatase, fructose 1,6-bisphophate aldolase and the photorespiratory glycine decarboxylase-H protein increases CO2 assimilation, vegetative biomass and seed yield in Arabidopsis. Plant Biotechnol. J. 2017, 15, 805–816. [Google Scholar] [CrossRef]
  10. Cai, B.; Ning, Y.; Li, Q.; Li, Q.; Ai, X. Effects of the Chloroplast Fructose-1,6-Bisphosphate Aldolase Gene on Growth and Low-Temperature Tolerance of Tomato. Int. J. Mol. Sci. 2022, 23, 728. [Google Scholar] [CrossRef]
  11. Zeng, Y.; Tan, X.; Zhang, L.; Jiang, N.; Cao, H. Identification and expression of fructose-1,6-bisphosphate aldolase genes and their relations to oil content in developing seeds of tea oil tree (Camellia oleifera). PLoS ONE 2014, 9, e107422. [Google Scholar] [CrossRef] [PubMed]
  12. Haake, V.; Zrenner, R.; Sonnewald, U.; Stitt, M. A moderate decrease of plastid aldolase activity inhibits photosynthesis, alters the levels of sugars and starch, and inhibits growth of potato plants. Plant J. 1998, 14, 147–157. [Google Scholar] [CrossRef] [PubMed]
  13. Lee, B.-S.; Koo, K.M.; Ryu, J.; Hong, M.J.; Kim, S.H.; Kwon, S.-J.; Kim, J.-B.; Choi, J.-i.; Ahn, J.-W. Overexpression of fructose-1,6-bisphosphate aldolase 1 enhances accumulation of fatty acids in Chlamydomonas reinhardtii. Algal Res. 2020, 47, 101825. [Google Scholar] [CrossRef]
  14. Koo, K.M.; Jung, S.; Lee, B.S.; Kim, J.-B.; Jo, Y.D.; Choi, H.-I.; Kang, S.-Y.; Chung, G.-H.; Jeong, W.-J.; Ahn, J.-W. The Mechanism of Starch Over-Accumulation in Chlamydomonas reinhardtii High-Starch Mutants Identified by Comparative Transcriptome Analysis. Front. Microbiol. 2017, 8, 858. [Google Scholar] [CrossRef] [PubMed]
  15. Garagounis, C.; Kostaki, K.I.; Hawkins, T.J.; Cummins, I.; Fricker, M.D.; Hussey, P.J.; Hetherington, A.M.; Sweetlove, L.J. Microcompartmentation of cytosolic aldolase by interaction with the actin cytoskeleton in Arabidopsis. J. Exp. Bot. 2017, 68, 885–898. [Google Scholar] [CrossRef]
  16. van der Linde, K.; Gutsche, N.; Leffers, H.M.; Lindermayr, C.; Müller, B.; Holtgrefe, S.; Scheibe, R. Regulation of plant cytosolic aldolase functions by redox-modifications. Plant Physiol. Biochem. 2011, 49, 946–957. [Google Scholar] [CrossRef]
  17. Olas, J.; Apelt, F.; Annunziata, M.; John, S.; Richard, S.; Gupta, S.; Kragler, F.; Balazadeh, S.; Mueller-Roeber, B. Primary carbohydrate metabolism genes participate in heat-stress memory at the shoot apical meristem of Arabidopsis thaliana. Mol. Plant 2021, 14, 1508–1524. [Google Scholar] [CrossRef]
  18. Simkin, A.J.; McAusland, L.; Headland, L.R.; Lawson, T.; Raines, C.A. Multigene manipulation of photosynthetic carbon assimilation increases CO2 fixation and biomass yield in tobacco. J. Exp. Bot. 2015, 66, 4075–4090. [Google Scholar] [CrossRef]
  19. Uematsu, K.; Suzuki, N.; Iwamae, T.; Inui, M.; Yukawa, H. Increased fructose 1,6-bisphosphate aldolase in plastids enhances growth and photosynthesis of tobacco plants. J. Exp. Bot. 2012, 63, 3001–3009. [Google Scholar] [CrossRef]
  20. Philippe, L.; Berardini, T.Z.; Li, D.; David, S.; Christopher, W.; Rajkumar, S.; Robert, M.; Kate, D.; Alexander, D.L.; Margarita, G.H. The Arabidopsis Information Resource (TAIR): Improved gene annotation and new tools. Nucleic Acids Res. 2012, 40, 1202–1210. [Google Scholar]
  21. Goodstein, D.M.; Shu, S.; Russell, H.; Rochak, N.; Hayes, R.D.; Joni, F.; Therese, M.; William, D.; Uffe, H.; Nicholas, P. Phytozome: A comparative platform for green plant genomics. Nucleic Acids Res. 2012, 40, D1178–D1186. [Google Scholar] [CrossRef] [PubMed]
  22. Katoh, K.; Rozewicki, J.; Yamada, K.D. MAFFT online service: Multiple sequence alignment, interactive sequence choice and visualization. Brief. Bioinform. 2019, 20, 1160–1166. [Google Scholar] [CrossRef] [PubMed]
  23. Bai, M.; Yuan, J.; Kuang, H.; Gong, P.; Li, S.; Zhang, Z.; Liu, B.; Sun, J.; Yang, M.; Yang, L. Generation of a multiplex mutagenesis population via pooled CRISPR-Cas9 in soya bean. Plant Biotechnol. J. 2020, 18, 721–731. [Google Scholar] [CrossRef]
  24. Chen, L.; Cai, Y.; Liu, X.; Yao, W.; Guo, C.; Sun, S.; Wu, C.; Jiang, B.; Han, T.; Hou, W. Improvement of Soybean Agrobacterium-Mediated Transformation Efficiency by Adding Glutamine and Asparagine into the Culture Media. Int. J. Mol. Sci. 2018, 19, 3039. [Google Scholar] [CrossRef] [PubMed]
  25. Xu, M.; Chen, F.; Qi, S.; Zhang, L.; Wu, S. Loss or duplication of key regulatory genes coincides with environmental adaptation of the stomatal complex in Nymphaea colorata and Kalanchoe laxiflora. Hortic. Res. 2018, 5, 42. [Google Scholar] [CrossRef] [PubMed]
  26. Yang, N.; Jiang, J.; Xie, H.; Bai, M.; Xu, Q.; Wang, X.; Yu, X.; Chen, Z.; Guan, Y. Metabolomics Reveals Distinct Carbon and Nitrogen Metabolic Responses to Magnesium Deficiency in Leaves and Roots of Soybean [Glycine max (Linn.) Merr.]. Front. Plant Sci. 2017, 8, 2091. [Google Scholar] [CrossRef]
  27. López-Ibáñez, J.; Pazos, F.; Chagoyen, M. MBROLE 2.0-functional enrichment of chemical compounds. Nucleic Acids Res. 2016, 44, W201–W204. [Google Scholar] [CrossRef]
  28. Gao, Z.; Chen, Z.; Cui, Y.; Ke, M.; Xu, H.; Xu, Q.; Chen, J.; Li, Y.; Huang, L.; Zhao, H.; et al. GmPIN-dependent polar auxin transport is involved in soybean nodule development. Plant Cell 2021, 33, 2981–3003. [Google Scholar] [CrossRef]
  29. Bolger, A.M.; Lohse, M.; Usadel, B. Trimmomatic: A flexible trimmer for Illumina sequence data. Bioinformatics 2014, 30, 2114–2120. [Google Scholar] [CrossRef]
  30. Valliyodan, B.; Cannon, S.B.; Bayer, P.E.; Shu, S.; Brown, A.V.; Ren, L.; Jenkins, J.; Chung, C.Y.; Chan, T.F.; Daum, C.G.; et al. Construction and comparison of three reference-quality genome assemblies for soybean. Plant J. 2019, 100, 1066–1082. [Google Scholar] [CrossRef]
  31. Kim, D.; Paggi, J.M.; Park, C.; Bennett, C.; Salzberg, S.L. Graph-based genome alignment and genotyping with HISAT2 and HISAT-genotype. Nat. Biotechnol. 2019, 37, 907–915. [Google Scholar] [CrossRef] [PubMed]
  32. Pertea, M.; Pertea, G.M.; Antonescu, C.M.; Chang, T.C.; Mendell, J.T.; Salzberg, S.L. StringTie enables improved reconstruction of a transcriptome from RNA-seq reads. Nat. Biotechnol. 2015, 33, 290–295. [Google Scholar] [CrossRef] [PubMed]
  33. Love, M.I.; Huber, W.; Anders, S. Moderated estimation of fold change and dispersion for RNA-seq data with DESeq2. Genome Biol. 2014, 15, 550. [Google Scholar] [CrossRef] [PubMed]
  34. Bu, D.; Luo, H.; Huo, P.; Wang, Z.; Zhang, S.; He, Z.; Wu, Y.; Zhao, L.; Liu, J.; Guo, J.; et al. KOBAS-i: Intelligent prioritization and exploratory visualization of biological functions for gene enrichment analysis. Nucleic Acids Res. 2021, 49, W317–W325. [Google Scholar] [CrossRef] [PubMed]
  35. Koeck, T.; Levison, B.; Hazen, S.L.; Crabb, J.W.; Stuehr, D.J.; Aulak, K.S. Tyrosine nitration impairs mammalian aldolase A activity. Mol. Cell. Proteom. 2004, 3, 548–557. [Google Scholar] [CrossRef] [PubMed]
  36. Tang, M.; Chen, X.; Ni, Q.; Lu, Y.; Wu, B.; Wang, H.; Yin, Z.; Zhou, W.; Dong, X. Estimation of hereditary fructose intolerance prevalence in the Chinese population. Orphanet J. Rare Dis. 2022, 17, 326. [Google Scholar] [CrossRef]
  37. Gillaspy, G.E. The cellular language of myo-inositol signaling. New Phytol. 2011, 192, 823–839. [Google Scholar] [CrossRef]
  38. Wang, F.; Wang, X.; Zhang, Y.; Yan, J.; Ahammed, G.J.; Bu, X.; Sun, X.; Liu, Y.; Xu, T.; Qi, H.; et al. SlFHY3 and SlHY5 act compliantly to enhance cold tolerance through the integration of myo-inositol and light signaling in tomato. New Phytol. 2022, 233, 2127–2143. [Google Scholar] [CrossRef]
  39. Gutbrod, K.; Romer, J.; Dörmann, P. Phytol metabolism in plants. Prog. Lipid Res. 2019, 74, 1–17. [Google Scholar] [CrossRef]
  40. Stortenbeker, N.; Bemer, M. The SAUR gene family: The plant’s toolbox for adaptation of growth and development. J. Exp. Bot. 2019, 70, 17–27. [Google Scholar] [CrossRef]
  41. Zhang, G.Z.; Jin, S.H.; Jiang, X.Y.; Dong, R.R.; Li, P.; Li, Y.J.; Hou, B.K. Ectopic expression of UGT75D1, a glycosyltransferase preferring indole-3-butyric acid, modulates cotyledon development and stress tolerance in seed germination of Arabidopsis thaliana. Plant Mol. Biol. 2016, 90, 77–93. [Google Scholar] [CrossRef] [PubMed]
  42. Kozuka, T.; Kobayashi, J.; Horiguchi, G.; Demura, T.; Sakakibara, H.; Tsukaya, H.; Nagatani, A. Involvement of auxin and brassinosteroid in the regulation of petiole elongation under the shade. Plant Physiol. 2010, 153, 1608–1618. [Google Scholar] [CrossRef] [PubMed]
  43. Liu, Z.; Yuan, L.; Song, X.; Yu, X.; Sundaresan, V. AHP2, AHP3, and AHP5 act downstream of CKI1 in Arabidopsis female gametophyte development. J. Exp. Bot. 2017, 68, 3365–3373. [Google Scholar] [CrossRef] [PubMed]
  44. Chini, A.; Fonseca, S.; Fernández, G.; Adie, B.; Chico, J.M.; Lorenzo, O.; García-Casado, G.; López-Vidriero, I.; Lozano, F.M.; Ponce, M.R.; et al. The JAZ family of repressors is the missing link in jasmonate signalling. Nature 2007, 448, 666–671. [Google Scholar] [CrossRef]
  45. Zhang, W.; Wu, X.; Wang, D.; Wu, D.; Fu, Y.; Bian, C.; Jin, L.; Zhang, Y. Leaf cytokinin accumulation promotes potato growth in mixed nitrogen supply by coordination of nitrogen and carbon metabolism. Plant Sci. 2022, 324, 111416. [Google Scholar] [CrossRef]
  46. Guan, C.; Wu, B.; Yu, T.; Wang, Q.; Krogan, N.T.; Liu, X.; Jiao, Y. Spatial Auxin Signaling Controls Leaf Flattening in Arabidopsis. Curr. Biol. 2017, 27, 2940–2950.e4. [Google Scholar] [CrossRef]
  47. Tadege, M.; Lin, H.; Bedair, M.; Berbel, A.; Wen, J.; Rojas, C.M.; Niu, L.; Tang, Y.; Sumner, L.; Ratet, P. STENOFOLIA regulates blade outgrowth and leaf vascular patterning in Medicago truncatula and Nicotiana sylvestris. Plant Cell 2011, 23, 2125–2142. [Google Scholar] [CrossRef]
  48. Wang, B.; Chu, J.; Yu, T.; Xu, Q.; Sun, X.; Yuan, J.; Xiong, G.; Wang, G.; Wang, Y.; Li, J. Tryptophan-independent auxin biosynthesis contributes to early embryogenesis in Arabidopsis. Proc. Natl. Acad. Sci. USA 2015, 112, 4821–4826. [Google Scholar] [CrossRef]
  49. Baldi, B.G.; Maher, B.R.; Cohen, S. Stable Isotope Labeling, in Vivo, of d- and l-Tryptophan Pools in Lemna gibba and the Low Incorporation of Label into Indole-3-Acetic Acid. Plant. Physiol. 1991, 95, 1203–1208. [Google Scholar] [CrossRef]
  50. Last, R.L. Tryptophan Mutants in Arabidopsis: The Consequences of Duplicated Tryptophan Synthase b Genes. Plant Cell 1991, 3, 345–358. [Google Scholar]
  51. Yokoyama, R.; de Oliveira, M.; Kleven, B.; Maeda, H. The entry reaction of the plant shikimate pathway is subjected to highly complex metabolite-mediated regulation. Plant Cell 2021, 33, 671–696. [Google Scholar] [CrossRef]
  52. Scalabrin, E.; Radaelli, M.; Capodaglio, G. Simultaneous determination of shikimic acid, salicylic acid and jasmonic acid in wild and transgenic Nicotiana langsdorffii plants exposed to abiotic stresses. Plant Physiol. Biochem. 2016, 103, 53–60. [Google Scholar] [CrossRef]
  53. Pitaksaringkarn, W.; Matsuoka, K.; Asahina, M.; Miura, K.; Sage-Ono, K.; Ono, M.; Yokoyama, R.; Nishitani, K.; Ishii, T.; Iwai, H.; et al. XTH20 and XTH19 regulated by ANAC071 under auxin flow are involved in cell proliferation in incised Arabidopsis inflorescence stems. Plant J. 2014, 80, 604–614. [Google Scholar] [CrossRef]
  54. Noir, S.; Bömer, M.; Takahashi, N.; Ishida, T.; Tsui, T.L.; Balbi, V.; Shanahan, H.; Sugimoto, K.; Devoto, A. Jasmonate controls leaf growth by repressing cell proliferation and the onset of endoreduplication while maintaining a potential stand-by mode. Plant Physiol. 2013, 161, 1930–1951. [Google Scholar] [CrossRef]
  55. Guan, Y.; Ding, L.; Jiang, J.; Shentu, Y.; Zhao, W.; Zhao, K.; Zhang, X.; Song, A.; Chen, S.; Chen, F. Overexpression of the CmJAZ1-like gene delays flowering in Chrysanthemum morifolium. Hortic. Res. 2021, 8, 87. [Google Scholar] [CrossRef]
Figure 1. Phylogenetic analysis and expression pattern analysis of 14 GmFBAs. (A) Phylogenetic tree constructed of amino acid sequences of FBA in soybean, Arabidopsis, Medicago truncatula and Lotus japonicus. (B) Relative expression of GmFBAc1 and GmFBAc2 in different tissues. (C) Relative expression of GmFBAc3 to GmFBAc7 and GmFBAp1 to GmFBAp7 in different tissues. Note: RT-qPCR data (2−ΔΔCt) for relative expression of GmFBAs; Blue represents cytosolic FBA and green represents plastidial FBA.
Agronomy 13 01383 g001
Figure 2. Homozygous mutants of gmfbac1gmfbac2 obtained by using one target site. (A) Genes structures of GmFBAc1 and GmFBAc2 with the target sites of CRISPR-Cas9 indicated and schematic illustrating the target site sequence and corresponding PAM (red uppercase letters). (B) Predicted protein structures of gmfbac1gmfbac2 double mutants. (C) DNA sequences of gmfbac1gmfbac2-1, -2 and -3 at target loci. (D) Relative expression of 14 GmFBAs in gmfbac1gmfbac2-1 and gmfbac1gmfbac2-2 (2−△△Ct). (E) FBA enzyme activity in leaves of 20 DAG seedlings. Note: t-test was performed between WT and gmfbac1gmfbac2 mutants, respectively. All values are presented as the mean ± SEM. The ns represents no significant difference. ** p < 0.01, *** p < 0.001.
Agronomy 13 01383 g002
Figure 3. Leaflet shape and seedlings size in WT and gmfbac1gmfbac2. (Bar = 2 cm) (A) Phenotypes of 20 DAG heterozygous and homozygous double mutants of GmFBAc1 and GmFBAc2. (B) Dried weight (DW) of 20 DAG heterozygous and homozygous double mutants of GmFBAc1 and GmFBAc2 and WT seedlings. (C) Leaf morphology of 20, 30 and 50 DAG seedlings. (Bar = 2 cm) (D) Width and length of leaflets in 20 DAG seedlings. Note: t-test was performed between WT and gmfbac1gmfbac2 mutants. All values are presented as the mean ± SEM. The ns represents no significant differences. * p < 0.05, *** p < 0.001.
Agronomy 13 01383 g003
Figure 4. Significance of differences in leaf epidermal cells between WT and gmfbac1gmfbac2 mutants. (Bar = 50 μm) (A) Morphology of epidermal cells in the leaves of 20 DAG seedlings. (B) Adaxial epidermal cell area of leaves. (C) Abaxial epidermal cell area of leaves. Note: t-test was performed between WT and gmfbac1gmfbac2 mutants. All values are presented as the mean ± SEM. The ns represents no significant differences.
Agronomy 13 01383 g004
Figure 5. Significance of differences in leaf metabolites between WT and gmfbac1gmfbac2 as revealed by metabolomic analysis. (A) PCA of metabolomic results of leaves. Blue, red and green circle represents wild type, gmfbac1gmfbac2-1 and gmfbac1gmfbac2-2, respectively. (B) Relative levels of saccharides, amino acids and other metabolites in gmfbac1gmfbac2 leaves. (C) Relative levels of organic acids in gmfbac1gmfbac2 leaves. Note: t-test was performed between WT and gmfbac1gmfbac2 mutants. All values are presented as the log2(Fold Change). * p < 0.05, ** p < 0.01, *** p < 0.001.
Agronomy 13 01383 g005
Figure 6. Changes in the content of phytohormones in gmfbac1gmfbacf2 leaves. (A) KEGG metabolic pathways significantly enriched with differential metabolites. (B) Relative levels of phytohormones in gmfbac1gmfbac2 leaves. Note: t-test was performed between WT and gmfbac1gmfbac2 mutants. All values are presented as the log2(Fold Change). ** p < 0.01, *** p < 0.001.
Agronomy 13 01383 g006
Figure 7. Significant differences in plant hormone signal transduction between WT and gmfbac1gmfbac2 were revealed by transcriptomic analysis. (A) KEGG metabolic pathways enriched with DEGs downregulated in gmfbac1gmfbac2 leaves compared to the WT leaves. (B) KEGG metabolic pathways enriched with DEGs upregulated in gmfbac1gmfbac2 compared to the WT. (C) Heatmap of down-regulated DEGs involved in the plant hormone are shown in the transcriptome profile. (D) Heatmap of up-regulated DEGs involved in the plant hormone are shown in the transcriptome profile.
Agronomy 13 01383 g007
Disclaimer/Publisher’s Note: The statements, opinions and data contained in all publications are solely those of the individual author(s) and contributor(s) and not of MDPI and/or the editor(s). MDPI and/or the editor(s) disclaim responsibility for any injury to people or property resulting from any ideas, methods, instructions or products referred to in the content.

