Article

QTL Mapping by Chromosome Segment Substitution Lines (CSSLs) Reveals Candidate Gene Controlling Leaf Sucrose Content in Soybean (Glycine max (L.) Merr.)

1
College of Agriculture, Northeast Agricultural University, Harbin 150030, China
2
Jiamusi Branch Institute, Heilongjiang Academy of Agricultural Sciences, Jiamusi 154000, China
3
Agricultural College, Shenyang Agricultural University, Shenyang 110866, China
4
Department of Crop Sciences, University of Natural Resources and Life Sciences Vienna, Konrad-Lorenz-Strasse 24, 3430 Tulln an der Donau, Austria
*
Authors to whom correspondence should be addressed.
These authors contributed equally to this work.
Agronomy 2023, 13(6), 1592; https://doi.org/10.3390/agronomy13061592
Submission received: 11 May 2023 / Revised: 7 June 2023 / Accepted: 7 June 2023 / Published: 13 June 2023
(This article belongs to the Special Issue New Advances in Soybean Molecular Biology)

Abstract

:
Understanding the genetic basis of leaf sucrose content can provide a novel way in improving soybean yields. To identify the related QTLs, 190 materials of chromosome fragment substitution lines (CSSLs) were used in this study. The CSSLs were developed from the cross between the cultivated soybean Suinong 14 (SN14) and wild soybean ZYD00006. Only one QTL with a high logarithm of odds (LOD) score was detected in 2021 and 2022 among 3780 bin markers (combined by 580,524 SNPs) distributed in 20 chromosomes. Nine candidate genes were screened and Glyma.14G029100 was considered as the hub gene. A promoter difference and CDS mutant was found among the parents and the reference genome, which lead to the relative transcriptional level difference.. Our results lay the groundwork for further research into its genetic mechanism.

1. Introduction

Soybean (Glycine max (L.) Merr.) is a potential commercial crop with wide-range use for food and feed [1], containing 40% protein, 20% oil, and 34% carbohydrates [2]. As it is becoming more and more popular in the food and feed consumption markets, soybean is meeting a huge demand gap globally. Stable and high yield is one of the most important targets for breeders all around the world.
The carbon assimilates during the reproductive stage of the plants are important to the grain yield, and are affected by two major factors: net photosynthesis in leaves; and the delivery rate of assimilates to flowers, pods, and seeds. The sucrose was synthesized by photosynthesis and delivered to the phloem, and was involved in various growth and development reactions [3]. Sucrose is the primary carbohydrate transported from mature leaves, the source organ, to young leaves, roots, and seeds, which are the sink organs of plants. The phloem transport system is highly efficient and involves both symplastic and apoplastic pathways. In the presence of light, sucrose is synthesized in the cytoplasm of source leaves, as illustrated in Figure 1, based on the study by Mark Stitt [4]. The Calvin cycle produces triose phosphate, which is transported to the cytoplasm through a triose phosphate transporter on the chloroplast membrane, catalyzed by FBA to generate Fru16BP, which is then reversibly generated by FBPase. Glc1P is reversibly generated by PGI and PGM, and then UDPGlc is generated by UGPase (UDP-glucose pyrophosphorylase). FBPase and SPS are the main rate-limiting enzymes in sucrose synthesis. The sucrose produced in source leaves is transported to non-photosynthetic organs, and a portion of it is decomposed into hexose by InV (cell wall invertase) [5], which is then transported to non-photosynthetic organs via hexose transporters [6]. The remaining sucrose is directly transported out by the sucrose transporter and undergoes endocytosis on the vacuole membrane before being transported to non-photosynthetic organs. In dicotyledonous plants such as soybean, some of the transported sucrose is stored in storage organs, whereas the rest is decomposed into Fru and UDPGlc by SuSy. Fructose is then catalyzed by FK (fructose kinase) and PGI to produce Glc6P. UDPGlc is converted to Glc1P by UGPase and to Glc6P under the catalysis of PGM [7], and it enters the powder [8], where it is catalyzed by PGM to generate Glc1P. AGPase (ADP-glucose pyrophosphorylase) then converts Glc1P to ADPGlc (ADP-glucose), which finally passes through SS (sucrose synthase) and SBE (starch branching enzyme) [9].
Quantity trait loci (QTL) mapping was first used in tomato and is widely used for mining the key genes affecting the relevant traits in various plants now. Previous studies have already created a genome-wide chromosome segment substitution line (CSSLs) for QTL mapping, where it is widely used for oil, protein, and seed size. Little is known about genetic studies of the sucrose content. Only a few QTLs related to seed sucrose content were identified based on RIL populations and F2 populations. Maughan et al. [10] identified 17 sucrose-related QTL on chromosomes 5, 7, 8, 13, 15, 19, and 20. Kim et al. [11] used RIL populations from a cross between ‘Keunolkong’ and ‘Shinpaldalkong’ and found four QTL for sucrose concentration on chromosomes 2, 11, and 19. Skoneczka et al. [12] used F2 derived populations from PI 87,013 × PI 200,508 and PI 243,545 × PI 200,508 and identified a QTL on chromosome 6. Finally, Zeng et al. [13] crossed MFS-553 with PI 243,545 and identified three novel QTL for sucrose concentration, which were located on chromosomes 5, 9, and 16. A recent paper elucidating QTL related to seed sucrose concentration in a 178-soybean genotype GWAS uncovered five potential QTL, located on chromosomes 4, 6, 7, 11, and 12 [14].
Even less QTL related to leaf sucrose content is known than the QTLs referring to the seed sucrose content. The objective of this study is to: (1) identify the candidate genes affecting the sucrose content in the leaves; (2) and validate the candidate genes.

2. Materials and Methods

2.1. Plant Materials

One-hundred and ninety chromosome fragment substitution lines (CSSLs) were built from Suinong 14 (recurrent parents) and ZYD00006. In 2012, 165 CSSL were obtained based on the 85 elementary CSSL by the marker selection, which, including 190 substituted segments, covered 82.55% genome of wild soybean. A fine mapping population was created by selecting homozygous recombinant BC3F2, BC3F3, BC3F4, BC3F5, and BC3F6 lines. These lines were developed by backcrossing selected F1 lines (a cross between Suinong 14 as the recurrent parent and ZYD00006 as the donor parent) to Suinong 14 and then self-pollinating until the F2 generation. By marker-assisted selection (MAS) for recurrent parent genome and backcrossing again with Suinong 14, we obtained 85 BC3F2 lines. After several rounds of selfing and MAS, we obtained a total of 190 lines, consisting of BC3F2, BC3F3, BC3F4, BC3F5, and BC3F6 individuals [15]. The CSSLs were sowed in Xiangyang Farm experimental field (45.75° N, 126.53° E) in Harbin, China in 2021–2022, using a completely random design of three rows, 3 m in length, 65 cm in ridge spacing, and 6 cm in plant spacing, with three repetitions. The field management is the same as that of the local field.

2.2. Measurement of Leaf Sucrose Content

Seven samples of 190 CSSLs were collected from 4:00 pm to 5:00 pm. When the fourth trifoliate compound leaf was fully unfolded (V4 period), the third trifoliate compound leaf was collected in an EP tube and stored in liquid nitrogen at −80 °C for the determination of sucrose content in the leaves. The sucrose content in the leaves was determined by a sucrose content kit (YX-W-B502, Sino Best Biological, Nanjing, China). Firstly, alkali was used to co-heat the sample to destroy the reducing sugar. Under acidic conditions, sucrose was hydrolyzed to produce glucose and fructose, and fructose further reacted with m-diphenol to produce colored substances, which had a characteristic absorption peak at 480 nm, determined by an enzyme-labeled instrument. The sucrose content in the leaves was calculated according to the following formula:
Sucrose   content   ( mg / g ) = ( C × V 1 ) × ( A 3 A 1 ) ( A 2 A 1 ) × ( W × V 1 / V 2 )
The light absorption values of blank tube, standard tube, and measuring tube are recorded as A1, A2, and A3, respectively. W: fresh weight of sample; C: standard tube concentration, 1 mg/mL; V1: added sample volume, 0.025 mL; V2: volume of added extract, 1 mL.

2.3. Method of QTL Mapping

The basic statistics of the sucrose content of parents and offspring of the CSSLs population, including minimum value, maximum value, average value, coefficient of variation, standard deviation, skewness, and kurtosis, were analyzed by Microsoft Excel 2021. The genetic map for QTL mapping was constructed by Zheng et al. [16], based on sequencing with an average genome depth more than 27× in the parent varieties and 5× in the CSSLs lines. A total of 580,524 different SNPs were screened around the 20 chromosomes and divided into 3780 bin markers based on the sequencing results of the SN14 and ZYD0006. The range of the marker length was from 20 kb to 22.91 Mb, with an average of 225.12 kb, and 79.2% of the markers were less than 0.2 Mb. Bin markers contributed by the genome screen and ICIM model in QTL IciMapping Version 4.1.0.0 software were used to locate the QTLs of the leaf sucrose content in CSSLs. A likelihood ratio test based on stepwise regression model (RSTEP-LRT-ADD) and 1000 permutation tests were used to analyze the phenotypic data. QTL naming was based on the methods of previous researchers: the structure of QTL names is as follows: Q + trait names + linkage groups or linkage groups number + “−” + QTL number.

2.4. Candidate Gene Mining and Sequence Alignment

The genes located in the QTL region were enriched and analyzed by gene ontology analysis (GO) and the candidate genes annotated by GO were compared with the reference genome Williams82 for the promoter and CDS sequence. The promoter and CDS sequence of candidate gene from Williams82 was obtained from the phytozome website (https://phytozome.jgi.doe.gov/pz/portal.html, accessed on 20 March 2023). The parents SN14 and ZYD00006 were sequenced [16] to obtain the promoter and CDS sequence of the candidate gene. Additionally, we used DNAMAN to compare the promoter and CDS sequences of Williams82, SN14, and ZYD00006. The software can clearly display the position of the mutation in the promoter sequence. Motif prediction of the promoter sequence was performed on the MEME website. The protein structures were predicted by SWISS-MODEL (https://swissmodel.expasy.org/, accessed on 20 March 2023).

2.5. Real-Time Quantitative PCR Analysis of Candidate Genes

In order to verify the results of the sequencing data, the leaves of parents and progeny strains with different sucrose contents were collected in the V4 stage, and total RNA was extracted by an OMEGA plant RNA kit. Then, the first-strand cDNA was synthesized from the total RNA samples using a Toyo Spinning Reverse Transcriptase Kit. In order to study the transcription level of candidate genes in different lines, qRT-PCR analysis was carried out using the LightCycler480 system, primers were designed using the Pick Primer online tool of the NCBI official website, and Primer Blast was used to test the specificity of the primers. The annealing temperature range was 61.7~63.1 °C. Gmactin 4 (GenBank: af049106) was used as an internal reference. The relative transcription level of the candidate genes was calculated according to the 2−∆∆CT method. Three replicates were set for each sample. Primers were synthesized by Ruibo Xingke Biotechnology Co., Ltd., (Beijing, China), as shown in Table S1.

2.6. Haplotype Analysis

The local BLAST analysis was carried out on the sequence information of candidate genes in the QTL interval in the CSSLs population resequencing data, and the SNP information of candidate genes in germplasm resources population was obtained. In this study, the haplotype distribution of candidate gene SNP sequences in the germplasm resources population was analyzed by DNA Sequence Polymorphism Version 6.12.03 software. The haplotypes and phenotypes of candidate genes were analyzed by SPSS software to determine the influence of each haplotype on phenotype.

3. Results

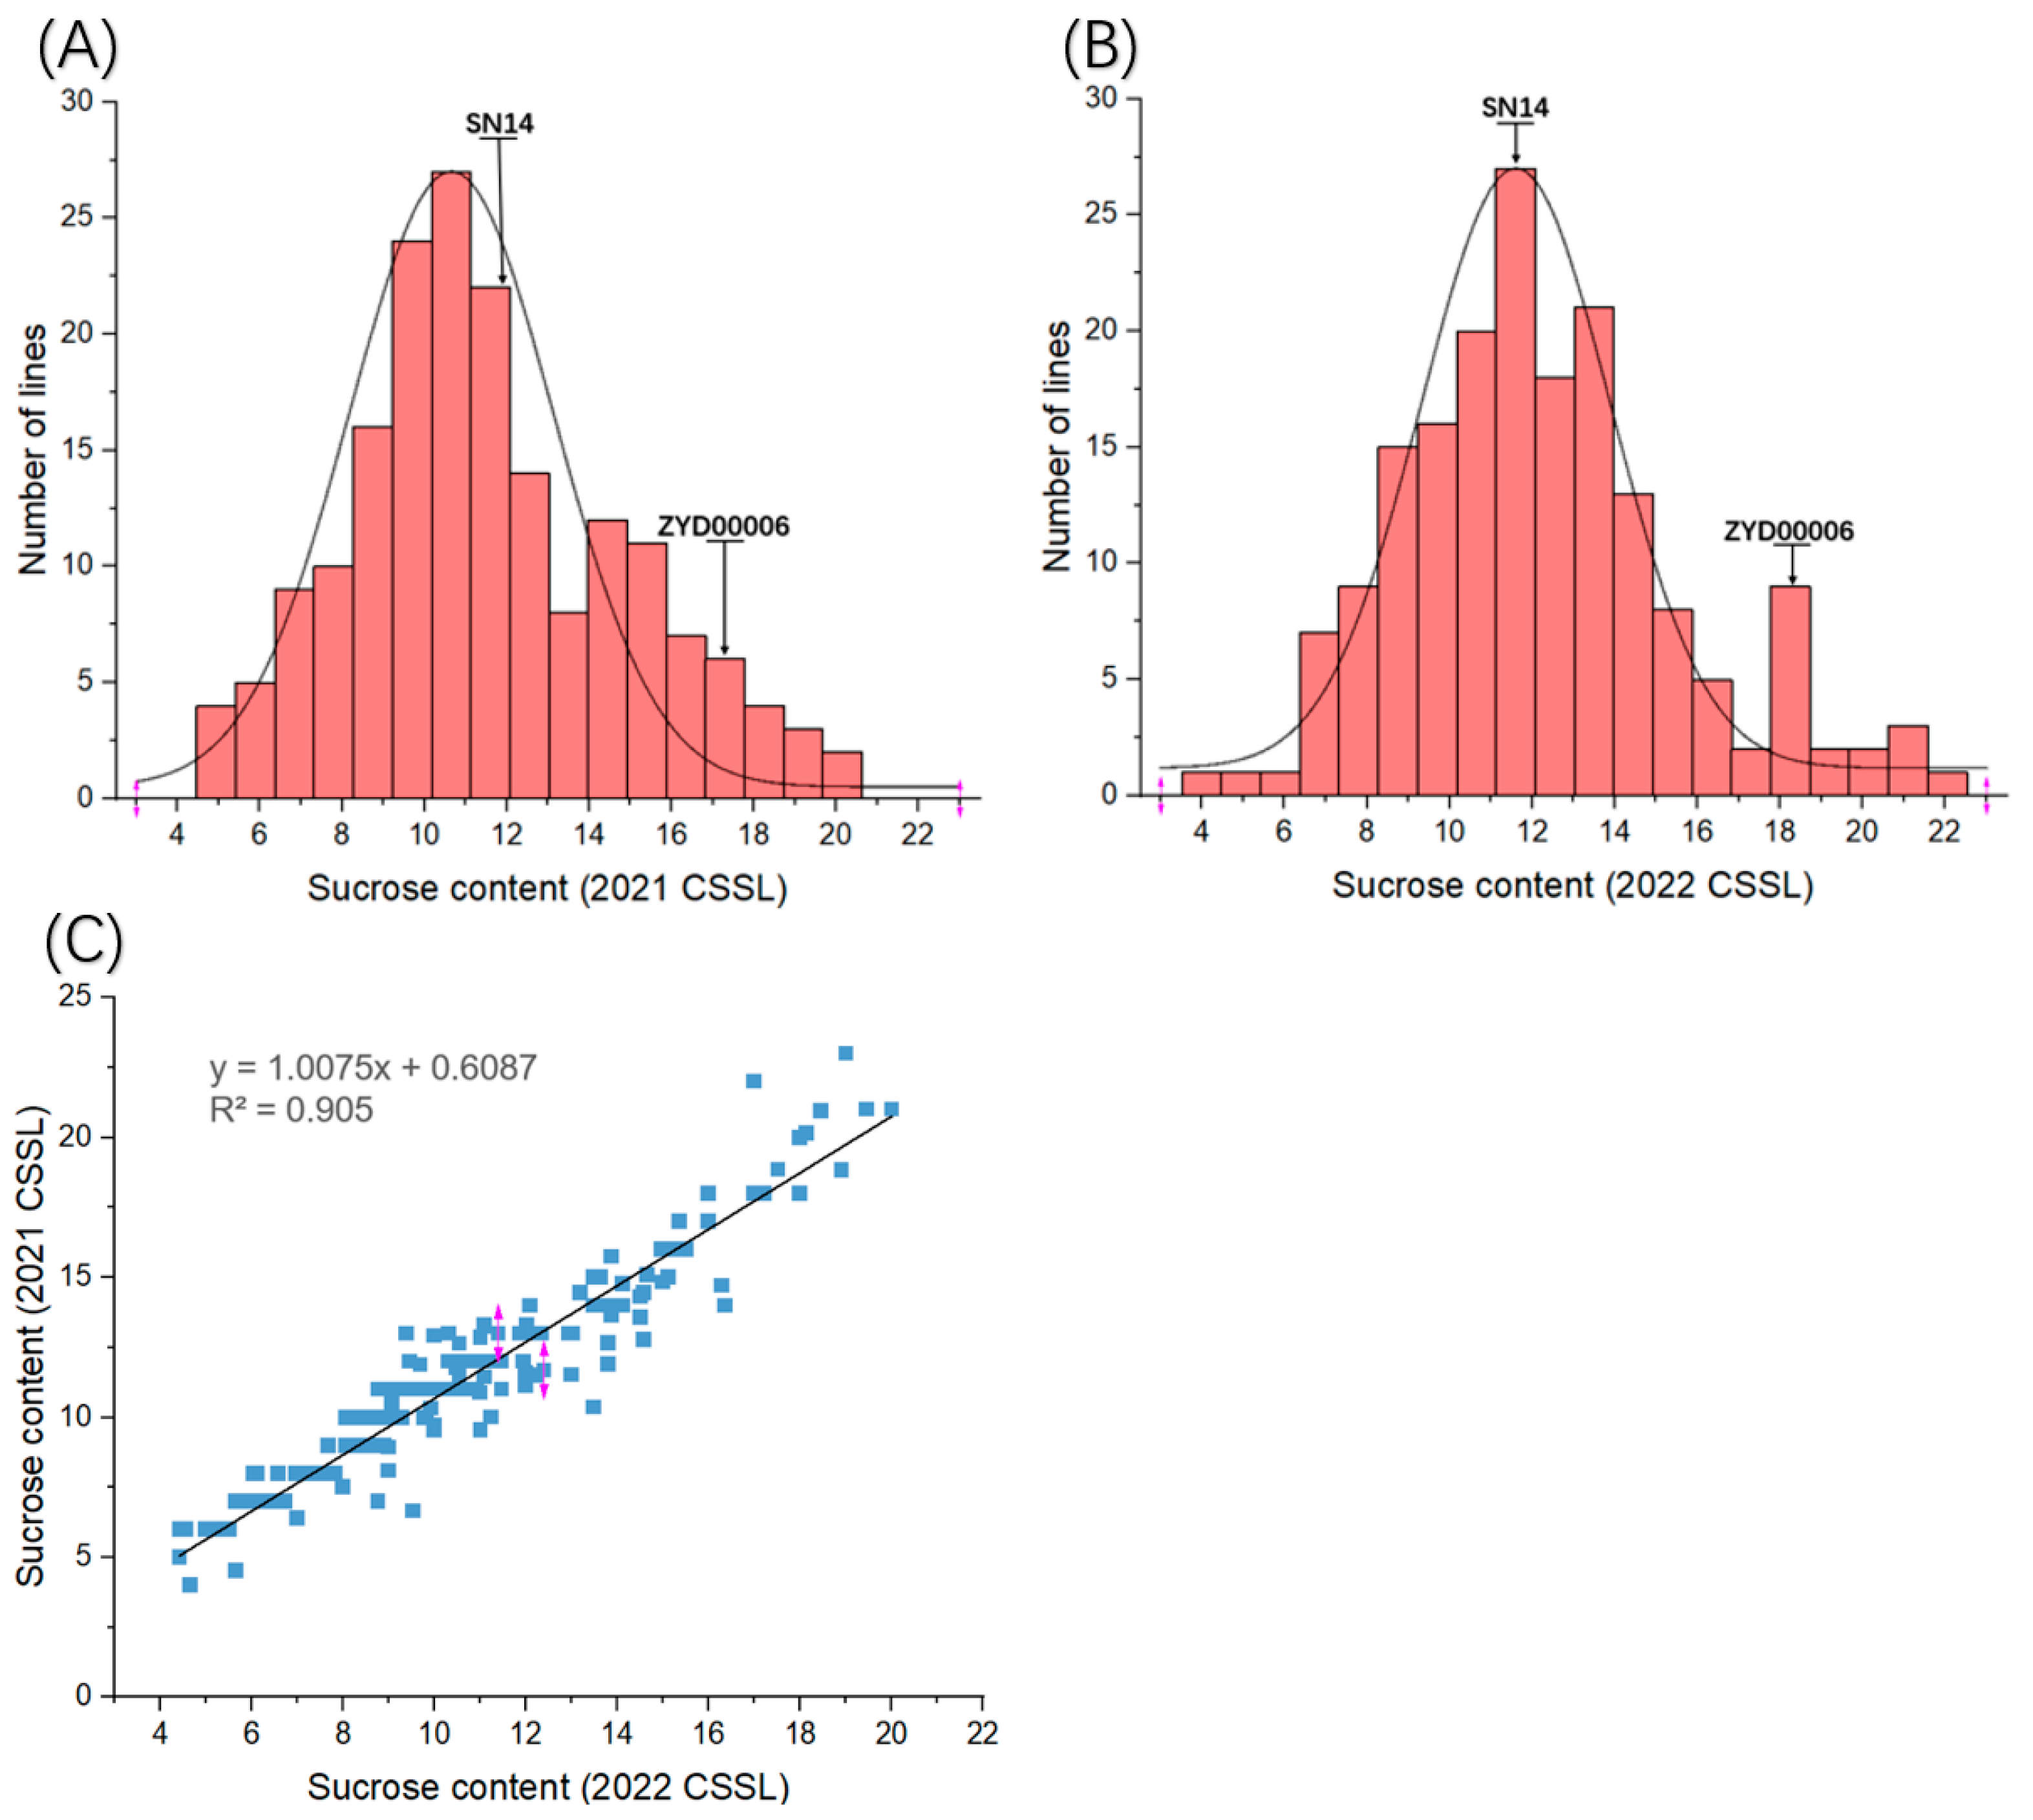
3.1. Distribution of Sucrose Content in CSSLs Population

The sucrose content of the third trifoliolate leaf of the CSSLs population collected from 2021 to 2022 was determined. SN14 had a lower leaf sucrose content than ZYD0006 in both 2021 and 2022, which was 12.37 mg/g and 17.58 mg/g (2021); and 11.68 mg/g and 18.66 mg/g (2022). The maximum leaf sucrose content in CSSLs lines was 22.06 mg/g, the minimum was 4.53 mg/g, and the average content was 13.69 mg/g. Meanwhile, the leaf sucrose content of 2022 CSSLs lines ranged from 3.80 mg/g to 20.02 mg/g, with an average of 11.26 mg/g (Table 1). The correlation coefficient of sucrose content in the CSSLs population from 2021 to 2022 was 0.951 (Figure 1C), which indicated that the sucrose content in the CSSLs population was stable from 2021 to 2022. From 2021 to 2022, the skewness of the distributions was less than 1.0 and the kurtosis was negative (Table 1), which showed a continuous normal distribution of the leaf sucrose content in 2021 (Figure 1A) and 2022 (Figure 1B) and was suitable for QTL mapping. The correlation analysis of leaf sucrose content data of the CSSLs population from 2021 to 2022 was carried out, and the correlation coefficient was 0.951 (Figure 1C). The results showed that the data of sucrose content in leaves of the CSSLs population was stable from 2021 to 2022.

3.2. Identification of QTLs Associated with Leaf Sucrose Content

Based on the genetic linkage map of soybean, ICIMMapping software was used to identify the QTL with the CSSLs population (Table 2). From 2021 to 2022, three QTLs related to leaf sucrose content were identified within the CSSLs population. They distributed in two linkages groups, B2 and D1a, with a contribution rate of 4.60% and 35.89%, respectively. Among them, qSuC-B2-1 was repeatedly detected to be located on Block 7226, starting at 2.12 Mb with a 0.13 Mb area on the B2 linkage group with a LOD score reached at 17.25 and 14.09 from 2021 to 2022 (Table 2), explaining contributions of 35.89% and 29.77% in 2021 and 2022, which indicates that qSuC-B2-1 was a stable QTL related to sucrose content.

3.3. Candidate Genes Identification

According to the Williams 82 soybean reference genome annotation information in the Phytozome database, a total of 18 genes were extracted from the qSuC-B2-1 area (Chr14: 2115358..2242125) (Table 3). Gene ontology analysis was carried out on the qSuC-B2-1 (Chr14: 2115358..2242125) and only nine candidate genes with GO annotations were identified in the eighteen genes (Table 4).

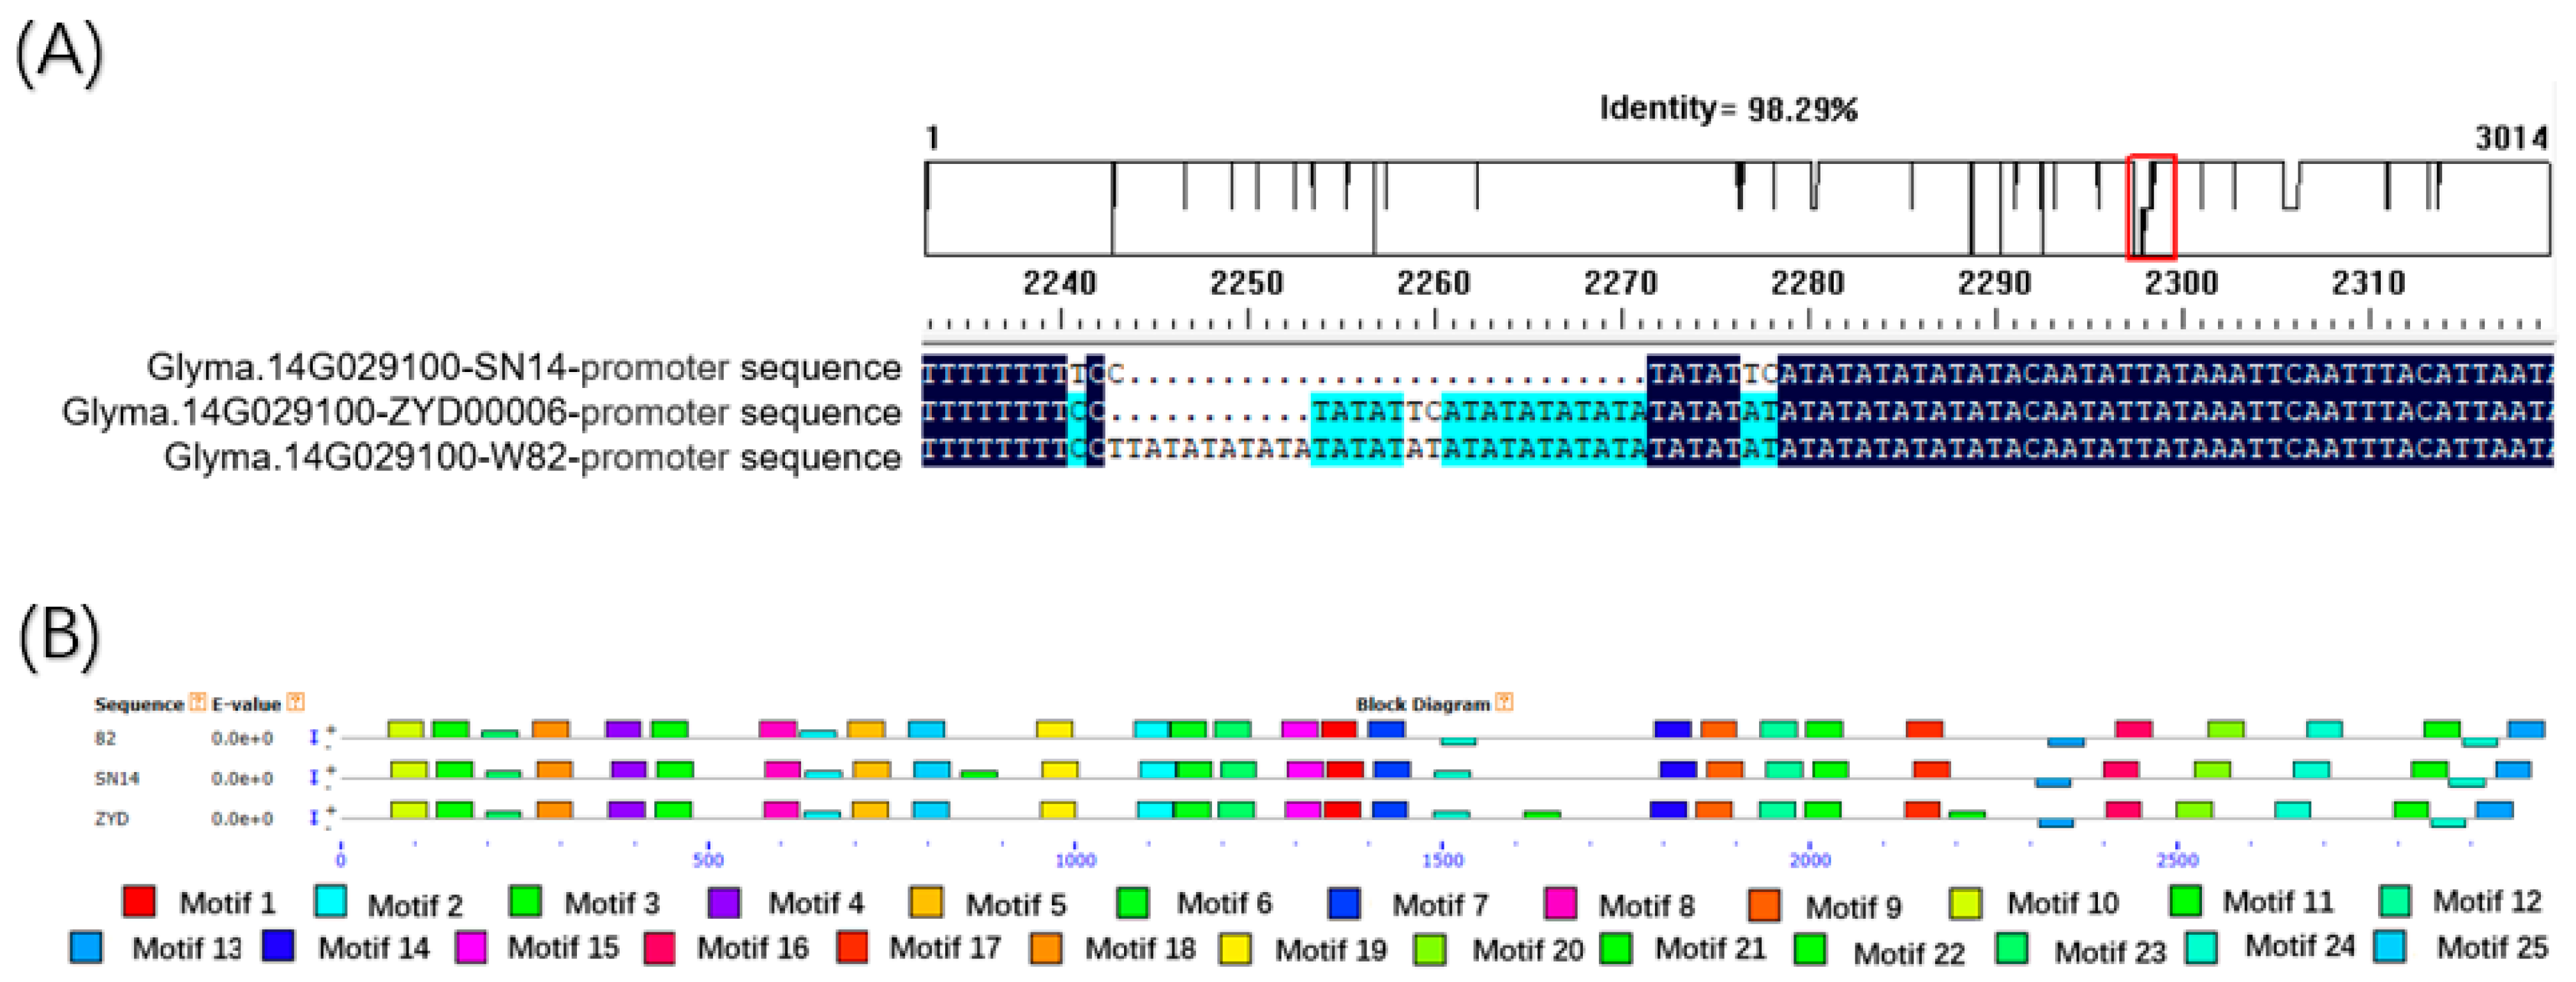
3.4. Candidate Gene Sequence Alignment of SN14 and ZYD00006

The molecular underpinnings of the CSSLs can be traced back to their progenitors, SN14 and ZYD00006. To elucidate the genetic variations within the promoter regions of putative genes between the parental strains and the reference genome (Williams82), promoter sequences from SN14 and ZYD00006 were extracted and subjected to comparative analysis (Figure 2A). This investigation uncovered disparities in the promoter regions of candidate genes between the parental lines and the reference genome, with numerous deletion regions being detected. A total of 25 motifs were identified. To unveil the regulatory elements residing in the Glyma.14G029100 gene’s promoter region, the MEME suite was employed. The examination disclosed that most of the identified motifs (Figure 2B) were conserved among the parental lines and the reference genome; however, it was noted that SN14 exhibited a greater abundance of motifs compared to Williams82. Moreover, two distinct regulatory elements, designated as motif21 and motif22, were exclusively detected in ZYD00006 relative to Williams82.
The length of CDS sequence of Glyma.14G029100 is 3192 bp. The sequence between SN14 and Williams 82 is the same, but 99.95% similarity is shown between ZYD00006 and Williams 82 (Figure 3A). A single SNP mutation of this gene was detected in ZYD00006, at 2867 bp in CDS. SNP mutation leads to the mutation of nonsense amino acid in ZYD00006, and the 955th amino acid changes from M (methionine) to I (isoleucine) (Figure 3B). Further analysis showed that the predicted tertiary structure of ZYD00006 was significantly changed by this amino acid change (Figure 3C). Specifically, in ZYD00006, the number of such protein’s beta angles increases. For example, in ZYD00006, the 955th amino acid participated in the β corner, and SN14 was consistent with Williams 82 (Figure 3C).

3.5. qRT-PCR Analysis of Candidate Genes

In order to verify the results of the sequencing data, we analyzed the relative expression of candidate genes. We selected recurrent parent SN14, donor parent ZYD00006, R149 (lowest leaf sucrose content in CSSLs lines), and R194 (highest leaf sucrose content in CSSLs lines) of offspring of the CSSLs population to verify the relative expression. The qSuC-B2-1 of R149 comes from the recurrent parent SN14. qSuC-B2-1 of R194 comes from the donor parent ZYD00006. The sucrose content of R149 leaves is lower than R194. A t-test of independent samples showed that the relative transcription level of Glyma.14G029100 is different among ZYD00006, SN14, R149, and R194 (Figure 4). The relative transcription level of Glyma.14G029100 is the highest in R194 and the lowest in R149. These results further prove that Glyma.14G029100 is related to sucrose content in leaves.

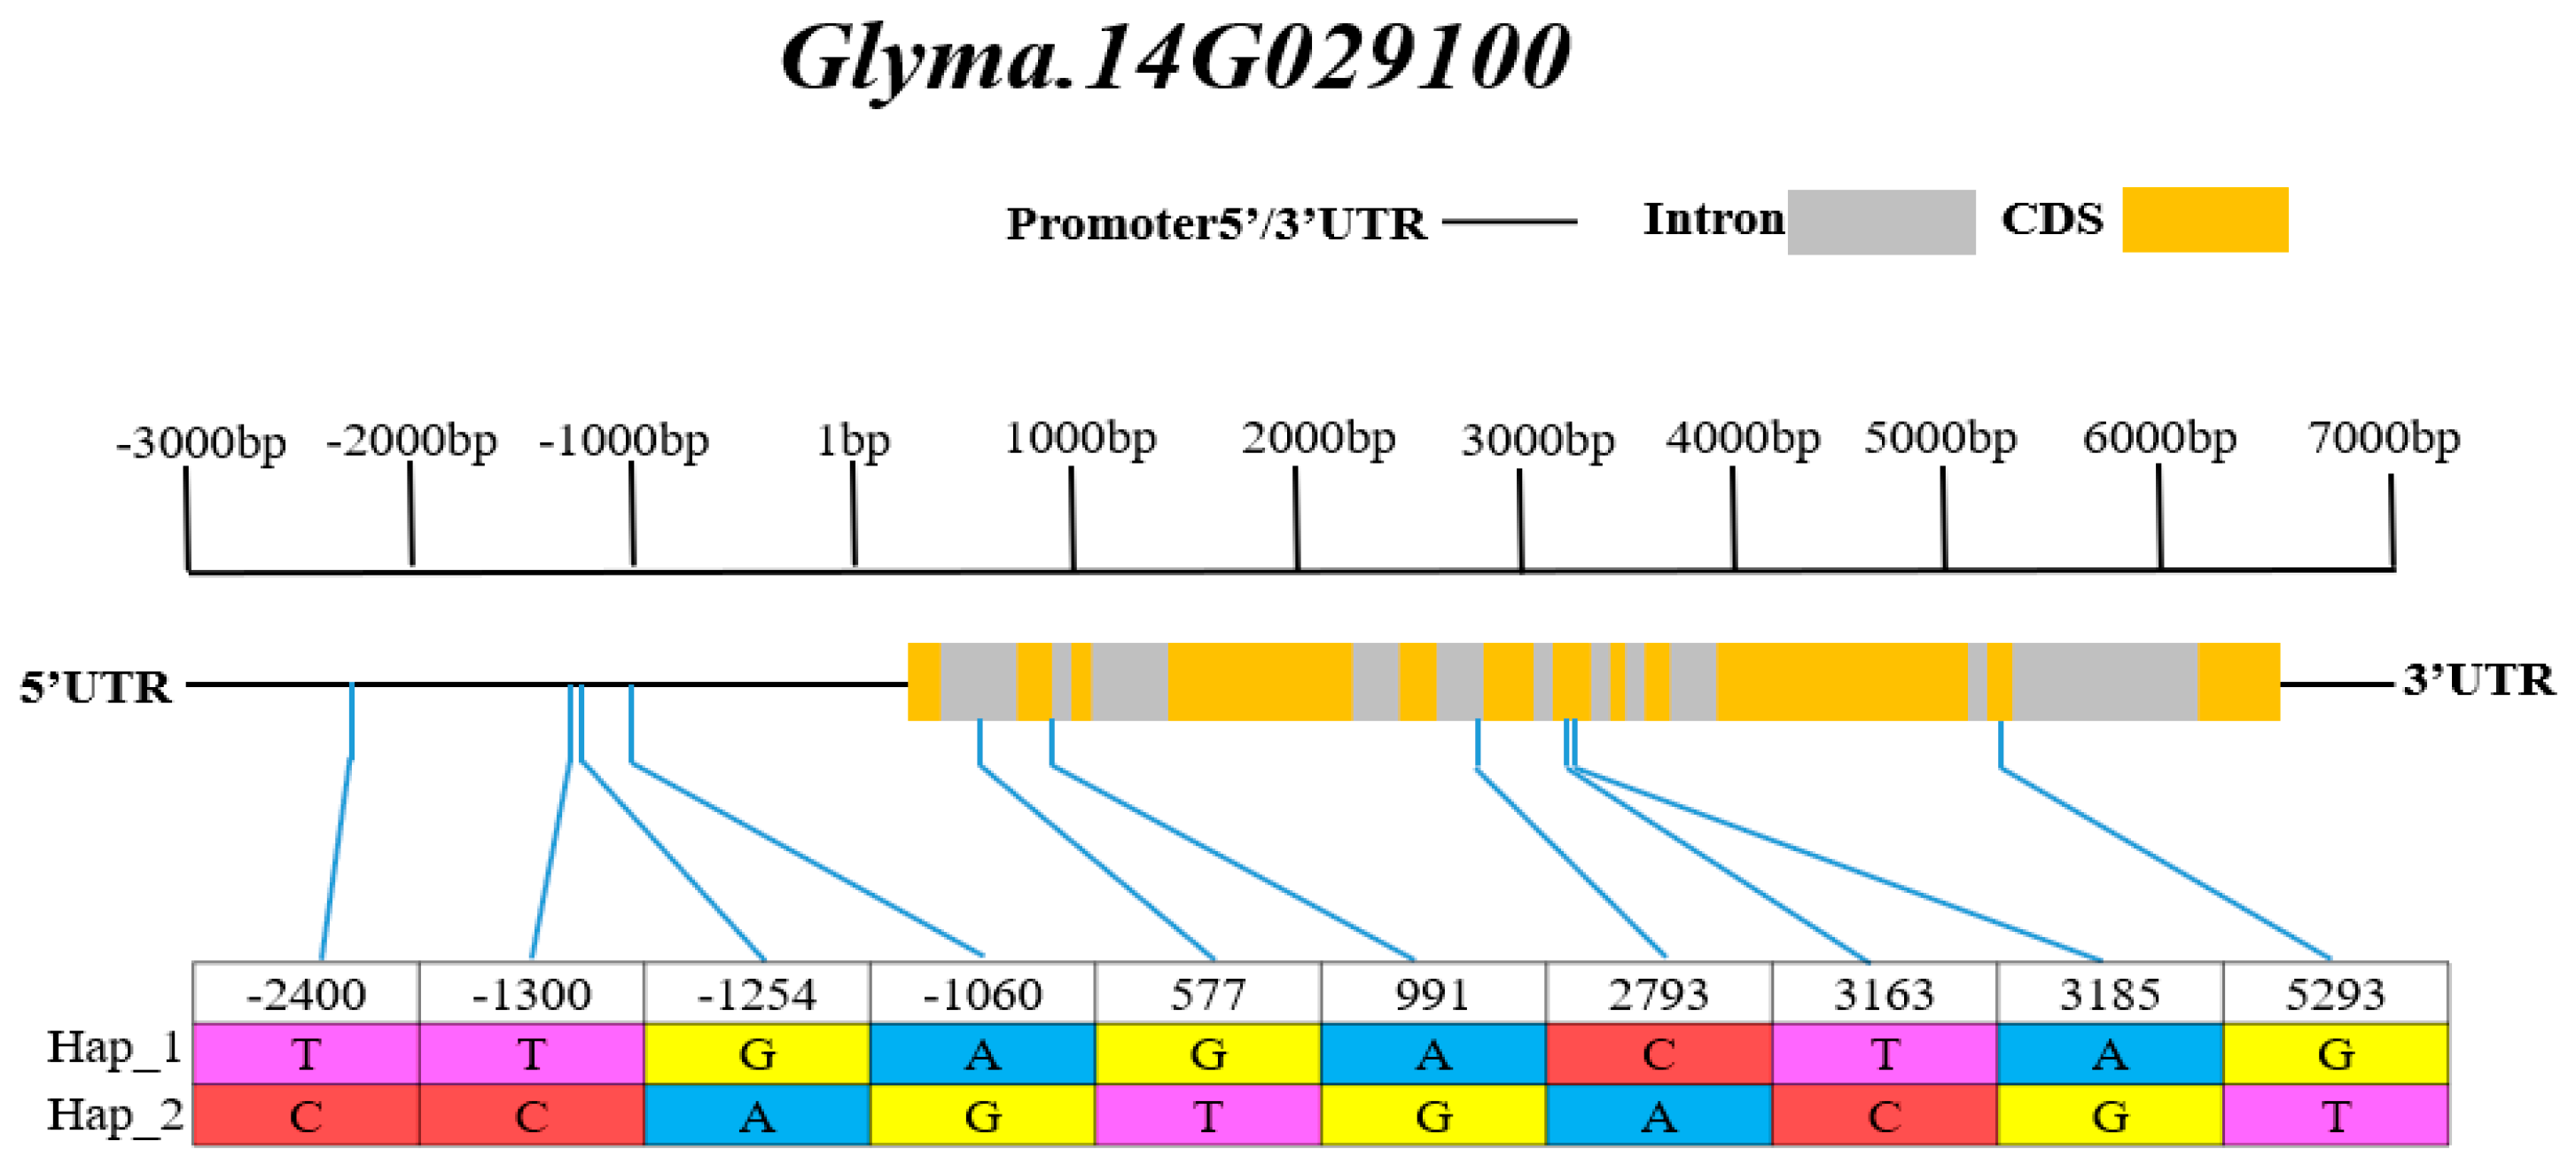
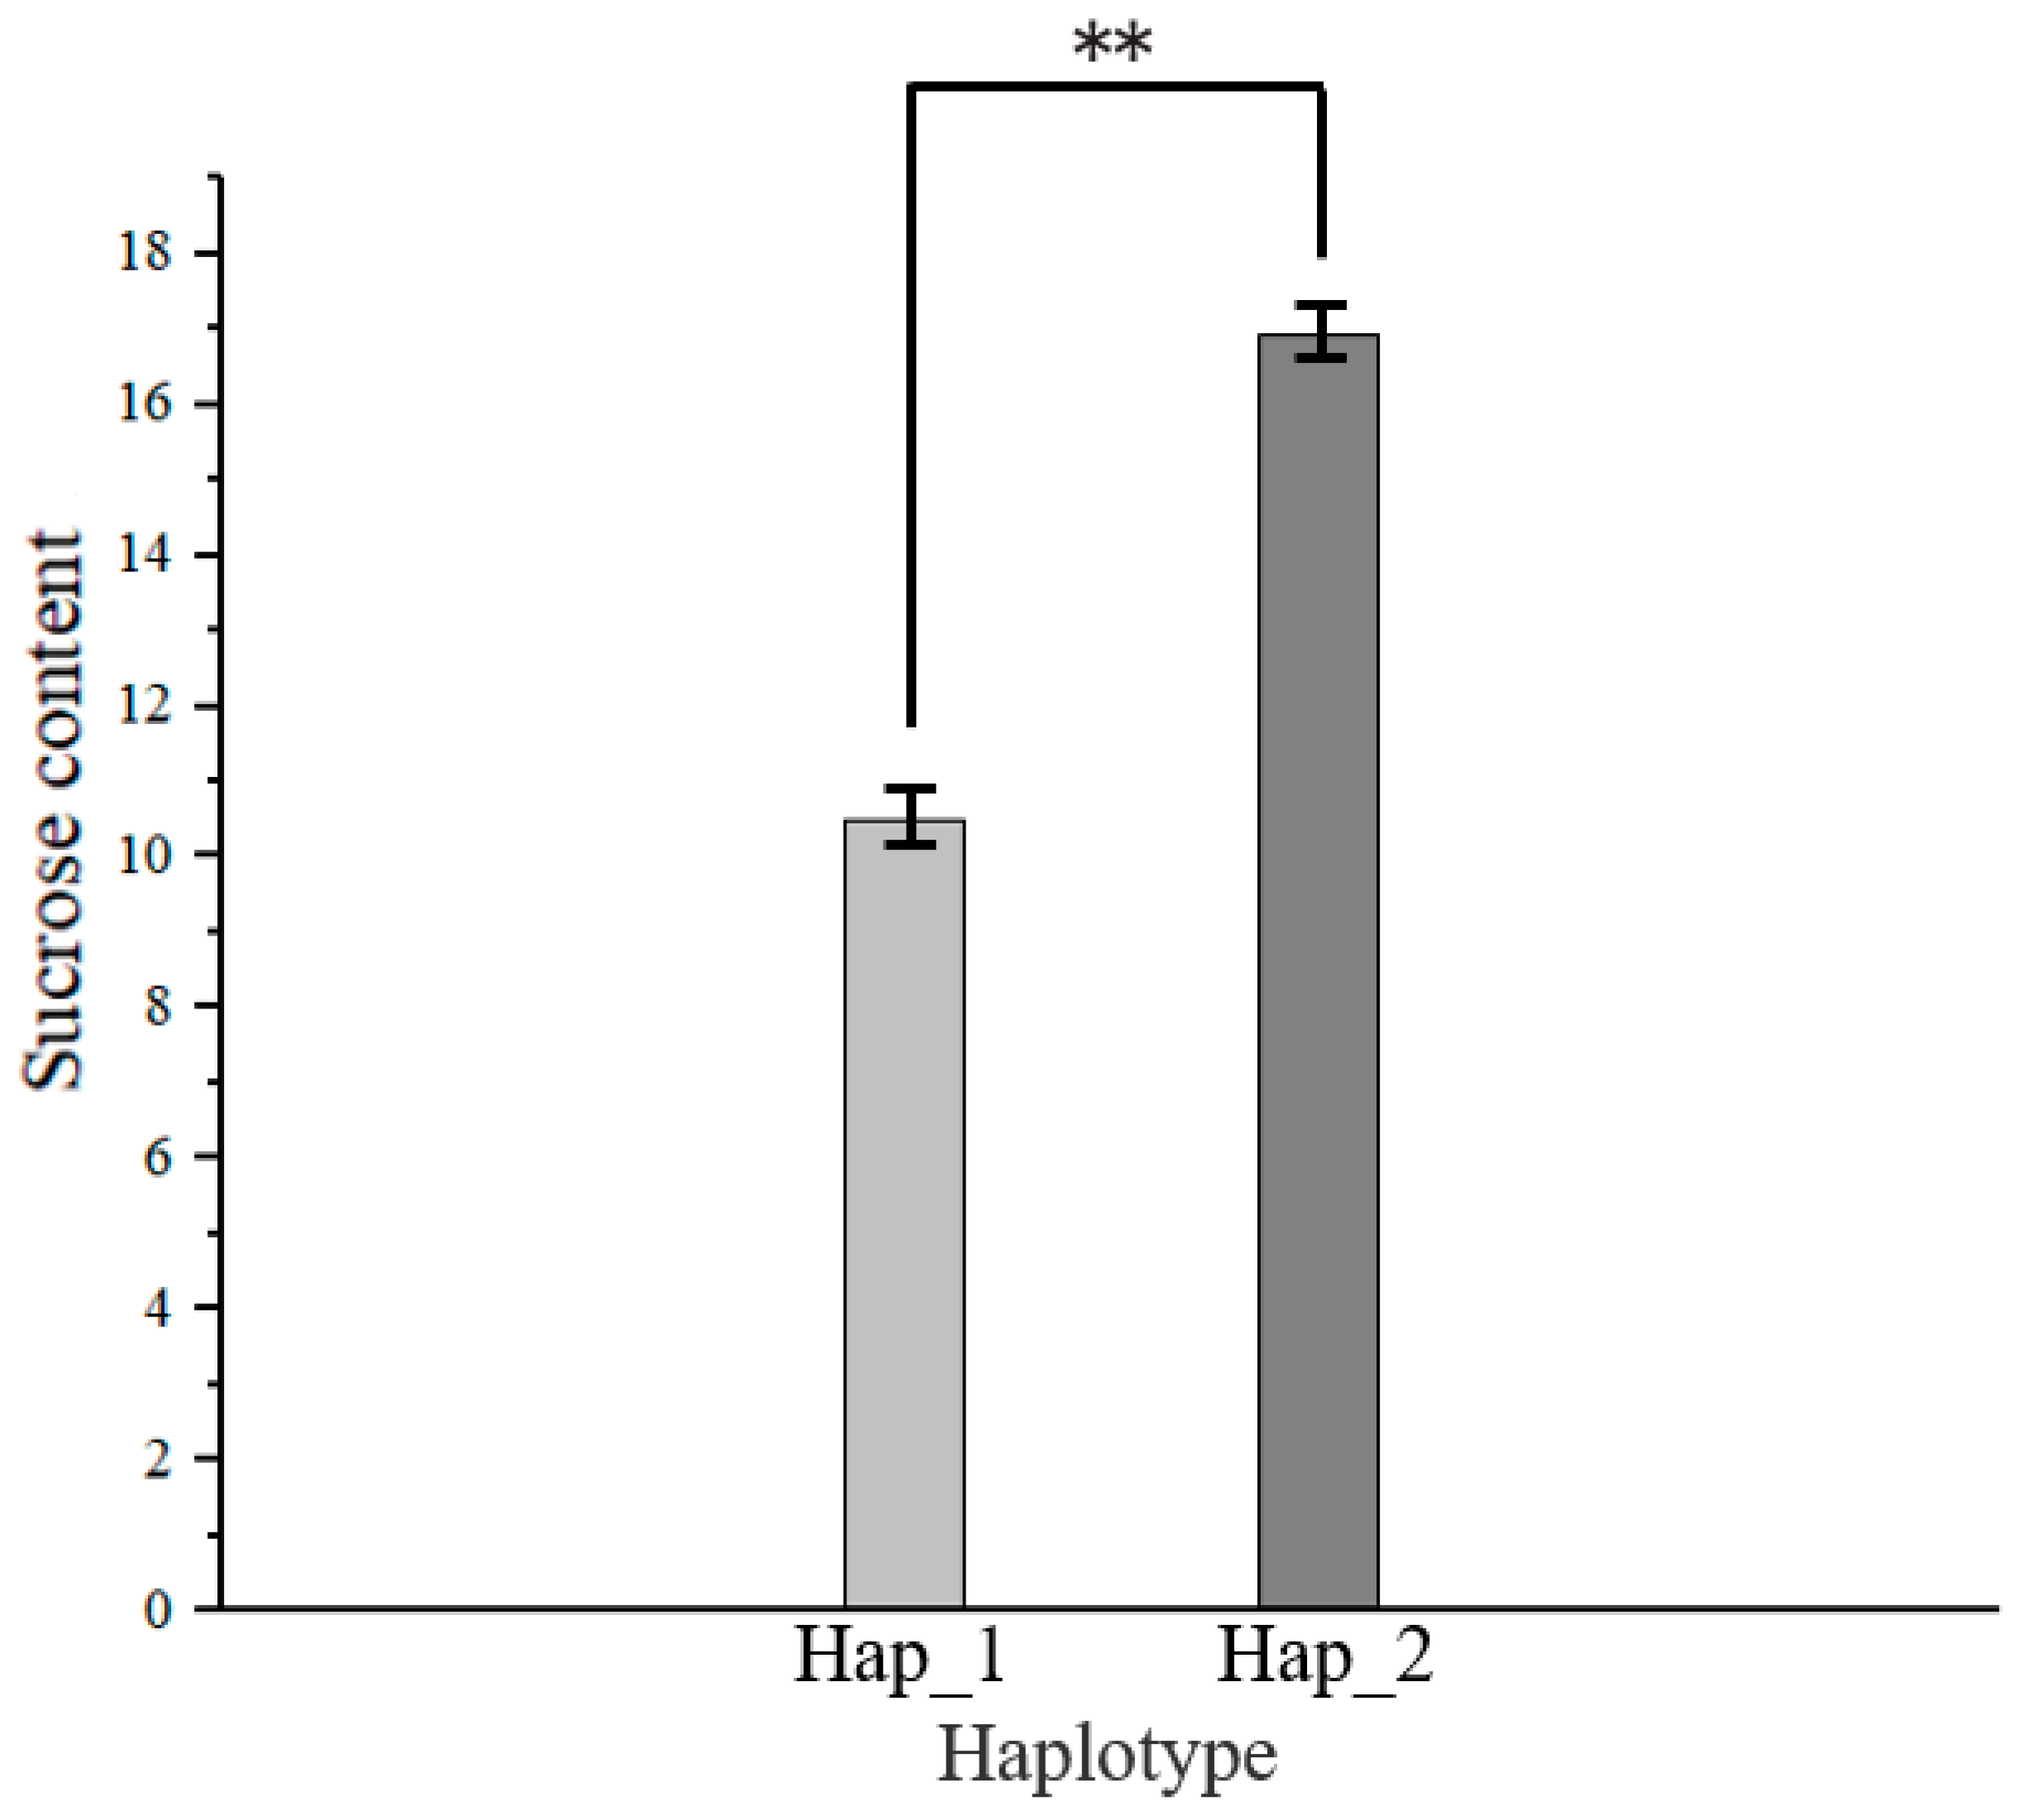
3.6. Haplotype Analysis of Candidate Genes

There were 10 SNP differences between the parents in Glyma.14G029100 and its promoter area, when the same was found in the CSSLs population. Three haplotypes were obtained by haplotype analysis with DNAsp5.0 software. The major haplotypes were defined as the haplotypes carried by 5% or more of the total materials. Only two major haplotypes, Hap_1 and Hap_2, were found in the CSSLS population (Figure 5). The average sucrose content of 167 lines belonging to Hap_1 was 10.48 mg/g, and that of 23 lines belonging to Hap_2 was 16.93 mg/g, and there was a significant difference in leaf sucrose content between Hap1 and Hap_ 2 (Figure 6). The results show that the leaf sucrose content of Hap_2 haplotype was higher. The Glyma.14G029100 of 23 lines belonging to Hap_2 comes from donor parent ZYD00006, and the Glyma.14G029100 gene of 167 lines belonging to Hap_1 comes from recurrent parent SN14.

4. Discussion

In this investigation, a chromosome fragment substitution line (CSSLs) population was employed for QTL mapping. CSSLs populations have been effectively utilized in various crops, such as rice [17,18], corn [19], cucumber [20], and cotton [21]. Additionally, extensive research has been conducted on soybean traits, including 100-grain weight (Xin et al., 2016) [15] and seed shape [22]. CSSLs are high-generation backcross populations created through multiple backcrossing of the parental hybrid F1 generation and the recurrent parent, combined with molecular marker-assisted selection of the donor parent chromosome fragment. The genetic background of CSSLs typically stems from the recurrent parent, containing only one or a few introduced fragments from the donor parent, which significantly minimizes genetic background interference. As a result, CSSLs serve as ideal materials for QTL positioning due to enhanced QTL accuracy. The long-term process of crop domestication, which selects only the best seeds for each generation, ultimately reduces the genetic diversity of the entire genome [23]. Each line within the population contains only one or a few introduced fragments, facilitating rapid and precise localization of the main QTL due to minimal genetic differences. However, the chromosome fragment substitution line used in our study was non-idealized CSSLs: the CSSLs were still carrying 2441 introgressed segments (including 459 introgressed segments with a single bin marker), whose length ranged from 0.02 Mb to 51.74 Mb, which contained large introgressed fragments. Otherwise, among the above introgressed segments, 60.43% of the introgressed segments were less than 1 Mb, which could also provide precious QTLs related to concerning traits. The purpose of constructing the SN14 × ZYD00006 soybean CSSLs population is to facilitate the genetic analysis of quantitative traits in soybean and improve the accuracy of marker-assisted breeding. Xin et al. used this population to determine the valuable loci for increasing the weight of 100 soybean grains. Li et al., [15] using this population, found three candidate genes related to embryonic development [24].
Soybean breeders have aimed to boost plant productivity, primarily in terms of biomass, to optimize crop yield, carbon sequestration, and biofuel production [25]. Genes involved in sucrose metabolism play a vital role in primary plant growth, consequently influencing biomass production [25]. Sucrose metabolism in leaves significantly affects biomass accumulation. Sucrose, the primary product of photosynthesis, can be directly utilized by glycolysis or translocated within the plant as a soluble carbohydrate via the phloem. It constitutes the most abundant form of soluble storage carbohydrate and functions as a signaling molecule that initiates critical metabolic events. Upon importation into sink tissues, sucrose can be utilized for cellular metabolism maintenance, cell wall biosynthesis, respiration, or conversion into starch for later use [26]. In the presence of light, sucrose is synthesized in the cytoplasm of source leaves.
Therefore, in this study, we assessed the sucrose content of the third ternate leaf of the CSSLs population at the V4 stage from 2021 to 2022. Based on the genetic map, we identified a QTL, qSuC-B2-1, which was introduced from the male parent ZYD00006 and had a high sucrose content in the leaves. We screened nine candidate genes with GO annotation within this QTL, excluding Glyma.14G030000, Glyma.14G030300, and Glyma.14G030400, as they were not expressed in leaves, based on the analysis of transcriptome data in Williams82 [26]. To identify the hub gene related to leaf sucrose content from the remaining six candidate genes, we performed qRT-PCR in the female parent SN14, the male parent ZYD00006, and R194, which carried the qSuCB2-1 QTL fragment from the male parent and showed the highest leaf sucrose content among the CSSLs. The results indicated no significant difference in the relative transcription levels of the candidate genes, except for Glyma.14G029100. The relative transcriptional level of Glyma.14G029100 was the lowest in the female parent SN14 and higher in the male parent ZYD00006. The differential expression of Glyma.14G029100 may lead to a higher sucrose content in leaves of wild parents (ZYD00006–Glycine soja) than SN14 varieties (G. max). By comparing the promoter sequences of Glyma.14G029100, it was found that the promoter sequences were quite different, which may be the reason for the differences in the expression between parents. Motifs, essential DNA sequences found in promoters and enhancers, play a pivotal role in the regulation of gene expression levels. In promoters, motifs facilitate the recruitment of general transcription factors (TFs) and RNA polymerase, which subsequently initiate transcription, leading to basal gene expression levels. Enhancers, on the other hand, contain cell-type-specific motifs that recruit TFs responsible for phenotype-determining gene induction from a distance via chromatin looping. The interaction of TFs with promoter motifs modulates transcription rates, underscoring the central role of TFs in gene regulation. Promoter elements and motifs contribute to gene expression flexibility on short timescales, facilitating immediate cellular responses to environmental changes, as well as on longer timescales, enabling evolutionary adaptation to novel conditions. A mutation was also found in amino acid sequence alignment. It is speculated that the amino acid mutation site we found may affect the activity of sucrose phosphate synthase, thus affecting the accumulation of sucrose content. In the haplotype analysis of Glyma.14G029100 in the CSSLs population, we found two haplotypes, Hap_1 and Hap_2. The two haplotypes of this candidate gene have mutation sites in both the promoter sequence and gene sequence. The average sucrose content in leaves of Hap_1 was significantly lower than that of Hap_2, suggesting that the haplotype of this gene was related to the sucrose content in leaves (Figure S1).

5. Conclusions

A QTL related to sucrose content in leaves was identified by QTL mapping analysis in the CSSL population. Nine candidate genes were screened in this QTL region, and a hub gene was screened by parent sequence comparison and relative expression analysis. The haplotype analysis showed that the candidate gene was closely related to sucrose content in leaves. However, further studies are needed to elucidate the molecular mechanism of Glyma.14G029100.

Supplementary Materials

The following supporting information can be downloaded at: https://www.mdpi.com/article/10.3390/agronomy13061592/s1, Table S1: qRT-PCR primer sequences of candidate genes. Figure S1: The relative transcription level of other candidate genes in leaves of parents and lines with high sucrose content at V4 stage.

Author Contributions

Conceptualization, D.Z. and M.Z.; methodology, Y.W., C.H.; software, Y.W.; validation, C.S., D.Z. and Z.Q.; investigation, C.S. and X.W.; resources, C.S.; data curation, Z.Q.; writing—original draft preparation, Y.W. and X.Y.; writing—review and editing, X.Y.; supervision, D.Z.; project administration, Q.C. and D.Z.; funding acquisition, Z.Q. All authors have read and agreed to the published version of the manuscript.

Funding

This study was supported by the Natural Science Foundation of Heilongjiang-Outstanding Youth Foundation (YQ2021C011), and the ‘High-quality’ Soybean Breeding Project (to Qi Zhaoming) of Hainan Yazhou Lab.

Data Availability Statement

Not applicable.

Conflicts of Interest

The authors declare no conflict of interest.

References

  1. Anderson, E.J.; Ali, M.L.; Beavis, W.D.; Chen, P.; Clemente, T.E.; Diers, B.W.; Graef, G.L.; Grassini, P.; Hyten, D.L.; McHale, L.K.; et al. Soybean [Glycine max (L.) Merr.] Breeding: History, Improvement, Production and Future Opportunities. In Advances in Plant Breeding Strategies: Legumes; Springer: Cham, Switzerland, 2019; pp. 431–516. [Google Scholar]
  2. Sagara, T.; Bhandari, D.R.; Spengler, B.; Vollmann, J. Spermidine and other functional phytochemicals in soybean seeds: Spatial distribution as visualized by mass spectrometry imaging. Food Sci. Nutr. 2020, 8, 675–682. [Google Scholar] [CrossRef] [Green Version]
  3. Yun, D.-Y.; Kang, Y.-G.; Yun, B.; Kim, E.-H.; Kim, M.; Park, J.S.; Lee, J.H.; Hong, Y.-S. Distinctive Metabolism of Flavonoid between Cultivated and Semiwild Soybean Unveiled through Metabolomics Approach. J. Agric. Food Chem. 2016, 64, 5773–5783. [Google Scholar] [CrossRef]
  4. Stitt, M.; Zeeman, S.C. Starch turnover: Pathways, regulation and role in growth. Curr. Opin. Plant Biol. 2012, 15, 282–292. [Google Scholar] [CrossRef]
  5. Comparot-Moss, S.; Denyer, K. The evolution of the starch biosynthetic pathway in cereals and other grasses. J. Exp. Bot. 2009, 60, 2481–2492. [Google Scholar] [CrossRef] [Green Version]
  6. Wind, J.; Smeekens, S.; Hanson, J. Sucrose: Metabolite and signaling molecule. Phytochemistry 2010, 71, 1610–1614. [Google Scholar] [CrossRef]
  7. Tarpley, L.; Vietor, D.M. Compartmentation of sucrose during radial transfer in mature sorghum culm. BMC Plant Biol. 2007, 7, 33. [Google Scholar] [CrossRef] [PubMed] [Green Version]
  8. Chia, T.; Thorneycroft, D.; Chapple, A.; Messerli, G.; Chen, J.; Zeeman, S.C.; Smith, S.M.; Smith, A.M. A cytosolic glucosyltransferase is required for conversion of starch to sucrose in Arabidopsis leaves at night. Plant J. 2004, 37, 853–863. [Google Scholar] [CrossRef] [PubMed]
  9. Schäfer, W.E.; Rohwer, J.M.; Botha, F.C. Partial purification and characterisation of sucrose synthase in sugarcane. J. Plant Physiol. 2005, 162, 11–20. [Google Scholar] [CrossRef]
  10. Maughan, P.J.; Maroof, M.S.; Buss, G.R. Identification of quantitative trait loci controlling sucrose content in soybean (Glycine max). Mol. Breed. 2000, 6, 105–111. [Google Scholar] [CrossRef]
  11. Kim, H.-K.; Kang, S.-T.; Cho, J.-H.; Choung, M.-G.; Suh, D.-Y. Quantitative trait loci associated with oligosaccharide and sucrose contents in soybean (Glycine max L.). J. Plant Biol. 2005, 48, 106–112. [Google Scholar] [CrossRef]
  12. Skoneczka, J.A.; Maroof, M.A.S.; Shang, C.; Buss, G.R. Identification of Candidate Gene Mutation Associated with Low Stachyose Phenotype in Soybean Line PI200508. Crop Sci. 2009, 49, 247–255. [Google Scholar] [CrossRef]
  13. Zeng, A.; Chen, P.; Shi, A.; Wang, D.; Zhang, B.; Orazaly, M.; Florez-Palacios, L.; Brye, K.; Song, Q.; Cregan, P. Identification of Quantitative Trait Loci for Sucrose Content in Soybean Seed. Crop Sci. 2014, 54, 554–564. [Google Scholar] [CrossRef]
  14. Sui, M.; Wang, Y.; Bao, Y.; Wang, X.; Li, R.; Lv, Y.; Yan, M.; Quan, C.; Li, C.; Teng, W.; et al. Genome-wide association analysis of sucrose concentration in soybean (Glycine max L.) seed based on high-throughput sequencing. Plant Genome 2020, 13, e20059. [Google Scholar] [CrossRef] [PubMed]
  15. Xin, D.; Qi, Z.; Jiang, H.; Hu, Z.; Zhu, R.; Hu, J.; Han, H.; Hu, G.; Liu, C.; Chen, Q. QTL Location and Epistatic Effect Analysis of 100-Seed Weight Using Wild Soybean (Glycine soja Sieb. & Zucc.) Chromosome Segment Substitution Lines. PLoS ONE 2016, 11, e0149380. [Google Scholar] [CrossRef] [Green Version]
  16. Zheng, H.; Hou, L.; Xie, J.; Cao, F.; Wei, R.; Yang, M.; Qi, Z.; Zhu, R.; Zhang, Z.; Xin, D.; et al. Construction of Chromosome Segment Substitution Lines and Inheritance of Seed-Pod Characteristics in Wild Soybean. Front. Plant Sci. 2022, 13, 869455. [Google Scholar] [CrossRef]
  17. Mulsanti, I.W.; Yamamoto, T.; Ueda, T.; Samadi, A.F.; Kamahora, E.; Rumanti, I.A.; Thanh, V.C.; Adachi, S.; Suzuki, S.; Kanekatsu, M.; et al. Finding the superior allele of japonica-type for increasing stem lodging resistance in indica rice varieties using chromosome segment substitution lines. Rice 2018, 11, 25. [Google Scholar] [CrossRef]
  18. Ookawa, T.; Aoba, R.; Yamamoto, T.; Ueda, T.; Takai, T.; Fukuoka, S.; Ando, T.; Adachi, S.; Matsuoka, M.; Ebitani, T.; et al. Precise estimation of genomic regions controlling lodging resistance using a set of reciprocal chromosome segment substitution lines in rice. Sci. Rep. 2016, 6, 30572. [Google Scholar] [CrossRef] [Green Version]
  19. Wang, H.; Zhang, X.; Yang, H.; Liu, X.; Li, H.; Yuan, L.; Li, W.; Fu, Z.; Tang, J.; Kang, D. Identification of heterotic loci associated with grain yield and its components using two CSSL test populations in maize. Sci. Rep. 2016, 6, 38205. [Google Scholar] [CrossRef] [Green Version]
  20. Xu, Q.; Shi, Y.; Yu, T.; Xu, X.; Yan, Y.; Qi, X.; Chen, X. Whole-Genome Resequencing of a Cucumber Chromosome Segment Substitution Line and Its Recurrent Parent to Identify Candidate Genes Governing Powdery Mildew Resistance. PLoS ONE 2016, 11, e0164469. [Google Scholar] [CrossRef] [Green Version]
  21. Zhai, H.; Gong, W.; Tan, Y.; Liu, A.; Song, W.; Li, J.; Deng, Z.; Kong, L.; Gong, J.; Shang, H.; et al. Identification of Chromosome Segment Substitution Lines of Gossypium barbadense Introgressed in G. hirsutum and Quantitative Trait Locus Mapping for Fiber Quality and Yield Traits. PLoS ONE 2016, 11, e0159101. [Google Scholar] [CrossRef] [Green Version]
  22. Yang, H.; Wang, W.; He, Q.; Xiang, S.; Tian, D.; Zhao, T.; Gai, J. Chromosome segment detection for seed size and shape traits using an improved population of wild soybean chromosome segment substitution lines. Physiol. Mol. Biol. Plants 2017, 23, 877–889. [Google Scholar] [CrossRef] [PubMed]
  23. Zhou, Z.; Jiang, Y.; Wang, Z.; Gou, Z.; Lyu, J.; Li, W.; Yu, Y.; Shu, L.; Zhao, Y.; Ma, Y.; et al. Resequencing 302 wild and cultivated accessions identifies genes related to domestication and improvement in soybean. Nat. Biotechnol. 2015, 33, 408–414. [Google Scholar] [CrossRef] [PubMed] [Green Version]
  24. Drag, D.W.; Slattery, R.; Siebers, M.; DeLucia, E.H.; Ort, D.R.; Bernacchi, C.J. Soybean photosynthetic and biomass responses to carbon dioxide concentrations ranging from pre-industrial to the distant future. J. Exp. Bot. 2020, 71, 3690–3700. [Google Scholar] [CrossRef] [PubMed]
  25. Coleman, H.D.; Beamish, L.; Reid, A.; Park, J.-Y.; Mansfield, S.D. Altered sucrose metabolism impacts plant biomass production and flower development. Transgenic Res. 2010, 19, 269–283. [Google Scholar] [CrossRef] [PubMed]
  26. Schmutz, J.; Cannon, S.B.; Schlueter, J.; Ma, J.; Mitros, T.; Nelson, W.; Hyten, D.L.; Song, Q.; Thelen, J.J.; Cheng, J.; et al. Genome sequence of the palaeopolyploid soybean. Nature 2010, 463, 178–183. [Google Scholar] [CrossRef] [Green Version]
Figure 1. Range frequencies of sucrose content in CSSLs population from 2021 (A) to 2022 (B). The X axis represents the sucrose content (mg/g), the Y axis represents the plant coefficient of the corresponding sucrose content, and the black solid line represents the normal curve of CSSLs population. The red arrow indicates the position of sucrose content (mg/g) of recurrent parent SN14 and donor parent ZYD00006 of CSSLs population. (C) Correlation analysis of sucrose content in CSSLs population from 2021 to 2022. Pink arrows indicated the fitting range.
Agronomy 13 01592 g001
Figure 2. (A) Nucleotide sequence alignment of promoter area of Glyma.14G029100 among Williams 82 (reference genome), SN14 (cultivated soybean parent, Suinong 14), and ZYD00006 (wild soybean parent). Dark blue indicates the same sequence and light blue indicates sequence difference. (B) Motifs present in the Glyma.14G029100 gene’s promoter.
Agronomy 13 01592 g002
Figure 3. (A) Nucleotide sequence alignment of CDS area of Glyma.14G029100 among Williams 82 (reference genome), SN14 (cultivated soybean parent, Suinong 14), and ZYD00006 (wild soybean parent). (B) Amino acid alignment of Glyma.14G029100 among Williams 82 (reference genome), SN14 (cultivated soybean parent, Suinong 14), and ZYD00006 (wild soybean parent). Dark blue indicates the same sequence and light blue indicates sequence difference. (C) Predicted tertiary structure of Glyma.14G029100 in ZYD00006 and SN 14.
Agronomy 13 01592 g003
Figure 4. The relative transcription level of Glyma.14G029100 in leaves of parents and lines with high sucrose content at V4 stage. The letters at the top of the column chart indicate the results of multiple comparisons, and different letters indicate significant differences.
Agronomy 13 01592 g004
Figure 5. SNP site variation among Glyma.14G029100 excellent haplotypes.
Agronomy 13 01592 g005
Figure 6. Sucrose content in leaves of Glyma.14G029100 in different major haplotypes. The X axis represents haplotype, and Y axis represents the average sucrose content (mg/g) of leaves corresponding to this haplotype in CSSLs population. ** stands for p < 0.01.
Agronomy 13 01592 g006
Table 1. Basic statistics of sucrose content per plant in parent and CSSL populations.
PopulationParent PopulationCSSL Population
Female (mg/g)Male (mg/g)Minimum (mg/g)Maximum (mg/g)Mean (mg/g)SD (mg/g)CV (%)SkewnessKurtosis
21-CSSL12.3717.584.5322.0613.693.9528.850.39−0.06
22-CSSL11.6818.663.820.0211.263.5231.260.32−0.36
Table 2. QTL mapping of leaf sucrose content in CSSLs population.
TraitYearQTLChr.Start Position (Mb)End Position (Mb)Size (Mb)LODPVE (%)Additive Effect
Sucrose Content21qSuC-D1a-110.710.770.062.694.601.10
Sucrose Content21qSuC-B2-1142.122.240.1317.2535.89−3.63
Sucrose Content22qSuC-B2-1142.122.240.1314.0929.77−3.05
Table 3. Candidate genes extracted from the annotation file of reference genome Williams 82.
ChrStart (bp)End (bp)Name
Chr1421266332133000Glyma.14G029100
Chr1421360602141071Glyma.14G029200
Chr1421428032143006Glyma.14G029300
Chr1421488992149084Glyma.14G029400
Chr1421504502155697Glyma.14G029500
Chr1421587712160914Glyma.14G029600
Chr1421626662164954Glyma.14G029700
Chr1421650052165953Glyma.14G029800
Chr1421663422167231Glyma.14G029900
Chr1421692352175640Glyma.14G030000
Chr1421813452187798Glyma.14G030100
Chr1421890972189530Glyma.14G030200
Chr1421980272198251Glyma.14G030300
Chr1422041422206726Glyma.14G030400
Chr1422073182218028Glyma.14G030500
Chr1422203792225086Glyma.14G030600
Chr1422264062230206Glyma.14G030700
Chr1422335692237977Glyma.14G030800
Table 4. Candidate Genes with GO Annotation in qSuC-B2-1 Region.
GeneGO AnnotationGene Description
Glyma.14G029000GO:0004713protein tyrosine kinase activity
Glyma.14G029100GO:0016157sucrose synthase activity
Glyma.14G029500GO:0017119Golgi transport complex
Glyma.14G030100GO:0003723RNA binding
Glyma.14G030000GO:0005840ribosome
Glyma.14G030300GO:0009055electron carrier activity
Glyma.14G030500GO:0005515protein binding
Glyma.14G030400GO:0009072aromatic amino acid family metabolic process
Glyma.14G030600GO:0005515protein binding
Glyma.14G030700GO:0003677DNA binding
Disclaimer/Publisher’s Note: The statements, opinions and data contained in all publications are solely those of the individual author(s) and contributor(s) and not of MDPI and/or the editor(s). MDPI and/or the editor(s) disclaim responsibility for any injury to people or property resulting from any ideas, methods, instructions or products referred to in the content.

