Article

Utilization of Prickly Pear Peels Flour as a Natural Source of Minerals, Dietary Fiber and Antioxidants: Effect on Cakes Production

by
Hossam S. El-Beltagi
1,2,*,
Abdelrahman R. Ahmed
3,4,
Heba I. Mohamed
5,*,
Hala Hazam Al-Otaibi
3,
Khaled M. A. Ramadan
6,7 and
Haiam O. Elkatry
3,4
1
Agricultural Biotechnology Department, College of Agriculture and Food Sciences, King Faisal University, Al-Ahsa 31982, Saudi Arabia
2
Biochemistry Department, Faculty of Agriculture, Cairo University, Gamma St, Giza 12613, Egypt
3
Food and Nutrition Science Department, Agricultural Science and Food, King Faisal University, Al-Ahsa 31982, Saudi Arabia
4
Home Economics Department, Faculty of Specific Education, Ain Shams University, Abassia, Cairo 11772, Egypt
5
Biological and Geological Sciences Department, Faculty of Education, Ain Shams University, Cairo 11341, Egypt
6
Central Laboratories, Department of Chemistry, King Faisal University, Al-Ahsa 31982, Saudi Arabia
7
Department of Biochemistry, Faculty of Agriculture, Ain Shams University, Cairo 11241, Egypt
*
Authors to whom correspondence should be addressed.
Agronomy 2023, 13(2), 439; https://doi.org/10.3390/agronomy13020439
Submission received: 26 December 2022 / Revised: 28 January 2023 / Accepted: 30 January 2023 / Published: 1 February 2023
(This article belongs to the Special Issue Effects of Agronomical Practices on Crop Quality and Sensory Profile)

Abstract

:
Prickly pear peel makes up around half of the fruit and is typically thrown away, creating an environmental issue. Due to its high bioactive chemical content, prickly pear peel can easily be used as a functional and nutraceutical ingredient in several food recipes, such as baked products. This study’s objective was to determine whether prickly pear peel flour (PPPF) could successfully be combined (5, 10, and 15%) with wheat flour to make cakes, by analyzing the physical and chemical characteristics of the cakes and performing a descriptive sensory analysis. Prickly pear peel flour contains high amounts of fiber, ash, carbohydrate, phenolic, flavonoid compounds, or antioxidant activity. In addition, PPPF contains high amounts of magnesium, calcium, sodium and potassium. The ethanolic extract of prickly pear peel revealed the presence of 11 phenolic compounds using UPLC-MS/MS. The main constituents in the peel extract were isorhamnetin (27.1%), eucomic acid (19.6%), kaempferol (14.07%), 3-O-Methylquercetin (13.7%), Feruloyl-D-glucose (10.01%) and piscidic acid (8.89%). Results showed that adding PPPF significantly enhanced the amount of fibers, total polyphenols, flavonoids and minerals in the cakes prepared by the addition of 5, 10 and 15% PPPF as compared to the control cake. Moreover, the addition of different levels of PPPF increased antioxidant activity (DPPH and ABTS%) and decreased thiobarbituric acid reactive substances (TBARS) in cakes as compared to the control cake. The descriptive sensory analysis ultimately revealed that cakes made with 10% prickly pear flour received a higher score for their smell, taste or color. In conclusion, prickly pear peel has antioxidant potential and contains biochemical compounds that can be utilized in the enhancement of functional foods and also help to reduce the waste accumulation that causes environmental issues.

1. Introduction

The prickly pear, or opuntia or opuntia ficus indica (opuntia spp.), is frequently used as food or in food products, and there is growing interest in using the cladode of the prickly pear as an ingredient in functional foods [1]. Opuntia is a domesticated plant found in many different civilizations [2], and it is thought to be among the most significant cactus species in agricultural production, as well as being among the first fruit crops to be adapted to a wide range of soil types [3]. The opuntia genus belongs to the plantae kingdom and the cactaceae family of cacti, and it is used as a crop and as an ornamental plant. Opuntia has approximately 130 genera and 1500 species, and it may be farmed in dry and semi-dry areas [4]. Commercial opuntia species are cultivated for both human and animal consumption [5].
Among the many advantages of opuntia are its high fiber content, fruit freshness, good taste, and high juicing production, which is preferred in processed foods such as baked products [6]. Over the past ten years, researchers have turned their attention to the phytochemical traits and total nutritional quality of opuntia, including in the food industry and its products [7]. There are different concentrations of free amino acids in opuntia, including arginine, alanine, asparagine, aspartic and glutamic acids, which are more prevalent in juice [8]. Because the juice contains the entire fruit (skin, seeds and flesh), it may have a higher amino acid concentration. In addition, opuntia is a great source of polyphenols and bioactive substances, including flavonoids such as isorhamnetin, kaempferol and derivatives of quercetin, as well as phenolic acids such as piscidic acid and eucomic acid [9].
In addition to type 2 diabetes mellitus (T2DM), hypertension, high cholesterol, rheumatoid arthritis, gastric mucosa illnesses and asthma can all be prevented using opuntia, due to its dietary items and chemical composition [10]. Due to their anti-inflammatory and antioxidant characteristics, a number of opuntia substances have also been used as potential remedies for easing the symptoms of ulcers, hyperglycemia and multiple sclerosis [11,12]. Opuntia is therefore thought to be an important and varied source of biologically active chemicals and nutrients that can be incorporated into functional foods and low-calorie substitutes for marmalade, juices, drinks, pasta, jams, biscuits and sweeteners [13,14]. It has only recently been suggested that using opuntia to produce nutraceutical and functional food products could help treat various ailments [15].
The fruit peel is typically discarded, but it can also be used to amend the soil and benefit the livestock feed industry. Because the peel accounts for approximately 48% of the weight of the entire fruit, the food processing industry is concerned about the significant amount of waste caused by the peel, and the associated financial burdens [16]. Both families and the food processing industry produce this waste. As a result, there is a significant issue with how to dispose of this waste because it can have a negative impact on human health. Utilizing this by-product properly could ease waste disposal issues and provide a potential new supply of bioactive chemicals [16]. Therefore, researchers have recently started to use fruit and vegetable waste as economic sources for important biological compounds, and make use of this waste in many foods, pharmaceutical, and cosmetic industries, as well as one of the ingredients in baking [17,18,19,20,21,22]. In fact, the baking industry in Egypt has grown significantly in recent years as baking products are diversified through adding various ingredients characterized by a high nutritional value [23,24]. Dietary fiber and phytochemicals have drawn the most attention among the additional ingredients. Blending flour with the powdered by-products of several plants, has reportedly led to improved nutritional and functional qualities in cookies and bread [25].
Partly because it contains a high concentration of bioactive chemicals and partly because of the general nature of PP peel, it is an important by-product produced from the fruit [6]. PP peel is an intriguing ingredient for bread products due to the fact that it contains proteins, dietary fiber [26], antioxidants [27], betalains [28] and flavonoids [29], and has a high nutritional value. Opuntia peel has been considered to be a functional ingredient for improving the physicochemical, structural, and nutritional properties of cooked sausages [30], baked goods [16,31], yogurt [28], margarine [32] and gluten-free snacks [33]. Anwar et al. [34] evaluated the use of very small amounts of prickly pear peel (0.5, 1, and 2%) for the enhancement of pan bread quality and found that this vegetable matrix might prolong the shelf life of bread and reduce staling.
Cakes are common bakery items that are consumed frequently all over the world. The cake is a common food among consumers because of its pleasant flavor, variety, and airy texture [35,36]. Dietary fiber refers to parts of fruits, vegetables, crops, nuts and legumes that cannot be digested by humans. It is a well-established fact that the consumption of adequate amounts of dietary fiber significantly reduces the risk of degenerative diseases, including diabetes, obesity, coronary heart disease, bowel cancer and gallstones [37,38,39]. Dietary fibers also have technological properties that can be used in the production of foods, resulting in texture modification and the enhancement of the stability of the food during production and storage [40]. Both the nutritional value and technological properties of dietary fibers are important in the potential development of a wide range of fiber-enriched foods (e.g., bakery products, snacks, sauces, drinks, cereals and biscuits) [41].
Accordingly, the objectives of this study were to describe the physical, chemical, nutritional and antioxidant properties of prickly pear peel flour (PPPF), to assess the effects of the addition of PPPF at various doses on the chemical and physical characteristics as well as on the technological parameters of cake, to improve the sensory profile of cake incorporating PPPF in comparison to the control cake, and to determine the amount of bioactive compounds left over after cake cooking.

2. Materials and Methods

2.1. Raw Materials

Fruits (approximately 100 g each) were selected from a market in Cairo, Egypt, based on the color development that was typical at the optimum time of harvest, which is 50% color (orange and red) on the outer peel at which time the interior of the fruit would be sufficiently soft (86% moisture) for this study. Waste materials (80% moisture) were used, namely prickly pear (opuntia ficus indica) peel flour (PPPF).

2.2. Cake Ingredients

Sucrose (commercial grade), fat (palm oil), a fresh whole egg, baking powder, dry milk powder, vanillin (pure vanillin) and soft wheat flour (72% extraction) were bought from LuLu Market, Hufuf, Saudi Arabia.

2.3. Preparation of Prickly Pear Peel Powders

The prickly pear peel was removed from the freshly washed fruits, chopped into small pieces, spread out in trays to soak up water, and dried in an air oven (Genlab Classic Ovens, MINO/50 Genlab Limited, Cheshire WA8 0SR England) at 50 °C for 48 h, ground in a laboratory mill for 2 min at 35,000 rpm (Huge Grinder Model No. E03407, China) to fine powder, and then sifted through 60 mesh sieve to produce a fine powder (6.5% moisture).

2.4. Processing of Cake

The modified Ahmed [42] method was used to manufacture cake samples. Table 1 summarizes the cake’s ingredients and lists the various prickly pear peel powder (PPPF) ratios employed in this investigation.
Sugar and shortening were mixed for 3 min to make a control cake. After adding them, the whole eggs and milk were mixed for two minutes. The batter was added, and after adding baking powder and sifted flour, it was mixed for 4 min. The batter was stirred for an extra minute after the bowl had been scraped clean. To make the replaced cake batters, the flour in the formula was replaced with prickly pear peel flour in ratios of 5, 10 and 15%. The mixing process was carried out in the same order as the control. Each pan (175 × 95 × 50 mm, metallic, lard-coated pan) was filled with cake batter, which was baked in an electric oven (Berjaya, BJY-E20KW-2BD, 2 Decks, Malaysia) for 30 min at 180 °C. The cakes were baked, taken out of the pans, and allowed to cool completely before being sealed in polyethylene bags and kept at room temperature for 21 days. Following the removal from the pans, samples were collected for analysis within an hour and frequently after one week.

2.5. Weight, Volume and Specific Volume of Cake Samples Determination

Weight and volume were determined in cakes after preparation with PPPF, and the specific volume of the cake samples was determined after one hour of baking [43]. To determine the specific volume, the weight-to-volume ratio was also calculated.

2.6. Color of Cake Samples Determination

Using a Minolta Calorimeter (CR 200 Japan), the color and crumb of a cake made with prickly pear peel flour were assessed using the Francis tristimulus color scheme [44]. According to Hunter values for L*, a*, and b*, color readings were expressed. The color differences among bread samples with different amounts of PPPF were expressed as ∆E, which was calculated using the following equation:
Δ E = ( Lx L 0 ) 2 + ( ax a 0 ) 2   + ( bx b 0 ) 2

2.7. Descriptive Sensory Analysis of Cake Samples

Ten trained panelists (professors and students, male and female, aged between 35–55 years), with several years of tasting experience and who have been frequently used in our previous studies, from the Food Science and Nutrition Department at King Faisal University’s Faculty of Agriculture and Food Science were asked to detect and describe differences among samples, indicate sensory attributes (appearance, crust color, crumb color, crumb texture, taste and smell) in each sample and measure the intensity of those attributes based on a scale of a 10-point numerical scale with 0.5 increments, where 0 means “none” and 10 means “very strong”. Each sample of cake was labeled by randomized code. Samples were presented at room temperature between the hours of 10:00 a.m. and 11:00 a.m. and the analysis was conducted under daylight illumination. Water was served between samples to eliminate the residual taste of previous samples, according to A.A.C.C. [45].

2.8. Chemical Composition

According to the method outlined in A.O.A.C, the following substances were measured: moisture, protein, total lipids, crude fiber, ash, total carbohydrates, and reducing sugars [46]. Moisture was determined in 5 g of sample using the oven method (Bender ED-115, Tuttlingen, Germany) at 105 °C overnight then dryed until stable in weight, and the crude protein content was measured in 1 g dried sample using the Kjeldahl method. The ash content of the sample was determined in 1 g of dried sample using a muffle furnace (Witeg FHT-14, Wertheim, Germany). Soxhlet fat extraction apparatus was used to determine the total number of lipids in 5 g of the dried sample. Total carbohydrates were measured spectrophotometrically using a phenol-sulfuric reagent, while reducing sugars were measured in the 85% ethanolic extract using the phenol-sulfuric reagent. Ascorbic acid was measured using the Asker and Treptow method [47]. Tobaruela et al. [48] used a fully automated technique to identify crude fiber (FOSS-Fibertic 8000, Hilleroed, Denmark). According to Jayaraman [49], free amino acids were measured in 85% ethanolic extract of powdered samples using the ninhydrin reagent (ACS-Sigma Aldrich, St. Louis, MO, USA) and optical density was measured at 570 nm using a spectrophotometer (Thermo Scientific Evolution 350 UV-Vis spectrophotometer, Waltham, MA, USA). L-Glycine (10–100 µg/mL) was used as the calibration standard curve.

2.9. Determination of P and K

The contents of the elements were determined in both the PPPF and the cakes according to the A. O. A. C. [46] method. Using concentrated H2SO4 (Ultra-pure, Sigma, Berkshire, UK), 1 g of dried powder samples was digested in a closed microwave digestion and extraction system (SINEO-MDS-6G SMART, Shanghai, China), and potassium content was measured using a Flame photometer (BWB-Flash Photometer, Berkshire, UK). Phosphorus was determined spectrophotometrically using the Thermo Scientific Evolution 350 UV-Vis spectrophotometer (Waltham, MA, USA), and phosphorus content was calculated from the standard calibration curve (P equivalent 0.01–10 mg/L).

2.10. Determination of Trace Element Levels

2.10.1. Microwave Digestion

Following the procedure outlined by Marin et al. [50], 1.0 g of the powdered sample was digested with either 2 mL of H2O2 (30%, ultra-pure for AA, Carlo-Erba, Val de Reuil, France) and 8 mL of HNO3 (65%, for ICP, Sigma-Aldrich, CA, USA) in a closed microwave digestion and extraction system (SINEO-MDS-6G SMART, Shanghai, China). Prior to ICP-OES analysis, the final mixtures were chilled and diluted to a volume of 25 mL using ultrapure water from the Milli-Q system (Millipore, Val de Reuil, France).

2.10.2. Trace Element Levels Determination by ICP-OES

In order to maintain plasma and carrier gas, an autosampler of AS 93-plus Argon (purity > 99.995%) was used. ICP-OES (Shimadzu 9800 Series—Tokyo, Japan) was used to measure amounts of trace elements. To calibrate, all of the elements that were evaluated were mixed into a 1000 mg/L multi-elemental standard solution from Sigma-Aldrich.

2.11. Total Phenolic Content Determination

The total phenolic content of PPPF and the powdered dried cake (10 g) was assessed in an 85% ethanolic extract according to Goffman and Bergman [51] using a Folin-Ciocalteu reagent. The absorbance was then read at 760 nm using a Thermo Scientific Evolution 350 UV-Vis spectrophotometer (Waltham, MA, USA). Gallic acid (GAE) was used to measure the total phenolic content as a standard, and is represented as mg GAE/100 g DW.

2.12. Total Flavonoid Content Determination

Spectrophotometric analysis was used by Chang et al. [52] to determine the total flavonoid content in 85% ethanolic extract by using AlCl3 and NaOH. The optical density of the mixture was measured at 510 nm using a Thermo Scientific Evolution 350 UV-Vis spectrophotometer (Waltham, MA, USA). In terms of quercetin (QE), the total flavonoid content was represented as mg/100 g sample (DW).

2.13. Total Anthocyanin Content Determination

Total anthocyanins were determined in the methanolic extract and their amounts were calculated using Abdel-Aal et al.’s [53] technique, using 1.5 N HCl. The optical density of the mixture was read at 535 nm using a spectrophotometer against reagent blanks. The total anthocyanin content was represented by mg Kuromanin (KE)/100 g (DW) of the sample. The molar extinction coefficient (Ɛ) was 25,700 M−1 cm−1 on average.

2.14. Total Carotenoids Content Determination

According to Wang et al. [54], total carotenoids were quantified spectrophotometrically using β-carotene as a standard (2–10 mg/mL). The results were shown in terms of mg/100 g DW.

2.15. Antioxidant Activity

Total antioxidant activity was measured using the ABTS [55], DPPH [56], and hydrogen peroxide methods described by Ruch et al. [57], with vitamin E (α-tocopherol) as a reference solution. Results were shown as the percentage of inhibitory activity, and once the percentage of activity was determined, the results were presented as the effective concentration at 50% ROS scavenging (IC50).

2.16. Ultra-High-Performance Liquid-Chromatography–Mass Spectrometry (UPLC-MS/MS) Identification of Phytochemicals Compounds

The mobile phase of 75% methanol: 15% water was used to reconstitute the ethanolic extract of prickly pear peel (10 g extract/l). Waters Acquity UPLC-I class in conjunction with Xevo TQD MS (USA), Acquity UPLC BEH C18 1.7 µm–2.1 × 100 mm column flow rate 0.8 mL min−1, the injection volume of 10 µL, Masslynix v 4.1 software with Mass library, argon as a collision cell gas inlet 7 psi, and a nitrogen pressure of 60 psi were used to identify individual total phenolic compounds. Using an atmospheric pressure electrospray ionization (ESI) source, MS was configured to operate in either positive (event MS1) or negative (event MS2) ion modes. With a nebulizing gas flow rate of 12 L/h, interface temperature of 300 °C, and a desolvation temperature of 526 °C, the electrospray capillary voltage was adjusted at 3000 Volts. Retention time Rt, isotopic data, and high mass accuracy MS/MS spectra were used by the metabolite library to recognize and validate metabolites.

2.17. MDA Determination by TBARS

MDA was determined in the TCA extract of PPPF and dried cake using a thiaobrabutirc acid reagent, according to Vyncke [58]. A Carry 50 UV/vis spectrophotometer from Varian (Sint-Katelijne-Waver, Belgium) was used to measure the absorbance at 525 and 560 nm.

2.18. Statistical Analysis

SPSS version 16 [59] was used for an analysis of variance for all treatments, and Duncan’s preference test was used to differentiate between the treatments [60]. The mean ± standard deviation of three replicates was used.

3. Results and Discussion

3.1. Proximate Composition of Prickly Pear Peel Flour

The proximate chemical analysis of PPPF is illustrated in Table 2. PPPF had a moisture content of approximately 6.58%. In fact, it is well known that foods with moisture contents above 12% promote the growth and development of microorganisms and enzyme activity, which hastens the decomposition of food [61]. The moisture content of the flour is used as a storage indicator. In order to maintain maximum preservation, flour should have less than 14% moisture [62]. This is beneficial because it extends the shelf life of the product by reducing the moisture content, which prevents the formation of mold and other organisms that can cause the product to spoil [62].
The ash content in PPPF was about 10.81%. The PPPF contained lipid (5.17%), protein (3.69%), and carbohydrate (49.93%). The percentage of proteins in the peel increased their nutritional content but may also cause some negative reactions that could change the color of the products, such as the creation of hydroxyl methyl furfural and/or the Maillard browning reaction [61]. In addition, the PPPF revealed a high level of crude fiber (25.79%), which is consistent with the findings of Anwar and Sallam [34]. Furthermore, Parafati et al. [16] discovered that the total fiber content of PPPF is around 33%, and that adding 15% and 20% PPPF to the bread results in a blend with a total fiber level of 8.01% and 9.48%, which is equivalent to whole wheat flour (8.4%). According to Sharoba [63], the wheat flour usually used in cake preparation contains around 0.45% crude fiber. Fibers are crucial for maintaining human health [34]. A fiber-rich diet aids in the prevention, reduction, and treatment of certain diseases such as lowering blood pressure, assisting in weight loss, improving immune function, and improving blood lipid concentrations [64]. PPPF contains 24.43% reducing sugars, 0.59% total nitrogen, and 0.37% free amino acids. Because of these distinctive qualities of sugars, the cactus pear peel is sweeter and ideal as a natural food or food additive for many different types of dishes [16]. Similar results were reported by Parafati et al. [16].

3.2. Secondary Metabolites Content of Prickly Pear Peel Flour

The secondary metabolite contents of prickly pear flour are presented in Figure 1. The analysis of secondary metabolites showed that PPPF contains a high concentration of total phenolics (385.03 ± 4.66 mg GAE/100 g) and ascorbic acid (210.17 ± 0.92 mg/100 g). Ascorbic acid is associated with a high total phenolic content [62]. Also, García-Cayuela et al., [65] found that PPPF has high concentrations of phenolic compounds, betalain pigments, and an antioxidant capacity. In addition, PPPF contains anthocyanins (9.62 ± 0.29 mg KE/100 g), flavonoids (32.47 ± 1.78 mg QE/100 g), and carotenoids (11.17 ± 0.61 mg/100 g). Similar findings were obtained by Hegazy et al. [66], who discovered that PPPP’s methanol extract contained only trace amounts of anthocyanins and carotenoids. Anthocyanins are one of the most important classes of plant pigments because they are water soluble and significantly reduce oxidative damage [21]. Carotenoids which are lipid-soluble C40 tetraterpenoids have an important role in the protection of lipoproteins and cellular membranes from oxidative damage [66]. In addition, flavonoids can prevent the peroxidation of free radicals by associating with lipids, proteins, and carbohydrates [67]. Furthermore, because of their abilities to stabilize and chelate iron, they can interact with a variety of enzyme systems [68,69,70,71,72].
Flavonoids have also been connected to antibacterial and antidiarrheal properties. Different phytochemicals have different modes of action, including enhancing colonic reabsorption of water and electrolytes and decreasing intestinal motility, whereas some substances have been found to inhibit particular pathogens [17]. Phytochemicals with anti-inflammatory properties include phenolics and flavonoids [17].
The generation of neurotransmitters, hormones, immune system responses, and tissue growth and maintenance are all impacted by vitamin C (ascorbic acid), which is a key component of PPPF. Reactive oxygen species, which damage macromolecules such as lipids, DNA and proteins, and are linked to cardiovascular disease, cancer, and neurological illnesses, are less adversely affected by this significant antioxidant [17].

3.3. Antioxidants Activity of Prickly Pear Peel Flour

The antioxidant activity of PPPF is presented in Table 3. The data show that increasing the concentration of PPPF from 25 to 150 µg/mL significantly increased the DPPH, ABTS, and H2O2 scavenging activity. The most pronounced increases in DPPH and ABTS were detected in 150 µg/mL PPPF by about 100% and 97.81%, respectively, as compared with 150 µg/mL Vit E, which was used as a standard. Furthermore, when compared to Vit E, the highest values of H2O2 scavenging were observed at 150 µg/mL by approximately 97.21%. The IC50 of DPPH, ABTS, and H2O2 was about 23.41, 26.37 and 41.83 µg/mL, respectively. Effective concentration at 50% ROS scavenging (IC50) reflects the antioxidant activity, whereas the lower IC50 represents the higher antioxidant activity of the extracts. A comparison with the IC50 of the standard vitamin E (2.49 μg/mL) showed that the PPPF extract has a strong antioxidant activity (23.41, 26.37 and 41.38 μg/mL). These findings corroborate those of El-Beltagi et al. [17], who discovered that DPPH radical scavenging was boosted with boosting prickly peel extract levels from 40, 80, 120, and 150 μg/mL. Several studies demonstrated a close connection between phenols and antioxidant activity [73,74,75,76]. The ability to scavenge DPPH radicals and antioxidant activity both raise with an enhancement in total phenolic content and phenolic compound hydroxylation level [31,77].
The main flavonoids found in PPPF are responsible for the antioxidant benefits. Since phenolic compounds can delay pro-oxidative effects in proteins, DNA and lipids by producing stable radicals, flavonoids are more effective antioxidants [73]. It has been demonstrated that the polyphenolic chemicals in PPPF cause the plasma membrane to hyperpolarize and increase the intracellular calcium pool in human Jurkat Tcell lines [17].

3.4. Mineral Content of Prickly Pear Peel Flour

Table 4 illustrates the mineral content of PPPF. It was clear that the PPPF contained significant amounts of magnesium, calcium, sodium and potassium (963.2, 929.0, 911.5, and 304.5 mg/100 g, respectively), which was followed by iron, manganese, zinc, and copper (117.5, 99.5, 100.5, and 53.0 mg/100 g, respectively). Nickel, chromium, phosphorus, and selenium had the lowest concentrations. As a result, PPPF is an excellent source of the majority of dietary minerals. These results are in accordance with Mahfouz and Abd-Elnoor [31], who noted that prickly pear peel is an important source of magnesium, calcium, and sodium, followed by potassium. The minerals in plant sources may differ from one place to another because the mineral content of the soil varies according to the site in which the plant is grown. However, many studies confirmed that PPPF powder is rich in various minerals, along with its ability to bind with water and absorb fats [78,79], and therefore it is suitable for manufacturing many products.
The first significant component of PPPF is magnesium, which is necessary for the processes that turn vitamin D into its active form and, as a result, produce adenosine triphosphate (ATP), a component that releases the parathyroid hormone and relaxes the muscles [17]. Calcium is a key component of PPPF and is known to promote muscle contraction, control the flow of nutrients through cell membranes, and help with insomnia [79]. In addition, bones serve as a key store for the body’s calcium, which makes up three-quarters of all minerals in the body. Manganese, zinc, and copper are also present in the peel, which are important because they are used for bone mineralization, muscle contraction, nerve stimulus transmission, and act as a cofactor of many enzymes involved in human metabolism. Furthermore, the presence of potassium is crucial because it helps to mitigate the negative effects of high sodium consumption on blood pressure [17].

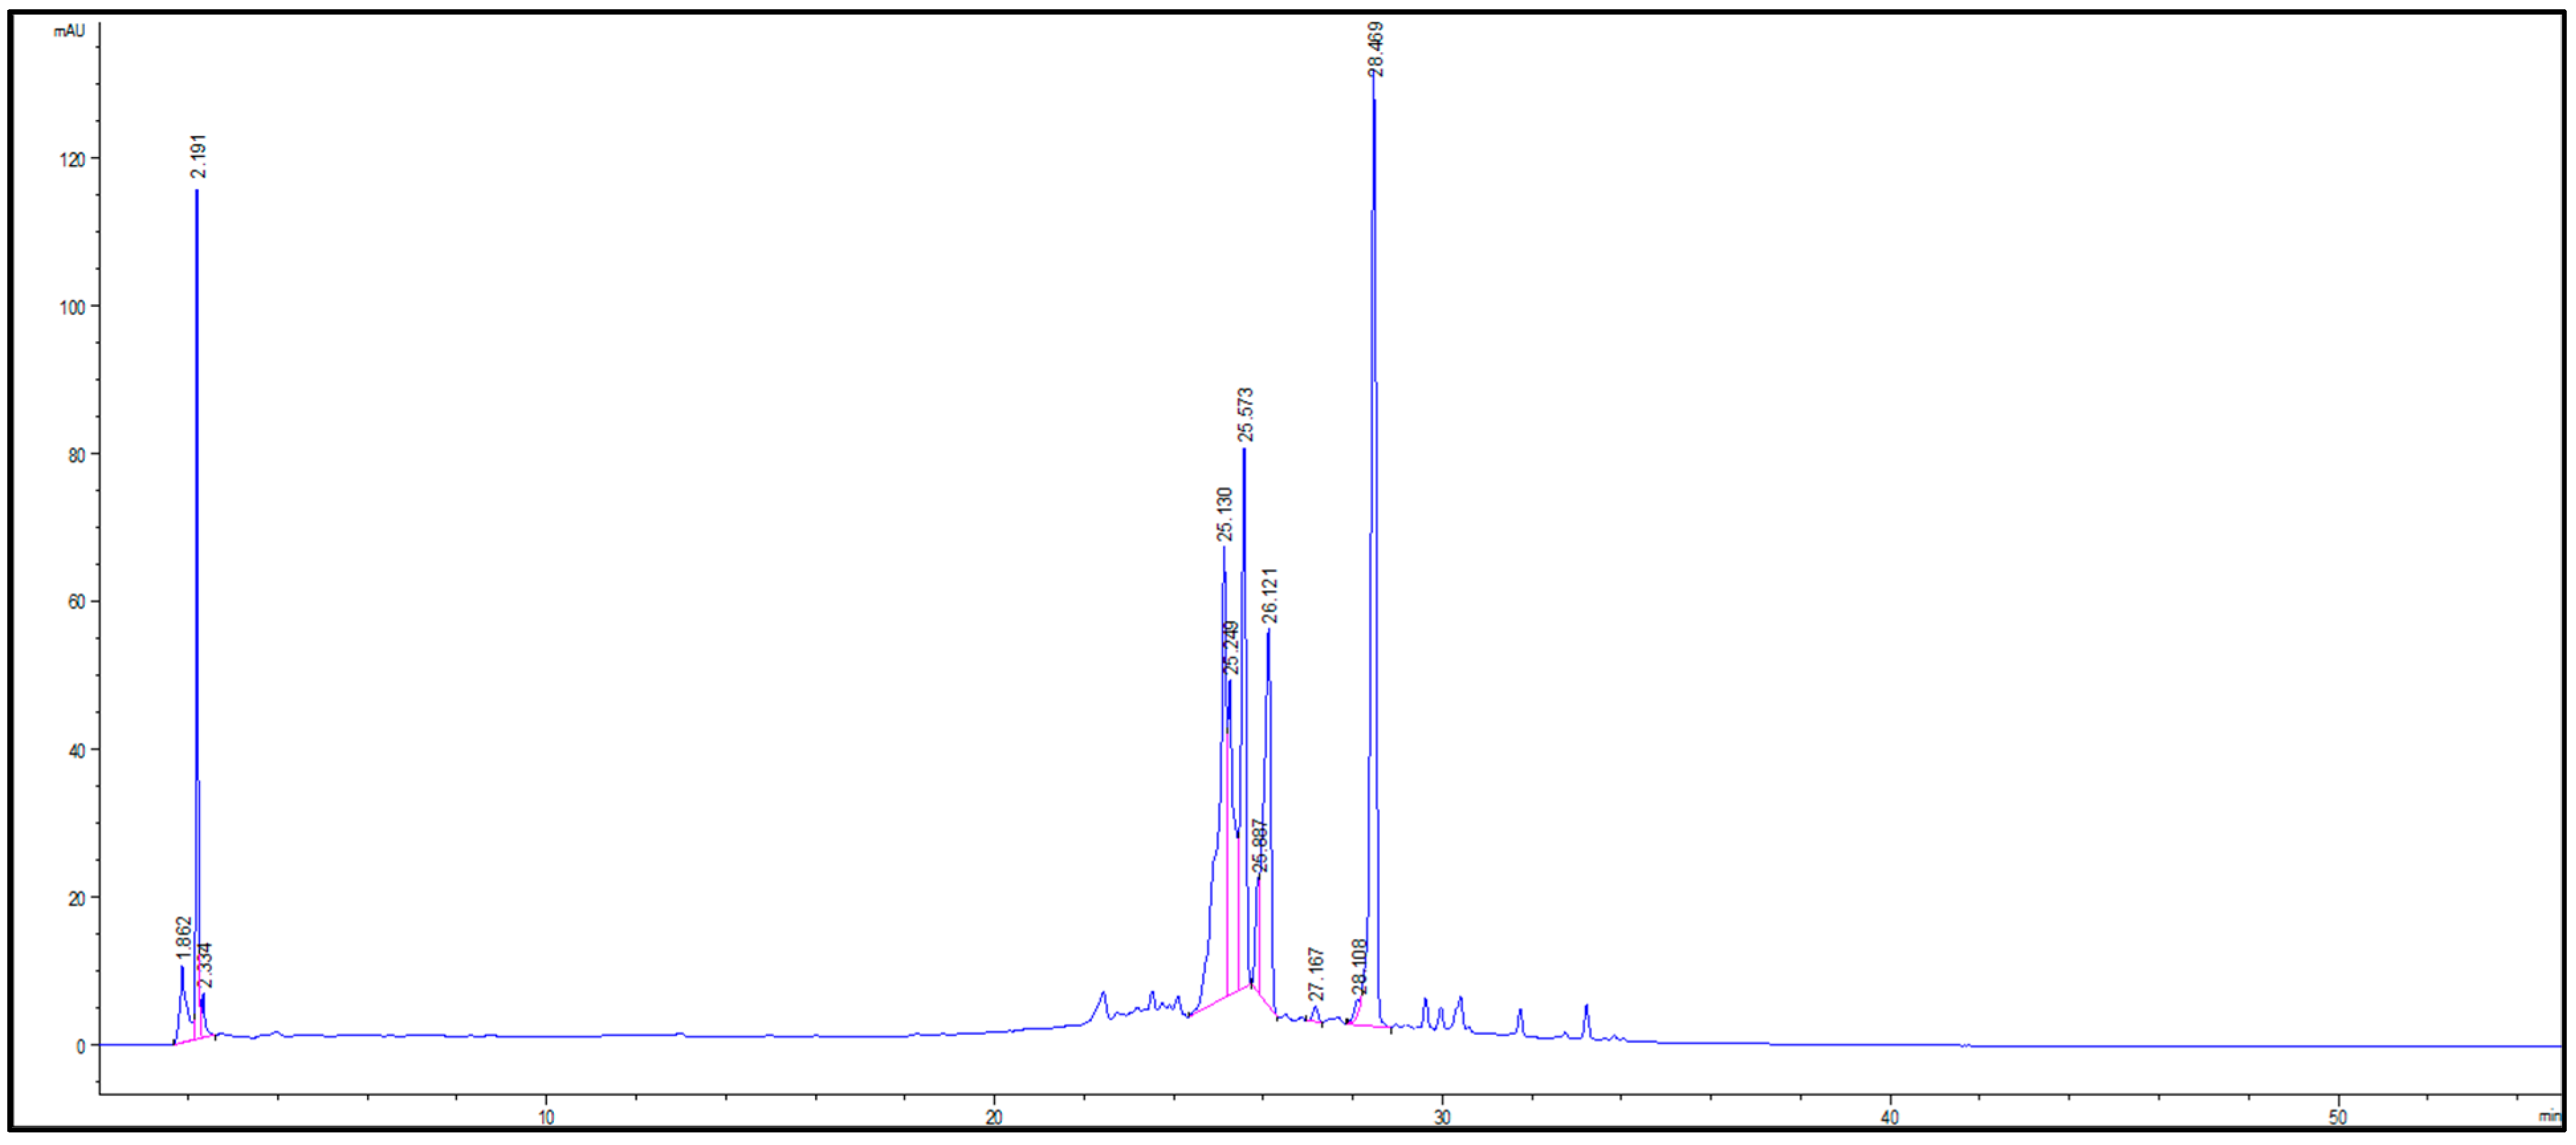
3.5. Polyphenolic Compounds of Prickly Pear Peels

Data in Table 5 and Figure 2 demonstrated that the ethanolic extract of prickly pear peel contains 11 phenolic compounds using UPLC-MS/MS. The main constituents in peel extract were isorhamnetin (27.1%), eucomic acid (19.6%), kaempferol (14.07%), 3-O-Methylquercetin (13.7%), Feruloyl-D-glucose (10.01%) and piscidic acid (8.89%). These findings are in line with those of Jiménez-Aguilar et al. [80], who discovered that the peel of prickly pears contains phenolic compounds such as quercetin, kaempferol and isorhamnetin. The amounts of five different types of flavonoids, including myricetin, quercetin, luteolin, kaempferol and isorhamnetin, were detected in the ethanolic extract of prickly pear fruits [81]. These phenolic and flavonoid substances are more effective as antioxidants that can postpone protein, DNA, and lipid prooxidative effects by producing stable radicals [82].

3.6. Proximate Analysis of Cakes Prepared by Replacing Flour with Various Levels of Prickly Pear Peel Flour

The results in Figure 3 display the proximate analysis of the control cake as well as the cake made by substituting wheat flour with various concentrations of PPPF (5, 10 and 15%). Moisture levels in the cake ranged from 8.46 to 13.46%. The cake prepared with 15% of PPPF contained lower amounts of moisture (8.46%) than the control cake. The low moisture level is beneficial to preserving the cake for a long time without microbial infection because most spoilage microbes might not be able to thrive at this low moisture level [88]. To increase the shelf life of stored cakes and biscuits, the moisture content must be within the acceptable range (0–14%) [62]. The moisture level of baked goods, which measures stability and susceptibility to microbiological contamination as well as water activity, directly correlates with shelf life [88].
The control cake has a lower ash content (0.58%) compared to the cake prepared with the addition of 15% of PPPF (2.28%). Meanwhile, there was a clear increase in the fibers as a result of adding different concentrations of PPPF. The total fibers increased from 2.43% in the control cake to 4.14% in the cake prepared with the addition of 15% PPPF. These results are similar to those of Mahfouz and Abd-Elnoor [31], who reported that the percentage of moisture, protein, ash and total dietary fiber content increased in cake prepared with 10% PPPF as opposed to the control cake. These findings demonstrate that the high concentration of bioactive chemicals in such studied by-products enables them to play an important and essential role in food and medicinal applications. These outcomes align with the findings of the research carried out by Anwar and Sallam [34], who found that dietary fibers increase intestinal motility and aid in digestion and excretion, and also bind to bile acids, which is one of the mechanisms that reduce plasma cholesterol. Also, the moisture content was significantly decreased with the increase of the PPPF, as was total protein content and total carbohydrates. However, ash, crude fiber and phenolic compounds significantly increased as the effect of the presence of PPPF in the biscuits [6].

3.7. Phenolic Compounds of Cakes Prepared by Replacing Flour with Various Levels of Prickly Pear Peel Flour

Figure 4 displays the findings relating to the bioactive components of cake samples prepared by adding different levels of PPPF. The amount of total phenolic and flavonoid compounds in the control cake and the cakes with 5, 10 and 15% PPPF differs significantly. The highest values of total phenolics (64.0 ± 0.14 mg GAE/100 g) and flavonoids (9.70 ± 0.38 mg QE/100 g) were observed in the cake prepared with the addition of 15% PPPF. In addition, these contents were smaller than the amounts reported in the PPPF. This is because thermal treatment leads to the substantial thermal destruction of these compounds, the polymerization of polyphenols and the decarboxylation of phenolic acids [6]. Similar findings were reported by Mahfouz and Abd-Elnoor [31], who discovered that replacing 10% of the wheat flour in the cake with prickly pear peel resulted in an increase in total phenols and carotenoid content when compared to the control cake. It may be better for food and health overall to substitute unsafe artificial ones with natural food additives [89].

3.8. Antioxidants Activity of Cakes Prepared by Replacing Flour with Various Levels of Prickly Pear Peel Flour

The antioxidant activity of the control cake and cake prepared with the addition of 5, 10 and 15% PPPF are presented in Figure 5 and Figure 6. The data show that increasing the concentration of PPPF from 50 to 150 µg/mL significantly increased the DPPH and ABTS scavenging activity. The most pronounced increases in DPPH and ABTS in cake prepared with 15% PPPF were detected in 150 µg/mL PPPF by about 98.15% and 100%, respectively, as compared with 150 µg/mL Vit E which was used as a standard. Similar results are reported by Mahfouz and Abd-Elnoor [31], who found that adding 10% PPPF to the preparation of cakes and biscuits increased antioxidant activity. DPPH activity is related to total phenolic and flavonoid content. For example, DPPH increases as phenolic compound content and phenolic compound hydroxylation increase [62,90].

3.9. Minerals Content of Cakes Prepared by Replacing Flour with Different Levels of PPPF

The data in Table 6 show that the mineral content of the cake prepared with the addition of different levels of PPPF (5, 10, and 15%) was significantly increased as compared to the control cake. The most pronounced increases in mineral content were detected in cake prepared with 15% PPPF. These results are in line with those of Mahfouz and Abd-Elnoor [31], who found that when PPPF was added to cakes and biscuits, their mineral content increased in comparison to control samples. In addition, cations like magnesium and calcium improve the mechanical characteristics of gluten for interactions with amino acid side groups [91].

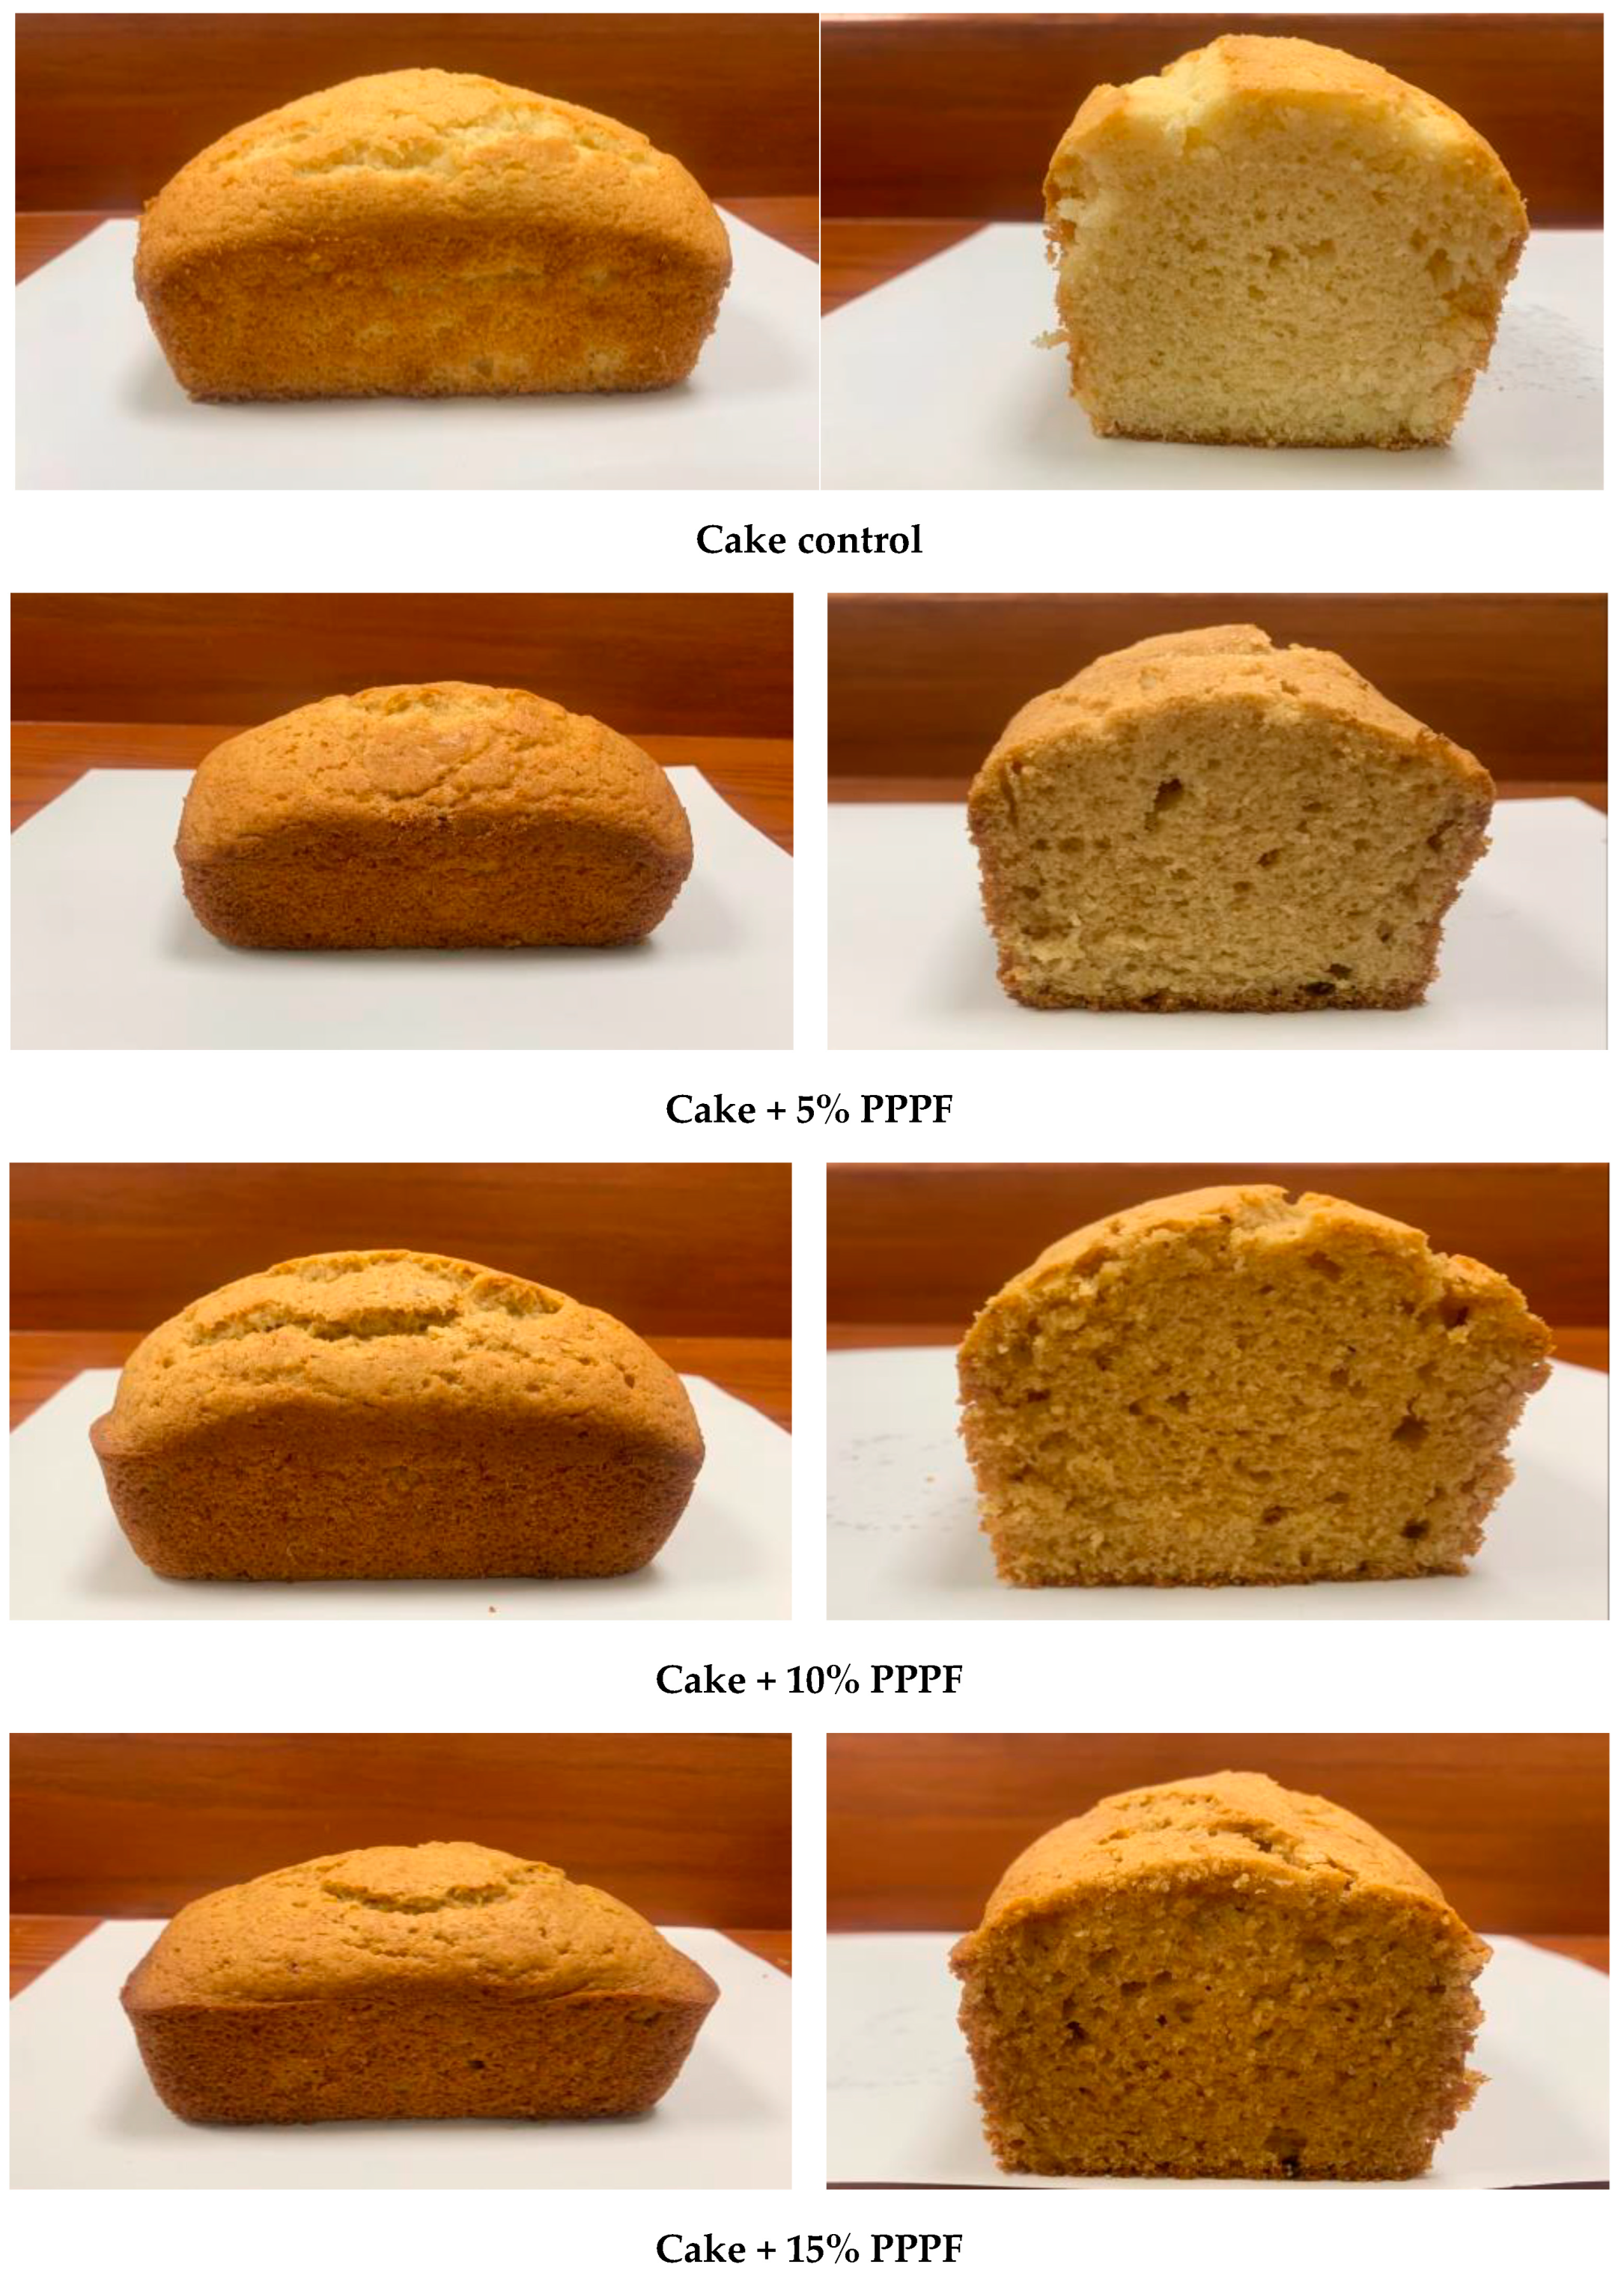
3.10. Evaluation of Cakes Prepared by Replacing Flour with Different Levels of PPPF

3.10.1. Physicochemical Characterization

Table 7 represents the physical characteristics of the cake prepared by replacing flour with various levels of PPPF (5, 10 and 15%). Cakes with 10% PPPF exhibited the highest values for height (cm), volume (cm3), and specific volume (cm3/g), followed by the control and cake with 5% PPPF, while cakes prepared with an addition of 15% PPPF exhibited the lowest values. These findings concur with those of Parafati et al. [16], who reported that cake batter containing up to 15% of PPPF significantly decreased the volume of batter when left to rise. This was likely to be because as the concentration of wheat flour was reduced in each subsequent sample, the concentration of wheat gluten was also decreased, and as a result, a corresponding decrease in the batter volume was observed.
Mahloko et al. [62] demonstrated that the ability of additional banana and prickly pear flour to bind oil, which slows down correct gluten synthesis, may be the cause of the reduced height of biscuits. Similar findings were made by Chinma and Gernah [92], who found that adding 10% soybean and 10% cassava flour reduced the biscuits’ height from 40.0 cm in control biscuits to 36.10 and 36.21 cm, respectively.

3.10.2. Color

The color parameter values for flour, PPPF, and cakes with several PPPF additions are shown in Table 8 and were assessed on both crust and crumb sections. The crust of cakes prepared with different levels of PPPF represented a decrease in lightness (L*) and yellowness (b*) characteristics in contrast to the control cake, especially in cakes prepared with 15% PPPF which showed lower values of L* and b*. In contrast, the cakes containing 10 and 15% PPPF showed a notable rise in the crust’s redness (a*).
The L* characteristics on crumbs showed a significant reduction in cakes containing different levels of PPPF (5, 10 and 15%). On the other hand, increasing levels of PPPF caused a significant increase in a*, and b* characteristics. These findings concur with those of Parafati et al. [16]. In addition, Djeghim et al. [93] found that increased levels of dried prickly pear peel (DPPP) caused an increment in the yellowness (b*) and redness (a*) of the gluten-free bread crumb. The gluten-free color of the bread crumb supplemented with by-products was directly correlated with the ingredients used in the production of the batter.
The color of the bread depends on the formulation or baking condition. Maillard reactions and caramelization of the crust are responsible for the changes in the color parameters between the crust and the crumb and the development of brown color on the surface at high temperature, but the color given to the ingredients used in bread formulation may mask this color [94].
The crust’s brightness decreased as the level of PPPF replacement increased, which was the most obvious outcome (Table 8). This could be the result of both enzymatic browning brought on by the presence of polyphenol oxidases and non-enzymatic browning brought on by an increased quantity of reducing sugars [6].

3.11. Sensory Evaluation

The sensory evolution of the cake prepared by adding PPPF was assessed at percentages of 5%, 10% and 15% (Table 9 and Figure 7). The control cake outperformed the cake prepared by the addition of 5%, 10% and 15% of PPPF in terms of appearance, crumb color, texture, crust color, and smell. The results also showed that the cake prepared by adding 10% PPPF received the higher sensory scores regarding the appearance, flavor and texture compared to the rest of the samples. In addition, there were significant differences between cake samples in both the color of the crust and the color of the crumb, and this may be due to the presence of carotene pigment in the PPPF, which affects the color [31]. The cake prepared with a 10% addition of PPPF received the highest sensory scores for taste, followed by 5%, then control, and finally 15%. The texture of the cake prepared by the addition of different levels of PPPF decreased significantly as compared to the control cake. The texture revealed that as the substitution of PPPF increased, the texture became stiffer and less elastic. These findings may be the result of interactions between the polysaccharides from cladodes, peel, and wheat flour proteins and the dilution of gluten proteins [16]. The highest concentration of prickly pear flour (15%) resulted in a decrease in the cakes’ size. According to De Wit et al. [79], similar outcomes were obtained.
According to the results of the sensory analysis, fortifying wheat flour cakes with 10% PPPF can be carried out satisfactorily. According to El-Shahat et al. [95], lowering the protein weakening index enhances the creation and stability of protein networks, while boosting batter consistency during baking affects the final product’s texture [96]. The high fiber content of 15% affected the cake’s appearance, texture, and flavor when compared to the control and the other substitution. The findings of the sensory analysis showed that 10% PPPF can be used to successfully replace cakes made with wheat flour.

3.12. Thiobarbituric Acid Reactive Substances (TBARS) Cakes Prepared by Replacing Flour with Various Levels of PPPF during Storage (Days)

The data in Figure 8 show that TBARS increased significantly in the control cakes and cakes prepared with different levels of 5, 10 and 15% of PPPF during the storage period (7, 14, and 21 days). In addition, the addition of different levels of PPPF caused a significant decrease in TBARS as compared to the control cakes. The most pronounced reduction in TBARS was detected in cakes prepared with 10 and 15% PPPF during the different storage periods. The determination of TBARS values is one of the main measurements of inspecting lipid oxidation. These findings suggest that bioactive compounds (flavonoids, polyphenols and carotenoids) in prickly pear peel by-products have antioxidant potential [96]. Since samples with the lowest amounts of phenolics and flavonoids also had the lowest percentage of radical inhibition, phenolic substances appear to be the cause of the strong free radical inhibition activity [97]. This is mostly caused by the high polyphenolic content of powdered prickly pear peel.

4. Conclusions

Fruit flour can be produced from prickly pear peel, which is thought of as a by-product and is rich in bioactive chemicals and has high antioxidant activity. In addition, it was discovered that the PPPF is an excellent source of dietary fibers, which might enhance the nutritional qualities of cake and make a useful product. According to the recovery of bioactive substances, it can be said that adding 5, 10 and 15% of prickly pear peel flour to the cake batter significantly increases the concentration of total polyphenols and flavonoids after baking. The recipe that results in the strongest flavor and best results in terms of specific volume is the one that substituted 10% PPPF of wheat flour. In addition, the trained panel concluded that the cake elaborated with 10% PPPF obtained the highest sensory analysis scores for the appearance, flavor and texture. According to the findings, PPPF is regarded as a good source of natural antioxidants and, in addition to dietary fibers, caused an inhibition in TBARS during storage; as a result, they can be used in the preparation of many functional foods that are thought to be exceptionally rich in fibers. In conclusion, cactus pear peel could be very suitable as a natural additive or substituted material in the production of many foodstuffs.

Author Contributions

Conceptualization, H.S.E.-B., H.O.E., A.R.A., H.I.M., H.H.A.-O. and K.M.A.R.; methodology, H.S.E.-B., H.O.E., A.R.A., H.I.M., H.H.A.-O. and K.M.A.R.; software, H.S.E.-B., A.R.A. and H.I.M.; validation, H.S.E.-B., H.S.E.-B., H.O.E., A.R.A., H.I.M., H.H.A.-O. and K.M.A.R.; formal analysis, H.S.E.-B., H.O.E., A.R.A. and K.M.A.R.; investigation, H.S.E.-B., A.R.A. and K.M.A.R.; resources, H.O.E., H.I.M. and H.H.A.-O.; data curation, H.S.E.-B. and H.I.M.; writing—original draft preparation, H.S.E.-B. and H.I.M.; writing—review and editing, H.S.E.-B., H.O.E., A.R.A., H.I.M., H.H.A.-O. and K.M.A.R.; visualization, H.S.E.-B., H.O.E., A.R.A., H.I.M., H.H.A.-O. and K.M.A.R.; supervision, H.S.E.-B., A.R.A. and K.M.A.R.; project administration, H.S.E.-B. and H.I.M.; funding acquisition, H.S.E.-B., H.O.E., A.R.A., H.H.A.-O. and K.M.A.R. All authors have read and agreed to the published version of the manuscript.

Funding

This research work was supported and funded by the Deputyship for Research and Innovation, Ministry of Education in Saudi Arabia (Project number INSTR001).

Institutional Review Board Statement

Not applicable.

Informed Consent Statement

Not applicable.

Data Availability Statement

All Data are available within the manuscript.

Acknowledgments

The authors extend their appreciation to the Deputyship for Research & Innovation, Ministry of Education in Saudi Arabia for funding this research.

Conflicts of Interest

The authors declare no conflict of interest.

References

  1. Oniszczuk, A.; W’ojtowicz, A.; Oniszczuk, T.; Matwijczuk, A.; Dib, A.; Markut-Miotła, E. Opuntia fruits as food enriching ingredient, the first step towards new functional food products. Molecules 2020, 25, 916. [Google Scholar] [CrossRef] [PubMed]
  2. Barba, F.J.; Garcia, C.; Fessard, A.; Munekata, P.E.S.; Lorenzo, J.M.; Aboudia, A.; Ouadia, A.; Remize, F. Opuntia ficus indica edible parts: A food and nutritional security perspective. Food Rev. Int. 2020, 38, 930–952. [Google Scholar] [CrossRef]
  3. Marquez, B.; Ayala, G.X.; Wing, R.R. Acculturation and weight loss strategies among latinas. J. Immigr. Minor. Health 2015, 17, 610–613. [Google Scholar] [CrossRef] [PubMed]
  4. Reda, T.H.; Atsbha, M.K. Nutritional composition, antinutritional factors, antioxidant activities, functional properties, and sensory evaluation of cactus pear (Opuntia ficus-indica) seeds grown in tigray region, Ethiopia. Int. J. Food Sci. 2019, 2019, 5697052. [Google Scholar] [CrossRef] [PubMed]
  5. Tahir, H.E.; Xiaobo, Z.; KomLa, M.G.; Adam, M.A. Nopal cactus (Opuntia ficus-indica (L.) Mill) as a source of bioactive compounds. In Wild Fruits: Composition, Nutritional Value and Products; Mariod, A.A., Ed.; Springer International Publishing: Cham, Switzerland, 2019; pp. 333–358. [Google Scholar] [CrossRef]
  6. Bouazizia, S.; Montevecchib, G.; Antonellib, A.; Hamdia, M. Effects of prickly pear (Opuntia ficus-indica L.) peel flour as an innovative ingredient in biscuits formulation. LWT—Food Sci. Technol. 2020, 124, 109155. [Google Scholar] [CrossRef]
  7. Valero-Galv’an, J.; Gonz’alez-Fern’andez, R.; Sigala-Hern’andez, A.; Núnez-Gast’elum, J.A.; Ruiz-May, E.; Rodrigo-García, J.; Larqu’e-Saavedra, A.; del Rocío Martínez-Ruiz, N. Sensory attributes, physicochemical and antioxidant characteristics, and protein profile of wild prickly pear fruits (O. macrocentra Engelm., O. phaeacantha Engelm., and O. engelmannii Salm-Dyck ex Engelmann.) and commercial prickly pear fruits (O. ficus-indica (L.) Mill.). Food Res. Int. 2021, 140, 109909. [Google Scholar] [CrossRef]
  8. Patil, K.; Dagadkhair, A. Physicochemical characteristics and antioxidant potential of opuntia fruit: A review. Pharma Innov. 2019, 8, 376–380. [Google Scholar]
  9. De Santiago, E.; Dominguez-Fernandez, M.; Cid, C.; De Pena, M.P. Impact of cooking process on nutritional composition and antioxidants of cactus cladodes (Opuntia ficus-indica). Food Chem. 2018, 240, 1055–1062. [Google Scholar] [CrossRef] [PubMed]
  10. Gouws, C.A.; Georgouopoulou, E.; Mellor, D.D.; Naumovski, N. The effect of juicing methods on the phytochemical and antioxidant characteristics of the purple prickly pear (Opuntia ficus indica)—Preliminary findings on juice and pomace. Beverages 2019, 5, 28. [Google Scholar] [CrossRef]
  11. Msaddak, L.; Siala, R.; Fakhfakh, N.; Ayadi, M.A.; Nasri, M.; Zouari, N. Cladodes from prickly pear as a functional ingredient: Effect on fat retention, oxidative stability, nutritional and sensory properties of cookies. Int. J. Food Sci. Nutr. 2015, 66, 851–857. [Google Scholar] [CrossRef]
  12. Bakari, S.; Daoud, A.; Felhi, S.; Slim, S.; Gharsallah, N.; Kadri, A. Proximate analysis, mineral composition, phytochemical contents, antioxidant and antimicrobial activities and GC-MS investigation of various solvent extracts of cactus cladode. Food Sci. Technol. 2016, 37, 286–293. [Google Scholar] [CrossRef]
  13. Liguori, G.; Gentile, C.; Gaglio, R.; Perrone, A.; Guarcello, R.; Francesca, N.; Fretto, S.; Inglese, P.; Settanni, L. Effect of addition of Opuntia ficus-indica mucilage on the biological leavening, physical, nutritional, antioxidant and sensory aspects of bread. J. Biosci. Bioeng. 2020, 129, 184–191. [Google Scholar] [CrossRef] [PubMed]
  14. Palmeri, R.; Parafati, L.; Restuccia, C.; Fallico, B. Application of prickly pear fruit extract to improve domestic shelf life, quality and microbial safety of sliced beef. Food Chem. Toxicol. 2018, 118, 355–360. [Google Scholar] [CrossRef] [PubMed]
  15. Silva, M.; Albuquerque, T.; Pereira, P.; Ramalho, R.; Vicente, F.; Oliveira, M.; Costa, H. Opuntia ficus-indica (L.) Mill.: A multi-benefit potential to be exploited. Molecules 2021, 26, 951. [Google Scholar] [CrossRef] [PubMed]
  16. Parafati, L.; Restuccia, C.; Palmeri, R.; Fallico, B.; Arena, E. Characterization of prickly pear peel flour as a bioactive and functional ingredient in bread preparation. Foods 2020, 9, 1189. [Google Scholar] [CrossRef]
  17. El-Beltagi, H.S.; Mohamed, H.I.; Elmelegy, A.A.; Eldesoky, S.E.; Safwat, G. Phytochemical screening, antimicrobial, antioxidant, anticancer activities and nutritional values of cactus (Opuntia ficus indicia) pulp and peel. Fresenius Environ. Bull. 2019, 28, 1534–1551. [Google Scholar]
  18. El-Beltagi, H.S.; El-Senousi, N.A.; Ali, Z.A.; Omran, A.A. The impact of using chickpea flour and dried carp fish powder on pizza quality. PLoS ONE 2017, 12, e0183657. [Google Scholar] [CrossRef]
  19. El-Beltagi, H.S.; El-Mogy, M.M.; Parmar, A.; Mansour, A.T.; Shalaby, T.A.; Ali, M.R. Phytochemical characterization and utilization of dried red beetroot (Beta vulgaris) peel extract in maintaining the quality of Nile Tilapia Fish Fillet. Antioxidants 2022, 11, 906. [Google Scholar] [CrossRef]
  20. Abdel-Rahim, E.A.; El-Beltagi, H.S.; Romela, R.M. White Bean seeds and Pomegranate peel and fruit seeds as hypercholesterolemic and hypolipidemic agents in albino rats. Grasas Aceites 2013, 64, 50–58. [Google Scholar] [CrossRef]
  21. Abdel-Rahim, E.A.; El-Beltagi, H.S. Constituents of apple, parsley and lentil edible plants and their therapy treatments for blood picture as well as liver and kidney functions against lipidemic disease. Electron. J. Environ. Agric. Food Chem. 2010, 9, 1117–1127. [Google Scholar]
  22. Afify, A.E.-M.M.R.; El-Beltagi, H.S.; Aly, A.A.; El-Ansary, A.E. Antioxidant enzyme activities and lipid peroxidation as biomarker for potato tuber stored by two essential oils from Caraway and Clove and its main component carvone and eugenol. Asian Pac. J. Trop. Biomed. 2012, 2, S772–S780. [Google Scholar] [CrossRef]
  23. Elkatry, H.O.; Ahmed, A.R.; El-Beltagi, H.S.; Mohamed, H.I.; Eshak, N.S. Biological activities of grape seed by-products and their potential use as natural sources of food additives in the production of Balady bread. Foods 2022, 11, 1948. [Google Scholar] [CrossRef] [PubMed]
  24. El-Beltagi, H.S.; Eshak, N.S.; Mohamed, H.I.; Bendary, E.S.A.; Danial, A.W. Physical characteristics, minerals content, antioxidants and antibacterial activities of Punica granatum or Citrus sinensis peel extracts and their applications to improve cake quality. Plants 2022, 11, 1740. [Google Scholar] [CrossRef]
  25. Ahmed, A.S. Nutritional and Technological Studies on the Effect of Phytochemicals on Obesity Injuries and Their Related Diseases by Using Experimental Animals. Ph.D. Thesis, Faculty of Specific Education, Port Saied University, Port Saied, Egypt, 2016. [Google Scholar]
  26. Bensadón, S.; Hervert-Hernández, D.; Sáyago-Ayeri, S.G.; Goñi, I. By-products of Opuntia ficus-indica as a source of antioxidant dietary fiber. Plant Foods Hum. Nutr. 2010, 65, 210–216. [Google Scholar] [CrossRef] [PubMed]
  27. Fernández-López, J.A.; Almela, L.; Obón, J.M.; Castellar, R. Determination of antioxidant constituents in cactus pear fruits. Plant Foods Hum. Nutr. 2010, 65, 253–259. [Google Scholar] [CrossRef] [PubMed]
  28. Hernández-Carranza, P.; Jattar-Santiago, K.Y.; Avila-Sosa, R.; Pérez-Xochipa, I.; Guerrero-Beltrán, J.A.; Ochoa-Velasco, C.E.; Ruiz-López, I.I. Antioxidant fortification of yogurt with red cactus pear peel and its mucilage. CyTA J. Food 2019, 17, 824–833. [Google Scholar] [CrossRef]
  29. Cai, W.; Gu, X.; Tang, J. Extraction, purification and characterization of the flavonoids from Opuntia milpa alta skin. Czech. J. Food Sci. 2010, 28, 108–116. [Google Scholar] [CrossRef]
  30. Diaz-Vela, J.; Totosaus, A.; Perez-Chabela, M.L. Integration of agroindustrial co-products as functional food ingredients: Cactus pear (Opuntia ficus indica) flour and pineapple (Ananas comosus) peel flour as fiber source in cooked sausages inoculated with lactic acid bacteria. J. Food Process. Preserv. 2015, 39, 2630–2638. [Google Scholar] [CrossRef]
  31. Mahfouz, M.Z.; Abd-Elnoor, A.V. Housewives’ knowledges and practices of utilizing prickly pear peels and its use in fortifying some bakery products (cake & biscuits): An applied study. Home Econ. J. 2020, 36, 163–199. [Google Scholar] [CrossRef]
  32. Chougui, N.; Djerroud, N.; Naraoui, F.; Hadjal, S.; Aliane, K.; Zeroual, B.; Larbat, R. Physicochemical properties and storage stability of margarine containing Opuntia ficus-indica peel extract as antioxidant. Food Chem. 2015, 173, 382–390. [Google Scholar] [CrossRef]
  33. Miranda, D.V.; Rojas, M.L.; Pagador, S.; Lescano, L.; Sanchez-Gonzalez, J.; Linares, G. Gluten-free snacks based on brown rice and amaranth flour with incorporation of Cactus pear peel powder: Physical, nutritional, and sensorial properties. Int. J. Food Sci. 2018, 2018, 7120327. [Google Scholar] [CrossRef] [PubMed]
  34. Anwar, M.M.; Sallam, E.M. Utilization of prickly pear peels to improve quality of pan bread. Arab. J. Nucl. Sci. Appl. 2016, 49, 151–163. [Google Scholar]
  35. Hedayati, S.; Ansari, S.; Javaheri, Z.; Golmakani, M.T.; Ansarifar, E. Multi-objective optimization of cakes formulated with fig or date syrup and different hydrocolloids based on TOPSIS. LWT 2022, 171, 114088. [Google Scholar] [CrossRef]
  36. Wilderjans, E.; Luyts, A.; Brijs, K.; Delcour, J.A. Ingredient functionality in batter type cake making. Trends Food Sci. Technol. 2013, 30, 6–15. [Google Scholar] [CrossRef]
  37. Hao, Y.; Wang, F.; Huang, W.; Tang, X.; Zou, Q.; Li, Z.; Ogawa, A. Sucrose substitution by polyols in sponge cake and their effects on the foaming and thermal properties of egg protein. Food Hydrocoll. 2016, 57, 153–159. [Google Scholar] [CrossRef]
  38. El-Gendi, H.; Salama, A.; El-Fakharany, E.M.; Saleh, A.K. Optimization of bacterial cellulose production from prickly pear peels and its ex situ impregnation with fruit byproducts for antimicrobial and strawberry packaging applications. Carbohydrate Polym. 2023, 302, 120383. [Google Scholar] [CrossRef]
  39. Ayadi, M.A.; Abdelmaksoud, W.; Ennouri, M.; Attia, H. Cladodes from Opuntia ficus indica as a source of dietary fiber: Effect on dough characteristics and cake making. Ind. Crops Prod. 2009, 30, 40–47. [Google Scholar] [CrossRef]
  40. Jeddou, K.B.; Bouaziz, F.; Zouari-Ellouzi, S.; Chaari, F.; Ellouz-Chaabouni, S.; Ellouz-Ghorbel, R.; Nouri-Ellouz, O. Improvement of texture and sensory properties of cakes by addition of potato peel powder with high level of dietary fiber and protein. Food Chem. 2017, 217, 668–677. [Google Scholar] [CrossRef]
  41. Segundo, C.; Román, L.; Gómez, M.; Martínez, M.M. Mechanically fractionated flour isolated from green bananas (M. cavendishii var. nanica) as a tool to increase the dietary fiber and phytochemical bioactivity of layer and sponge cakes. Food Chem. 2017, 219, 240–248. [Google Scholar] [CrossRef]
  42. Ahmed, A.R. Influence of chemical properties of wheat-lupine flour blends on cake quality. Am. J. Food Sci. Technol. 2014, 2, 67–75. [Google Scholar] [CrossRef]
  43. Randez-Gil, F.; Prieto, J.A.; Murcia, A.; Sanz, P. Construction of baker٫s yeast strains that secret Aspergilus oryzae alph-amylase and their use in bread making. J. Cereal Sci. 1995, 21, 185–193. [Google Scholar] [CrossRef]
  44. Francis, F.J. Colorimetry of foods. In Physical Properties of Foods; Peleg, M., Bagly, E.B., Eds.; The AVI Publishing Company Inc.: Westort, CT, USA, 1983; pp. 105–123. [Google Scholar]
  45. A.O.C.C. American of Cereal Association Chemists Approved Method of the AOAC, 10th ed.; American Association of Cereal Chemists: St. Paul, MD, USA, 1996; pp. 4, 13, 61. [Google Scholar]
  46. A.O.A.C. Association of Official Analytical Chemists. In Official Methods of Analysis, 18th ed.; AOAC International: Arlington, VA, USA, 2010. [Google Scholar]
  47. Asker, A.; Treptow, H. Quality Assurance in Tropical Fruits Processing; Springer: Berlin/Heidelberg, Germany; New York, NY, USA, 1993. [Google Scholar]
  48. Tobaruela, E.D.C.; Santos, A.D.O.; de Almeida-Muradian, L.B.; Araujo, E.D.S.; Lajolo, F.M.; Menezes, E.W. Application of dietary fiber method AOAC 2011.25 in fruit and comparison with AOAC 991.43 method. Food Chem. 2018, 238, 87–93. [Google Scholar] [CrossRef] [PubMed]
  49. Jayaraman, J. Postharvest Biological Control; Wiely Eastern Limited.: New Delhi, India, 1985. [Google Scholar]
  50. Marin, B.; Chopin, E.I.B.; Jupinet, B.; Gauthier, D. Comparison of microwave-assisted digestion procedures for total trace element content determination in calcareous soils. Talanta 2008, 77, 282–288. [Google Scholar] [CrossRef] [PubMed]
  51. Goffman, F.D.; Bergman, C.J. Rice kernel phenolic content and its relationship with antiradical efficiency. J. Sci. Food Agric. 2004, 84, 1235–1240. [Google Scholar] [CrossRef]
  52. Chang, C.; Yang, M.; Wen, H.M.; Chern, J.C. Estimation of total flavonoid content in propolis by two complementary colorimetric methods. J. Food Drug Anal. 2002, 10, 178–182. [Google Scholar] [CrossRef]
  53. Abdel-Aal, E.S.M.; Young, J.C.; Rabalski, I. Anthocyanin composition in black, blue, pink, purple, and red cereal grains. J. Agric. Food Chem. 2006, 54, 4696–4704. [Google Scholar] [CrossRef]
  54. Wang, Y.C.; Chuang, Y.C.; Hsu, H.W. The flavonoid, carotenoid and pectin content in peels of citrus cultivated in Taiwan. Food Chem. 2008, 106, 277–284. [Google Scholar] [CrossRef]
  55. Re, R.; Pellegrini, N.; Proteggente, A.; Pannala, A.; Yang, M.; Rice-Evans, C. Antioxidant activity applying an improved ABTS radical cation decolorization assay. Free Radic. Biol. Med. 1999, 26, 1231–1237. [Google Scholar] [CrossRef]
  56. Alexandre, E.M.C.; Lourenço, R.V.; Bittante, A.M.Q.B.; Moraes, I.C.F.; Sobral, P.J.d.A. Gelatin-based films reinforced with montmorillonite and activated with nanoemulsion of ginger essential oil for food packaging applications. Food Packag. Shelf Life 2016, 10, 87–96. [Google Scholar] [CrossRef]
  57. Ruch, R.J.; Cheng, S.J.; Klaunig, J.E. Prevention of cytotoxicity and inhibition of intercellular communication by antioxidant Caechins isolated from Chinese Green tea. Carcinogenesis 1989, 10, 1003–1008. [Google Scholar] [CrossRef]
  58. Vyncke, W. Evaluation of direct thiobarbituric acid extraction method for determining oxidative rancidity in mackerel (Scomber scombrus L.). Fette Seifen Anstrichm. 1975, 77, 239–240. [Google Scholar] [CrossRef]
  59. PSS, I. SPSS Version 16.0; SPSS Incorporated: Chicago, IL, USA, 2007. [Google Scholar]
  60. Duncan, D.B. Multiple range and multiple F tests. Biometrics 1955, 11, 1–42. [Google Scholar] [CrossRef]
  61. Ndangui, C.B.; Petit, J.; Gaiani, C.; Nzikou, J.M.; Scher, J. Impact of thermal and chemical pretreatments on physicochemical, rheological and functional properties of sweet potato (Ipomea batatas Lam) Flour. Food Bioprocess Technol. 2014, 7, 3618–3628. [Google Scholar] [CrossRef] [Green Version]
  62. Mahloko, L.M.; Silungwe, H.; Mashau, M.E.; Kgatla, T.E. Bioactive compounds, antioxidant activity and physical characteristics of wheat-prickly pear and banana biscuits. Heliyon 2019, 5, e02479. [Google Scholar] [CrossRef] [PubMed]
  63. Sharoba, A. Improve the Nutritive Value of Produced Cake by Replacement Wheat Flour with Pearl Millet Flour. Ann. Agric. Sci. Moshtohor. 2021, 59, 445–454. [Google Scholar] [CrossRef]
  64. Abou-Bakr, T.M.; Youssef, M.M.; Moharram, H.A. Analysis, health benefits and applications of prebiotic: A Review. Alex. J. Food Sci. Technol. 2014, 11, 25–37. [Google Scholar]
  65. García-Cayuela, T.; Gómez-Maqueo, A.; Guajardo-Flores, D.; Welti-Chanes, J.; Cano, M.P. Characterization and quantification of individual betalain and phenolic compounds in Mexican and Spanish prickly pear (Opuntia ficus-indica L. Mill) tissues: A comparative study. J. Food Comp. Anal. 2019, 76, 1–13. [Google Scholar] [CrossRef]
  66. Hegazy, E.M.; Ibrahim, N.M.; Saleh, N.S.M. Determination of antioxidant and antifungal activities in cookies fortified with solar dried prickly pear peels powder. Pak. J. Biol. Sci. 2020, 23, 590–601. [Google Scholar] [CrossRef]
  67. Jakobek, L. Interactions of polyphenols with carbohydrates, lipids and proteins. Food Chem. 2015, 175, 556–567. [Google Scholar] [CrossRef]
  68. El-Beltagi, H.S.; El-Mahdy, O.M.; Mohamed, H.I.; El-Ansary, A.E. Antioxidants, antimicrobial, and anticancer activities of purified chitinase of Talaromyces funiculosus Strain CBS 129594 biosynthesized using crustacean bio-wastes. Agronomy 2022, 12, 2818. [Google Scholar] [CrossRef]
  69. El-Beltagi, H.S.; Mohamed, H.I.; Abdelazeem, A.S.; Youssef, R.; Safwat, G. GC-MS analysis, antioxidant, antimicrobial and anticancer activities of extracts from Ficus sycomorus fruits and leaves. Not. Bot. Horti. Agrobot. Cluj-Napoca 2019, 47, 493–505. [Google Scholar] [CrossRef]
  70. Afify, A.M.R.; Rashed, M.M.; Ebtesam, A.M.; El-Beltagi, H.S. Effect of gamma radiation on the lipid profiles of soybean, peanut and sesame seed oils. Grasas Aceites 2013, 64, 356–368. [Google Scholar] [CrossRef]
  71. Naeem, M.; Basit, A.; Ahmad, I.; Mohamed, H.I.; Wasila, H. Effect of salicylic acid and salinity stress on the performance of tomato. Gesunde Pflanzen 2020, 72, 393–402. [Google Scholar] [CrossRef]
  72. Afify, A.E.M.M.; El-Beltagi, H.S. Effect of insecticide cyanophos on liver function in adult male rats. Fresenius Environ. Bull. 2011, 20, 1084–1088. [Google Scholar]
  73. Abou-Elella, F.; Ali, R. Antioxidant and Anticancer Activities of Different Constituents Extracted from Egyptian Prickly Pear Cactus (Opuntia ficus Indica) Peel. Biochem. Anal. Biochem. 2014, 3, 158. [Google Scholar] [CrossRef] [Green Version]
  74. El-Beltagi, H.S.; Dawi, F.; Ashoush, I.S.; Ramadan, K.M.A. Antioxidant, anticancer and ameliorative activities of Spirulina platensis and pomegranate juice against hepatic damage induced by CCl4. Not. Bot. Hort. Agrobot. Cluj-Napoca 2020, 48, 1941–1956. [Google Scholar] [CrossRef]
  75. Rajendrasozhan, S.; Moll, H.E.; Snoussi, M.; Romeilah, R.M.; El-Beltagi, H.S.; Shalaby, E.A.; Younes, K.M.; El-Beltagi, H.S. Phytochemical screening and antimicrobial activity of various extracts of aerial parts of Rhanterium epapposum. Processes 2021, 9, 1351. [Google Scholar] [CrossRef]
  76. El-Beltagi, H.S.; Mohamed, H.I.; Aldaej, M.I.; Al-Khayri, J.M.; Rezk, A.A.; Al-Mssallem, M.Q.; Sattar, M.N.; Ramadan, K.M.A. Production and antioxidant activity of secondary metabolites in Hassawi rice (Oryza sativa L.) cell suspension under salicylic acid, yeast extract, and pectin elicitation. Vitr. Cell Dev. Biol. Plant 2022, 58, 615–629. [Google Scholar] [CrossRef]
  77. Ramadan, K.M.A.; El-Beltagi, H.S.; Shanab, S.M.M.; El-fayoumy, E.A.; Shalaby, E.A.; Bendary, E.S.A. Potential antioxidant and anticancer activities of secondary metabolites of Nostoc linckia cultivated under Zn and Cu stress conditions. Processes 2021, 9, 1972. [Google Scholar] [CrossRef]
  78. Shallan, M.A.; El-Beltagi, H.S.; Mona, A.M.; Amera, T.M.; Sohir, N.A. Effect of amylose content and pre-germinated brown rice on serum blood glucose and lipids in experimental animal. Aust. J. Basic Appl. Sci. 2010, 4, 114–121. [Google Scholar]
  79. Dewit, M.; Bothma, C.; Hugo, A.; Sithole, T.; Absalom, C.; van Den, B.C. Physico-chemical and sensory evaluation of cactus pear (Opuntia ficus-indica L. Mill and Opuntia robusta Wendl) cladode flour in different baked products. JPACD 2015, 17, 89–106. [Google Scholar]
  80. Jiménez-Aguilar, D.M.; López-Martínez, J.M.; Hernández-Brenes, C.; Gutiérrez-Uribe, J.A.; Welti-Chanes, J. Dietary fiber, phytochemical composition and antioxidant activity of Mexican commercial varieties of cactus pear. J. Food Comp. Anal. 2015, 41, 66–73. [Google Scholar] [CrossRef]
  81. De Wit, M.; Du Toit, A.; Osthoff, G.; Hugo, A. Antioxidant content, capacity and retention in fresh and processed Cactus pear (Opuntia ficus-indica and O. robusta) fruit peels from different fruit-colored cultivars. Front. Sustain. Food Syst. 2020, 4, 133. [Google Scholar] [CrossRef]
  82. Yeddes, N.; Chérif, J.K.; Guyot, S.; Sotin, H.; Ayadi, M.T. Comparative study of antioxidant power, polyphenols, flavonoids and betacyanins of the peel and pulp of three Tunisian Opuntia forms. Antioxidants 2013, 2, 37–51. [Google Scholar] [CrossRef] [PubMed]
  83. Alexandre, E.M.C.; Coelho, M.C.; Ozcan, K.; Pinto, C.A.; Teixeira, J.A.; Saraiva, J.A.; Pintado, M. Emergent technologies for the extraction of antioxidants from Prickly pear peel and their antimicrobial activity. Foods 2021, 10, 570. [Google Scholar] [CrossRef] [PubMed]
  84. Procházková, D.; Boušová, I.; Wilhelmová, N. Antioxidant and prooxidant properties of flavonoids. Fitoterapia 2011, 82, 513–523. [Google Scholar] [CrossRef] [PubMed]
  85. Silva-Beltrán, N.P.; Ruiz-Cruz, S.; Cira-Chávez, L.A.; Estrada-Alvarado, M.I.; Ornelas-Paz, J.d.J.; López-Mata, M.A.; Del-Toro-Sánchez, C.L.; Ayala-Zavala, J.F.; Márquez-Ríos, E. Total phenolic, flavonoid, tomatine, and tomatidine contents and antioxidant and antimicrobial activities of extracts of tomato plant. Int. J. Anal. Chem. 2015, 2015, 284071. [Google Scholar] [CrossRef] [PubMed] [Green Version]
  86. Kuti, J.O. Antioxidant compounds from four Opuntia cactus pear fruit varieties. Food Chem. 2004, 85, 527–533. [Google Scholar] [CrossRef]
  87. Slimen, J.B.; Hidouri, M.; Ghouma, M.; Salem, E.B.; Dorozhkin, S.V. Sintering of potassium doped hydroxy-fluorapatite bioceramics. Coatings 2021, 11, 858. [Google Scholar] [CrossRef]
  88. Agu, H.O.; Okoli, N.A. Physico-chemical, sensory, and microbiological assessments of wheat-based biscuit improved with beniseed and unripe plantain. Food Sci. Nutr. 2014, 2, 464–469. [Google Scholar] [CrossRef]
  89. Barbosa-Pereira, L.; Bilbao, A.; Vilches, P.; Angulo, I.; LLuis, J.; Fité, B.; Paseiro-Losada, P.; Manuel, J. Brewery waste as a potential source of phenolic compounds: Optimisation of the extraction process and evaluation of antioxidant and antimicrobial activities. Food Chem. 2014, 145, 191–197. [Google Scholar] [CrossRef] [PubMed]
  90. Ramadan, K.M.A.; El-Beltagi, H.S.; Mohamed, H.I.; Shalaby, T.A.; Galal, A.; Mansour, A.T.; Aboul Fotouh, A.A.; Bendary, E.S.A. Antioxidant, anti-cancer activity and phytochemicals profiling of Kigelia pinnata fruits. Separation 2022, 9, 379. [Google Scholar] [CrossRef]
  91. Sehn, G.A.R.; Nogueira, A.D.C.; Almeida, E.L.; Chang, Y.K.; Steel, C.J. Fortification of wheat dough with calcium and magnesium ions affects empirical rheological properties. Cereal Chem. 2015, 92, 405–410. [Google Scholar] [CrossRef]
  92. Chinma, C.E.; Gernah, D.I. Physicochemical and sensory properties of cookies produced from cassava/soyabean/mango composite flours. J. Food Technol. 2007, 5, 256–260. [Google Scholar]
  93. Djeghim, F.; Bourekoua, H.; Różyło, R.; Bieńczak, A.; Tanaś, W.; Zidoune, M.N. Effect of By-Products from Selected Fruits and Vegetables on Gluten-Free Dough Rheology and Bread Properties. Appl. Sci. 2021, 11, 4605. [Google Scholar] [CrossRef]
  94. Martins, Z.; Pinho, O.; Ferreira, I. Fortification of Wheat Bread with Agroindustry By-Products: Statistical Methods for Sensory Preference Evaluation and Correlation with Color and Crumb Structure. J. Food Sci. 2017, 82, 2183–2191. [Google Scholar] [CrossRef]
  95. El-Shahat, M.S.; Rabie, M.A.; Ragab, M.; Siliha, H. Changes on physicochemical and rheological properties of biscuits substituted with the peel and alcohol-insoluble solids (AIS) from cactus pear (Opuntia ficus-indica). J. Food Sci. Technol. 2019, 56, 3635–3645. [Google Scholar] [CrossRef]
  96. Collar, C.; Bollain, C.; Rosell, C.M. Rheological behaviour of formulated bread doughs during mixing and heating. Food Sci. Technol. Int. 2007, 13, 99–107. [Google Scholar] [CrossRef]
  97. El-Shahat, M.S.; Ragab, M.; Siliha, H.A.; Rabie, M.A. Physicochemical characteristics of biscuits fortified with cactus pear peel powder. Zagazig J. Agric. Res. 2017, 44, 1073–1084. [Google Scholar] [CrossRef]
Figure 1. Secondary metabolites contents (Total phenolic mg GAE/100 g, total anthocyanins mg KE/100 g, total flavonoids mg QE/100 g, total carotenoids, and ascorbic acid) in PPPF. Each value represents the mean (±SD) of three different replications. GAE: gallic acid; KE: kuromanin; QE: quercetin.
Agronomy 13 00439 g001
Figure 2. LC-Chromatogram of polyphenolic compounds in ethanolic extract of prickly pear peel.
Agronomy 13 00439 g002
Figure 3. Proximate analysis of cake prepared by replacing flour with various levels of prickly pear peel flour (PPPF). Each value represents the mean (±SD) of three different replications. The different letters on the same bar show a significant difference according to Duncan’s test at p ≤ 0.05.
Agronomy 13 00439 g003
Figure 4. Total phenolic (mg GAE/100 g DW) and total flavonoids (mg QE/100 g DW) contents in cake supplemented with different levels of prickly pear peel flour (PPPF). Each value represents the mean (±SD) of three different replications. The different letters on the same bar show a significant difference according to Duncan’s test at p ≤ 0.05. GAE: gallic acid; QE: quercetin.
Agronomy 13 00439 g004
Figure 5. Antioxidants capacity % of cake prepared by replacing flour with various levels of prickly pear peel flour (50, 100, and 150 µg/mL of PPPF) against DPPH. Each value represents the mean (±SD) of three different replications. Different letters on the same bar show a significant difference according to Duncan’s test at p ≤ 0.05.
Agronomy 13 00439 g005
Figure 6. Antioxidants capacity % of cake treatments prepared by replacing flour with various levels of prickly pear peel flour (50, 100, and 150 µg/mL of PPPF) against ABTS. Each value represents the mean (±SD) of three different replications. Different letters on the same bar show a significant difference according to Duncan’s test at p ≤ 0.05.
Agronomy 13 00439 g006
Figure 7. The whole cake and sullied cakes were prepared by replacing flour with various levels of PPPF.
Agronomy 13 00439 g007
Figure 8. TBARS (µg/g) of cakes prepared by replacing flour with various levels of PPPF during storage (days). Each value represents the mean (±SD) of three different replications. The different letters on the same bar show a significant difference according to Duncan’s test at p ≤ 0.05.
Agronomy 13 00439 g008
Table 1. Recipe of cake.
IngredientsFlour
(g)
Sugar
(g/100 g Flour)
Shortening
(g/100 g Flour)
Fresh Egg
(g/100 g Flour)
Milk (mL/100 g Flour)
(1.5% Fat)
Baking Powder (g/100 g Flour)Vanillin
(g/100 g Flour)
Cake control1006050655042
Cake + PPPF 5%956050655042
Cake + PPPF 10%906050655042
Cake + PPPF 15%856050655042
Table 2. Proximate analysis of prickly pear peel flour.
ParametersPrickly Pear Peels
Moisture%6.58 ± 1.53
Ash%10.81 ± 0.35
Lipid%5.17 ± 0.40
Crude Protein%3.69 ± 0.19
Carbohydrates%49.93 ± 1.21
Crude Fiber%25.79 ± 0.23
Reducing Sugar%24.43 ± 0.99
Total Nitrogen%0.59 ± 0.03
Free Amino Acids%0.37 ± 0.01
Each value represents the mean (±SD) of three different replications.
Table 3. Antioxidant activities of prickly pear peel flour (PPPF) extract and vitamin E as a standard against DPPH, ABTS and H2O2.
TreatmentConcentration
(µg/mL)
% Inhibition of DPPHIC50 (μg/mL)% Inhibition of ABTSIC50 (μg/mL)% Inhibition of H2O2IC50 (μg/mL)
PPPF2545.54 ± 0.4323.4140.78 ± 1.6626.3715.37 ± 1.5741.38
5076.52 ± 1.067.54 ± 2.2625.16 ± 1.87
10098.73 ± 0.5287.98 ± 1.7165.36 ± 0.77
150100.00 ± 0.597.81 ± 0.5097.21 ± 1.26
Vitamin E2512.84 ± 0.162.4919.96 ± 0.071.8616.79 ± 1.046.45
5027.04 ± 0.3654.73 ± 0.6435.13 ± 0.69
10066.46 ± 0.9687.93 ± 0.9760.14 ± 1.37
15092.03 ± 1.32100.00 ± 0.0099.90 ± 0.14
Each value represents the mean (±SD) of three different replications.
Table 4. The minerals content of prickly pear peel flour.
Minerals Contents mg/100 g DWPPPF
Mg963.0 ± 2.0
Ca929.0 ± 1.0
Na911.5 ± 0.5
K304.5 ± 0.41
Fe117.5 ± 0.32
Mn99.5 ± 0.24
Zn100.5 ± 0.27
Cu53.0 ± 0.15
Ni0.07 ± 0.01
Cr0.03 ± 0.002
P0.01 ± 0.001
Se0.00 ± 0.0
Each value represents the mean (±SD) of three different replications.
Table 5. LC-Tandem MS of polyphenolic compounds of prickly pear peel, in negative mode (EI)-MS.
Phenolic CompoundBase Beak m/z[M + H]Ret. Time [min]Relative %References
Gallic acid1251691.8622.72 ± 0.15Alexandre, et al. [83]
Piscidic acid1932552.1918.98 ± 0.25Alexandre, et al. [83]
Caffeic acid1351792.3340.83 ± 0.08Alexandre, et al. [83]
Eucomic acid17923925.13019.59 ± 0.35Procházková et al. [84]
Feruloyl-D-glucose19335525.24910.10 ± 0.16Silva-Beltrán, et al. [85]
3-O-Methylquercetin30031525.57313.73 ± 0.23Silva-Beltrán, et al. [85]
Catechin28928925.8872.00 ± 0.17Kuti [86]
Kaempferol18528526.12114.07 ± 0.19Kuti [86]
Cinnamic12914727.1670.39 ± 0.04Slimen, et al. [87]
Coumarin14514528.1080.46 ± 0.01Procházková et al. [84]
Isorhamnetin31131528.46927.10 ± 0.58Alexandre, et al. [83]
Table 6. Minerals content of cakes prepared by replacing flour with various levels of PPPF.
Minerals Content mg/100 g DWCake ControlCake + PPPF 5%Cake + PPPF 10%Cake + PPPF 15%
Mg0.043 ± 0.003 d41.97 ± 0.52 c93.61 ± 1.10 b136.94 ± 0.78 a
Ca16.00 ± 0.12 d56.65 ± 0.69 c105.9 ± 0.63 b148.5 ± 0.85 a
Na0.045 ± 0.004 d39.83 ± 0.58 c88.17 ± 0.53 b129.6 ± 0.74 a
K0.260 ± 0.01 d14.17 ± 0.21 c29.70 ± 0.18 b43.6 ± 0.25 a
Fe3.60 ± 0.14 d9.02 ± 0.13 c14.98 ± 0.09 b20.4 ± 0.12 a
Mn0.57 ± 0.02 d5.12 ± 0.08 c10.19 ± 0.21 b14.7 ± 0.1 a
Zn0.79 ± 0.013 d5.39 ± 0.7 c10.59 ± 0.42 b15.1 ± 0.09 a
Cu0.001 ± 0.0 d2.15 ± 0.04 c5.18 ± 0.3 b7.54 ± 0.04 a
Ni0.001 ± 0.0 b0.001 ± 0.0 b0.003 ± 0.0 a0.003 ± 0.001 a
Cr0.00 ± 0.0 b0.000 ± 0.0 b0.002 ± 0.0 a0.002 ± 0.0 a
P0.130 ± 0.02 b0.132 ± 0.001 b0.132 ± 0.002 b0.136 ± 0.001 a
Se0.072 ± 0.001 a0.073 ± 0.002 a0.073 ± 0.001 a0.074 ± 0.000 a
Each value represents the mean (±SD) of three different replications. Different letters on the same column show a significant difference according to Duncan’s test at p ≤ 0.05.
Table 7. Weight, volume, and specific volume of cakes prepared by replacing flour with various levels of PPPF.
SubstitutionWeight (g)Height (cm)Volume (cm3)Specific Volume (cm3/g)
Cake Control230± 3.06 a6.70 ± 0.20 b685 ± 5.00 b2.98 ± 0.02 b
Cake + PPPF 5%230 ± 2.52 a6.33 ± 0.21 c658 ± 7.64 c 2.82 ± 0.02 c
Cake + PPPF 10%233 ± 1.53 a7.60 ± 0.26 a715 ± 5.00 a3.24 ± 0.03 a
Cake + PPPF 15%233 ± 1.00 a6.30 ± 0.15 c633 ± 2.52 d2.72 ± 0.01 d
Each value represents the mean (±SD) of three different replications. Different letters on the same column show a significant difference according to Duncan’s test at p ≤ 0.05.
Table 8. Color values of cakes prepared by replacing flour with various levels of PPPF.
SubstitutionCrust Crumb
L*a*b*∆EL*a*b*∆E
Flour94.68 ± 0.43 a23.33 ± 3.21 a9.51 ± 0.13 e-94.68 ± 0.43 a23.33 ± 3.21 a9.51 ± 0.13 d-
PPPF60.89 ± 1.72 c9.41 ± 1.07 c30.52 ± 1.44 d-60.89 ± 1.72 d9.41 ± 1.07 bc30.52 ± 1.44 c-
Cake
Control
68.81 ± 1.14 b11.58 ± 1.54 c42.97 ± 1.13 a0.00 c77.09 ± 1.13 b2.39 ± 0.28 c29.93 ± 0.47 c0.00 d
Cake + PPPF 5%54.23 ± 2.27 d12.58 ± 1.08 c36.75 ± 0.33 bc17.18 ± 2.74 a64.20 ± 0.81 c6.81 ± 2.39 d36.54 ± 0.60 b15.27 c ± 0.26
Cake + PPPF 10%58.18 ± 3.08 c16.75 ± 1.60 b37.63 ± 0.49 b12.50 ± 1.95 b59.98 ± 0.99 d7.84 ± 1.82 bc37.14 ± 0.73 b19.42 b ± 0.18
Cake + PPPF 15%53.40 ± 2.10 d12.2 ± 2.73 c35.73 ± 1.12 c16.36 ± 2.03 a54.51 ± 1.05 e11.19 ± 0.39 b38.47 ± 0.20 a25.7 ± 0.49 a
Each value represents the mean (±SD) of three different replications. Different letters on the same column show a significant difference according to Duncan’s test at p ≤ 0.05.
Table 9. Sensory analysis of cakes prepared by replacing flour with various levels of prickly pear peel flour (PPPF).
SubstitutionAppearanceCrust ColorCrumb ColorTextureTasteOdor
Cake Control8.3 ± 0.48 c8.7 ± 0.95 a8.8 ± 0.63 a8.3 ± 0.95 a8.5 ± 0.71 c8.4 ± 1.07 a
Cake + PPPF 5%8.7 ± 0.95 b8.0 ± 0.97 c8.0 ± 1.06 c7.9 ± 1.29 b8.9 ± 1.17 b8.3 ± 1.06 a
Cake + PPPF 10%9.0 ± 0.95 a8.3 ± 0.95 b8.5 ± 0.67 b7.8 ± 2.20 b9.2 ± 1.07 a8.2 ± 0.92 a
Cake + PPPF 15%7.6 ± 0.88 d7.7 ± 0.95 d7.3 ± 0.82 d7.4 ± 2.27 c8.0 ± 0.82 d8.0 ± 0.82 a
Each value represents the mean (±SD) of ten trained panelists. The different letters on the same column show a significant difference according to Duncan’s test at p ≤ 0.05.
Disclaimer/Publisher’s Note: The statements, opinions and data contained in all publications are solely those of the individual author(s) and contributor(s) and not of MDPI and/or the editor(s). MDPI and/or the editor(s) disclaim responsibility for any injury to people or property resulting from any ideas, methods, instructions or products referred to in the content.

