Article

Effects of Trellis Systems on the Vegetative Growth and Fruit Quality of Muscat-Flavored Table Grapes

1
Institute of Forestry and Pomology, Beijing Academy of Agriculture and Forestry Sciences, Beijing 100093, China
2
Key Laboratory of Biology and Genetic Improvement of Horticultural Crops (North China), Ministry of Agriculture and Rural Affairs, Beijing 100093, China
3
Beijing Engineering Research Center for Deciduous Fruit Trees, Beijing 100093, China
*
Author to whom correspondence should be addressed.
Agronomy 2023, 13(4), 1090; https://doi.org/10.3390/agronomy13041090
Submission received: 8 February 2023 / Revised: 5 April 2023 / Accepted: 8 April 2023 / Published: 10 April 2023
(This article belongs to the Special Issue Effects of Agronomical Practices on Crop Quality and Sensory Profile)

Abstract

:
The selection of appropriate grapevine trellis systems is of great importance for regulating vine vigor, forming grape yield, improving fruit quality, and labor-saving field management in the North China Plain. The effects of two trellis systems on the viticultural characteristics and fruit quality of three table grape cultivars: RuiduHongyu (RDHY), RuiduXiangyu (RDXY), and Red Globe (RG) were investigated. The two trellis systems were: (i) T trellis, with shoots positioned horizontally and downwards; and (ii) V trellis, with shoots positioned upright with an inclined angle. Headspace-solid-phase micro-extraction combined with gas chromatography mass spectrometry (HS-SPME-GC-MS) was used to determine the compositions and contents of the monoterpenes in the fruit. The results showed that for RDHY and RG, the T trellis showed better shoot growth consistency. The sugar–acid ratios of RDHY in 2019 and RDXY in 2021 under the T trellis were significantly higher than those under the V trellis. In 2020 and 2021, RDHY showed significantly higher total anthocyanin, flavonoid, and proanthocyanidin concentrations under the T trellis. The total monoterpene content in RDHY berries was significantly higher under the T trellis. The aromatic profiles of RDHY and RDXY grapes were similar and were mainly composed of citrus, other floral, other fruit, and rose aromatic characteristics. Among them, the main aromatic characteristics varied greatly among the different treatments. In conclusion, the Eurasian table grape cultivars with muscat flavor showed a more moderate and controllable vine vigor, consistent shoot growth, better fruit quality and taste, and greater accumulation of polyphenolic compounds and monoterpenes under the T trellis system.

1. Introduction

Grapes contain hundreds of volatile aromatic substances that can be divided into terpenes, norisoprenes, methoxypyrazines, esters, and alcohols according to their functional groups. Compounds with different aromatic properties and sensory thresholds contribute to the distinctive aroma and flavor of different fruits [1,2,3,4,5]. Various classes of compounds can contribute to these types of aroma, among which terpenes (terpenoids) are the main components in muscat-flavored grapes, resulting in their strong “floral”, “sweet”, and “fruity” notes [6]. The most abundant terpenoids in grapes are monoterpenes, which mainly exist in the skin [7], and are often used as characteristic compounds for the identification of table grape and wine grape cultivars.
The main grape-producing areas in the North China Plain have a typical continental monsoon climate, with hot and rainy summers and cold and dry winters, so it is necessary to bury the grapevine in the soil to overwinter. In addition, the deep soil texture is mostly clay loam with poor water permeability, which makes viticulture challenging: vegetative growth occurs rapidly, the vigor of vine is difficult to control, the balance between vegetative growth and reproductive growth is disrupted, and a variety of diseases and insect pests occur simultaneously, leading to low production and unsatisfactory fruit quality with intensive labor and high cost. The regulation of grapevine vigor refers to the cultivation and management process of adjusting the growth potential and conditions of the vine at different stages to achieve a balance between vegetative growth and reproductive growth so that the vine can reach a stable and moderate condition [8,9]. Among them, a trellis system should be carefully selected for certain growing conditions because it is first established when starting a vineyard. Proper trellis systems are beneficial for vine growth, canopy characters, and fruit quality compositions [10,11].
The aromatic potential of grapes and wines are highly influenced by viticultural practices, such as vine training, water management, cluster thinning, and leaf removal [12]. The effect of trellis systems on grapevines is strong, which helps the viticulturist employ management techniques that improve fruit quality [13,14]. Previous studies on the growth and development of grapevines grown on different trellis systems or training systems mostly focused on the vegetative growth characteristics, fruit physicochemical indicators, phenolic compounds, and volatile aromatic compounds of wine or raisin grapes [15,16,17]. For example, Swanepoel et al. [18] conducted a study on six types of trellis systems in 2017 and found that larger trellis systems improved the budbreak rate, yield, and leaf photosynthesis of two raisin cultivars. Mota et al. [19] found that the modified Geneva double curtain improved fruit ripeness, total anthocyanin content, and total phenolic content compared to vertical shoot positioning. Nan et al. [20] evaluated two training systems: crawled cordon training and independent long-stem pruning, on the volatile composition of Ecolly wine grapes, and found that crawled cordon training improved the accumulation of aromatic compounds in the wine. However, there are few studies on the effect of different trellis systems on the comprehensive viticultural characteristics and fruit quality of muscat-flavored table grapes. In this study, two muscat-flavored table grape cultivars and a traditional cultivar with no muscat flavor, Red Globe, were used to investigate the effects of two trellis systems (T trellis and V trellis) on fruit load, vine structure, basic physicochemical indicators of fruit quality, the contents of phenolic compounds, and the compositions and contents of monoterpenes. The aim of this study was to provide a theoretical basis for the rational selection of trellis systems for Muscat-flavored table grapes under a continental monsoon climate to achieve easier control of vine vigor, the high utilization of light energy, labor-saving management, and high-quality fruits with pleasant flavor.

2. Materials and Methods

2.1. Growing Conditions

The trial was conducted in the demonstration vineyard in Machanying Town, Pinggu District, Beijing, China (40°13′ N, 117°12′ E). The test site was a typical alluvial plain, grapevine soil burial overwintering zone, with an average annual temperature of 13.7 °C, an annual rainfall of 491 mm, and a growing degree day index of 2491 (base = 10 °C). The field capacity was 25.4%, the bulk density was 1.37 g∙cm−3, the content of organic substances was 20.8 g∙kg−1, the pH was 7.6, available nitrogen was 78.3 mg∙ kg−1, available phosphorus was 89.6 mg∙kg−1, available potassium was 324.3 mg∙kg−1, and the content of soluble salts was 3.15 g∙kg−1. The meteorological data for 2019–2021 (Table S1) came from Weather Underground https://www.wunderground.com (accessed on 11 August 2022).

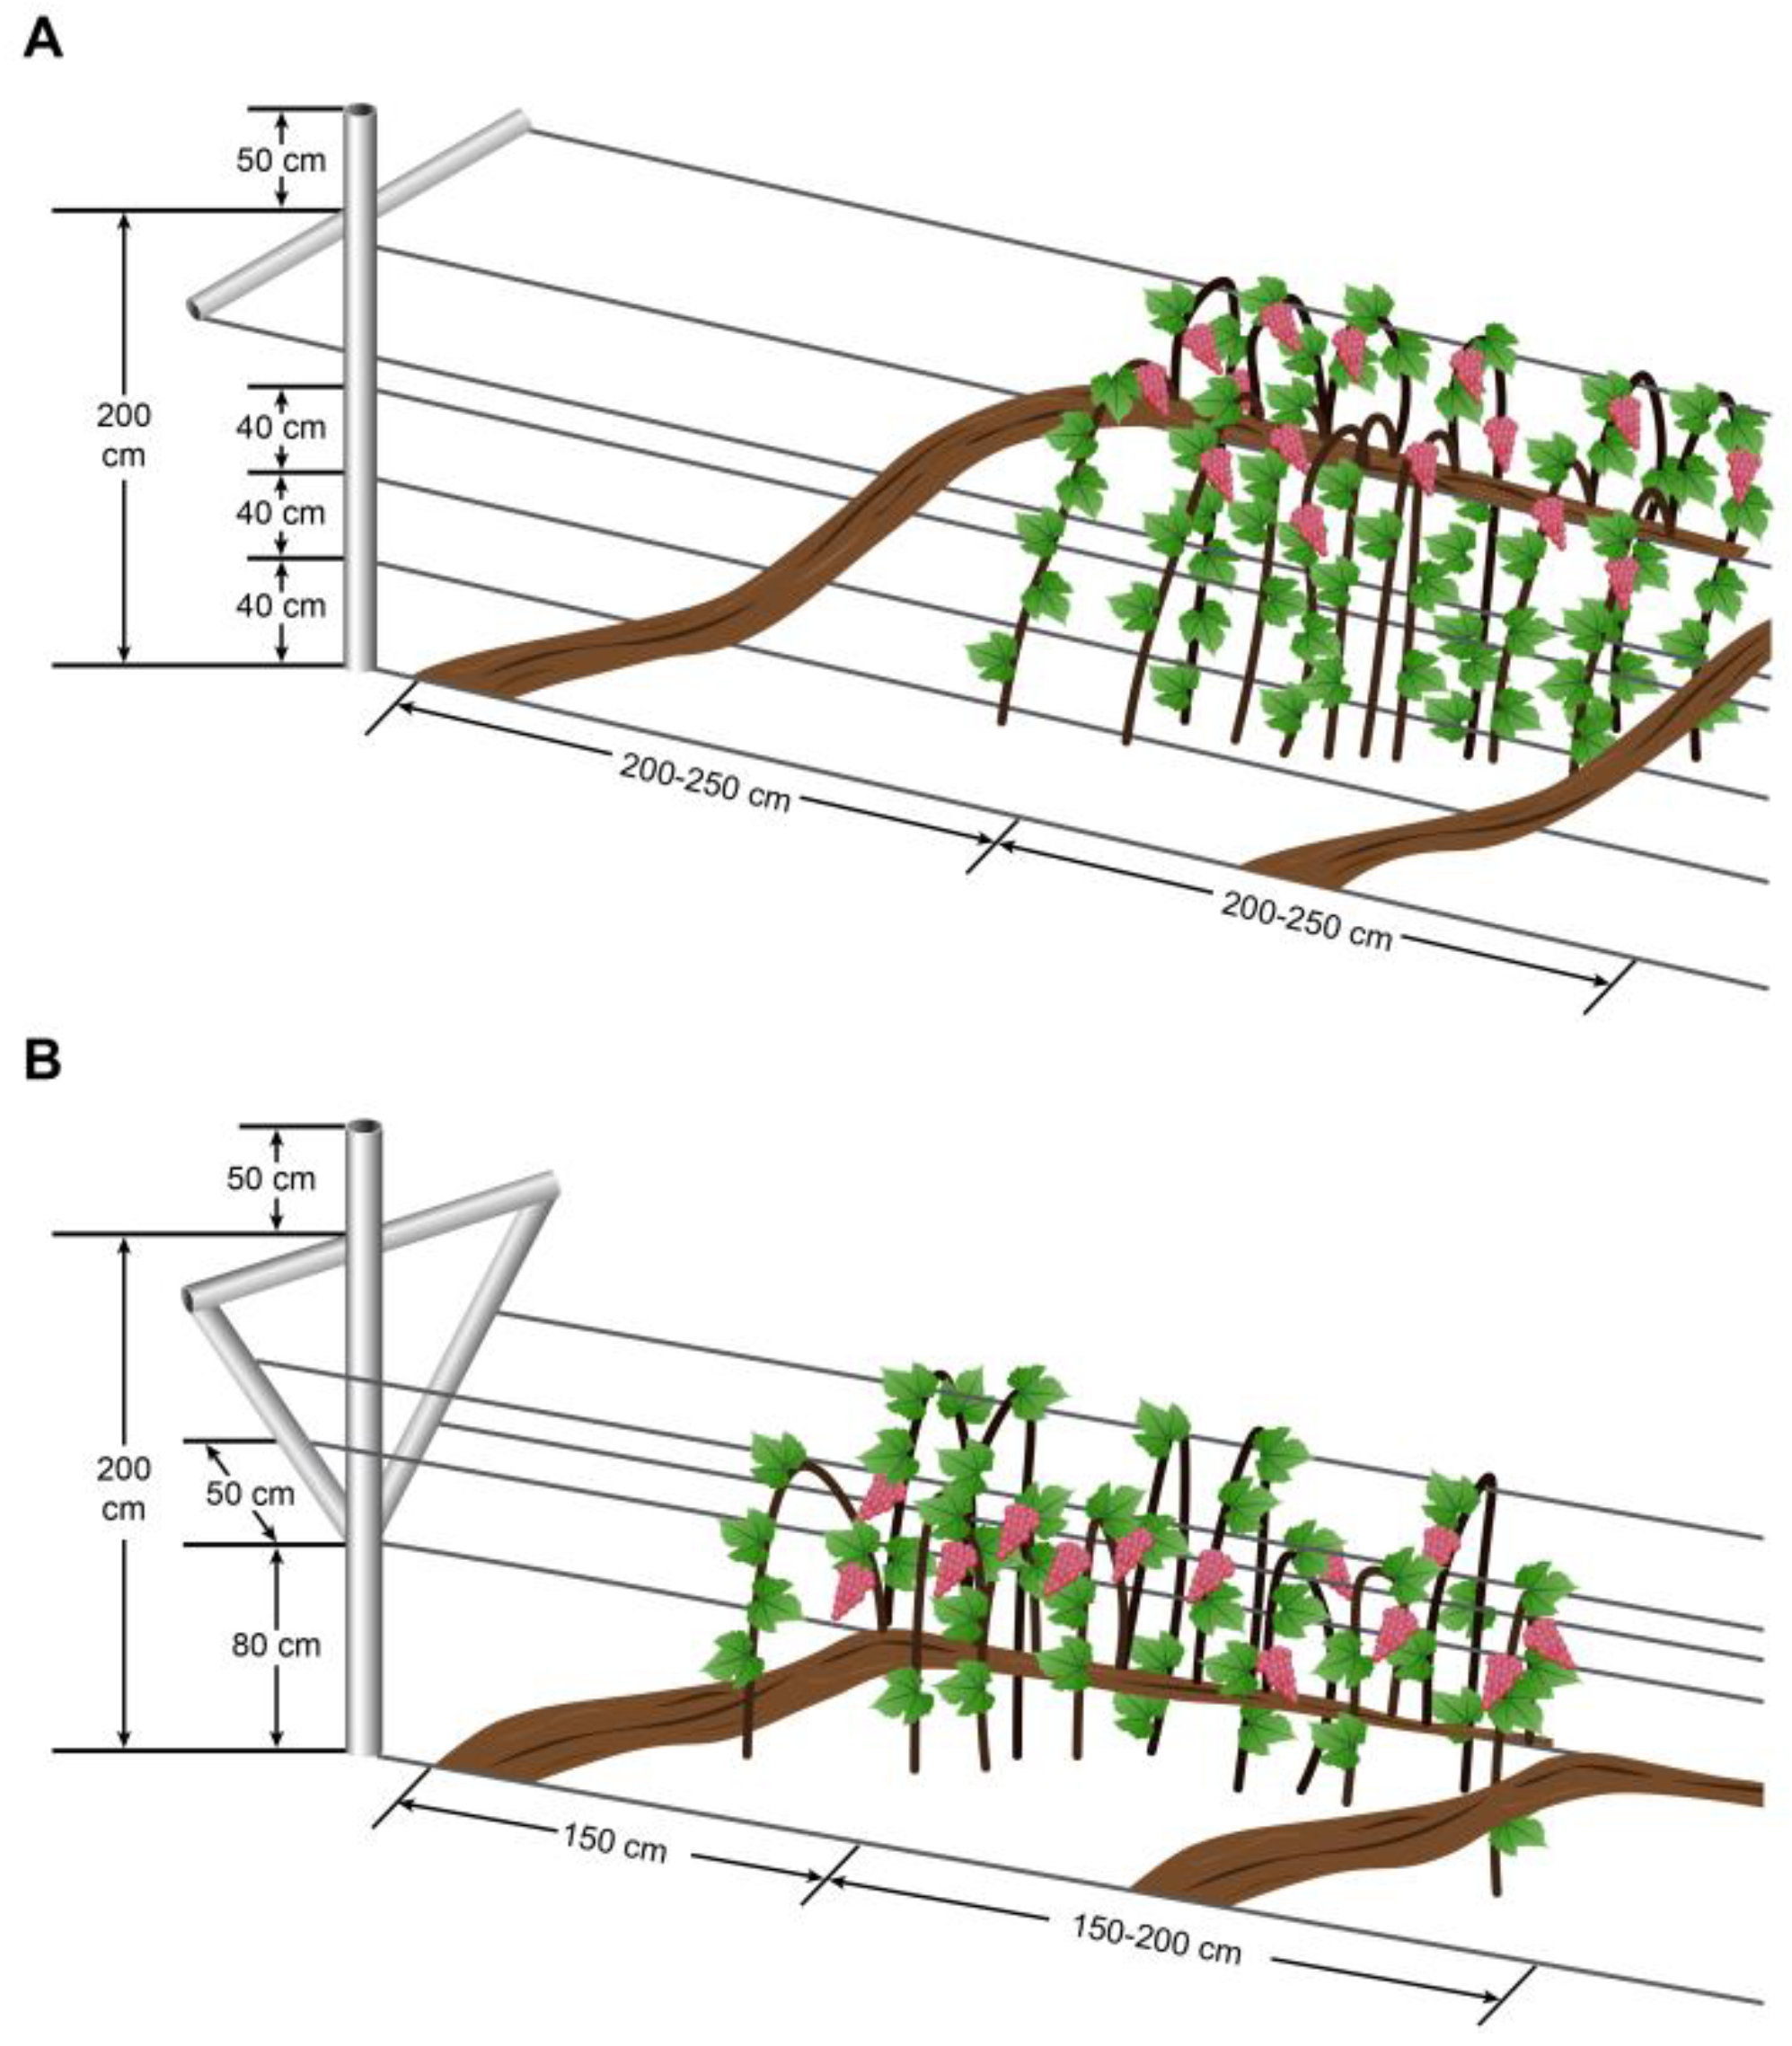
2.2. Plant Material and Experimental Design

The grape cultivars tested in this study were the Vitis vinifera L. table grapes of ‘RuiduHongyu’ (RDHY), ‘RuiduXiangyu’ (RDXY), and ‘Red Globe’ (RG). Cultivars RDHY and RDXY were released by the Institute of Forestry and Pomology of the Beijing Academy of Agriculture and Forestry Sciences. RDHY has a purple-red skin color with a strong muscat flavor. RDXY has a greenish yellow skin color with a strong muscat flavor. RG is a traditional cultivar with a very low content of monoterpenes (neutral flavor) that was used as a control. RDHY and RDXY were chosen due to their aromatic flavor of “muscat”, which is mainly given by volatile compounds such as linalool, geraniol, and rose oxide. RG was used as a control due to its low content of volatile compounds, as mentioned above. According to the content of total free monoterpenes, grape cultivars are classified as the muscat aromatic type, the non-muscat aromatic type, and the non-aromatic type [6]. RDHY and RDXY belong to the muscat aromatic type, while RG belongs to the non-aromatic type, which also called neutral flavor.
Planted in the spring of 2009, two trellis systems, T trellis (anterograde flat trellis) and V trellis (Figure 1), were applied to the three cultivars. The height and width of the T trellis surfaces were 200 cm and 150 cm, respectively; the total length and the sagging length of the shoots were approximately 160 cm and 85 cm, respectively. Three lead wires were drawn on both sides of the V trellis. The first lead wire was 80 cm from the ground, the second lead wire was 120 cm from the ground, and the distance between the lead wires on both sides was 60 cm. The third lead wire was 160 cm from the ground, and the distance between the lead wires on both sides was 120 cm. The total length and sagging length of the shoots were approximately 100 cm and 50 cm, respectively. Considering the convenience of burying the vines into the soil, the main vines were placed on the lead wires at an angle of 15–25°. The training system of the two types of trellis systems was a single horizontal cordon with a slant trunk [9,21,22]; vines were planted in the north-south direction, and the plant-row spacing was 3 m × 3 m. The shoots were tied vertically with the main vine. For auxiliary shoot topping, 2–3 leaves per node were left below the cluster, and 1–2 leaves per node were left above the cluster. The targets of disease control and pest control were mainly downy mildew, powdery mildew, thrips, leafhoppers, and mealy bugs, which were controlled by agricultural treatment and physical removal, and the chemical pesticide was applied 3–5 times per year. Rain-shelter cultivation was adopted with ridging, mulching with horticultural ground cloth, drip irrigation, and mechanical soil burial for overwintering.
This study investigated the effects of two trellis systems on the viticultural characteristics and fruit quality of three table grape cultivars, so there were six treatments in total. Three rows of grapevines (30 vines per row) within the vineyard were conducted for each treatment. Twenty vines with moderate vigor from each treatment were selected to control their yields at the same level for investigation and sampling. For RDHY and RDXY, the yields were limited to approximately 7300 kg per acre; for RG, the yields were limited to approximately 7900 kg per acre. The effects of trellis systems on fruit load and fruit physicochemical indicators were investigated from 2019–2021. Vine growth characteristics were investigated in 2019. Polyphenolic compound contents were measured from 2020–2021. Monoterpenes detection and the analysis of the aromatic profile were performed in 2021. Cultivar names are abbreviated in the figures and charts as ‘RuiduHongyu’-RDHY, ‘RuiduXiangyu’-RDXY, and ‘Red Globe’-RG.

2.3. Investigation of Vegetative Growth and Fruit Load

According to the modified E-L system of grapevine growth stages [23], certain major stages, including bud break (E-L stage 12), the beginning of flowering (E-L stage 19), veraison (E-L stage 35), and cane maturing (E-L stage 37) were observed and recorded under each treatment for three consecutive years.
A total of 5 vines were randomly selected for the same treatment, and the total number of buds, the number of broken buds, the number of bearing shoots, and the number of flower clusters per bearing shoot on the whole vine were investigated. The percentage of budbreak, percentage of bearing shoots, and the number of flower clusters per bearing shoot were calculated according to the following formulas:
percentage of budbreak (%) = the number of breaked buds/the total number of buds × 100
percentage of bearing shoots (%) = the number of bearing shoots/the number of broken buds × 100;
the number of flower clusters per bearing shoot = the number of flower clusters/the number of fruiting shoots.
In the autumn of 2019, a digital Vernier caliper was used to measure the thicknesses of the vines and the thicknesses of all shoots of five vines; the lengths of the vines were measured with a tape. The thicknesses of the vines were measured at the basal area of the trunks; the shoot thicknesses were measured at the basal shoot internodes; and the vine length was measured alongside the trunk and cordon.

2.4. Determination of Fruit Physicochemical Indices

Due to the different ripening stages of the three cultivars, fruits were considered to reach maturity when the seeds turned brown. The fruits of RDHY, RDXY and RG were sampled around late August, early September, and at the end of September, respectively. Ten clusters of each treatment were collected randomly and brought back to the laboratory to identify the basic physicochemical parameters. The cluster mass was obtained by an electronic scale JM-A20002 (Cixi Red diamond Equipment Co., Ltd., Ningbo, China). Thirty berries from each treatment were randomly selected and weighed to calculate the single berry weight. Ten grape berries were randomly selected to measure the average horizontal and vertical diameters by a digital vernier caliper (CD-15CP, Mitutoyo, Japan). The fruit shape index was the ratio of berry length to berry width. The total soluble solids (TSS) was determined by a portable refractometer PAL-1 (Atago Co., Ltd., Tokyo, Japan), and titratable acidity (TA) was determined by titration with 0.1 mol/L NaOH. The sugar-acid ratio was obtained by dividing the TSS by the TA. The remaining fruit samples were rapidly frozen in liquid nitrogen and stored in an ultralow temperature refrigerator (−80 °C).

2.5. Measurement of the Polyphenolic Compounds Contents in the Fruits

The grape fruits from 2020 and 2021 stored in the ultra-low temperature refrigerator at −80 °C were taken for examination, where 50 g was weighed for the polyphenolic compounds extraction analysis. The grape fruits were rapidly frozen in liquid nitrogen to remove impurities, such as pedicels or seeds. Next, the grape fruits were ground by an A11 stainless grinder (IKA Works, Guangzhou, China). For total anthocyanin concentration, 2 g of ground grape fruits were placed in a 10 mL centrifuge tube, and 6 mL of methanol (with 1% HCl) was added. After being shaken and incubated at 4 °C in the dark overnight, the flesh was centrifuged for 10 min (12,000 r/min) to collect the clear juice. The absorbance at 525 nm (A525) was determined, and dimethyl-delphinidin-diglucoside-chloride was used as a standard [24].
For total phenolic concentration, 2 g grounded grape fruits were added to a 50 mL centrifuge tube with 10 mL methanol (with 2% HCl). After being shaken and incubated at room temperature in the dark for 24 h, the flesh was centrifuged for 10 min to collect the clear juice. The total phenolic concentration was determined using the Folin–Ciocalteu method, and gallic acid was used as a standard [25].
For flavonoid concentration, 2 g of grounded grape fruits were added to a 50 mL centrifuge tube containing 10 mL of methanol (with 2% HCl). After being shaken and incubated at room temperature in the dark for 24 h, the flesh was centrifuged for 10 min to collect the clear juice. The absorbance at 510 nm (A510) was determined, and catechin was used as a standard [26].
For the proanthocyanidin concentration, 1 g of grounded grape fruits was weighted to a 10 mL centrifuge tube with 20 mL of 70% acetone. After being shaken and incubated at 25 °C in the dark for 24 h, the flesh was centrifuged for 15 min (8000 r/min) to collect the clear juice. The proanthocyanidin concentration was determined using the butanol-HCl method, and proanthocyanidin was used as a standard [27]. All of the spectrophotometric assays were performed by an ultraviolet and visible spectrophotometer (P330, Implen, Westlake Village, CA, USA) and repeated three times.

2.6. Detection of Monoterpenes and Qualitative and Quantitative Analysis

The grape fruits from 2021 were taken for the detection of monoterpenes. The extraction of monoterpenes followed our previously published method [28]. The free volatiles were extracted under the following headspace-solid-phase micro-extraction (HS-SPME) conditions: 5 mL of juice was mixed with 10 μL of 4-methyl-2-pentanol (internal standard) and 1 g of NaCl in a 20 mL Teflon silicone screw-top vial. The vial was equilibrated at 40 °C for 30 min, with stirring at 500 r/min. Afterward, an activated SPME tip (Supelco, Bellefonte, PA, USA) was inserted into the headspace of the vial, and the volatile components were adsorbed at 40 °C for 30 min. Additionally, the SPME tip was inserted into the GC inlet for at 250 °C for 8 min to release the volatiles. There were three replicates per treatment.
Gas chromatography and mass spectrometry (GC-MS) were performed using an Agilent 7890B GC and Agilent 5977A MS (Agilent Technologies, Santa Clara, CA, USA), respectively. The capillary column was an HP-INNOWAX (60 m × 0.25 mm × 0.25 μm, J&W Scientific, Folsom, CA, USA). The GC-MS conditions followed the method published by Wu et al. [29]: high-purity helium was used as the carrier gas (He, >99.999%) at a flow rate of 1 mL/min; the inlet temperature was 250 °C, the sample was under spitless injection, the resolution time was 8 min; and the ramp-up procedure was conducted at 50 °C for 1 min, then ramped up to 220 °C at 3 °C/min and maintained for 5 min. The mass spectrometry ionization method was electronic ionization, the ion source temperature was 230 °C, the ionization energy was 70 eV, the quadrupole temperature was 150 °C, the mass spectrometry interface temperature was 280 °C, and the mass scan range was 30–350 m/z.
The GC-MS detection conditions and the qualitative and quantitative analysis of aromatic substances were described in previous studies [30]. The mass spectra were retrieved from the NIST 11 library using full-ion scanning spectra. The retention indices were calculated based on the chromatographic retention times and the mass spectra of existing standards. The volatile compounds were identified by comparing their RIs and mass spectrum with their standards and NIST11 library. All of the monoterpene standards prepared in advance were mixed with the synthetic matrix to form the standard solution. The resultant solutions were sequentially diluted into 15 levels. The standard solutions were extracted and analyzed by the same method as the grape samples. The monoterpenes in grape berries were quantified using their corresponding external standards. The compounds were quantified by compounds with the same number of C atoms and similar structures when no standards were available (Table S2).

2.7. Analysis of the Aromatic Profile

The aroma value (OAV, odor activity value) is a conventional indicator for evaluating the contribution of volatile components in grapes and wines. It is usually obtained by dividing the concentration of a volatile component by its sensory threshold. The sensory threshold for each volatile component was obtained from references. When the compound has an OAV > 1, it is considered to play an important role in the overall aroma. The larger the OAV value is, the larger the contribution is. The OAV value was calculated for each compound in all samples, and the compounds with OAV values greater than 1 were screened and classified according to their odor characteristics. Next, the aromatic profile was simulated. The grape fruit aroma was divided into 10 categories: 1 = rose, 2 = grass, 3 = lemon, 4 = citrus, 5 = mint, 6 = mushroom, 7 = fatty, 8 = sweet, 9 = other floral, and 10 = other fruity.

2.8. Data Processing and Statistical Analysis

The data were compiled and plotted using Microsoft Excel 2007 software. For the effects of trellis systems on the fruit load, vine growth characteristics, fruit physicochemical indicators, and the content of monoterpenes, a two-way analysis of variance (AVONA) was conducted (Cultivar × Treatment). A statistical analysis of the data was performed using SigmaPlot 12.0 according to Student-Newman-Keuls multiple comparisons with the lowest significance level of p < 0.05. The contents of phenolics were plotted using GraphPad Prism 8. Cluster analysis and the least square discriminant analysis (PLS-DA) were performed using MetaboAnalyst 5.0.

3. Results

3.1. Effects of Trellis Systems on Fruit Load and Vine Growth Characteristics

After years of continuous investigation, little difference in grapevine phenology was found between the two trellis systems. The bud burst of RDHY was around 12 April, flowering began around 20 May, veraison occurred around 28 June, and cane maturing occurred around 30 July. The bud burst of RDXY was around 13 April, flowering began around 22 May, veraison occurred around 15 July, and cane maturing occurred around 8 August. The bud burst of RG occurred around 23 April, flowering began around 27 May, veraison occurred around 2 August, and cane maturing occurred around 6 August (Table S3). As seen in Table 1, for RDHY, the percentage of budbreak increased year by year from 2019 to 2021, but there was no significant difference between the two trellis systems. The percentage of bearing shoots was significantly higher under the T trellis than that under the V trellis in 2021. The number of flower clusters per bearing shoot was between 1.38 and 1.76, and there was no significant difference between the 2 trellis systems. For RDXY, the percentage of budbreak under the T trellis was significantly higher than that under the V trellis in 2019, but there was no significant difference between the two trellis systems in 2020 and 2021. The percentage of bearing shoots ranged from 73.8% to 91.8%, but there was no significant difference between the two trellis systems. Similarly, there was no significant difference in the number of flower clusters per bearing shoot between the 2 trellis systems. For RG, the percentage of budbreak was not affected by the trellis systems. In general, the percentage of bearing shoots was low, ranging from 24.7% to 43.3%, and the T trellis showed significantly higher values than the V trellis in 2021.The number of flower clusters per bearing shoot showed higher values under the T trellis than under the V trellis from 2019–2021, but the difference was not significant.
Table 2 shows that there was no significant difference in the thickness of vines of the three cultivars under the two systems. For all three cultivars, the lengths of vines grown under the T trellis were longer than those grown under the V trellis, but the differences were not significant. For RDHY, the thickness of the shoots under the V trellis was 12.2 mm, which was significantly higher than that under the T trellis, which produced an average thickness of 10.4 mm. For RDXY and RG, there was no significant difference. The maximum thickness of shoots differed greatly between the two trellis systems. For RDHY, the maximum thickness of shoots under the V trellis was 17.8 mm, which was 3 mm higher than that under the T trellis. Similarly, for RG, the maximum thickness of shoots under the V trellis was 19.2 mm, which was 2.9 mm higher than that under the T trellis. The difference between the two trellis systems in the minimum thickness of shoots was little, from 0.3 to 0.5 mm. Therefore, for RDHY and RG, the T trellis produced a smaller difference between the maximum and the minimum thickness of shoots, which showed better shoot growth consistency than that under the V trellis.

3.2. Effects of Different Trellis Systems on Fruit Physicochemical Indicators and Polyphenolic Compounds

3.2.1. Effects of Trellis Systems on Fruit Physicochemical Indicators

The cluster weights of RDHY vines grown under the T trellis were greater than those from vines grown under the V trellis for three consecutive years, but the difference was not significant (Table 3). The cluster weights of RDXY under the T trellis were significantly higher than that under the V trellis in 2019 and 2020. For RG, there was no significant difference between the two trellis systems in cluster weights. The berry weight of RDXY under the T trellis was 1.5 g higher than that under the V trellis in 2020. The berry weight of RG under the T trellis was 1.1 g higher than that under the V trellis in 2021. For other years and cultivars, the difference in berry weight between the two trellis systems did not exceed 1.0 g. The TSSs of RG in 2019 and RDXY in 2020 under the T trellis were significantly higher than those under the V trellis, but the difference was not significant for the other years or cultivars. The results for TA did not show a specific trend. RDHY had a significantly higher TA under the V trellis compared to that under the T trellis in 2019 and 2020, but the opposite result was observed in 2021. RDXY showed no significant difference in TA between the two trellis systems in 2019 and 2020, but in 2021, the V trellis showed significantly higher TA than those under the T trellis. RG showed a significantly higher TA under the T trellis than that under the V trellis in 2019 and 2021, but in 2020 there was no significant difference between the two trellis systems. The results of sugar–acid ratios were relatively consistent. The sugar–acid ratios of RDHY in 2019, 20-20 and RDXY in 2021 under the T trellis were significantly higher than those under the V trellis. Most of the other year and cultivar combinations also showed higher values under the T trellis, but the differences were not significant.

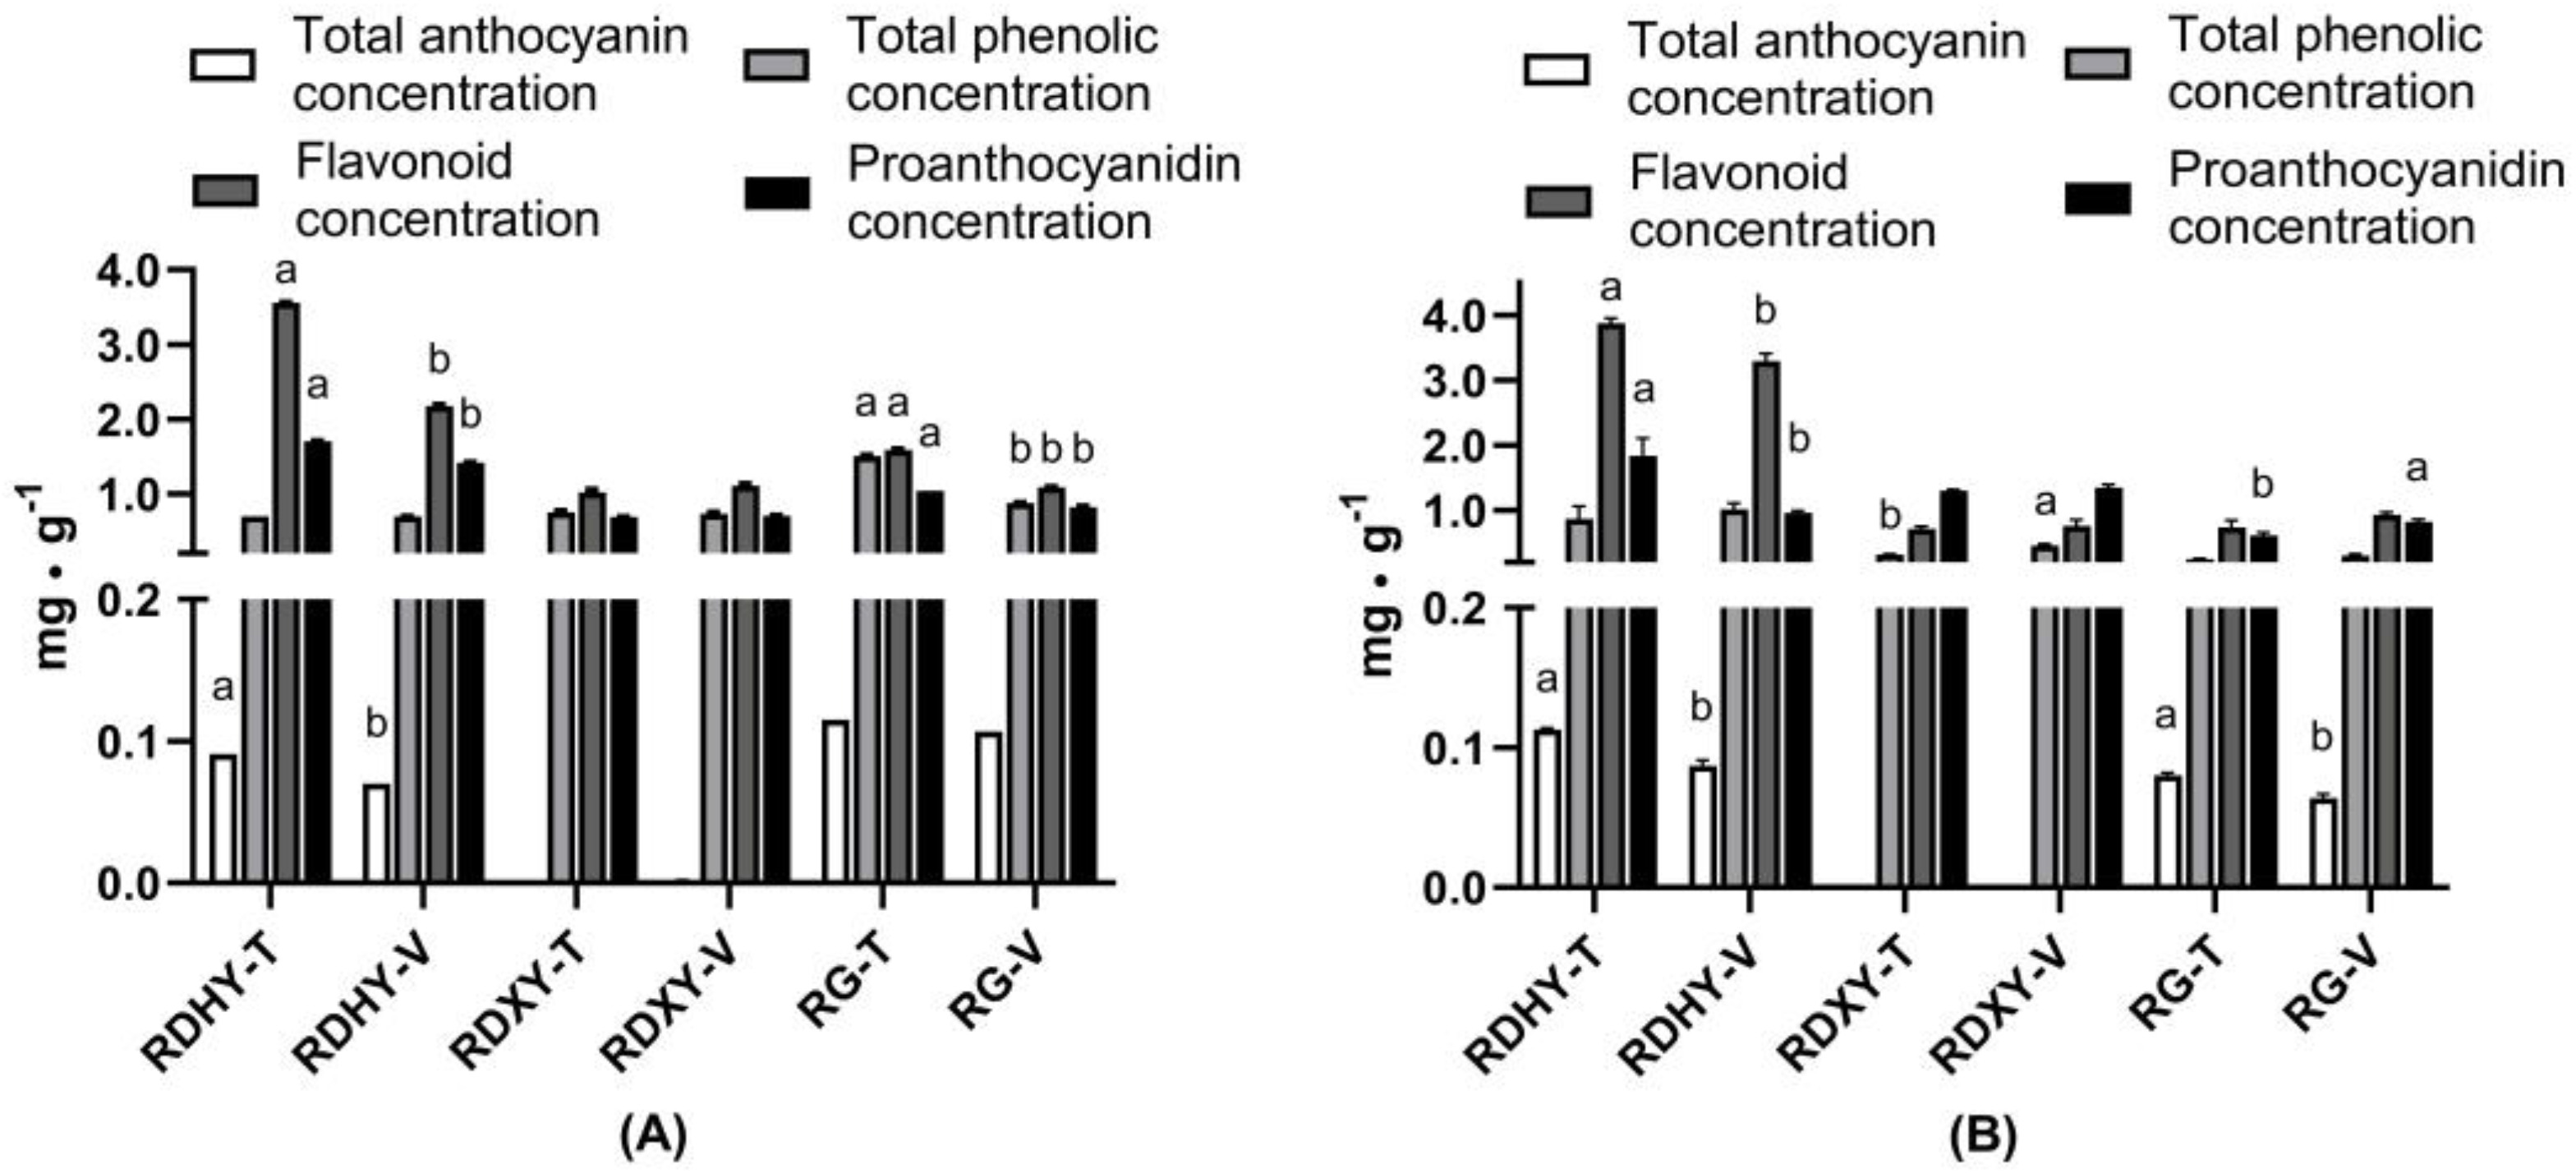
3.2.2. Effects of Trellis Systems on the Content of Polyphenolic Compounds in the Fruit

The results of polyphenol compounds (Figure 2) in 2020 showed that for RDHY, the total anthocyanin, flavonoid, and proanthocyanidin concentrations under the T trellis were significantly higher than those under the V trellis. For RDXY, there was no significant difference between the two trellis systems. For RG, the total phenolic, flavonoid and proanthocyanidin concentrations under the T trellis were significantly higher than those under the V trellis. In 2021, RDHY showed the same results as in 2020. For RDXY, the total phenolic concentration under the T trellis was significantly lower than that under the V trellis. For RG, the total anthocyanin concentration showed a significantly higher value under the T trellis, while the proanthocyanidin concentration showed the opposite result. In conclusion, for RDHY, the T trellis system increased the accumulation of the total anthocyanin, flavonoid, and proanthocyanidin significantly.

3.3. Effects of Trellis Systems on the Composition and Content of Monoterpenes in 3 Table Grape Cultivars

3.3.1. Effects of Trellis Systems on the Composition and Content of Monoterpenes

Different trellis systems significantly affected the total monoterpene content (Table S4). The total monoterpene content in RDHY berries under the T trellis (9141.69 µg∙L−1) was significantly higher than that under the V trellis (5849.10 µg∙L−1). Furthermore, for RDHY, the content of linalool (M15) under the T trellis was significantly higher than that under the V trellis (p value < 0.001). RDHY berries under the T trellis had twice the content of linalool (M15) as those under the V trellis. The total monoterpene content in RDXY berries under the T trellis (8762.09 µg∙L−1) was higher than that for RDXY berries under the V trellis (8191.52 µg∙L−1), but the difference was not significant. Similarly, the total monoterpene content in RG berries under the T trellis (2370.93 µg∙L−1) was higher than that under the V trellis (2364.72 µg∙L−1), but the difference was not significant.
The results of a hierarchical clustering analysis (Figure 3) showed that the 24 monoterpenes were mainly clustered into four categories. The first category contained phellandrene (M3), cis-furan linalool oxide (M12), geranic acid (M24), limonene (M2), and γ-terpinen (M5), which were more abundant in RDXY. The second category included hortrineol (M16), β-trans-ocimene (M4), and linalool (M15), which were more abundant in RDHY berries under the T trellis. The third class included β-myrcene (M1), allo-ocimene (M10), (E, Z)-allo-ocimene (M11), β-cis-ocimene (M6), trans-furan linalool oxide (M13), and α-terpineol (M19). This category of compounds showed a high content in RDXY berries under the V trellis and RDHY berries under the T trellis, but a low content in RDHY berries under the V trellis. The fourth category included 4-terpineol (M17), geraniol (M23), trans-rose oxide (M9), geranial (M20), β-citronellol (M21), nerol oxide (M14), cis-rose oxide (M8), terpinolen (M7), and nerol (M22). This category of compounds had similar contents in RDHY and RDXY and did not appear to be affected by the trellis system. For RG, the content of monoterpenes was at a low level.

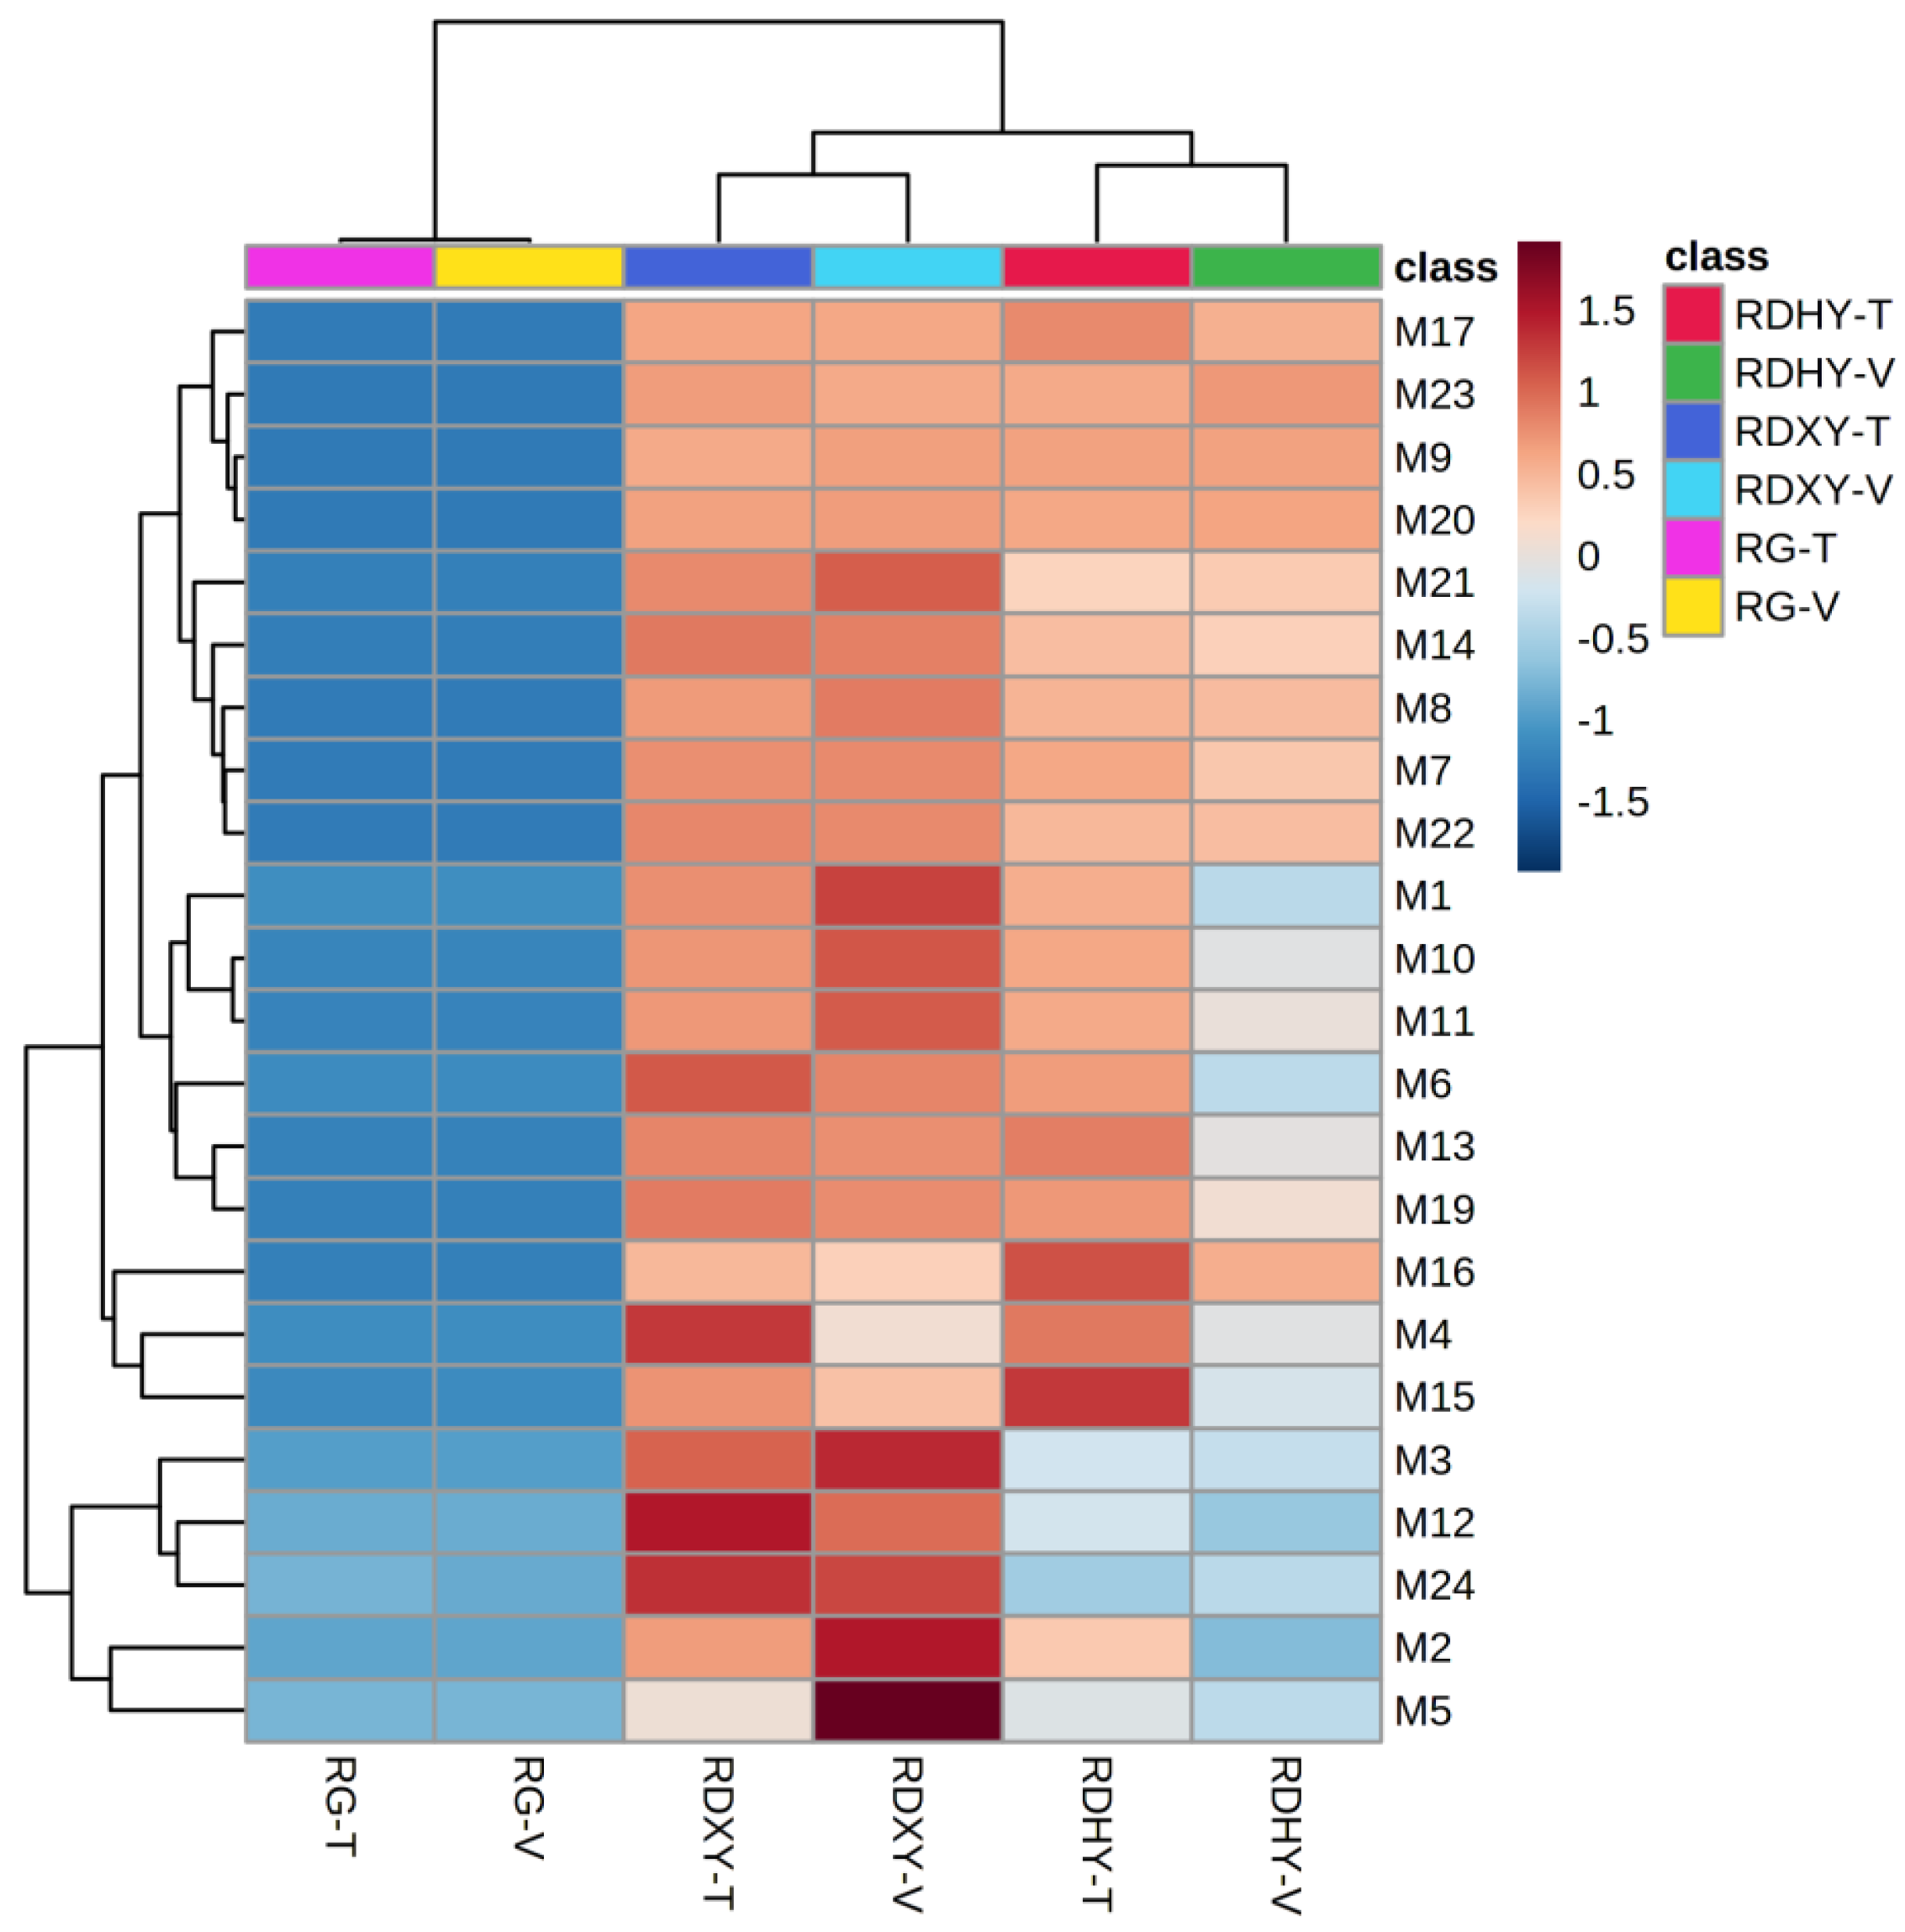
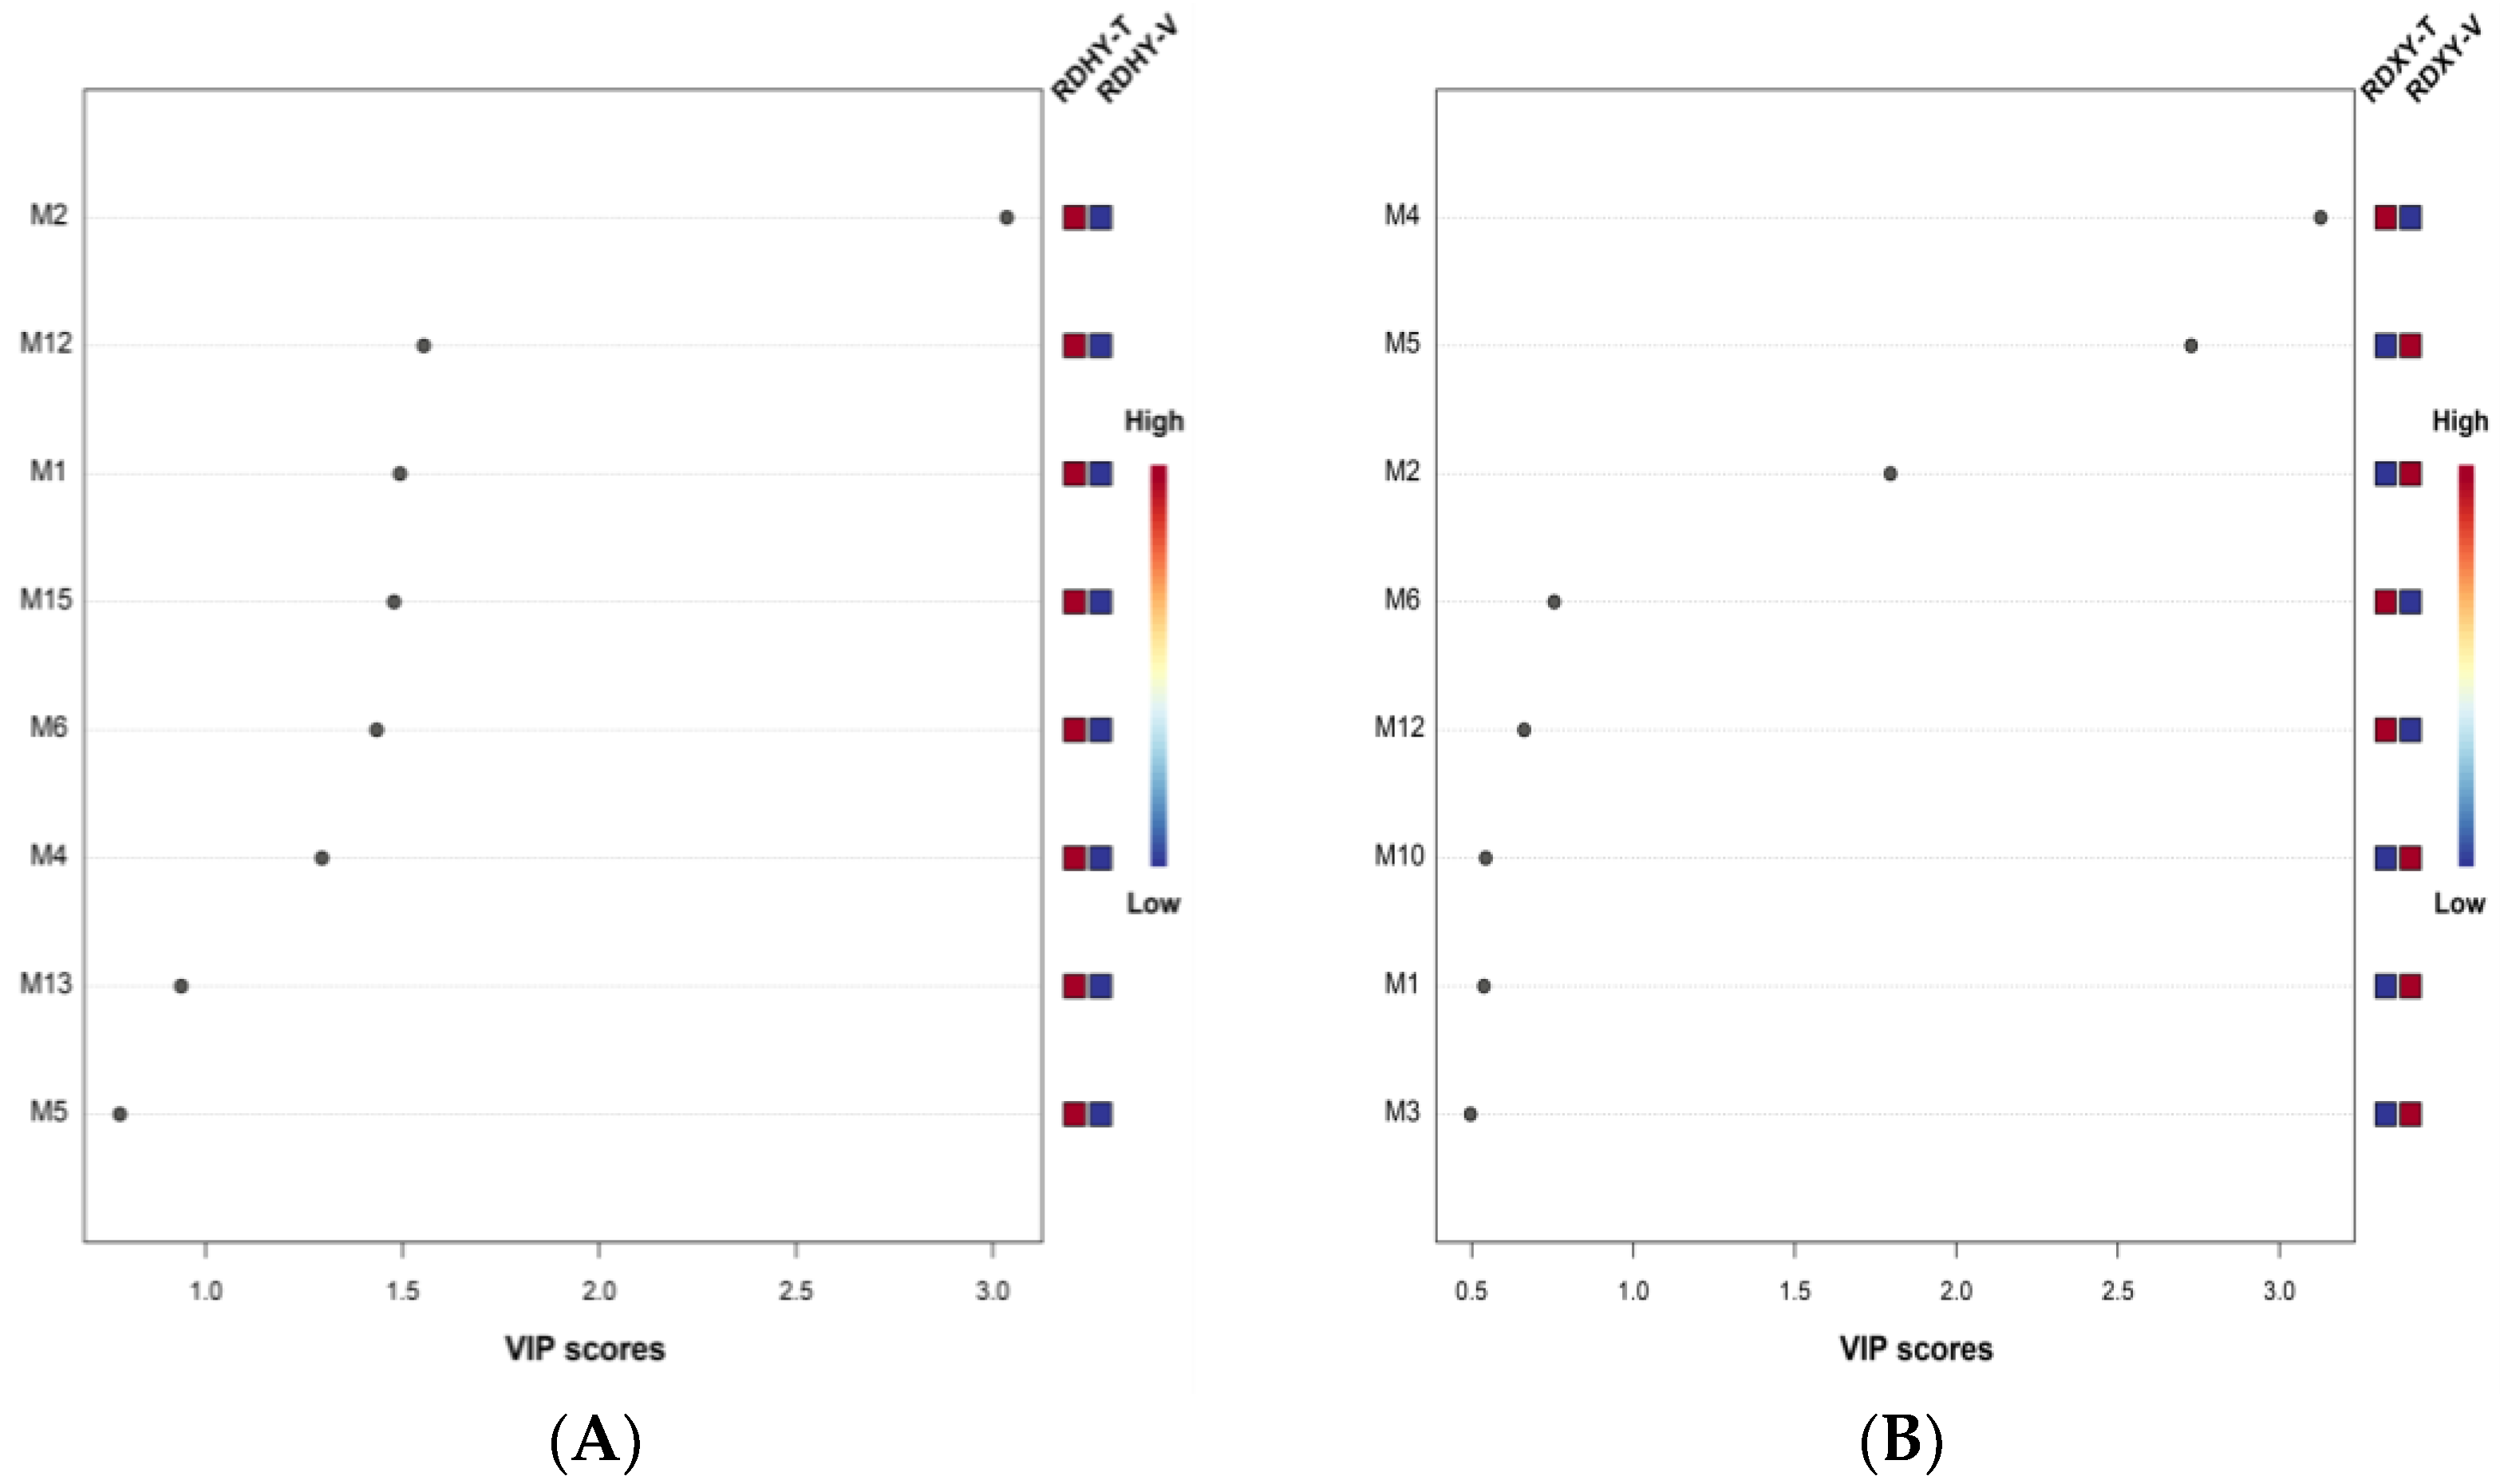
3.3.2. Multivariate Statistical Analysis of Monoterpenes

PLS-DA were performed on the content of monoterpenes. In PLS-DA, a compound with a variable importance in projection (VIP) value greater than 1.0 was considered the main contributing compound. The five compounds with the highest VIP values in RDHY were limonene (M2), cis-furan linalool oxide (M12), β-myrcene (M1), linalool (M15), and β-cis-ocimene (M6) (Figure 4A). The five compounds with the highest VIP values of RDXY were β-trans-ocimene (M4), γ-terpinen (M5), limonene (M2), β-cis-ocimene (M6), and cis-furan linalool oxide (M12) (Figure 4B). Thus, the PLS-DA showed that limonene (M2), cis-furan linalool oxide (M12), and β-cis-ocimene (M6) were the main contributing compounds for both RDHY and RDXY.

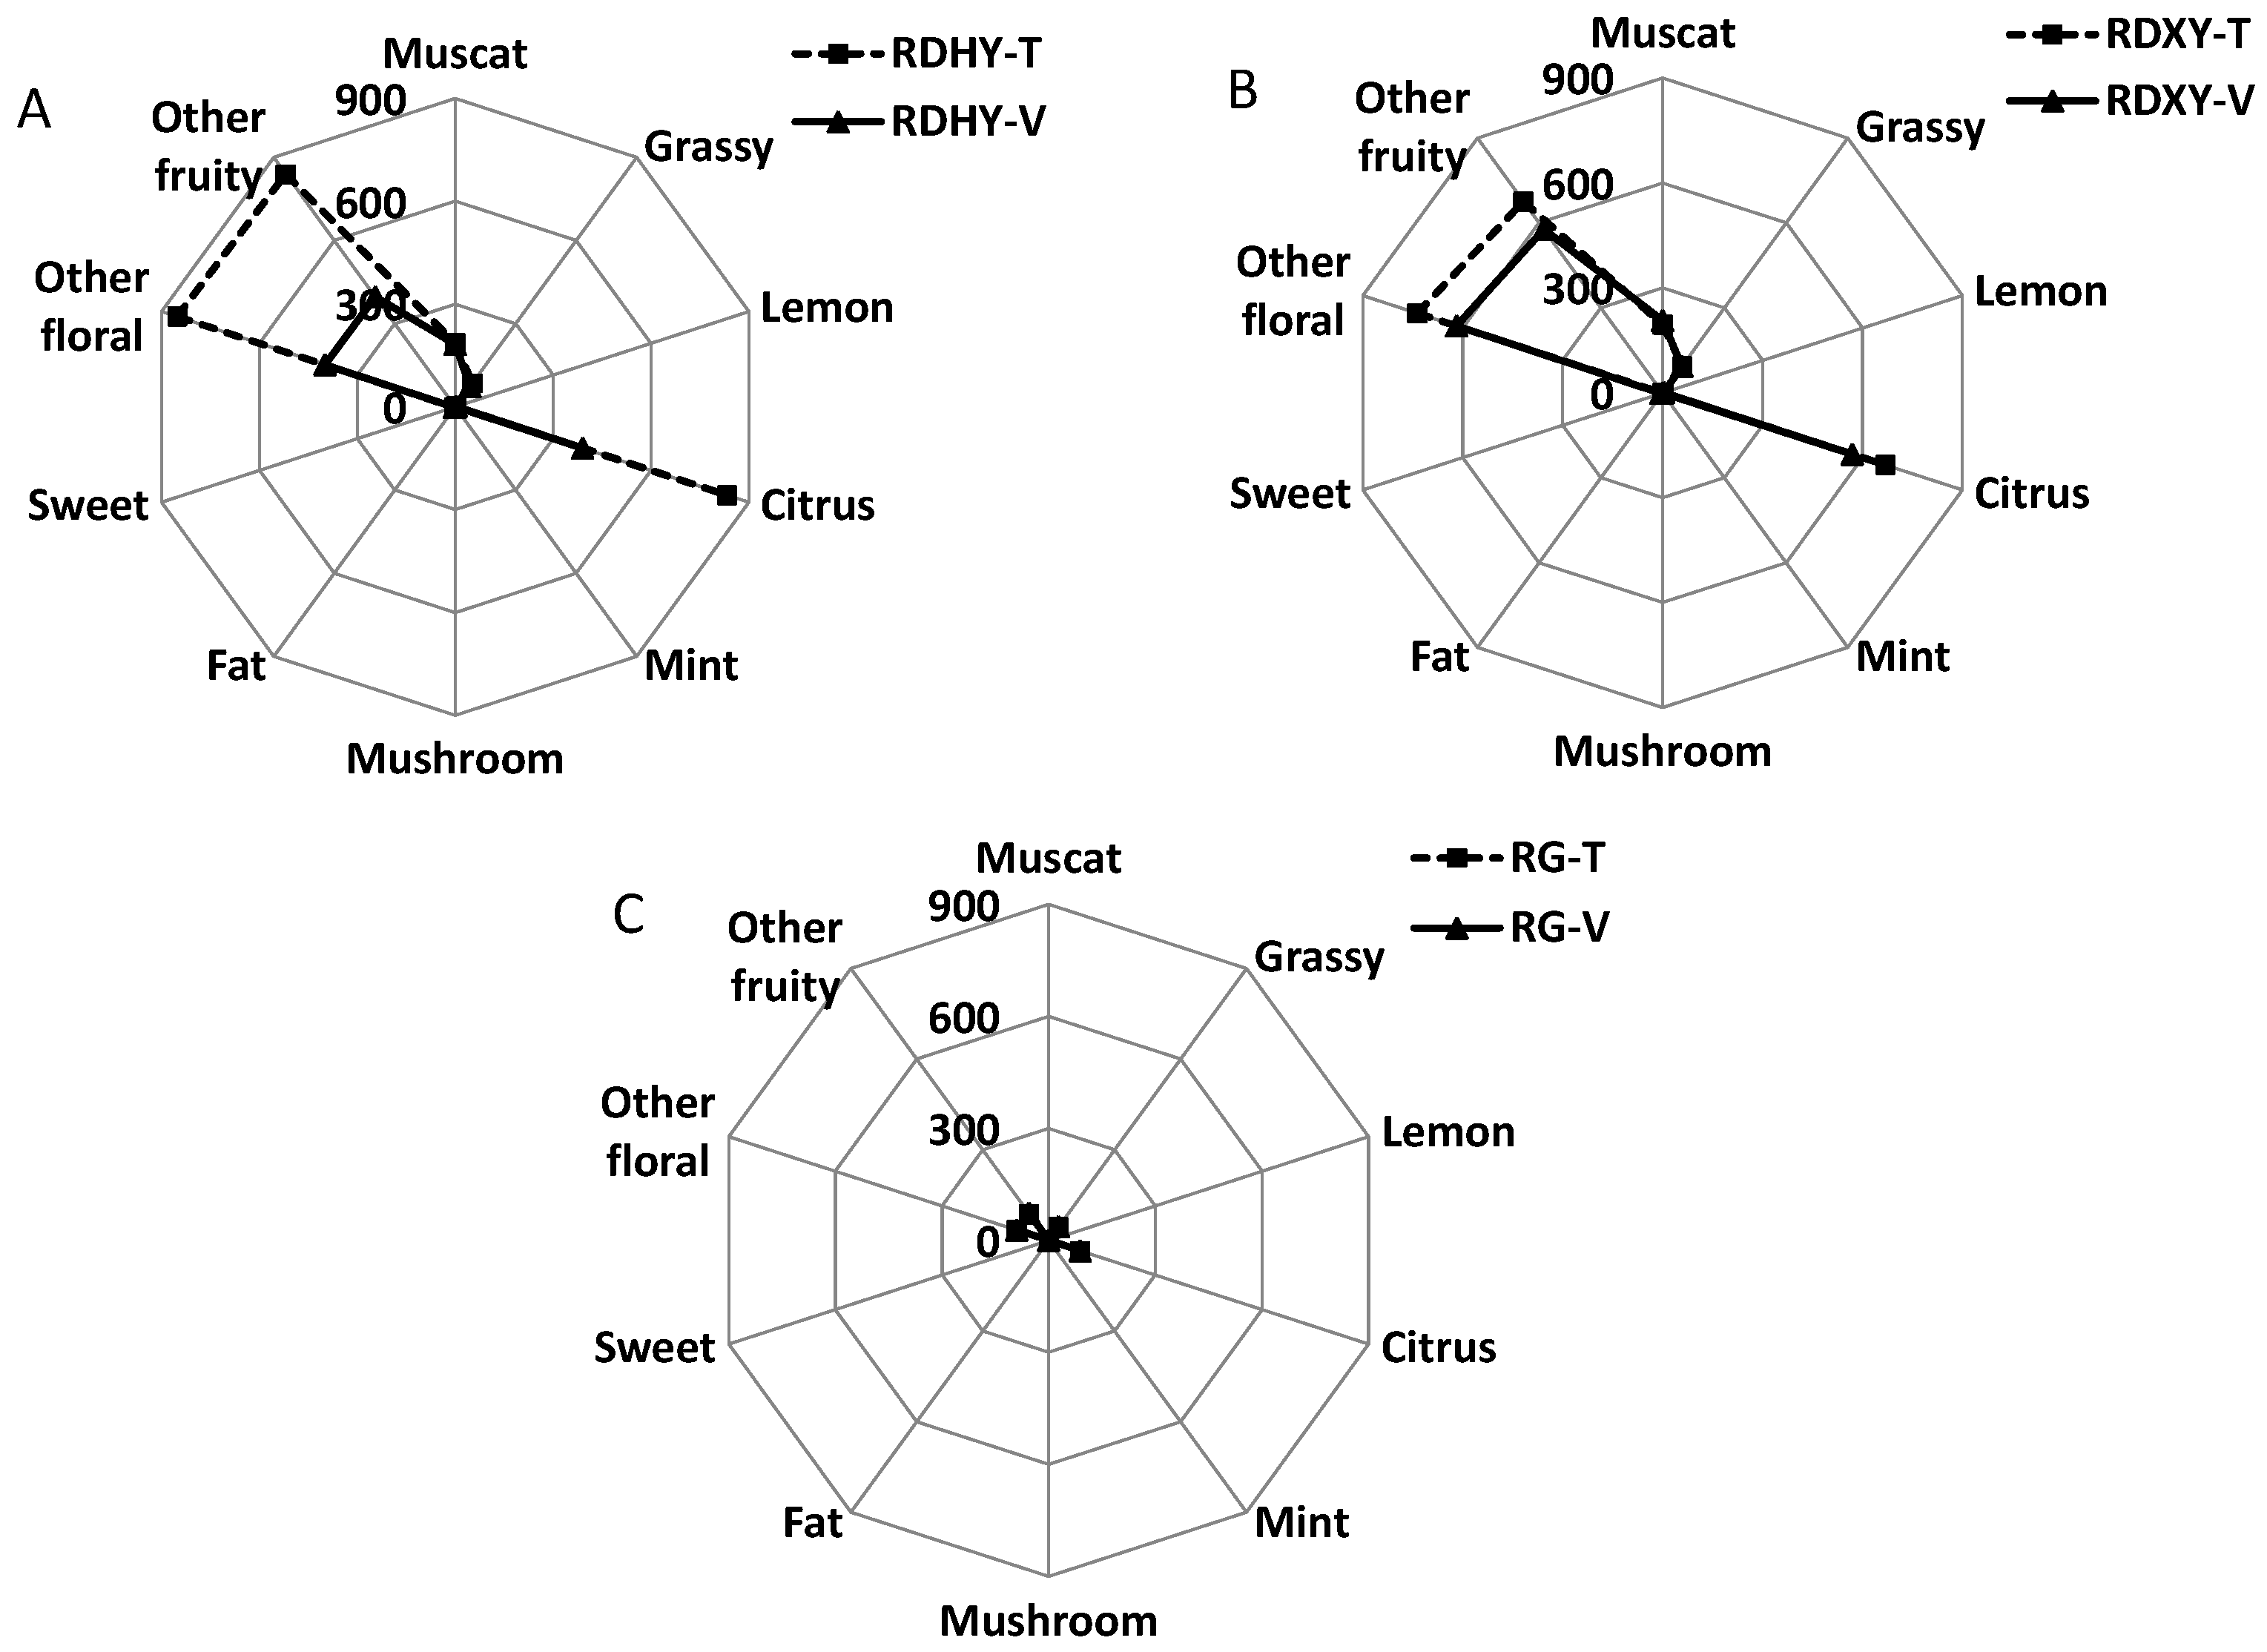
3.3.3. Evaluation of the Aromatic Profile

The sensory thresholds and aromatic descriptions of the compounds were collected from the published literature (Table 4). There were 13, 12, 14, and 14 compounds whose concentrations were greater than the threshold in RDHY-T, RDHY-V, RDXY-T, and RDXY-V, respectively (Table 4). Among them, linalool, cis-rose oxide, trans-rose oxide, and geranic acid had very high OAVs, giving the grape fruits rose, grass, citrus and other floral and fruity aromatic characteristics. The concentrations of linalool and geranic acid in RG under both trellis systems were greater than the threshold, giving these grape fruits grassy, citrus, and other floral and fruity aromatic characteristics.
The aromatic profiles of RDHY and RDXY grapes were similar and were mainly composed of citrus, other floral, other fruity, and rose aromatic characteristics (Figure 5). Among them, the aromatic characteristics of citrus, other floral, and other fruity varied greatly among the different treatments. The values from high to low were found for RDHY-T, RDXY-T, RDXY-V, and RDHY-V. There was little difference in the rose aroma between the two cultivars. In conclusion, the T trellis system increased the citrus, other floral, and other fruity notes in both muscat flavored cultivars.

4. Discussion

4.1. Effects of Trellis Systems on the Viticultural Characteristics of Three Table Grape Cultivars

The results from this 3-year study confirmed that different trellis systems affected the fruit load, shoot growth consistency, basic indicators of fruit quality, and fruit volatile compounds. The growth status of shoots, including the thickness and consistency of shoots, are intuitive and important indicators of whether the growth of the vine is moderate and stable. In this study, the polar growth characteristics of the vines grown under the T trellis were suppressed, apical dominance was weakened, and vine vigor was better regulated, so the average shoot thickness was close to 1.00 cm. For RDHY, the thickness of the shoots under the V trellis was 12.2 mm, which was significantly higher than that under the T trellis, which produced an average thickness of 10.4 mm. Furthermore, the maximum thickness of shoots under the V trellis was 17.8 mm, which was 3 mm higher than that under the T trellis. In addition, the difference between the maximum and minimum thickness of shoots under the V trellis was 2.7 mm higher than that under the T trellis, indicating that the T trellis is more conducive to the formation of a moderate and stable vine structure, which is beneficial to fruit development and uniformity [42,43]. For example, Chao et al. [44] studied Red Globe and found that the relationship between the percentage of bearing shoots and shoot thickness was extremely significant when the shoot thickness was in the range of 0.50–1.10 cm. They reported the regression equation y = 50.758ln (x) + 0.5753, with a correlation coefficient of 0.9855**. With increasing shoot thickness, the percentage of bearing shoots increased, reaching a maximum value of 93% at 1.10 cm, and then gradually decreased. However, few studies have examined the consistency of shoots among different trellising systems, which should be an important consideration in future viticultural research.

4.2. Effects of Trellis Systems on Basic Indicators of Fruit Quality

The sugar-acid ratio is highly correlated with consumer acceptability and can be used as an efficient measurement to determine consumer preference [45,46]. It indicates the balance between the sourness and sweetness of grapes, determines the taste quality of the grapes, and can be used as a basic index for evaluating taste [47,48]. In this study, the TSS of most years and cultivars was higher under the T trellis than under the V trellis. The results of TA were inconsistent, but the results of the sugar-acid ratio were consistent. Except for RDXY in 2019, all other year and cultivar combinations showed higher sugar-acid ratios under the T trellis. This is consistent with the results of Swanepoel et al. [18], who found that the fruit maturity of two raisin and table grape cultivars was better when grown under the T trellis than under vertical trellis systems (lengthened Perold and USA hedge). Similarly, Mota et al. [19] compared the vertical shoot position (VSP) and modified Geneva double curtain (GDC) on Syrah grapes. In the GDC system, the trunk height was 1.90 m aboveground, with shoots horizontally divided and trained downward. They found that the GDC system produced fruits with significantly higher total soluble solids concentrations and lower TA than VSP.
The results of this study showed that the T trellis significantly increased the total anthocyanin, flavonoid, and proanthocyanidin concentrations of RDHY for two consecutive years. These polyphenolic compounds can effectively scavenge reactive oxygen ions [49] and strengthen blood vessels. They also reduce blood pressure and blood lipids [50]. Similarly, Liu et al. [51] studied the effects of different trellis systems (pergola with a horizontal leaf curtain and hedge with an upright leaf curtain) on ‘Moldova’, and found that a pergola with a horizontal leaf curtain significantly reduced the fluctuation range of temperature and humidity and the percentage of high temperature around the fruiting zone, which resulted in improved fruit quality. The reducing sugars, total phenols, anthocyanins, and flavonoids were increased by 5.09%, 2.39%, 27.11%, and 44.89%, respectively, compared to those under the hedge with an upright leaf curtain. Previous studies on polyphenolic compounds have mostly focused on wine grapes. The commonly used trellis systems for wine grapes in the Mediterranean climate area are vertical shoot positioning, low single wire, Lyra and Geneva double curtain [11,52]. In the continental monsoon climate area of China, the commonly used trellis systems are the pergola trellis with independent long-stem vines, single guyot, and a V-shaped trellis [10,53]. At present, there are few studies on the effects of the T trellis with horizontal leaf curtains on the content of polyphenolic compounds in table grapes, but as consumers increase their requirements for the nutritional value of fruits, this would be a promising direction for future research.

4.3. Effects of Trellis Systems on Monoterpenes in Grapes

Due to the differences in the composition and content of aromatic compounds, there is a variation in the flavor of grapes [54]. Monoterpenes are important isoprene derivatives in grapes and are typical aromatic components of muscat-flavored grapes. According to the content of total free monoterpenes, grape cultivars are classified as the muscat aromatic type (total free monoterpenes greater than 6 mg∙L−1), the non-muscat aromatic type (total amount of 1–4 mg∙L−1), and the non-aromatic type (total amount less than 1 mg∙L−1) [6]. Based on this standard, RDXY T, RDXY V and RDHY T were all considered to be muscat-scented in this study. The total free monoterpene of RDHY V was 5.8 mg∙L−1, which was between the non-muscat aromatic and muscat aromatic types. Previous studies have shown that the muscat aroma of grapes is related to the presence or absence of rose oxide, and rose oxide is present in all muscat-scented grape cultivars, but not in non-muscat-scented cultivars [3]. Rose oxide was detected in RDHY and RDXY under both trellis systems in quantities much higher than their aromatic thresholds.
With regard to compound concentration, a single, strong aroma may be more important than the total group concentration [55]. Among all treatments in this study, the content of linalool was the highest, well above its aromatic threshold. It was the main aromatic component and the main substance that caused the differences in aroma across cultivars, indicating that it had the greatest contribution to the aroma of grapes. Although there was no significant difference in the total free monoterpene content between the 2 trellis systems for RDXY, the linalool content of the T trellis was significantly higher than that of the V trellis. Moreover, the linalool content of RDHY berries under the T trellis was twice that of RDHY berries under the V trellis, indicating that the T trellis significantly promoted the accumulation of linalool. Our results were evident that terpenes are positively correlated to sunlight exposure due to the upregulated genes involved in terpene metabolism [56,57], as T trellis had more canopy light interception. The research of Liu et al. from 2015 to 2016 showed that the real-time temperature fluctuation and daily average temperature under pergolas with horizontal leaf curtains were lower than those under hedges with vertical leaf curtains. Pergolas with horizontal leaf curtains had a stronger microclimate adjustment effect. This effect is particularly pronounced in hot weather. This resulted in significantly lower secondary metabolite accumulation in Moldova under hedge cultivation than under pergolas for two consecutive years [53]. It is thought that pergolas with horizontal leaf curtains can improve the quality of grapes by improving the energy distribution of photosynthesis under high temperature conditions, thus alleviating high temperature stress and reducing respiratory consumption. However, the effects of the T trellis on reducing environmental stress need to be further studied in combination with the canopy microenvironment, fruit respiration rate, and related enzyme activities (sucrose metabolic enzyme invertases and sucrose synthases) across a variety of developmental stages.

5. Conclusions

Due to the structural characteristics of the T trellis and effective vine vigor regulation, the apical dominance of grapevines grown under T trellis was inhibited, and the microenvironment around and inside the canopy was optimized. The results of this experiment showed that the Eurasian table grape cultivars grown under the T trellis system showed a more moderate and controllable vine vigor, more consistent shoot growth, better fruit quality and taste, and the greater accumulation of polyphenolic compounds and monoterpenes compared to the V trellis system.

Supplementary Materials

The following supporting information can be downloaded at: https://www.mdpi.com/article/10.3390/agronomy13041090/s1, Table S1: Weather conditions from 2019 to 2021; Table S2: Qualitative information on the analyzed monoterpene contents in grape samples; Table S3: Effects of trellis systems on the phenology of 3 cultivars from 2019 to 2021; Table S4: Effects of trellis systems on the monoterpene contents in 3 table grape cultivars (μg·L−1).

Author Contributions

Conceptualization, X.-Y.W.; methodology, G.-J.Z. and H.-L.W.; investigation, J.-C.R. and A.-L.Y.; resources, H.-Y.X.; software, Z.-H.L.; writing—original draft preparation, X.-Y.W.; writing—review and editing, G.-J.Z. and L.S.; supervision, L.S.; funding acquisition, H.-Y.X. and L.S. All authors have read and agreed to the published version of the manuscript.

Funding

This work was supported by the China Agriculture Research System of Grapes (CARS-29-01), Beijing Academy of Agriculture and Forestry Sciences Innovation Capability Construction Special Project (KJCX20210437, KJCX20230118), and The Youth Research Fund of the Beijing Academy of Forestry and Pomology Sciences (LGYJJ202001).

Institutional Review Board Statement

Not applicable.

Informed Consent Statement

Not applicable.

Data Availability Statement

The data presented in this study are available on request from the corresponding author. The data are not publicly available due to privacy.

Conflicts of Interest

The authors declare no conflict of interest.

References

  1. Gregan, S.M.; Jordan, B. Methoxypyrazine accumulation and o-methyltransferase gene expression in sauvignon blanc grapes: The role of leaf removal, light exposure, and berry development. J. Sci. Food Agric. 2016, 64, 2200–2208. [Google Scholar] [CrossRef] [PubMed]
  2. Kalua, C.M.; Boss, P.K. Evolution of volatile compounds during the development of cabernet sauvignon grapes (Vitis vinifera L.). J. Agric. Food Chem. 2009, 57, 3818–3830. [Google Scholar] [CrossRef] [PubMed]
  3. Ruiz-Garcia, L.; Hellin, P.; Flores, P.; Fenoll, J. Prediction of Muscat aroma in table grape by analysis of rose oxide. Food Chem. 2014, 154, 151–157. [Google Scholar] [CrossRef] [PubMed]
  4. Xu, X.-Q.; Cheng, G.; Duan, L.-L.; Jiang, R.; Pan, Q.-H.; Duan, C.-Q.; Wang, J. Effect of training systems on fatty acids and their derived volatiles in Cabernet Sauvignon grapes and wines of the north foot of Mt. Tianshan. Food Chem. 2015, 181, 198–206. [Google Scholar] [CrossRef] [PubMed]
  5. Zhang, P.; Fuentes, S.; Siebert, T.; Krstic, M.; Herderich, M.; Barlow, E.-W.-R.; Howell, K. Terpene evolution during the development of Vitis vinifera L. cv. Shiraz grapes. Food Chem. 2016, 204, 463–474. [Google Scholar] [CrossRef] [Green Version]
  6. Mateo, J.J.; Jiménez, M. Monoterpenes in grape juice and wines. J. Chromatogr. A 2000, 881, 557–567. [Google Scholar] [CrossRef]
  7. Wilson, B.; Strauss, C.R.; Williams, P.J. The distribution of free and glycosidically bound monoterpenes among skin, juice, and pulp fractions of some white grape varieties. Am. J. Enol. Vitic. 1986, 37, 107–111. [Google Scholar] [CrossRef]
  8. Keller, M.; Tarara, J.M.; Mills, L.J. Spring temperatures alter reproductive development in grapevines. Aust. J. Grape Wine Res. 2010, 16, 445–454. [Google Scholar] [CrossRef]
  9. Zhang, G.-J.; Wang, X.-Y.; Sun, L.; Yan, A.-L.; Wang, H.-L.; Ren, J.-C.; Xu, H.-Y. Grapevine vigor control theory and coping strategy for grape growing under mainland monsoon type climate. Sino-Overseas Grapevine Wine 2016, 3, 30–33. [Google Scholar]
  10. Li, H.; Wang, H. Chinese Wine; Northwest Agriculture and Forestry University Press: Yangling, China, 2010; pp. 26–29. [Google Scholar]
  11. Wolf, T.K.; Dry, P.R.; Iland, P.G.; Botting, D.; Dick, J.; Kennedy, U.; Ristic, R. Response of Shiraz grapevines to five different training systems in the Barossa Valley, Australia. Aust. J. Grape Wine Res. 2003, 9, 82–95. [Google Scholar] [CrossRef]
  12. Song, J.-Q.; Shellie, K.C.; Wang, H.; Qian, M.-C. Influence of deficit irrigation and kaolin particle film on grape composition and volatile compounds in Merlot grape (Vitis vinifera L.). Food Chem. 2012, 134, 841–850. [Google Scholar] [CrossRef]
  13. Naylor, A.P. The Effects of Row Orientation, Trellis, Shoot and Bunch Position on the Variability of Sauvignon Blanc Vitis vinifera L. Juice Composition. Master Thesis, Lincoln University, Lincoln, New Zealand, 2001. [Google Scholar]
  14. Reynolds, A.G.; Heuvel, J.E.V. Influence of grapevine training systems on vine growth and fruit composition: A review. Am. J. Enol. Viticult 2009, 60, 251–268. [Google Scholar] [CrossRef]
  15. Zhou, Y.-M.; Han, J.-Y.; Zhang, J.; Cheng, G.; Xie, T.-L. Effects of different trellis systems on grapevine growth and fruit quality of Vitis vinifera L. cv. Guipu No.6. South China Fruits 2018, 47, 101–103. [Google Scholar]
  16. Geng, K.-Q.; Li, D.-M.; Zhang, J.; Zhang, Y.-X.; Zhan, Z.-N.; Wang, Z.-P. Evolution of volatile aroma compounds and amino acids in Cabernet Gernischt grape berries (Vitis vinifera L.): Comparison of different training systems for mechanical soil burial. Foods 2022, 11, 1568. [Google Scholar] [CrossRef]
  17. Bernardo, N.P.; Oliveira, A.; Mota, R.V.; Camara, F.M.M.; Peregrinp, I.; Regina, M.L.; Purgatto, E. Volatile composition of sparkling wines of cv. Chardonnay cultivated under different training systems in Serra da Mantiqueira (Brazil). Foods 2022, 11, 1529. [Google Scholar] [CrossRef]
  18. Swanepoel, J.J.; Hunter, J.J.; Archer, E. The Effect of trellis systems on the performance of Vitis vinifera L. cvs. Sultanina and Chenel in the lower Orange River region. S. Afr. J. Enol. Vitic 2017, 11, 59–66. [Google Scholar]
  19. Mota, R.V.D.; Amorim, D.D.; Favero, A.C.; Purgatto, E.; Regina, M.D.A. Effect of trellising system on grape and wine composition of Syrah vines grown in the cerrado region of Minas Gerais. Food Sci. Technol. 2011, 31, 967–972. [Google Scholar] [CrossRef] [Green Version]
  20. Nan, L.; Liu, L.; Zhao, X.; Qiu, S.; Wang, H.; Li, H. Effect of alternative new pruning system and harvesting times on aroma compounds of young wines from Ecolly (Vitis vinifera) in a new grape growing region of the Weibei Plateau in China. Sci. Hortic. 2013, 162, 181–187. [Google Scholar] [CrossRef] [Green Version]
  21. He, P.-C.; Cheng, G.-L. Studies of different training systems on wine grapes. J. Fruit Sci. 1994, 11, 14–18. [Google Scholar]
  22. Li, Y.-D.; Zhang, G.-D.; Ma, J.-P. A new training system for wine grapes in soil-bury areas: Slant trunk with horizontal cordons. Sino-Overseas Grapevine Wine 2006, 6, 25–27. [Google Scholar]
  23. Coombe, B.G. Adoption of a system for identifying grapevine growth stages. Aust. J. Grape Wine Res. 1995, 1, 104–110. [Google Scholar] [CrossRef]
  24. Yang, F.-C.; Wu, J.; Cheng, J.-H.; Xu, K.; Chen, J.-W. Studies on extraction and physical-chemical properties of anthocyanin from red globe grape peel. J. Fruit Sci. 2007, 24, 287–292. [Google Scholar]
  25. Arnous, A.; Makris, D.P.; Kefalas, P. Correlation of pigment and flavanol content with antioxidant properties in selected aged regional wines from Greece. J. Food Compos. Anal. 2002, 15, 655–665. [Google Scholar] [CrossRef]
  26. Dai, H.; Qin, C.; Ding, L. Effects of salicylic acid on the contents of total flavonoids and resveratrol and related enzyme activities in ‘Cabernet Sauvignon’. J. China Agric. Univ. 2016, 21, 37–42. [Google Scholar]
  27. Ramchandani, A.G.; Chettiyar, R.S.; Pakhale, S. Evaluation of antioxidant and anti-initiating activities of crude polyphenolic extracts from seedless and seeded Indian grapes. Food Chem. 2010, 119, 298–305. [Google Scholar] [CrossRef]
  28. Wang, X.-Y.; Wang, H.-L.; Zhang, G.-J.; Yan, A.-L.; Ren, J.-C.; Liu, Z.-H.; Xu, H.-Y.; Sun, L. Effects of Fruit Bagging Treatment with Different Types of Bags on the Contents of Phenolics and Monoterpenes in Muscat-Flavored Table Grapes. Horticulturae 2022, 8, 411. [Google Scholar] [CrossRef]
  29. Wu, Y.-W.; Zhu, B.-Q.; Tu, C.; Duan, C.-Q.; Pan, Q.-H. Generation of volatile compounds in litchi wine during winemaking and short-term bottle storage. J. Agric. Food Chem. 2011, 59, 4923–4931. [Google Scholar] [CrossRef]
  30. Sun, L.; Zhu, B.-Q.; Zhang, X.-Y.; Zhang, G.-J.; Yan, A.-L.; Wang, H.-L.; Wang, X.-Y.; Xu, H.-Y. The accumulation profiles of terpene metabolites in three Muscat table grape cultivars through HS-SPME-GCMS. Sci. Data 2020, 7, 5. [Google Scholar] [CrossRef] [Green Version]
  31. Bowen, A.J.; Reynolds, A.G. Odor potency of aroma compounds in Riesling and Vidal blanc table wines and ice wines by gas chromatography-olfactometry-mass spectrometry. J. Agric. Food Chem. 2012, 60, 2874–2883. [Google Scholar] [CrossRef]
  32. Castro-Vázquez, L.; Díaz-Maroto, M.C.; Pérez-Coello, M.S. Aroma composition and new chemical markers of Spanish citrus honeys. Food Chem. 2007, 103, 601–606. [Google Scholar] [CrossRef]
  33. Fenoll, J.; Manso, A.; Hellin, P.; Ruiz, L.; Flores, P. Changes in the aromatic composition of the Vitis vinifera grape Muscat Hamburg during ripening. Food Chem. 2009, 114, 420–428. [Google Scholar] [CrossRef]
  34. Han, Z.-X.; Rana, M.M.; Liu, G.-F.; Gao, M.-J.; Li, D.-X.; Wu, F.-G.; Li, X.-B.; Wan, X.-C.; Wei, S. Data on green tea flavor determinantes as affected by cultivars and manufacturing processes. Data Brief 2017, 10, 492–498. [Google Scholar] [CrossRef]
  35. Liu, Y.; Li, Q.; Yang, W.; Sun, B.; Zhou, Y.; Zheng, Y.; Huang, M.; Yang, W. Characterization of the potent odorants in Zanthoxylum armatum DC Prodr. pericarp oil by application of gas chromatography-mass spectrometry-olfactometry and odor activity value. Food Chem. 2020, 319, e126564. [Google Scholar] [CrossRef]
  36. Noguerol-Pato, R.; Gonzalez-Barreiro, C.; Cancho-Grande, B.; Martinez, M.C.; Santiago, J.L.; Simal-Gandara, J. Floral, spicy and herbaceous active odorants in Gran Negro grapes from shoulders and tips into the cluster, and comparison with Brancellao and Mouraton varieties. Food Chem. 2012, 135, 2771–2782. [Google Scholar] [CrossRef] [Green Version]
  37. Pino, J.A.; Mesa, J. Contribution of volatile compounds to mango (Mangifera indica L.) aroma. Flavour Fragr. J. 2006, 21, 207–213. [Google Scholar] [CrossRef]
  38. Tamura, H.; Boonbumrung, S.; Yoshizawa, T.; Varanyanond, D.W. The Volatile Constituents in the Peel and Pulp of a Green Thai Mango, KhieoSawoei Cultivar (Mangifera indica L.). Food Sci. Technol. Res. 2001, 7, 72–77. [Google Scholar] [CrossRef] [Green Version]
  39. Wu, Y.; Duan, S.; Zhao, L.; Gao, Z.; Luo, M.; Song, S.; Xu, W.; Zhang, C.; Ma, C.; Wang, S. Aroma characterization based on aromatic series analysis in table grapes. Sci. Rep. 2016, 6, 31116. [Google Scholar] [CrossRef] [Green Version]
  40. Cai, J. Study on Aroma Quality Improvement for Cabernet Sauvignon Wines based on Pre-Fermentation Technology from North Slope of Tianshan Mountains. Ph.D. Thesis, China Agriculture University, Beijing, China, 2014. [Google Scholar]
  41. Cai, X.; Mai, R.-Z.; Zou, J.-J.; Zhang, H.-Y.; Zeng, X.-L.; Zheng, R.-R.; Wang, C.-Y. Analysis of aroma-active compounds in three sweet osmanthus (Osmanthus fragrans) cultivars by GC-olfactometry and GC-MS. J. Zhejiang Univ.-Sci. B 2014, 15, 638–648. [Google Scholar] [CrossRef] [Green Version]
  42. Percival, D.C.; Fisher, K.H.; Sullivan, J.-A. Use of fruit zone leaf removal with Vitis vinifera L. cv. Riesling grapevines. I. Effect on canopy structure, microclimate, bud survival, shoot density, and vine vigor. Am. J. Enol. Vitic. 1994, 45, 123–132. [Google Scholar] [CrossRef]
  43. Huang, H.-H. Application of T-trellis system and rain-shelter cultivation on ‘Kyoho’. Mod. Hortic. 2006, 5, 16–17. [Google Scholar]
  44. Chao, W.-J.; Zhang, W.; Yao, L.-Q. Effects of different pruning methods on flower initiation of red globe grape. Sino-Overseas Grapevine Wine 2009, 1, 31–33. [Google Scholar]
  45. Jayasena, V.; Cameron, I. Brix/acid ratio as a predictor of consumer acceptability of Crimson Seedless table grapes. J. Food Qual. 2008, 31, 736–750. [Google Scholar] [CrossRef]
  46. Nelson, K.E.; Schutz, H.G.; Ahmedullah, M.; Mcpherson, J. Flavour preferences of supermarket customers for ‘Thompson Seedless’ grapes. Am. J. Enol. Vitic. 1973, 24, 31–40. [Google Scholar] [CrossRef]
  47. Bai, S.-J.; Li, C.; Cai, J.-S.; Zhao, R.-H.; Chen, G. Principal factor analysis and Euclidean cluster diagram of new grape cultivars’ quality traits in Turpan area. Acta Agric.-Occident. Sin. 2016, 25, 1006–1016. [Google Scholar]
  48. Zhang, L.; Zhang, X.-Y.; Kang, Y.-L.; Ma, G.-F.; Yuan, H.-Y. The effect of soil fertility on wine grape quality. Acta Agric. Jiangxiensis 2008, 2, 226–229. [Google Scholar]
  49. Makris, D.P.; Kallithraka, S.; Kefalas, P. Flavonols in grapes, grape products and wines: Burden, profile and influential parameters. J. Food Compos. Anal. 2006, 19, 396–404. [Google Scholar] [CrossRef]
  50. Xia, L.-L.; Xu, C.-M.; Huang, K.-L.; Lu, J.; Zhang, Y.-L. Evaluation of phenolic compounds, antioxidant and antiproliferative activities of 31 grape cultivars with different genotypes. J. Food Biochem. 2019, 43, e12626. [Google Scholar] [CrossRef]
  51. Liu, X.; Guo, S.; Xiao, Q.; Du, Y.; Zhai, H. Effect of canopy micro-environment on anthocyanins of ‘Moldova’ grape. Food Sci. 2018, 39, 98–106. [Google Scholar]
  52. Palliotti, A. A new closing Y-shaped training system for grapevines. Aust. J. Grape Wine Res. 2012, 18, 57–63. [Google Scholar] [CrossRef]
  53. Shens, T.; Shan, S.-M.; Sun, Y.; Li, Y.-L.; Zhang, J.-X. The effect of Chang trellis system on photosynthetic efficiency and fruit quality of Cabernet Sauvignon. North. Hortic. 2015, 1, 27–30. [Google Scholar]
  54. Song, J.; Forney, C.F. Flavour volatile production and regulation in fruit. Can. J. Plant Sci. 2008, 88, 537–550. [Google Scholar] [CrossRef]
  55. Nykänen, L. Formation and occurrence of flavor compounds in wine and distilled alcoholic beverages. Am. J. Enol. Viticult. 1986, 37, 184–196. [Google Scholar] [CrossRef]
  56. Friedel, M.; Frotscher, J.; Nitsch, M.; Hofmann, M.; Bogs, J.; Stoll, M.; Dietrich, H. Light promotes expression of monoterpene and flavonol metabolic genes andenhances flavour of winegrape berries (Vitis vinifera L. cv. Riesling). Aust. J. Grape Wine Res. 2016, 22, 409–421. [Google Scholar] [CrossRef]
  57. Luo, J.; Brotchie, J.; Pang, M.; Marriott, P.J.; Howell, K.; Zhang, P. Freeterpene evolution during the berry maturation of five Vitis vinifera L. cultivars. Food Chem. 2019, 299, 125101. [Google Scholar] [CrossRef]
Figure 1. Sketch of the two trellis systems ((A): the T trellis system; (B): the V trellis system)).
Agronomy 13 01090 g001
Figure 2. Effects of trellis systems on berry total anthocyanin concentration, total phenolic concentration, flavonoid concentration and proanthocyanidin in three table grape cultivars. (A) Year 2020, (B) Year 2021. For a certain cultivar, different letters above bars with the same color represent significant differences between treatments (p value < 0.05). RDXY is a white grape cultivar whose total anthocyanin concentration is not applicable. Note: RDHY, ‘RuiduHongyu’; RDXY, ‘RuiduXiangyu’; RG, ‘Red Globe’; T, the T trellis system; V, the V trellis system.
Agronomy 13 01090 g002
Figure 3. Hierarchical clustering analysis of the effects of trellis systems on the monoterpene contents of 3 table grape cultivars. The color of box represents the value of monoterpene content. Each line represents a compound, and each column represents a treatment. A red box represents a higher content than the average value, and a blue box represents a lower content. Note: RDHY, ‘RuiduHongyu’; RDXY, ‘RuiduXiangyu’; RG, ‘Red Globe’; T, the T trellis system; V, the V trellis system.
Agronomy 13 01090 g003
Figure 4. Main compounds based on variable importance in projection (VIP) values of RDHY (A) and RDXY (B). Note: RDHY, ‘RuiduHongyu’; RDXY, ‘RuiduXiangyu’; RG, ‘Red Globe’; T, the T trellis system; V, the V trellis system.
Agronomy 13 01090 g004
Figure 5. The aromatic profile of monoterpenes in three table grape cultivars under two trellis systems. Note: RDHY, ‘RuiduHongyu’; RDXY, ‘RuiduXiangyu’; RG, ‘Red Globe’; T, the T trellis system; V, the V trellis system.
Agronomy 13 01090 g005
Table 1. Effects of trellis systems on the fruit load of three cultivars from 2019 to 2021. Data are the mean of three replications. A two-way analysis of variance (ANOVA) was conducted (treatment × cultivar). Within the same column and factor, different letters stand for the significant difference (p value < 0.05) according to the Student–Newman–Keuls test. Significant differences are indicated: *, p value < 0.05; ***, p value < 0.001, ns, not significant.
Percentage of Budbreak/%Percentage of Bearing Shoots/%Flower Clusters per Bearing Shoot
Year 2019
Treatment
T 59.772.41.5
V 54.568.21.34
Cultivar
RDHY 51.3 b84.4 a1.53 a
RDXY 65.9 a88.2 a1.64 a
RG 54.0 b38.3 b1.09 b
Treatment × Cultivar
RDHY
T46.8 b91.4 a1.68 a
V55.8 b77.4 a1.38 a
RDXY
T73.4 a84.7 a1.63 a
V58.5 b91.8 a1.65 a
RG
T59.0 b41.0 b1.18 b
V49.1 b35.6 b1.00 b
Significance
Treatment0.217 ns0.357 ns0.120 ns
Cultivar0.026 * <0.001 ***<0.001 ***
Treatment × Cultivar0.072 ns0.179 ns0.409ns
Year 2020
Treatment
T 66.459.21.5
V 7167.11.57
Cultivar
RDHY 64.1 b71.0 b1.72 a
RDXY 76.2 a85.2 a1.74 a
RG 65.9 b33.2 c1.15 b
Treatment × Cultivar
RDHY
T62.767.9 a1.67 a
V65.574.2 a1.76 a
RDXY
T7382.0 a1.59 a
V79.488.5 a1.90 a
RG
T63.627.9 b1.23 b
V68.238.5 b1.06 b
Significance
Treatment0.161 ns0.098 ns0.374ns
Cultivar0.016 *<0.001 ***<0.001 ***
Treatment × Cultivar0.897 ns0.904 ns0.097ns
Year 2021
Treatment
T 7967.5 a1.55
V 82.557.6 b1.5
Cultivar
RDHY 81.975.6 a1.63 b
RDXY 8078.0 a1.81 a
RG 80.334.0 b1.15 c
Treatment × Cultivar
RDHY
T7785.4 a1.69 a,b
V86.865.8 b1.56 b
RDXY
T84.273.8 a,b1.78 a
V75.782.3 a1.83 a
RG
T75.743.3 c1.19 c
V84.924.7 d1.12 c
Significance
Treatment0.797 ns0.034 *0.346ns
Cultivar0.182 ns<0.001 ***<0.001 ***
Treatment × Cultivar0.017 *0.027 *0.393ns
Note: RDHY, ‘RuiduHongyu’; RDXY, ‘RuiduXiangyu’; RG, ‘Red Globe’; T, the T trellis system; V, the V trellis system.
Table 2. Effects of trellis systems on the vine growth characteristics of the cultivars. Data are the mean of three replications. A two-way analysis of variance (ANOVA) was conducted (treatment × cultivar). Within the same column and factor, different letters stand for the significant difference (p value < 0.05) according to the Student–Newman–Keuls test. Significant differences are indicated: ***, p value < 0.001, ns, not significant.
CultivarTreatmentVine Thickness (mm)Vine Length
(mm)
Shoot Thickness (mm)Maximum Shoot Thickness (mm)Minimum Shoot Thickness (mm)Difference between Max and Min (mm)
Treatment
T 59.5596.211.2 b
V 58.8464.611.9 a
Cultivar
RDHY 61.0492.711.3
RDXY 58.5568.711.5
RG 57.9529.811.7
Treatment × Cultivar
RDHY
T61.1574.710.4 b14.84.310.5
V61.0410.712.2 a17.84.613.2
RDXY
T56.7662.711.6 a16.85.311.5
V60.2474.711.4 a16.25.011.2
RG
T60.7551.311.5 a16.37.78.6
V55.1508.312.0 a19.27.212.1
Significance
Treatment0.865 ns0.089 ns<0.001 ***
Cultivar0.819 ns0.692 ns0.246 ns
Treatment × Cultivar0.682 ns0.680 ns<0.001 ***
Note: RDHY, ‘RuiduHongyu’; RDXY, ‘RuiduXiangyu’; RG, ‘Red Globe’; T, the T trellis system; V, the V trellis system.
Table 3. Fruit physicochemical indicators of the three cultivars under two trellis systems. Data are the mean of three replications. A two-way analysis of variance (ANOVA) was conducted (treatment × cultivar). Within the same column and factor, different letters stand for a significant difference (p value < 0.05) according to the Student–Newman–Keuls test. Significant differences are indicated: *, p value < 0.05; **, p value < 0.01, ***, p value < 0.001, ns, not significant.
Cluster Weight (g)Berry Weight (g)Berry Width (cm)Berry Length (cm)Fruit Shape IndexTotal Soluble Solids (°Brix)TA (g·L−1)TSS/TA
2019
Treatment
T 632.4 17.14.93 b34.9 a
V 574.7 16.95.22 a32.9 b
Cultivar
RDHY 478.9 b 17.7 a4.56 c39.4 a
RDXY 542.9 b 16.5 b5.23 b31.5 b
RG 788.8 a 16.7 b5.44 a30.8 b
Treatment × Cultivar
RDHYT503 b6.11.962.351.217.4 a4.00 c43.1 a
V455 b5.81.972.321.1818.0 a5.11 b35.7 b
RDXYT637 a7.52.292.481.0816.2 b5.17 b30.6 c
V516 b7.12.22.341.0616.8 b5.28 b32.4 c
RGT758 a9.42.442.631.0817.7 a5.63 a31.1 c
V820 a9.72.362.481.0515.7 c5.25 b30.4 c
Significance
Treatment 0.249 ns 0.418 ns<0.001 ***0.035 *
Cultivar <0.001 *** 0.006 **<0.001 ***<0.001 ***
Treatment × Cultivar 0.144 ns <0.001 ***<0.001 ***0.003 **
2020
Treatment
T 576.4 18.9 a4.91 b39.3 a
V 526.6 17.8 b5.04 a35.9 b
Cultivar
RDHY 322.8 c 20.5 a4.88 c42.9 a
RDXY 542.9 b 17.5 b5.07 a34.8 b
RG 788.8 a 17.2 b4.98 b35.1 b
Treatment × Cultivar
RDHYT368 b6.42.052.51.2221.0 a4.70 c46.2 a
V344 b6.12.042.441.220.0 a5.05 a39.6 b
RDXYT509 a8.22.352.461.0518.3 b5.09 a36.0 b
V457 b6.72.182.351.0816.6 c5.05 a33.7 b
RGT905 a12.22.672.941.117.5 b,c4.93 b35.7 b
V906 a13.12.753.031.116.9 b,c5.03 ab34.5 b
Significance
Treatment 0.296 ns 0.025 *0.001 **0.026 *
Cultivar <0.001 *** <0.001 ***0.001 **<0.001 ***
Treatment × Cultivar 0.118 ns 0.671 ns<0.001 ***0.254ns
2021
Treatment
T 734.9 17.25.1633.9
V 722.2 16.95.1532.4
Cultivar
RDHY 395.8 c 18.3 a5.15 b36.5 a
RDXY 712.5 b 17.0 b5.56 a29.8 c
RG 1077.4 a 15.9 b4.74 c33.3 b
333Treatment × Cultivar
RDHYT422 c62.052.321.1318.4 a5.33 b36.9 a
V369 c6.22.052.41.1718.2 a4.98 c36.1 a
RDXYT752 b8.52.332.61.1217.2 a,b5.31 b32.2 a
V673 b8.52.42.61.0816.7 a,b5.80 a28.3 b
RGT1031 a11.92.52.91.1616.0 b4.83 c34.0 a
V1124 a10.82.42.61.0815.8 b4.65 d33.8 a
Significance
Treatment 0.782 ns 0.539 ns0.730 ns0.208 ns
Cultivar <0.001 *** 0.003 **<0.001 ***0.002 **
Treatment × Cultivar 0.295 ns 0.976 ns<0.001 ***0.157 ns
Note: RDHY, ‘RuiduHongyu’; RDXY, ‘RuiduXiangyu’; RG, ‘Red Globe’; T, the T trellis system; V, the V trellis system.
Table 4. OAV and aromatic descriptions of monoterpenes in three table grape cultivars under two trellis systems. (a) The threshold refers to the following literature [31,32,33,34,35,36,37,38,39]. (b) Bold results for OAV indicate that the value is greater than 1. (c) The medium is a water solution, with the aromatic categories: 1-muscat, 2-grassy, 3-lemon, 4-citrus, 5-mint, 6-mushroom, 7-fat, 8-sweet, 9-other floral, and 10-other fruity.
CodeCompoundOlfactory Threshold (µg∙L−1) aCultivarTreatment bAroma DescriptionAromatic Category cCategory No.Reference
TV
M1β-Myrcene36RDHY11.95.73Fruity flavorOther fruity flavor10[37]
RDXY13.3116.46
RG\\
M2Limonene10RDHY2.950.52Floral, grassy and citrus flavorOther floral, grassy and citrus flavor2, 4, 9[40]
RDXY3.675.4
RG\\
M3Phellandrene40RDHY0.730.65Sweet and rose flavorMuscat and sweet flavor1, 8[39]
RDXY1.691.96
RG\\
M4β-trans-Ocimene34RDHY4.002.11HerbalGrassy and sweet flavor2, 8[41]
RDXY4.742.43
RG\\
M5γ-Terpinen1000RDHY0.050.03
RDXY0.060.17
RG\\
M6β-cis-Ocimene34RDHY5.782.76Herbal, floralGrassy and other floral2, 9[41]
RDXY7.026.23
RG\\
M7Terpinolen200RDHY17.6715.77Pine oil flavorGrassy flavor2[39]
RDXY18.8719.12
RG\\
M8cis-Rose oxide0.5RDHY106.51103.59Rose flavorMuscat flavor1[33]
RDXY115.16124.71
RG\\
M9trans-Rose oxide0.5RDHY76.3976.38Rose flavorMuscat flavor1[33]
RDXY74.4076.96
RG\\
M10Allo-ocimene\RDHY\\
RDXY\\
RG\\
M11(E,Z)-Allo-ocimene\RDHY\\
RDXY\\
RG\\
M12cis-Furan linalool oxide6RDHY18.428.29FloralFloral9[41]
RDXY61.5648.68
RG\\
M13trans-Furan linalool oxide6RDHY9.185.67Citrus, greenCitrus and grassy flavor2, 4[41]
RDXY9.028.77
RG\\
M14Nerol oxide3000RDHY0.020.01
RDXY0.020.02
RG\\
M15Linalool6RDHY821.81384.69Floral, lavender, citrus and bayberry flavorOther floral, citrus and fruity flavor4, 9, 10[33]
RDXY656.72555.13
RG89.2489.54
M16hortrineol110RDHY4.073.22Floral and fruity flavorOther floral and fruity flavor9, 10[39]
RDXY3.102.81
RG\\
M174-Terpineol130RDHY0.080.07
RDXY0.070.07
RG\\
M18Neral1000RDHY00
RDXY00
RG\\
M19α-Terpineol330RDHY0.280.2
RDXY0.30.28
RG\\
M20Geranial32RDHY0.760.77
RDXY0.780.79
RG\\
M21β-Citronellol40RDHY0.540.56
RDXY0.70.78
RG\\
M22Nerol300RDHY0.130.13
RDXY0.150.15
RG\\
M23Geraniol40RDHY3.053.20Rose, geranium, peach and lemon flavorMuscat, lemon and other fruity flavor1, 3, 10[40]
RDXY3.163.05
RG\\
M24Geranic acid40RDHY46.6447.14Green flavorGrassy flavor2[36]
RDXY52.1951.79
RG45.8945.69
Note: RDHY, ‘RuiduHongyu’; RDXY, ‘RuiduXiangyu’; RG, ‘Red Globe’; T, the T trellis system; V, the V trellis system.
Disclaimer/Publisher’s Note: The statements, opinions and data contained in all publications are solely those of the individual author(s) and contributor(s) and not of MDPI and/or the editor(s). MDPI and/or the editor(s) disclaim responsibility for any injury to people or property resulting from any ideas, methods, instructions or products referred to in the content.

