Article

Pre-Harvest Application of Strigolactone (GR24) Accelerates Strawberry Ripening and Improves Fruit Quality

College of Horticulture, Sichuan Agricultural University, Chengdu 611130, China
*
Author to whom correspondence should be addressed.
These authors contributed equally to this work.
Agronomy 2023, 13(11), 2699; https://doi.org/10.3390/agronomy13112699
Submission received: 25 September 2023 / Revised: 21 October 2023 / Accepted: 25 October 2023 / Published: 27 October 2023

Abstract

:
GR24, a synthetic strigolactone analogue, plays a crucial role in a wide range of life processes. Studying the effects of the pre-harvest application of GR24 on strawberry ripening and fruit quality provides a scientific basis for the application of GR24 in horticultural crop production. GR24 solutions at concentrations of 0, 0.5, 1 and 2 µmol/L were applied to strawberries at the de-greening stage. The results showed that pre-harvest treatment with 1 µmol/L GR24 increased fruit weight and size; promoted fruit softening; increased the content of sugars, total flavonoids, total phenolics, and anthocyanins, and increased antioxidant activity. These results proved that GR24 effectively accelerated fruit ripening and improved fruit quality. In addition, to gain more insight into the biological mechanism of GR24 in fruit ripening, we conducted a combined transcriptomic and metabolomic analysis. It was found that the differences were related to sugar and flavonoid biosynthesis, particularly in the later stage of fruit ripening. qRT-PCR analysis revealed that GR24 increased gene expression activity and metabolite accumulation in the anthocyanin and sugar biosynthetic pathway, thereby promoting strawberry color and flavor.

1. Introduction

The strawberry (Fragaria × ananassa Duchesne) is one of the most important small berry crops in the world and is widely cultivated due to its high economic value and the wide range of markets available [1]. Strawberries have many uses, not only as a fresh fruit but also as a raw material for various processed foods. Consumers around the world like them because their edible fruits are rich in nutrients and have a strong flavor. However, strawberry is a typical non-climacteric fruit with short shelf-life, which severely limits the development of the strawberry industry [2].
Pre- and post-harvest treatments, such as chilling [3], modified atmosphere packaging [4], and the application of exogenous chemicals and other physical or chemical methods [5], can effectively improve the quality and extend the shelf-life of horticultural products. Currently, some studies have shown that pre-harvest treatments, post-harvest cold storage, and the use of preservatives, packaging, and other methods can, to some extent, slow down the decay of strawberry fruit and reduce post-harvest losses. For example, pre-harvest treatment of strawberry fruit with UV-C light can prolong their shelf life and improve their storage quality [6]. UV-C radiation during plant growth can also affect disease susceptibility and fruit quality before and after harvesting [7]. Pre-harvest application of methyl jasmonate (MeJA) has been shown to have a positive effect on the post-harvest quality of strawberry fruit [8]. Pre-harvest treatments with chitosan and some conventional fungicides can reduce the amount of post-harvest rot in strawberries [9]. Short-term use of CO2 can have a positive effect on the freshness and flavor of strawberries during cold storage [10]. In addition, the Nano-Ag packages can effectively keep strawberries fresh [11].
Strigolactones (SLs) are endogenous signaling factors that are found in very low concentrations in plants [12]. However, SLs play an important role in various life processes, with a wide variety of biological functions, such as inhibiting plant branching, regulating leaf senescence, regulating mycorrhizal symbiosis and root network structure, and mitigating abiotic stress damage [13]. Currently, artificially synthesized SL analogues include GR3, GR7, GR5, Nijmegen-1, and GR24, of which GR24 has the highest activity and is the most widely used [14]. Exogenous GR24 can directly or indirectly inhibit the germination and elongation of axillary buds of non-heading Chinese cabbage [15]. GR24 can also enhance the synthesis of some metabolites; for example, exogenous GR24 can enhance artemisinin production in Artemisia annua [16]. The application of GR24 to post-harvest sweet oranges may affect the physical and chemical properties, sensory quality, and antioxidant capacity of the fruits [17]. GR24 is also able to promote the ripening and coloring of grapes, induce the accumulation of anthocyanins and increase the content of soluble sugars and organic acids [18]. The application of exogenous GR24 can therefore be one of the most important means of improving and maintaining the post-harvest quality of horticultural products. At present, there are few reports on the application of GR24 in strawberries, which to some extent limits the application of GR24 in post-harvest fruit.
In the study of berry fruit biology, strawberry is one of the most widely used model species. The quality of the strawberry fruit depends mainly on characteristics such as size, shape, sugar/acid ratio, aroma, and color. The ripening of strawberry fruit is often accompanied by a change in appearance and the accumulation of a number of important compounds, such as anthocyanins, amino acids, sugars, organic acids, and ascorbic acid, which are synergistically regulated by different metabolic pathways [19]. Anthocyanins are an important component of the polyphenols in strawberries, which not only make the fruit more colorful, but also benefit human health through their antioxidant capacity [20]. Although there are numerous reports on the effects of pre-harvest exogenous treatments on strawberry quality, the molecular mechanisms by which exogenous substances affect plant secondary metabolic pathways and thus alter the biosynthesis of metabolites are not yet clear. Therefore, this study investigated the effects of pre-harvest spraying of different concentrations of GR24 on fruit color, fruit quality, and bioactive compounds in strawberry. In addition, by combining of transcriptomic and metabolomic technologies, we investigated the changes in metabolites and genes at different developmental stages of strawberry fruits treated with GR24 to gain insight into the molecular mechanisms underlying the application of exogenous GR24 on fruit quality of berry crops.

2. Materials and Methods

2.1. Plant Materials

Strawberry plants (Fragaria × ananassa cv. ‘Benihoppe’) were derived from strawberry asexual propagation in planting base (Jinggang Village, Pidu District, Chengdu, Sichuan Province, China). Bare-rooted strawberry plants are planted around mid-August every year. Strawberry plants were grown in a plastic greenhouse located in the field from September 2021 to April 2022. GR24 (Coolaber, Beijing, China) solutions of 0 (control, CK), 0.5, 1 and 2 µmol/L were sprayed on uniformly growing and fully formed strawberry de-greened stage fruits at 7-day intervals for a total of three sprays. Thirty strawberry plants were randomly selected for each treatment concentration and sprayed with GR24. Each ten strawberry plants were a biological replicate. A total of 480 fruits were harvested, including thirty fruits from each treatment, and chilled in liquid nitrogen for subsequent experiments. Each ten strawberry fruits were a biological replicate. The experiment was repeated three times.

2.2. Determination of the Strawberry Fruit Quality Attributes

Fruit color was measured using a chromameter (NR1103, Shenzhen Sanenchi technology Co., Ltd., Shenzhen, China). The color was recorded and taken as an average as the levels of L*, a*, and b*. A caliper gauge was used to measure the vertical and horizontal diameters of the fruit (the widest and longest parts of the fruit), and an electronic scale was use to weigh and record each fruit separately. A digital display firmness tester (FR-5105, LUTRON, Beijing, China) was used to measure fruit firmness. Each experiment was repeated three times.
The total titratable acid (TA) was determined as a percentage of the citric acid content by titration with 0.1 M NaOH. The total soluble solids (TSS) were measured using a digital sugar tester (PAL-1, ATAGO, Tokyo, Japan). The Folin-Ciocalteu colorimetric method was utilized to determine the total phenolic content [21], while the aluminum chloride colorimetric method was employed to determine the total flavonoid content [22]. The Ferric-reducing antioxidant power (FRAP) was utilized to determine the antioxidant power [3]. Proanthocyanidins (catechins) and anthocyanins (pelargonidin-3-glucoside and cyanidin-3-glucoside) were determined by high-performance liquid chromatography (HPLC) [23]. Each experiment was repeated three times.

2.3. RNA Extraction, Library Construction, Sequencing, and Data Assembly

Total RNA was extracted from the fruits using the Plant Total RNA Isolation Kit (Huayueyang Biotechnology Co., Beijing, China) following the manufacturer’s instructions. To accurately determine RNA integrity and concentration, RNA samples were subjected to rigorous quality control using the Agilent 2100 Bioanalyzer. Oligo (dT) magnetic beads were used for the enrichment of polyadenylated mRNA, which was then subjected to random fragmentation using a fragmentation buffer. First strand cDNA was synthesized using mRNA as a template, and dNTPs were used as raw materials to synthesize second-strand cDNA. A cDNA library was constructed using PCR amplification of 250–350 bp fragments. The size of the library insert was then determined using the Agilent 2100 bioanalyzer. Transcriptome sequencing was performed using the Illumina HiSeq platform at Beijing Novogene Science and Technology Co., Ltd. (Beijing, China).
After removing the reads containing adapters and unknown nucleotides, the raw reads were aligned to the specified reference genome to obtain mapped data. FeatureCounts (version 1.5.0-p3) was used to calculate the transcript abundance (FPKM, fragments per kilobase of transcript per million mapped reads) for each gene. Differentially expressed genes (DEGs) between the two comparison groups were analyzed using DESeq2. In order to control for false discovery rates, the p-values were adjusted using the FDR control procedure of Benjamini and Hochberg. DEGs were filtered with padj ≤ 0.05 and |log2FoldChange| ≥ 1 as thresholds for differential analysis using DESeq2.

2.4. Metabolite Extraction, Detection, and Data Analysis

One hundred micrograms of samples were separately added to 1 mL of extraction solution (methanol: acetonitrile = 1:1), sonicated for 10 min and then allowed to stand for 1 h. The sample was then centrifuged at 15,000× g for 20 min and 500 µL of the supernatant was collected and dried under vacuum. A 160 μL extraction solution (acetonitrile to water volume ratio = 1:1) was added to the dried compounds to resuspend them, and the supernatant was collected after centrifugation. A quality control (QC) sample was formed by extracting 10 µL from each sample to check the experimental reproducibility on the machine.
The liquid chromatography tandem mass spectrometry system used consists of a Waters Acquity ultra-high performance liquid chromatography system coupled to a Waters Xevo G2-XS quadrupole time-of-flight mass spectrometer (Milford, MA, USA). The chromatographic elution program was as follows: 0–0.25 min, 98% A and 2% B; 0.25–10.00 min, 2% A and 98% B; 10.00–13.00 min, 2% A and 98% B; 13.00–13.10 min, 98% A and 2% B; 13.10–15.00 min, 98% A and 2% B. The mass spectrometer was operated in MS-E mode under the control of MassLynx V4.2 software (Waters) for first and second level mass spectrometry data acquisition. Raw data files (.raw) obtained from mass spectrometry detections were imported into Compound Discoverer 3.1 (CD 3.1) software for data pre-processing. The mzCloud (https://www.mzcloud.org/, accessed on 1 March 2023), mzVault, and Masslist databases were then used to match and identify molecular feature peaks and normalize quantitative results, resulting in the identification and quantification of data.
The data were logarithmically transformed and standardized using MetaX software (v.2.1.0). Principal component analysis (PCA) and partial least squares discriminant analysis (PLS-DA) were used to reduce dimensions and perform regression analysis on the collected data. The parameters VIP (Variable Importance in the Projection), fold change (FC) and p-value were used to screen for differential metabolites based on the following criteria: FC > 1.0, p-value < 0.05 and VIP > 1.0. Each treatment was repeated six times.

2.5. Gene Expression Validation

qRT-PCR was performed using the Bio-Rad Real-Time PCR System, and results were quantified using Bio-Rad CFX Manager. The unique primers were designed using the Primer Premier 6.0 software on the basis of the genome and transcriptome sequences of the strawberry, and the primer sequences were listed in Table S1. ACTIN gene was used as the internal reference gene, and the relative expression levels of the genes were calculated using the 2−ΔΔCt method [24]. Each experiment was repeated three times.

2.6. Data Processing and Analysis

SPSS software was used for statistical analysis and processing, and data analysis was performed using analysis of variance (ANOVA). The Duncan multiple range test was used for post-hoc comparisons, and p < 0.05 was considered statistically significant.

3. Results

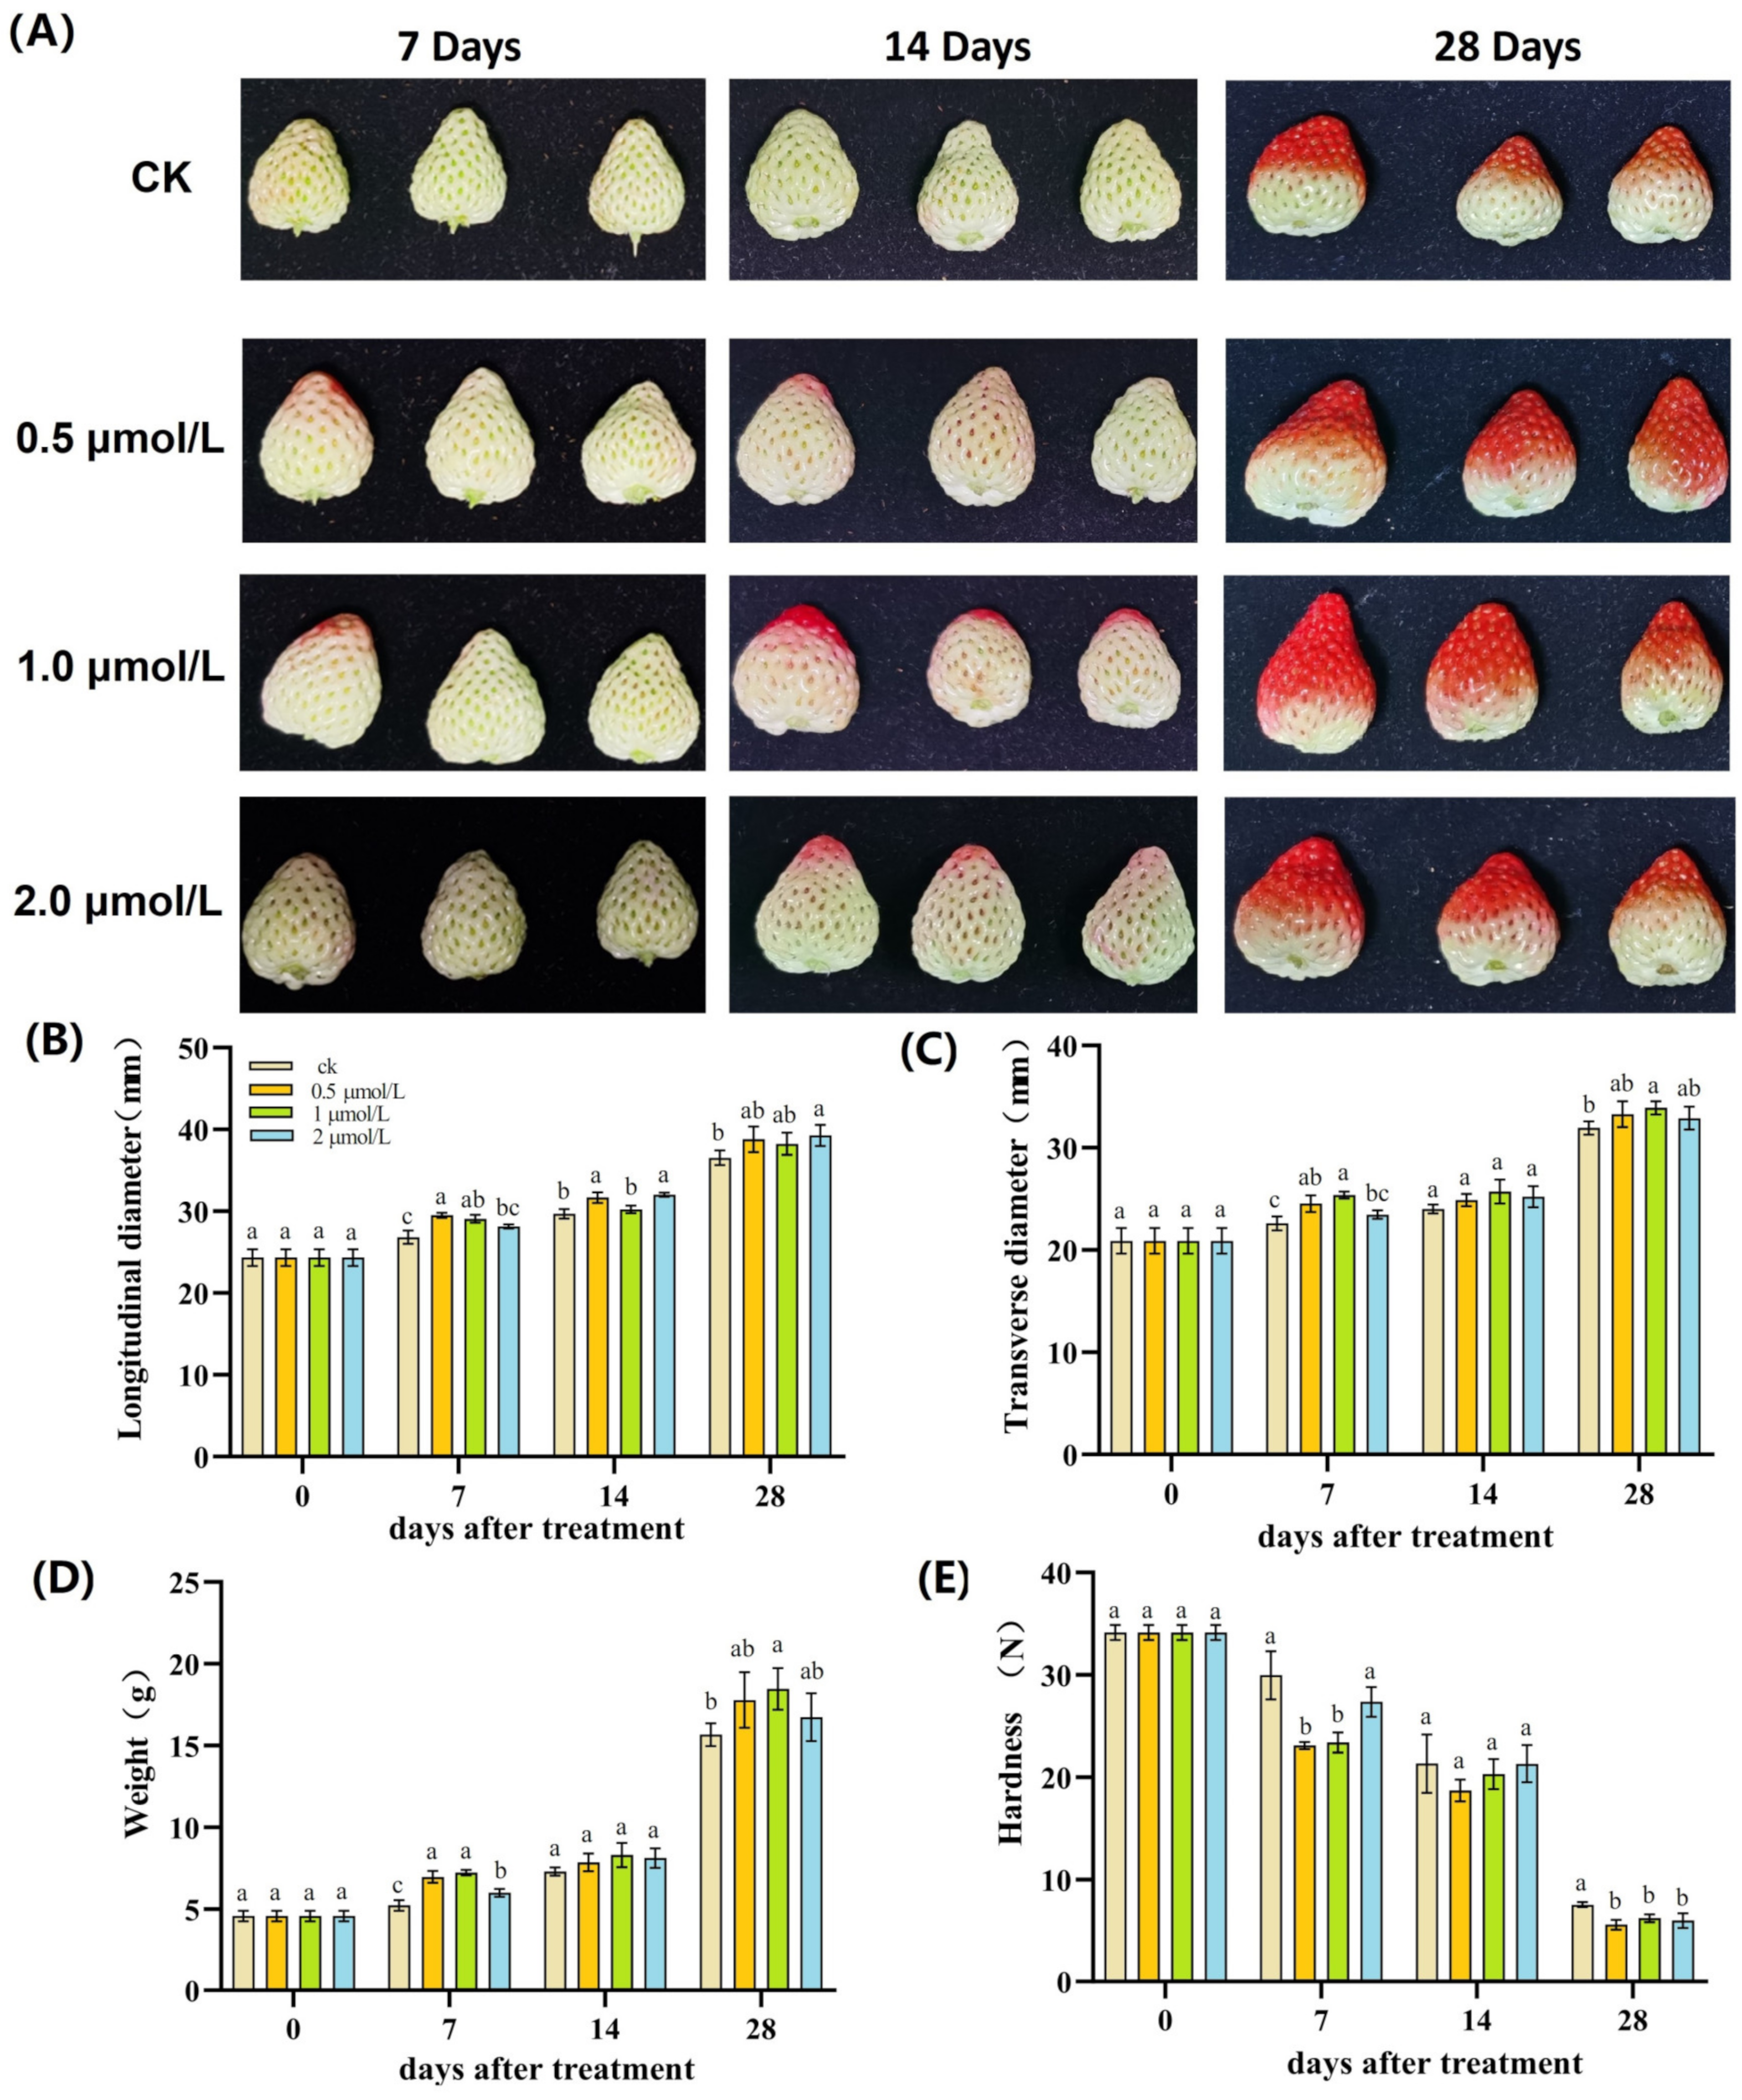
3.1. Effects of Pre-Harvest GR24 Treatment on Appearance Characteristics of Strawberry Fruit

There were differences in the phenotype of the strawberry fruit after treatment with different concentrations of GR24 (Table 1 and Figure 1A). As shown in Table 1, the alterations of L* across three GR24 concentration treatments were not significant compared to the CK throughout the developmental stages of the fruit. The a* value of the fruit color is negative from 0 to 14 days, indicating a higher proportion of green color than red color in the fruit. However, at day 28, the strawberry fruit treated with exogenous GR24 displayed a higher degree of redness compared to the CK. Furthermore, the b* value, was significantly higher in the CK group compared to the 2 µmol/L GR24 treatment group at day 14. This indicates that exogenous GR24 has a positive promoting effect on the accumulation of redness in strawberry fruits.
After GR24 treatment, both the longitudinal and transversal diameters of the fruit showed an increasing trend (Figure 1B,C), especially the longitudinal diameter increased significantly with 2 μmol/L GR24 treatment and the transversal diameter increased significantly with 1 μmol/L of GR24 treatment. In terms of fruit weight (Figure 1D), after 28 days of treatment, the weight of strawberry fruit significantly increased with 1.0 μmol/L GR24. Fruit firmness showed a decreasing trend during fruit growth, and fruit firmness in the GR24-treated groups were lower than that in the CK group (Figure 1E).

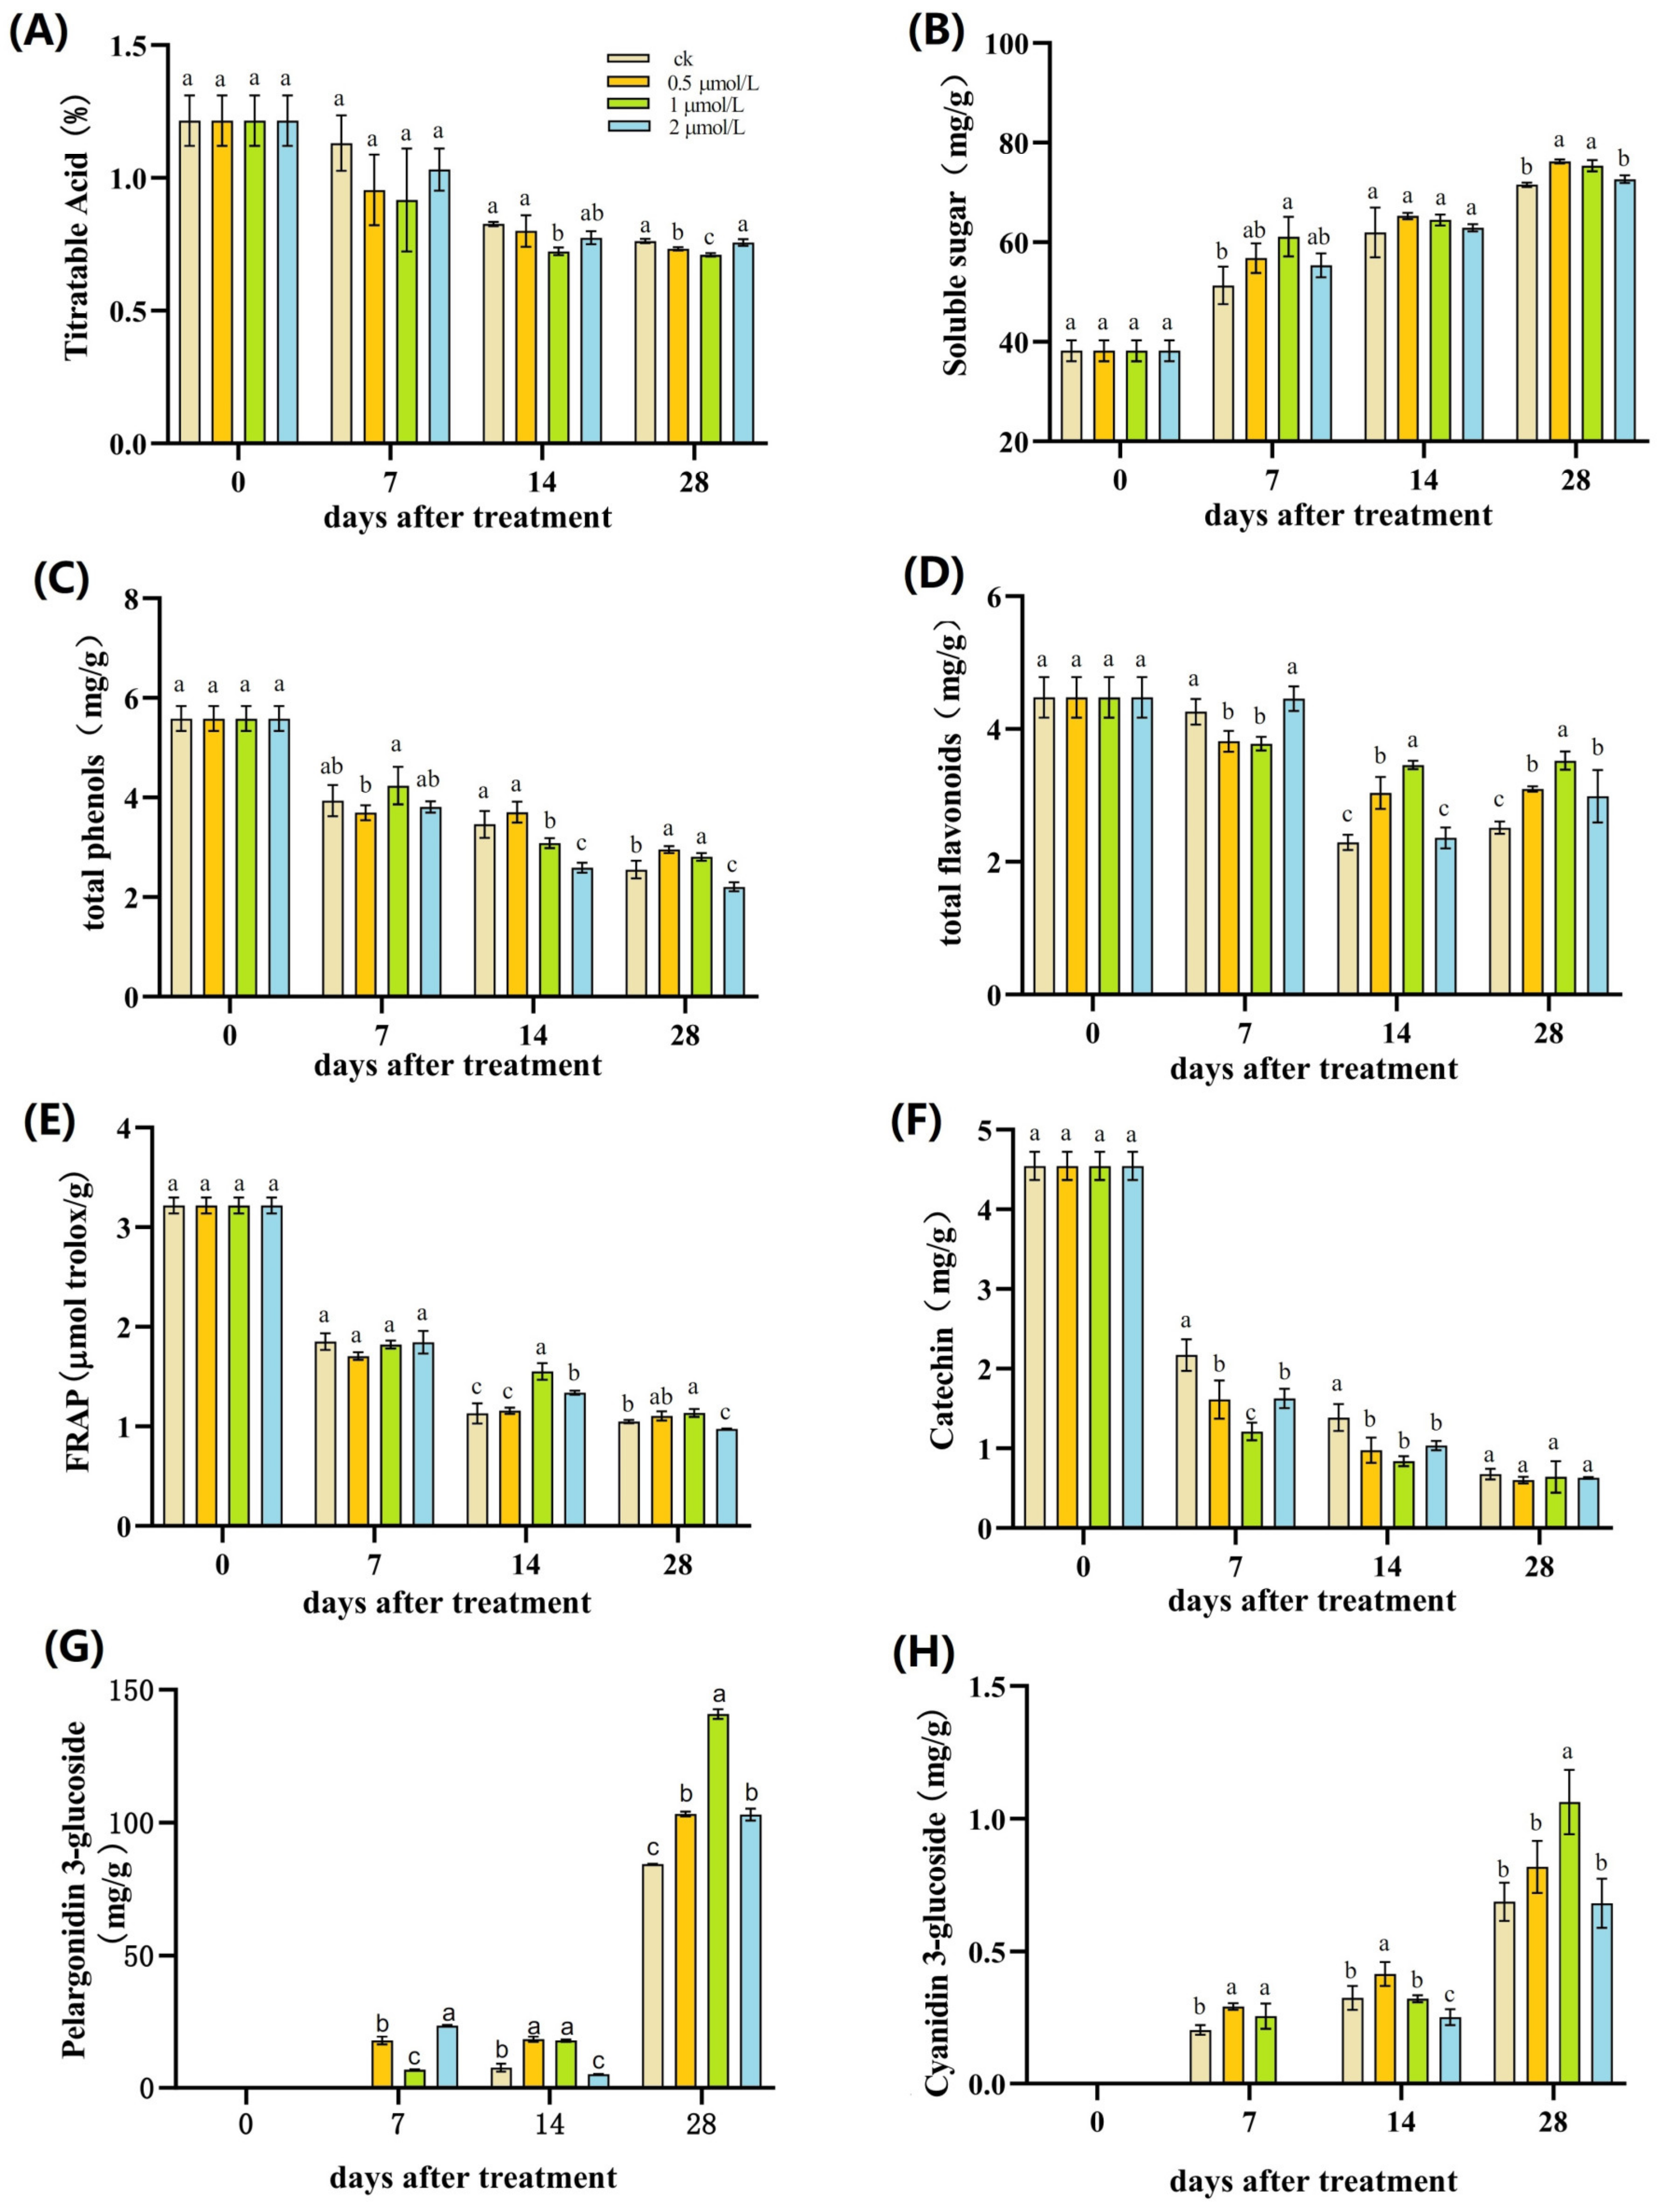
3.2. Effects of Pre-Harvest GR24 Treatment on Nutritional Quality Parameters of Strawberries

As illustrated in Figure 2A, there was a significant difference in titratable acid content between the control and GR24 treatment groups after 14 days. From 14 to 28 days, the titratable acid content of the strawberry fruit treated with a concentration of 1 µmol/L GR24 was significantly lower than that of the control group. As the strawberry fruit grew, the sugar content gradually increased (Figure 2B). On days 7 and 28 after treatment, the soluble sugar content of the 1 µmol/L treatment was significantly higher than that of the control group. The total phenolic content of strawberries showed a slow decreasing trend during development, but 0.5 and 1.0 µmol/L of GR24 effectively promote an increase in phenolic content after 28 days after treatment (Figure 2C). The total flavonoid content of strawberries showed a decreasing trend and then an increasing trend during development. After 14 and 28 days of treatment, GR24 effectively increased the total flavonoid content, and the best concentration was 1 µmol/L (Figure 2D). The FRAP value gradually decreased over time during strawberry growth, and there was no significant difference between the control and treatment groups after 7 days of treatment. After 14 and 28 days of treatment, GR24 effectively improved the antioxidant activity, with 1 µmol/L being the most effective concentration (Figure 2E). The catechin and anthocyanin (pelargonidin-3-O-glucoside and cyanidin-3-O-glucoside) content of strawberries showed significant changes during growth (Figure 2F–H). The levels of catechin were significantly lower in the treatment groups than in the control group after 7 and 14 days of GR24 treatment, whereas pelargonidin-3-O-glucoside and cyanidin-3-O-glucoside gradually increased during strawberry growth. GR24 treatment significantly increased the levels of pelargonidin-3-O-glucoside and cyanidin-3-O-glucoside, and the most effective concentration was 1 µmol/L.

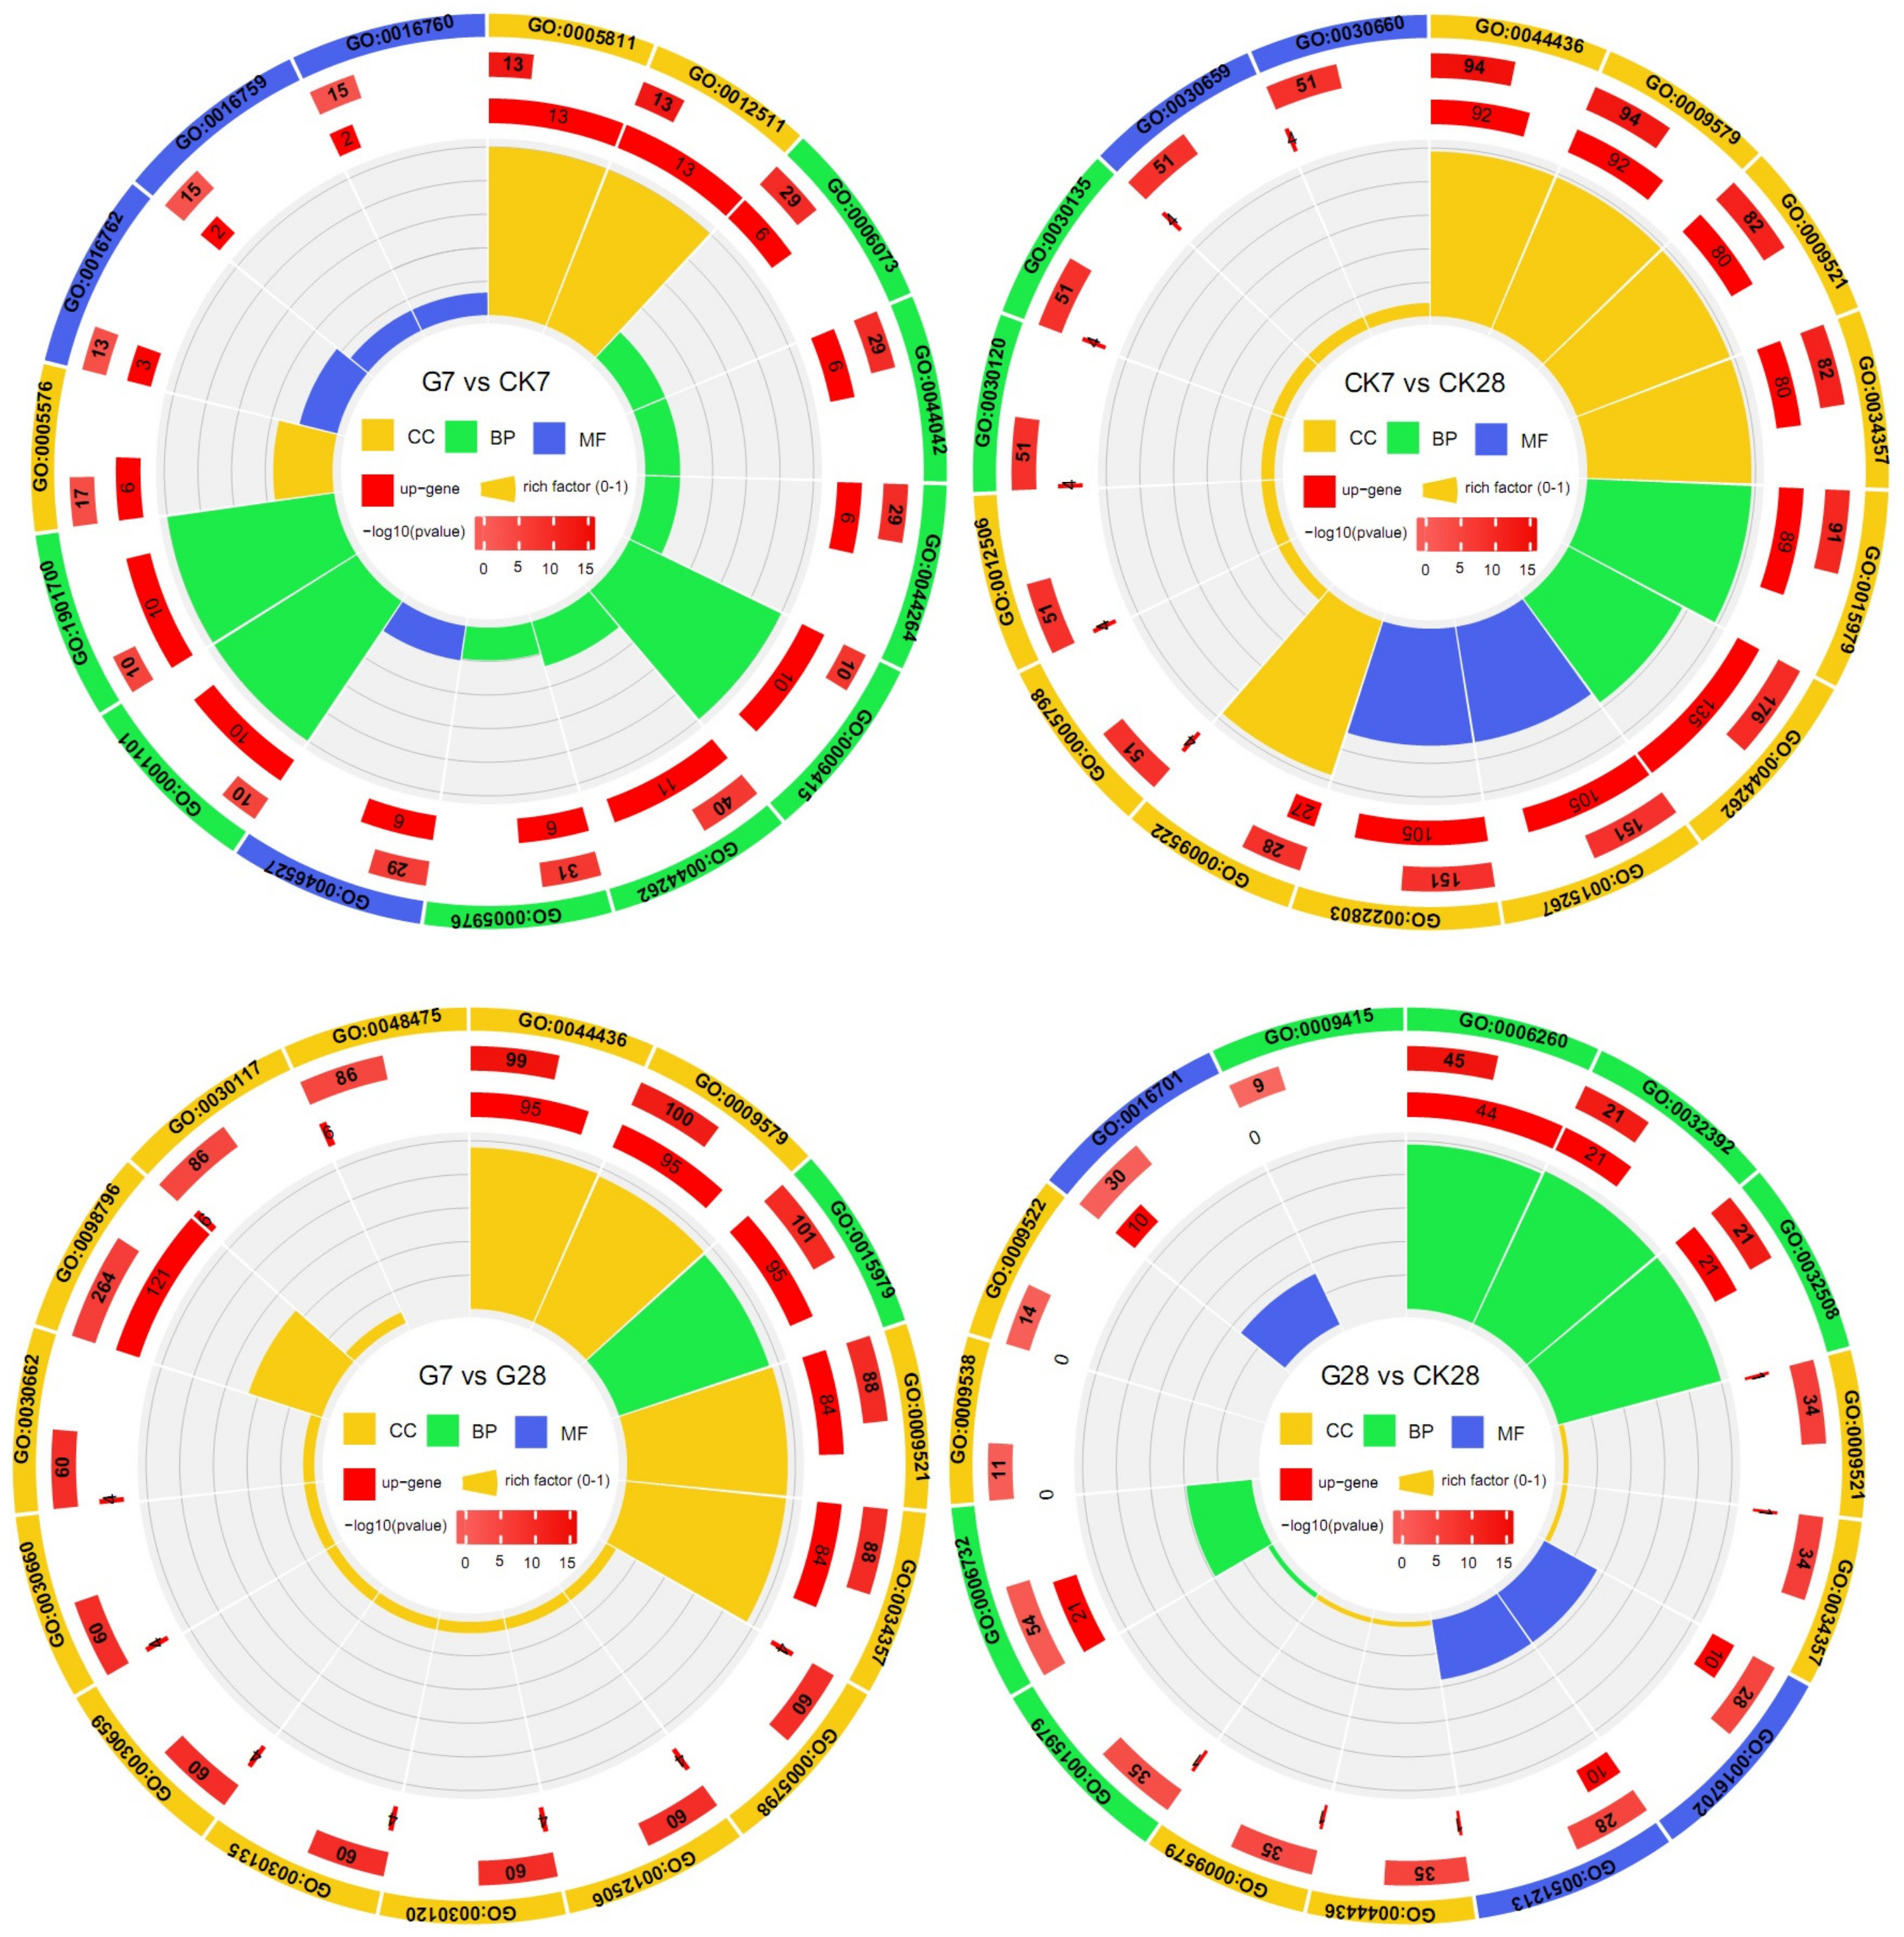
3.3. Transcriptomic Analysis of the Effect of GR24 on Fruit Quality

To investigate the molecular mechanism of GR24 in promoting fruit growth and development, twelve libraries were constructed for transcriptome sequencing that represented four strawberry fruit samples treated with water and 1.0 µmol/L GR24 for 7 and 28 days, with three replicates per sample. A total of 81.67 G of raw data was obtained from 12 libraries, and each sample was aligned to the reference genome with over 92% homology (Table S2).
A total of 110,659 genes were found to be expressed, with the expression level of each gene normalized as FPKM. At least 33,700 genes were found to be differentially expressed between one or more of the groups compared, and the largest number of differentially expressed genes (DEGs) was found in the G7 vs. G28 group, followed by the CK7 vs. CK28, G28 vs. CK28, and G7 vs. CK7 groups (Figure 3A). Further analysis of the commonly and specifically expressed genes in the four comparison groups (Figure 3B) showed that 376 genes were commonly differentially expressed in all four comparison groups. Specifically, 15,046 genes were commonly differentially expressed in the CK7 vs. CK28 and G7 vs. G28 groups, and 709 and 443 genes were specifically expressed in the CK28 vs. G28 and CK7 vs. CK28 groups, respectively. These results suggest that these genes are involved in the regulation of strawberry growth and development under the action of GR24.
Clustering analysis of the expression was carried out for all the DEGs. The expression levels showed significant differences between the two sampling periods, and based on the expression trend, the genes were divided into four sub-clusters. During the growth and development of the strawberries, the amplitudes of gene expression showed a significant change trend, especially sub-cluster 1, in which 539 genes showed a significant level of expression after 28 days, while 966 genes in sub-cluster 2 showed a significant decrease in expression after 28 days (Figure 3C,D).
To better understand the biological functions of the differentially expressed genes, GO (Gene Ontology) analysis was used for functional annotation of each group (Figure 4 and Table S3). Thylakoid part (GO: 0044436), photosystem (GO: 0009521), photosynthetic membrane (GO: 0034357), photosynthesis (GO: 0015979) and cellular carbohydrate metabolic process (GO: 0044262) were significantly enriched in the CK7 vs. CK28 and G7 vs. G28 combinations, and these processes were mainly the result of the up-regulation of DEGs. However, thylakoid part (GO: 0044436), photosystem (GO: 0009521), and photosynthetic membrane (GO: 0034357) were also significantly enriched in G28 vs. CK28 and mainly regulated by down-regulated DEGs. Cellular glucan metabolic process (GO: 0006073), glucan metabolic process (GO: 044042), and cellular polysaccharide metabolic process (GO: 0044264) were significantly enriched in G7 vs. CK and mainly regulated by down-regulated DEGs.

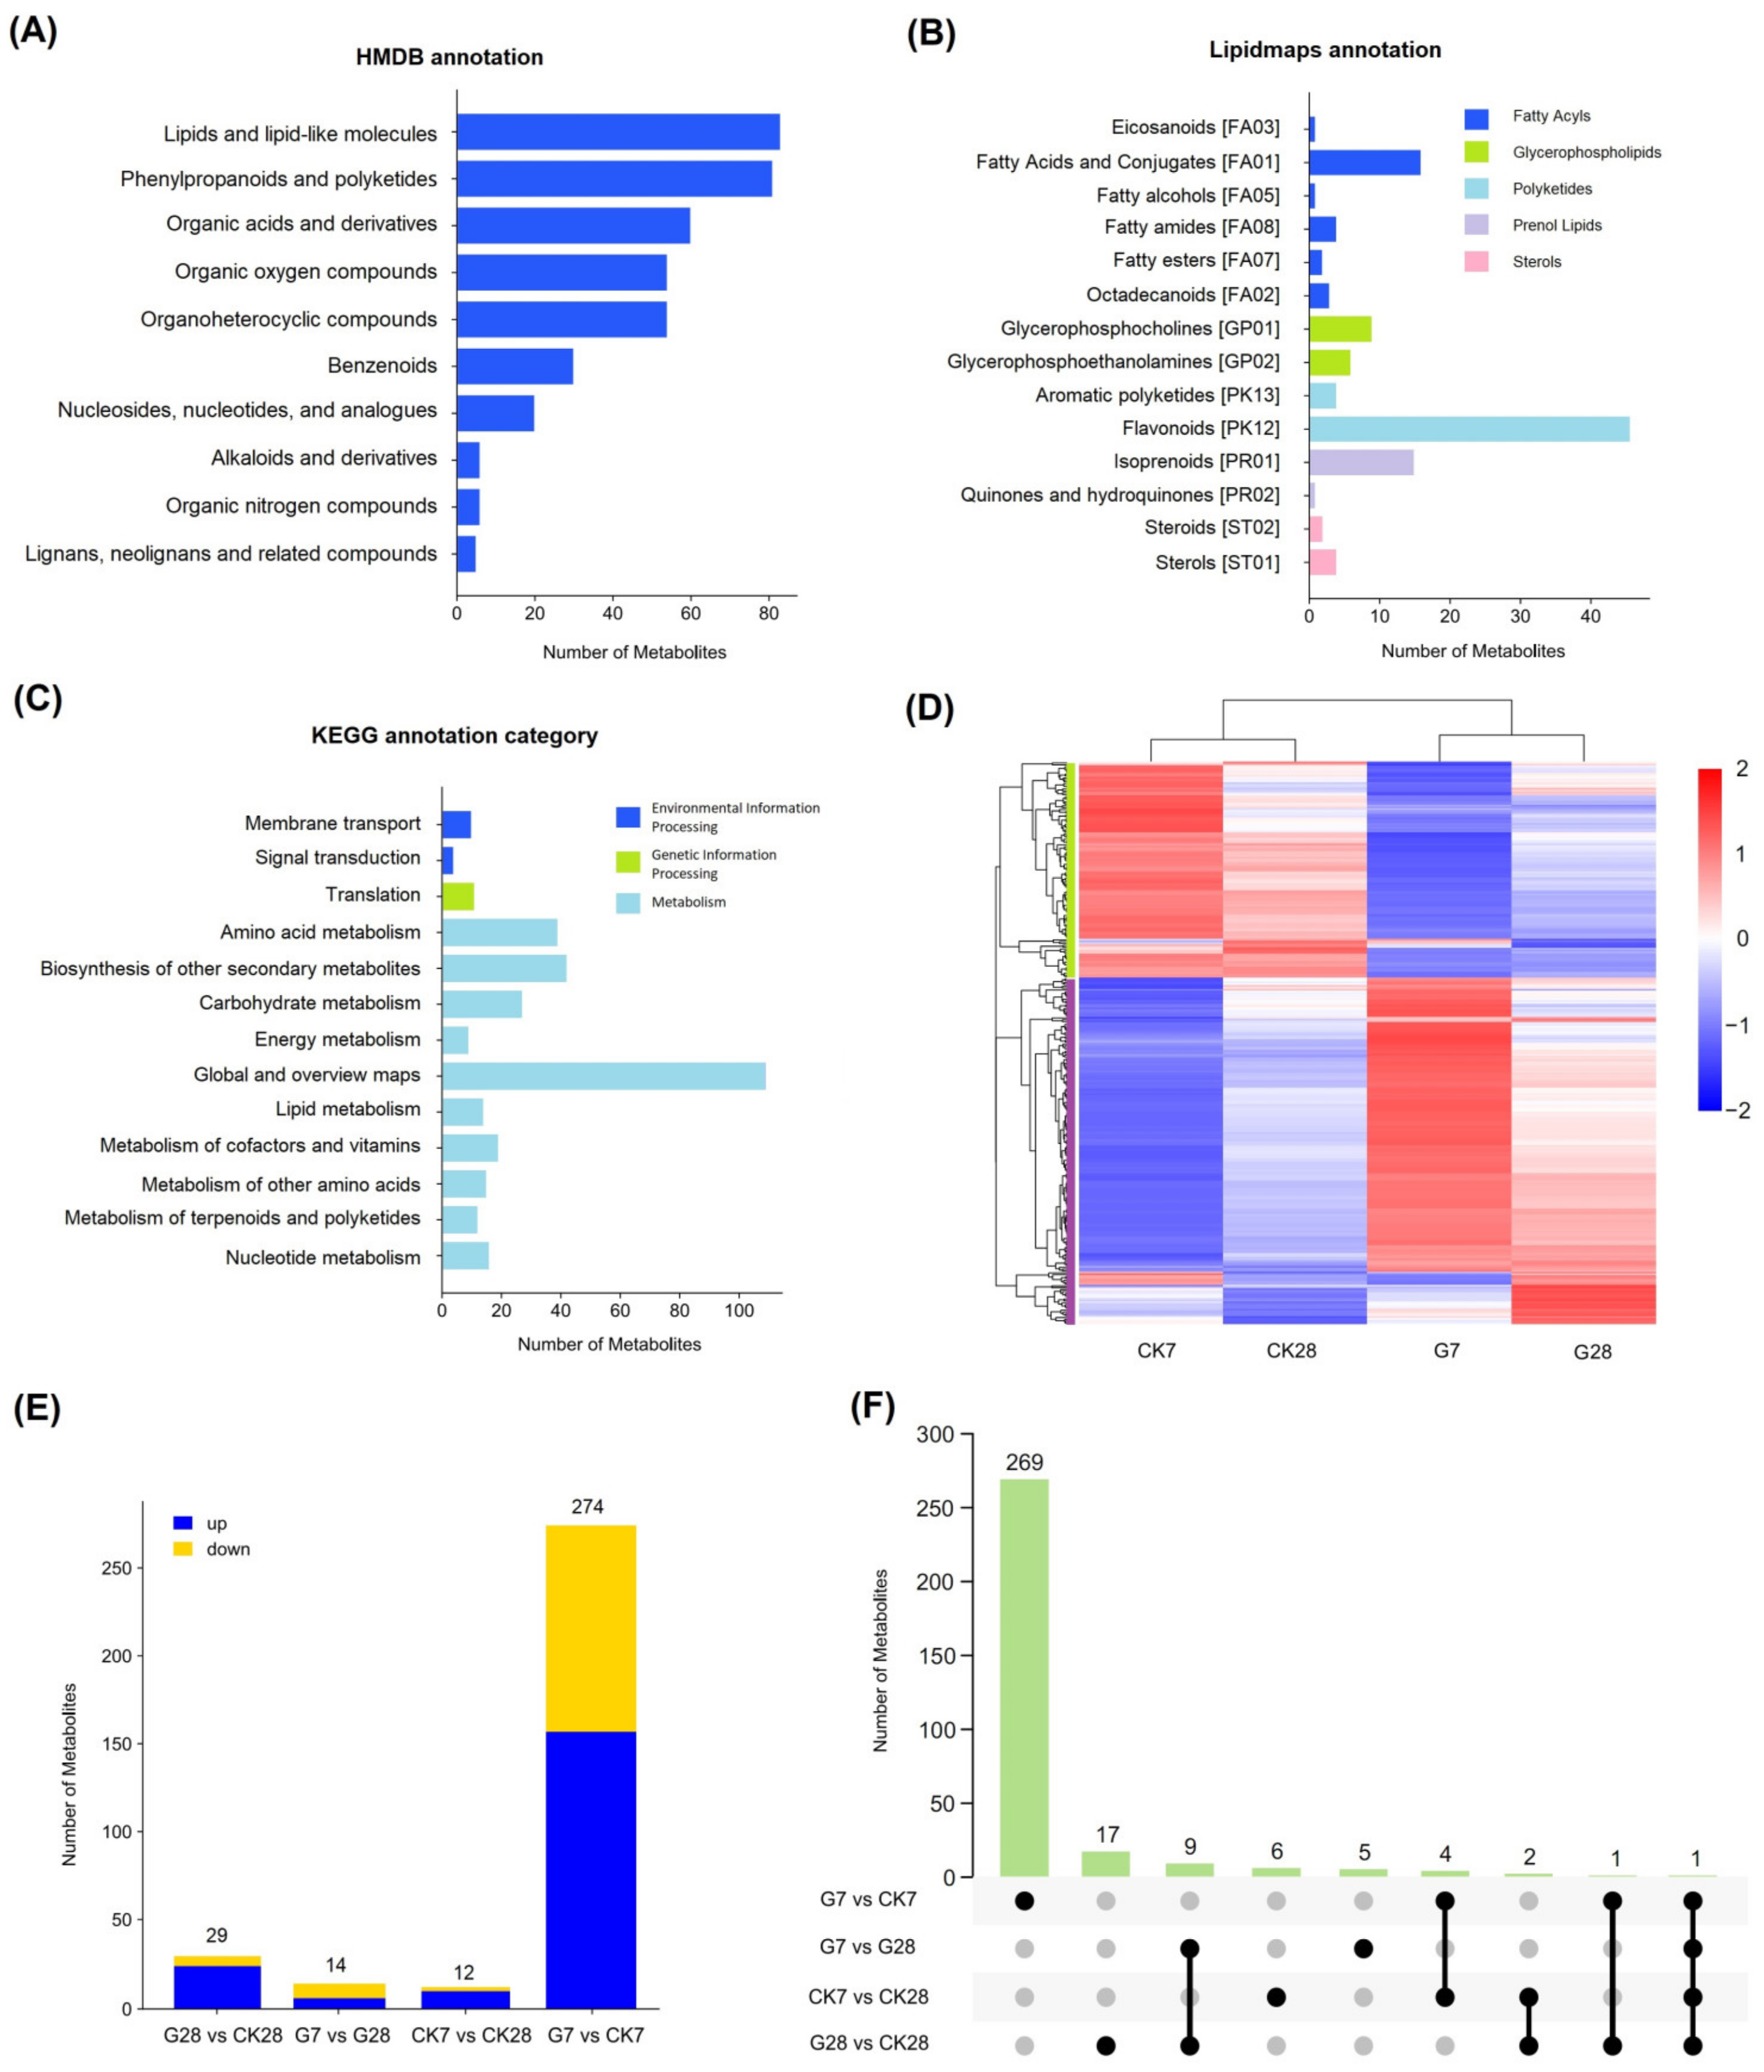
3.4. Metabolomic Analysis of the Effect of GR24 on Strawberry Fruit Quality

To better understand the changes of metabolites during the process of strawberry fruit ripening after GR24 treatment, metabolites in the strawberry fruits were identified by UPLC-MA/MS. A total of 762 metabolites were detected across all samples, and the metabolites were further functionally annotated using three databases, including HMDB, Lipidmaps, and KEGG (Table S4). In the HMDB database (Figure 5A), a total of 399 metabolites were classified into 10 categories, with the most abundant types being lipids and lipid-like molecules (83 metabolites), followed by phenylpropanoids and polyketides (81 metabolites) and organic acids and derivatives (60 metabolites), with fewer metabolites annotated in the remaining groups. For the Lipidmaps annotation (Figure 5B), the group with the most metabolites were polyketides (50 metabolites), followed by fatty acyls (27 metabolites), and the sterols (6 metabolites) in the database contained the fewest metabolites. For the KEGG database, the identified metabolites were grouped into 13 pathways involved in three major categories (metabolism, environmental information processing, and genetic information processing), comprising a total of 327 metabolites. Among them, global and overview maps had the most metabolites (109), followed by biosynthesis of other secondary metabolites (42) and amino acid metabolism (39) (Figure 5C).
A hierarchical clustering analysis was carried out on the levels of accumulation of all the metabolites in the strawberries. As shown in Figure 5D, metabolite clustering analysis of the four stages showed clear grouping patterns, and all differential metabolites were grouped into two categories. The first category of metabolites was highly expressed in the two samples without GR24 treatment, whereas the second category of metabolites was highly expressed after GR24 treatment. A total of 314 differential accumulation metabolites (DAMs) were identified by comparing the metabolites among the four periods (Figure 5E,F). Among the four comparison groups, G7 vs. CK7 had the most DAMs (274), far more than G28 vs. CK28 (29), G7 vs. G28 (14), and CK7 vs. CK28 (12). Of these, 269 DAMs were expressed only in G7 vs. CK7, suggesting that GR24 contributes to strawberry ripening in the early stage of fruit development.

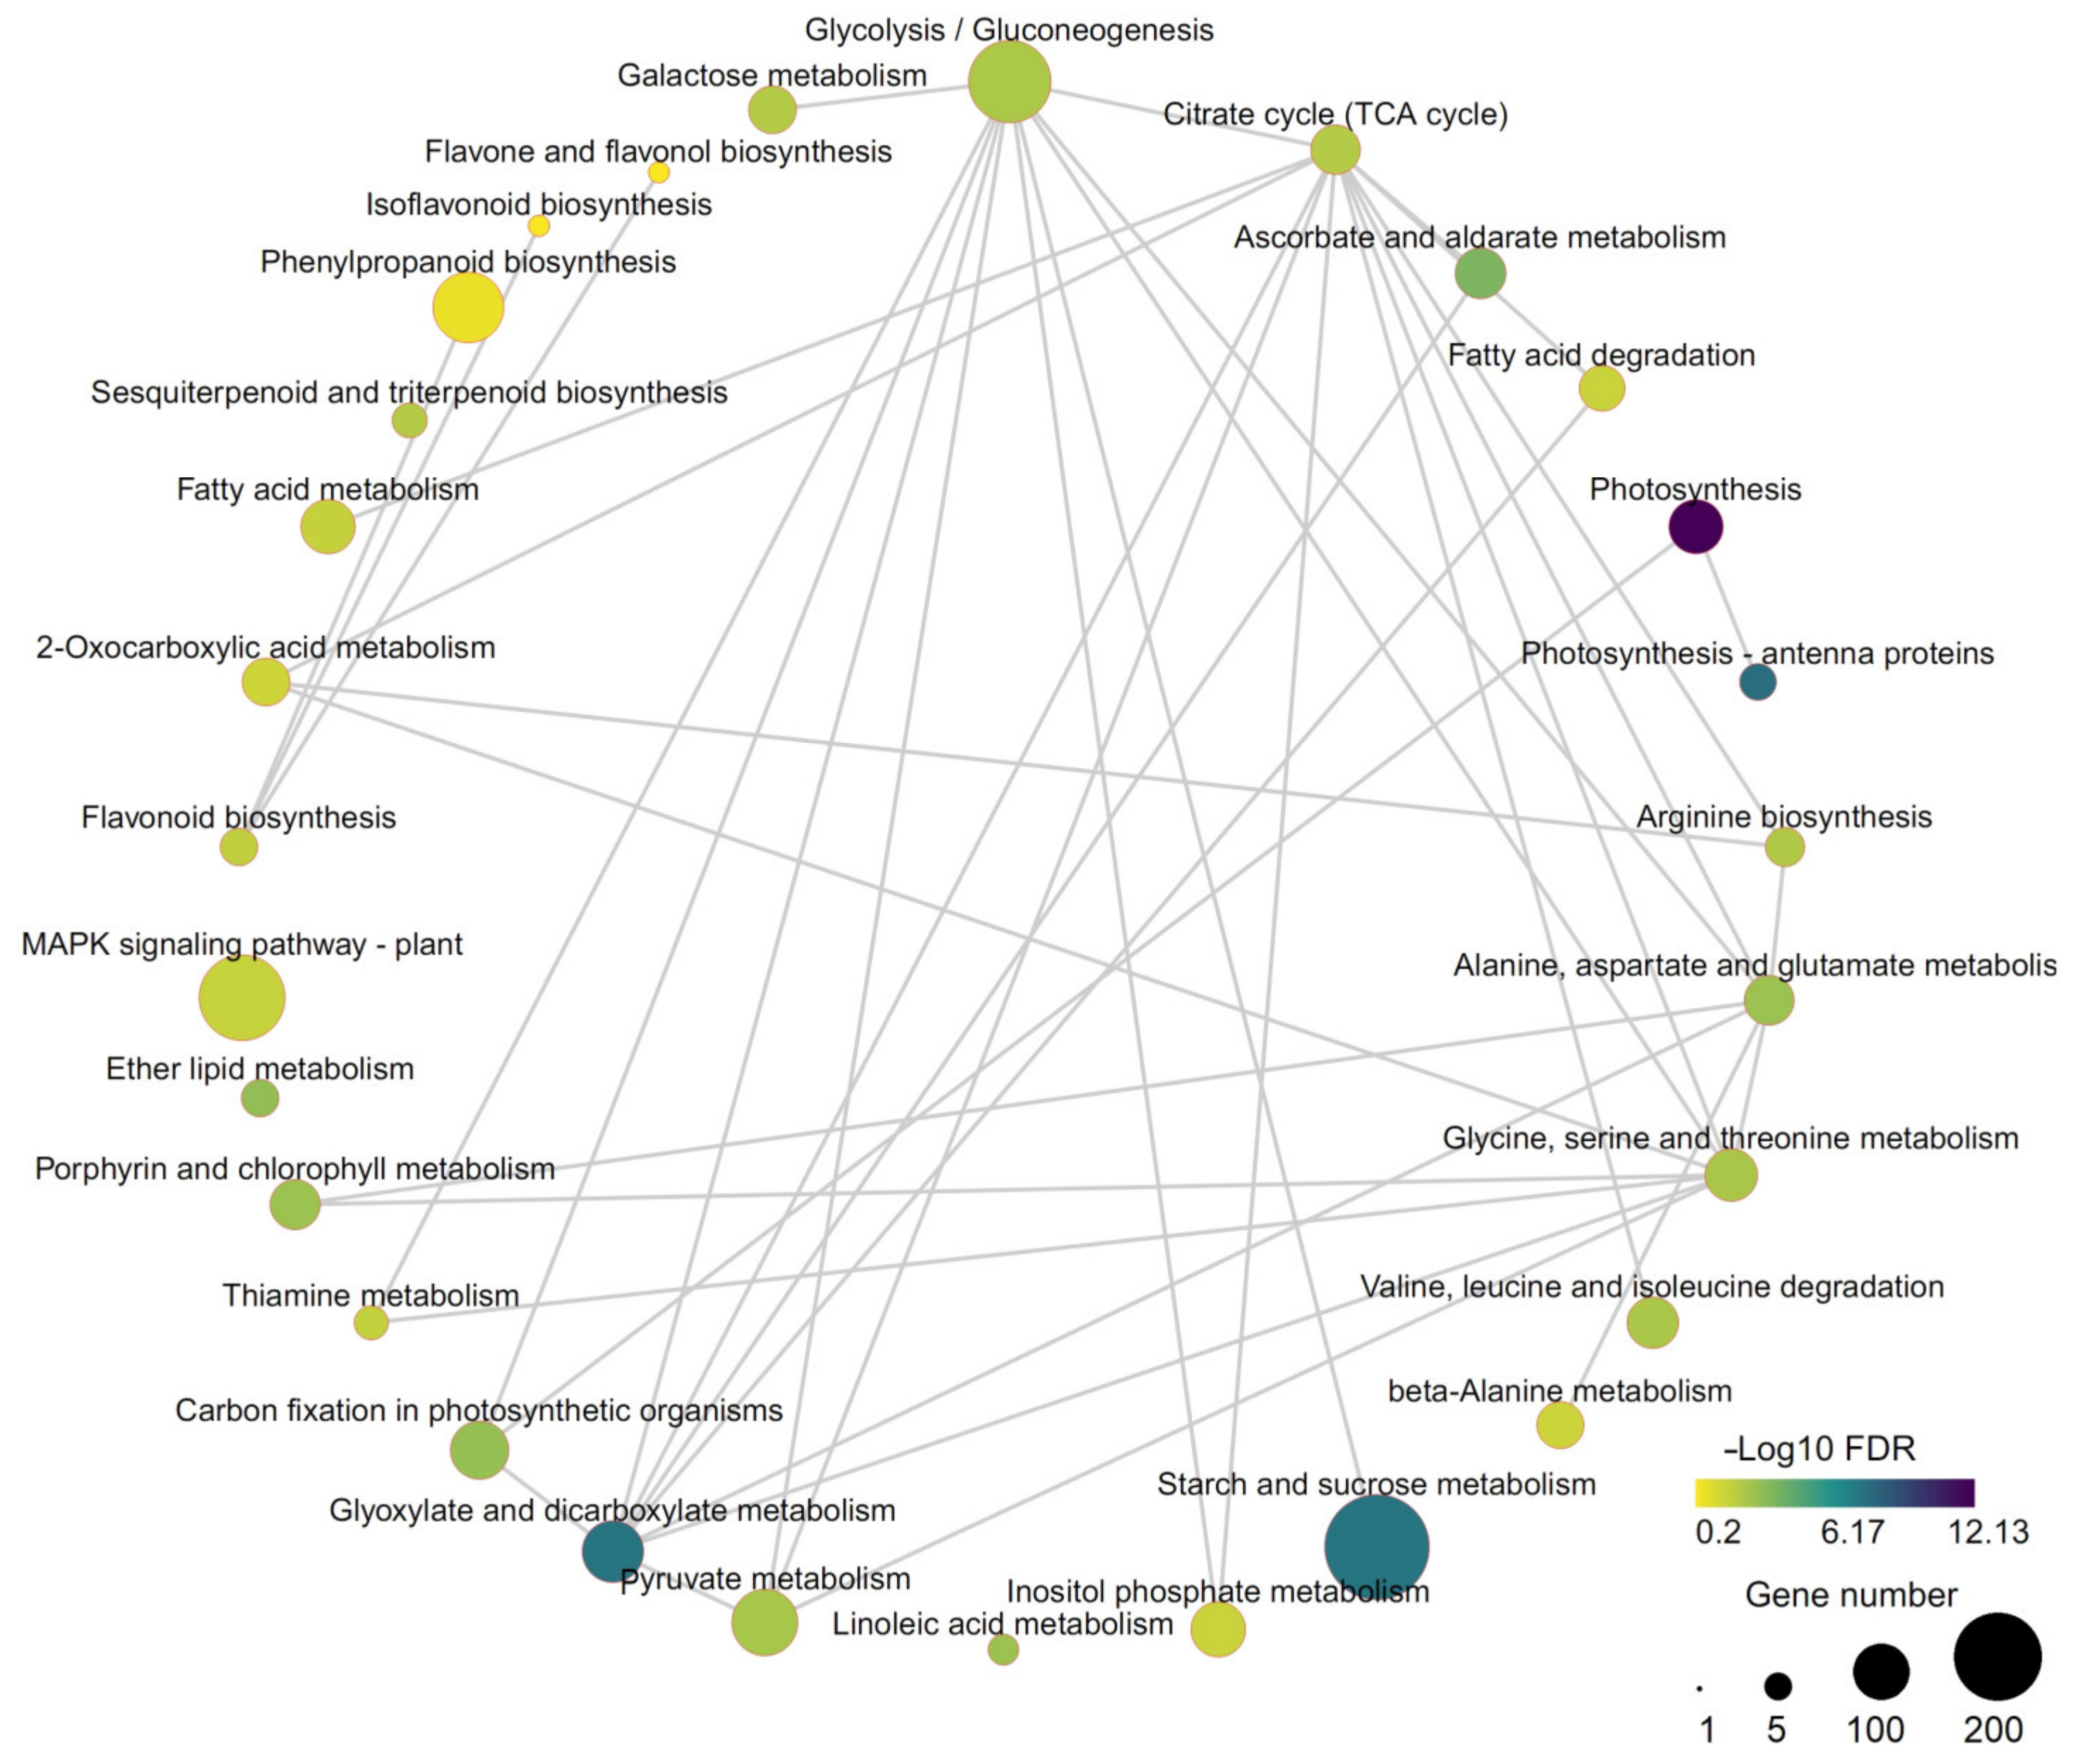
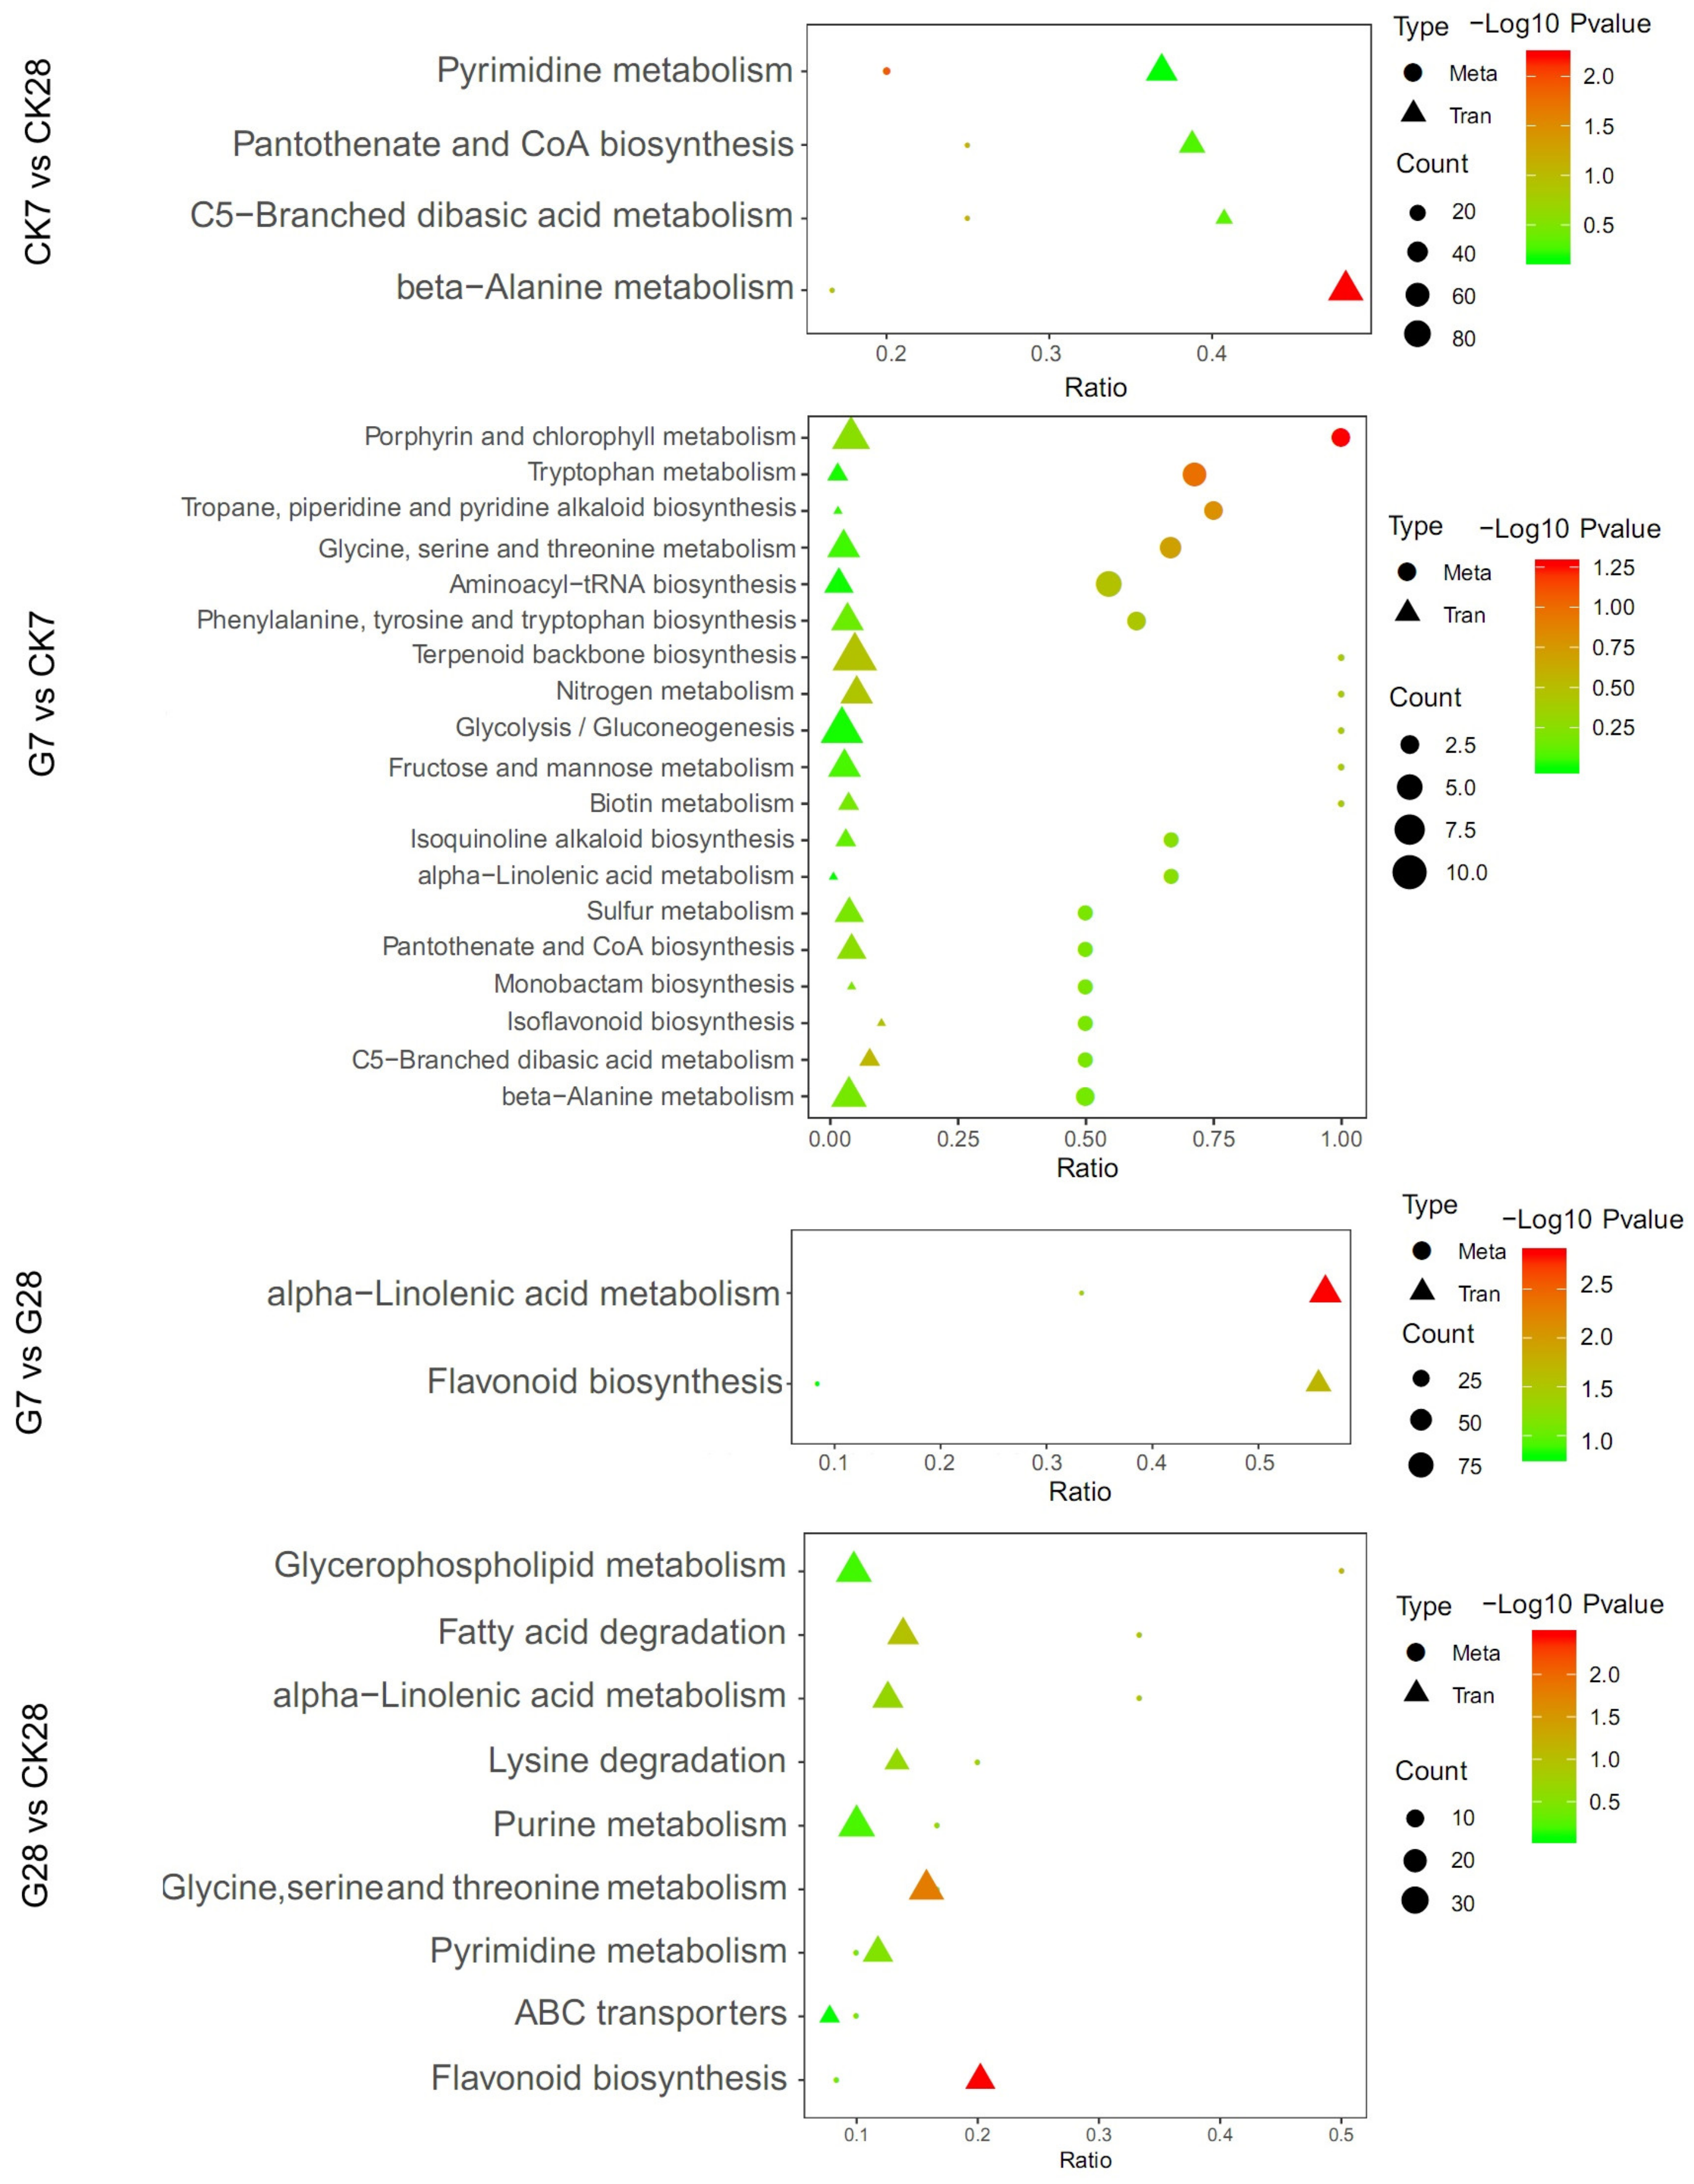
3.5. KEGG Enrichment Analysis and Transcriptome and Metabolome Correlation Analysis

Correlation network analysis was performed on the pathways that were significantly enriched in the DEGs of the four groups, and the results showed that the connections between the pathways were complex and tight (Figure 6). Glycolysis/gluconeogenesis and TCA cycle were highly enriched in center of the graph, acting as central nodes connecting multiple pathways of strawberry fruit growth and development. Flavonoid biosynthesis was also closely related to isoflavonoid biosynthesis, flavone and flavanol biosynthesis, and phenylpropanoid biosynthesis, among others.
The correlation between the DEGs and the DAMs was analyzed, and it was found that some common metabolic pathways were enriched in the KEGG pathway in each treatment. Significantly enriched pathways associated with DEGs and DAMs were identified using KEGG enrichment analysis. Enriched pathways for each comparison are shown in Figure 7 and Table S5, and 27 pathways were identified in all comparisons. In the transcriptome, the most significantly expressed pathways were alpha-linolenic acid metabolism, flavonoid biosynthesis, beta-alanine metabolism, isoflavonoid biosynthesis, etc. In the metabolome, pyrimidine metabolism, alpha-linolenic acid metabolism, and porphyrin and chlorophyll metabolism were the most significantly expressed pathways. Among them, the G7 vs. CK7 comparison had the most enriched metabolic pathways, followed by the G28 vs. CK28 comparison. The pathways involved in strawberry fruit growth and development were mainly concentrated in glycolysis/gluconeogenesis, fructose and mannose metabolism, flavonoid biosynthesis, isoflavonoid biosynthesis, etc., which have been linked to the physiological processes of sugar metabolism and the anthocyanin pathway in strawberries.

3.6. Analysis of the Sugar Biosynthesis Pathway Regulated by GR24 in Strawberry Fruit Ripening

The association between genes and metabolites in the sugar biosynthesis pathway was studied, and a total of 98 DEGs and three DAMs were identified in the starch and sucrose metabolism (ko00500) and glycolysis/gluconeogenesis (ko00010) pathways. Figure 8A shows significant associations between metabolites (sucrose, D-glucose 6-phosphate, and α,α-trehalose) and genes in the sugar biosynthesis pathway. As the fruit matures, the sugar content gradually increases, with variations in different types of sugars. The expression of most genes involved in sugar synthesis pathways increases and remains at a high level, such as endoglucanase (EG) and sucrose-phosphatase (SPP) (Figure 8B). The expression levels of eight selected genes related to sugar synthesis pathways were validated (Figure 8C). Except for HXK and UGP2, the qRT-PCR results of other genes are generally consistent with the transcriptome data. SUS, INV, and UGP2 show significantly reduced expression levels in the late stage of strawberry fruit ripening, while EG and GPI show significantly increased expression levels at day 28. Furthermore, it was found that treatment with GR24 significantly promotes the expression of SPP, UGP2, and GPI genes.

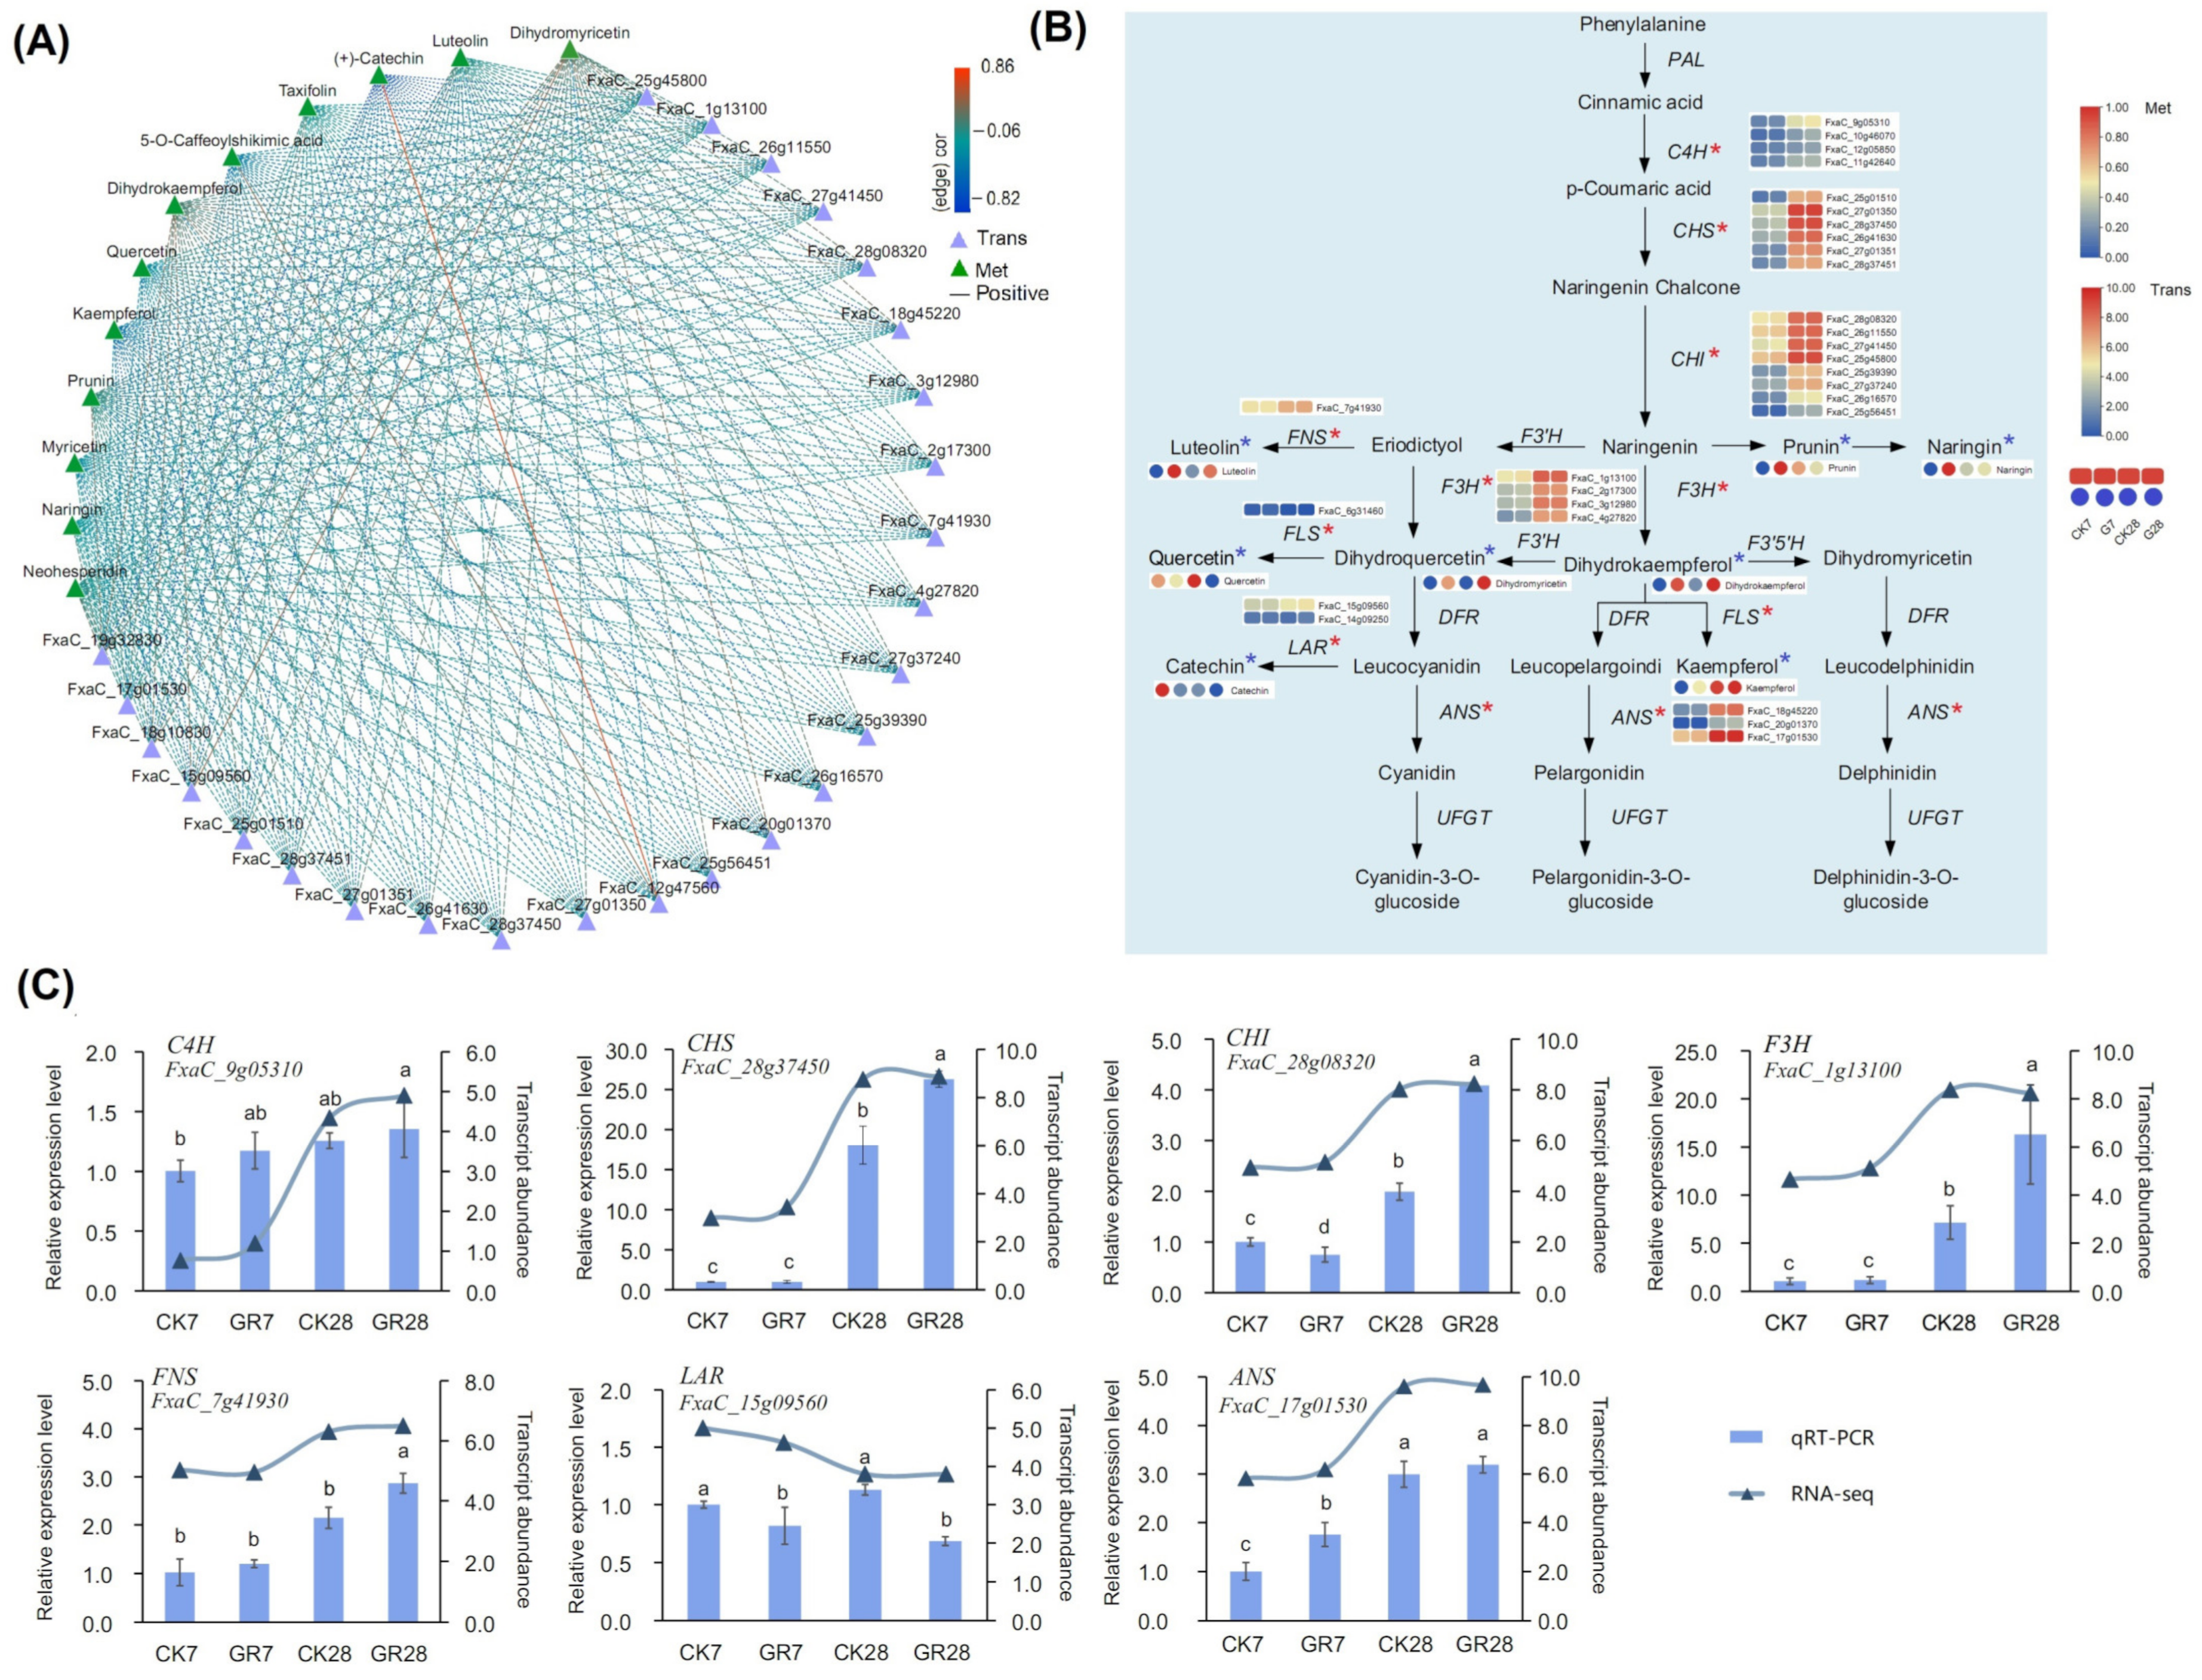
3.7. Analysis of the Anthocyanin Pathway Regulated by GR24 in Strawberry Fruit Ripening

Metabolites and genes in the anthocyanin assimilation pathway were analyzed, from which a total of 26 DEGs and 12 DAMs were identified. There was a strong overall correlation between the metabolites and the genes (Figure 9A). Dihydrokaempferol, luteolin, and dihydromyricetin were positively correlated with most genes, while kaempferol, quercetin, and catechin were negatively correlated with the genes. As the strawberry fruit ripened, gene expression levels of CHS, CHI, ANS, and F3H were significantly higher at 28 days than at 7 days. In addition, the expression levels of most of the genes were up-regulated after treatment with GR24, suggesting that GR24 promotes the synthesis of anthocyanins in the fruit and thus enhances the ripening of the strawberry fruit. During fruit ripening, there was a significant accumulation of related metabolites, such as dihydrokaempferol, dihydromyricetin, and kaempferol, especially after GR24 treatment, whereas the accumulation of luteolin, prunin, naringin, and catechin decreased during the ripening process of the fruit (Figure 9B).
To validate the transcriptome data, seven DEG genes involved in the anthocyanin synthesis pathway were selected for qRT-PCR analysis (Figure 9C). Gene expression after 7 days of GR24 treatment was not significantly different between control and treatment groups, but as the fruit ripened, all genes except the LAR gene showed a significant increase in expression after 28 days. The genes expressed in the GR28 group were expressed at higher than those expressed in the CK28 group. The expression levels of CHS, CHI, and F3H increased more than twofold after GR24 treatment compared to the CK28 group. FNS also showed a clear upward trend, while LAR expression showed a significant decrease. The qRT-PCR results of the anthocyanin synthesis pathway genes were consistent with the trend noted in the transcriptomic data, indicating that the transcriptomic data were highly reliable.

4. Discussion

During strawberry development, fruit quality is a key factor in determining the economic value of strawberries, including fruit weight, sugar, acid, color appearance, and synthesis of volatile aroma compounds. Strawberries are rich in flavonoids and phenolic compounds, which are beneficial to human health [25]. The application of some exogenous plant growth regulators, such as gibberellin (GA3) and abscisic acid (ABA), has been widely demonstrated to significantly increase fruit quality [26,27]. Treatment of grape fruit with SA, ASA, and MeSa can improve fruit quality characteristics [25]. At present, as a new plant growth regulator, application research on GR24 in horticultural products is relatively rare and not deep enough, and there are many aspects worthy of further improvement. In our study, GR24 was found to effectively promote the fruit quality of strawberries, including reducing acidity and increasing sugars, flavonoids, total phenolics, anthocyanins, and antioxidant activity. GR24 also can enhance the weight and size of strawberry fruits. The effective concentration of GR24 is not applied uniformly in different species. Foliar spraying at 4 μmol/L effectively increased the growth and photosynthetic efficiency of A. annua [16]. Application of 200 μmol/L GR24 to post-harvest oranges affected the physicochemical and sensory qualities and the antioxidant capacity of the fruit [17]. In grapes, 50 μmol/L GR24 has been shown to promote ripening and coloring, induce anthocyanin accumulation, and increase soluble sugar and organic acid content [18]. However, for pre-harvest treatment of strawberry fruits, the most effective concentration of GR24 appears to be 1 μmol/L.
Previous studies have reported that GR24 has a stimulating effect on the growth of the leaves and roots of plants [28,29], and 200 μmol/L of GR24 effectively increased the firmness of sweet orange fruit and inhibited fruit ripening [17]. However, in this study, we found that GR24 promoted the softening of strawberry fruits and reduced their hardness. This difference in effect may be due to the distinction between climacteric and non-climacteric fruits regarding the action of GR24. Some literature has also reported that exogenous hormones, such as ABA and ethylene, which promote fruit ripening and coloring, also accelerate fruit softening [27].
A higher sugar/acid ratio of strawberry is associated with a better flavor [30]. Strawberry fruits contain soluble sugars composed of glucose, fructose, and sucrose, with glucose and fructose being dominant in the early stage and sucrose significantly increasing in the later stage of ripening [31]. Therefore, the accumulation of sucrose during fruit ripening is a key determining factor for strawberry fruit quality. In this study, the total sugar content of strawberry fruits continuously increased with fruit development, while the acidity decreased. The effect of 1 μmol/L GR24 is particularly of interest as it effectively improved the sugar/acid ratio of strawberry fruits. Metabolomics analysis showed that under GR24 treatment, the sucrose content at day 28 was significantly higher compared to the untreated group. HXK, UGP2, GPI, and SUS are key enzymes in the sugar biosynthesis pathway [32]. Additionally, SPP catalyzes the final step of sucrose biosynthesis and controls sucrose synthesis [33]. Sucrose breakdown is mainly catalyzed by SUS and INV [34]. In this study, under GR24 treatment, the expression of SPP, HXK, UGP2, and GPI genes was significantly increased, promoting sucrose accumulation. Meanwhile, the expression levels of INV and SUS genes were significantly decreased, further inhibiting sucrose breakdown.
In our study, GR24 treatment increased the accumulation of pelargonidin-3-O-glucoside and cyanidin-3-O-glucoside (Figure 2G,H), thereby improving fruit color. Anthocyanin biosynthesis depends on several key enzymes encoded by early flavonoid biosynthetic genes (PAL, CHS, CHI, and F3H) and late biosynthetic genes (DFR, ANS, and UFGT) [35]. The structural genes for these enzymes have been studied in many species, for example in celery and kiwifruit [23,36]. ANS expression in strawberries is closely related to anthocyanin accumulation, and ANS is a key gene controlling anthocyanin levels in strawberry fruit [37]. LAR catalyzes the conversion of leucocyanidin and cyanidin into catechin and epicatechin, which are components of proanthocyanins [38]. In this study, most of the transcript levels of anthocyanin biosynthesis-related, genes such as C4H, CHS, CHI, F3H, FNS and ANS, showed significantly higher expression in mature strawberry fruit than in the control, which appears to be related to the induced expression of these genes by GR24 treatment. The expression of these genes further confirmed the accumulation of anthocyanin content, whereas the expression of LAR decreased, in line with the results for catechin content.
Fruit development and ripening are complex processes involving the interplay of physiological, biochemical, and molecular processes that are finely regulated by multiple metabolomic pathways and genes [39]. Transcriptome sequencing and metabolomics provide an opportunity to comprehensively investigate the progress of strawberry fruit ripening [40]. Research shows that sugar acid metabolism [41], flavonoid metabolism [42], lipid metabolism [43], and folate metabolism [44] are involved in strawberry fruit development and ripening. Specific metabolites are directly related to quality traits, such as total phenolics, antioxidant activity, and anthocyanins. In our study, the identified DEGs and metabolites were significantly enriched in photosynthesis, carbohydrate metabolism, glucan metabolism, and the flavonoids pathway, providing a basis for studying the effect of GR24 on fruit development and metabolism.
The combined analysis of transcriptomics and metabolomics can provide a large amount of data on molecular and metabolic events under different conditions, helping to understand the relationship between genotype and phenotype. In celery, the combined analysis of transcriptomics and metabolomics identified multiple key metabolites and genes that significantly contribute to the high-temperature response [45]. A comprehensive analysis of transcriptomics and metabolomics in strawberries confirmed that amino acid and terpenoid synthesis and metabolism, as well as the phenylpropanoid pathway, play an important role in the response to temperature changes [46]. In this study, some differentially expressed genes and metabolites were significantly involved in pathways such as sugar acid metabolism and flavonoid biosynthesis. This also suggests that genes induced by GR24 may have an important role in the improvement of fruit quality during fruit ripening. Similar findings have been reported in studies on kiwifruit [36] and sweet cherry [47], where significant differences in the flavonoid biosynthesis pathway were observed during fruit development and ripening, ultimately affecting fruit color.

5. Conclusions

We found that the application of exogenous GR24 can promote softening and coloring of strawberry fruit, while improving fruit quality attributes, with the concentration of 1.0 µmol/L being the most effective. Transcriptomic and metabolomic analyses revealed the differentially expressed genes and metabolites in the anthocyanin pathway during strawberry fruit development and under different treatments. Under GR24 treatment, the significantly up-regulated expression of anthocyanin biosynthesis genes was accompanied by a moderate accumulation of anthocyanins. These results suggest that GR24 is a signaling molecule that promotes strawberry ripening and alters fruit development and metabolic processes.

Supplementary Materials

The following supporting information can be downloaded at: https://www.mdpi.com/article/10.3390/agronomy13112699/s1, Table S1 Primer sequence designed for qRT-PCR; Table S2 Statistical data of transcriptome sequencing data assembly; Table S3 GO annotations of the DEGs in different comparisons; Table S4 Functional annotation of metabolites in HMDB, Lipidmaps, and KEGG databases; Table S5 Annotated association analysis of DAMs and DEGs in different combinations.

Author Contributions

Conceptualization, M.L. and Y.L. (Ya Luo); Methodology, X.L., M.Y., G.H., Y.J. and M.S.; Resources, C.H., H.T. and X.W.; Software, Y.P., Y.L. (Yuanxiu Lin), Y.Z. (Yong Zhang) and W.H.; Data curation and visualization, Y.W., Y.Z. (Yunting Zhang) and Q.C.; Writing, M.Y. and M.L.; Funding acquisition, Y.L. (Ya Luo). All authors have read and agreed to the published version of the manuscript.

Funding

This research was financially supported by the National Natural Science Foundation of China (No. 32272688); Natural Science Foundation of Sichuan Province (No. 23NSFSC0777); Sichuan Tianfu New Area Rural Revitalization Research Institute “The open competition project to select the best candidates“ (No. XZY108); and Key R&D Project of Science and Technology Department of Sichuan Province (No. 2023YFN0005).

Data Availability Statement

Transcriptional and metabolic data were generated by Nuohe Gene Technology Co., Ltd., Beijing, China.

Conflicts of Interest

The authors declare that the research was conducted in the absence of any commercial or financial relationships that could be construed as a potential conflict of interest.

References

  1. Giampieri, F.; Alvarez-Suarez, J.M.; Battino, M. Strawberry and human health: Effects beyond antioxidant activity. J. Agric. Food Chem. 2014, 62, 3867–3876. [Google Scholar] [CrossRef] [PubMed]
  2. Taha, I.M.; Zaghlool, A.; Nasr, A.; Nagib, A.; El Azab, I.H.; Mersal, G.A.M.; Ibrahim, M.M.; Fahmy, A. Impact of Starch Coating Embedded with Silver Nanoparticles on Strawberry Storage Time. Polymers 2022, 14, 1439. [Google Scholar] [CrossRef] [PubMed]
  3. Li, M.; Wang, Y.; Wei, X.; Wang, Z.; Wang, C.; Du, X.; Lin, Y.; Zhang, Y.; He, W.; Wang, X.; et al. Effects of pretreatment and freezing storage on the bioactive components and antioxidant activity of two kinds of celery after postharvest. Food Chem. X 2023, 18, 100655. [Google Scholar] [CrossRef]
  4. Li, D.; Li, L.; Xiao, G.; Limwachiranon, J.; Xu, Y.; Lu, H.; Yang, D.; Luo, Z. Effects of elevated CO2 on energy metabolism and γ-aminobutyric acid shunt pathway in postharvest strawberry fruit. Food Chem. 2018, 265, 281–289. [Google Scholar] [CrossRef]
  5. Silva, G.M.C.; Silva, W.B.; Medeiros, D.B.; Salvador, A.R.; Cordeiro, M.H.M.; da Silva, N.M.; Santana, D.B.; Mizobutsi, G.P. The chitosan affects severely the carbon metabolism in mango (Mangifera indica L. cv. Palmer) fruit during storage. Food Chem. 2017, 237, 372–378. [Google Scholar] [CrossRef]
  6. Xu, Y.; Charles, M.T.; Luo, Z.; Mimee, B.; Tong, Z.; Roussel, D.; Rolland, D.; Véronneau, P.Y. Preharvest UV-C treatment affected postharvest senescence and phytochemicals alternation of strawberry fruit with the possible involvement of abscisic acid regulation. Food Chem. 2019, 299, 125138. [Google Scholar] [CrossRef]
  7. Forges, M.; Bardin, M.; Urban, L.; Aarrouf, J.; Charles, F. Impact of UV-C radiation applied during plant growth on pre- and postharvest disease sensitivity and fruit quality of strawberry. Plant Dis. 2020, 104, 3239–3247. [Google Scholar] [CrossRef]
  8. Zuñiga, P.E.; Castañeda, Y.; Arrey-Salas, O.; Fuentes, L.; Aburto, F.; Figueroa, C.R. Methyl jasmonate applications from flowering to ripe fruit stages of strawberry (Fragaria × ananassa ‘Camarosa’) reinforce the fruit antioxidant response at post-harvest. Front. Plant Sci. 2020, 11, 538. [Google Scholar] [CrossRef]
  9. Feliziani, E.; Landi, L.; Romanazzi, G. Preharvest treatments with chitosan and other alternatives to conventional fungicides to control postharvest decay of strawberry. Carbohydr. Polym. 2015, 132, 111–117. [Google Scholar] [CrossRef]
  10. Kim, I.; Ahn, D.; Choi, J.H.; Lim, J.H.; Ok, G.; Park, K.J.; Lee, J. Changes in volatile compounds in short-term high CO2-treated ‘Seolhyang’ strawberry (Fragaria × ananassa) fruit during cold storage. Molecules 2022, 19, 6599. [Google Scholar] [CrossRef]
  11. Zhang, C.; Li, W.; Zhu, B.; Chen, H.; Chi, H.; Li, L.; Qin, Y.; Xue, J. The quality evaluation of postharvest strawberries stored in nano-ag packages at refrigeration temperature. Polymers 2018, 10, 894. [Google Scholar] [CrossRef]
  12. Humphrey, A.J.; Galster, A.M.; Beale, M.H. Strigolactones in chemical ecology: Waste products or vital allelochemicals? Nat. Prod. Rep. 2006, 23, 592–614. [Google Scholar] [CrossRef]
  13. Kapulnik, Y.; Koltai, H. Strigolactone involvement in root development, response to abiotic stress, and interactions with the biotic soil environment. Plant Physiol. 2014, 166, 560–569. [Google Scholar] [CrossRef]
  14. Koltai, H.; Prandi, C. Strigolactones: Biosynthesis, synthesis and functions in plant growth and stress responses. Phytohorm. Window Metab. Signal. Biotechnol. Appl. 2014, 265–288. [Google Scholar] [CrossRef]
  15. Cui, H.M.; Cao, X.W.; Wang, J.J.; Xiong, A.S.; Hou, X.L.; Li, Y. Effects of exogenous GR24 on the growth of axillary bud of non- heading Chinese cabbage. J. Nanjing Agric. Univ. 2016, 3, 7. [Google Scholar]
  16. Wani, K.I.; Zehra, A.; Choudhary, S.; Naeem, M.; Khan, M.M.A.; Khan, R.; Aftab, T. Exogenous strigolactone (gr24) positively regulates growth, photosynthesis, and improves glandular trichome attributes for enhanced artemisinin production in artemisia annua. J. Plant Growth Regul. 2022, 42, 4606–4615. [Google Scholar] [CrossRef]
  17. Ma, Q.L.; Lin, X.; Zhan, M.X.; Chen, Z.X.; Wang, H.G.; Yao, F.X.; Chen, J.Y. Effect of an exogenous strigolactone GR24 on the antioxidant capacity and quality deterioration in postharvest sweet orange fruit stored at ambient temperature. Int. J. Food Sci. Technol. 2022, 57, 619–630. [Google Scholar] [CrossRef]
  18. Liu, B.; Zhang, Y.; Wang, S.; Wang, W.; Xu, X.; Wu, J.; Fang, Y.; Ju, Y. Effects of strigolactone and abscisic acid on the quality and anti-oxidant activity of grapes (Vitis vinifera L.) and wines. Food Chem. X 2022, 16, 100496. [Google Scholar] [CrossRef]
  19. Reis, L.; Forney, C.F.; Jordan, M.; Munro Pennell, K.; Fillmore, S.; Schemberger, M.O.; Ayub, R.A. Metabolic Profile of Strawberry Fruit Ripened on the Plant Following Treatment With an Ethylene Elicitor or Inhibitor. Front. Plant Sci. 2020, 11, 995. [Google Scholar] [CrossRef]
  20. Acquaviva, R.; Russo, A.; Galvano, F.; Galvano, G.; Barcellona, M.L.; Volti, G.L.; Vanella, A. Cyanidin and cyanidin 3-O-β-D-glucoside as DNA cleavage protectors and antioxidants. Cell Biol. Toxicol. 2003, 19, 243–252. [Google Scholar] [CrossRef]
  21. Ganhão, R.; Pinheiro, J.; Tino, C.; Faria, H.; Gil, M.M. Characterization of nutritional, physicochemical, and phytochemical composition and antioxidant capacity of three strawberry “Fragaria × ananassa Duch.” Cultivars (“primoris”, “endurance”, and “portola”) from western region of portugal. Foods 2019, 8, 682. [Google Scholar] [CrossRef] [PubMed]
  22. Parra-Palma, C.; Fuentes, E.; Palomo, I.; Torres, C.A.; Ramos, P. Linking the platelet antiaggregation effect of different strawberries species with antioxidants: Metabolomic and transcript profiling of polyphenols. Bol. Latinoam. Caribe Plantas Med. Aromát. 2017, 17, 36. [Google Scholar]
  23. Li, M.; Li, J.; Tan, H.; Luo, Y.; Zhang, Y.; Chen, Q.; Wang, Y.; Lin, Y.; Zhang, Y.; Wang, X.; et al. Comparative metabolomics provides novel insights into the basis of petiole color differences in celery (Apium graveolens L.). J. Zhejiang Univ. B 2022, 23, 300–314. [Google Scholar] [CrossRef] [PubMed]
  24. Li, M.; Wang, L.; Liu, Y.; Lin, Y.; Zhang, Y.; Long, Y.; Luo, C.; Zhang, Y.; Chen, Q.; Chen, P.; et al. Characterization and regulation mechanism analysis of ubiqui-tin-conjugating family genes in strawberry reveals a potential role in fruit ripening. BMC Plant Biol. 2022, 22, 39–54. [Google Scholar] [CrossRef]
  25. García-Pastor, M.E.; Zapata, P.J.; Castillo, S.; Martínez-Romero, D.; Valero, D.; Serrano, M.; Guillén, F. Preharvest salicylate treatments enhance antioxidant compounds, color and crop yield in low pigmented-table grape cultivars and preserve quality traits during storage. Antioxidants 2020, 9, 832. [Google Scholar] [CrossRef]
  26. Erogul, D.; Sen, F. Effects of gibberellic acid tretatment on fruit thinning and fruit quality in Japanese plum (Prunus salicina Lindl). Sci. Hortic. 2015, 186, 137–142. [Google Scholar] [CrossRef]
  27. Lama, K.; Yadav, S.; Rosianski, Y.; Shaya, F.; Lichter, A.; Chai, L.; Dahan, Y.; Freiman, Z.; Peer, R.; Flaishman, M.A. The distinct ripening processes in the reproductive and non-reproductive parts of the fig syconium are driven by ABA. J. Exp. Bot. 2019, 70, 115–131. [Google Scholar] [CrossRef]
  28. Rozpądek, P.; Domka, A.M.; Nosek, M.; Ważny, R.; Jędrzejczyk, R.J.; Wiciarz, M.; Turnau, K. The role of strigolactone in the cross-talk between arabidopsis thaliana and the endophytic fungus mucorsp. Front. Microbiol. 2018, 9, 441–454. [Google Scholar] [CrossRef]
  29. Ruyter-Spira, C.; Kohlen, W.; Charnikhova, T.; van Zeijl, A.; van Bezouwen, L.; De Ruijter, N.; Cardoso, C.; Lopez-Raez, J.A.; Matusova, R.; Bours, R.; et al. Physiological effects of the synthetic strigolactone analog GR24 on root system architecture in Arabidopsis: Another belowground role for strigolactones? Plant Physiol. 2010, 2, 721–734. [Google Scholar] [CrossRef]
  30. Qiu, S.; Wang, J.; Gao, L. Discrimination and characterization of strawberry juice based on electronic nose and tongue: Com-parison of different juice processing approaches by LDA, PLSR, RF, and SVM. J. Agric. Food Chem. 2014, 27, 6426–6434. [Google Scholar] [CrossRef]
  31. Akhatou, I.; Fernández-Recamales, A. Nutritional and nutraceutical quality of strawberries in relation to harvest time and crop conditions. J. Agric. Food Chem. 2014, 62, 5749–5760. [Google Scholar] [CrossRef] [PubMed]
  32. Fang, X.; Wang, H.; Zhou, X.; Zhang, J.; Xiao, H. Transcriptome reveals insights into biosynthesis of ginseng polysaccharides. BMC Plant Biol. 2022, 22, 594. [Google Scholar] [CrossRef] [PubMed]
  33. Lunn, J.E.; Macrae, E. New complexities in the synthesis of sucrose. Curr. Opin. Plant Biol. 2003, 6, 208–214. [Google Scholar] [CrossRef] [PubMed]
  34. Cabello, S.; Lorenz, C.; Crespo, S.; Cabrera, J.; Ludwig, R.; Escobar, C.; Hofmann, J. Altered sucrose synthase and invertase expression affects the local and systemic sugar metabolism of nematode-infected Arabidopsis thaliana plants. J. Exp. Bot. 2014, 65, 201–212. [Google Scholar] [CrossRef]
  35. Griesser, M.; Hoffmann, T.; Bellido, M.L.; Rosati, C.; Fink, B.; Kurtzer, R.; Aharoni, A.; Muñoz-Blanco, J.; Schwab, W. Redirection of flavonoid biosynthesis through the down-regulation of an anthocyanidin glucosyltransferase in ripening strawberry fruit. Plant Physiol. 2008, 146, 1528–1539. [Google Scholar] [CrossRef]
  36. Li, Y.; Fang, J.; Qi, X.; Lin, M.; Zhong, Y.; Sun, L.; Cui, W. Combined analysis of the fruit metabolome and transcriptome reveals candidate genes involved in flavonoid biosynthesis in Actinidia arguta. Int. J. Mol. Sci. 2018, 19, 1471. [Google Scholar] [CrossRef]
  37. Yuan, H.; Yu, H.; Huang, T.; Shen, X.; Xia, J.; Pang, F.; Wang, J.; Zhao, M. The complexity of the Fragaria × ananassa (octoploid) tran-scriptome by single-molecule long-read sequencing. Hort. Res. 2019, 6, 46–59. [Google Scholar] [CrossRef]
  38. Carbone, F.; Preuss, A.; De Vos, R.C.H.; D’Amico, E.; Perrotta, G.; Bovy, A.G.; Martens, S.; Rosati, C. Developmental, genetic and environmental factors affect the expression of flavonoid genes, enzymes and metabolites in strawberry fruits. Plant Cell Environ. 2009, 32, 1117–1131. [Google Scholar] [CrossRef]
  39. Seymour, G.B.; Chapman, N.H.; Chew, B.L.; Rose, J.K.C. Regulation of ripening and opportunities for control in tomato and other fruits. Plant Biotechnol. J. 2013, 11, 269–278. [Google Scholar] [CrossRef]
  40. Yi, G.; Shin, H.; Min, K.; Lee, E.J. Expanded transcriptomic view of strawberry fruit ripening through meta-analysis. PLoS ONE 2021, 16, e0252685. [Google Scholar] [CrossRef]
  41. Darwish, A.G.; Das, P.R.; Ismail, A.; Gajjar, P.; Balasubramani, S.P.; Sheikh, M.B.; Tsolova, V.; Sherif, S.M.; El-Sharkawy, I. Untargeted metabolomics and antioxidant capacities of muscadine grape genotypes during berry development. Antioxidants 2021, 10, 914. [Google Scholar] [CrossRef] [PubMed]
  42. Pillet, J.; Yu, H.-W.; Chambers, A.H.; Whitaker, V.M.; Folta, K.M. Identification of candidate flavonoid pathway genes using transcriptome correlation network analysis in ripe strawberry (Fragaria × ananassa) fruits. J. Exp. Bot. 2015, 66, 4455–4467. [Google Scholar] [CrossRef] [PubMed]
  43. Antunes, A.C.; Acunha, T.d.S.; Perin, E.C.; Rombaldi, C.V.; Galli, V.; Chaves, F.C. Untargeted metabolomics of strawberry (Fragaria x ananassa ‘Camarosa’) fruit from plants grown under osmotic stress conditions. J. Sci. Food Agric. 2019, 99, 6973–6980. [Google Scholar] [CrossRef] [PubMed]
  44. Li, D.; Li, L.; Luo, Z.; Mou, W.; Mao, L.; Ying, T. Comparative transcriptome analysis reveals the influence of abscisic acid on the metabolism of pigments, ascorbic acid and folic acid during strawberry fruit ripening. PLoS ONE 2015, 10, e0130037. [Google Scholar] [CrossRef]
  45. Li, M.; Li, J.; Zhang, R.; Lin, Y.; Xiong, A.; Tan, G.; Luo, Y.; Zhang, Y.; Chen, Q.; Wang, Y.; et al. Combined analysis of the metabolome and transcriptome to explore heat stress responses and adaptation mechanisms in celery (Apium graveolens L.). Int. J. Mol. Sci. 2022, 23, 3367. [Google Scholar] [CrossRef]
  46. Zheng, T.; Lv, J.; Sadeghnezhad, E.; Cheng, J.; Jia, H. Transcriptomic and metabolomic profiling of strawberry during postharvest cooling and heat storage. Front. Plant Sci. 2022, 13, 1009747. [Google Scholar] [CrossRef]
  47. Yang, H.; Tian, C.; Ji, S.; Ni, F.; Fan, X.; Yang, Y.; Sun, C.; Gong, H.; Zhang, A. Integrative analyses of metabolome and transcriptome reveals metabolomic variations and candidate genes involved in sweet cherry (Prunus avium L.) fruit quality during development and ripening. PLoS ONE 2021, 16, e0260004. [Google Scholar] [CrossRef]
Figure 1. Effects of different concentrations of GR24 on the phenotype (A), longitudinal diameter (B), transverse diameter (C), weight (D), and hardness (E) of strawberry fruit. Different letters indicate significant differences (p < 0.05).
Agronomy 13 02699 g001
Figure 2. Effects of pre-harvest GR24 treatment on nutritional quality parameters of strawberries. (A) Titratable acid content, (B) soluble sugar content, (C) total phenol content, (D) total flavonoid content, (E) FRAP activity, (F) catechin content, (G) pelargonidin-3-O-glucoside content, and (H) cyanidin-3-O-glucoside content. Different letters indicate significant differences (p < 0.05).
Agronomy 13 02699 g002
Figure 3. Analysis of the transcriptome during the ripening of fruit treated with GR24. (A) Analysis of DEGs in different combinations. (B) Analysis of commonly and uniquely expressed genes among pairwise comparisons. (C) Cluster heat map of the transcript abundance of all DEGs. The color from green to red indicates the expression level from low to high. (D) K-means clustering analysis of expression trends of all DEGs.
Agronomy 13 02699 g003
Figure 4. GO functional annotation analysis of DEGs in different combinations. Only the top 15 significantly enriched annotations are shown.
Agronomy 13 02699 g004
Figure 5. Analysis of the metabolome during the ripening of fruit treated with GR24. (AC) Functional annotation of metabolites in HMDB, Lipidmaps, and KEGG databases. (D) The heat map of the accumulation of metabolites in different samples. (E) Analysis of DAMs in different combinations. (F) Analysis of common and unique accumulation metabolites in pairwise comparisons between different combinations.
Agronomy 13 02699 g005
Figure 6. Annotation analysis of the transcriptomic and metabolomic KEGG pathways involved in the development of fruit under GR24 treatment.
Agronomy 13 02699 g006
Figure 7. Annotated association analysis of DAMs and DEGs in different combinations. Dots indicate metabolite enrichment, and triangles indicate gene enrichment.
Agronomy 13 02699 g007
Figure 8. Analysis of the gene and metabolite expression of the sugar biosynthesis pathway during the ripening of strawberry fruit. (A) Correlation network analysis of DEMs and DEGs related to sugar biosynthesis. (B) Expression analysis of DEMs and DEGs in the pathway of the sugar biosynthesis. (C) qRT-PCR expression validation analysis of key genes in the sugar biosynthesis pathway.
Agronomy 13 02699 g008
Figure 9. Analysis of the gene and metabolite expression of the anthocyanin synthesis pathway during the ripening of strawberry fruit. (A) Correlation network analysis of DEMs and DEGs related to anthocyanin synthesis. (B) Expression analysis of DEMs and DEGs in the pathway of the anthocyanin synthesis. (C) qRT-PCR expression validation analysis of key genes in the anthocyanin synthesis pathway.
Agronomy 13 02699 g009
Table 1. Changes in L*, a*, and b* of strawberry fruit in response to different treatments during development.
DaysTreatmentsL*a*b*
DAT 7CK74.473 ± 0.150 a−6.851 ± 0.183 a46.105 ± 0.332 a
0.5 µmol/L GR2475.691 ± 0.312 a−6.578 ± 0.114 a45.474 ± 0.151 a
1 µmol/L GR2475.431 ± 1.083 a−6.564 ± 0.116 a45.510 ± 0.702 a
2 µmol/L GR2476.073 ± 0.286 a−6.903 ± 0.403 a46.728 ± 0.148 a
DAT 14CK67.427 ± 0.456 a−7.374 ± 0.247 a34.056 ± 0.508 a
0.5 µmol/L GR2468.173 ± 0.832 a−5.474 ± 1.367 a32.924 ± 1.520 ab
1 µmol/L GR2467.787 ± 0.442 a−5.454 ± 0.204 a31.830 ± 0.053 ab
2 µmol/L GR2467.615 ± 0.730 a−5.014 ± 0.357 a31.149 ± 0.235 b
DAT 28CK46.256 ± 2.106 a33.138 ± 1.783 b32.372 ± 0.225 a
0.5 µmol/L GR2442.241 ± 1.168 a37.256 ± 0.826 a30.527 ± 1.469 a
1 µmol/L GR2442.523 ± 0.347 a37.485 ± 1.251 a31.495 ± 0.445 a
2 µmol/L GR2441.898 ± 1.201 a38.331 ± 0.228 a30.912 ± 0.432 a
Note: DAT: Days after treatment. Each data represents mean ± SD, t-test at 0.05 level of significance (p < 0.05), letters a, b and c indicate significant differences, the same notation is used below.
Disclaimer/Publisher’s Note: The statements, opinions and data contained in all publications are solely those of the individual author(s) and contributor(s) and not of MDPI and/or the editor(s). MDPI and/or the editor(s) disclaim responsibility for any injury to people or property resulting from any ideas, methods, instructions or products referred to in the content.

