Article

Changes in the Chemical and Sensory Profile of Coffea canephora var. Conilon Promoted by Carbonic Maceration

by
Willian dos Santos Gomes
1,
Lucas Louzada Pereira
2,
Cristhiane Altoé Filete
2,
Taís Rizzo Moreira
3,
Rogério Carvalho Guarçoni
4,
Emanuele Catarina da Silva Oliveira
2,
Aldemar Polonini Moreli
2,
Cleidiana Vieira Guimarães
2,
Marinalva Maria Bratz Simmer
2,
Valdemar Lacerda Júnior
5,
Wanderson Romão
6,
Eustaquio Vinicius Ribeiro de Castro
5 and
Fábio Luiz Partelli
7,*
1
Genetic Improvement Program, Federal University of Espírito Santo, S/N Guararema, Alegre 29375-000, Brazil
2
Federal Institute of Education Science and Technology of Espírito Santo, Venda Nova do Imigrante 29375-000, Brazil
3
Center for Agrarian Sciences and Engineering, Federal University of Espírito Santo, Avenida Governador Lindemberg, 316—Centro, Jerônimo Monteiro, Vitória 29375-000, Brazil
4
Capixaba Institute for Research, Technical Assistance and Rural Extension, Venda Nova do Imigrante, Vitória 29375-000, Brazil
5
Laboratory of Research and Methodologies Development for Petroleum Analysis, Chemistry Department, Federal University of Espírito Santo, Av. Fernando Ferrari, 514, Goiabeiras, Vitória 29075-910, Brazil
6
Federal Institute of Education Science and Technology of Espírito Santo, Vila Velha 29106-010, Brazil
7
Department of Agrarian and Biological Sciences (DCAB), University Center of Northern Espírito Santo (CEUNES), Federal University of Espírito Santo (UFES), Rod. BR 101 Norte, Km 60, Bairro Litorâneo, São Mateus 29932-540, Brazil
*
Author to whom correspondence should be addressed.
Agronomy 2022, 12(10), 2265; https://doi.org/10.3390/agronomy12102265
Submission received: 19 August 2022 / Revised: 16 September 2022 / Accepted: 16 September 2022 / Published: 22 September 2022
(This article belongs to the Special Issue Coffee—from Plant to Cup)

Abstract

:
Among the different strategies adopted to improve the quality of Coffea canephora, fermentation is considered a promising technology to modulate the organoleptic characteristics of the beverage. Considering the possibility of providing a change in sensory profile through fermentation, this study aims to evaluate the chemical and sensory changes promoted by carbonic maceration in C. canephora whose effect is still unknown. The study was implemented in anaerobic conditions with different fermentation times (24, 48, 72, 96, and 120 h) and temperatures (18, 28, and 38 °C). The processed grains were subject to sensory analysis and medium infrared spectroscopy. Significant linear functional relationships were observed between total score and temperature for fermentation times of 24, 72, and 96 h and that the total score increased with fermentation temperature. Although a clear connection with sensory results was not observed, infrared analysis was able to point out important correlations with quality through stretches observed in infrared spectrum regions. Thus, there is feasibility of applying the carbonic maceration technique for grain processing of C. canephora.

1. Introduction

The world interest in the consumption of specialty coffees has grown significantly in recent years due to the stimuli caused by important changes, also called ‘waves’, regarding the commercialization, valorization, philosophies, and purposes of drinking [1].
In the context of trade expansion potential, Coffea arabica and Coffea canephora are the most important species, the latter being considered by many as strategic, due to the prevalence of its agronomic characteristics, such as high productivity, resistance to pests and diseases, and tolerance to abiotic stress, making possible its expansion in several regions in the world [2,3,4]. In this context, the production of C. canephora has grown significantly in recent years and today represents about 40% of world production [5].
In addition, the species is also traditionally considered of lower sensory quality, presenting little pronounced notes regarding sweetness and acidity, and possessing a striking aroma of roasted cereals [3]. Thus, in order to meet the sensory limitation presented by the species, several studies are concentrating efforts to improve the quality of C. canephora [6,7,8].
The final quality of the coffee drink is considered a complex condition and dependent on a number of factors that affect the physical, chemical, and sensory characteristics of coffee, and it can be inserted into pre-harvest events, such as genetic variety, coffee microbiota, geographical location, edaphoclimatic conditions and cultural treatments, as well as post-harvest activities, represented by processing and fermentation actions, drying, transport, and roasting [9].
Studies indicate that the control of the fermentative processes of coffee is becoming increasingly popular for the production of specialty coffees, due to the possibility of the development of precursors of aroma and flavor that add to the quality of the beverage [10]. Thus, the possibility of diversification of metabolic routes promoted by fermentation constitutes an opportunity for the entry of C. canephora into the specialty coffee market.
In this context, the technique called carbonic maceration, created by Michel Flanzy in 1934 is a well-known winemaking process that explores the adaptability of intact grapes to an oxygen-free medium enriched with carbon dioxide (CO2). This adaptation results in the transition from a respiratory anaerobic metabolism to a fermentative metabolism within each fruit [11].
The positive effect of carbonic maceration has provided the production of wines of superior quality and with a harmonious balance. According to some studies, the most responsive fermentation parameters in wine were observed between 30 and 32 °C, for 5 to 8 days in cases of lower temperature (15 °C), the time was extended to 20 days [12,13]. The observed results suggest a significant role of time and temperature control in the execution of the fermentation process.
For coffee, although a beneficial effect of carbonic maceration has been observed in promoting changes in the chemical and sensory profile of C. arabica [14], the selection of suitable parameters for C. canephora has not yet been carried out testing.
Considering the possibility of increasing the quality of C. canephora through fermentation, this study investigated the hypothesis that carbonic maceration applied to coffee fruits contributes to the advancement of the sensory and chemical quality of C. canephora. Thus, the objective was to analyze the sensory profile and the organic functions that contribute to the sensory and nutritional qualities of the C. canephora beverage after the application of the carbonic maceration process.

2. Materials and Methods

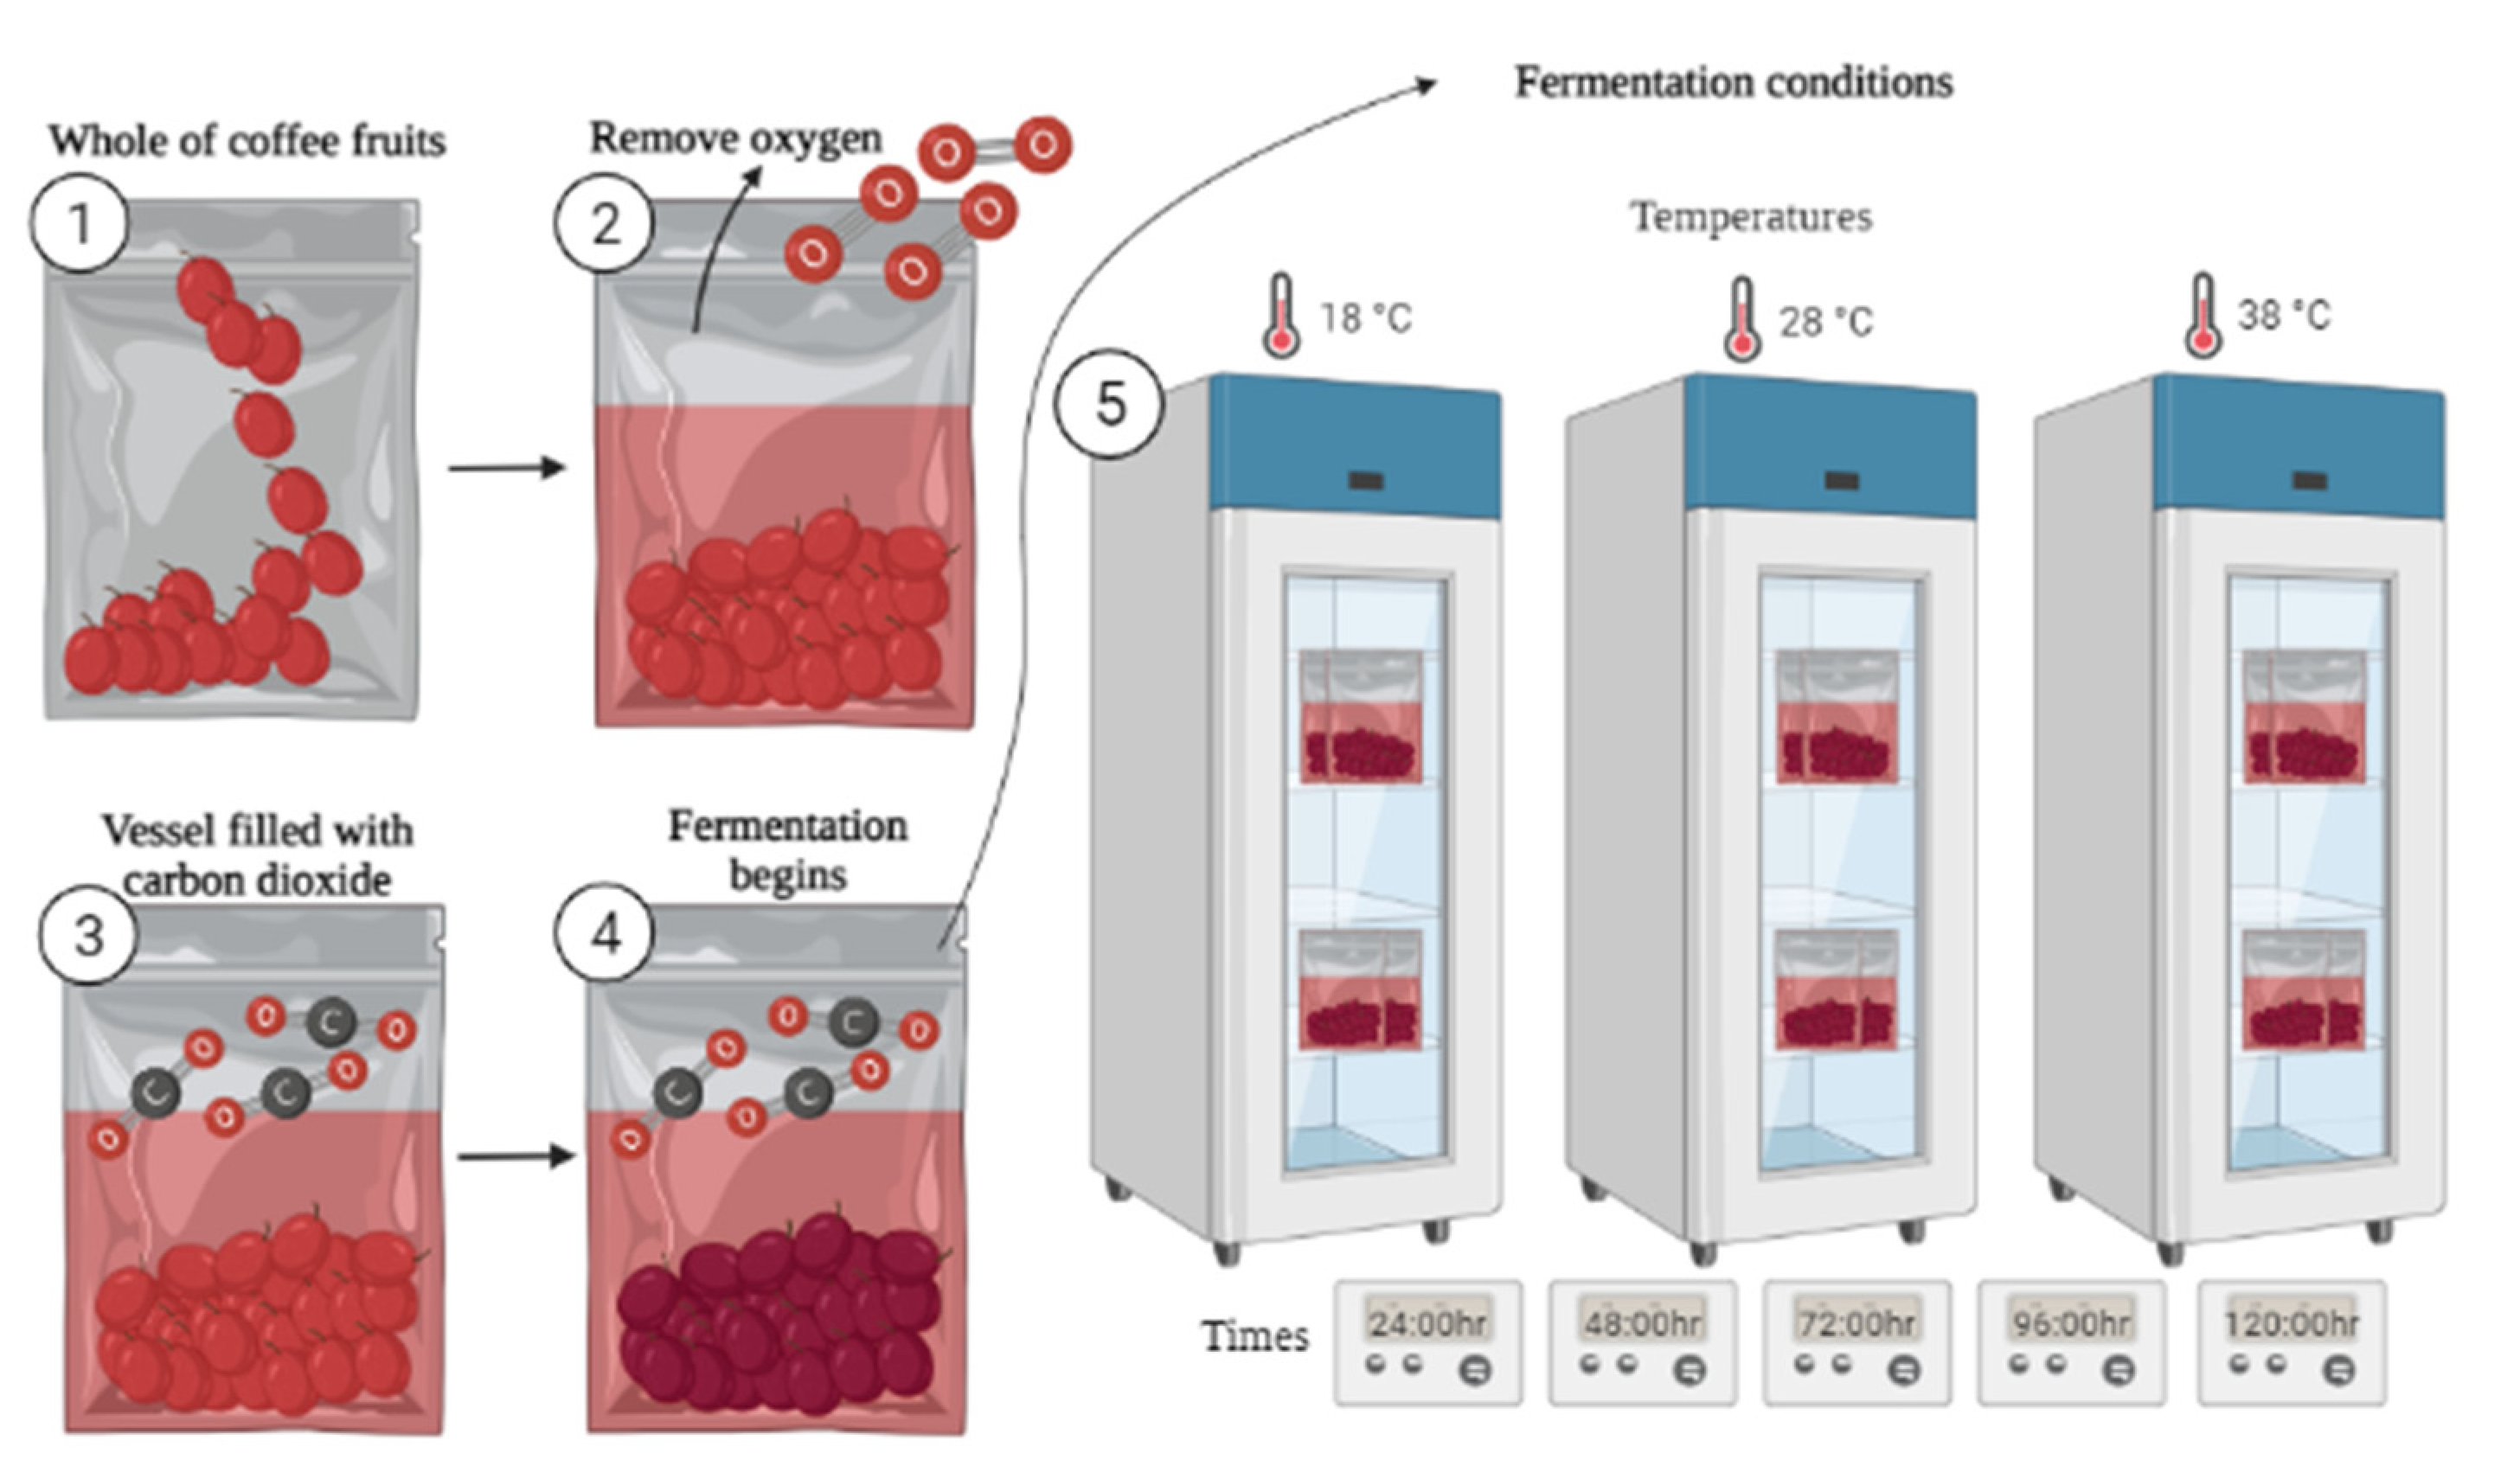
2.1. Raw Materials—Fermentation Processing

Coffea canephora var. conilon from the 2019–2020 crop was collected manually, in Jaguaré, in the state of Espírito Santo, Brazil, located at coordinates 18°55′43.0″ S 40°10′42.9″ W, at an altitude of 208 m. Dried fruits, rotten grains, leaves, branches, and other impurities were removed by washing with drinking water. The water used in the processing of coffees is in accordance with the consolidation ordinance GM/MS N°888 of the Brazilian Ministry of Health, which deals with the classification of the quality of treatment and the potability of water for human consumption [15].
Approximately 240 kg of coffee were collected, which were distributed in the experimental plots consisting of sterile plastic bags (flat plastic polypropylene bags, 40 cm × 50 cm and 18 cm thick). These bags were used as experimental units for fermentation. The temperatures (18, 28, and 38 °C), and the fermentation times (24, 48, 72, 96, and 120 h) were evaluated in this assay (Figure 1). Four repetitions were performed for each variable, according to the methodology established by Brioschi Junior et al. [14].
A vacuum sealer (ROBOTIC 900/1200 PLATES model, TecMaq®, São Paulo, Brazil) was used to remove atmospheric air and CO2 (99.9% purity) was injected with 20 kgf cm−2 of pressure. The experimental units were placed in 3 vertical bod incubators model NL 161/01, with programmable temperature between −10 to 60 °C, variation of ±0.1 °C and forced air circulation by ventilation [14].
At the end of the fermentation, the samples were taken to the drying unit. Part of the treatment analyzes were collected and identified for sensory and chemical analysis.

2.2. Preparation of Samples for Sensory and Chemical Analyses

The sampling roasting process was performed using the Probat© (Emmerich, Germany) Probatino model roaster with Agtron-SCA© disc set. The roasting point of these samples was between the colors determined by discs #65 and #55 for specialty coffees SCAA [16]. The roasting process was performed 24 h in advance of sensory analysis and grinding respected the 8 h of rest time after roasting. All samples were toasted between 9 and 10 min.

2.3. Sensory Analysis of Coffee Samples

After roasting and cooling, the samples remained sealed, according to the sensory analysis methodology [16]. The coffee samples were ground in a Bunn© (Springfield, IL, USA) G3 electric mill, with medium/coarse granulometry.
Each batch of coffee was tasted with 5 cups, and the optimum concentration of 8.25 g of ground coffee was adopted in 150 mL of water, according to the midpoint of the optimal balance chart for obtaining the Golden Cup [16]. The water infusion point was 92–95 °C. The Q-Graders started the evaluations when the cup temperature reached 55 °C, respecting the 4 min time for tasting after infusion.
The sensory quality of the coffee was evaluated using the Uganda Coffee Development Authority Sensory Analysis Protocol [17] with 6 Q-Graders. The number of Q-Graders in a sensory panel was initially proposed by Pereira al. [18]. The quality of the coffee drink once evaluated through the UCDA protocol is expressed by a centesimal numerical scale. The tasting form offers the possibility of evaluating eleven (11) sensory attributes for coffee: Fragrance/Aroma, Flavor, Aftertaste, Salt/Acid, Bitter/Sweet, Mouthfeel, Uniform Cups, Balance, Clean Cups, Overall and Total Score.
The results of this sensory evaluation were established from a scale of 16 units representing quality levels with intervals of 0.25 (one-quarter of a point) between numerical values between “6” and “10”. Thus, the ranking of coffees was good (6.00 < points < 6.75), very good (7.00 < points < 7.75), excellent (8.00 < points < 8.75) and exceptional (9.00 < points < 10).

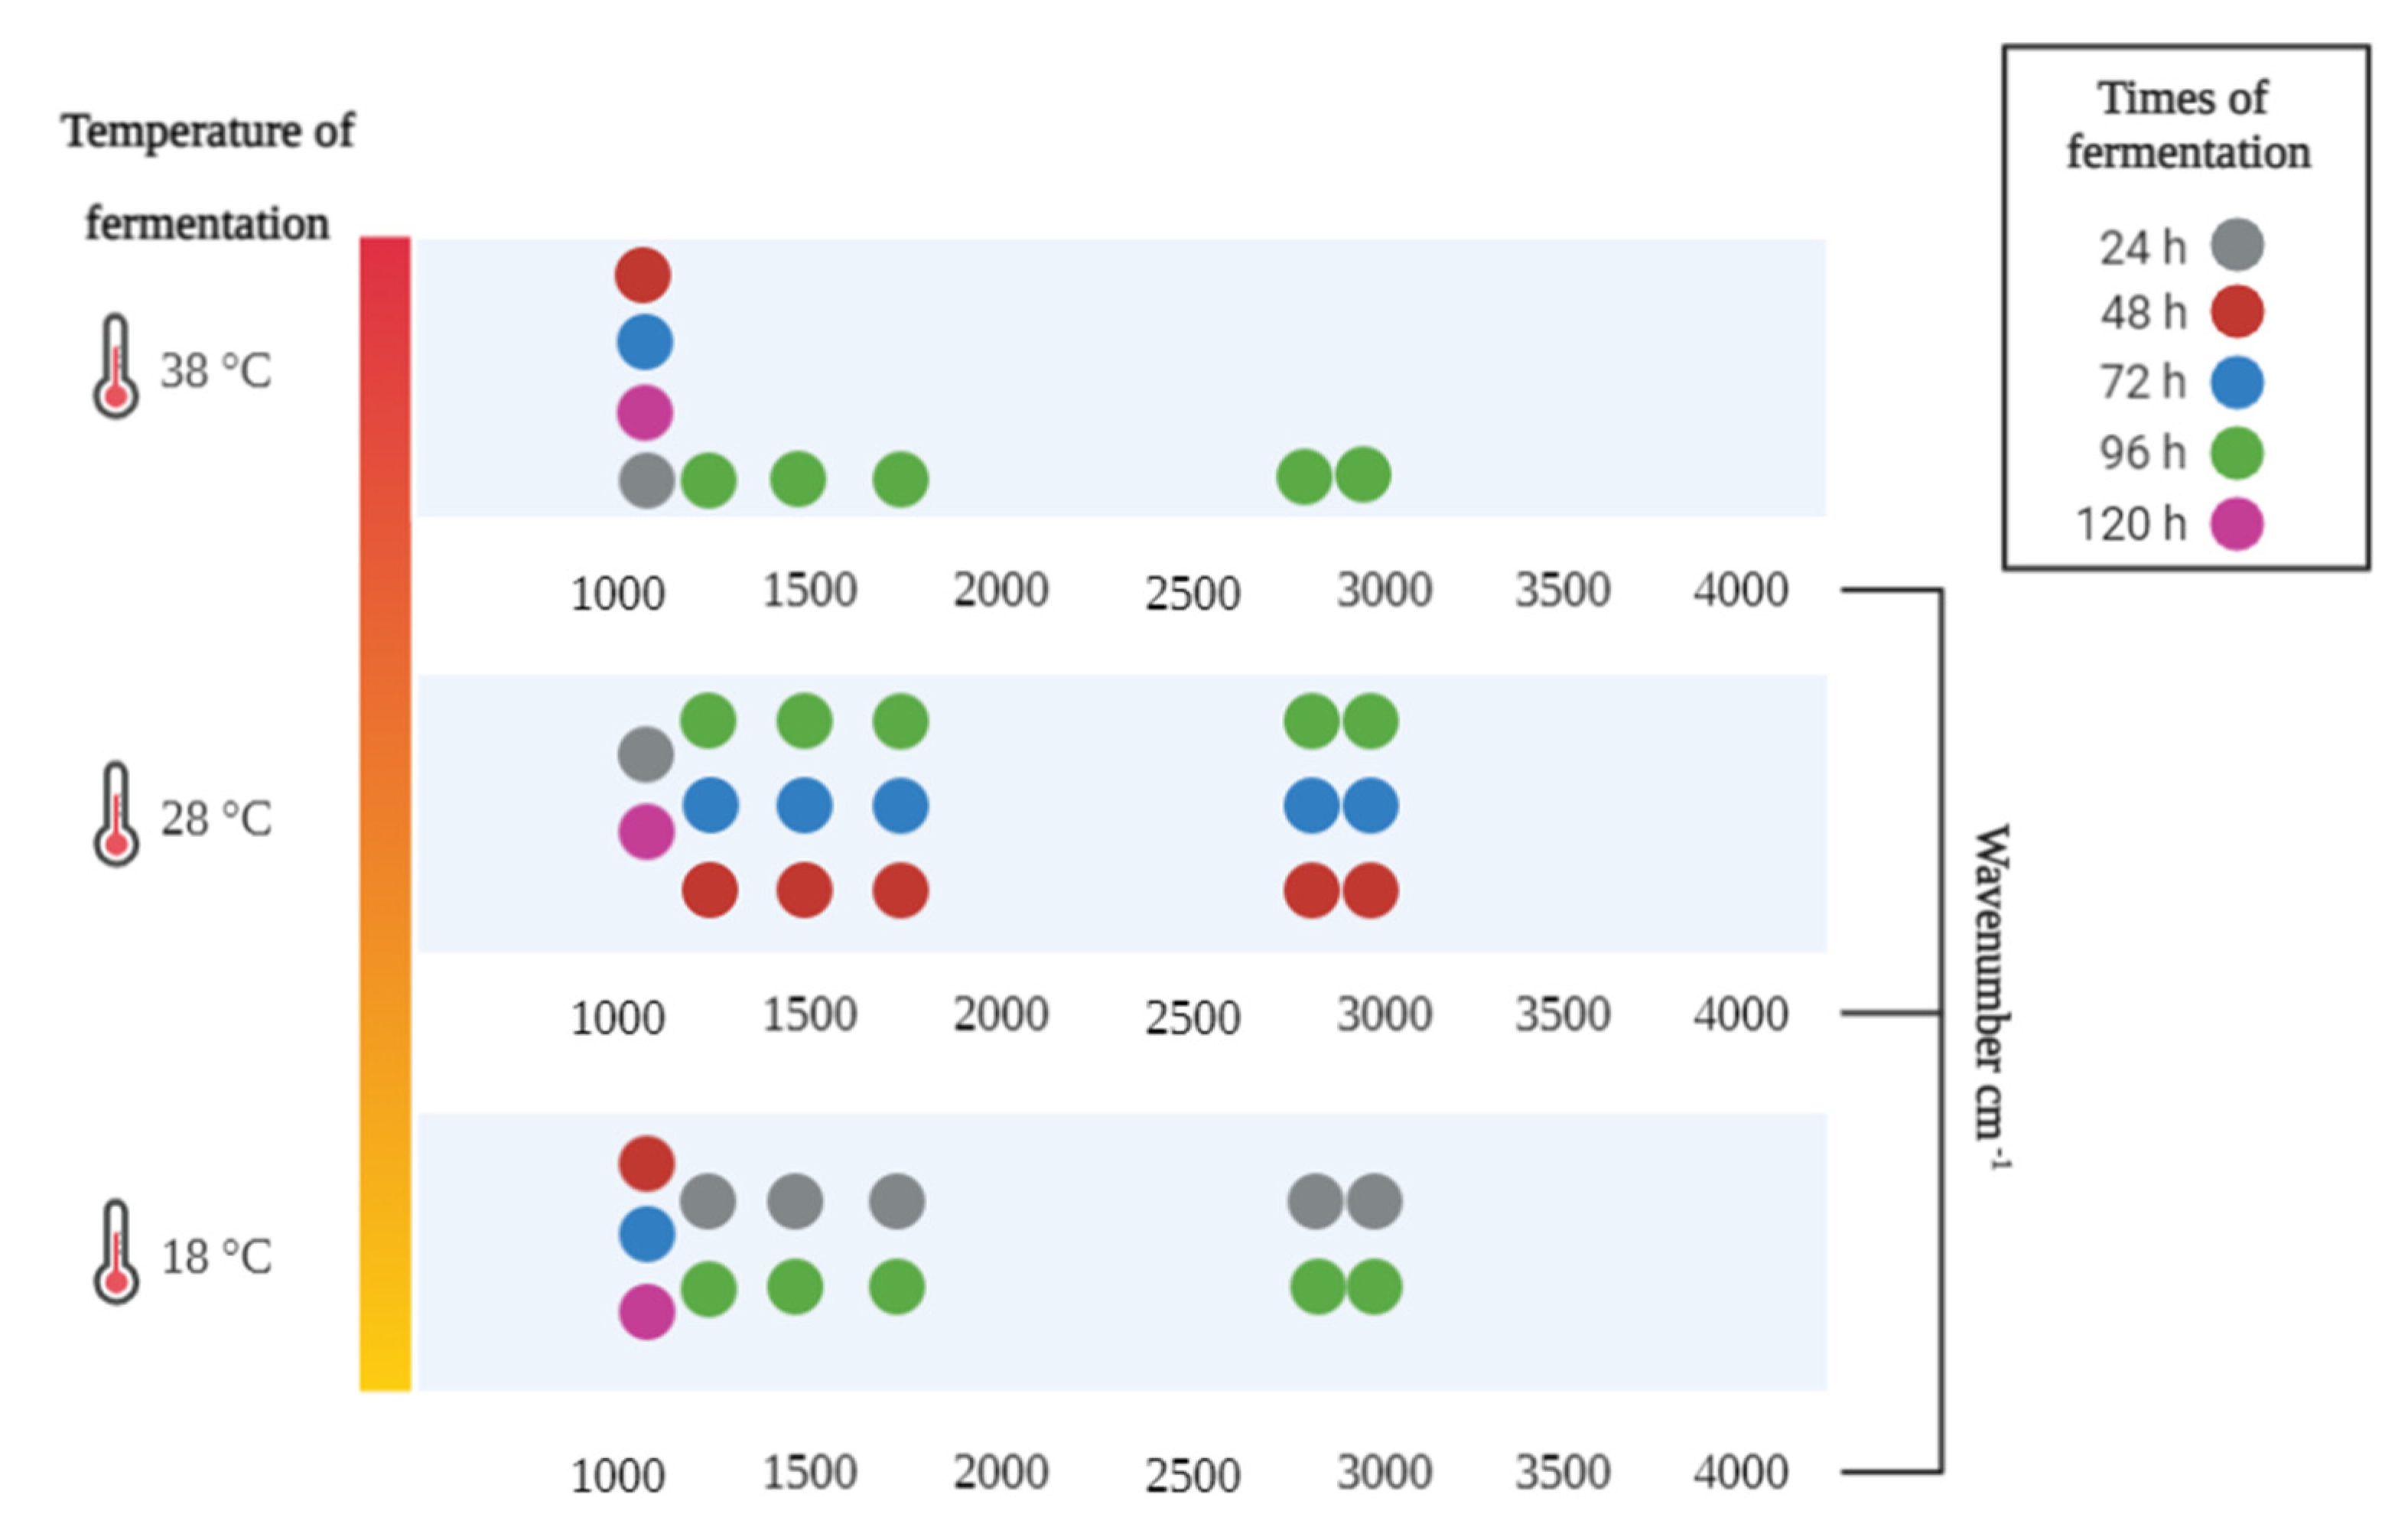
2.4. Infrared Analysis of Fermented Coffee Fruits

The chemical analysis of the toasted coffee samples was according to the methodology established by Oliveira et al. [19]. The infrared spectra in the middle region of the roasted and ground coffee samples were obtained in a Cary 630 FTIR model spectrometer from Agilent Technologies© (Santa Clara, CA, USA), in a diamond ATR (Attenuated total reflectance) accessory with a reflex angle of 45°, 1 mm in diameter, 200 μm of active area and approximately 2 μm of sample penetration depth, zinc selenide reflectance detector (ZnSe). The recorded spectrum was obtained with an average of 8 consecutive scans, with a resolution of 4 cm1 in the working range of 630 to 4000 cm1.

2.5. Statistical Analysis

The experiments with three temperatures, 18, 28, and 38 °C, were carried out in a completely randomized design with four replications, with treatments consisting of 5 fermentation times, 24, 48, 72, 96, and 120 h. Each experimental unit was represented by 4 kg of coffee.
For the statistical analyses, joint analyses of experiments were performed, and the interaction temperature and fermentation time were unfolded to study the overall score as a function of temperature within the fermentation time levels and the overall score as a function of the time within the temperature levels. The regression models were tested by the F test and the coefficients by the T-test, using the R program.
Analyses of main components were performed to group the coffees, regarding the sensory characteristics and nuances of the coffee, through visual examinations in graphic dispersions. The IBMSPSS© 28 software (New York, NY, USA) was used for the statistical analysis.
For infrared spectroscopy analysis, the original spectra were organized in a matrix, where each replica was considered a sample. All calculations were performed in the Matlab r2013a version software (MathWorks©, Natick, MA, USA). Prior to the application of chemometric tools to the data set, multiplicative scatter correction (MSC) correction was applied as a data processing resource. The data were centered on the mean and subsequently submitted to exploratory analysis using the multivariate technique of principal component analysis (PCA) [19].

3. Results

Significant linear functional relationships were observed between total score and temperature for fermentation times of 24, 72, and 96 h and the total score increased with fermentation temperature. No significant functional relationships were observed between total score and temperature for the other fermentation times. However, there is a trend of increase in the total score with the fermentation temperature (thermal gradient) for the other fermentation times. Significant linear relationships were observed between total grade and fermentation time for three fermentations, that is, the total grade increased with fermentation time.
Regression models * and ** Significant at 5% and 1% probability levels by the T (Regression equation) and F (R2) tests, respectively.
From the regression model obtained, all significant coefficients were included, generating a response surface, demonstrating as the fermentation time and temperature increase, the sensory score of the coffees is improved (Figure 2).
Regarding the sensory characteristics, strong correlations were observed between all the variables for the construction of the final sensory score, as shown by the acute angles formed between them (Figure 3a).
It is observed dispersion of the 15 coffees in the three temperatures and five fermentation times in relation to sensory characteristics (Figure 3b) based on the coordinates related to the first two main components, CP1 and CP2 (Dimensions), which formed four distinct groups and that the two components absorbed 94.61% of the variation existing in the original characteristics, CP1 (Dim1) with 91.96% and CP2 (Dim2) with 2.65%.
Figure 3b shows the formation of four groups, the groups being confirmed in Table 1, the blue group formed by the highest final score 83.25 refers to the temperature of 38 °C and fermentation time of 120 h, followed by the green group formed by the coffees that presented final notes of 82.16 and 81.85, referring to the temperature of 38 °C and fermentation times 72 and 96 h, respectively. The yellow and red groups are composed of the other coffees, with lower final notes. The dispersion of the groups formed by the best coffees (green and blue) (Figure 3b) are arranged in the same direction as the main component, according to the eigenvector graph (Figure 3a), confirming the strong correlation of sensory characteristics for the formation of the coffee quality.
In the infrared spectroscopy analysis, the spectra were submitted to multiplicative dispersion correction (MSC), with the objective of correcting the spectra so that they are as close to a reference spectrum (Figure 4).
The selection of the spectral region used in the construction of the models was based on the regions of greatest variance after the analysis of the original data. The selection of the spectral region used in the construction of the models was based on the regions of greatest variance after the analysis of the original data. The method applied showed, in the analysis of principal components, better separation of the experimental units, when classified by time (Figure 5a). In this case, the separation of the times of 96 h and 120 h stood out along the first principal component (PC1), the first being concentrated in the negative portion and the second in the positive portion of the graph. In the fifth principal component (PC5) the 72 h time was concentrated in the negative portion of the chart.
Looking at the loading chart in PC1 (Figure 5b) it is possible to identify that the regions with the greatest contribution to the separation of 96 h time were the regions around 2900 cm1, 2800 cm1, 1750 cm1, 1450 cm1 and 1200 cm1, while the region with the greatest contribution to the separation of the time of 120 h was the region around 1050 cm−1.
When setting temperatures of 18 °C, 28 °C and 38 °C as a function of fermentation times (Figure 6), it is observed that the 96 h time was responsible for covering the largest number of regions between the studied temperatures. However, there was no variation in the coverage of these regions due to the temperatures tested.
When the temperature of 38 °C was reached, the spectrum region around 1000 cm1 was responsible for covering the highest number of fermentation times, with the times of 24 h, 48 h, 72 h, and 120 h present in this region. However, for none of the tested temperatures, the presence of the fermentation time of 96 h for the region around 1050 cm−1 was observed. It is also observed that this region was the only one that contributed to the separation of the fermentation time of 120 h, not being noticed its presence in any other region of the spectrum for the tested temperatures.

4. Discussion

The results of the sensory analysis indicate the potential of carbonic maceration in the processing of C. canephora under different temperature settings and fermentation times (Table 1). This technique is known to significantly impact the profile of wines [11,12,13] and more recently in C. arabica [14].
The binomial time and temperature is considered vital in the fermentation process, as it directly affects the quality and chemical composition of the product [20]. In the principal component analysis, the formation of two groups composed of the best sensory results was noticed, the first being the treatment involving 120 h of fermentation and temperature of 38 °C, followed by the group associated with treatment with temperature of 38 °C and fermentation times 72 and 96 h.
These results suggest the improvement of the sensory profile in coffees subjected to a constant temperature of 38 °C and times higher than 72 h of fermentation. Contrary to what is observed in wine, where the determination of the ideal values of the time-temperature binomial are highly variable, and may reach 8 to 25 days of fermentation at temperatures from 20 to 30 °C, this study [21,22,23], suggests a smaller variation of these parameters for coffee, since the results found corroborate a study conducted in C. arabica [14], who also observed that the conditions of temperature, oxygen reduction and availability of CO2, were able to promote changes in the sensory profile, verifying a tendency to improve the extent to which the grains were submitted to increased time and temperature in the fermentation process.
The positive results observed by the increase in time and temperature suggest the emergence of specific conditions for the appropriate fermentation process. Regarding time, the CO2 enriched environment caused by the maceration process results in a shift from a respiratory metabolism to an anaerobic fermentative metabolism [12]. Thus, during the first hours, the saturated environment of CO2 incites intracellular fermentation, being performed by enzymes present inside the fruits, triggering alcohol production, the degradation of malic acid, pectinolytic and proteolytic phenomena, the formation of volatile compounds and the diffusion of phenolic compounds [11].
Only with the advance of time, the fruits at a given moment release their must in the fermentative environment, which will be enriched with sugars and with high potential for microbial growth [24] promoting favorable conditions for the occurrence of alcoholic fermentation of the must by yeasts and subsequently the malolactic fermentation by lactic bacteria. The diversity of compounds generated during these stages contributes to the organoleptic modulation of the product. Thus, the supply of short fermentation periods may not be sufficient for the microorganisms involved in these steps to act significantly.
Similarly, temperature is also considered an influencing factor during the fermentation process. In this regard, Santamaría et al. [24] observed that low temperatures promoted a slow progress in alcoholic fermentation during carbonic maceration, making it necessary a longer fermentation period, increasing the risk of the incidence of microorganisms limiting to quality. On the other hand, temperatures above 30 °C were essential for intracellular fermentation to take place optimally, corroborating the sensory results obtained in this study.
Another aspect to be considered about temperature is the ability of this parameter to select the microorganisms that will act in the fermentation process. This is because the various reactions related to this step occur in the presence of a group of specific microbial species [21], and the maintenance of this process is related to the establishment of this community [22].
Among the various aspects that control this composition, temperature is one of the factors that most contribute to the performance of metabolism, consequently of microbial communities, and in the fermentation process. The alteration of microorganisms in the face of temperature changes has been shown to have a significant effect on their metabolic activity and growth, as it affects the thermodynamic characteristics of the biochemical reactions in the process [25].
In general, these microorganisms operate at psychrophilic (<20 °C) [26], mesophilic (20–43 °C, although 35–37 °C is generally considered ideal) [27], and thermophilic (50–60 °C) temperature levels [26] In this study it is suggested that carbonic maceration operated at 38 °C selected the medium with mesophilic microorganisms, which were able to contribute with the best sensory products. A study conducted by Pereira et al. [28], where they investigated the microbial community present in anaerobic fermentation in coffee, identified the presence of the mesophilic genera Arthrobacter, Cellulosimicrobium, Enterobacter, Zymomonas, Acinetobacter, Bacillus and Leuconostoc. On another occasion, Ribeiro et al. [29] demonstrated that mesophilic bacteria showed significant pectnolytic activities in coffee fermentation. Thus, it is clear that this group of microorganisms are abundant and active in the fermentation process, making it necessary to systematically study species, biochemical mechanisms and interaction with other microorganisms important for the chemical and sensory modulation of coffee.
The principal component analysis revealed that all variables evaluated in the sensory analysis stood out, reinforcing the fact that coffee quality is achieved through the balance of sensory attributes, which can be directly influenced by a great diversity of chemical compounds that will interact during the roasting step of the beans. This complex of reactions will contribute to a coffee beverage with balanced sensory characteristics [30].
Although in infrared spectroscopy a clear trend of correlation with the sensory results obtained in this study was not observed, the analysis was able to point out important correlations with quality through the stretches observed in the regions of the infrared spectrum.
For the regions of the spectrum between 1200–1700 cm1, C–O bonds were identified in alcohols related to sugars and chlorogenic acids; C-N in amino acids- related amines; as well as CH3 and CH2 curves, aromatic chains and primary, and secondary amines [31,32].
The presence of these compounds in C. canephora, was previously highlighted by Fioresi [32], especially in coffees submitted to the fermentation process, constituting the technique as an important influencer in the production of these compounds for the species. Chlorogenic acids are compounds traditionally recognized for being important contributors to the flavor, color, and aroma of coffee during the roasting process. In addition, they are important formers of volatile phenolic compounds, which are directly related to the formation of aroma [33].
The relationship of the regions around 1200–1600 cm−1 with the formation of chlorogenic acids can contribute to elucidate the absence of these regions for the time of 120 h of fermentation. Some studies indicate that although C. canephora has higher levels of chlorogenic acid, its concentration can be altered through fermentative processes, and may be influenced by the time, temperature and microorganism involved in the process. About the fermentation time, was observed that the contents of caffeine and chlorogenic acid in C. canephora declined significantly as the fermentation time progressed, regardless of the inoculated microorganism [34] Along the same lines, other studies have observed significant reductions in chlorogenic acid content through fermentation [35,36].
The bands identified in the region around 1050 cm−1 are generally attributed to axial co formations, especially of quinic acid in coffees [35] Quinic acid is a compound that contributes to the presence of bitterness and astringency in coffee. During roasting, chlorogenic acids are degraded, promoting increased concentration of quinic acid [34].
The stretches found in the region around 1750 cm−1, may be related to carbonyl compounds found in roasted coffees and related to c=o bond stretch vibration or alyphatic lipids [35], whereas for coffees broken down in the region around 2900–2800 cm−1, the bands may be related to the asymmetric stretch of c-h bonds of the methyl group of the caffeine molecule (2800–3000 cm−1) [36].

5. Conclusions

The results of this study indicate that time and temperature parameters promote chemical and sensory changes during carbonic maceration in C. canephora.
There is an improvement in sensory quality as the times and temperatures employed have advanced. In this study, the treatment involving 38 °C and 120 h had a score of 83.25 points, in contrast to the score of 78.64 promoted by the shortest time (24 h) and temperature (18 °C) tested.
Infrared analysis revealed the presence of bands attributed to the formation of compounds commonly found in Coffea canephora, such as bands related to sugars and chlorogenic acids, reinforcing the potential of the technique for process discrimination.
Future studies should consider an intense investigation of the biochemical mechanisms influenced by the microorganisms involved during the fermentation process for the different times and temperatures studied. Furthermore, the application of more sensitive and informative analytical techniques may be useful to identify and discriminate the compounds produced by the different parameters tested during carbonic maceration.

Author Contributions

Conceptualization, W.d.S.G., L.L.P., F.L.P. and A.P.M.; Methodology, W.d.S.G., L.L.P., R.C.G. and E.C.d.S.O.; Validation, C.A.F. and T.R.M., Formal Analysis, R.C.G., E.C.d.S.O. and L.L.P.; Investigation, W.d.S.G., C.A.F., T.R.M., L.L.P., M.M.B.S. and C.V.G.; Data curation, E.V.R.d.C., L.L.P. and E.C.d.S.O.; Writing-original draft preparation, W.d.S.G., L.L.P. and F.L.P.; Writing—review and editing, W.d.S.G., L.L.P., F.L.P., V.L.J. and W.R.; Project administration, L.L.P., F.L.P. and A.P.M. All authors have read and agreed to the published version of the manuscript.

Funding

This research was funded by Sul Serrana of Espírito Santo Free Admission Credit Cooperative—Sicoob (23186000886201801), the Coordination for the Improvement of Higher Education Personnel—CAPES, the Research and Innovation Support Foundation of Espírito Santo—FAPES, the National Council of Scientific and Technological Development—CNPq, the Federal Institute of Espírito Santo for supporting the research through the PRPPG no. 12/2021—Research Productivity Program—PPP.

Data Availability Statement

Not applicable.

Acknowledgments

The authors would like to thank the Federal University of Espírito Santo—UFES, the Capixaba Institute for Research, Technical Assistance and Rural Extension—INCAPER. As well as the coffee grower, João Marré for the harvest and donation of the fruits for the experiment.

Conflicts of Interest

The authors declare no conflict of interest.

References

  1. Guimarães, E.R.; Leme, P.H.M.V.; De Rezende, D.C.; Pereira, S.P.; Dos Santos, A.C. The Brand New Brazilian Specialty Coffee Market. J. Food Prod. Mark. 2019, 25, 49–71. [Google Scholar] [CrossRef]
  2. Aquino, S.O.; Kiwuka, C.; Tournebize, R.; Gain, C.; Marraccini, P.; Mariac, C.; Bethune, K.; Couderc, M.; Cubry, P.; Andrade, A.C.; et al. Adaptive Potential of Coffea canephora from Uganda in Response to Climate Change. Mol. Ecol. 2022, 31, 1800–1819. [Google Scholar] [CrossRef] [PubMed]
  3. Campuzano-Duque, L.F.; Herrera, J.C.; Ged, C.; Blair, M.W. Bases for the Establishment of Robusta Coffee (Coffea canephora) as a New Crop for Colombia. Agronomy 2021, 11, 2550. [Google Scholar] [CrossRef]
  4. Partelli, F.L.; da Silva, F.A.; Covre, A.M.; Oliosi, G.; Correa, C.C.G.; Viana, A.P. Adaptability and Stability of Coffea canephora to Dynamic Environments Using the Bayesian Approach. Sci. Rep. 2022, 12, 11608. [Google Scholar] [CrossRef] [PubMed]
  5. International Coffee Organization. Available online: https://www.ico.org/new_historical.asp?section=Statistics (accessed on 3 July 2022).
  6. Alves, A.L.; Pessoa, M.S.; de Souza, P.E.N.; Partelli, F.L.; Moscon, P.S.; da Silva, E.C.; Guimarães, A.O.; Muniz, E.P.; Pinheiro, P.F.; Borém, F.M.; et al. Influence of Environmental and Microclimate Factors on the Coffee Beans Quality (C. Canephora): Correlation between Chemical Analysis and Stable Free Radicals. Agric. Sci. 2018, 9, 1173–1187. [Google Scholar] [CrossRef]
  7. Lemos, M.F.; Perez, C.; da Cunha, P.H.P.; Filgueiras, P.R.; Pereira, L.L.; Almeida da Fonseca, A.F.; Ifa, D.R.; Scherer, R. Chemical and Sensory Profile of New Genotypes of Brazilian Coffea canephora. Food Chem. 2020, 310, 125850. [Google Scholar] [CrossRef] [PubMed]
  8. Gamboa-Becerra, R.; Hernández-Hernández, M.C.; González-Ríos, Ó.; Suárez-Quiroz, M.L.; Gálvez-Ponce, E.; Ordaz-Ortiz, J.J.; Winkler, R. Metabolomic Markers for the Early Selection of Coffea Canephora Plants with Desirable Cup Quality Traits. Metabolites 2019, 9, 214. [Google Scholar] [CrossRef] [PubMed]
  9. Hameed, A.; Hussain, S.A.; Ijaz, M.U.; Ullah, S.; Pasha, I.; Suleria, H.A.R. Farm to Consumer: Factors Affecting the Organoleptic Characteristics of Coffee. II: Postharvest Processing Factors. Compr. Rev. Food Sci. Food Saf. 2018, 17, 1184–1237. [Google Scholar] [CrossRef] [PubMed]
  10. Haile, M.; Kang, W.H. The Role of Microbes in Coffee Fermentation and Their Impact on Coffee Quality. J. Food Qual. 2019, 2019, 4836709. [Google Scholar] [CrossRef]
  11. Tesniere, C.; Flanzy, C. Carbonic Maceration Wines. In Advances in Food and Nutrition Research; Elsevier: Amsterdam, The Netherlands, 2011; pp. 1–15. [Google Scholar]
  12. González-Arenzana, L.; Santamaría, R.; Escribano-Viana, R.; Portu, J.; Garijo, P.; López-Alfaro, I.; López, R.; Santamaría, P.; Gutiérrez, A.R. Influence of the Carbonic Maceration Winemaking Method on the Physicochemical, Colour, Aromatic and Microbiological Features of Tempranillo Red Wines. Food Chem. 2020, 319, 126569. [Google Scholar] [CrossRef] [PubMed]
  13. Zhang, Y.-S.; Du, G.; Gao, Y.-T.; Wang, L.-W.; Meng, D.; Li, B.-J.; Brennan, C.; Wang, M.-Y.; Zhao, H.; Wang, S.-Y.; et al. The Effect of Carbonic Maceration during Winemaking on the Color, Aroma and Sensory Properties of ‘Muscat Hamburg’ Wine. Molecules 2019, 24, 3120. [Google Scholar] [CrossRef] [PubMed]
  14. Brioschi Junior, D.; Carvalho Guarçoni, R.; de Cássia Soares da Silva, M.; Gomes Reis Veloso, T.; Catarina Megumi Kasuya, M.; Catarina da Silva Oliveira, E.; Maria Rodrigues da Luz, J.; Rizzo Moreira, T.; Grancieri Debona, D.; Louzada Pereira, L. Microbial Fermentation Affects Sensorial, Chemical, and Microbial Profile of Coffee under Carbonic Maceration. Food Chem. 2021, 342, 128296. [Google Scholar] [CrossRef] [PubMed]
  15. Pereira, L.L.; Guarçoni, R.C.; Pinheiro, P.F.; Osório, V.M.; Pinheiro, C.A.; Moreira, T.R.; ten Caten, C.S. New Propositions about Coffee Wet Processing: Chemical and Sensory Perspectives. Food Chem. 2020, 310, 125943. [Google Scholar] [CrossRef] [PubMed]
  16. Pereira, L.L.; Cardoso, W.S.; Guarçoni, R.C.; da Fonseca, A.F.A.; Moreira, T.R.; Caten, C.S. ten The Consistency in the Sensory Analysis of Coffees Using Q-Graders. Eur. Food Res. Technol. 2017, 243, 1545–1554. [Google Scholar] [CrossRef]
  17. Oliveira, E.C.d.S.; Carvalho Guarçoni, R.; Vinicius Ribeiro de Castro, E.; Gomes de Castro, M.; Louzada Pereira, L. Chemical and Sensory Perception of Robusta Coffees under Wet Processing. Coffee Sci. 2020, 15, e151672. [Google Scholar] [CrossRef]
  18. Maleke, M.; Doorsamy, W.; Abrahams, A.M.; Adefisoye, M.A.; Masenya, K.; Adebo, O.A. Influence of Fermentation Conditions (Temperature and Time) on the Physicochemical Properties and Bacteria Microbiota of Amasi. Fermentation 2022, 8, 57. [Google Scholar] [CrossRef]
  19. Guzzon, R.; Malacarne, M.; Larcher, R.; Franciosi, E.; Toffanin, A. The Impact of Grape Processing and Carbonic Maceration on the Microbiota of Early Stages of Winemaking. J. Appl. Microbiol. 2020, 128, 209–224. [Google Scholar] [CrossRef] [PubMed]
  20. Santamaría, P.; González-Arenzana, L.; Escribano-Viana, R.; Garijo, P.; López, R.; Sanz, S.; Gutiérrez, A.R. Difficulties Associated with Small-Scale Production of Carbonic Maceration Wines. Fermentation 2022, 8, 27. [Google Scholar] [CrossRef]
  21. Zhang, H.; Wang, L.; Wang, H.; Yang, F.; Chen, L.; Hao, F.; Lv, X.; Du, H.; Xu, Y. Effects of Initial Temperature on Microbial Community Succession Rate and Volatile Flavors during Baijiu Fermentation Process. Food Res. Int. 2021, 141, 109887. [Google Scholar] [CrossRef] [PubMed]
  22. Fernández-Rodríguez, J.; Pérez, M.; Romero, L.I. Semicontinuous Temperature-Phased Anaerobic Digestion (TPAD) of Organic Fraction of Municipal Solid Waste (OFMSW). Comparison with Single-Stage Processes. Chem. Eng. J. 2016, 285, 409–416. [Google Scholar] [CrossRef]
  23. Nie, E.; He, P.; Zhang, H.; Hao, L.; Shao, L.; Lü, F. How Does Temperature Regulate Anaerobic Digestion? Renew. Sustain. Energy Rev. 2021, 150, 111453. [Google Scholar] [CrossRef]
  24. Pereira, T.S.; Batista, N.N.; Santos Pimenta, L.P.; Martinez, S.J.; Ribeiro, L.S.; Oliveira Naves, J.A.; Schwan, R.F. Self-Induced Anaerobiosis Coffee Fermentation: Impact on Microbial Communities, Chemical Composition and Sensory Quality of Coffee. Food Microbiol. 2022, 103, 103962. [Google Scholar] [CrossRef] [PubMed]
  25. Ribeiro, L.S.; da Cruz Pedrozo Miguel, M.G.; Martinez, S.J.; Bressani, A.P.P.; Evangelista, S.R.; Silva e Batista, C.F.; Schwan, R.F. The Use of Mesophilic and Lactic Acid Bacteria Strains as Starter Cultures for Improvement of Coffee Beans Wet Fermentation. World J. Microbiol. Biotechnol. 2020, 36, 186. [Google Scholar] [CrossRef] [PubMed]
  26. Pinheiro, P.F.; Pinheiro, C.A.; Osório, V.M.; Pereira, L.L. Chemical Constituents of Coffee. In Quality Determinants in Coffee Production; Springer: Berlin/Heidelberg, Germany, 2021; pp. 209–254. [Google Scholar]
  27. Abreu, M.B.; Marcheafave, G.G.; Bruns, R.E.; Scarminio, I.S.; Zeraik, M.L. Spectroscopic and Chromatographic Fingerprints for Discrimination of Specialty and Traditional Coffees by Integrated Chemometric Methods. Food Anal. Methods 2020, 13, 2204–2212. [Google Scholar] [CrossRef]
  28. Fioresi, D.B.; Pereira, L.L.; Catarina da Silva Oliveira, E.; Moreira, T.R.; Ramos, A.C. Mid Infrared Spectroscopy for Comparative Analysis of Fermented Arabica and Robusta Coffee. Food Control 2021, 121, 107625. [Google Scholar] [CrossRef]
  29. Moreira, R.F.A.; Trugo, L.C.; De Maria, C.A.B. Componentes Voláteis Do Café Torrado. Parte II. Compostos Alifáticos, Alicíclicos e Aromáticos. Quim. Nova 2000, 23, 195–203. [Google Scholar] [CrossRef]
  30. Purwoko, T.; Suranto, S.; Setyaningsih, R.; Marliyana, S.D. Chlorogenic Acid and Caffeine Content of Fermented Robusta Bean. Biodiversitas J. Biol. Divers. 2022, 23, 902–906. [Google Scholar] [CrossRef]
  31. Lee, L.W.; Cheong, M.W.; Curran, P.; Yu, B.; Liu, S.Q. Modulation of Coffee Aroma via the Fermentation of Green Coffee Beans with Rhizopus Oligosporus: I. Green Coffee. Food Chem. 2016, 211, 916–924. [Google Scholar] [CrossRef] [PubMed]
  32. Gauthier, L.; Bonnin-Verdal, M.-N.; Marchegay, G.; Pinson-Gadais, L.; Ducos, C.; Richard-Forget, F.; Atanasova-Penichon, V. Fungal Biotransformation of Chlorogenic and Caffeic Acids by Fusarium Graminearum: New Insights in the Contribution of Phenolic Acids to Resistance to Deoxynivalenol Accumulation in Cereals. Int. J. Food Microbiol. 2016, 221, 61–68. [Google Scholar] [CrossRef] [PubMed]
  33. Assis, C.; Oliveira, L.S.; Sena, M.M. Variable Selection Applied to the Development of a Robust Method for the Quantification of Coffee Blends Using Mid Infrared Spectroscopy. Food Anal. Methods 2018, 11, 578–588. [Google Scholar] [CrossRef]
  34. Wei, F.; Tanokura, M. Chemical Changes in the Components of Coffee Beans during Roasting. In Coffee in Health and Disease Prevention; Academic Press: Cambridge, MA, USA, 2015; pp. 83–91. [Google Scholar]
  35. Wang, N.; Fu, Y.; Lim, L.-T. Feasibility Study on Chemometric Discrimination of Roasted Arabica Coffees by Solvent Extraction and Fourier Transform Infrared Spectroscopy. J. Agric. Food Chem. 2011, 59, 3220–3226. [Google Scholar] [CrossRef] [PubMed]
  36. Craig, A.P.; Franca, A.S.; Oliveira, L.S. Evaluation of the Potential of FTIR and Chemometrics for Separation between Defective and Non-Defective Coffees. Food Chem. 2012, 132, 1368–1374. [Google Scholar] [CrossRef] [PubMed]
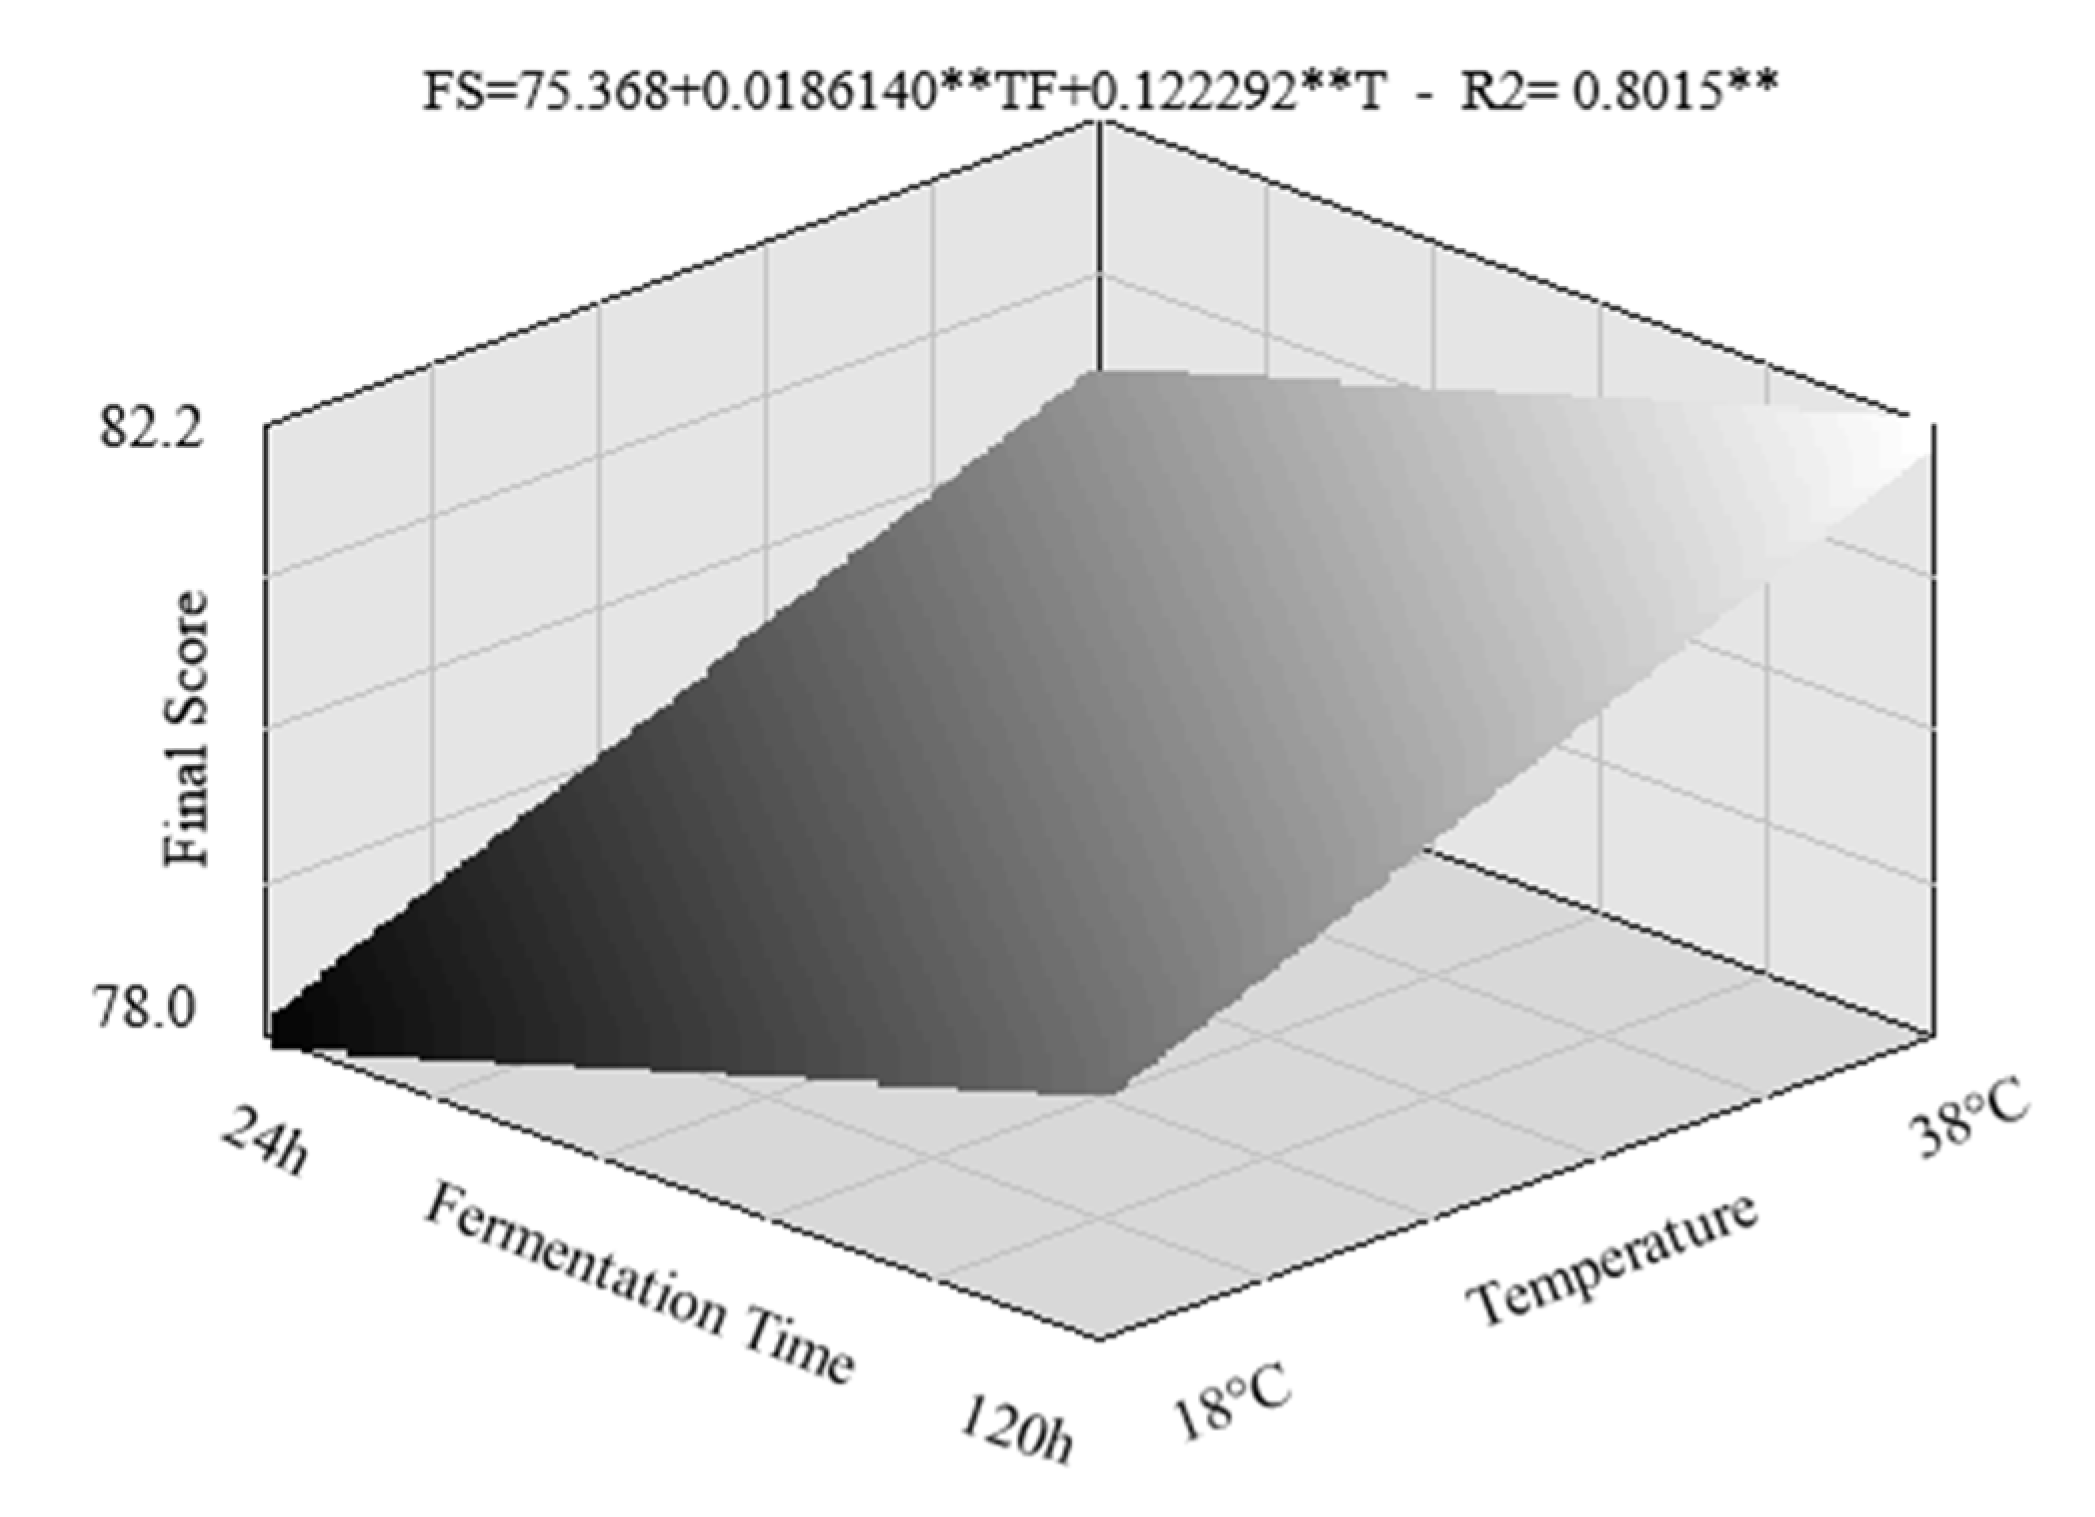
 [Green Version]
Figure 1. Carbonic maceration process.
Agronomy 12 02265 g001
Figure 2. Response surface of the final score of the sensorial analysis of the coffees submitted to the tested fermentation times and periods. FS = Final Score, TF = Fermentation Time, T = Temperature. Regression models * and ** Significant at 5% and 1% probability levels by the T (Regression equation) and F (R2) tests, respectively.
Agronomy 12 02265 g002
Figure 3. (a): Dispersion diagram (a) and Group categories (b) in relation to the first two main components, obtained from sensory characteristics, from coffees obtained from three fermentation times and 5 temperatures.
Agronomy 12 02265 g003
Figure 4. Multiplicative dispersion correction (MSC) of pre-treated infrared spectra of coffee samples submitted to the five fermentation times and three temperatures.
Agronomy 12 02265 g004
Figure 5. General PCA classified by fermentation time (a), loading graph highlighting the first and fifth main component (PC1 and PC5) (b).
Agronomy 12 02265 g005
Figure 6. Coverage of fermentation times (24, 48, 72, 96 and 120 h) along the spectral regions as a function of fermentation times (18, 28 and 38 °C).
Agronomy 12 02265 g006
Table 1. Regression models of the total score characteristic as a function of temperature and fermentation time and respective coefficients of determination R2. Regression models—* and ** Significant at 5% and 1% probability levels by the t and F tests, respectively.
Fermentation
Time (h)
Fermentation Temperature (°C)Regression EquationR2
182838
2478.6479.4280.20Y = 77.2292 + 0.0781250 ** X0.9999 **
4878.5179.7879.38--
7279.1080.4082.16Y = 76.2792 + 0.152604 * X0.9921 **
9679.0080.4081.85Y = 76.4229 + 0.142708 ** X0.9998 **
12079.3580.5583.25--
Regression EquationYY = 79.2421 + 0.0120486 ** XY = 78.7917 + 0.0357639 * X
R20.7776 *0.8790 *0.7563 *
Publisher’s Note: MDPI stays neutral with regard to jurisdictional claims in published maps and institutional affiliations.

