Article

Economic and Environmental Consequences of the ECJ Genome Editing Judgment in Agriculture

1
Institute of Farm Economics, Thünen Institute, Bundesallee 63, 38116 Braunschweig, Germany
2
Federal Office of Consumer Protection and Food Safety, Mauerstraße 39–42, 10117 Berlin, Germany
3
International Agricultural Trade and Development Group, Faculty of Life Sciences, Humboldt-Universität zu Berlin, Hannoversche Straße 27, 10115 Berlin, Germany
*
Author to whom correspondence should be addressed.
Agronomy 2021, 11(6), 1212; https://doi.org/10.3390/agronomy11061212
Submission received: 15 May 2021 / Revised: 7 June 2021 / Accepted: 12 June 2021 / Published: 15 June 2021
(This article belongs to the Special Issue Precision Genome Editing for Plant Breeding)

Abstract

:
Genome-edited crops are on the verge of being placed on the market and their agricultural and food products will thus be internationally traded soon. National regulations, however, diverge regarding the classification of genome-edited crops. Major countries such as the US and Brazil do not specifically regulate genome-edited crops, while in the European Union, they fall under GMO legislation, according to the European Court of Justice (ECJ). As it is in some cases impossible to analytically distinguish between products from genome-edited plants and those from non-genome-edited plants, EU importers may fear the risk of violating EU legislation. They may choose not to import any agricultural and food products based on crops for which genome-edited varieties are available. Therefore, crop products of which the EU is currently a net importer would become more expensive in the EU, and production would intensify. Furthermore, an intense substitution of products covered and not covered by genome editing would occur in consumption, production, and trade. We analyzed the effects of such a cease of EU imports for cereals and soy in the EU agricultural sector with the comparative static agricultural sector equilibrium model CAPRI. Our results indicate dramatic effects on agricultural and food prices as well as on farm income. The intensification of EU agriculture may result in negative net environmental effects in the EU as well as in an increase in global greenhouse gas (GHG) emissions. This suggests that trade effects should be considered when developing domestic regulation for genome-edited crops.

1. Introduction

New plant breeding techniques have recently been developed, allowing for the targeted modification of DNA sequences in a site-directed manner. These techniques can be subsumed under the term “genome editing” and comprise a set of different molecular approaches (Side directed nucleases (SDN), including Meganucleases (MN), Zinc-Finger Nucleases (ZFN), Transcription Activator-like Effector Nucleases (TALENs), and Clustered Regularly Interspaced Short Palindromic Repeats/ CRISPR associated protein (CRISPR/Cas), including SDN-1, SDN-2, and SDN-3; 2: Oligonucleotide-directed mutagenesis (ODM); 3: base editing (BE)) [1]. Among them, CRISPR/Cas is the genome editing system that is discussed the most and has received significant attention. Compared to conventional breeding methods as well as other genome editing approaches, CRISPR/Cas holds the advantage of being low in cost and easy to apply [2]. According to [3], genome editing can help to achieve several breeding goals. First, it can reduce the time needed to breed a new crop variety in conventional breeding, decreasing 7–25 years to 2–3 years. Thus, resistance to pests, diseases, and chemical weed control can be achieved faster. Another target is plant resistance to abiotic stress such as drought, cold, salinity, and water and nitrogen deficiencies. Therefore, genome editing has the potential to support the decrease of food waste and the enhancement of nutritional traits. Most applications of genome editing that are entering the market soon selectively modify one or more base pairs without adding foreign DNA to the genome (SDN-1). The SDN-1-induced spontaneous repair of DNA can lead to mutations, causing gene silencing, gene knockout, or changes in gene activity [2]. Research on market applications has been performed in 99 different studies, with 28 different plants. Most applications have been carried out in rice (rice is an important crop but also a model plant), followed by tomato, maize, potato, wheat, soybean, and rapeseed [1]. Table A1 gives an overview of the relevant crops and their characteristics [1,4]. As indicated, most of the traits are SDN-1-based. In the US, some farmers have already started to cultivate genome-edited crops [5]. The Joint Research Center (JRC) of the EU Commission [6] recently presented a review of market applications for new genomic techniques.
For some time, it was unclear as to how genome-edited crops would be regulated in the EU. On 25 July 2018, the ECJ concluded that “organisms obtained by mutagenesis are GMO” [7] and thus fall within the scope of Directive 2001/18/EC, including all legal obligations which arise from this directive. According to this judgment, all traits resulting from SDN-1 lead to a GMO, whereas the same traits, originating from natural or induced undirected mutagenesis are exempted from this rule. Consequently, food and feed that either consist of, contain, or have been produced from GMOs must seek approval for placement on the market in the EU, according to Regulation (EC) No. 1829/2003. A detailed description of the approval procedure can be found in [8]. Beyond that, Regulation (EC) No. 1830/2003 [9] demands traceability and labelling of genetically modified food and feed. Traceability should facilitate both the withdrawal of products with unforeseen adverse effects on human and animal health and the environment, as well as enable environmental monitoring. In addition, it is essential to ensure consumers’ freedom of choice through accurate labelling. All products consisting of or containing GMOs must be labelled accordingly. Admixtures of approved GMOs must also be labelled if these traces are adventitious or technically unavoidable and exceed the threshold of 0.9%. The authors of [10] point out that “classic GMOs” are detectable, identifiable, and quantifiable by PCR methods. This assumption is an integral part of the European GMO regulatory framework. With regards to genome editing, especially SDN-1, this paradigm has shifted. While the detection of a certain sequence mediated by genome editing might be possible if the specific sequence is known, the identification of its origin might be impossible if no further information is given [10]. Especially for commodities that normally consist of a mixture of different varieties and origins as well as processed food or feed, identification of origin is extremely challenging. Currently, Switzerland, Norway, and the UK are considering new laws that facilitate the approval of genome-edited crops [11]. Outside the EU, several countries hold a different view on the regulation of genome-edited products. This may also be due to the fact that GMOs in general have a different history of being regulated right from the start. Unlike in the EU, where GMO legislation has a strong focus on the production process, risk assessment in the US and Canada is predominantly based on the final product [12]. In these cases, there was no need to adapt the regulatory systems already in place [5]. For some countries, the definition of an LMO (“living modified organism”) from the Cartagena Protocol on Biosafety (Art. 3, g) draws the line between a GMO and a non-GMO. Since SDN-1 does not introduce new genetic material into the existing genome, organisms produced by SDN-1 do not fall under the definition of the protocol and are thus commonly regarded as similar to those organisms produced by conventional breeding techniques [13]. Countries such as Argentina, Australia, Brazil, Israel, and Japan have already explicitly excluded SDN-1-produced organisms from GMO regulation [5,13,14,15]. Many other countries are currently debating the status of genome-edited crops. For China, which holds around 60% of all CRISPR patents in agriculture and is a large importer of agricultural commodities, there are divergent views with regard to which direction the development of genome editing regulation might evolve [5,11,16]. A specific regulation is not yet in place.
With the launch of genome-edited varieties, farmers will adopt and spread this technology, particularly in non-regulated markets. This increases the probability of unapproved GMOs entering the European Union. According to the zero-tolerance policy in the EU, these products must be withdrawn from the market [17]. In the past, trade disruptions due to regulatory asynchronicity have been reported in the case of GMOs. The authors of [18] define regulatory asynchronicity as a situation in which a traded GMO is approved in one country but not (yet) in another country. According to [19], the Syngenta-developed maize variety Agrisure VipteraTM (MIR162) was approved in the US in 2010 and commercially planted in 2011. Canada, Japan, Australia, Brazil, Mexico, New Zealand, South Korea, Russia, and Taiwan approved imports of this maize. China planned to approve it but did not do so before 2014. Due to the presence of the MIR162 trait in US shipments, China started to reject maize imports because of its zero-tolerance policy. As a result, maize exports from the US to China dropped by 85%. In the context of this disruption in international trade, several lawsuits have been documented. Due to the lack of approval for MIR162 in China and the country’s zero-tolerance policy for unapproved GMOs, the trading company, Bunge, refused any MIR162 maize at their facilities until approval had been given. In August 2011, the breeding company, Syngenta, sued Bunge for damages due to profit loss and harm of reputation. Shortly before Chinese approval was given in 2014, Syngenta and Bunge agreed to dismiss the litigation without paying any fees or costs to each other [20]. In 2014, Cargill filed a lawsuit against Syngenta for having marketed GM maize in the US, which had not yet been approved for market sale in China. Shipments from Cargill were stopped at the Chinese border. A total of 1.4 million tons of maize were affected and damage costs amounted up to USD 90 million [21]. Moreover, in 2014, the major US exporter of livestock feed products, Trans Coastal Supply, sued Syngenta for its loss of more than USD 41 million resulting from the lack of approval of MIR162 in China [22,23]. In 2015, Syngenta sued Cargill and ADM over losses that US farmers were said to have suffered from rejections of boatloads of MIR162 to China [24]. This long-lasting dispute over MIR162 shows that regulatory asynchronicity can be a severe hurdle in international trade and may cause considerable economic damage to breeders, farmers, and traders along the value chain. An economic assessment of the MIR162 case carried out by the US-American National Grain and Feed Association (NGFA) found economic losses from USD 1 billion up to USD 2.6 billion for the US value chain [25]. Given their experience with rejected shipments of GMOs in the past, we can presume that traders doing business with the EU will stop shipping products for which they cannot guarantee the use or non-use of genome editing in the breeding process. Consequently, international trade will not only be confronted with the already existing regulatory asynchronicity, but also with regulatory divergence due to different legal interpretations of the GMO definition.
For the specific case of non-detection and non-identification of origin, genome-edited crops can be classified as credence goods [26] and might thus require a functioning identity preservation system [27] to enable international commodity trade. For instance, identity preserved production and marketing (IPMM) is frequently applied in the grain and oilseed industry to facilitate the production and delivery of a certain quality along the entire value chain [28]. This concept could be transferred to the commodity trade of genome-edited crops. However, as [29] have already pointed out, identity preservation entails additional costs, which can only be recovered through higher market prices for specific value-added products. In general commodity trade, where different batches from different sources are usually mixed along the production chain, this concept is deemed unlikely to work economically.
With a special focus on international trade, [14] discuss the option of establishing an international public registry to accommodate divergent national policies on genome-edited crops. This database should cover all biotech products that are placed on the market, including those applications that fall under GMO regulation in some countries but are exempted in others. Every country would thus be enabled to spot respective products, if prescribed by national legislation. However, it is not clear how countries should be encouraged to voluntarily give information on products that are not regulated within their national boundaries. Beyond that, even if a database could tackle the challenge of detection, identification issues might remain unsolved.
Given this background, the aim of this article is to analyze the economic and environmental consequences of a cease of imports of agricultural products into the EU, where genome-edited varieties are close to market introduction. Based on the latest communication from the EU Commission [6] on potential crops, which are already or soon to be on the market, an import cease might become relevant for soy products and cereals (encompassing soft wheat, durum wheat, rye and meslin, barley, oats, maize, and other cereals), and maize. For a detailed list, we also refer to Table A1 in the Appendix A. In 2019, the EU’s net imports of soy products amounted to around 90% of its domestic use, while net imports for cereals were more balanced [30]. An import cease in soy products would therefore have different market effects. In particular, the large share of soy imports for pig and poultry fattening, and to a lesser extent, for other animals will result in intense substitution processes in feed component demand. We simulate the effects of such a cease of imports with the comparative static agricultural sector equilibrium model CAPRI, which explicitly accounts for feed input and output relations, and also for the interaction of biofuels with feedstock markets, substitution in human demand, and bilateral trade flows. In Section 2, we introduce the economic model used to analyze the economic consequences. Section 3 discusses the implementation of the scenario. In Section 4, we present and discuss economic and environmental results and provide a conclusion.

2. The Economic Impact Model and Scenario

We apply a comparative static partial equilibrium model for the agricultural sector, CAPRI, which was developed to perform policy and market impact assessments from the global to the regional level. The core of the model is based on the linkage of a European-focused supply module and a global partial equilibrium market module [31].
The supply module covers the EU, Norway, the Western Balkans, and Turkey. This module represents all agricultural production activities, related output generation, and input use at the regional level (NUTS2). Each mathematical programming model optimizes the farm income under restrictions that are related to land balances, including a land supply curve, nutrient balances, nutrient requirements of animals, and if applicable, quotas and set-aside obligations. The decision variables include crop acreages, total land use, herd sizes, fertilizer application rates, and feed mixes. The allocation response depends primarily on nonlinear terms in the objective function that are either econometrically estimated [32] or derived from exogenous supply elasticities. The interaction between animal and crop production is established via the feed module, as part of the supply module. It defines how many kg of certain feed categories or single feed stuffs are used per animal, depending on its prices. It thus accounts for the nutrient requirements of animals. Total feed use might be produced regionally (grass, fodder root crops, silage maize, other fodder from arable land) or bought from the market at fixed prices. These prices, however, change with each iteration of the market module.
The global partial equilibrium market module is a spatial, non-stochastic, global multi-commodity model for approximately 50 primary and processed agricultural products. It covers approximately 80 countries or country blocks. It is defined by a system of behavioral equations that represent agricultural supply, human and feed consumption, multilateral trade relations, feed energy and land as inputs, along with the processing industry, all of which are divided into commodity and geographical units. On the demand side, the Armington approach [33] assumes that products are differentiated by origin, thereby allowing the simulation of bilateral trade flows and related bilateral and multilateral trade instruments, including tariff-rate quotas. This submodule delivers the output prices used in the supply module, allows for market analyses at the global, EU, and national scales, and includes a welfare analysis for the agricultural sector. The supply curve of the market model representing the EU is adjusted to the aggregated supply of the NUTS2 regional programming models during each iteration. This is repeated until an equilibrium is found. The model also includes a market representation for biofuels and biofuel feedstocks [34], where ethanol and biodiesel are endogenously determined. Biofuel supply and feedstock demand react to biofuel and feedstock prices and at the same time, biofuel demand and bilateral trade flows react flexibly to biofuel and fossil fuel prices.
We develop two scenarios for the year 2030: A baseline and a cease of EU imports from all countries outside the EU. The baseline may be interpreted as a projection in time covering the most likely future development of the agricultural sector under status-quo policies and including all future changes already foreseen in the current legislation. The baseline accounts for trends in population growth, inflation, GDP growth, technological progress such as yield growth, and increasing feed and fertilizer efficiency. The purpose of the baseline is to serve as a comparison point for counterfactual analysis, which, in our case, is the cease of imports scenario. The cease of imports scenario uses all specifications of the baseline and additionally includes the cease of imports of all cereal products, including maize, soybeans, soy cakes, and soy oil. This is technically implemented by prohibitive tariffs for these products that increase the import prices by a factor of eight so that the price of the imported commodities becomes prohibitively high. As this is a partial equilibrium model, there are no increases in tariff incomes and therefore no distortions caused by a change in government budget. We consider that the UK is not part of the free trade area of the EU.
As an alternative to our formulation of a complete cease of imports, we also allowed further imports from regions with regulations similar to the EU. Simulation tests with such a scenario specification revealed that a cease of imports solely from countries such as the US, Brazil, and China triggers EU import flows to shift to origins such as Russia and African countries, which would then create a strong incentive to import from non-regulated origins and in turn, allow these countries to export their domestic production to the EU. Such a trade shift would not reduce the risk for trading companies, as the imports from Russia and African countries will potentially be contaminated with genome-edited varieties in the medium term due to the low standards of seed replication schemes and the natural spread of certain crops. Consequently, we applied the scenario for all countries, independently of the regulatory status for genome editing.

3. Results and Discussion

This section describes and discusses the effects of the scenario compared to the baseline in the year 2030. In the first subsection, we look at economic results. We first analyze EU market balances (Section 3.1), finding substantially reduced imports and exports and increased domestic production. Secondly, we look at EU market prices and find a scarcity of soy and soy by-products in the EU. Thirdly, we analyze the substitution processes in feed rations, and then finally, we look at changes in the origin of trade flows. We also present the welfare effects for the EU. In the Section 3.2, we look at land use changes and environmental effects. We show that mainly fallowed land, land used for fodder maize and forestry, would be used for the production of soy and pulses in the EU. We also present land use changes in other regions of the world. In addition, we discuss land use changes by crop and fodder type in the EU at the regional level and the increase of nitrogen surplus. We conclude the environmental section by showing the impact on total global greenhouse gas emissions created by the agricultural sector. In Section 3.3, we present a sensitivity analysis with respect to different model assumptions.

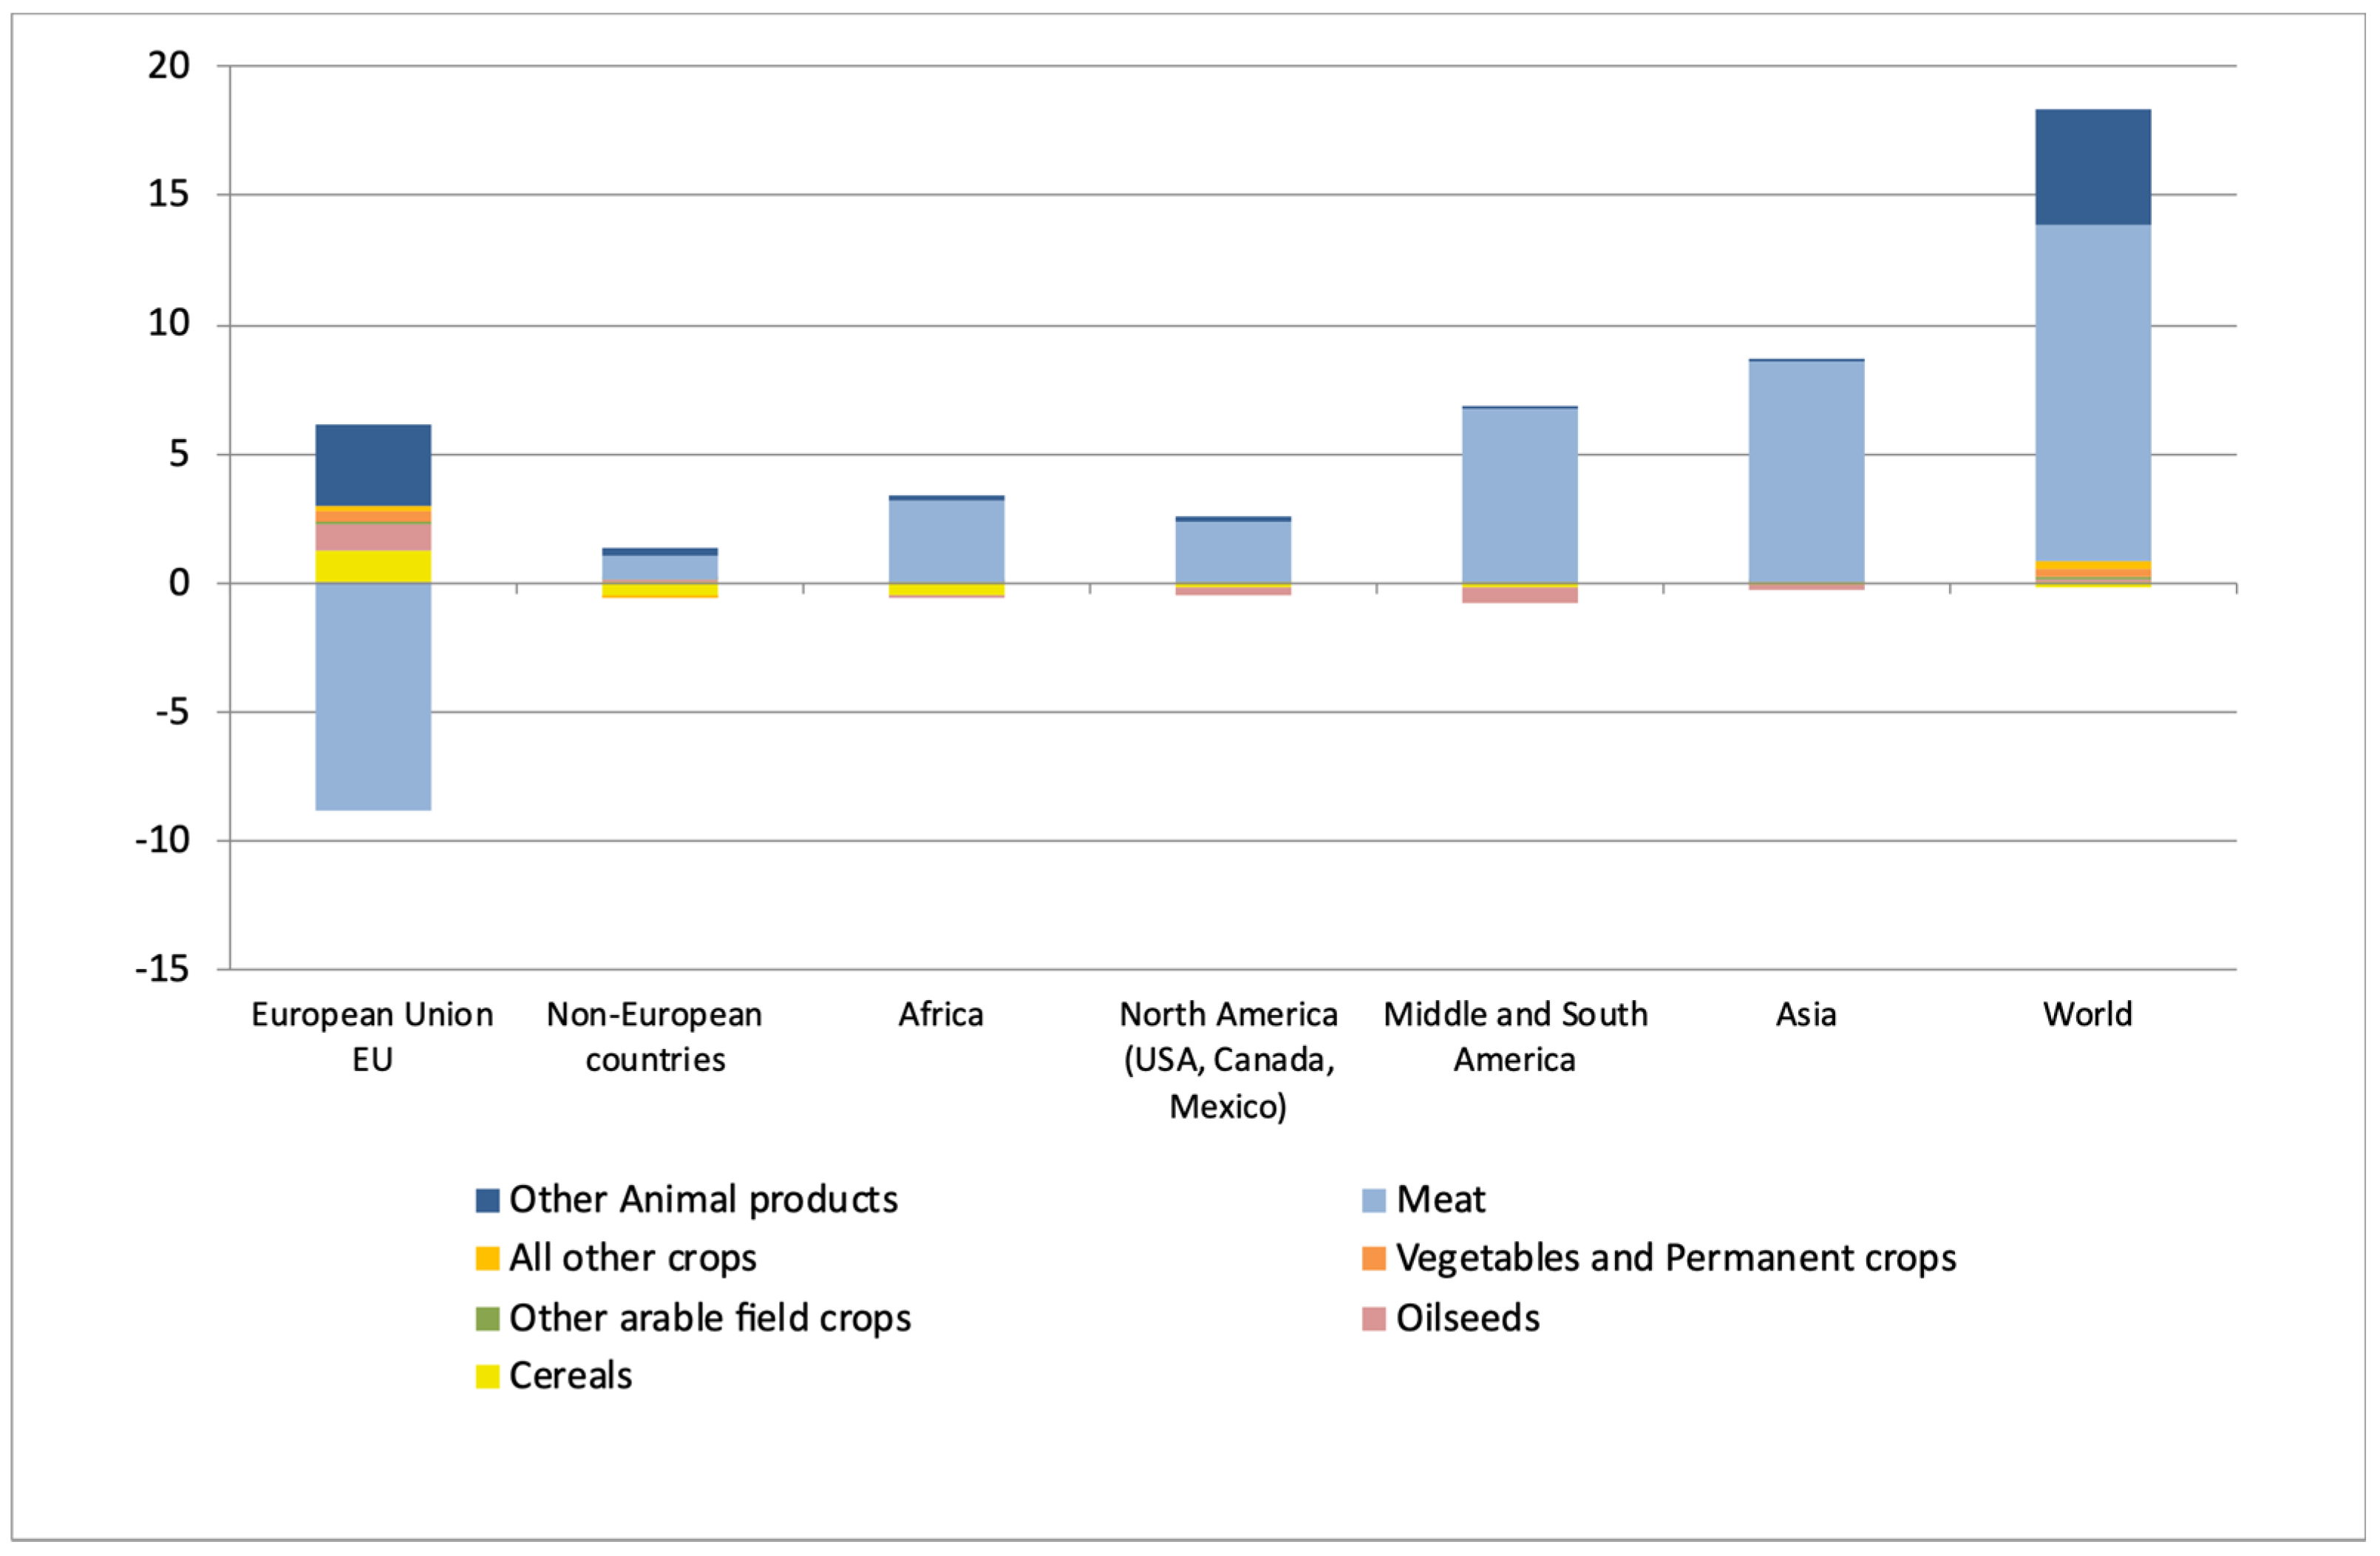
3.1. Economic Analysis

In Figure 1, imports of cereals disappear from the scenario due to the cease of imports. Total market volume decreases for wheat by −3%, for maize by −14%, for other cereals by −25%, and for barley by −2%. Additionally, EU production for the presented crops and animals increases and exports decline to compensate for the decline in imports of maize and other cereals. For all presented products in Figure 1, imports decline by −61%. Production (−2%) and import (−1%) of sugar decline slightly (total market volume −2%), driven by a decline in use as bioethanol feedstock (−2%). Human consumption remains almost unchanged (+1%).
Note: Figure 1 and Figure 2 present the EU results. On the left the baseline and on the right the scenario (and in brackets within the scenario, the percentage change to the baseline) are presented. The flow chart reads as follows: EU production and the imports into the EU are depicted on the left, and its usage (feed, human consumption, processing, and exports) on the right-hand side. Each color represents a sub-group of products. Values do not account for EU intra trade and do not include the UK.
In Figure 2 we observe that imports are reduced by −56%. At the same time, domestic production for pulses and soybean increases. Export (−48%), feed use (−29%), human consumption (−3%), and processing (−18%) decline.
A more detailed analysis is possible with Table 1 and Table 2, where the market balance is also presented by product and not as aggregates as in the flow charts above. Production in the EU increases for raw products subject to a cease of imports, as well as for close substitutes. These are soybean (265%), followed by grain maize (5%), other cereals (9%), and pulses (15%). This is triggered by increased domestic prices. In addition, poultry (−10%) and pork meat (−9%) production declines, given higher prices for feed concentrates. In total, exports from the EU are reduced for all products, except sugar. An amount of 2.1 million tons of wheat (+5%) additionally enter the feedstock for animals. Likewise, fish products (including meal) (+5%) are imported and used to substitute the protein from soy. (Fish comprises other aquatic products freshwater fish, and saltwater fish. We do not explicitly distinguish between fish and fish meal products, but in case it enters feed use, it is assumed to be fish meal.) The reduction of human consumption of pork and poultry meat is small (−1%). In the baseline, 18% of the net production of both poultry and pork meat is exported. In the import cease scenario, most of the production decline is met by a decline in exports, so that human consumption decreases by only 1%.
As imports of soy cake and soybeans are reduced to zero, soybean production in the EU increases by 265% to substitute for the imported soybeans and soy cake. Meanwhile, imports of rapeseed (23%), sunflower cake (79%), and pulses (55%) increase to fill the protein gap. Due to the ceased imports of soy cake, its use for feed decreases by 73%, as depicted in Table 2, and is substituted by an increased use of rapeseed cake (+15%) and sunflower cake (+40%).
Note: Table 1 and Table 2 report changes to the baseline in 1.000 tones, as well as in % changes. Positive values indicate increases, negative values indicate a decrease compared to the baseline. Values do not account for EU intra trade and do not include the UK.
The missing soy imports also cause a reduction in human consumption, processing, and feed use. Human consumption of soy oil decreases strongly (−15%) and is substituted by an increase in sunflower oil (+4%), palm oil (+6%), and rapeseed oil (+4%). The reduction in the availability of soy as protein-rich feed results in increasing costs of production and hence higher market prices for pork, poultry, milk, cheese, and beef; hence, a decline in consumption of about one percent. We find an interaction between the demand for animal feed and for biofuel feedstock. Protein for fodder becomes scarcer. Among the substitutes are Dried Distillers Grains (DDG), which are high in protein and are a by-product of bioethanol production from cereals. The price of DDG increases by +33% in the EU because of the increase in demand, which leads to an increase in the use of cereals in bioethanol production (+3%). The production of DDG increases by 2%. Sugar as a feedstock for bioethanol is substituted by grains as it does not produce DDG as a by-product. The reduced demand for sugar results in a 2% decline in EU production. Bioethanol production in the EU increases by 1%. At the same time, imports of bioethanol fall (−1%) and exports increase (1%). Biodiesel production declines by −2% due to the decline in soy oil imports, which is mainly substituted by rapeseed oil (+4%), sunflower oil (+5%), and palm oil (+13%).
The impact on the fodder ratios is shown in Table 3. For ruminants, protein-rich fodder (including soy cake and/or maize silage) is substituted by protein from grass silage and fodder from arable land (non-permanent grass). As the protein content of grass is higher than that of maize silage, maize silage is reduced. DDG and other protein cakes substitute within the category “protein-rich feed”, containing a high share of soy.
Under this scenario, producer prices in the EU increase. We present price changes of more than one percent in Table 4. Prices increase in all regions of the world, including the EU, due to reduced EU exports and increased EU imports, for rapeseed, sunflower seed, pulses, and pork caused by the substitution of soy products. This applies to sunflower seeds (2–11%), rapeseed (3–13%), and pulses (11–>1%). Additionally, meat becomes more expensive. Pork meat prices increase (1–17%).
The price of other cereals increases in the EU. At the same time, exports of other cereals from the EU to non-EU markets decline and consequently, prices in non-EU Europe also decline (−2%). South, Middle, and North America, which export other cereals to the EU in the baseline also encounter price declines (from −2 to −6%).
Significant price increases are observed for soy in the EU (+169% for seed, +59% for oil, and +162% for cake). This creates an incentive to increase soy production in the EU. For Middle and South America, which export soy to the EU in the baseline, declining prices are the consequence (−15% for cake and −3% for soybeans). For soy oil and cake, prices also drop in other regions, including North America, which is among the EU’s main trading partners for soy products in the baseline. In the EU, the sugar price and the bioethanol price decline by less than 1%, a consequence of the increased feed demand for DDG. Higher bioethanol production leads in turn to declining prices and to a substitution of biodiesel to fulfil the biofuel mandates of the EU. For the other products, prices increase as EU demand increases for substitutes to the products covered by the import cease.
In general, we find an increase in imports of non-soy oilseeds and protein crops, which are not covered by the scenario, as they substitute for the former soy imports (Table 5). In addition, we find imports of animal products increasing slightly, as their domestic production in the EU gets less competitive. The larger the absolute quantities imported from a region into the EU, the larger the absolute change of imports from this region is in the simulation. The increase in imports of sunflower cake mainly stems from Middle and South America and non-EU Europe, while the increase in imports of rapeseed is mainly due to an increase in the imports from North America and non-EU Europe. The increase in the import of pulses come from North America and non-EU Europe.
The welfare analysis for the EU comprises changes in consumer and producer surplus as well as budgetary effects. Consumer welfare is measured based on the money metric concept, linked to the indirect utility function. On the producer side, gross value added (GVA) plus premiums is used as the main indicator for the renumeration of labor, capital, and land in agriculture, irrespective of the ownership of these factors. Primary losses of about EUR 18.6 billion are experienced by consumers because of higher price levels. In addition, an increase in tariff revenues of EUR 0.43 billion due to new imports is observed. Although imports are reduced for genome-edited crops, tariff revenues for rapeseed and sunflower seed as well as fish and fish products increase. Finally, the farming sector benefits from higher prices and about EUR 20.8 billion are available for the payment made to land, labor, and capital in agriculture.

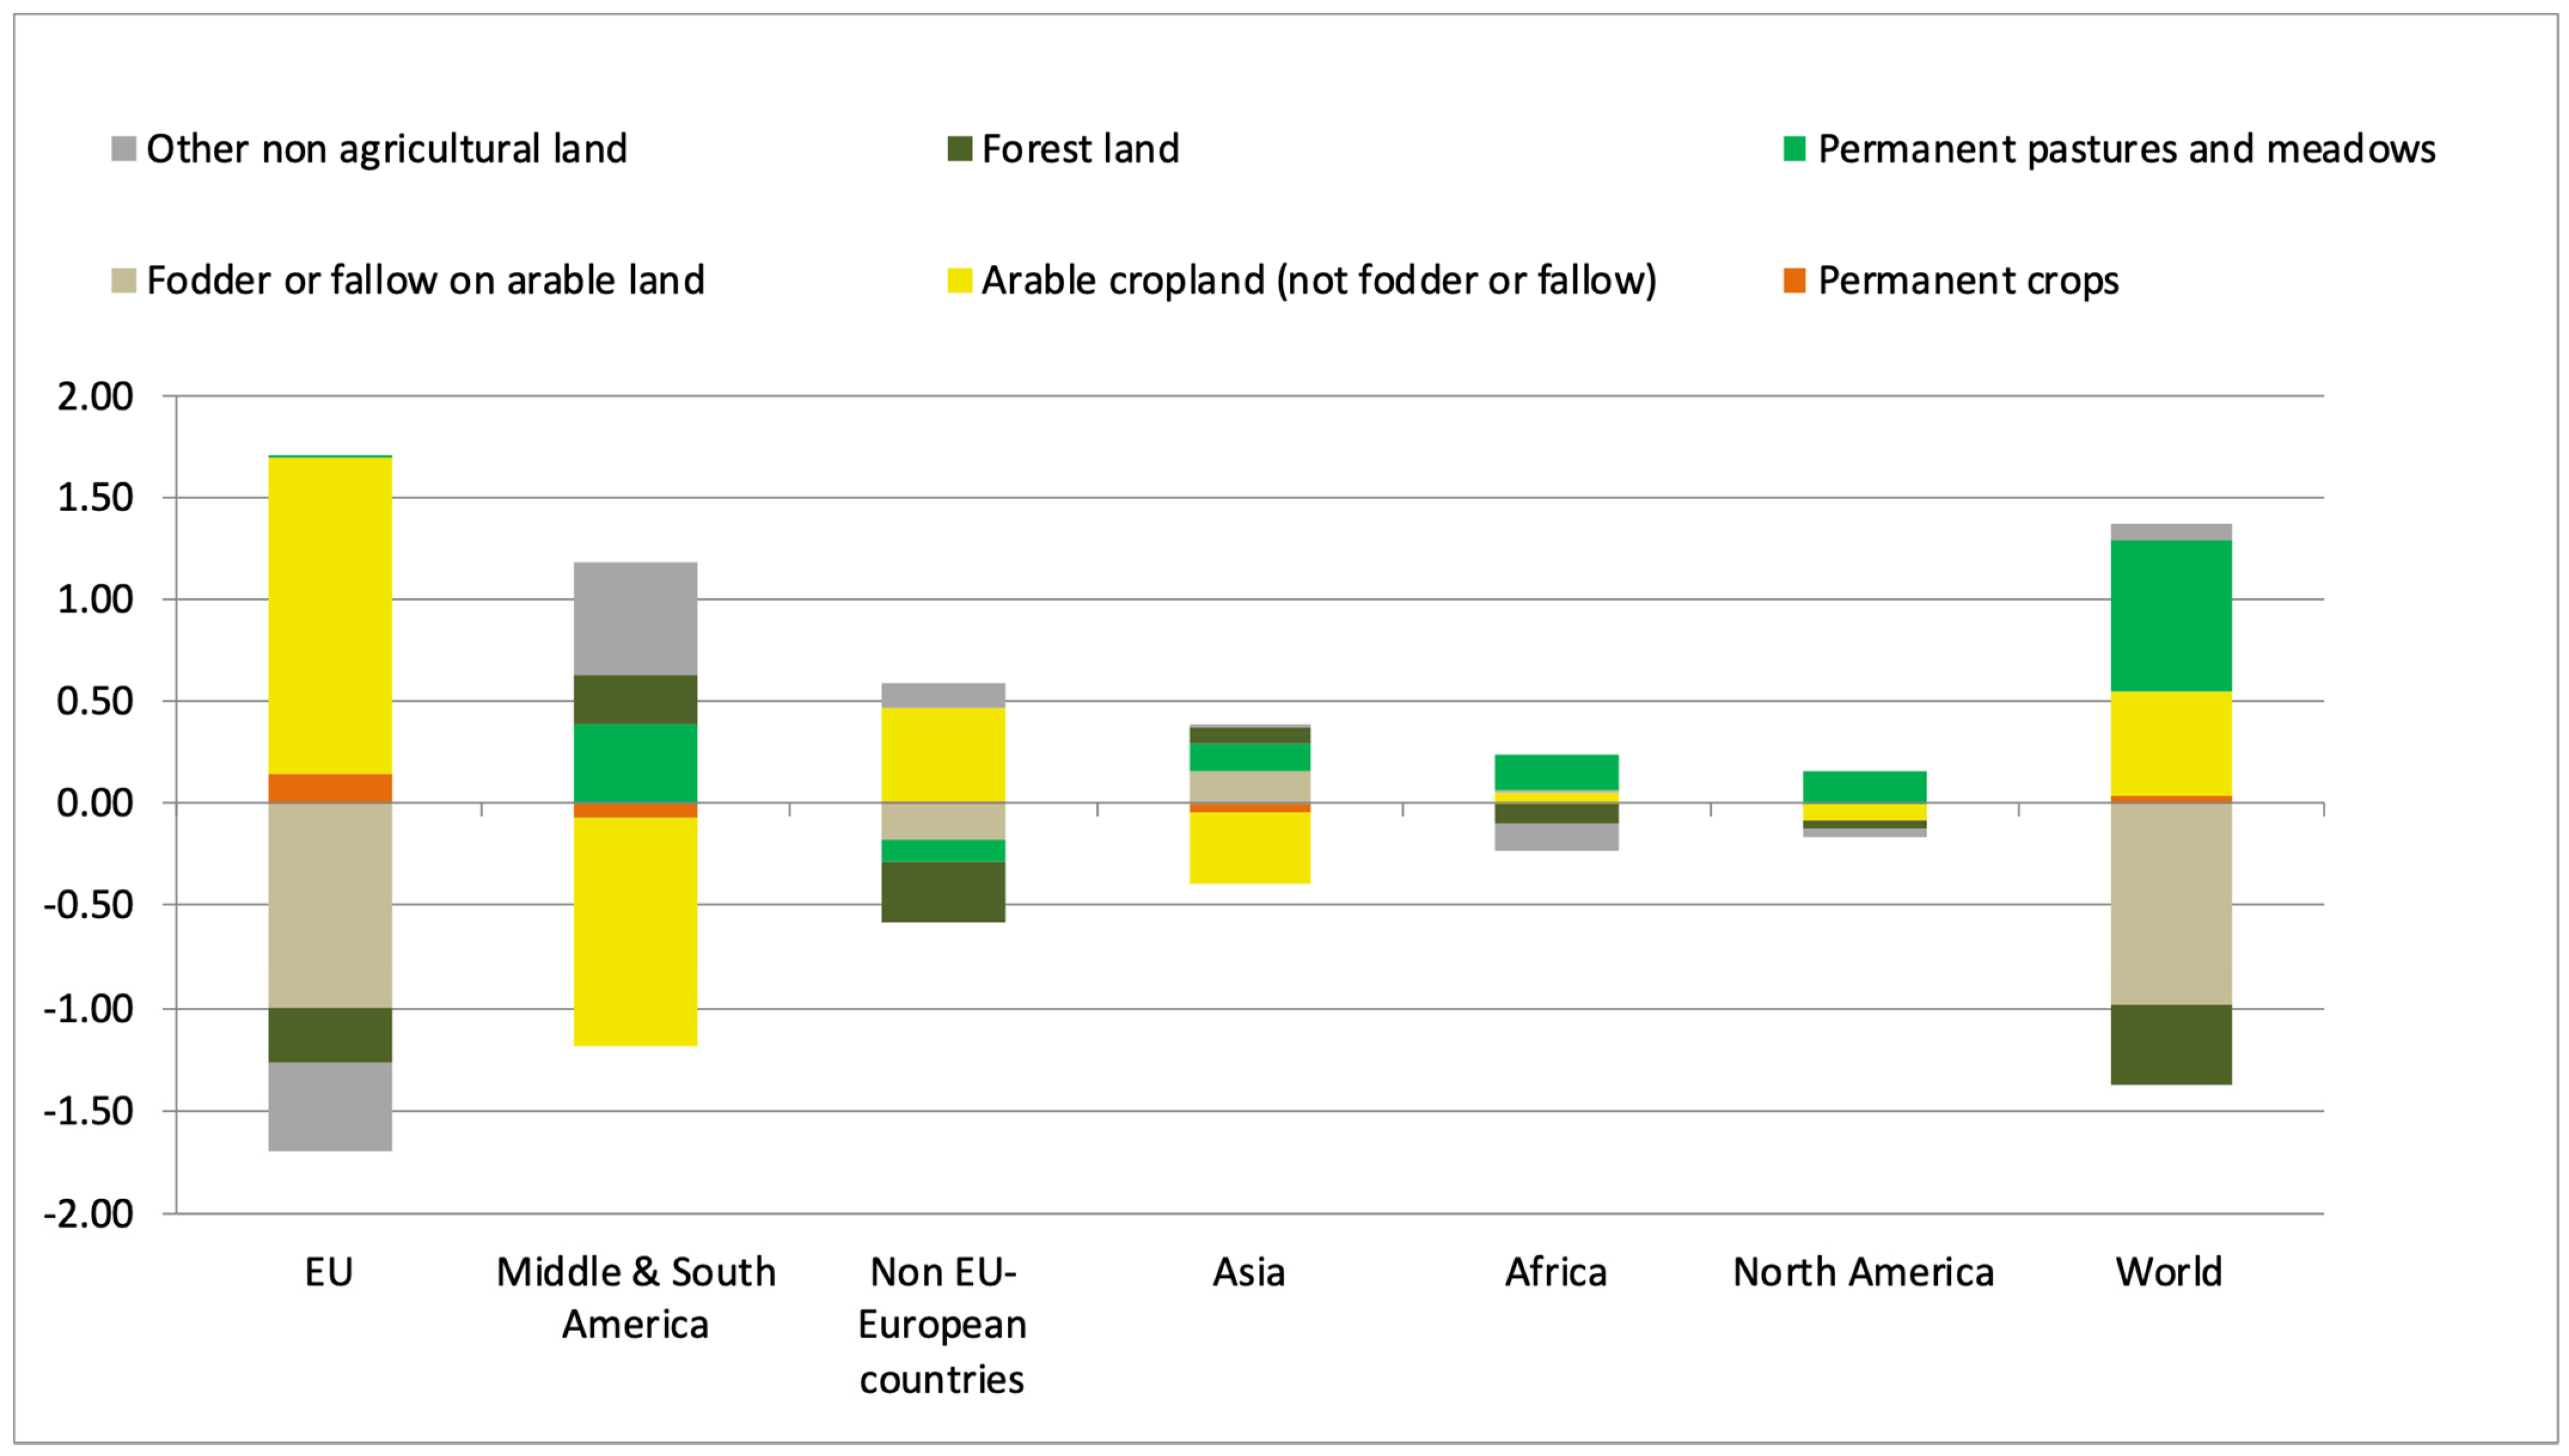
3.2. Land Use Change and Environmental Effects

Figure 3 looks at the balance of global land use change. It can be observed that in the import cease scenario, land used for pulses and soy increases in the EU (yellow), as well as permanent cropping in the form of olive oil (orange), which is important for the oil demand in Europe, and to a very small extent, grassland (green). The area for this expansion comes from arable crops like fodder maize, fallow land, but also to a smaller extent from cereals and oil production (khaki). The same pattern can be observed in non-EU European regions, though to a lower extent. For Middle and South America the reduction of exports of soy products releases land, while the increased demand for meat increases the share of grassland. In addition, forest and other land is recovered.
The distribution of land use changes across EU regions is depicted in the maps of Figure 4 for selected crops. The maps show the percentage change for the respective cropping type by NUTS2 region. The production of fodder maize declines due to substitution by protein-rich crops. The decline of extensively managed grassland and the increase of more intensively used grassland is interesting. This affects environmental goods such as the provision of biodiversity in agricultural systems or nutrient emissions. The increase in crop and food prices makes it profitable to produce more intensively, e.g., with a higher use of inputs like fertilizer, or to change from extensive grazing on otherwise fallow land to artificial pastures. The change in intensity can also be observed for cereals, where the yields increase by 2%, for oilseeds (1–3%) and for pulses (7%). An intensification in production can be seen in both the Eastern and the Western parts of the EU. Soy production increases particularly in Romania, Croatia, Hungary, the Slovak Republic, and Italy.
Olive oil is a substitute for soy oil and hence its production area in the EU increases by 3% (not shown in Figure 4). Animal herd numbers decrease in the EU, particularly for fattening of pigs, poultry, and beef. Increased product prices for crops result in higher production intensity. In particular, the use of mineral fertilizer is increased (+11% in sum, +10% per ha), while the use of manure decreases (−7% both in sum and per ha). Due to the increased production of legumes, the biological fixation of nitrogen increases by 44% resp. 43% (see Table 6). The increase in fertilization with crop residues by 9% can be explained by an increased overall production in the EU. It is notable that the nutrient surplus for nitrogen at soil level increases by 8%, both in total and per ha. This may have direct implications for the quality of ground and surface waters as well as for biodiversity and greenhouse gas emissions.
GHG emissions, as indicated in Figure 5, increase in the EU agricultural sector and in most other regions as well. In the EU, this is driven by the increased and more intensive production of cereals and oil seeds, while the production of meat and other animal products decreases. Meat consumed in the EU, which has formerly been produced there, is now imported. In addition, less meat is exported from the EU (−42%).
Therefore, meat production and the associated GHG emissions increase in other regions, predominantly in Africa, the Americas, and Asia. This accumulates to a global net increase in GHG emissions equivalent to 18 million tons of CO2. This is an increase by 0.3% at the global level and equals 4% of the baseline GHG emissions of EU agriculture. We see that a cease of imports of genome-edited crops leads to the relocation of production that is disadvantageous in terms of carbon efficiency.
While the production of one ton of soybeans is currently much more carbon-efficient in South America than in the EU, the scenario results in decreasing production in the former and increasing production in the latter. The opposite is true for livestock and other animal products: [35] list the carbon emissions in the production of beef, pork, and dairy to be among the lowest in the EU when compared internationally. Production in sub-Saharan Africa or Brazil is linked to significantly higher emissions. Hence, a substitution of domestic EU production by imports from these regions will increase the overall average emissions per ton of product.

3.3. Sensitivity Analysis

Given the strong production effect in the EU, we analyze the sensitivity of presented results with respect to the supply elasticity in the EU. A first scenario doubled while a second scenario halved the supply elasticity for the EU producers in the model. Figure 6 presents the market balance positions, e.g., production (prod), feed use (feed), biofuel use (biof), imports (imp), export (exp), and prices of the most volatile products. We observe that using higher elasticities results in lower prices, lower imports, and higher production in the EU compared to the scenario above, which is consistent with economic theory. Strong differences are found for price changes for soybean, which vary between 116% (high elasticity) and 236% (low elasticity). Accordingly, soybean production increases in the high elasticity scenario by 310% as compared to 218% in the low elasticity scenario. Soybean substitutes like sunflower imports have less pronounced reactions to high elasticities due to the higher responsiveness of farmers to grow soy in the EU. Similar reactions can be found for pulses in feed use and imports. Fish product imports used as feed input are also sensitive. In the low elasticity scenario, fish imports increase by 71% compared to the increase of 38% in the import cease scenario. For the other products, the difference between low and high elasticity ranges between 5 and 20 percentage points. In summary, we observe that although the sensitivity setup represents a profound change of the assumptions in the model, the findings of our study are robust with respect to the directions and overall magnitude. However, attention is required when single values are interpreted, particularly for products with profound changes, e.g., soybean, pulses, sunflower, and fish meal for feed.
In addition, we analyzed the sensitivity with respect to the import price by increasing it by 10%, 25%, and 50% for cereals and soy using the standard elasticities. The findings are presented in Table 2 of the annex. As a result, we see that a marginal increase of import prices already prohibitively affects imports for cereals, which shows the independence of the EU from other cereal markets. The high dependency of soy results in a 50% price increase, with 33% for imports observed in the baseline.

4. Discussion and Conclusions

To our knowledge, this study is the first comprehensive analysis of the potential consequences of genome editing regulation in the EU. A comparison with other studies can be made for certain aspects. For example, the dependencies of the EU on soybean imports are addressed by [36,37,38]. They conclude that the utilization of locally produced protein-rich feedstuffs show clear advantages in terms of emissions. We broadened the analysis and showed that higher prices resulting from reduced imports induce additional mineral fertilizer and land use changes, which in turn lead to an increase in net GHG emissions in the EU and globally. The effects of a cease of soybean imports from selected origins due to asynchronous approvals of GM crops are analyzed by [39]. The effects on agricultural markets in that analysis are less profound as substantial substitution results from imports from non-GMO origins, an effect not allowed in our analysis. The effects on global land use changes were also discussed in several other studies, e.g., [40]. The substitution possibilities of soybean meal and cereals in European livestock diets with bioethanol by-products are well acknowledged in [37]. With our analysis, we economically quantify the degree of substitution which could take place and the relevance of the EU biofuel sector in the adjustment to a cease of imports. Not yet found in the literature is the conversion of extensive grassland into intensive grassland due to higher agricultural prices. This has implications on biodiversity as well as on other environmental dimensions [41].
Considering the effects of the scenario, we find that replacing protein and oil originally imported via soy for feed (for pig, poultry fattening, and ruminants) and for oil (for biodiesel production), the markets adjust by (i) increasing EU production of pulses and soy, (ii) increasing imports of substitutes, (iii) substituting feed protein by increasing the intensity of EU grassland use, and (iv) slightly shifting from biodiesel to bioethanol, as DDG is a protein-rich by-product of bioethanol production. This triggers a conversion of non-agricultural land, forest, and fallow land (partially also fodder produced on arable land as fodder maize) to crop land. Crop land is then used to increase the feedstock for bioethanol production, mainly cereals. The strong price reactions reflect the strong dependence of the EU on soy product imports. As further consequences, palm oil imports increase to serve as feedstock for EU biodiesel and for human consumption. EU exports are reduced for products which (i) are not imported anymore (or for which soy or cereals are an input) and (ii) substitute soy products, e.g., rapeseed and sunflower seed. In particular, the strong increase in demand for rapeseed and sunflower seed invokes land use changes towards more crop land in other countries, except for Brazil, where crop land is converted back to grassland as induced by higher meat prices.
The intensification of agriculture (higher use of fertilizer) and the additional land use for agriculture particularly result in higher nutrient surpluses in the EU per hectare as well as in total, although white meat production in the EU declines and hence the production of manure. Global GHG emissions increase as the new distribution of production is less efficient, not only in terms of production cost, but also regarding GHG emissions; soybean production in the EU and animal production outside the EU are comparatively inefficient in terms of GHG emissions. Overall, the net effects on GHG emissions are large and positive. Agricultural prices increase in many regions of the world.
When analyzing the scenario, we need to acknowledge the limitations. We did not consider genome-edited animal products, crops other than cereals or soybeans, or any further processed goods, all of which have the potential to contribute to even stronger effects. Lacking reliable information on specific properties of genome-edited plants, we could not account for any productivity effect, which would increase the competitiveness outside and increase relative production costs inside the EU. As the market module uses the Armington approach and the supply model uses positive mathematical programming, the so-called “small share problem” arises in the simulation. If the share of imports or supply is small in the baseline, the import or the supply will stay relatively small, even if major price changes occur. It is therefore possible that we overestimated the price effect [42]. Furthermore, it should be mentioned that the income effect in this study is probably unequally distributed in the farming population, particular between cash crop and animal intensive farms. A quantification would require models operating at the farm group scale [43].
To summarize, countries worldwide are divided in their policies on genome-edited crops, especially with regards to SDN-1, where no foreign DNA is introduced into the genome. Some main exporting countries of agricultural commodities do not regulate SDN-1, while others like the EU do. Until now, the link between a mutation and a certain breeding technique cannot be established; therefore, uncertainties for traders as well as regulatory agencies will arise. Currently, there is no way to combine the imports of crops or crop products for which genome-edited varieties exist with the implementation of the ECJ verdict as compliance with GMO legislation simply cannot be enforced due to identification problems. Accidental imports are likely to occur and will undermine the legislation in place [44]. One could argue that if no method for identification exists, imports will flow into the EU without being recognized. We anticipate, however, that interested stakeholders will find a way to prove that genome-edited crops enter the EU illegally. This will prevent traders from shipping from non-regulated markets. This has implications for the regulation of genome-edited crops in the future. The EU Council, being aware of the potential economic consequences of current EU regulation, requested the EU Commission to submit an investigation in the light of the Court’s judgment and, if necessary, to make a proposal for a new regulation. As a result, they published the study [45], stating: “In certain cases, it would be difficult to identify or trace the presence of NGT (new genomic techniques) products not authorized in the EU, and to prove in court that it did not result from naturally occurring mutations. Trade disruptions may occur, with economic losses and a lack of access to resources outside the EU…”. With this study we contribute to the assessment of such consequences and point to the resulting market implications, the potential effects on GHG emissions and environmental aspects, as well as the effects on land use in South America and income increases in the agricultural sector worldwide. However, given the current initiative of the EU Council and the resulting process, we doubt that the EU’s timeline for finding a solution is sufficient to prevent a scenario as outlined in this paper. The scenario shows that because of asynchronous and divergent national legislations on genome-edited crops, especially with regards to SDN-1, significant changes in the EU agricultural sector are likely to occur. Against the background of (i) the challenge of non-identification and (ii) significant environmental as well as economic effects, and (iii) supposing that genome-edited products are safe, it seems worthwhile to reconsider the current EU regulatory framework. Recently, different options to either amend, supplement, or replace Directive 2001/18/EC have been discussed [44]. Generally speaking, any reform in the EU legislation on GMOs should aim at being consistent with scientific principles, striving towards international coherence, and allowing for agricultural innovations such as genome editing [46].

Author Contributions

Conceptualization, A.G., N.C., F.T., H.G.; methodology, A.G., F.T., H.G.; software, A.G., F.T. validation, A.G., F.T., H.G.; formal analysis, A.G., N.C., F.T., H.G.; writing—original draft preparation, A.G., N.C., F.T., H.G.; writing—review and editing, A.G., N.C., F.T.; visualization, A.G., F.T.; supervision, A.G., H.G.; All authors have read and agreed to the published version of the manuscript.

Funding

This research received no external funding.

Institutional Review Board Statement

Not applicable.

Informed Consent Statement

Not applicable.

Data Availability Statement

The model and the results are available under https://agp-uni-bonn.de/svn/trunk, accessed on 14 June 2021.

Acknowledgments

We thank Xinxin Yang and Sebastian Neuenfeldt for their help with the graphical representation of figures, tables and charts.

Conflicts of Interest

The authors declare no conflict of interest.

Appendix A

Table A1. Genome-edited plants with market-oriented traits [1,4].
No.PlantTrait/SpecificationTechnological SpecificationDeveloper, Producer, CountryProbably Traded as…
1PotatoProduct quality, non-browningTALENs
SDN1
Calyxt, USAIP
2PotatoProduct quality, reduced black spottinessTALENs
SDN1
Simplot Plant Science, USA
(Calyxt)
n.a.
3MaizeProduct quality, waxy cornCRISPR/Cas9
SDN1
Du Pont Pioneer, USA in Koop. ChinaIP—grown under contract
Might occur in processed products
4MaizeProduct quality,
higher starch levels
Meganuklease
SDN1
Agrivida, USAIP
5MaizeProduct quality, reduced phytate production + herbicide toleranceZFN
SDN3
DowAgroScience, USAIP
6MaizeFungal resistance, Northern Leaf Blight (NLB)CRISPR/Cas9 (Cisgenesis)
SDN3
Du Pont Pioneer, USACommodity
7MaizeIncreased yield, increased photosynthesis efficiencyMeganuklease
SDN3
Benson Hill Biosystems, USACommodity
8MushroomProduct quality, non-browningCRISPR/Cas9
SDN1
Penn State University, USAIP
9WheatProduct quality, increased nutritional valueTALENs
SDN1
Calyxt, USAIP
10WheatFungal resistance, resistance to powdery mildewCRISPR/Cas9
TALENs
SDN1
u.a. Calyxt, USACommodity
11SoybeanAbiotic stress, drought and
salt tolerance
CRISPR/Cas9
SDN1
USDA-ARS, USACommodity
12SoybeanProduct quality, high oleic content, low linoleic contentTALENs
SDN1
Cellectis Plant Science, USAIP
13RiceFungal resistance, resistance to powdery mildewTALENs
SDN1
Iowa State University, USACommodity
14TomatoGrowth characteristics,
easy separation of fruit from stem
CRISPR/Cas9
SDN1
University of Florida, USAn.a
15PennycressProduct quality,
altered oil composition
CRISPR/Cas9
SDN1
Illinois State University, USAn.a.
16TobaccoProduct quality,
reduced nicotine content
Meganuklease
SDN1
North Carolina State Universityn.a.
17RapeseedHerbicide toleranceODMCibus, Kanada; USACommodity
Table A2. Sensitivity analysis with respect to the import price for soy and cereals in the EU, in percentage change to baseline.
ScenarioCommodityProductionHuman ConsumptionFeedImportsExports CommodityProductionHuman ConsumptionFeedImportsExports
10%Wheat126−100−23Rapeseed oil223410−5
25%126−100−23333711−4
50%026−100−23334212−4
cease025−100−26546614−2
10%Barley005−100−18Sunflower oil−122814−10
25%005−100−18−133015−10
50%004−100−18−133416−11
cease−104−100−19145118−10
10%Maize70−13−100−27Soya oil−6−7−28−94−83
25%70−13−100−27−7−7−29−96−86
50%60−14−100−28−9−8−30−98−88
cease50−15−100−28−19−15−37−100−96
10%Other Cereals823−22−99−52Palm oil04040
25%824−22−100−5304040
50%824−22−100−5304040
cease925−21−100−5506040
10%Rapeseed−3−2513−13Rapeseed cake2−2839−40
25%−3−2614−143−2942−42
50%−4−2715−153−31047−45
cease−5−4923−225−41569−56
10%Sunflower seed−12−3−946−16Sunflower cake−1−12246−40
25%−13−4−1049−17−1−12450−42
50%−14−4−1153−180−12755−45
cease−17−5−1473−251−24079−54
10%Soya seed137−13−29−55−98Soya cake−60−53−77−99
25%150−14−31−60−99−71−56−80−100
50%169−15−34−67−99−83−60−85−100
cease265−17−51−100−100−1923−73−100−100
10%Pulses6−13231−19Sugar−2002−1
25%7−13534−19−2001−1
50%8−13938−21−20−110
cease15−26156−25−20−2−11
10%Pork−6−1039−29Biodiesel−2008−7
25%−7−1042−30−2008−7
50%−7−1047−33−2008−7
cease−9−1069−42−2009−8
10%Poultry−7−1070−29Bioethanol0003−3
25%−7−1077−310003−2
50%−8−1086−330002−2
cease−10−10130−4210001
10%Fish 002130DDG−100426−51
25%002330−101474−53
50%002540001546−55
cease003850205899−63

References

  1. Modrzejewski, D.; Hartung, F.; Sprink, T.; Krause, D.; Kohl, C.; Wilhelm, R. What is the available evidence for the range of applications of genome-editing as a new tool for plant trait modification and the potential occurrence of associated off-target effects: A systematic map. Environ. Evid. 2019, 8, 27. [Google Scholar] [CrossRef] [Green Version]
  2. Friedrichs, S.; Takasu, Y.; Kearns, P.; Dagallier, B.; Oshima, R.; Schofield, J.; Moreddu, C. An overview of regulatory approaches to genome editing in agriculture. Biotechnol. Res. Innov. 2019, 3, 208–220. [Google Scholar] [CrossRef]
  3. Ricroch, A. Global developments of genome editing in agriculture. Transgenic Res. 2019, 28, 45–52. [Google Scholar] [CrossRef] [PubMed]
  4. Kohl, C.; Modrzejewski, D.; Kopertekh, L.; Dietz-Pfeilstetter, A.; Fischer, M.; Menz, J.; Sprink, T.; Hartung, F.; Wilhelm, R. Anlage 4—Übersicht über Nutz- und Zierpflanzen, die Mittels Gentechnik und Neuer Molekularbiologischer Techniken für die Bereiche Ernährung, Landwirtschaft, Gartenbau, Arzneimittelherstellung und -Forschung Entwickelt Werden. BMEL. Available online: https://www.bmel.de/SharedDocs/Downloads/DE/_Landwirtschaft/Gruene-Gentechnik/NMT_Stand-Regulierung_Anlage4.pdf?__blob=publicationFile&v=3 (accessed on 14 May 2021).
  5. Menz, J.; Modrzejewski, D.; Hartung, F.; Wilhelm, R.; Sprink, T. Genome Edited Crops Touch the Market: A View on the Global Development and Regulatory Environment. Front. Plant Sci. 2020, 11, 586027. [Google Scholar] [CrossRef] [PubMed]
  6. European Commission; Joint Research Centre. Current and Future Market Applications of New Genomic Techniques; LU Publications Office: Geneva, Switzerland, 2021; Available online: https://data.europa.eu/doi/10.2760/02472 (accessed on 12 May 2021).
  7. Court of Justice of the European Union (ECJ). Press Release No 111/18. Luxembourg. July 2018. Available online: https://curia.europa.eu/jcms/upload/docs/application/pdf/2018-07/cp180111en.pdf (accessed on 14 June 2021).
  8. Hartung, F.; Schiemann, J. Precise plant breeding using new genome editing techniques: Opportunities, safety and regulation in the EU. Plant J. 2014, 78, 742–752. [Google Scholar] [CrossRef] [PubMed]
  9. European Parliament (EP); European Council (EC). Regulation (EC) No 1830/2003 of the European Parliament and of the Council of 22 September 2003 Concerning the Traceability and Labelling of Genetically Modified Organisms and the Traceability of Food and Feed Products Produced from Genetically Modified Organisms and Amending Directive 2001/18/EC. Available online: https://eur-lex.europa.eu/legal-content/EN/ALL/?uri=CELEX%3A32003R1830 (accessed on 14 May 2021).
  10. Grohmann, L.; Keilwagen, J.; Duensing, N.; Dagand, E.; Hartung, F.; Wilhelm, R. Detection and Identification of Genome Editing in Plants: Challenges and Opportunities. Front. Plant Sci. 2019, 10, 236. [Google Scholar] [CrossRef] [Green Version]
  11. Schmidt, S.M.; Belisle, M.; Frommer, W.B. The evolving landscape around genome editing in agriculture: Many countries have exempted or move to exempt forms of genome editing from GMO regulation of crop plants. EMBO Rep. 2020, 21. [Google Scholar] [CrossRef]
  12. Sprink, T.; Eriksson, D.; Schiemann, J.; Hartung, F. Regulatory hurdles for genome editing: Process- vs. product-based approaches in different regulatory contexts. Plant Cell Rep. 2016, 35, 1493–1506. [Google Scholar] [CrossRef] [Green Version]
  13. Tsuda, M.; Watanabe, K.N.; Ohsawa, R. Regulatory Status of Genome-Edited Organisms Under the Japanese Cartagena Act. Front. Bioeng. Biotechnol. 2019, 7, 387. [Google Scholar] [CrossRef] [Green Version]
  14. Eckerstorfer, M.F.; Engelhard, M.; Heissenberger, A.; Simon, S.; Teichmann, H. Plants Developed by New Genetic Modification Techniques—Comparison of Existing Regulatory Frameworks in the EU and Non-EU Countries. Front. Bioeng. Biotechnol. 2019, 7, 26. [Google Scholar] [CrossRef] [Green Version]
  15. Bömeke, O.; Kahrmann, J.; Matthies, A. Detaillierte Übersicht zum Regulatorischen Status der Neuen Molekularbiologischen Techniken (NMT) in Ausgewählten Drittstaaten. 2018. Available online: https://www.bvl.bund.de/SharedDocs/Downloads/06_Gentechnik/molekulare_techniken/molekulare_techniken_bericht_anlage1.pdf (accessed on 14 May 2021).
  16. Cohen, J. Fields of dreams. Science 2019, 365, 422–425. [Google Scholar] [CrossRef] [Green Version]
  17. Roïz, J. Limits of the current EU regulatory framework on GMOs: Risk of not authorized GM event-traces in imports. OCL Ol. Corps Gras Lipides 2014, 21. [Google Scholar] [CrossRef] [Green Version]
  18. Kalaitzandonakes, N.; Kaufman, J.; Miller, D. Potential economic impacts of zero thresholds for unapproved GMOs: The EU case. Food Policy 2014, 45, 146–157. [Google Scholar] [CrossRef]
  19. Phillipson, M.; Smyth, S.J. Regulatory Lags for Genetically Modified Crops: Legal and Political Perspectives. In The Coexistence of Genetically Modified, Organic and Conventional Foods: Government Policies and Market Practices; Kalaitzandonakes, N., Phillips, P.W.B., Wesseler, J., Smyth, S.J., Eds.; Springer: New York, NY, USA, 2016; pp. 197–206. [Google Scholar] [CrossRef]
  20. Polansek, T. Syngenta Drops Lawsuit against Bunge over Biotech Viptera corn. Reuters. 17 December 2014. Available online: https://www.reuters.com/article/syngenta-ag-bunge-lawsuit-idUSL1N0U101I20141217 (accessed on 14 May 2021).
  21. Pearson, D.R. Cargill v. Syngenta: Biotechnology and Trade. Cato Institute. 1 October 2014. Available online: https://www.cato.org/blog/cargill-v-syngenta-biotechnology-trade (accessed on 14 May 2021).
  22. Polansek, T. Syngenta Faces Second Lawsuit over GMO Corn Rejected by China. Reuters. 2014. Available online: https://www.reuters.com/article/us-syngenta-seed-trans-coastal-idUSKBN0HB2OQ20140917 (accessed on 14 May 2021).
  23. NZZ. Syngenta Wird Auch von Trans Coastal Supply Wegen Maissaatgut Verklagt. Neue Zür. Ztg. 2014. Available online: https://www.nzz.ch/wirtschaft/newsticker/syngenta-wird-auch-von-trans-coastal-supply-wegen-maissaatgut-verklagt-1.18385369 (accessed on 14 May 2021).
  24. Reuters. REFILE-Syngenta Sues Cargill, ADM in GMO Corn Fight. Reuters. 2015. Available online: https://www.reuters.com/article/syngenta-seed-traders-idUSL1N13F18V20151120 (accessed on 14 May 2021).
  25. Fisher, M. Lack of Chinese Approval for Import of US Agricultural Products Containing Agrisure VipteraTM MIR 162: A Case Study on Economic Impacts in Marketing Year 2013/14; NGFA: Washington, DC, USA, 2014; Available online: http://ngfa.org/wp-content/uploads/Agrisure-Viptera-MIR-162-Case-Study-An-Economic-Impact-Analysis.pdf (accessed on 14 June 2021).
  26. Consmüller, N.; Vaasen, A.; Bartsch, D. Are genome edited products credence goods? Implications for regulation and governance. In Poster presented at the ISBR Symposium, Tarragona; ISBR: Karnataka, India, 2019. [Google Scholar]
  27. Eriksson, D.; Kershen, D.; Nepomuceno, A.; Pogson, B.J.; Prieto, H.; Purnhagen, K. A comparison of the EU regulatory approach to directed mutagenesis with that of other jurisdictions, consequences for international trade and potential steps forward. New Phytol. 2019, 222, 1673–1684. [Google Scholar] [CrossRef] [PubMed]
  28. Smyth, S.; Phillips, P. Product Differentiation Alternatives: Identity Preservation, Segregation, and Traceability. AgBioForum 2003, 5. [Google Scholar]
  29. Maaß, O.; Consmüller, N.; Kehlenbeck, H. Socioeconomic Impact of Genome Editing on Agricultural Value Chains: The Case of Fungal-Resistant and Coeliac-Safe Wheat. Sustainability 2019, 11, 6421. [Google Scholar] [CrossRef] [Green Version]
  30. FAOSTAT. Available online: http://www.fao.org/faostat/en/#data/ (accessed on 4 June 2021).
  31. Britz, W.; Witzke, P. CAPRI Model Documentation 2014. Bonn. Available online: https://www.capri-model.org/docs/capri_documentation.pdf (accessed on 14 May 2021).
  32. Jansson, T.; Heckelei, T. Estimating a Primal Model of Regional Crop Supply in the European Union: Regional Crop Supply in the EU. J. Agric. Econ. 2011, 62, 137–152. [Google Scholar] [CrossRef]
  33. Armington, P.S. A Theory of Demand for Products Distinguished by Place of Production. IMF Staff Pap. 1969, 1969. [Google Scholar] [CrossRef]
  34. European Commission; Joint Research Centre; Institute for Prospective Technological Studies. Methodology to Assess EU Biofuel Policies: The CAPRI Approach; LU Publications Office: Geneva, Switzerland, 2013; Available online: https://data.europa.eu/doi/10.2791/82235 (accessed on 14 May 2021).
  35. Golub, A.A.; Henderson, B.B.; Hertel, T.W.; Gerber, P.J.; Rose, S.K.; Sohngen, B. Global climate policy impacts on livestock, land use, livelihoods, and food security. Proc. Natl. Acad. Sci. USA 2013, 110, 20894–20899. [Google Scholar] [CrossRef] [PubMed] [Green Version]
  36. Hörtenhuber, S.J.; Lindenthal, T.; Zollitsch, W. Reduction of greenhouse gas emissions from feed supply chains by utilizing regionally produced protein sources: The case of Austrian dairy production: Greenhouse gas emissions from regional protein sources for dairy cows. J. Sci. Food Agric. 2011, 91, 1118–1127. [Google Scholar] [CrossRef]
  37. Weightman, R.M.; Cottrill, B.R.; Wiltshire, J.J.J.; Kindred, D.R.; Sylvester-Bradley, R. Opportunities for avoidance of land-use change through substitution of soya bean meal and cereals in European livestock diets with bioethanol coproducts: Substitution of soya and cereals with bioethanol coproducts. GCB Bioenergy 2011, 3, 158–170. [Google Scholar] [CrossRef]
  38. Sasu-Boakye, Y.; Cederberg, C.; Wirsenius, S. Localising livestock protein feed production and the impact on land use and greenhouse gas emissions. Animal 2014, 8, 1339–1348. [Google Scholar] [CrossRef] [PubMed] [Green Version]
  39. Henseler, M.; Piot-Lepetit, I.; Ferrari, E.; Mellado, A.G.; Banse, M.; Grethe, H.; Parisi, C.; Helaine, S. On the asynchronous approvals of GM crops: Potential market impacts of a trade disruption of EU soy imports. Food Policy 2013, 41, 166–176. [Google Scholar] [CrossRef]
  40. Muller, A.; Bautze, L. Agriculture and Deforestation: The EU Common Agricultural Policy, Soy, and Forest Destruction; Fern: Moreton in Marsh, UK, 2017. [Google Scholar]
  41. Weisser, W.W.; Roscher, C.; Meyer, S.T.; Ebeling, A.; Luo, G.; Allan, E.; Bebler, H.; Barnard, R.L.; Buchmann, N.; Buscot, F.; et al. Biodiversity effects on ecosystem functioning in a 15-year grassland experiment: Patterns, mechanisms, and open questions. Basic Appl. Ecol. 2017, 23, 1–73. [Google Scholar] [CrossRef]
  42. Kuiper, M.H.; van Tongeren, F.W. Using Gravity to Move Armington-an Empirical Approach to the Small Initial Trade Share Problem in General Equilibrium Models; OCED: Metta Fort, France, 2007. [Google Scholar]
  43. Gocht, A.; Britz, W.; Ciaian, P.; Paloma, S.G. Farm type effects of an EU-wide direct payment harmonisation. J. Agric. Econ. 2013, 64, 1–32. [Google Scholar] [CrossRef]
  44. Wasmer, M. Roads Forward for European GMO Policy—Uncertainties in Wake of ECJ Judgment Have to be Mitigated by Regulatory Reform. Front. Bioeng. Biotechnol. 2019, 7, 132. [Google Scholar] [CrossRef] [PubMed]
  45. European Commission. Study on the Status of New Genomic Techniques Under Union Law and in Light of the Court of Justice Ruling in Case C-528/16’, Brussels, COMMISSION STAFF WORKING DOCUMENT SWD(2021) 92 Final. April 2021. Available online: https://data.consilium.europa.eu/doc/document/ST-8285-2021-INIT/en/pdf (accessed on 14 June 2021).
  46. Eriksson, D.; Custers, R.; Björnberg, K.E.; Hansson, S.O.; Purnhagen, K.; Qaim, M.; Romeis, J.; Schiemann, J.; Schleissing, S.; Tosun, J.; et al. Options to Reform the European Union Legislation on GMOs: Scope and Definitions. Trends Biotechnol. 2020, 38, 231–234. [Google Scholar] [CrossRef] [Green Version]
Figure 1. Elements of the market balance for cereals, sugar, and meat markets for the EU, in the baseline and a cease of import scenario, in different tones; (A) presents the baseline; (B) describes the cease of import scenario. The percentage change compared to the baseline is presented in brackets in (B), after the totals in K = 1000 tones.
Agronomy 11 01212 g001
Figure 2. Elements of the market balance for the oil and cake markets for the EU, in the baseline and a cease of import scenario, in different tones; (A) presents the baseline; (B) describes the cease of import scenario. The percentage change compared to the baseline is presented in brackets in (B), after the totals in K = 1000 tones.
Agronomy 11 01212 g002
Figure 3. Global land use change in 1000 ha.
Agronomy 11 01212 g003
Figure 4. Land use change by cropping type in percentage change to the baseline.
Agronomy 11 01212 g004
Figure 5. Greenhouse gas emissions in millions of tons of CO2-equivalents.
Agronomy 11 01212 g005
Figure 6. Sensitivity analyses for high and low supply elasticities presented for the market balance positions and the market prices in the EU. We present products and positions with an absolute difference higher than 0.5 million tones and more than 15% compared to the baseline. The red line represents the cease of import scenario, the blue and the green dots the low and high elasticity scenario.
Agronomy 11 01212 g006
Table 1. Elements of the market balance for the EU—absolute and percentage changes to the baseline for cereals, sugar, and meat markets.
ProductionHuman con.ProcessingBiofuelsFeed UseImportsExportsMarket Volume *
1000 t abs.%1000 t abs.%1000 t abs.%1000 t abs.%1000 t abs.%1000 t abs.%1000 t abs.%%
Wheat−465-9602−307−8232621435−3312−100−6804−26−3
Barley−338−110- 3041911124−421−100−2185−19−1
Grain maize3080515-−967−15−469−14−8890−15−13,541−100−151−28−14
Other cereals1201931625−2927−41−99−25−2288−21−6202−100−3−60−25
Pork meat−2094−9−239−1−138−30 3467−1682−42−9
Poultry meat−1452−10−155−1−1−50 241130−1056−42−8
Sugar−398−213-1-−51−2−2−3−22−1171−2
Fish and aquatic products 33-−3−1 609386275−134
* Imports + Production; “-” indicate very small values.
Table 2. Elements of the market balance for the EU—absolute and percentage changes to the baseline for the oil and cake markets.
ProductionHuman con.ProcessingBiofuelsFeed UseImportsExportsMarket Volume *
1000 t abs.%1000 t abs.%1000 t abs.%1000 t abs.%1000 t abs.%1000 t abs.%1000 t abs.%%
Soybeans6.871265−58−17−2.905−25478-−471−51−10.405−100−101−100−27
Soy oil−425−19−292−15−243−100−589−94−102−37−1.566−100−766−96−52
Soy cake−1.732−192323−170−100 −20.521−73−19.605−100−669−100−74
Rapeseed−750−5−33−41.10851.229-6991.88523−8−225
Rapeseed oil490511243111564260665914−10−26
Rapeseed cake6255−3−4−120−43 1.6301529369−589−567
Sunflower seed−1.677−17−33−5−371−653-−45−1449973−730−25−11
Sunflower oil3311074−2−1195855114818−28−105
Sunflower cake451 −2 2.558402.44879−65−5438
Pulses37915−25−2−8−20 9906151255−67−2525
Palm oil 536−10 22213 26540 4
Bio ethanol441 −10111
Bio diesel−182−2 1089−73−8−1
DDG 862 1975105900−6−635
* Imports + Production; “-” indicate very small values.
Table 3. Fodder ratio changes due to the cease of imports compared to the baseline in the EU.
RuminantsGranivorous
For Dairy ProductionOther CowsMale Adult Cattle High Male Adult Cattle LowSheep and Goat Pig
Fattening
Poultry
Fattening
kg Dry Matter/Headkg Dry Matter/Million Heads
Feed cerealsbaseline997390580145112124993
% to baseline12−16−24−25-1
Protein-rich feedbaseline511216296757982246
% to baseline−32−54−39−55−36−2−1
Energy-rich feedbaseline632430719156
% to baseline11214-2
Other feed (like DDG)baseline13310167305
% to baseline05−2−21
Grasbaseline8794768262642928157
% to baseline1814171224
Fodder maizebaseline431517922470121120
% to baseline−31−28−25−21−32
Fodder grass from arable land baseline27262649167180136
% to baseline3126252331
Table 4. Producer price development in different geographical regions.
European Union EUNon-European
Countries
North America
(USA, Canada, Mexico)
Middle and South America
Baseline
in Euro/t
%Baseline
in Euro/t
%Baseline
in Euro/t
%Baseline
in Euro/t
%
Products with price increase in all regions
Rapeseed 41393901333734433
Sunflower seed 34111519432423822
Pulses 29611660590217111
Pork meat 179217236611698416472
Other products
Wheat 2085411−523702020
Barley 1834305−4184−11631
Grain maize 21062880197−1191−3
Other cereals 1659199−2168−2176−6
Soybeans 396169380−8407−4340−3
Poultry meat 1781123303−81414116050
Rapeseed oil 8472934−1084518371
Soy oil 77259764−882208321
Rapeseed cake 338283957409−2401−6
Sunflower seed cake 300143835361−3367−6
Soy cake 384162427−4485−6488−15
Sugar 506-6142452-257-
Bio ethanol 1230-8861789-964-
DDG from bio-ethanol processing 12033151−9149−6144−15
Table 5. Absolute and percentage changes of EU imports by origins.
Europe, Non-EUAfricaNorth America Middle and South AmericaAsiaAustralia and New ZealandTotal
abs.% abs.%abs.%abs.%abs.%abs.%abs.%
Rapeseed31811174128866361811862318188423
Sunflower seed20784201351710366901885609249973
Pulses1494520762206571473569167051256
Fish 1096116385194112724346285
Rapeseed cake28768 62277000029369
Sunflower seed cake171859393433330681422740500244779
Table 6. Sources and remains of nitrate used in the EU agriculture.
Total (in 1000 t)Per ha (in kg)
Value in Baselineabs. Change% ChangeValue in Baselineabs. Change% Change
sourceMineral fertilizer955210241159610
Manure8144−607−750−4−7
Crop residues854380595359
Biological fixation16077014410443
Atmospheric deposition18441011100
remainsAbsorption by crop−19,59314127−12187
Surplus total 10,09745956334
Gaseous loss−2794−107−4−17−1−4
Run off mineral−395359−209
Run off manure−256−19−7−2−2−8
Surplus at soil level6543541841−448
Publisher’s Note: MDPI stays neutral with regard to jurisdictional claims in published maps and institutional affiliations.

