Article

Individual and Combined Effects of Planting Date, Seeding Rate, Relative Maturity, and Row Spacing on Soybean Yield

Department of Plant Sciences, North Dakota State University, Fargo, ND 58105, USA
*
Author to whom correspondence should be addressed.
Agronomy 2021, 11(3), 605; https://doi.org/10.3390/agronomy11030605
Submission received: 18 February 2021 / Revised: 17 March 2021 / Accepted: 20 March 2021 / Published: 23 March 2021
(This article belongs to the Special Issue Soybean Breeding, Agronomic Practices, and Production Systems)

Abstract

:
Planting date (PD), seeding rate (SR), relative maturity (RM) of cultivars, and row spacing (RS) are primary management factors affecting soybean (Glycine max (L.) Merr.) yield. The individual and synergistic effects of PD, SR, RM, and RS on seed yield and agronomic characteristics in North Dakota were herein investigated. Early and late PD, early and late RM cultivars, two SR (408,000 and 457,000 seed ha−1), and two RS (30.5 and 61 cm) were evaluated in four total environments in 2019 and 2020. Maximizing green canopy cover prior to the beginning of flowering improved seed yield. Individual factors of early PD and narrow RS resulted in yield increase of 311 and 266 kg ha−1, respectively. The combined factors of early PD, late RM, high SR, and narrow RS improved yield by 26% and provided a $350 ha−1 partial profit over conventional practices. Canopy cover and yield had relatively weak relationships with r2 of 0.36, 0.23, 0.14, and 0.21 at the two trifoliolate, four trifoliolate, beginning of flowering, and beginning of pod formation soybean growth stages, respectively. Producers in the most northern soybean region of the USA should combine early planting, optimum RM cultivars, 457,000 seed ha−1 SR, and 31 cm RS to improve yield and profit compared to current management practices.

1. Introduction

The gap between genetic potential and the average producer soybean (Glycine max (L.) Merr.) yield at the farm level has previously been investigated in the north-central USA region. In the north-central USA region, the states North Dakota, South Dakota, and Minnesota comprised 19% of USA soybean production in 2020 [1] with an average profit of $230 USD ha−1 in southern North Dakota [2]. A grower survey of 524 soybean fields in North Dakota by Rattalino Edreira et al. [3] found yield differences between the highest and average-yielding (1200 kg ha−1) fields were due to three primary factors, including planting date (PD) [3], relative maturity (RM) [4], and seeding rate (SR) [5]. Mourtzinis et al. [4] stated that RS practices in North Dakota were about equally split between narrow (~25 cm) and wide (~76 cm) spacings in surveyed soybean fields. The effects of PD, RM, SR, and RS on soybean production have been individually well-investigated. Current North Dakota management trends of second-half of May planting, cultivars with RM not best-adapted for the region, and 408,000 seed ha−1 SR can be improved upon [6], with narrow RS providing yield benefits compared to wide RS in northern growing regions [7]. The potential synergistic effects of early planting, cultivars with longer RM [6], and SR higher than 408,000 seed ha−1 require further exploration, especially in northern USA soybean production environments [8,9].
The soybean planting date is considered the most important cultural management factor to production [10]. Delaying soybean planting from 1 May to 15 May decreased yield by 0.5% d−1 in Minnesota [11]. Delaying soybean planting beyond May resulted in declining yields in the north-central USA region [3,12,13,14,15,16]. In addition, Stanley [6] reported a 0.4% d−1 yield loss when delaying planting beyond 1 May (up to 1 June) in North Dakota. However, soybean yield response to PD can vary considerably from year-to-year, especially depending on the magnitude of environmental constraints [15,16].
The length of the cropping season in the north-central USA has increased by 5 to 20 d since the 1950s, according to Kucharik et al. [17], generating uncertain optimal soybean maturity recommendations [18]. Soybean cultivar RM groups in the USA range from 00.0 to 10.0 [19], with the suggested maturity groups for production in North Dakota ranging from 00.0 to 1.0 [20]. Mourtzinis and Conley [21] delineated optimal soybean maturity group zones and noted a range of RM 0.0 to 1.5 is more suited for North Dakota production. To maximize yield, current production recommendations suggest utilizing a cultivar with the longest maturity group suitable for a growing region [22].
With similar SR, the distance between soybean rows has an impact on plant density within the row and soybean seed yield. Narrow rows can cause earlier in-season canopy closure [23], resulting in greater accumulated light interception compared to wider RS [24,25]. In the northern and central soybean growing regions in the USA, narrow RS can improve soybean yields in normal environmental conditions [9,25,26,27,28,29,30]. Narrow rows can increase soybean yield when planted late or under no-till conditions [14]. In contrast, wide soybean RS improves yields under soil water deficit conditions [29,31].
Various SR have been reported as optimal for yield and typically differ between growing regions. Seeding rates below 560,197 seeds ha−1 in Iowa [32], 284,050 to 573,000 seeds ha−1 in high yield conditions in Kansas [29], and 444,600 to 494,000 seeds ha−1 in North Dakota [9], all of which have been found to produce the greatest yield. Soybean iron deficiency chlorosis (IDC) in IDC-prone North Dakota soils can be reduced by increasing plant density from 300,000 to 600,000 plants ha−1, resulting in increased seed yield [33]. To produce similar yields around 3600 kg ha−1, Lee et al. [34] reported optimal SR for planting in May in Kentucky was as low as 171,000 seed ha−1, where SR in Wisconsin was as high as 741,000 seeds ha−1 [14]. Gaspar et al. [5] found SR below the agronomical optimal SR exponentially increased risk and potential yield loss. Reducing risk for soybean yield loss may be circumvented by optimizing canopy cover through management, which would require a greater understanding of the effect of management practices on canopy cover.
Canopy cover is a useful proxy measurement for light interception and crop productivity [35]. Maximum photosynthesis is achieved when plants maximize light interception and utilization of photosynthetic radiation [36,37]. Light interception can be quantified with methods such as quantum line sensors [38], approximated by fractional green canopy cover (FGCC) from pictures using the Canopeo app [39], and leaf area index.
Estimating and predicting crop yields using canopy cover measurements is of high relevance to producers. Crop growth stage [40], RS [41], and canopy structure [42] can affect FGCC. Green canopy cover may allow for better yield prediction and a useful application in soybean production. To our knowledge, no previous research in the northern USA soybean growing region has evaluated the combined effect of management factors and their potential for synergism to increase soybean yields, and their use in yield prediction based on canopy cover.
The objectives of the research were to determine how PD, SR, RM, and RS, as individual factors and when combined, affect seed yield, and agronomic characteristics, if combining factors are more economical than current practices, and to evaluate if FGCC can predict soybean yield.

2. Materials and Methods

Field experiments were conducted in 2019 and 2020 in Fargo, North Dakota, USA (46.932° N, 96.513° W). Each year the location had two experiments: one tile-drained, as described by Kandel et al. [43], and one non-tile-drained. Each experiment and year combination were called an environment, for a total of four environments.
The experimental design was a randomized complete block (RCB) with a split-plot arrangement with four replicates. The whole plot was PD, and the sub-plots were a factorial combination of RM of cultivars, SR, and RS, with the combination of all factors described as a package. Planting dates were at an optimal time, which is no earlier than 5 d before the last projected spring frost in mid-May and a late PD two weeks thereafter (Table 1). Cultivars were from the same company and differed by 0.3 RM units and were described as early or late RM relative to the cultivars grown in that environment (Table 2). Seeding rates were 408,000 and 457,000 pure live seeds (germinable seeds) ha−1 and adjusted using a 98% germination average. The RS widths were narrow (30.5 cm) and wide (61 cm). The four factors of PD, RM, SR, and RS were combined over 2019 and 2020, with the main effects analyzed individually. To answer if a combination of factors provided higher yield compared to conventional practices, individual factors were combined into ‘packages’, combined across environments, and analyzed by packages using an RCB. The ‘improved package’ consisted of an early PD, late RM, 457,000 seeds ha−1, and narrow RS factors, whereas the ‘conventional package’ was a late PD, early RM, 408,000 seeds ha−1, and wide RS.
Experimental units were seeded using a Hege 1000 no-till planter (Hege Company, Waldenberg, Germany). Seeds were sown to a depth of approximately 3 cm, with the experimental unit size being 1.52 m by 5.47 m. Soils were tested (Table 3) for plant essential nutrients before seeding to ensure fertility was not a limiting factor based on North Dakota State University recommendations [20]. Soil fertility levels were sufficient and no additional fertilizer was applied. Soybean seed was pre-treated with Acceleron seed treatment, (Bayer CropScience, Monheim, Germany). Seeds were inoculated with Bradyrhizobium jamponicum using Vault SP (BASF, Ludwigshafen, Germany) at a rate of 40 g per 23 kg of seed.
Two applications of Roundup PowerMAX (Bayer CropScience, Monheim, Germany) at a rate of 1.6 L ha−1 were applied during the season for weed control. Soybean aphid (Aphis glycines Matsumura) and grasshopper (Orthoptera: Acrididae) were controlled when pest densities surpassed the economic threshold [44] using the insecticide Mustang Maxx (FMC Corporation, Philadelphia, PA, USA) at a rate of 1.75 L ha−1.
After planting, a number of established plants per experimental unit were recorded at the V2 or two trifoliolate stage [45]. Established plant density was determined by counting a 0.91 m length from the middle soybean rows, and the final plant density was determined by counting plants from the same length before harvest. During the growing season, soil cover percent was recorded using the Canopeo app (Oklahoma State University, Stillwater, OK, USA). Fractional green canopy cover photos were processed to determine a canopy coverage percentage [39]. Canopy pictures were taken approximately 1.5 m from the soil surface in the center of each plot using an iPad (Apple, Cupertino, CA, USA). Matlab software (MathWorks, Inc., Natick, MA, USA) was used to estimate canopy cover by FGCC. The FGCC measurements were recorded when soybean plants in the early PD were at the V2, V4, R1, R3, R5, or R7 growth stage (two trifoliolate, four trifoliolate, beginning of flowering, beginning of pod formation, beginning of bean development, and pod and leaf yellowing), respectively [45]).
Experimental units were harvested after physiological maturity [45] using a Wintersteiger classic plot combine (Wintersteiger AG, Ried, Austria). Seed samples were cleaned and weighed post-harvest and analyzed for oil and protein content using a Perten Instruments DA 7250 NIR analyzer (Perten Instruments, Inc., Springfield, IL, USA). Moisture and test weight were determined using a GAC 2100 moisture tester (DICKEY-John Corp., Minneapolis, MN, USA) and observations were corrected to 13% moisture content. Seed weights were obtained by counting 1000 seeds using an electric counter and weighing them. Weather data were collected using the North Dakota Agricultural Weather Network [46] providing weekly maximum and minimum air temperature and rainfall using the Fargo NDAWN weather station.
Normality and homogeneity of variance assumptions of ANOVA were met, as determined by residual histograms and the ratio of the highest and lowest error mean square being less than 10 [47]. Analysis of variance was performed for 2019 and 2020 environments using the GLIMMIX procedure in SAS 9.4 (SAS Institute, SAS Circle, Cary, NC, USA). The individual factor analysis used fixed and random effect designations described by Carmer et al. [48], where PD, RM, SR, and RS were considered fixed effects, while environment, and replicate within environment, were considered random. Analysis of variance of dependent variables for packages were performed using the GLIMMIX procedure, where package was considered a fixed effect, and environment a random effect. The FGCC dependent variable was analyzed as a repeated measure over time using the design structure similar to the respective analysis [49]. Simple linear correlations between FGCC and yield were performed using the CORR procedure. Orthogonal contrasts were made using Proc GLIMMIX to compare improved and conventional management packages. Means were separated using a Tukey’s HSD with p = 0.05.
A partial net profit economic analysis for the individual factors and packages were only included costs associated with seed and no other costs, such as machinery and labor which do not affect the economics of SR. The partial net profit was calculated by subtracting seed cost (price per seed (PPS)⨯ live seeding rate (SR)) from gross revenue (seed yield (SY)⨯ market price (MP)): Partial   Net   Profit   =   ( SY   ×   MP )     ( PPS   ×   SR ) . Price per seed was calculated by dividing a $49.20 seed cost unit−1 by 140,000 seeds [50]. Gross revenue calculations used the 2010–2020 soybean market price average of $0.41 kg−1 from the Chicago Board of Trade. Means were separated using Tukey’s HSD with p = 0.05.

3. Results and Discussion
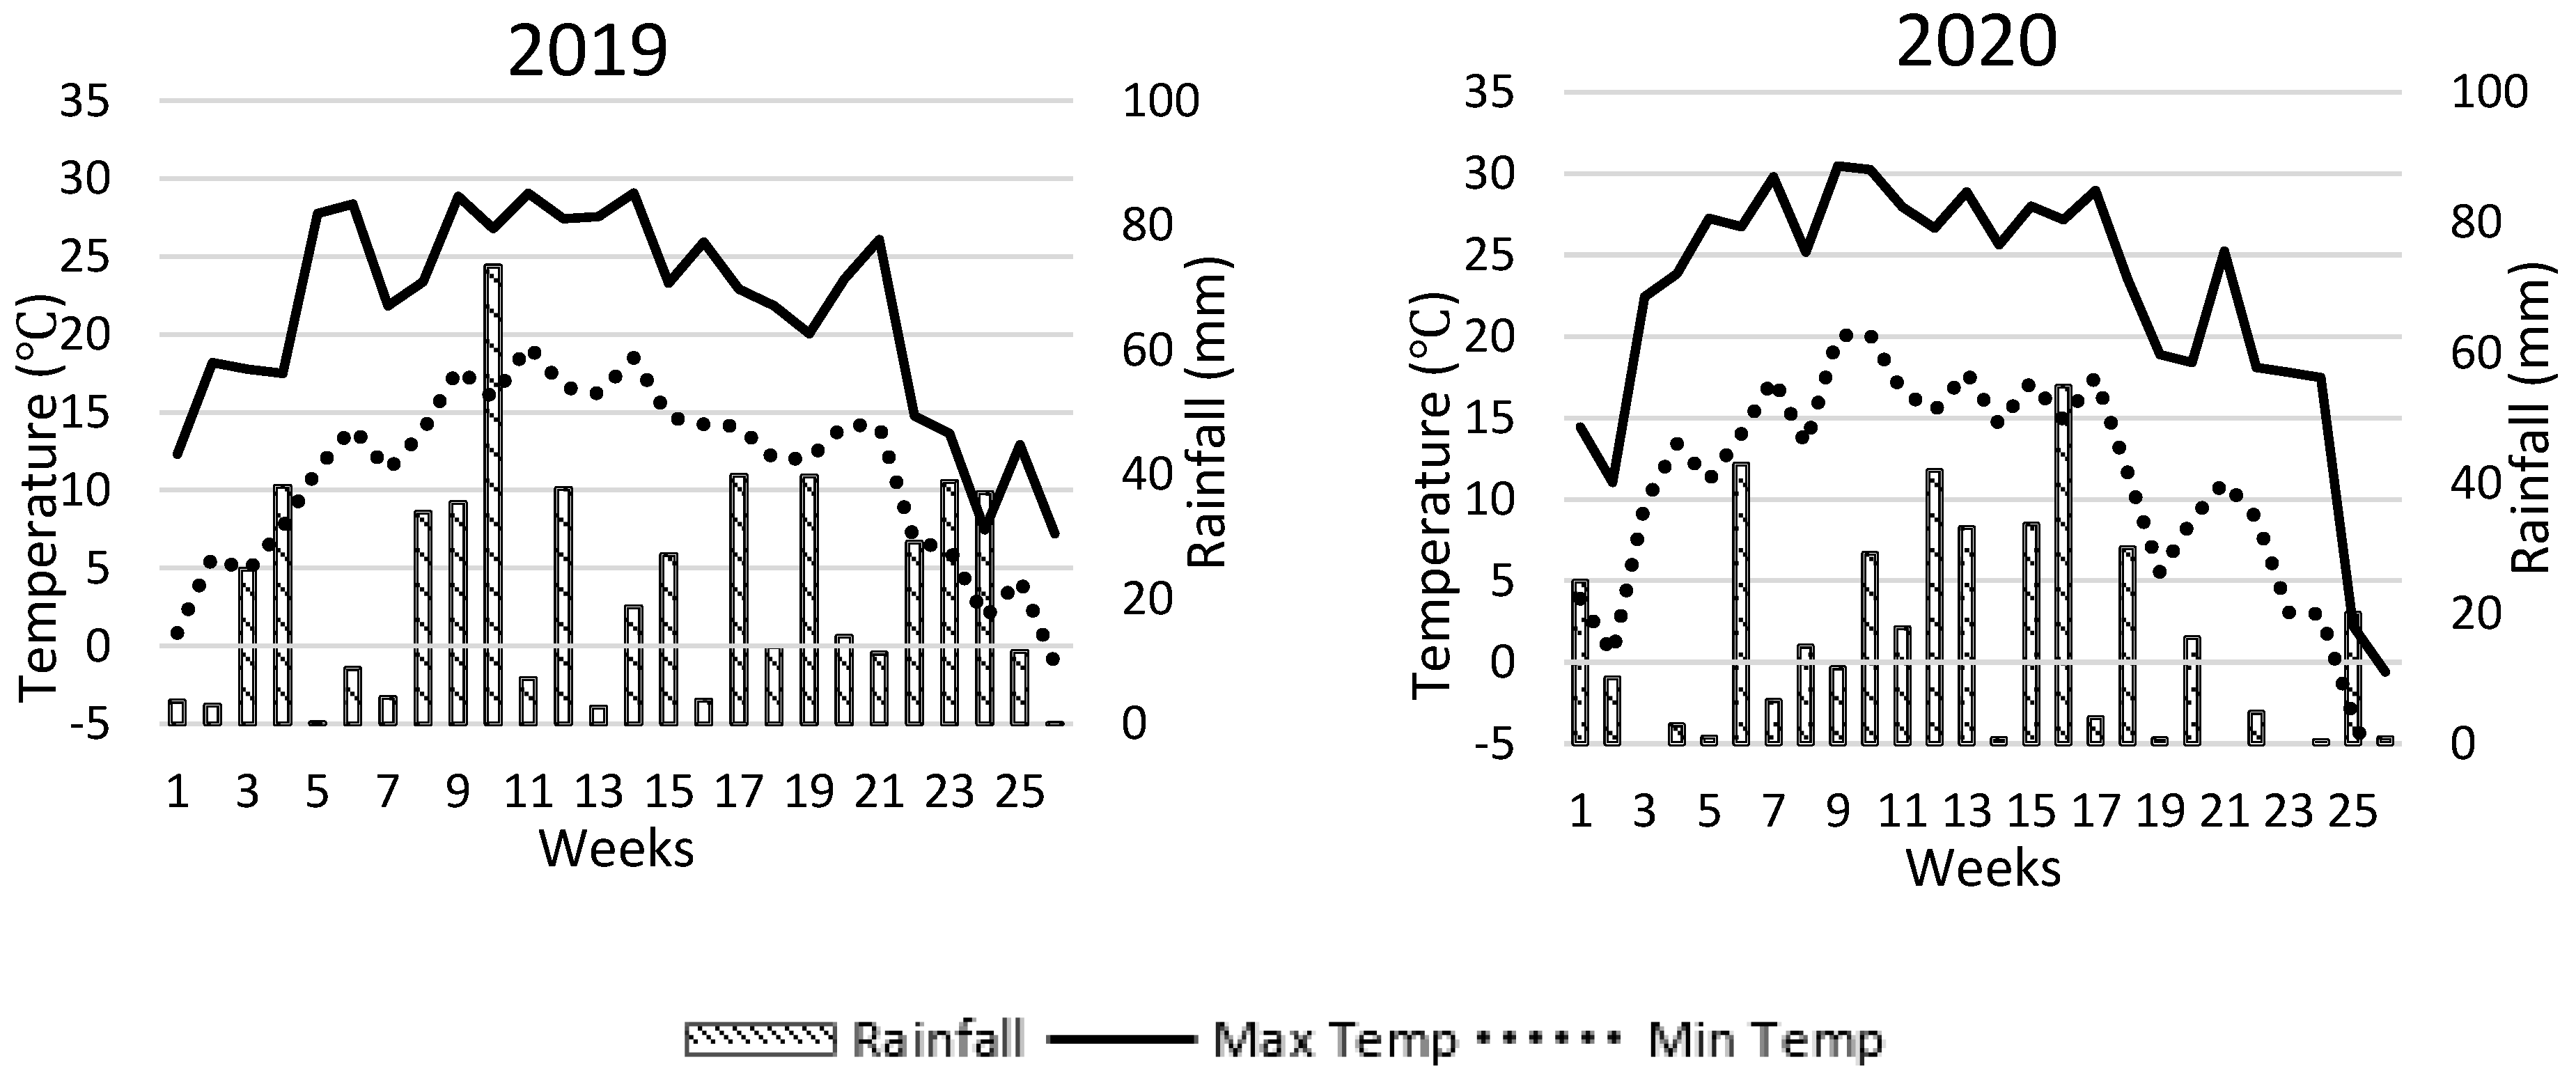
3.1. Weather Data

Rainfall amounts and temperature conditions differed slightly between the years. Rainfall events were more frequent in 2019 compared to 2020 (Figure 1). Total rainfall between weeks 1 to 25 was greater in 2019 (558 mm) compared to 2020 (404 mm). Weekly rainfall averages post week 15 were considerably drier in 2020 compared to 2019. The two-week period following planting in 2019 was warmer and drier compared to the first two weeks following planting in 2020. In 2020, minimum air temperatures decreased below 0 °C, causing slight frost damage to the longer relative maturity soybean cultivar. On average, average temperatures of 16.2 and 16.4 °C between weeks 1 and 25 were similar in 2019 and 2020, respectively.

3.2. Individual Factor Analysis

Analysis of interactions among individual factors were non-significant, PD, RM, and RS affected most dependent variables (Table 4). Early planting resulted in reduced established plant density compared to late planting, thereby affecting final plant densities (Table 4). Above-normal rainfall events before the early PD created poor seeding and emergence conditions. The yield of early PD soybean was significantly higher compared with late PD soybean. Delaying planting beyond May in the upper Midwest can reduce yields [32] and consequently resulted in a 9% decrease in partial net profit (Table 4). Although late planting provided better germination and establishment, early planting allows for greater accumulated solar radiation throughout the growing season providing greater yields comparatively [51]. In Japan, planting three weeks later than optimal decreased soybean yield due to reduced node production, slower canopy development [52]. Delaying planting can shorten vegetative and reproduction growth stage periods resulting in less radiation accumulation when planting after 20 May in Iowa [53].
The later RM cultivar yielded significantly higher than the early RM cultivar. Planting longer maturing (2.0) cultivars in Minnesota and Wisconsin tend to increase yields compared to earlier RM (0.5) confirming the trend in our experiment [22]. Cultivars had significant differences in seed protein, oil content, and weight, which can partly be explained by the genetics of the cultivar (Table 4). Other studies have also found that longer-maturing cultivars can accumulate greater amounts of solar radiation throughout the season often resulting in greater seed yield and oil content, and reduced protein content [51,54]. However, autumn frost damage is a risk in the northern growing region therefore selecting a RM which can mature before the average frost date is critical to maximize production.
Seeding rate did not have a significant effect on observations, other than plant stands. Established and final plant stands were greater for the higher SR (Table 4). Both SRs had similar stand loss from established to final density of around 9%. In southern Brazil, optimal SRs were greater in high yielding environments (>5000 kg ha−1) where SRs could be reduced by 18% without a yield penalty compared to low yield environments (<4000 kg ha−1) [55]. Gaspar et al. [56] recommends soybean farmers in Wisconsin to adjust SRs to the economic optimum of 255,000–293,000 seeds ha−1 for maximum yield. For this research, increasing the separation between the two SRs or adding additional rates may have shown an effect of SR.
Narrow rows were found to be superior to wider rows regarding yield. Cox and Cherney [28] found a linear increase in yield as RS when decreasing RS from 76 to 19 cm in north-central USA. Row spacing results showed the benefit of narrow RS (30.5 cm) in the northern USA soybean growing region (Table 4). Previous research in the northern USA soybean growing region deemed RS a major yield contributing factor with narrow RS (30.5 cm) providing a 6% greater yield than wide RS (61 cm) [9]. Andrade et al. [7] similarly reported 540 kg ha−1 yield benefit to narrow RS compared to wide RS. The yield increase in narrow RS is likely due to an advantage of increased light interception during the limited growing season [7]. Lee et al. [34] reported complete canopy cover at the R5 growth stage was required for maximum yield potential. Narrow RS of 19 and 38 cm also can provide weed control for multiple-resistant waterhemp (Amaranthus tuberculatus) which is commonly found in the north central growing region of the USA [57].
In general, PD was expected to be the most critical determinant of yield. Moreover, narrow RS improved yield and partial net profit by 7% compared to wider spacings (Table 4). Many previous studies have confirmed the importance of soybean RS particularly due to increased light interception [24,25]. Evaluating these individual effects within an improved management package of early PD, a late-maturing cultivar, high SR (457,000 seed ha−1), and narrow RS (30.5 cm) permits assessment of the potential synergism between four yield benefitting factors.
The fractional green canopy cover (FGCC) was significantly different across the growing season. The greatest FGCC occurred at R3 (89%) and R5 (90%). Canopy measurements at the V2, V4, R1, and R3 growth stages were significantly correlated with yield, with r2 values for all growth stages ranging from −0.05 to 0.36 which are not relatively strong relations (Table 5). The FGCC measurement at the V2 growth stage was the most closely correlated with yield, suggesting management practices that maximize FGCC may improve soybean yields. Edreira et al. [51] found that the average producer can improve their accumulated photosynthetically active radiation, and therefore seed yield by 14%, through earlier canopy closure. Our data reinforces that maximization of FGCC earlier in the season likely improves light interception and seed yield. Although significant, the associations between V2 and R3 growth stages and yield were relatively poor (on average r2 = 0.24). Additionally, subsequent environmental events (e.g., drought, hail, early frost) can alter seed yield after early canopy measurements making these measurements unreliable for end-season seed yield predictions.

3.3. Treatment Package Analysis

Analysis by packages allowed for a more comprehensive depiction of a producer’s management system as producers typically compare yield differences through a systematic approach. The package analysis followed similar trends as the individual factor analysis (PD, RM, and RS). Although factors like early planting, late RM, and narrow RS have yield advantages alone, consolidating these factors into a singular package can improve yield when compared to other potential packages farmers may use.
Established and final plant stand results did not show any definite trends related to the packages (Table 6). In general, packages with the early RM cultivar had higher protein content and lower oil content, with the inverse true for the late RM, however, this is mostly due to the genetics of the cultivars used. Conventional compared to the improved package did not differ for plant stand, protein content, oil content, and seed weight. Producers are currently not directly compensated for relatively high protein or oil content and should not consider them when investigating profitability.
The improved management strategy provided for higher yield (26% increase) and partial net profit (+$350 ha−1) compared to conventional practices (Table 6). Comparing the conventional to treatment 8 (Table 6), the difference in RS had a non-significant yield increase, suggesting that a change in RS does not impact yield or partial net profit if a late RM soybean is planted late at a lower SR. In this case, changing the SR of the improved treatment to the lower SR (Treatment 5) results in similar profits, but would likely buffer plant density-reducing events (e.g., disease, hail, early frost). Schmitz et al. [9] found increased yields associated with narrow RS compared to wide RS in the same growing region. In North Dakota, in the absence of ideal temperature and rainfall, wide RS can result in incomplete canopy closure, whereas narrow RS improves the potential to maximize accumulated photosynthetically active radiation, therefore, increasing grain yield [24,51].

4. Conclusions

Our research benefits soybean producers in the north-central USA region, as other research on these management strategies has been limited in this region. Planting as early as appropriate and using narrow RS can increase soybean yield. Although an individual management strategy may not improve yields alone, combining yield-promoting management practices provided greater yield and partial net profit compared to conventional practices. These findings display a synergistic yield effect when combining favorable management strategies. The relationship between canopy cover at early growth stages and yield was significant; however, it is important to consider that various environmental stressors can influence seed yield beyond early season measurements. It is recommended that northern USA soybean producers combine favorable management practices of early planting, optimal maturity cultivars adapted to the area, and narrow RSs to maximize yield potential.

Author Contributions

P.K.S.: literature review, conceptualization, methodology, research, formal statistical analysis, writing—original draft, and writing—review and editing. H.J.K.: funding acquisition, project administration, conceptualization, investigation, supervision, and writing—review and editing. All authors have read and agreed to the published version of the manuscript.

Funding

This project was funded by a grant from the North Central Soybean Research Program through the ‘Boots on the Ground: Validation of Benchmarking Process through an Integrated On-Farm Partnership’ project and research funding from the North Dakota State University Agricultural Experiment Station.

Acknowledgments

The authors would like to thank Chad Deplazes for his technical research assistance.

Conflicts of Interest

The authors declare no conflict of interest.

References

  1. NASS-USDA. Crop Production. 2020. Available online: https://www.nass.usda.gov/Publications/Todays_Reports/reports/crop0920.pdf (accessed on 22 March 2021).
  2. Haugen, R. Projected 2021 Crop Budgets: South Valley North Dakota. North Dakota State Univ. Ext. Pub. 2021. EC1660. Available online: https://www.ag.ndsu.edu/farmmanagement/crop-budget-archive (accessed on 22 March 2021).
  3. Rattalino Edreira, J.I.; Mourtzinis, S.; Conley, S.P.; Roth, A.C.; Ciampitti, I.A.; Licht, M.A.; Kandel, H.J.; Kyveryga, P.M.; Lindsey, L.E.; Mueller, D.S.; et al. Assessing causes of yield gaps in agricultural areas with diversity in climate and soils. Agric. For. Meteorol. 2017, 247, 170–180. [Google Scholar] [CrossRef]
  4. Mourtzinis, S.; Rattalino Edreira, J.I.; Grassini, P.; Roth, A.; Casteel, S.N.; Ciampitti, I.A.; Kandel, H.J.; Kyveryga, P.M.; Licht, M.A.; Lindsey, L.E.; et al. Sifting and winnowing: Analysis of farmer field data for soybean in the US North-Central region. Field Crops Res. 2018, 211, 130–141. [Google Scholar] [CrossRef]
  5. Gaspar, A.P.; Mourtzinis, S.; Kyle, D.; Galdi, E.; Lindsey, L.E.; Hamman, W.P.; Matcham, E.G.; Kandel, H.J.; Schmitz, P.K.; Stanley, J.D.; et al. Defining optimal soybean seeding rates and associated risk across North America. Agron. J. 2020, 112, 2103–2114. [Google Scholar] [CrossRef] [Green Version]
  6. Stanley, J.D. Yield-limiting factors in North Dakota soybean fields. Master’s Thesis, North Dakota State University, Fargo, ND, USA, November 2017. [Google Scholar]
  7. Andrade, J.F.; Rattalino Edreira, J.I.; Mourtzinis, S.; Conley, S.P.; Ciampitti, I.A.; Dunphy, J.E.; Gaska, J.M.; Glewen, K.; Holshouser, D.L.; Kandel, H.J.; et al. Assessing the influence of row spacing on soybean yield using experimental and producer survey data. Field Crops Res. 2019, 230, 98–106. [Google Scholar] [CrossRef]
  8. Endres, G.; Kandel, H.J.; Schmitz, P.K.; Eriksmoen, E.; Pradhan, G.; Rickertsen, J. Soybean Response to Planting Rates and Row Spacings in North Dakota; North Dakota State Univ. Ext. Pub.: Fargo, ND, USA, 2020; p. A1961. [Google Scholar]
  9. Schmitz, P.K.; Stanley, J.D.; Kandel, H.J. Row spacing and seeding rate effect on soybean seed yield in North Dakota. Crop. Forage Turfgrass Manag. 2020. [Google Scholar] [CrossRef]
  10. Cartter, J.; Hartwig, E.E. The management of soybeans. In The Soybean: Genetics, Breeding, Physiology, Nutrition, Management; Norman, A.G., Ed.; Academic Press: New York, NY, USA, 1963; pp. 161–226. [Google Scholar] [CrossRef]
  11. Lueschen, W.E.; Ford, J.H.; Evans, S.D.; Kanne, B.K.; Hoverstad, J.R.; Randall, G.W.; Orf, J.H.; Hicks, D.R. Tillage, row spacing, and planting date effects on soybean following corn and wheat. J. Prod. Agric. 1992, 5, 254–260. [Google Scholar] [CrossRef]
  12. Anderson, L.R.; Vasilas, B.L. Effects of planting date on two soybean cultivars: Seasonal dry matter accumulation and seed yield. Crop Sci. 1985, 25, 999–1004. [Google Scholar] [CrossRef]
  13. Elmore, R.W. Soybean cultivar response to tillage systems and planting date. Agron. J. 1990, 82, 69–73. [Google Scholar] [CrossRef]
  14. Oplinger, E.S.; Philbrook, B.D. Soybean planting date, row width, and seeding rate response in three tillage systems. J. Prod. Agric. 1992, 5, 94–99. [Google Scholar] [CrossRef]
  15. Pedersen, P.; Lauer, J.G. Soybean agronomic response to management systems in the upper midwest. Agron. J. 2005, 95, 1146–1151. [Google Scholar] [CrossRef] [Green Version]
  16. Robinson, A.P.; Conley, S.P.; Volenec, J.J.; Santini, J.B. Analysis of high yielding, early-planted soybean in Indiana. Agron. J. 2009, 101, 131–139. [Google Scholar] [CrossRef]
  17. Kucharik, C.J.; Serbin, S.P.; Vavrus, S.; Hopkins, E.J.; Motew, M.M. Patterns of climate change across Wisconsin from 1950 to 2006. Phys. Geogr. 2010, 31, 1–28. [Google Scholar] [CrossRef] [Green Version]
  18. Gaspar, A.P.; Conley, S.P. Responses of canopy reflectance, light interception, and soybean seed yield to replanting suboptimal stands. Crop Sci. 2015, 55, 377–385. [Google Scholar] [CrossRef]
  19. Boerma, H.R.; Specht, J.E. (Eds.) Soybeans: Improvement, Production, and Uses, 3rd ed.; ASA; CSSA; SSSA: Madison, WI, USA, 2004. [Google Scholar] [CrossRef]
  20. Kandel, H.; Endres, G. Soybean Production Field Guide for North Dakota; North Dakota State Univ. Ext. Pub.: Fargo, ND, USA, 2019; p. A1172. [Google Scholar]
  21. Mourtzinis, S.; Conley, S.P. Delineating soybean maturity groups across the US. Agron. J. 2017, 109, 1–7. [Google Scholar] [CrossRef] [Green Version]
  22. Mourtzinis, S.; Gaspar, A.; Naeve, S.; Conley, S.P. Planting date, maturity, and temperature effects on soybean seed yield and quality. Agron. J. 2017, 109, 1–10. [Google Scholar] [CrossRef] [Green Version]
  23. Shibles, R.M.; Weber, C.R. Interception of solar radiation and dry matter production by various soybean planting patterns. Crop Sci. 1966, 6, 55–59. [Google Scholar] [CrossRef]
  24. Andrade, F.H.; Calviño, P.; Cirilo, A.; Barbieri, P. Yield responses to narrow rows depend on increased radiation interception. Agron. J. 2002, 94, 975–980. [Google Scholar] [CrossRef]
  25. Bullock, D.; Khan, S.; Rayburn, A. Soybean yield response to narrow rows is largely due to enhanced early growth. Crop Sci. 1998, 38, 1011–1016. [Google Scholar] [CrossRef]
  26. De Bruin, J.L.; Pedersen, P. Effect of row spacing and seeding rate on soybean yield. Agron. J. 2008, 100, 704–710. [Google Scholar] [CrossRef]
  27. Cooper, R.L. Response of soybean cultivars to narrow rows and planting rates under weed-free conditions. Agron. J. 1997, 69, 89–92. [Google Scholar] [CrossRef]
  28. Cox, W.J.; Cherney, J.H. Growth and yield responses of soybean to row spacing and seeding rate. Agron. J. 2011, 103, 123–128. [Google Scholar] [CrossRef]
  29. Devlin, D.L.; Fjell, D.L.; Shroyer, J.P.; Gordon, W.B.; Marsh, B.H.; Maddux, L.D.; Martin, V.L.; Duncan, S.R. Row spacing and seeding rates for soybean in low and high yielding environments. J. Prod. Agric. 1995, 8, 143–215. [Google Scholar] [CrossRef]
  30. Ethredge, W.J.; Ashley, D.A.; Woodruff, J.M. Row spacing and plant population effects on yield components of soybean. Agron. J. 1989, 81, 947–951. [Google Scholar] [CrossRef]
  31. Alessi, J.; Power, J.F. Effects of plant and row spacing on dryland soybean yield and water-use efficiency. Agron. J. 1982, 74, 851–854. [Google Scholar] [CrossRef] [Green Version]
  32. De Bruin, J.L.; Pedersen, P. Soybean seed yield response to planting date and seeding rate in the upper midwest. Agron. J. 2008, 100, 696–703. [Google Scholar] [CrossRef]
  33. Goos, R.J.; Johnson, B. Seed treatment, seeding rate, and cultivar effects on iron deficiency chlorosis of soybean. J. Plant Nutr. 2001, 24, 1255–1268. [Google Scholar] [CrossRef]
  34. Lee, C.D.; Egli, D.B.; TeKrony, D.M. Soybean response to plant population at early and late planting dates in the mid-south. Agron. J. 2008, 100, 971–976. [Google Scholar] [CrossRef]
  35. Shepherd, M.J.; Lindsey, L.E.; Lindsey, A.J. Soybean canopy cover measured with Canopeo compared with light interception. Agric. Environ. Lett. 2018, 3, 180031. [Google Scholar] [CrossRef] [Green Version]
  36. Lee, C.D. Reducing row widths to increase yield: Why it does not always work. Crop Manag. 2006, 5. [Google Scholar] [CrossRef]
  37. Wells, R. Soybean growth response to plant density: Relationships among canopy photosynthesis, leaf area, and light interception. Crop Sci. 1991, 31, 755–791. [Google Scholar] [CrossRef]
  38. Egli, D.B. Mechanisms responsible for soybean yield response to equidistant planting patterns. Agron. J. 1994, 86, 1046–1049. [Google Scholar] [CrossRef]
  39. Patrignani, A.; Ochsner, T.E. Canopeo: A powerful new tool for measuring fractional green canopy cover. Agron. J. 2015, 107, 2312–2320. [Google Scholar] [CrossRef] [Green Version]
  40. Goodwin, A.W.; Lindsey, L.E.; Harrison, S.K.; Paul, P.A. Estimating wheat yield with normalized difference vegetation index and fractional green canopy cover. Crop. Forage Turfgrass Manag. 2018, 4, 1–6. [Google Scholar] [CrossRef] [Green Version]
  41. Singer, J. Soybean light interception and yield response to row spacing and biomass removal. Crop Sci. 2001, 41, 424–429. [Google Scholar] [CrossRef]
  42. Gardner, F.P.; Auma, E.O. Canopy structure, light interception, and yield and market quality of peanut genotypes as influenced by planting pattern and planting date. Field Crop. Res. 1989, 20, 13–29. [Google Scholar] [CrossRef]
  43. Kandel, H.J.; Brodshaug, J.A.; Steele, D.D.; Ransom, J.K.; DeSutter, T.M.; Sands, G.R. Subsurface Drainage Effects on Soil Penetration Resistance and Water Table Depth on a Clay Soil in the Red River of the North Valley, USA. Agric. Eng. Int. CIGR J. 2013, 15, 1–10. [Google Scholar]
  44. Ragsdale, D.W.; McCornack, B.P.; Venette, R.C.; Potter, B.D.; Macrae, I.V.; Hodgson, E.W. Economic threshold for soybean aphid (Hemiptera: Aphididae). J. Econ. Entomol. 2007, 100, 1258–1267. [Google Scholar] [CrossRef]
  45. Fehr, W.R.; Caviness, C.E.; Burmood, D.T.; Pennington, J.S. Stage of development descriptions for soybeans, Glycine Max (L.) Merrill. Crop Sci. 1971, 11, 929–931. [Google Scholar] [CrossRef]
  46. NDAWN. North Dakota Agricultural Weather Network. North Dakota State Univ., Fargo, ND, USA, 2021. Available online: http://ndawn.ndsu.nodak.edu (accessed on 22 March 2021).
  47. Tabachnick, B.G.; Fidell, L.S. Using Multivariate Statistics, 4th ed.; Harper Collins: New York, NY, USA, 2001. [Google Scholar]
  48. Carmer, S.G.; Nyquist, W.E.; Walker, W.M. Least significant differences for combined analyses of experiments with two- or three-factor treatment designs. Agron. J. 1998, 81, 665–672. [Google Scholar] [CrossRef]
  49. Littell, R.C.; Milliken, G.A.; Stroup, W.W.; Wolfinger, R.D.; Schabenberger, O. SAS for Mixed Models, 2nd ed.; SAS Institute Inc.: Cary, NC, USA, 2006. [Google Scholar]
  50. Plastina, A. Estimated Cost of Crop Production in Iowa—2021, FM 1712, Ag Decision Maker; Iowa State University: Ames, IA, USA, 2021. [Google Scholar]
  51. Rattalino Edreira, J.I.; Mourtzinis, S.; Azzari, G.; Andrade, J.F.; Conley, S.P.; Specht, J.E.; Grassini, P. Combining field-level data and remote sensing to understand impact of management practices on producer yields. Field Crops Res. 2020, 257, 107932. [Google Scholar] [CrossRef]
  52. Kumagai, E.; Takahashi, T. Soybean (Glycine max (L.) Merr.) Yield reduction due to late sowing as a function of radiation interception and use in a cool region of northern Japan. Agronomy 2020, 10, 66. [Google Scholar] [CrossRef] [Green Version]
  53. Kessler, A.; Archontoulis, S.V.; Licht, M.A. Soybean yield and crop stage response to planting date and cultivar maturity in Iowa, USA. Agron. J. 2020, 112, 382–394. [Google Scholar] [CrossRef]
  54. Monteith, J.L. Solar radiation and productivity in tropical ecosystems. J. Appl. Ecol. 1972, 9, 747–766. [Google Scholar] [CrossRef] [Green Version]
  55. Corassa, G.M.; Amando, T.J.C.; Strieder, M.L.; Schwalbert, R.; Pires, J.L.F.; Carter, P.R.; Ciampitti, I.A. Optimum soybean seeding rates by yield environment in southern Brazil. Agron. J. 2018, 110, 2430–2438. [Google Scholar] [CrossRef]
  56. Gaspar, A.P.; Mueller, D.S.; Wise, K.A.; Chilvers, M.I.; Tenuta, A.U.; Conley, S.P. Response of broad-spectrum and target-specific seed treatments and seeding rate on soybean seed yield, profitability, and economic risk. Crop Sci. 2016, 57, 2251–2262. [Google Scholar] [CrossRef] [Green Version]
  57. Shultz, J.L.; Myers, B.; Bradley, K.W. Influence of soybean seeding rate, row spacing, and herbicide programs on the control of resistant waterhemp in glufosinate-resistant soybean. Weed Technol. 2015, 29, 169–176. [Google Scholar] [CrossRef]
Figure 1. Soybean growing season weekly (week 1 starts at 1 May) mean temperatures after seeding and rainfall totals for 2019 and 2020 Fargo environments.
Agronomy 11 00605 g001
Table 1. Important dates and environment information for 2019 and 2020 soybean environments.
Planting Date
SCN 120192020Harvest Date
Environment20192020121220192020
eggs 100 cc−1DOY
Fargo00137154133149302275
1 SCN, Soybean cyst nematode; DOY, Day of year. DOY 135 is 15 May and DOY 280 is 7 October.
Table 2. Soybean cultivars used and descriptive features.
NDSUCompany
CultivarMaturityIDC 1IDCSCN 2CanopyHeight
AG 05x90.52.43RMediumMedium
AG 08x80.8-4RMediumMedium Tall
1 IDC, iron deficiency chlorosis. NDSU IDC scored on 1–5 scale (1 = green, 5 = dead) [33]. Company IDC scored on 1–9 scale (1 = green 9 = dead). 2 SCN, soybean cyst nematode; R, resistant.
Table 3. Soil test results for soybean environments in 2019 and 2020.
DepthNO3-NPKpHOM
cmkg ha−1mg kg−1 %
2019
0–1581549586
15–6114530084
2020
0–15221848986
15–6126635384
Table 4. Mean agronomic trait observations for planting date, relative maturity, seeding rate, and row spacing averaged across controlled tile drainage and naturally environments in 2019 and 2020 for a total of 4 environments.
SOV 1ESFSProteinOilTSWYieldPartial Net ProfitFGCC
PDplants ha−1g kg−1g kg ha−1$ ha−1%
Early380,608 b344,881 b335 a173 a140 a3884 a1604 a56 a
Late432,649 a403,757 a335 a171 a137 a3573 b1476 b58 a
RM
Early409,419 a362,826 a339 a168 b142 a3584 a1480 a56 a
Late403,838 a385,812 a331 b176 a136 b3873 a1600 a58 a
SR
seeds ha−1
408,000392,081 b360,607 b334 a172 a139 a3686 a1522 a57 a
457,000421,176 a388,031 a335 a172 a139 a3772 a1557 a58 a
RS
cm
30.5424,782 a395,411 a334 a173 a138 a3862 a1595 a59 a
61388,475 a353,227 a336 a171 a140 a3596 b1485 b55 a
Within columns, for each main factor, means followed by the same letter are not significantly different at p ≤ 0.05. 1 SOV, source of variation; ES, established stand; FS, final stand; TSW, 1000 seed weight.
Table 5. Simple correlation coefficients for the relationship between soybean seed yield and fractional green canopy cover (FGCC) measured at different growth stages throughout the growing season for the combined environments in 2019 and 2020.
Correlations
Growth Stager2pFGCC
%
V20.36<0.00111 e
V40.23<0.00146 c
R10.140.03375 b
R30.210.00289 a
R50.100.13890 a
R7−0.050.44233 d
Within column, means followed by the same letter are not significantly different at p ≤ 0.05.
Table 6. Treatment package means and contrasts for soybean agronomic characteristics and partial net averaged across environments in 2019 and 2020.
Package 1PD 2RMSRRSESFSProteinOilTSWYieldPartial Net Profit 3FGCC
seeds ha−1 plants ha−1g kg−1gkg ha−1$ ha−1%
IEL457,000N326,306 a399,705 bcd330 f177 ab136bcd4162a1719 a58 a
CLE408,000W396,754 a536,117 abc339 abcd165 e143abc3316g1369 g57 a
1EE408,000N289,801 a331,818 d338 abcde170 bcde139 abcd3867 abcde1597 abcde55 a
2EE457,000N321,823 a365,121 cd339 abcd170 bcde142 abcd3843 abcde1587 abcde53 a
3EE408,000W335,272 a457,984 abcd340 ab170 bcde147 a3639 bcdefg1503 bcdefg58 a
4EE457,000W369,215 a526,511 abcd340 ab168 de147 a3581 cdefg1478 cdefg60 a
5EL408,000N348,081 a425,322 abcd331 def180 a141 abcd4085 ab1687 ab54 a
6EL408,000W334,631 a470,793 abcd330 f174 abcd136 bcd3831 abcde1582 abcde55 a
7EL457,000W353,204 a489,366 abcd333 bcdef178 ab138 abcd4013 abc1657 abc56 a
8LE408,000N355,125 a424,041 abcd339 abcd167 de140 abcd3489 defg1441 defg60 a
9LE457,000N376,260 a458,625 abcd337 abcdef171 bcde136 bcd3670 bcdefg1515 bcdefg54 a
10LE457,000W421,731 a593,116 ab341 a167 de145 ab3356 fg1385 fg56 a
11LL408,000N304,531 a413,794 abcd330 f176 abc136 bcd3783 abdef1562 abcdef62 a
12LL457,000N361,831 a471,787 abcd332 cdef174 abcd133 d3944 abcd1629 abc61 a
13LL408,000W398,675 a579,027 ab331 def174 abcd133 d3437 efg1419 efg56 a
14LL457,000W421,090 a604,644 a333 bcdef174 abcd134 cd3542 defg1462 defg57 a
Pns<0.001<0.001<0.001<0.001<0.001<0.001ns
Improved vs. Conventional P0.5720.8090.9620.5100.9560.0040.0040.518
Within the column, means for each treatment followed by the same letter are not significantly different at p ≤ 0.05. 1 I, suggested improved management for growers; C, conventional management currently used by growers. 2 PD, planting date; RM, relative maturity; SR, seeding rate; RS, row spacing; E, Early; L, Late; N, narrow (30.5 cm) row spacing; W, Wide (61 cm) row spacing; TSW, 1000 seed weight; FGCC, fractional green canopy cover. 3 Partial net profit accounts for $49.20 per 140 000 seeds and $0.41 kg−1 market price.
Publisher’s Note: MDPI stays neutral with regard to jurisdictional claims in published maps and institutional affiliations.

