
Strawberry Flavor Is Influenced by the Air Temperature Differential during Fruit Development but Not Management Practices

Abstract
1. Introduction
2. Materials and Methods
2.1. Farm Survey Methods
2.2. Research Farm Methods
2.3. Methods for Both Regional Farm Samples and Research Farm Plots
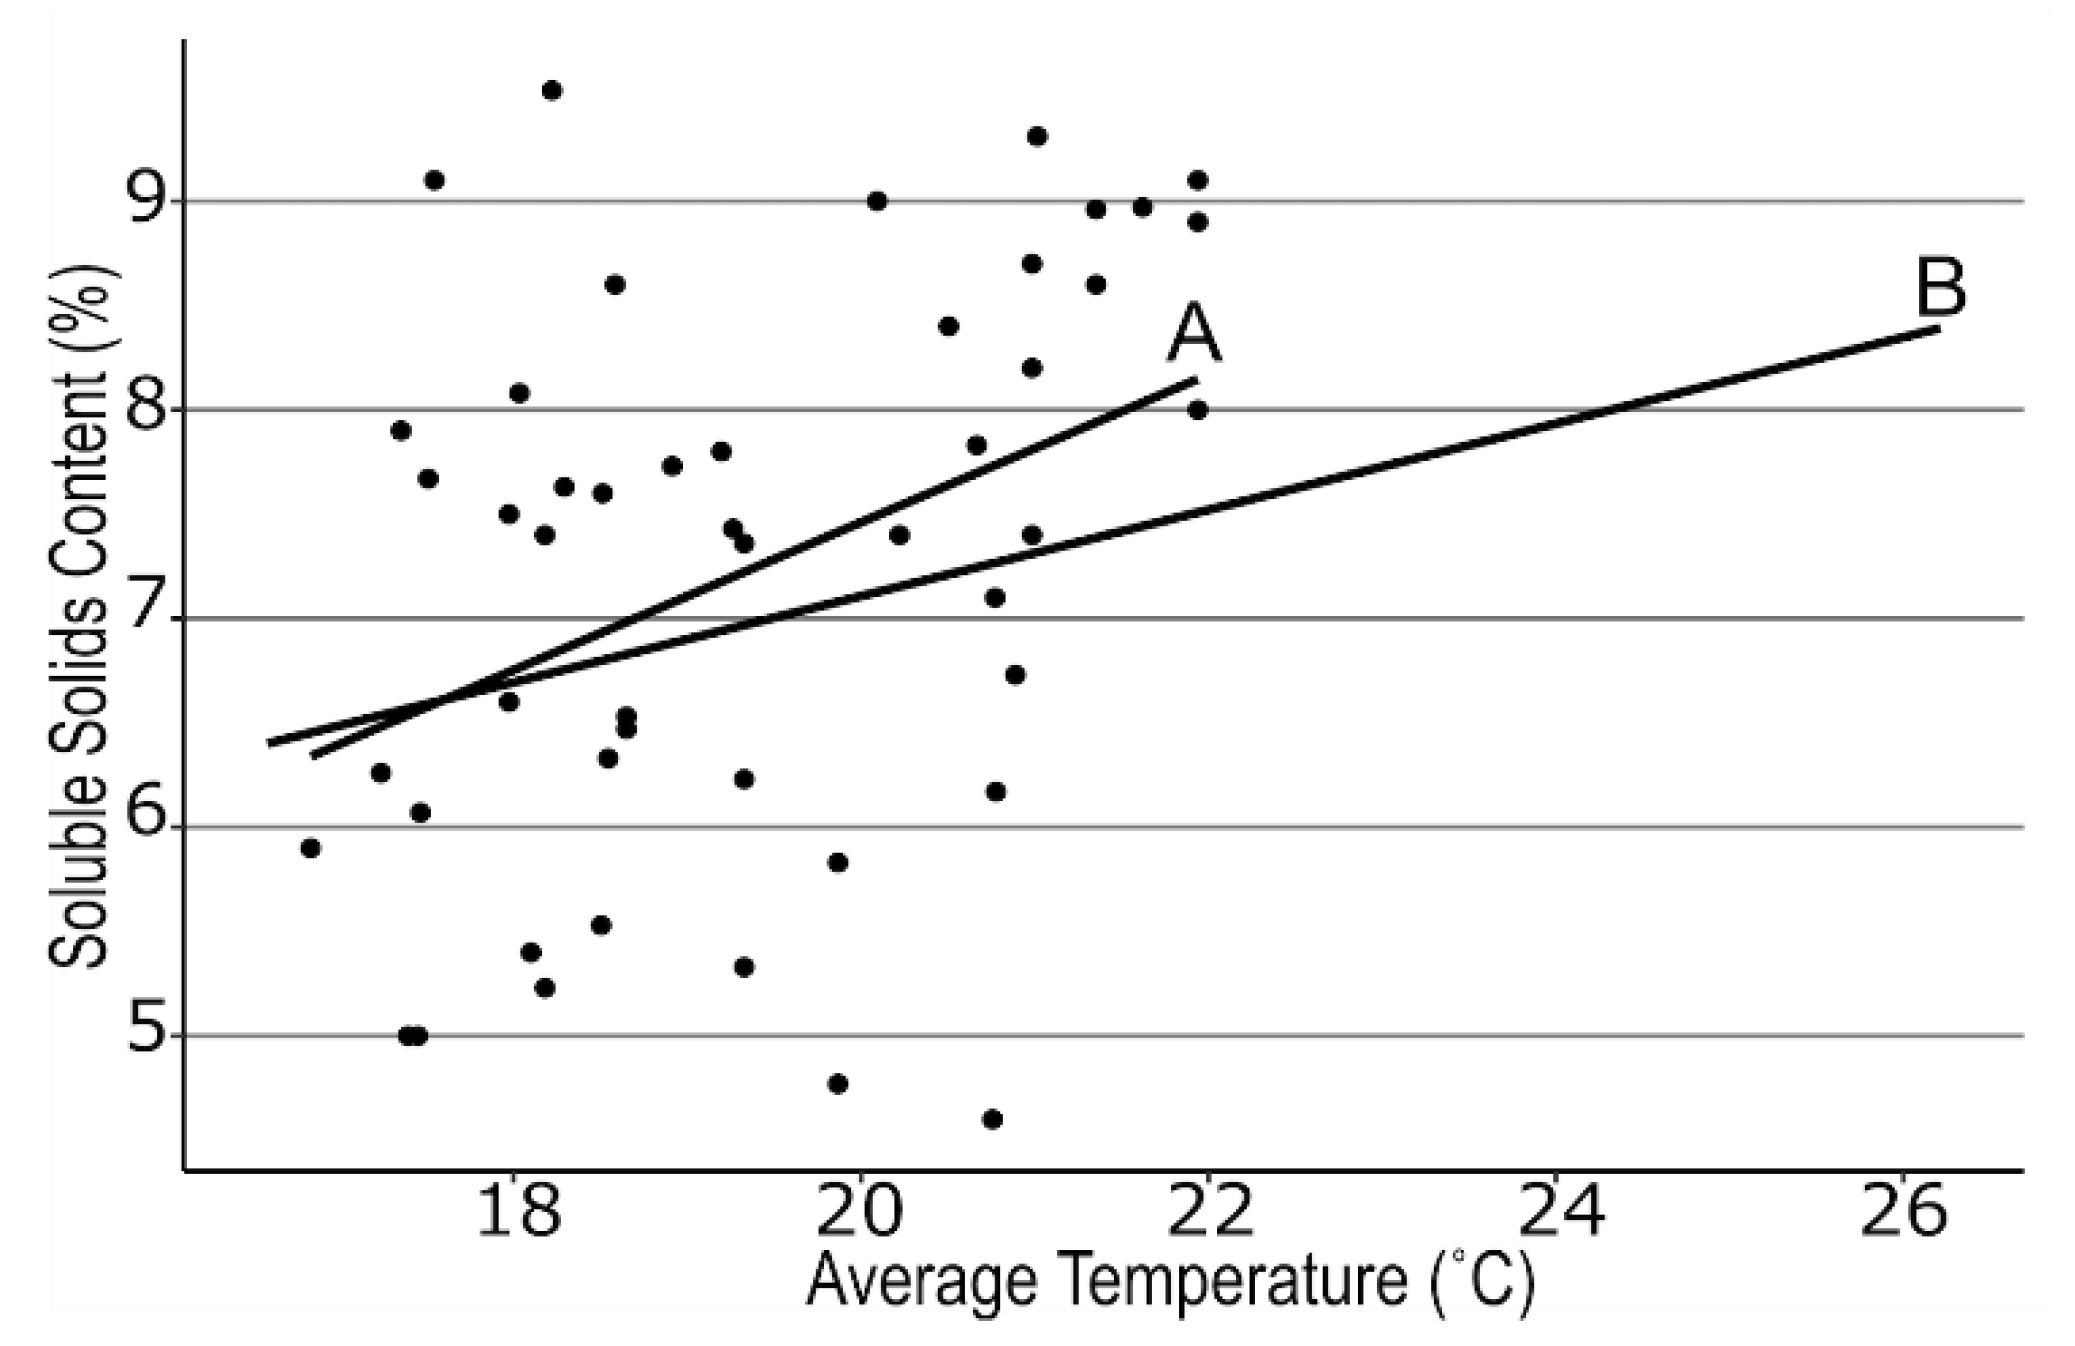
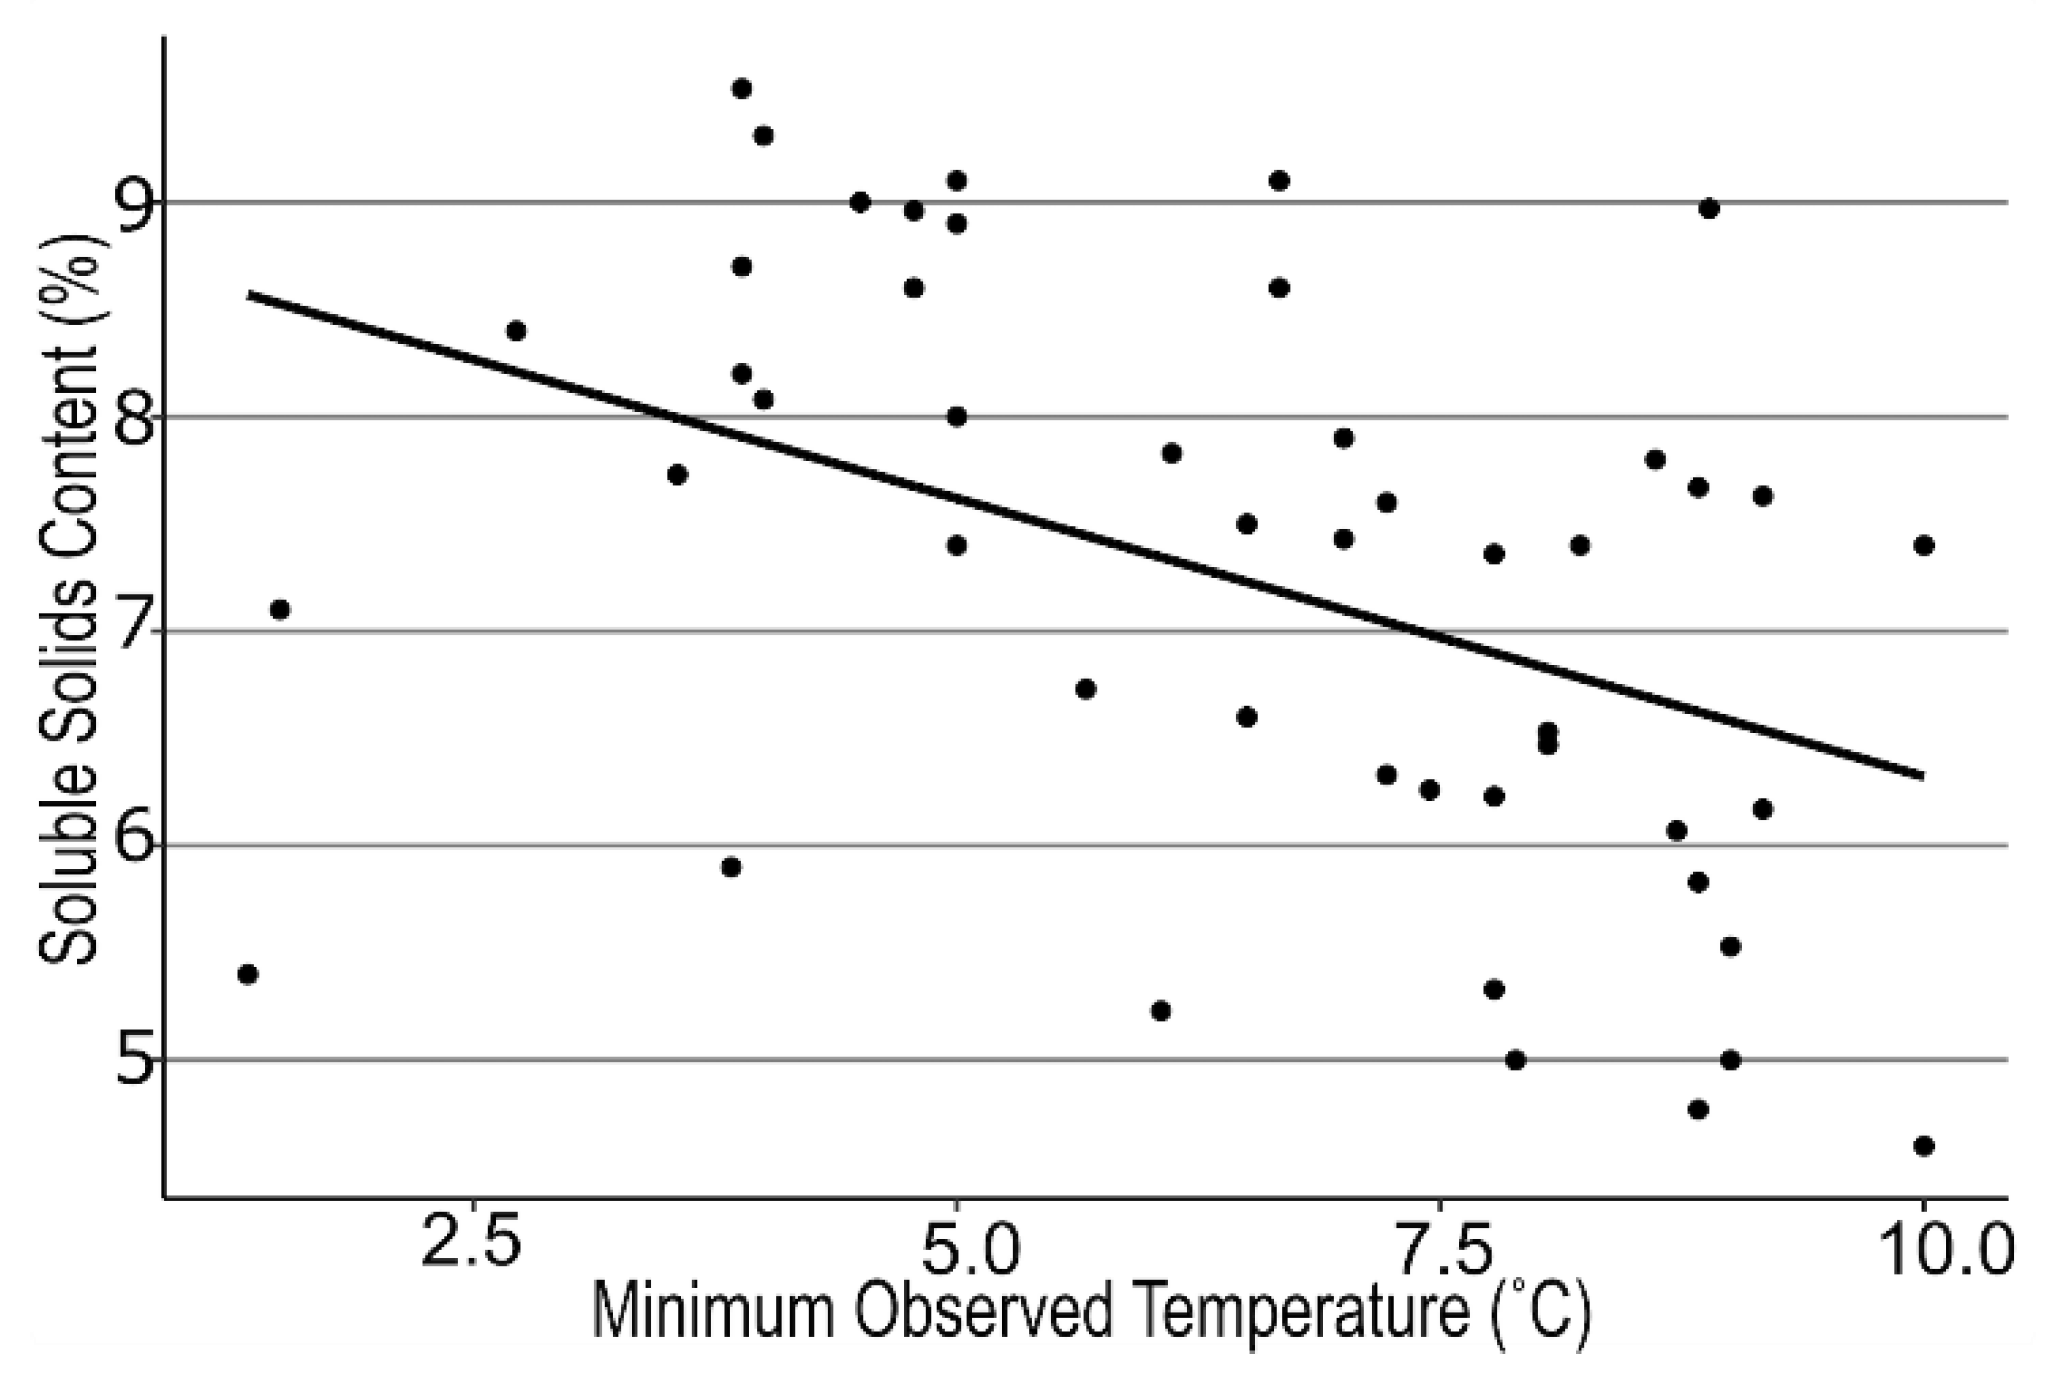
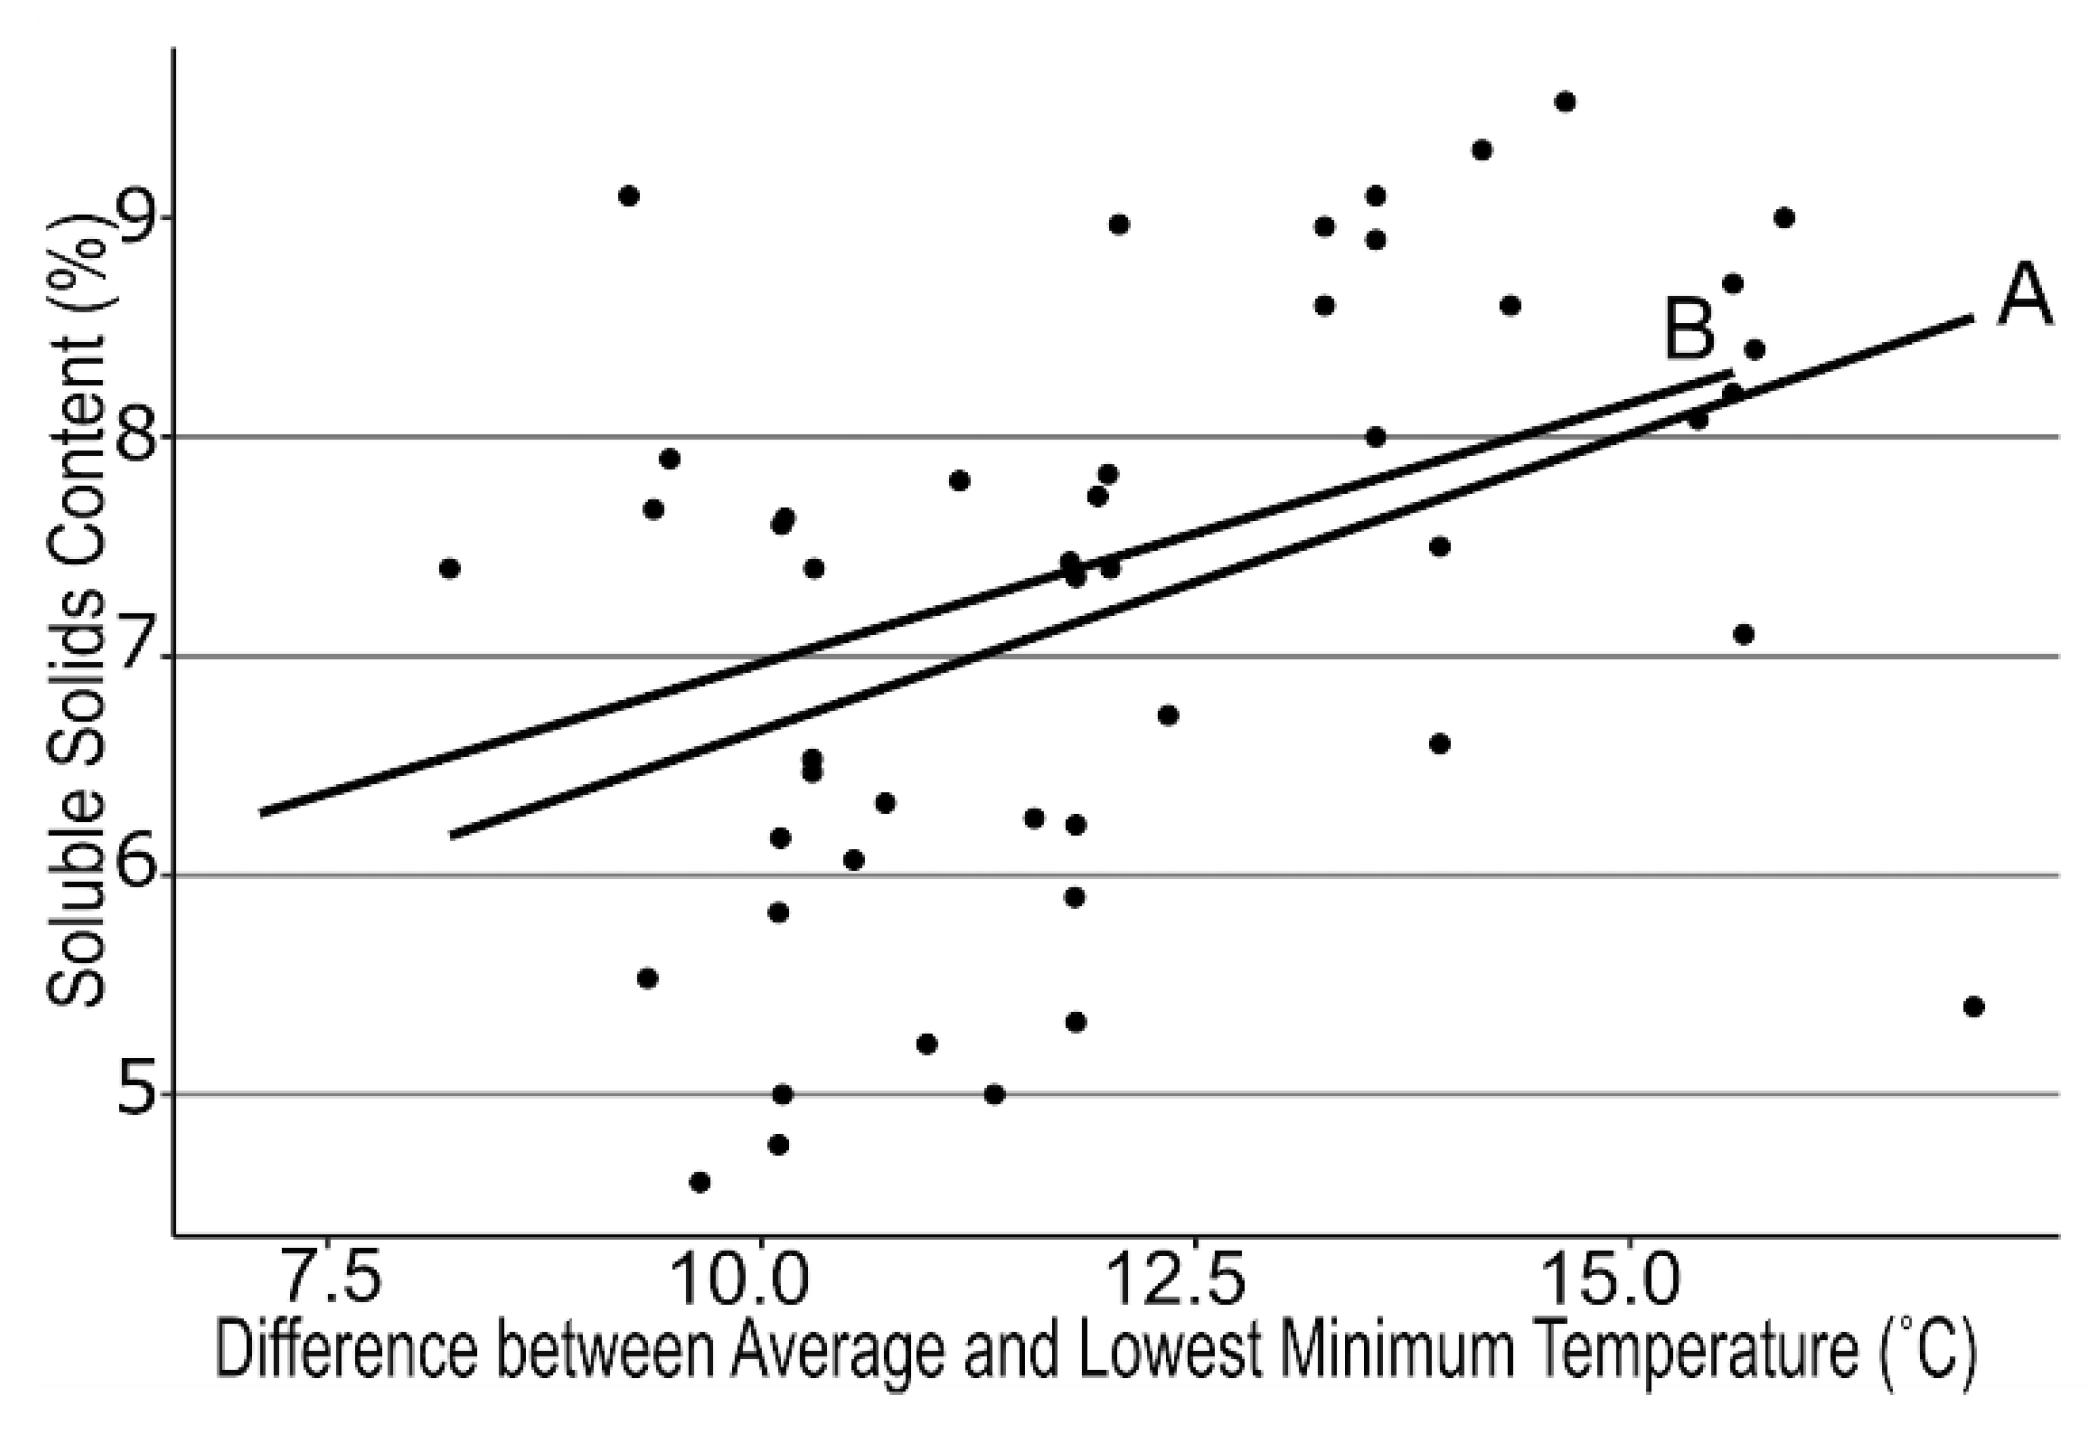
3. Results
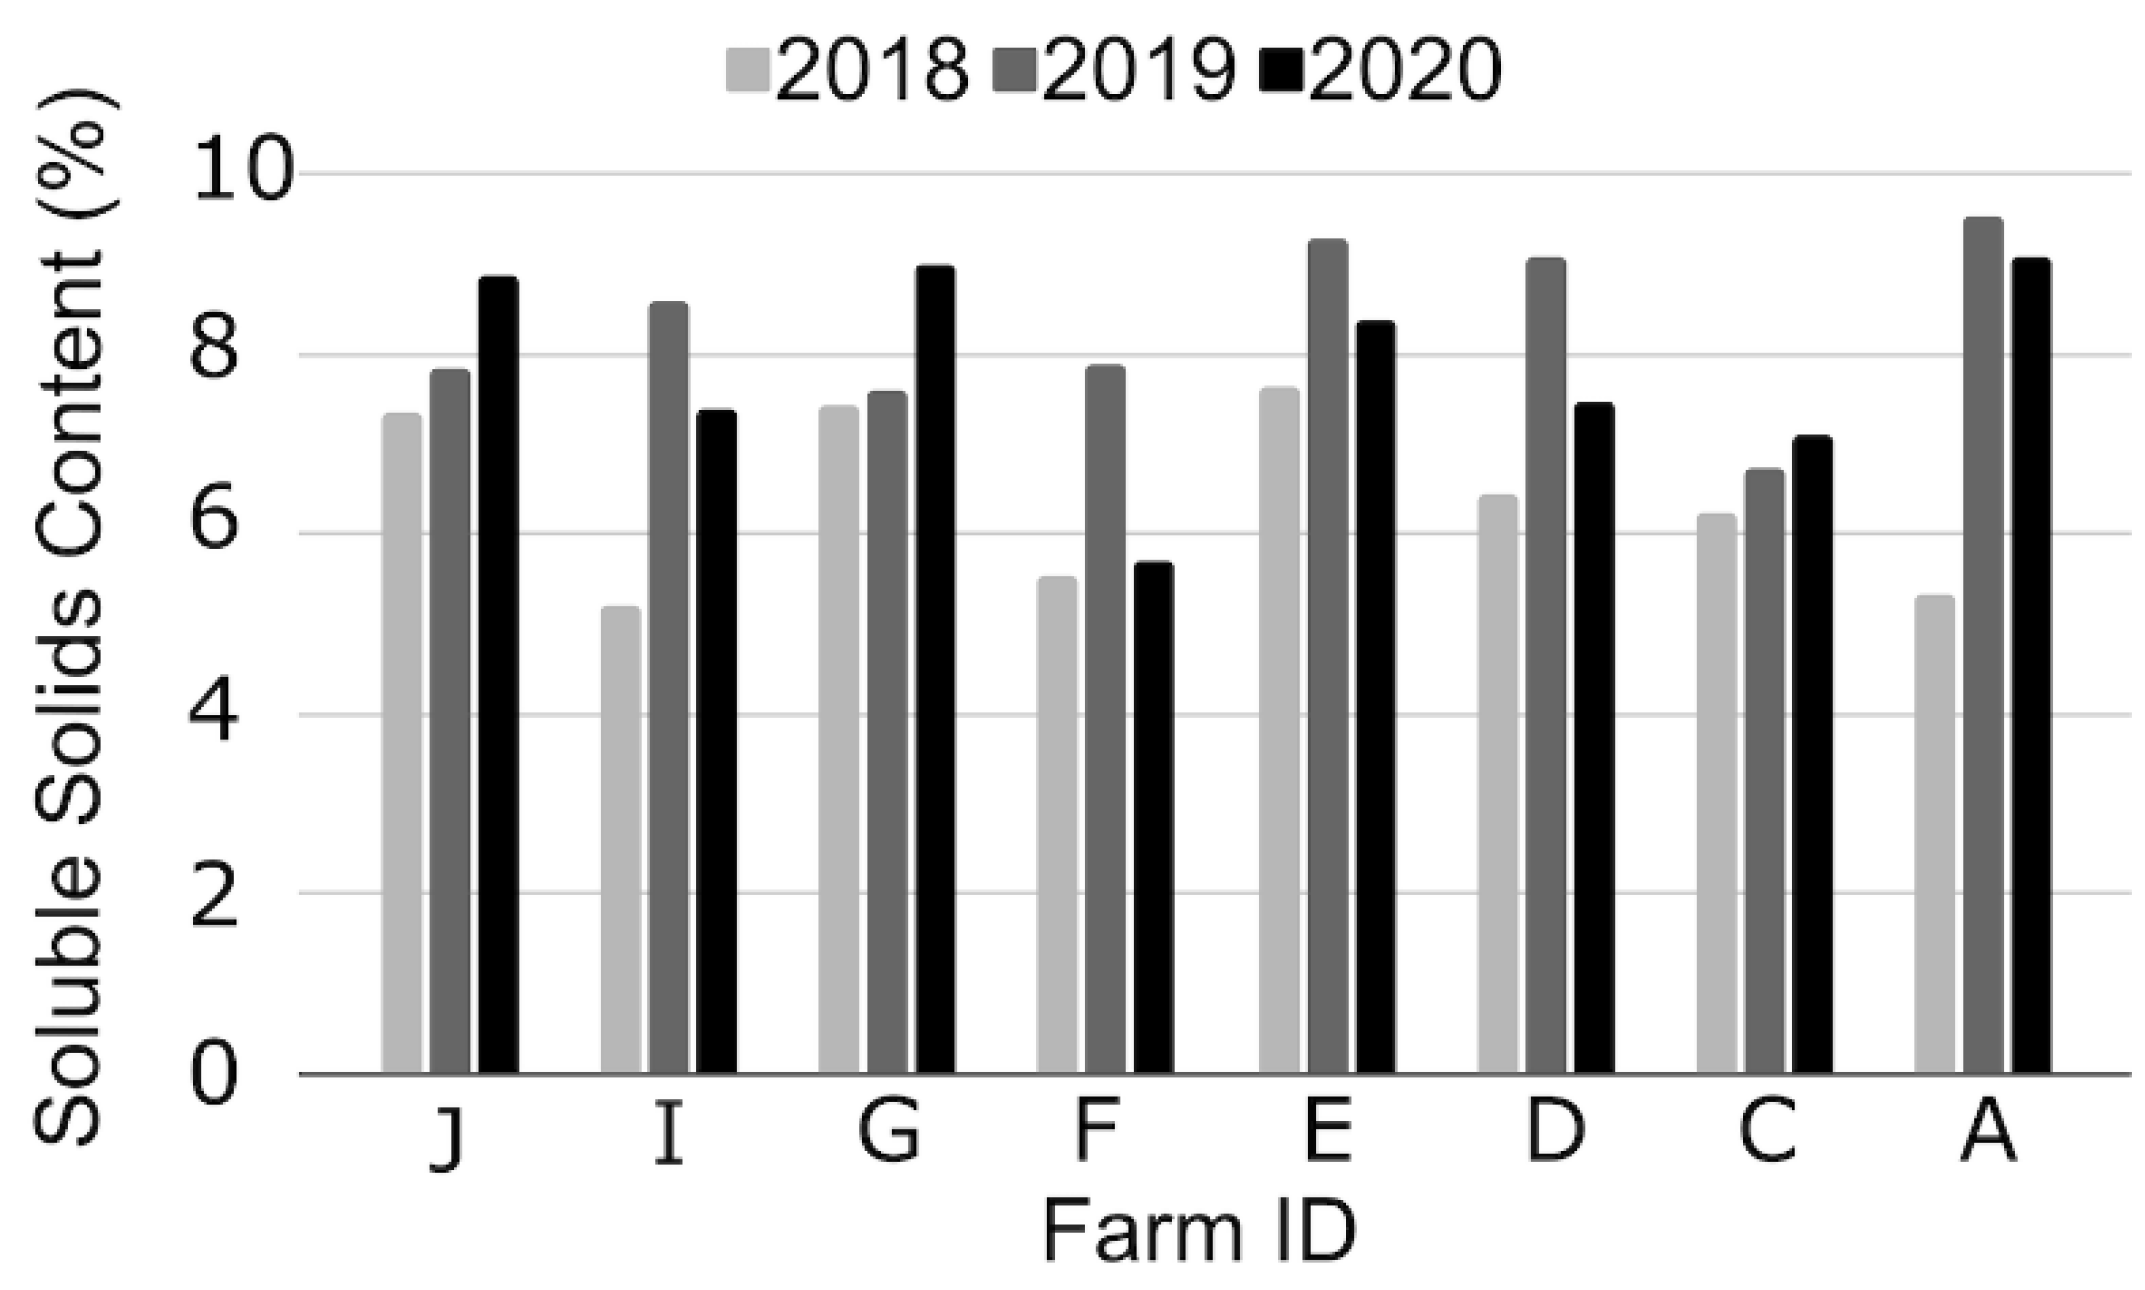
3.1. Grower Samples
3.2. Research Farm Trials
4. Discussion
5. Conclusions
Author Contributions
Funding
Institutional Review Board Statement
Informed Consent Statement
Data Availability Statement
Acknowledgments
Conflicts of Interest
References
- Azodanlou, R.; Darbellay, C.; Luisier, J.L.; Villettaz, J.C.; Amado, R. Quality assessment of strawberries (Fragaria species). J. Agric. Food. Chem. 2003, 51, 715–721. [Google Scholar] [CrossRef] [PubMed]
- Schwieterman, M.L.; Colquhoun, T.A.; Jaworski, E.A.; Bartoshuk, L.M.; Gilbert, J.L.M.; Tieman, J.D.; Odabasi, A.Z.; Moskowitz, H.R.; Folta, K.M.; Klee, H.J.; et al. Strawberry flavor: Diverse chemical compositions, a seasonal influence, and effects on sensory perception. PLoS ONE 2014, 9, e88446. [Google Scholar] [CrossRef]
- Samtani, J.B.; Rom, C.R.; Friedrich, H.; Fennimore, S.A.; Finn, C.E.; Petran, A.; Wallace, R.W.; Pritts, M.P.; Fernandez, G.; Chase, C.A.; et al. The status and future of the strawberry industry in the United States. HortTechnology 2019, 29, 11–24. [Google Scholar] [CrossRef]
- Crecente–Campo, J.M.; Nunes–Damaceno, M.A.; Rodriguez, R.; Vazquez–Oderiz, M.L. Color, anthocyanin pigment, ascorbic acid and total phenolic compound determination in organic versus conventional strawberries (Fragaria × ananassa Duch. cv. Selva). J. Food Comp. Anal. 2012, 28, 23–30. [Google Scholar] [CrossRef]
- Khalil, H.A.; Hassan, S.M. Ascorbic acid, –carotene, total phenolic compound and microbiological quality of organic and conventional citrus and strawberry grown in Egypt. Afr. J. Biotechnol. 2015, 14, 272–277. [Google Scholar] [CrossRef]
- Reganold, J.P.; Andrews, P.K.; Reeve, J.R.; Carpenter–Boggs, L.; Schadt, C.W.; Alldredge, J.R.; Ross, C.F.; Davies, N.M.; Zhou, J. Fruit and soil quality of organic and conventional strawberry agroecosystems. PLoS ONE 2010, 5, e12346. [Google Scholar] [CrossRef]
- Perkins-Veazie, P. Growth and Ripening of Strawberry Fruit; Wiley & Sons: Hoboken, NJ, USA, 1995. [Google Scholar]
- Taghavi, T.; Babalar, M.; Ebadi, A.; Ebrahimzadeh, H.; Mohammad, A. Effects of nitrate to ammonium ratio on yield and nitrogen metabolism of strawberry (Fragaria × ananassa cv. Selva). Int. J. Agric. Biol. 2004, 6, 994–997. [Google Scholar]
- Carroll, J.; Pritts, M.; Heidenreich, C. 2016 Organic Production and IPM Guide for Strawberries; NYS IPM Prog: Geneva, NY, USA, 2016. [Google Scholar]
- Gannett, M.; Pritts, M.P.; Lehmann, J. Soil amendments affect soil health indicators and crop yield in perennial strawberry. HortTechnology 2019, 29, 179–188. [Google Scholar] [CrossRef]
- Sarrantonio, M. Building Soil Fertility and Tilth with Cover Crops, 3rd ed.; Managing Cover Crops Profitably; Clark, A., Ed.; Sustainable Agriculture Network: Beltsville, MD, USA, 2007; pp. 16–24. [Google Scholar]
- Watson, R.; Wright, C.J.; McBurney, T.; Taylor, A.J.; Linksforth, R.S.T. Influence of harvest date and light integral on the development of strawberry flavour compounds. J. Exp. Bot. 2002, 53, 2121–2129. [Google Scholar] [CrossRef] [PubMed]
- Cecatto, A.; Ruiz, F.M.; Calvete, E.; Martinez, J.; Palencia, P. Mycorrhizal inoculation affects the phytochemical content in strawberry fruits. Acta Sci. Agron. 2016, 38, 227–237. [Google Scholar] [CrossRef]
- Douds, D.D.; Nagahaski, G.; Shenk, J.E.; Demchak, K. Inoculation of strawberries with AM fungi produced on–farm increased yield. Biol. Agric. Hortic. 2008, 26, 209–219. [Google Scholar] [CrossRef]
- Garland, B.C.; Schroeder–Moreno, M.S.; Fernandez, G.E.; Creamer, N.G. Influence of summer cover crops and mycorrhizal fungi on strawberry production in the southeastern United States. Hortscience 2011, 46, 985–991. [Google Scholar] [CrossRef]
- Zamorska, I.L. Soil Mulching Affects Fruit Quality in Strawberry; Opalko, A.A., Weisfield, L.I., Bekuzarova, S.A., Bome, N.A., Zaikov, G.E., Eds.; Ecological Consequences of Increasing Crop Productivity; Apple Academic Press: Burlington, ON, Canada, 2014; pp. 167–174. [Google Scholar]
- Wang, S.Y.; Camp, M.J. Temperatures after bloom affect plant growth and fruit quality of strawberry. Sci. Hortic. 2000, 85, 183–199. [Google Scholar] [CrossRef]
- Souleyre, E.J.F.; Iannetta, P.P.M.; Ross, H.A.; Hancock, R.D.; Shepherd, L.V.T.; Viola, R.; Taylor, M.A.; Davies, H.V. Starch metabolism in developing strawberry (Fragaria × ananassa) fruits. Physiol. Planta 2004, 121, 369–376. [Google Scholar] [CrossRef]
- Jouquand, C.; Chandler, C.; Plotto, A.; Goodner, K. A sensory and chemical analysis of fresh strawberries over harvest dates and seasons reveals factors that affect eating quality. J. Am. Soc. Hortic. Sci. 2008, 133, 859–867. [Google Scholar] [CrossRef]
- Atkinson, C.J.; Dodds, P.A.A.; Ford, Y.Y.; Miere, J.L.E.; Taylor, J.M.; Blake, P.S.; Paul, N. Effects of cultivar, fruit number, and reflected photosynthetically active radiation on Fragaria × ananassa productivity and fruit ellagic acid and ascorbic acid concentrations. Ann. Bot. 2006, 97, 429–441. [Google Scholar] [CrossRef] [PubMed]
- MacKenzie, S.J.; Chandler, C.K. The late season decline in fruit soluble solids content observed in Florida is caused by rising temperatures. Acta Hortic. 2009, 842, 843–846. [Google Scholar] [CrossRef]
- MacKenzie, S.J.; Chandler, C.K.; Hasing, T.; Whitaker, V.M. The role of temperature in the late–season decline in soluble solids content of strawberry fruit in a subtropical production system. Am. Soc. Hortic. Sci. 2011, 46, 1562–1566. [Google Scholar] [CrossRef]
- Osatuke, A.; Pritts, M.P. Sugar content in strawberry is influenced by temperature during fruit development. J. Am. Pomol. Soc. 2021, in press. [Google Scholar]
- Cervantes, L.; Ariza, M.T.; Miranda, L.; Lozano, D.; Medina, J.J.; Soria, C.; Ferri, E.M. Stability of fruit quality traits of different strawberry varieties under variable environmental conditions. Agron. J. 2020, 10, 1242. [Google Scholar] [CrossRef]
- Hokanson, S.C.; Finn, C.E. Strawberry cultivar use in North America. HortTechnology 2000, 10, 94–106. [Google Scholar] [CrossRef]
- Network for Environment and Weather Applications (NEWA). NEWA Weather Data Page. New York State Integrated Pest Management Program, Cornell University. 2020. Available online: http://newa.cornell.edu/index.php?page=all–weather–data (accessed on 11 August 2020).
- Pritts, M.; Bihn, E.; Carroll, J.; Cox, K.; Helms, M.; Landers, A.; Loeb, G.; McDermott, L. Cornell Pest Management Guidelines for Berry Crops; Cornell University Press: Ithaca, NY, USA, 2020. [Google Scholar]
- Shin, Y.; Riu, J.A.; Liu, R.H.; Nock, J.F.; Watkins, C.B. Harvest maturity, storage temperature and relative humidity affect fruit quality, antioxidant contents and activity, and inhibition of cell proliferation of strawberry fruit. Postharvest Biol. Technol. 2008, 49, 201–209. [Google Scholar] [CrossRef]
- Moebius-Clune, B.N.; Moebius-Clune, D.J.; Gugino, B.K.; Idowu, O.J.; Ristow, A.J.; van Es, H.M.; Schindelbeck, R.R.; Thies, J.E.; Shayler, H.A.; McBride, M.B.; et al. Comprehensive Assessment of Soil Health—The Cornell Framework, 3.2nd ed.; Cornell University: Geneva, NY, USA, 2016. [Google Scholar]
- Zoecklein, B.W.; Fugelsang, K.C.; Gump, B.H.; Nury, F.S. Wine Analysis and Production; Chapman and Hall: Gaithersburg, MD, USA, 1999. [Google Scholar]
- Chambers, E., IV. Analysis of Sensory Properties in Foods, 1st ed.; MDPI: Basel, Switzerland, 2019. [Google Scholar]
- Grosofsky, A.; Haupert, M.L.; Versteeg, S.W. An exploratory investigation of coffee and lemon scents and odor identification. Percept. Motor Skills 2011, 112, 536–538. [Google Scholar] [CrossRef]
- Lester, G.; Lewers, K.S.; Medina, M.B.; Saftner, R.A. Comparative analysis of strawberry total phenolics via Fast Blue BB vs. Folin–Ciocalteu: Assay interference by ascorbic acid. J. Food. Comp. Anal. 2012, 27, 102–107. [Google Scholar] [CrossRef]
- Kreuger, D. Measurement of Fruit Juice Solids Content; Kreuger Food Laboratories: Chelmsford, MA, USA, 2015. [Google Scholar]
- Jetti, R.R.; Yang, E.; Kurnianta, A.; Finn, C.; Quian, M.C. Quantification of selected aroma–active compounds in strawberries by headspace solid–phase microextraction gas chromatography and correlation with sensory descriptive analysis. J. Food Sci. 2007, 72, 242–246. [Google Scholar] [CrossRef] [PubMed]
- Osatuke, A. Management Practices and Site and Their Effect on Strawberry Fruit Quality. Master’s Thesis, Cornell University, Ithaca, NY, USA, 2020. [Google Scholar]
- Gündüz, K.; Ozdemir, E. The effects of genotype and growing conditions on antioxidant capacity, phenolic compounds, organic acid and individual sugars of strawberry. Food Chem. 2014, 155, 298–303. [Google Scholar] [CrossRef]
- Harker, F.R.; Marsh, K.; Young, H.; Murray, S.H.; Gunson, F.A.; Walker, S.B. Sensory interpretation of instrumental measurements 2: Sweet and acid taste of apple fruit. Postharvest Biol. Technol. 2002, 24, 241–250. [Google Scholar] [CrossRef]
- Tyl, C.; Sadler, G.D. pH and Titratable Acidity. In Food Analysis, 5th ed.; Nielsen, S., Ed.; Springer: New York, NY, USA, 2017; pp. 389–406. [Google Scholar]
- Ikegaya, A.; Toyoizumi, T.; Ohba, S.; Nakajima, T.; Kawata, T.; Ito, S.; Arai, E. Effects of distribution of sugars and organic acids on the taste of strawberries. Food. Sci. Nutr. 2019, 7, 2419–2426. [Google Scholar] [CrossRef] [PubMed]
- Sortwell, D.; Woo, A. Improving the Flavour of Fruit Products with Acidulants; Bartek Ingredients: Stoney Creek, ON, Canada, 1996. [Google Scholar]
- Nutrient Management Spear Program. Agronomy Fact Sheet #4: Nitrogen Credits from Manure. Cornell Cooperative Extension. 2005. Available online: http://nmsp.cals.cornell.edu/publications/factsheets/factsheet4.pdf (accessed on 6 October 2020).
- Strand, L.L. Integrated Pest Management for Strawberries; UCANR: Davis, CA, USA, 2008. [Google Scholar]
- Deschamps, S.S.; Shinsuke, A. Metalized–striped plastic mulch reduced root–zone temperatures during establishment and increases early-season yields of annual winter strawberry. Hortscience 2019, 54, 110–116. [Google Scholar] [CrossRef]


| Treatment | Annual N Rate | N Source | Organic Matter Supplementation | Microbial Supplementation | Synthetic Pesticide Use |
|---|---|---|---|---|---|
| ORG − | 50 kg N·ha−1 | Compost, composted chicken manure | Straw mulch, Secale cereale preplant cover crop | None | None |
| ORG o | 100 kg N·ha−1 | Compost, composted chicken manure | Straw mulch, Secale cereale preplant cover crop | None | None |
| ORG + | 100 kg N·ha−1 | Compost, composted chicken manure | Straw mulch, Secale cereale preplant cover crop | MycoGold® pre-plant, Yeti® at a rate of 10 mL⋅3.78 L−1 monthly | None |
| CON − | 50 kg N·ha−1 | Urea | Straw mulch, Secale cereale preplant cover crop | None | napropamide, 8 kg⋅ha−1 pre-plant annually |
| CON o | 100 kg N·ha−1 | Urea | Straw mulch, Secale cereale preplant cover crop | None | napropamide, 8 kg⋅ha−1 pre-plant annually |
| CON + | 100 kg N·ha−1 | Urea | Straw mulch, Secale cereale preplant cover crop | None | napropamide, 8 kg⋅ha−1 pre-plant annually, captan, 92 g⋅ha−1 in spring, terbacil, 92 g⋅ha−1 monthly |
| LOC − | 50 kg N·ha−1 | Urea | None | None | napropamide, 8 kg⋅ha−1 pre-plant annually |
| LOC o | 100 kg N·ha−1 | Urea | None | None | napropamide, 8 kg⋅ha−1 pre-plant annually |
| LOC + | 100 kg N·ha−1 | Urea | None | None | napropamide, 8 kg⋅ha−1 pre-plant annually, captan, 92 g⋅ha−1 in spring, terbacil, 92 g⋅ha−1 monthly |
| Compound | Normalized Peak Area | CV |
|---|---|---|
| Furanone | 0.4 | 119% |
| Isoamyl acetate | 0.2 | 122% |
| Ethyl hexanoate | 0.6 | 83% |
| Linalool | 2.0 | 86% |
| Hexanoic acid | 1.5 | 100% |
| Ethyl butanoate | 0.6 | 93% |
| Treatment | Leaf N | Leaf C/N Ratio |
|---|---|---|
| ORG − | 1.84% c | 26.2 a |
| ORG o | 1.84% c | 26.1 a |
| ORG + | 1.84% c | 26.4 a |
| CON − | 2.11% abc | 22.7 bc |
| CON o | 2.33% a | 20.6 c |
| CON + | 2.30% a | 20.9 c |
| LOC − | 1.96% bc | 24.8 ab |
| LOC o | 2.21% ab | 21.6 bc |
| LOC + | 2.26% a | 21.3 c |
| Plot Comparison | Probability of Correctly Identifying a Difference in Taste Test | Probability of Correctly Identifying a Difference in Sniff Test |
|---|---|---|
| CON + to ORG + | 32% | 31% |
| CON o to LOC + | 20% | 41% |
| CON o to ORG o | 17% | 28% |
| CON o to CON − | 15% | 32% |
Publisher’s Note: MDPI stays neutral with regard to jurisdictional claims in published maps and institutional affiliations. |
© 2021 by the authors. Licensee MDPI, Basel, Switzerland. This article is an open access article distributed under the terms and conditions of the Creative Commons Attribution (CC BY) license (http://creativecommons.org/licenses/by/4.0/).
Share and Cite
Osatuke, A.; Pritts, M. Strawberry Flavor Is Influenced by the Air Temperature Differential during Fruit Development but Not Management Practices. Agronomy 2021, 11, 606. https://doi.org/10.3390/agronomy11030606
Osatuke A, Pritts M. Strawberry Flavor Is Influenced by the Air Temperature Differential during Fruit Development but Not Management Practices. Agronomy. 2021; 11(3):606. https://doi.org/10.3390/agronomy11030606
Chicago/Turabian StyleOsatuke, Anya, and Marvin Pritts. 2021. "Strawberry Flavor Is Influenced by the Air Temperature Differential during Fruit Development but Not Management Practices" Agronomy 11, no. 3: 606. https://doi.org/10.3390/agronomy11030606
APA StyleOsatuke, A., & Pritts, M. (2021). Strawberry Flavor Is Influenced by the Air Temperature Differential during Fruit Development but Not Management Practices. Agronomy, 11(3), 606. https://doi.org/10.3390/agronomy11030606