
Tracking Changes on Soil Structure and Organic Carbon Sequestration after 30 Years of Different Tillage and Management Practices

 ,
,  ,
,  ,
, 
Abstract
1. Introduction
2. Materials and Methods
2.1. Study Area
2.2. Experimental Design
2.3. Soil Sampling and Laboratory Methods
2.4. Statistical Analysis
3. Results
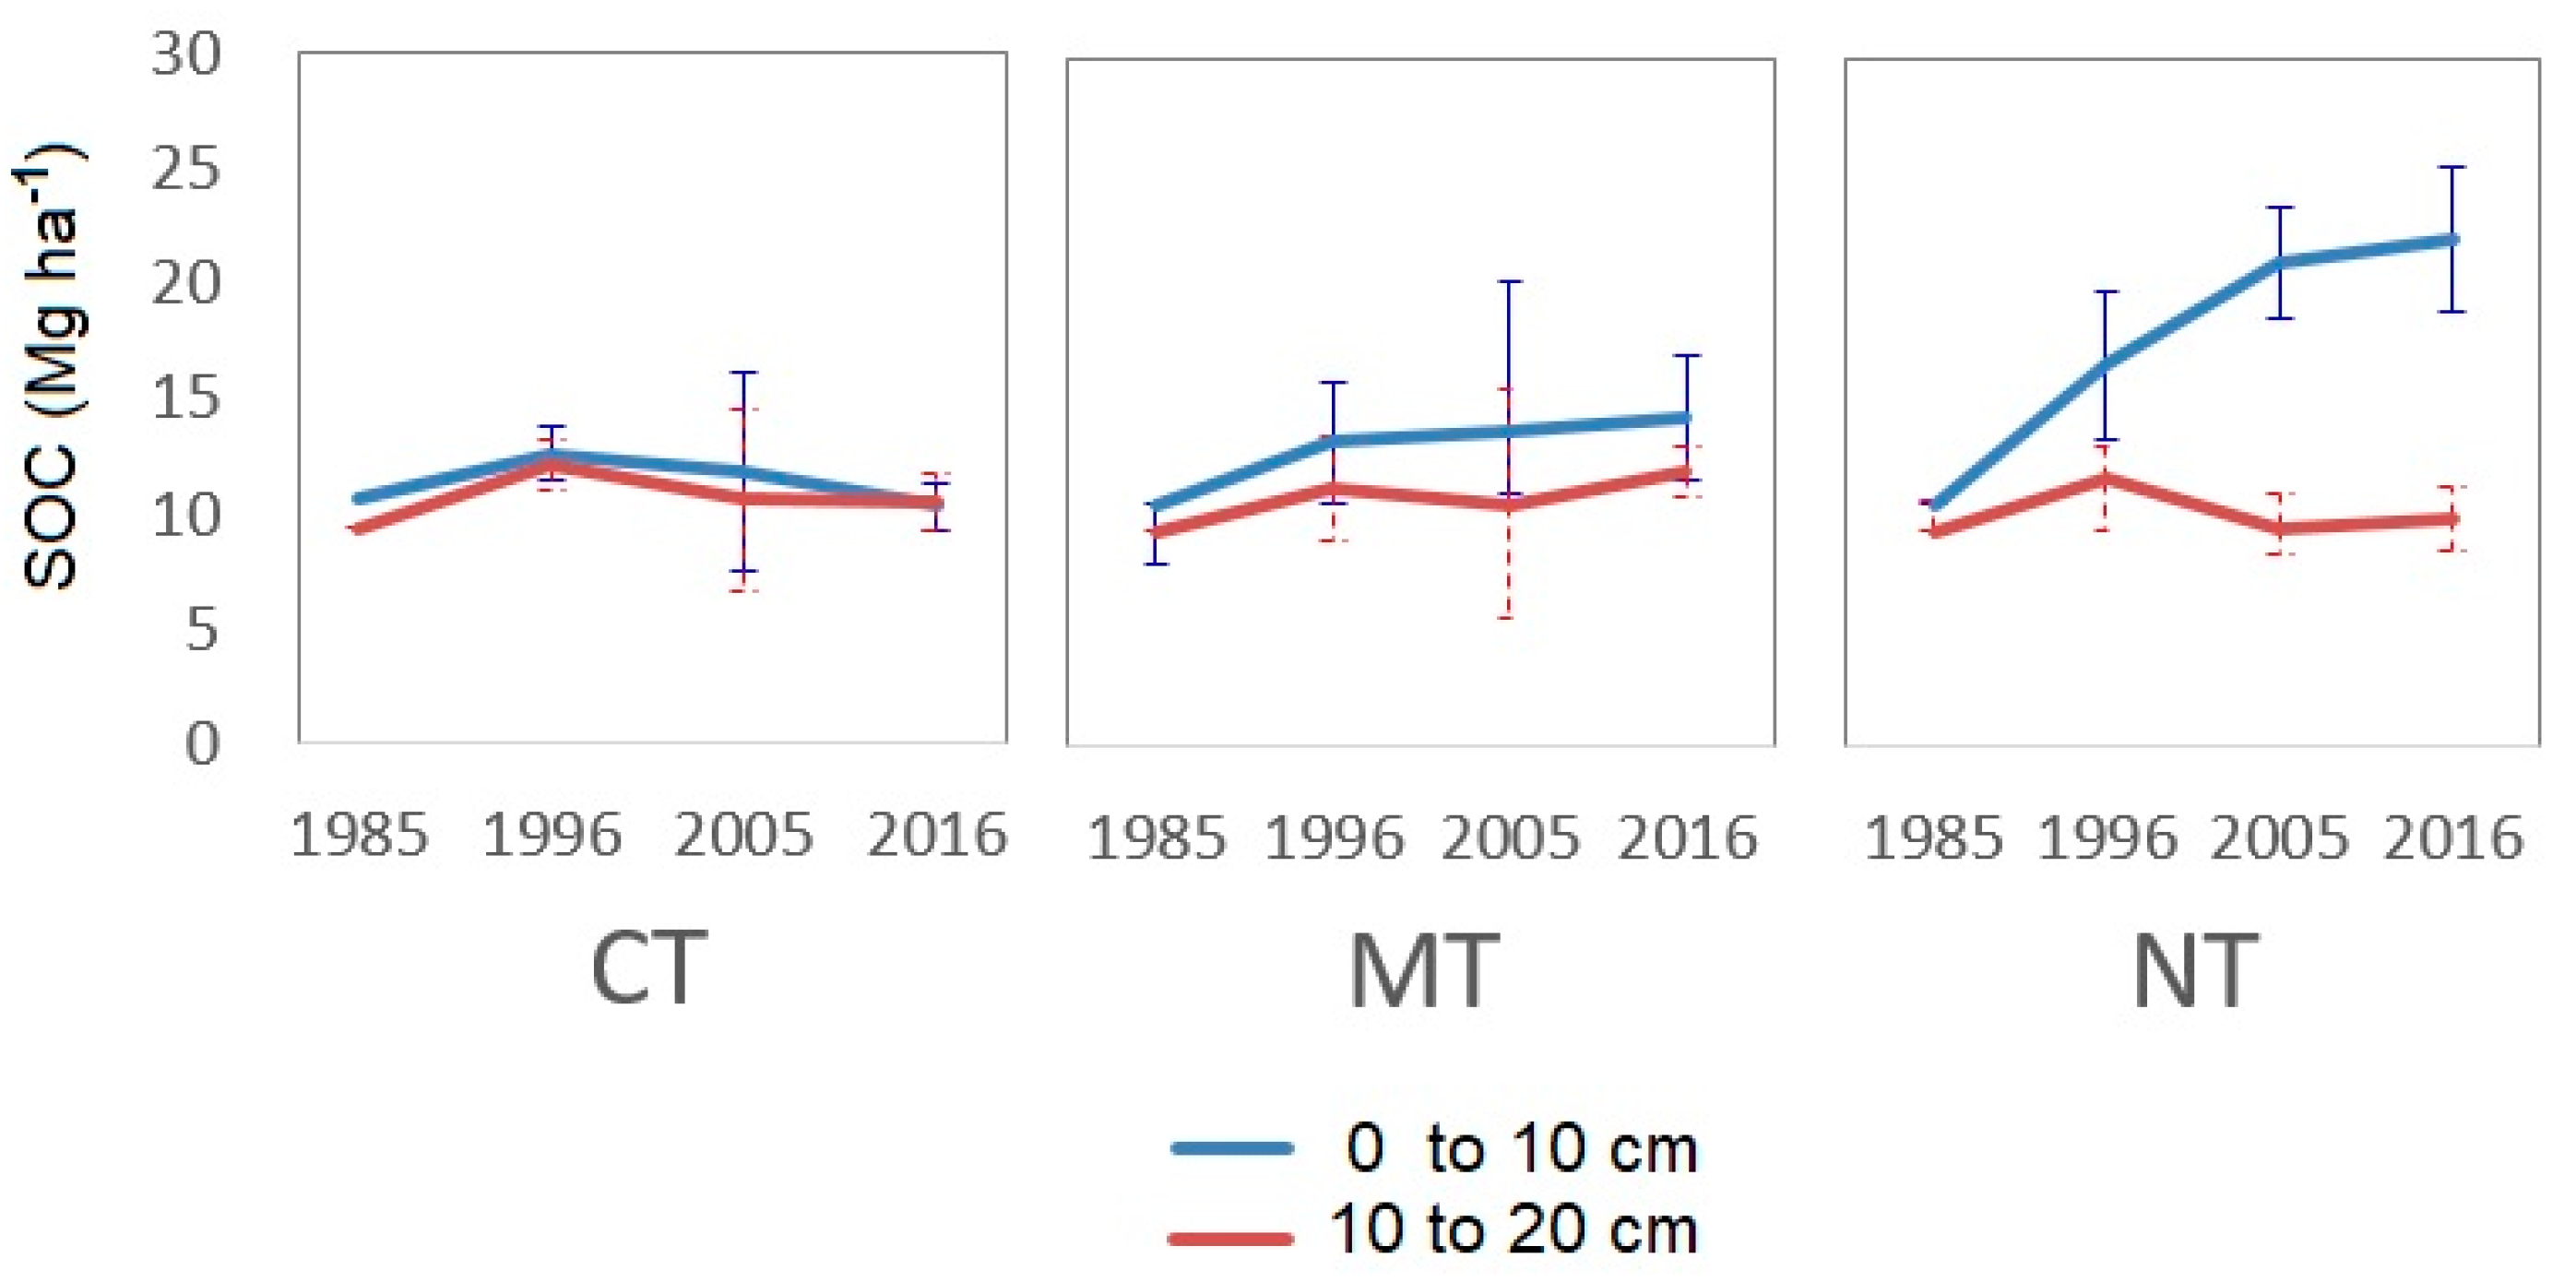
3.1. Changes in SOC
3.2. Changes in Physical and Chemical Properties
3.3. Changes in Water Infiltration and Water Availability
4. Discussion
4.1. Changes in SOC
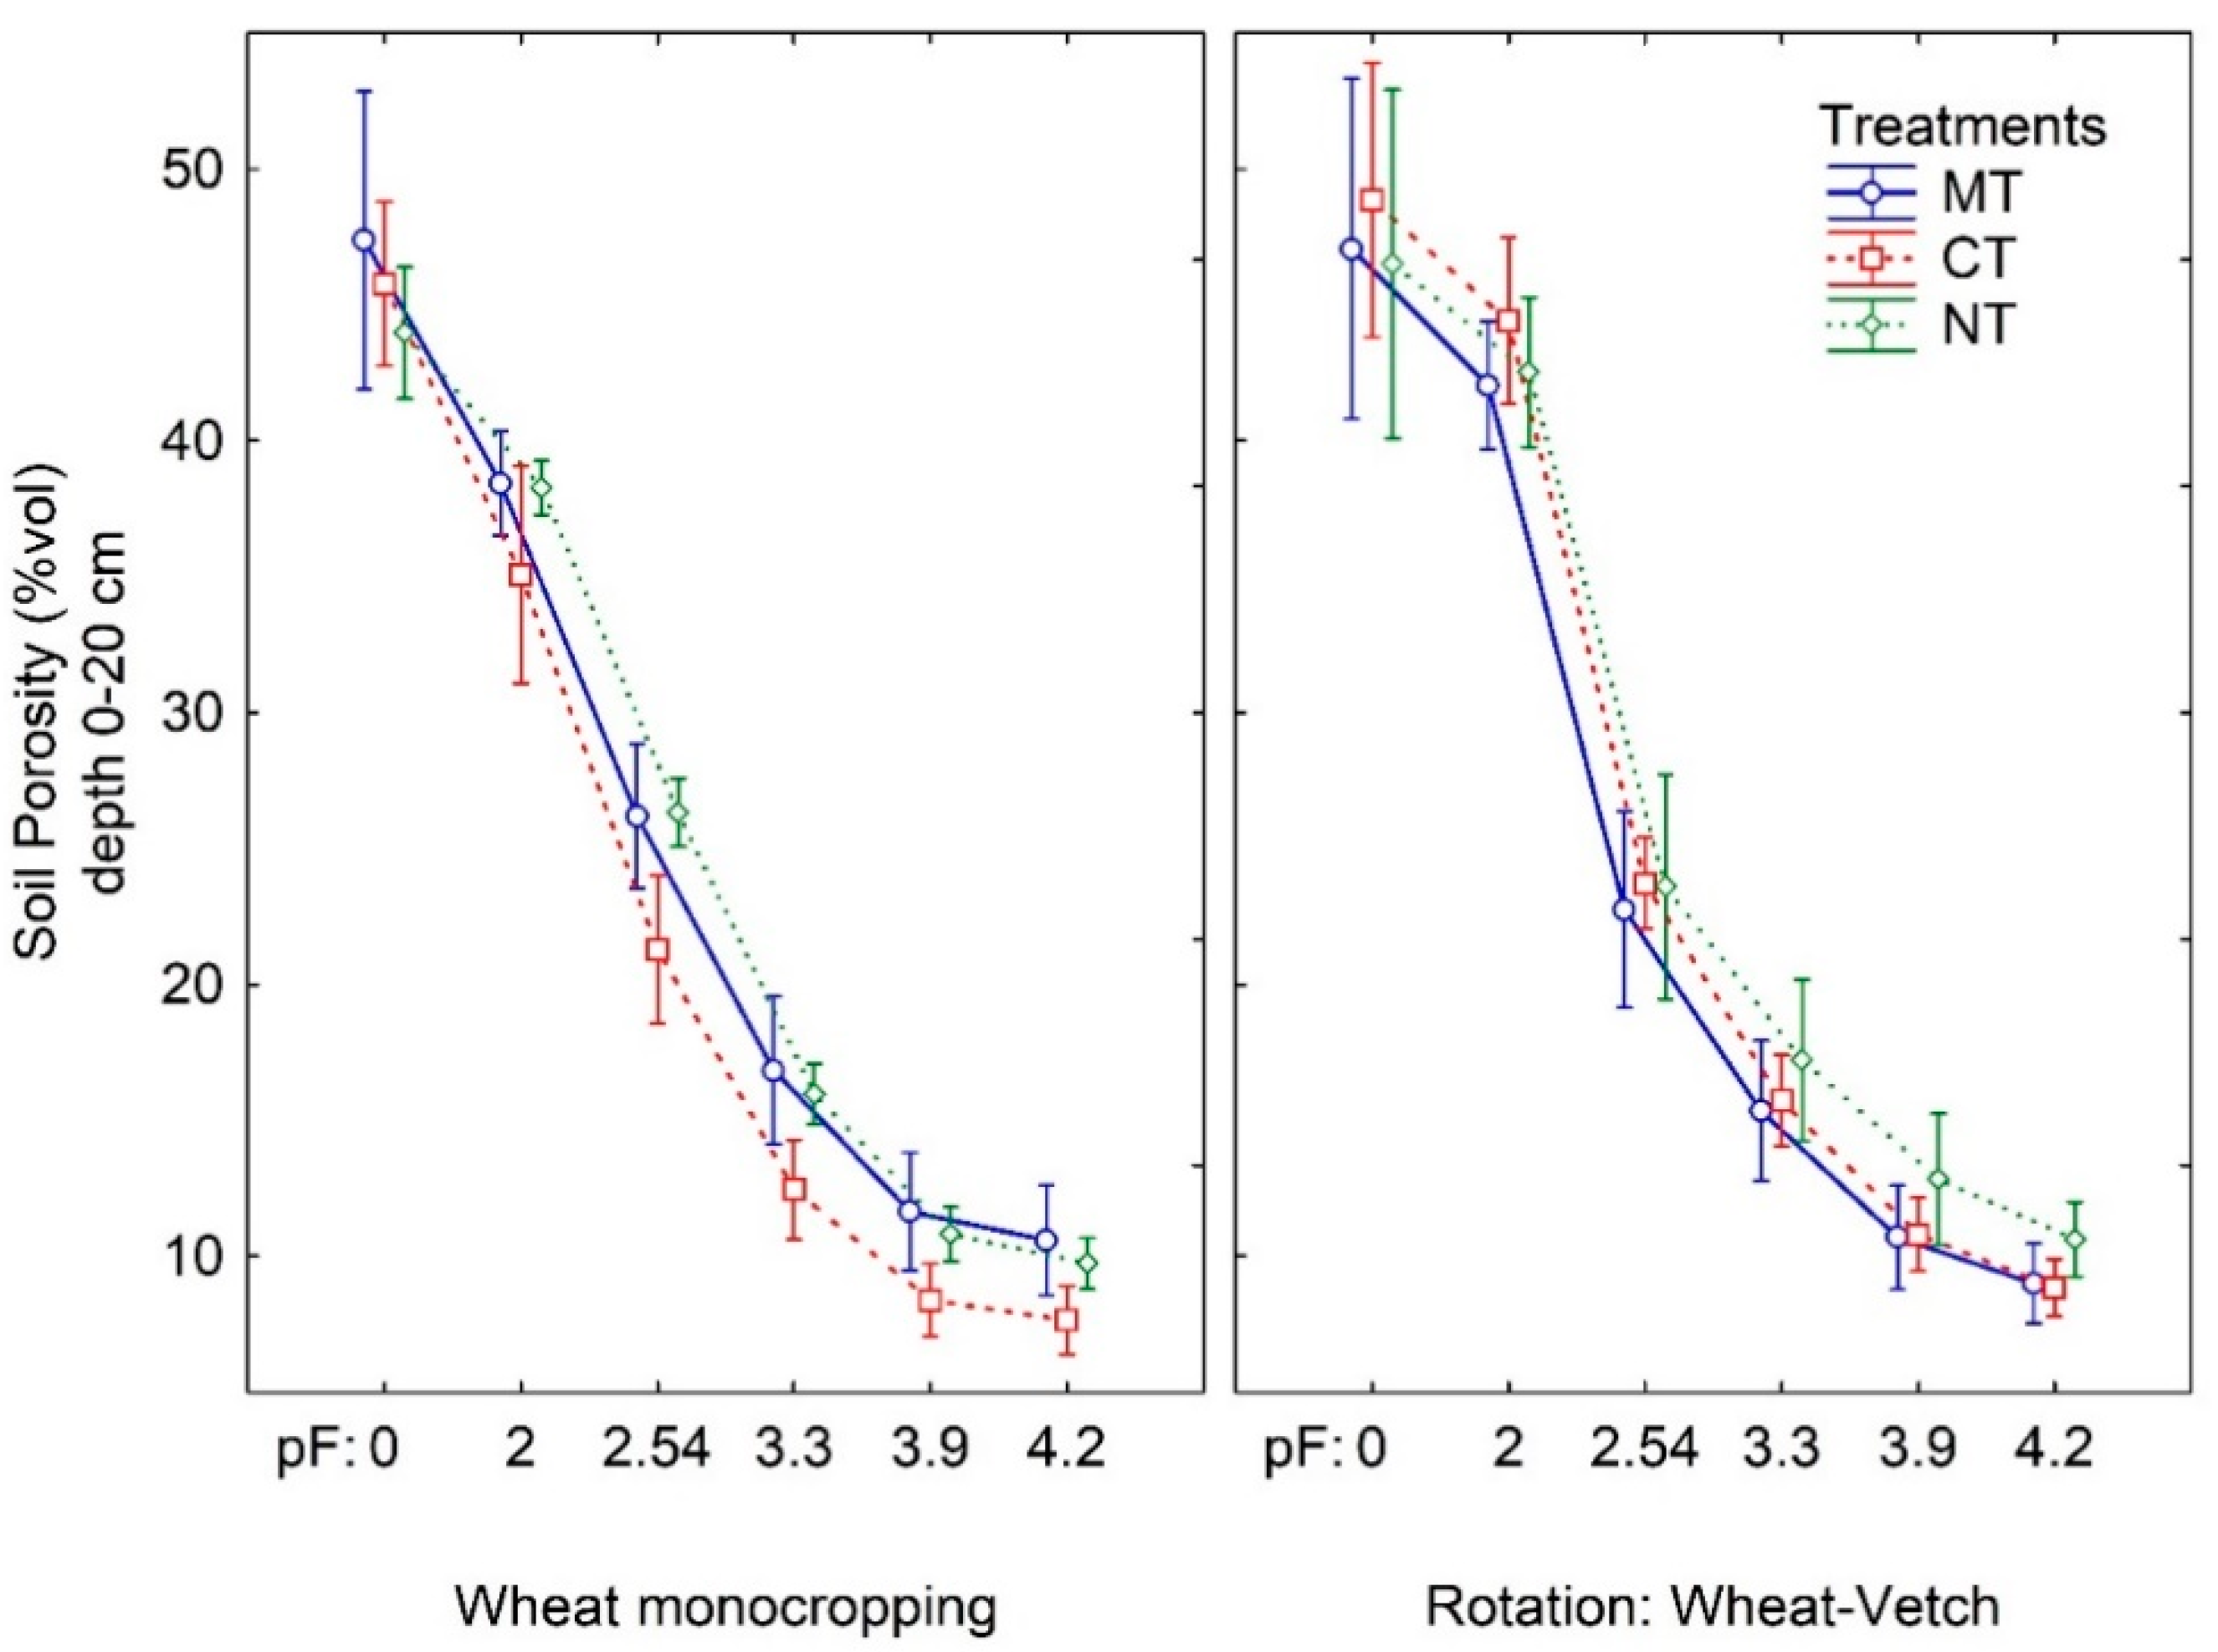
4.2. Changes in Physical and Chemical Properties
4.3. Changes in Water Infiltration and Water Availability
5. Conclusions
Author Contributions
Funding
Institutional Review Board Statement
Informed Consent Statement
Data Availability Statement
Acknowledgments
Conflicts of Interest
References
- Ordóñez Fernández, R.; González Fernández, P.; Giráldez Cervera, J.V.; Perea Torres, F. Soil properties and crop yields after 21 years of direct drilling trials in southern Spain. Soil Tillage Res. 2007, 94, 47–54. [Google Scholar] [CrossRef]
- Martín-Lammerding, D.; Hontoria, C.; Tenorio, J.L.; Walter, I. Mediterranean dryland farming: Effect of tillage practices on selected soil properties. Agron. J. 2011, 103, 382–389. [Google Scholar] [CrossRef]
- Zhang, S.; Li, Q.; Zhang, X.; Wei, K.; Chen, L.; Liang, W. Effects of conservation tillage on soil aggregation and aggregate binding agents in black soil of Northeast China. Soil Tillage Res. 2012, 124, 196–202. [Google Scholar] [CrossRef]
- Azuka, C.V.; Obi, M.E. Runoff-infiltration processes and some physical properties of Degraded Ultisol under different soil and crop management practices in Nsukka, South Eastern Nigeria. Acad. Res. J. Agric. Sci. Res. 2014, 2, 67–75. [Google Scholar] [CrossRef]
- Virto, I.; Moni, C.; Swanston, C.; Chenu, C. Turnover of intra- and extra-aggregate organic matter at the silt-size scale. Geoderma 2010, 156, 1–10. [Google Scholar] [CrossRef]
- Kabiri, V.; Raiesi, F.; Ghazavi, M.A. Six years of different tillage systems affected aggregate-associated SOM in a semi-arid loam soil from Central Iran. Soil Tillage Res. 2015, 154, 114–125. [Google Scholar] [CrossRef]
- Vázquez, E.; Benito, M.; Espejo, R.; Teutscherová, N. Effects of no-tillage and liming amendment combination on soil carbon and nitrogen mineralization. Eur. J. Soil Biol. 2019, 93, 103090. [Google Scholar] [CrossRef]
- García-Díaz, A.; Allas, R.B.; Gristina, L.; Cerdà, A.; Pereira, P.; Novara, A. Carbon input threshold for soil carbon budget optimization in eroding vineyards. Geoderma 2016, 271, 144–149. [Google Scholar] [CrossRef]
- Belmonte, S.A.; Celi, L.; Stahel, R.J.; Bonifacio, E.; Novello, V.; Zanini, E.; Steenwerth, K.L. Effect of long-term soil management on the mutual interaction among soil organic matter, microbial activity and aggregate stability in a vineyard. Pedosphere 2018, 28, 288–298. [Google Scholar] [CrossRef]
- Biddoccu, M.; Ferraris, S.; Pitacco, A.; Cavallo, E. Temporal variability of soil management effects on soil hydrological properties, runoff and erosion at the field scale in a hillslope vineyard, North-West Italy. Soil Tillage Res. 2017, 165, 46–58. [Google Scholar] [CrossRef]
- Amézketa, E.; Aragüés, R.; Pérez, P.; Bercero, A. Techniques for controlling soil crusting and its effect on corn emergence and production. Span. J. Agric. Res. 2003, 1, 101. [Google Scholar] [CrossRef]
- Marques, M.J.; García-Muñoz, S.; Muñoz-Organero, G.; Bienes, R. Soil conservation beneath grass cover in hillside vineyards under Mediterranean Climatic conditions (Madrid, Spain). Land Degrad. Dev. 2010, 21, 122–131. [Google Scholar] [CrossRef]
- Martínez-Mena, M.; Carrillo-López, E.; Boix-Fayos, C.; Almagro, M.; Franco, N.G.; Díaz-Pereira, E.; Montoya, I.; De Vente, J. Long-term effectiveness of sustainable land management practices to control runoff, soil erosion, and nutrient loss and the role of rainfall intensity in Mediterranean rainfed agroecosystems. Catena 2020, 187, 104352. [Google Scholar] [CrossRef]
- De Moraes, M.T.; DeBiasi, H.; Carlesso, R.; Franchini, J.C.; Da Silva, V.R.; Da Luz, F.B. Soil physical quality on tillage and cropping systems after two decades in the subtropical region of Brazil. Soil Tillage Res. 2016, 155, 351–362. [Google Scholar] [CrossRef]
- Six, J.; Elliott, E.; Paustian, K. Soil macroaggregate turnover and microaggregate formation: A mechanism for C sequestration under no-tillage agriculture. Soil Biol. Biochem. 2000, 32, 2099–2103. [Google Scholar] [CrossRef]
- Devine, S.; Markewitz, D.; Hendrix, P.; Coleman, D. Soil aggregates and associated organic matter under conventional tillage, no-tillage, and forest succession after three decades. PLoS ONE 2014, 9, e84988. [Google Scholar] [CrossRef]
- Zotarelli, L.; Alves, B.J.R.; Urquiaga, S.; Boddey, R.M.; Six, J. Impact of tillage and crop rotation on light fraction and intra-aggregate soil organic matter in two Oxisols. Soil Tillage Res. 2007, 95, 196–206. [Google Scholar] [CrossRef]
- Six, J.; Paustian, K. Aggregate-associated soil organic matter as an ecosystem property and a measurement tool. Soil Biol. Biochem. 2014, 68, A4–A9. [Google Scholar] [CrossRef]
- Pittelkow, C.M.; Linquist, B.A.; Lundy, M.E.; Liang, X.; Van Groenigen, K.J.; Lee, J.; Van Gestel, N.; Six, J.; Venterea, R.T.; Van Kessel, C. When does no-till yield more? A global meta-analysis. Field Crop. Res. 2015, 183, 156–168. [Google Scholar] [CrossRef]
- Feng, G.; Sharratt, B.; Young, F. Influence of long-term tillage and crop rotations on soil hydraulic properties in the US Pacific Northwest. J. Soil Water Conserv. 2011, 66, 233–241. [Google Scholar] [CrossRef]
- Al-Kaisi, M.M.; Douelle, A.; Kwaw-Mensah, D. Soil microaggregate and macroaggregate decay over time and soil carbon change as influenced by different tillage systems. J. Soil Water Conserv. 2014, 69, 574–580. [Google Scholar] [CrossRef]
- Hulugalle, N.R.; Weaver, T.B.; Finlay, L.A.; Hare, J.; Entwistle, P.C. Soil properties and crop yields in a dryland Vertisol sown with cotton-based crop rotations. Soil Tillage Res. 2007, 93, 356–369. [Google Scholar] [CrossRef]
- Jemai, I.; Ben Aissa, N.; Ben Guirat, S.; Ben-Hammouda, M.; Gallali, T. Impact of three and seven years of no-tillage on the soil water storage, in the plant root zone, under a dry subhumid Tunisian climate. Soil Tillage Res. 2013, 126, 26–33. [Google Scholar] [CrossRef]
- Bhattacharyya, R.; Prakash, V.; Kundu, S.; Gupta, H. Effect of tillage and crop rotations on pore size distribution and soil hydraulic conductivity in sandy clay loam soil of the Indian Himalayas. Soil Tillage Res. 2006, 86, 129–140. [Google Scholar] [CrossRef]
- ESYRCE Encuesta Sobre Superficies y Rendimientos de Cultivos. Análisis de Las Técnicas de Mantenimiento Del Suelo Y de Los Métodos de Siembra en España; Ministerio de Agricultura, Pesca y Alimentación: Madrid, Spain, 2019.
- West, T.O.; Post, W.M. Soil organic carbon sequestration rates by tillage and crop rotation. Soil Sci. Soc. Am. J. 2002, 66, 1930–1946. [Google Scholar] [CrossRef]
- Abid, M.; Lal, R. Tillage and drainage impact on soil quality: I. Aggregate stability, carbon and nitrogen pools. Soil Tillage Res. 2008, 100, 89–98. [Google Scholar] [CrossRef]
- Hontoria, C.; Gómez-Paccard, C.; Mariscal-Sancho, I.; Benito, M.; Pérez, J.; Espejo, R. Aggregate size distribution and associated organic C and N under different tillage systems and Ca-amendment in a degraded Ultisol. Soil Tillage Res. 2016, 160, 42–52. [Google Scholar] [CrossRef]
- Álvaro-Fuentes, J.; López, M.V.; Cantero-Martínez, C.; Arrúe, J. Tillage effects on soil organic carbon fractions in mediterranean dryland agroecosystems. Soil Sci. Soc. Am. J. 2008, 72, 541–547. [Google Scholar] [CrossRef]
- Daraghmeh, O.A.; Jensen, J.; Petersen, C.T. Near-saturated hydraulic properties in the surface layer of a sandy loam soil under conventional and reduced tillage. Soil Sci. Soc. Am. J. 2008, 72, 1728–1737. [Google Scholar] [CrossRef]
- Liebig, M.; Tanaka, D.; Wienhold, B.J. Tillage and cropping effects on soil quality indicators in the northern Great Plains. Soil Tillage Res. 2004, 78, 131–141. [Google Scholar] [CrossRef]
- Haddaway, N.R.; Hedlund, K.; Jackson, L.E.; Kätterer, T.; Lugato, E.; Thomsen, I.K.; Jørgensen, H.B.; Isberg, P.-E. How does tillage intensity affect soil organic carbon? A systematic review. Environ. Évid. 2017, 6, 30. [Google Scholar] [CrossRef]
- Smith, P. How long before a change in soil organic carbon can be detected? Glob. Chang. Biol. 2004, 10, 1878–1883. [Google Scholar] [CrossRef]
- Barklund, A. Success stories of agricultural long-term experiments. R. Swedish Acad. Agric. For. (Kungl. Skogs- och Lantbruksakademiens) 2007, 9, 108. [Google Scholar]
- Bai, Z.; Caspari, T.; Gonzalez, M.R.; Batjes, N.H.; Mäder, P.; Bünemann, E.K.; De Goede, R.; Brussaard, L.; Xu, M.; Ferreira, C.S.S.; et al. Effects of agricultural management practices on soil quality: A review of long-term experiments for Europe and China. Agric. Ecosyst. Environ. 2018, 265, 1–7. [Google Scholar] [CrossRef]
- Kätterer, T.; Bolinder, M.A.; Berglund, K.; Kirchmann, H. Strategies for carbon sequestration in agricultural soils in northern Europe. Acta Agric. Scand. Sect. A—Anim. Sci. 2012, 62, 181–198. [Google Scholar] [CrossRef]
- Holz, S.C.; Ingelmo, F.; Canet, R. Long term effects of the application of sewage sludge and vegetal cover on some physical and physicochemical properties of a degraded arid soil. Agrochimica 2000, 44, 132–139. [Google Scholar]
- Rhoton, F.; Shipitalo, M.; Lindbo, D. Runoff and soil loss from midwestern and southeastern US silt loam soils as affected by tillage practice and soil organic matter content. Soil Tillage Res. 2002, 66, 1–11. [Google Scholar] [CrossRef]
- Steiner, C.; Teixeira, W.G.; Lehmann, J.; Nehls, T.; de Macêdo, J.L.V.; Blum, W.E.H.; Zech, W. Long term effects of manure, charcoal and mineral fertilization on crop production and fertility on a highly weathered Central Amazonian upland soil. Plant. Soil 2007, 291, 275–290. [Google Scholar] [CrossRef]
- Melgar, J.C.; Mohamed, Y.; Serrano, N.; García-Galavís, P.A.; Navarro, C.; Parra, M.A.; Benlloch, M.; Fernández-Escobar, R. Long term responses of olive trees to salinity. Agric. Water Manag. 2009, 96, 1105–1113. [Google Scholar] [CrossRef]
- Arai, M.; Tayasu, I.; Komatsuzaki, M.; Uchida, M.; Shibata, Y.; Kaneko, N. Changes in soil aggregate carbon dynamics under no-tillage with respect to earthworm biomass revealed by radiocarbon analysis. Soil Tillage Res. 2013, 126, 42–49. [Google Scholar] [CrossRef]
- Kumar, S.; Nakajima, T.; Mbonimpa, E.; Gautam, S.; Somireddy, U.; Kadono, A.; Lal, R.; Chintala, R.; Rafique, R.; Fausey, N. Long-term tillage and drainage influences on soil organic carbon dynamics, aggregate stability and corn yield. Soil Sci. Plant. Nutr. 2014, 60, 108–118. [Google Scholar] [CrossRef]
- Parihar, C.; Yadav, M.; Jat, S.; Singh, A.; Kumar, B.; Pradhan, S.; Chakraborty, D.; Jat, M.; Jat, R.; Saharawat, Y.; et al. Long term effect of conservation agriculture in maize rotations on total organic carbon, physical and biological properties of a sandy loam soil in north-western Indo-Gangetic Plains. Soil Tillage Res. 2016, 161, 116–128. [Google Scholar] [CrossRef]
- Bottinelli, N.; Angers, D.A.; Hallaire, V.; Michot, D.; Le Guillou, C.; Cluzeau, D.; Heddadj, D.; Menasseri-Aubry, S. Tillage and fertilization practices affect soil aggregate stability in a Humic Cambisol of Northwest France. Soil Tillage Res. 2017, 170, 14–17. [Google Scholar] [CrossRef]
- Hontoria, C.; Gómez-Paccard, C.; Vazquez, E.; Mariscal-Sancho, I.; Hontoria, C.; Carbonell-Bojollo, R.; Espejo, R. Mid-long term effects of no tillage and Ca-amendment on degraded acid soils under contrasting weather conditions. Soil Tillage Res. 2018, 183, 83–92. [Google Scholar] [CrossRef]
- Mahmoud, M.; Janssen, M.; Peth, S.; Horn, R.; Lennartz, B. Long-term impact of irrigation with olive mill wastewater on aggregate properties in the top soil. Soil Tillage Res. 2012, 124, 24–31. [Google Scholar] [CrossRef]
- Barbera, V.; Poma, I.; Gristina, L.; Novara, A.; Egli, M. Long-term cropping systems and tillage management effects on soil organic carbon stock and steady state level of C sequestration rates in a semiarid environment. Land Degrad. Dev. 2010, 23, 82–91. [Google Scholar] [CrossRef]
- Wang, J.; Ishidaira, H.; Sun, W.; Ning, S. Development and interpretation of new sediment rating curve considering the effect of vegetation cover for Asian basins. Sci. World J. 2013, 2013, 1–9. [Google Scholar] [CrossRef] [PubMed]
- Santín-Montanyá, M.; Martín-Lammerding, D.; Zambrana, E.; Tenorio, J. Management of weed emergence and weed seed bank in response to different tillage, cropping systems and selected soil properties. Soil Tillage Res. 2016, 161, 38–46. [Google Scholar] [CrossRef]
- Zhang, G.; Chan, K.; Oates, A.; Heenan, D.; Huang, G. Relationship between soil structure and runoff/soil loss after 24 years of conservation tillage. Soil Tillage Res. 2007, 92, 122–128. [Google Scholar] [CrossRef]
- Blanco-Moure, N.; Gracia, R.; Bielsa, A.C.; López, M.V. Soil organic matter fractions as affected by tillage and soil texture under semiarid Mediterranean conditions. Soil Tillage Res. 2016, 155, 381–389. [Google Scholar] [CrossRef]
- Malhi, S.S.; Légère, A.; Vanasse, A.; Parent, G. Effects of long-term tillage, terminating no-till and cropping system on organic C and N, and available nutrients in a Gleysolic soil in Québec, Canada. J. Agric. Sci. 2018, 156, 472–480. [Google Scholar] [CrossRef]
- AEMET SP Spanish State Meteorological Agency Data for the Period 1981 to 2010. Available online: http://www.aemet.es/es/serviciosclimaticos/datosclimatologicos/valoresclimatologicos?l=3175&k=mad (accessed on 23 April 2019).
- Burt, R.; Soil Survey Staff. (Eds.) Soil Survey Staff Kellogg Soil Survey Laboratory Methods Manual; Department of Agriculture, N.R.C.S.: Lincoln, NE, USA, 2014.
- Franzluebbers, A. Water infiltration and soil structure related to organic matter and its stratification with depth. Soil Tillage Res. 2002, 66, 197–205. [Google Scholar] [CrossRef]
- Hernanz, J.; Sánchez-Girón, V.; Navarrete, L. Soil carbon sequestration and stratification in a cereal/leguminous crop rotation with three tillage systems in semiarid conditions. Agric. Ecosyst. Environ. 2009, 133, 114–122. [Google Scholar] [CrossRef]
- ASTM. Standard test method for particle-size analysis of soils. In Annual Book of ASTM Standards 04.08; ASTM: Philadelphia, PA, USA, 1985; pp. 117–127. [Google Scholar]
- Walkley, A.; Black, I.A. an examination of the Degtjareff method for determining soil organic matter, and a proposed modification of the chromic acid titration method. Soil Sci. 1934, 37, 29–38. [Google Scholar] [CrossRef]
- FAO. Measuring and Modelling Soil Carbon Stocks and Stock Changes in Livestock Production Systems: Guidelines for Assessment (Version 1). Livestock Environmental Assessment and Performance (LEAP) Partnership; FAO: Rome, Italy, 2019. [Google Scholar]
- Penman, J.; Gytarsky, M.; Hiraishi, T.; Krug, T.; Kruger, D.; Pipatti, R.; Buendia, L.; Miwa, K.; Ngara, T.; Tanabe, K.; et al. Section 3. LUCF sector good practice guidance. In Good Practice Guidance for Land Use, Land-Use Change and For-Estry; IPCC National Greenhouse Gas Inventories Programme and Institute for Global Environmental Strategies (IGES): Hayama, Japan, 2003; pp. 3.1–3.312. [Google Scholar]
- UNFCCC. Paris Agreement FCCC/CP/2015/l.9/Rev.1. Retrieved. 2015. Available online: https://unfccc.int/resource/docs/2015/cop21/eng/l09r01.pdf (accessed on 5 February 2021).
- Kjeldahl, J. Neue methode zur bestimmung des stickstoffs in organischen körpern. Z. Anal. Chem. 1883, 22, 366–382. [Google Scholar] [CrossRef]
- Olsen, S.R. Phosphorus in alkaline and calcareous soils. Inorganic phosphorus in alkaline and calcareous soils. In Soil and Fertilizer Phosphorus in Crop Nutrition; Pierre, W.H., Norman, A.G., Eds.; Springer: New York, NY, USA, 1953; pp. 89–122. [Google Scholar]
- Richards, L.A. Diagnosis and improvement of saline and alkali soils. Soil Sci. 1954, 78, 154. [Google Scholar] [CrossRef]
- Kemper, W.D.; Rosenau, R.C. Aggregate stability and size distribution. In Methods of Soil Analysis, Part 1, Physical and Mineralogical Methods; American Society of Agronomy-Soil Science Society of America: Madison, WI, USA, 1986; Volume 5, pp. 425–442. [Google Scholar] [CrossRef]
- Imeson, A.; Vis, M. Assessing soil aggregate stability by water-drop impact and ultrasonic dispersion. Geoderma 1984, 34, 185–200. [Google Scholar] [CrossRef]
- Boix-Fayos, C.; Calvo-Cases, C.; Imeson, A.; Soriano-Soto, M. Influence of soil properties on the aggregation of some Mediterranean soils and the use of aggregate size and stability as land degradation indicators. Catena 2001, 44, 47–67. [Google Scholar] [CrossRef]
- Taboada, M.A.; Barbosa, O.; Rodríguez, M.; Cosentino, D. Mechanisms of aggregation in a silty loam under different simulated management regimes. Geoderma 2004, 123, 233–244. [Google Scholar] [CrossRef]
- Sastre, B.; Barbero-Sierra, C.; Bienes, R.; Marques, M.J.; García-Díaz, A. Soil loss in an olive grove in Central Spain under cover crops and tillage treatments, and farmer perceptions. J. Soils Sediments 2016, 17, 873–888. [Google Scholar] [CrossRef]
- Bienes, R.; Marques, M.; Sastre, B.; García-Díaz, A.; Ruiz-Colmenero, M. Eleven years after shrub revegetation in semiarid eroded soils. Influence in soil properties. Geoderma 2016, 273, 106–114. [Google Scholar] [CrossRef]
- USDA. Soil Quality Test Kit Guide; United States Department of Agriculture: Lincoln, NE, USA; Washington, DC, USA, 2001.
- Siegel, S.; Castellan, N.J. Nonparametric Statistics for the Behavioral Sciences, 2nd ed.; McGraw-Hill: New York, NY, USA, 1988. [Google Scholar]
- StatSoft Statistica. Data Analisys Software System, v10-2011; Scientific Research: Irvine, CA, USA, 2011. [Google Scholar]
- Hammer, O.; Harper, D.A.T.; Ryan, P.D. PAST: Paleontological statistics software package for education and data analysis. Paleontol. Electron. 2001, 4, 9. [Google Scholar]
- Verheijen, F.G.A.; Jones, R.J.A.; Rickson, R.; Smith, C.J. Tolerable versus actual soil erosion rates in Europe. Earth-Sci. Rev. 2009, 94, 23–38. [Google Scholar] [CrossRef]
- Hernanz, J.; Sánchez-Girón, V.; Navarrete, L.; Sánchez, M. Long-term (1983–2012) assessment of three tillage systems on the energy use efficiency, crop production and seeding emergence in a rain fed cereal monoculture in semiarid conditions in central Spain. Field Crop. Res. 2014, 166, 26–37. [Google Scholar] [CrossRef]
- Loveland, P. Is there a critical level of organic matter in the agricultural soils of temperate regions: A review. Soil Tillage Res. 2003, 70, 1–18. [Google Scholar] [CrossRef]
- Martín, J.R.; Álvaro-Fuentes, J.; Gonzalo, J.; Gil, C.; Ramos-Miras, J.; Corbí, J.G.; Boluda, R. Assessment of the soil organic carbon stock in Spain. Geoderma 2016, 264, 117–125. [Google Scholar] [CrossRef]
- Minasny, B.; Malone, B.P.; McBratney, A.B.; Angers, D.A.; Arrouays, D.; Chambers, A.; Chaplot, V.; Chen, Z.-S.; Cheng, K.; Das, B.S.; et al. Soil carbon 4 per mille. Geoderma 2017, 292, 59–86. [Google Scholar] [CrossRef]
- Sommer, R.; Bossio, D. Dynamics and climate change mitigation potential of soil organic carbon sequestration. J. Environ. Manag. 2014, 144, 83–87. [Google Scholar] [CrossRef]
- TWB. Carbon Sequestration in Agricultural Soils; Report Number: 67395-GLB; World Bank: Washington, DC, USA, 2012. [Google Scholar]
- Smith, P.; Powlson, D.S.; Glendining, M.J.; Smith, J.U. Preliminary estimates of the potential for carbon mitigation in European soils through no-till farming. Glob. Chang. Biol. 1998, 4, 679–685. [Google Scholar] [CrossRef]
- Peregrina, F.; Larrieta, C.; Ibáñez, S.; Garcia-Escudero, E. Labile organic matter, aggregates, and stratification ratios in a semiarid vineyard with cover crops. Soil Sci. Soc. Am. J. 2010, 74, 2120–2130. [Google Scholar] [CrossRef]
- Kelley, K.R.; Stevenson, F.J. Forms and nature of organic N in soil. Fertil. Res. 1995, 42, 1–11. [Google Scholar] [CrossRef]
- Deubel, A.; Hofmann, B.; Orzessek, D. Long-term effects of tillage on stratification and plant availability of phosphate and potassium in a loess chernozem. Soil Tillage Res. 2011, 117, 85–92. [Google Scholar] [CrossRef]
- Rhoades, H.F. Effect of Organic Matter Decomposition on the Solubility and Fixation of Phosphorus in Alkaline Soils; University of Nebraska: Lincoln, NE, USA, 1939. [Google Scholar]
- Raghad, M.; Alsaede, A.; Iqbal, M. Behavior of potassium in soil: A mini review. Chem. Int. 2016, 2, 58–69. [Google Scholar] [CrossRef]
- Bronick, C.; Lal, R. Soil structure and management: A review. Geoderma 2005, 124, 3–22. [Google Scholar] [CrossRef]
- Van Der Meulen, E.S.; Nol, L.; Cammeraat, E. Effects of irrigation and plastic mulch on soil properties on semiarid abandoned fields. Soil Sci. Soc. Am. J. 2006, 70, 930–939. [Google Scholar] [CrossRef]
- Rohošková, M.; Valla, M. Comparison of two methods for aggregate stability measurement—A review. Plant Soil Environ. 2011, 50, 379–382. [Google Scholar] [CrossRef]
- Rawlins, B.; Wragg, J.; Lark, R.M. Application of a novel method for soil aggregate stability measurement by laser granulometry with sonication. Eur. J. Soil Sci. 2013, 64, 92–103. [Google Scholar] [CrossRef]
- García-Díaz, A.; Marqués, M.J.; Sastre, B.; Bienes, R. Labile and stable soil organic carbon and physical improvements using groundcovers in vineyards from central Spain. Sci. Total Environ. 2018, 621, 387–397. [Google Scholar] [CrossRef] [PubMed]
- Tisdall, J.M.; Oades, J.M. Organic matter and water-stable aggregates in soils. Eur. J. Soil Sci. 1982, 33, 141–163. [Google Scholar] [CrossRef]
- Vaezi, A.; Sadeghi, S.H.; Bahrami, H.; Mahdian, M. Modeling the USLE K-factor for calcareous soils in northwestern Iran. Geomorphology 2008, 97, 414–423. [Google Scholar] [CrossRef]
- Da Veiga, M.; Reinert, D.J.; Reichert, J.M.; Kaiser, D.R. Short and long-term effects of tillage systems and nutrient sources on soil physical properties of a Southern Brazilian Hapludox. Rev. Brasileira de Ciência do Solo 2008, 32, 1437–1446. [Google Scholar] [CrossRef][Green Version]
- Costa, J.L.; Aparicio, V.C.; Cerdà, A. Soil physical quality changes under different management systems after 10 years in the Argentine humid pampa. Solid Earth 2015, 6, 361–371. [Google Scholar] [CrossRef]
- López-Fando, C.; Dorado, J.; Pardo, M. Effects of zone-tillage in rotation with no-tillage on soil properties and crop yields in a semi-arid soil from central Spain. Soil Tillage Res. 2007, 95, 266–276. [Google Scholar] [CrossRef]
- Godoy, V.A.; Zuquette, L.V.; Gómez-Hernández, J.J. Spatial variability of hydraulic conductivity and solute transport parameters and their spatial correlations to soil properties. Geoderma 2019, 339, 59–69. [Google Scholar] [CrossRef]
- Soracco, C.G.; Lozano, A.L.A.; Balbuena, R.; Ressia, J.M.; Filgueira, R.R. Contribution of macroporosity to water flux of a soil under different tillage systems. Rev. Brasileira de Ciência do Solo 2012, 36, 1149–1156. [Google Scholar] [CrossRef][Green Version]
- Wang, Q.; Lu, C.; Li, H.; He, J.; Sarker, K.K.; Rasaily, R.G.; Liang, Z.; Qiao, X.; Li, H.; McHugh, A.D.J. The effects of no-tillage with subsoiling on soil properties and maize yield: 12-Year experiment on alkaline soils of Northeast China. Soil Tillage Res. 2014, 137, 43–49. [Google Scholar] [CrossRef]
- De Almeida, W.S.; Panachuki, E.; De Oliveira, P.T.S.; Menezes, R.D.S.; Sobrinho, T.A.; De Carvalho, D.F. Effect of soil tillage and vegetal cover on soil water infiltration. Soil Tillage Res. 2018, 175, 130–138. [Google Scholar] [CrossRef]
- Basche, A.; DeLonge, M.S. Comparing infiltration rates in soils managed with conventional and alternative farming methods: A meta-analysis. PLoS ONE 2019, 14, e0215702. [Google Scholar] [CrossRef]
- Fernández-Ugalde, O.; Virto, I.; Bescansa, P.; Imaz, M.; Enrique, A.; Karlen, D. No-tillage improvement of soil physical quality in calcareous, degradation-prone, semiarid soils. Soil Tillage Res. 2009, 106, 29–35. [Google Scholar] [CrossRef]
- Martínez, E.; Fuentes, J.-P.; Silva, P.; Valle, S.; Acevedo, E. Soil physical properties and wheat root growth as affected by no-tillage and conventional tillage systems in a Mediterranean environment of Chile. Soil Tillage Res. 2008, 99, 232–244. [Google Scholar] [CrossRef]
- Xiao, L.; Zhao, R.; Kuhn, N.J. No tillage is not an ideal management for water erosion control in China. Sci. Total Environ. 2020, 736, 139478. [Google Scholar] [CrossRef] [PubMed]
- López-Fando, C.; Almendros, G.; Bello, A. Effects of no-tillage on yield and soil properties under semi-arid conditions in central Spain. In Integrated Soil and Sediment Research: A Basis for Proper Protection; Springer: Berlin/Heidelberg, Germany, 1993; Volume 1, pp. 147–148. [Google Scholar] [CrossRef]


| Prof. (cm) | Horizon FAO | Texture (USDA) | SOC (g kg−1) | N (%) | C/N | BD (g cm−3) | |||
| Sand % | Silt % | Clay % | |||||||
| 0–18 | Ap | 37.1 | 39.8 | 23.1 | 6.1 | 0.10 | 6.3 | 1.46 | |
| 18–34 | ABt | 37.3 | 40.2 | 22.5 | 5.3 | - | - | 1.56 | |
| 34–68 | Bt | 31.1 | 33.9 | 35.0 | 4.6 | 0.06 | 6.8 | 1.57 | |
| 68–91 | BCt | 43.5 | 32.2 | 24.3 | - | - | - | - | |
| 91–131 | Ck | 49.1 | 31.3 | 19.6 | - | - | - | - | |
| Prof. (cm) | Horizon FAO | pH (1:2.5 H2O) | Ca CO3 (%) | K (ppm) | Exchangeable cations (cmol(+)·kg−1) | ||||
| Total | Active | Ca | Mg | K | Na | ||||
| 0–18 | Ap | 7.8 | 0.0 | - | 27.0 | 14.5 | 3.0 | 0.30 | 0.16 |
| 18–34 | ABt | 7.5 | 0.0 | - | - | 13.8 | 3.6 | 0.10 | 0.20 |
| 34–68 | Bt | 7.3 | 0.8 | - | 19.5 | 12.8 | 4.1 | 0.10 | 0.13 |
| 68–91 | BCt | 7.5 | 1.6 | - | - | 16.6 | 5.0 | 0.15 | 0.22 |
| 91–131 | Ck | 7.8 | 15.6 | 5.8 | - | 19.6 | 5.8 | 0.10 | 0.27 |
| Factors | |||||
|---|---|---|---|---|---|
| Tillage (n = 12) | Crop rotation (n = 18) | ||||
| CT | MT | NT | Wheat-Wheat | Wheat-Vetch | |
| SOC 0–10 cm (g kg−1) | 7.5 ± 0.7 c | 10.6 ± 1.9 b | 15.4 ± 2.2 a | 10.8 ± 3.5 a | 11.5 ± 3.9 a |
| SOC 10–20 cm (g kg−1) | 7.5 ± 0.9 ab | 7.8 ± 0.7 a | 6.6 ± 0.9 b | 7.2 ± 0.9 a | 7.4 ± 1.0 a |
| SR SOC | 1.01 | 1.36 | 2.32 | 1.50 | 1.55 |
| N 0–10 cm (g kg−1) | 0.95 ± 0.11 b | 1.13 ± 0.16 b | 1.49 ± 0.21 a | 1.11 ± 0.26 a | 1.27 ± 0.34 a |
| N 10–20 cm (g kg−1) | 0.82 ± 0.08 a | 0.82 ± 0.15 a | 0.76 ± 0.14 a | 0.77 ± 0.13 a | 0.83 ± 0.12 a |
| SR N | 1.16 | 1.38 | 1.96 | 1.44 | 1.53 |
| P 0–10 cm (mg kg−1) | 15.5 ± 4.2 b | 21.8 ± 6.8 a | 24.2 ± 5.6 a | 18.9 ± 5.7 a | 22.1 ± 7.3 a |
| P 10–20 cm (mg kg−1) | 16.8 ± 4.6 a | 15.08 ± 3.8 a | 13.4 ± 4.9 a | 14.1 ± 3.7 a | 16.1 ± 5.2 a |
| SR P | 0.92 | 1.45 | 1.80 | 1.34 | 1.37 |
| K 0–10 cm (mg kg−1) | 308 ± 99 b | 357 ± 109 ab | 428 ± 94 a | 413 ± 118 a | 316 ± 78 b |
| K 10–20 cm (mg kg−1) | 255 ± 58 a | 248 ± 68 a | 241 ± 69 a | 277 ± 48 a | 219 ± 65 b |
| SR K | 1.21 | 1.44 | 1.78 | 1.49 | 1.44 |
| 2 Factors (Rotation and Tillage System) | |||||||
|---|---|---|---|---|---|---|---|
| Soil Parameters | n | Wheat-Wheat (Monocrop) | Wheat-Vetch (Rotation) | ||||
| CT | MT | NT | CT | MT | NT | ||
| CND | 12 | 10.0 ± 2.64 b | 12.7 ± 6.14 ab | 17.4 ± 8.7 a | 13.9 ± 7.2 a | 16.1 ± 12.6 a | 18.3 ± 10.6 a |
| WSA (%) | 12 | 19.1 ± 8.8 a | 26.1 ± 7.6 a | 24.2 ± 8.3 a | 24.3 ± 9.5 a | 28.4 ± 11.7 a | 25.9 ± 8.8 a |
| Inf (mm h−1) | 3 | 84 ± 19 a | 145 ± 128 a | 69 ± 24 b | 126 ± 38 a | 105 ± 20 a | 44 ± 27 b |
| SOC (g kg−1) | 12 | 7.2 ± 0.6 b | 9.1 ± 1.8 a | 10.7 ± 4.5 ab | 7.8 ± 0.9 a | 9.3 ± 2.3 a | 11.3 ± 5.1 b |
| TN (%) | 12 | 0.08 ± 0.01 b | 0.09 ± 0.02 a | 0.11 ± 0.04 a | 0.09 ± 0.4 b | 0.10 ± 0.02 a | 0.12 ± 0.05 a |
| P (mg kg−1) | 12 | 14.1 ± 2.6 b* | 18.8 ± 5.6 a | 16.7 ± 6.3 ab | 18.2 ± 4.9 a* | 18.1 ± 7.4 a | 20.9 ± 8.2 a |
| K (mg kg−1) | 12 | 305 ± 89 a | 343 ± 113 a | 388 ± 125 a | 258 ± 75 a | 262 ± 82 a | 281 ± 103 a |
| BD (Mg m−3) | 6 | 1.36 ± 0.10 b | 1.45 ± 0.11 ab | 1.51 ± 0.08 a | 1.42 ± 0.10 a | 1.46 ± 0.16 a | 1.45 ± 0.11 a |
| Macrop (% v/v) | 6 | 10.9 ± 3.7 a* | 8.4 ± 4.4 ab | 5.2 ± 2.1 b | 4.6 ± 2.1 a* | 5.2 ± 5.3 a | 4.1 ± 3.6 a |
| Mesop (% v/v) | 6 | 15.5 ± 0.7 a* | 12.8 ± 2.1 ab* | 12.5 ± 1.4 b | 20.5 ± 3.4 a* | 19.1 ± 4.6 a* | 18.8 ± 4.0 a |
| TP (% v/v) | 6 | 49.1 ± 3.6 a | 47.4 ± 5.2 a | 44.0 ± 2.3 a | 48.9 ± 4.8 a | 47.1 ± 6.0 a | 46.5 ± 6.1 a |
| FC (% v/v) | 6 | 22.7 ± 1.2 b | 26.2 ± 2.5 a | 26.3 ± 1.2 a | 23.7 ± 1.6 a | 22.8 ± 3.4 a | 23.6 ± 3.9 a |
| PWP (% v/v) | 6 | 8.1 ± 0.5 b | 10.6 ± 1.9 a | 9.7 ± 0.9 a | 8.9 ± 1.0 a | 9.0 ± 1.4 a | 10.6 ± 1.3 a |
| AWC (% v/v) | 6 | 14.6 ± 1.2 b | 15.6 ± 0.9 ab | 16.6 ± 0.6 a* | 14.9 ± 1.1 a | 13.8 ± 2.4 a | 13.0 ± 2.8 a* |
| AWC/TP (% w/w) | 6 | 29.7 ± 2.6 b | 33.4 ± 4.9 ab | 37.8 ± 3.0 a* | 30.8 ± 4.9 a | 29.8 ± 7.1 a | 28.0 ± 5.9 a* |
Publisher’s Note: MDPI stays neutral with regard to jurisdictional claims in published maps and institutional affiliations. |
© 2021 by the authors. Licensee MDPI, Basel, Switzerland. This article is an open access article distributed under the terms and conditions of the Creative Commons Attribution (CC BY) license (http://creativecommons.org/licenses/by/4.0/).
Share and Cite
Bienes, R.; Marques, M.J.; Sastre, B.; García-Díaz, A.; Esparza, I.; Antón, O.; Navarrete, L.; Hernánz, J.L.; Sánchez-Girón, V.; Sánchez del Arco, M.J.; et al. Tracking Changes on Soil Structure and Organic Carbon Sequestration after 30 Years of Different Tillage and Management Practices. Agronomy 2021, 11, 291. https://doi.org/10.3390/agronomy11020291
Bienes R, Marques MJ, Sastre B, García-Díaz A, Esparza I, Antón O, Navarrete L, Hernánz JL, Sánchez-Girón V, Sánchez del Arco MJ, et al. Tracking Changes on Soil Structure and Organic Carbon Sequestration after 30 Years of Different Tillage and Management Practices. Agronomy. 2021; 11(2):291. https://doi.org/10.3390/agronomy11020291
Chicago/Turabian StyleBienes, Ramón, Maria Jose Marques, Blanca Sastre, Andrés García-Díaz, Iris Esparza, Omar Antón, Luis Navarrete, José L. Hernánz, Víctor Sánchez-Girón, María J. Sánchez del Arco, and et al. 2021. "Tracking Changes on Soil Structure and Organic Carbon Sequestration after 30 Years of Different Tillage and Management Practices" Agronomy 11, no. 2: 291. https://doi.org/10.3390/agronomy11020291
APA StyleBienes, R., Marques, M. J., Sastre, B., García-Díaz, A., Esparza, I., Antón, O., Navarrete, L., Hernánz, J. L., Sánchez-Girón, V., Sánchez del Arco, M. J., & Alarcón, R. (2021). Tracking Changes on Soil Structure and Organic Carbon Sequestration after 30 Years of Different Tillage and Management Practices. Agronomy, 11(2), 291. https://doi.org/10.3390/agronomy11020291