Abstract
Bioenergy crops such as Miscanthus × giganteus are foreseeable as an alternative source to replace fossil fuel and reduce greenhouse gas emissions. They are also assessed as an environment-friendly solution for polluted, marginal and low-quality agricultural soils. Several studies had been launched on soil organic carbon sequestration potentials of miscanthus culture along with its impacts on restoring soil functionality, most of which focus on the long-term basis of the plant’s cultivation. Nevertheless, information concerning the short term impacts as well as the situation in Czechia is still scarce. In this context, a field experiment was launched in 2017 in a poor-quality agricultural land in the city of Chomutov (North-Western Czechia) to compare the impacts of the perennial C4 miscanthus with an annual C3 forage crop (wheat) on the soil carbon stocks as well as enhancing its functionality. Results through the 0–30 cm soil profile examination showed that miscanthus plants played a role in improving the studied soil physico-chemical (bulk density and soil organic carbon concentrations) and biological (Phospholipid fatty acids stress indicator, basal respiration and fluorescein diacetate hydrolytic activity) parameters. The naturally occurring δ13C concentrations were used to evaluate the direct plant contribution to the total soil organic carbon (SOC) stocks and revealed considerable miscanthus contribution all over the detected soil layers (1.98 ± 0.21 Mg C. ha−1 yr−1) after only 3 growing seasons. It is thus suggested that the C4 perennial miscanthus possess remarkable prospects for SOC sequestration and restoring degraded lands.
1. Introduction
In most European countries, fossil fuels (coal and gas) are still the main source of energy production and represent a major source of greenhouse gases and air pollution [1,2]. To combat the resulting negative environmental and health impacts, EU members modified their targets for 2030 to achieve at least 40% reduction of greenhouse gases (GHGs) emissions and reach a share of at least 32% in renewable energy compared with 1990 [3].
Bioenergy production, is an attractive renewable alternative to the traditional fossil fuel and is expected to compensate the increasing energy demand, alleviate energy crisis and mitigate climate change [4,5]. Corn cultivation and stover harvesting represent one of the largest annual crop-based biofuel feedstocks and are expected to meet the growing demand for biofuel [5]. Nevertheless, it is questionable how much biomass could be produced taking into consideration the competition with food and feed along with the adverse environmental consequences that are not yet fully understood [6,7]. Therefore, the shift towards the second-generation energy corps is gaining more popularity for several socio-economic and environmental reasons [8].
Second generation energy crops, with high yield biomass are considered a good alternative source of energy, as they possess high capacities to reduce GHGs emissions and mitigate climate changes [9,10,11]. These lignocellulosic rich feedstocks are mainly perennial grasses such as Miscanthus × giganteus or switchgrass [12,13]. Having in mind the limited area of agricultural land and to avoid the food production conflict, cultivation of such high biomass crops is becoming more favorable on marginal and less fertile lands unsuitable for arable crops [1,11,14]. Hence, the increase in their volume over the past 15 years is justifiable [15]. Beside their positive socio-economic and environmental impacts, perennial biomass crops play a pivotal role in enhancing the degraded soil quality by improving water and nutrient retention, reducing pollutants dispersion as well as augmenting soil biodiversity [16,17,18]. Another important feature is their long-term impact on the soil organic carbon (SOC) stocks, via carbon sequestration or emission [9]. The SOC pool is a decisive factor in carbon storage and plays a vital role in the global carbon cycle [19]. Land-use/management changes are key factors in affecting the SOC dynamics and may consequently contribute to fluctuations in the carbon sequestration potentials [19].
The C4 perennial lignocellulose rich, rhizomatous grass “Miscanthus × giganteus” hereafter termed miscanthus, is a good candidate for biomass production for energy purposes. This high-yield, sterile hybrid and noninvasive crop, has the potential to grow in various climates and adapt to diverse soil conditions, comprising low-quality agricultural and marginal lands [11,20]. Along with their high yield and low agricultural inputs, as a perennial grass, miscanthus has the capacity to increase SOC pool compared with annual crops due to the large quantities of belowground depositions of their extensive root system [21,22]. Moreover, with the adoption of late harvest (spring) strategy, leaf fall and litter accumulation on the surface also contribute to the soil carbon pool. Another reason for such prediction is the fact that soil disturbance resulting from annual ploughing processes is restricted only to the establishment phase and thereby SOC mineralization is reduced [9]. However, field work has shown a broad spectrum of results with both losses and gains in SOC following land-use conversion towards miscanthus cultivars [16,17,21]. For instance, Poeplau and Don [23] reported SOC change rates under miscanthus established on arable land ranging from −6.85 to + 7.70 t.ha−1.yr−1. Several site-specific interacting factors could be taken into consideration to justify the different outcome such as soil texture, age of the crop, mean temperature, management practices and initial SOC concentrations [24,25]. For instance, soil disturbance due to ploughing and increasing global temperatures are known to have negative impacts on the soil carbon stocks by stimulating the decomposition and release of soil carbon [16,23], whereas SOC tends to increase with the increase of clay content and as a result of the relatively large quantities of rootstock belowground and the translocation of considerable proportions of carbon to the root system or rhizomes [13,23]. In addition, some of the uncertainties regarding the effect of the bioenergy crop on SOC stocks are probably related to methodological difficulties in measuring SOC stock changes [9].
In Czechia, fossil fuels still account for the bulk of energy supply and domestic energy production (>70%) [26]. Along with this serious economic and environmental issue, the state has been suffering from the deterioration of agricultural soil quality during the past 25 years [27]. Indeed, 51% of the agricultural land is threatened by erosion, compaction, contamination and principally loss of organic matter [28]. To offset fossil fuels and to enhance the degraded soil quality, there is an increase in perennial biomass crops implementation as alternative energy source from 2% in 2000 to almost 10% in 2018 [26]. In spite this increase, papers that shed light on the contribution of perennial biomass crops to soil quality improvement and SOC dynamics are still scarce. Accordingly, the low-quality soil of the agricultural experimental site at the Crop Institute in Chomutov is a vivid example on the land-use shifting towards the perennial bioenergy grass Miscanthus × giganteus. A field experiment was set to determine the potentials of miscanthus to grow and proliferate on the low-quality soil. This paper evaluates on short term basis the impacts on the agricultural soil upon converting the land-use towards the perennial bioenergy grass Miscanthus × giganteus in comparison with adjacent control sites cultivated with annual forage crop. Precisely, we measured the (i) changes in soil biological parameters, (ii) physicochemical parameters and (iii) changes in the total SOC stocks including the 13C/12C carbon ratios which indicate the input of carbon from plant photosynthesis.
2. Materials and Methods
2.1. Field Selection and Design
An experimental research field was established at the Crop Research Institute in Chomutov, North-Western Czechia. The field is located in the terrestrial Paleogene and Neogene of the Bohemian massif (50.4607750 N, 13.3855908 E), with mean annual precipitation of 525 nm and annual temperature of 7.6 °C. According to the basic soil survey from 1967, the agricultural area in the site is classified as low quality, mainly because the soil is shallow, less structural, relatively acidic pH (pH/KCl about 5.5) and a weakly humic with low ratio of humic to fulvic acids (<1) (Table 1). Historically (19th century) there were few small individual brown-coal mines on the site; residua of the mining were detected in soil until recently. During the WWII the area suffered from bombing aiming to the nearby railway station (Details about the site history are presented in Supplementary Material).

Table 1.
Soil parameters in the experimental field at the Crop Research Institute in Chomutov, North Western Czechia. Results are expressed as means ± SD (n = 4).
The current miscanthus field area is 450 m2. Prior to miscanthus cultivation, annual crop rotation was taking place. In April 2017, 100 m2 was cultivated by miscanthus rhizomes after soil ploughing and weed mechanical removal. Initially, the main purpose of the research was to determine the miscanthus capacity to grow on low-quality soils as well as to determine and compare biomass calorific values upon PGR treatment (ongoing research, results will be published later). For this sake, half of the rhizomes were treated with plant growth regulator (PGR, Stimpo) and were cultivated in an area of 50 m2. The other half (referred to as control, 50 m2) was cultivated by untreated rhizomes (1 rhizome per m2). In April 2018, same treatments were performed (with and without PGR) and rhizomes were planted on the other 350 m2. In both plots neither fertilizers nor pesticides were applied. In November 2018 (end of first and second growing season respectively), miscanthus samples were collected from every plot and measured for biomass (0.5 t.ha−1 for the 2017 control plot).
In the current work, soil and miscanthus samples were collected from the 2017 control plot (i.e., without rhizome treatment, 50 m2) as the soil was less disturbed and the root and rhizome system was more developed compared to the 2018 plot which was recently ploughed. The avoidance of possible PGR impacts was considered while planning. For the sake of comparison and to reply to the research objectives, an adjacent field cultivated by an annual forage crop C3 photosynthesis type wheat (Triticum aestivum L.) of an area 35,000 m2 was selected. Prior to wheat cultivation, the C3 perennial grass Phalaris arundinacea was cultivated for approximately 10 years. The wheat field was also 3 years old and neither fertilizers nor pesticides were applied. Due to the relatively large area of the wheat field (35,000 m2) in comparison with targeted miscanthus plot (50 m2), an adjacent subplot of similar area (i.e., 50 m2) was framed in the wheat field, from which samples were collected. That was done to ensure the homogeneity of the soil parameters in both fields and to avoid possible variations or heterogeneity originating from the wheat field. Moreover, as soil information prior to the miscanthus and wheat cultivation was lacking, unplanted soils were collected from the so-called unplanted pathway separating the two fields and taken as reference corresponding to the initial soil state.
2.2. Sampling and Sample Preparation
Soil cores were randomly collected by a soil auger (Ø 7 cm, Edelman auger by Eijkelkamp—Giesbeek, Netherlands) under 4 different miscanthus and wheat clusters in the selected sub-plots. Another 4 soil cores were also collected in the unplanted pathway which represents the initial soil state prior to cultivation (Figure S2a–c, respectively). Soil sampling took place on the 20th of June 2019 (corresponding to the third growing season).
The cores were divided into 3 layers (0–10, 10–20 and 20–30 cm). At each layer, a standard-size steel cylinder (113 cm3) was pushed into the soil for the bulk density determination. Four replicates were taken from each location. Soil samples were collected into plastic bags and transported to the laboratory on the same day. Subsample from the 0–10 cm layer was stored at −40 °C for PLFA analysis. Another subsample was sieved to 2 mm and conserved at 4 °C for further biological analysis. The remaining portion of the 0–10 cm layer and the entire 10–20 and 20–30 cm collected samples were dried at 40 °C, sieved to pass 2 mm mesh and ball milled before the physico-chemical and 13C/12C analysis.
On the same day, miscanthus plants parts (leaves, stems, rhizomes, roots as well as the surface litter layer) were collected from the same locations from which soil samples were taken and stored in plastic bags. Rhizomes were visible until 15 cm depth, while roots went deeper until 30 cm depth. Wheat (above and belowground) samples were collected as well. However, no litter was collected due to annual ploughing activities. Samples were also transported to the laboratory, oven dried at 40 °C, cut into smaller pieces and then ball milled for the 13C/12C analysis.
It is important to mention that 10 g of each of the soil and plant samples, were oven dried at 105 °C for 48 h to determine their corresponding residual humidity which was used as a correction factor in further calculations.
2.3. Soil Physico-Chemical and Biological Analysis
Soil pH (H2O) was determined via Lab pH meter (inoLab® pH 7110-WTW, by Xylem Analytics – Weilheim in Oberbayern, Germany) upon stirring a mixture of soil and deionized water according to ISO 10390 standard. Soil organic carbon was measured by a TOC analyzer (SKALAR PrimacsSLC). Soil bulk densities were determined at each depth by collecting the soil in standard-size steel cylinders (113 cm3) and weighing the sample before and after oven drying for 48 h at 105 °C.
Phospholipid fatty acids (PLFA) analysis was performed to determine the soil microbial biomass and microbial community structure according to the ISO/TS 29843-2. PLFAs extraction from soil samples is described by Holík et al. [29]. Briefly, soil was extracted by mixture of chlorophorm, methanol and phosphate buffer. The polar lipid fraction was separated on silica columns and fatty acid methyl esters (FAMEs) were prepared by alkaline methanolysis. PLFAs were quantitatively analyzed by Varian 3800 gas chromatograph with DB-FFAP capillary column (60 m × 0.25 mm × 0.50 µm, Agilent); helium as carrier gas (constant flow 0.8 mL/min); splitless injection (1 µL, 0.2 min, 240 °C); oven program 100 °C, 2 min, 4 °C/min to 240 °C, 5 min, and Varian 4000 ion trap mass spectrometer (external ionization source at 180 °C, transferline at 240 °C, ion trap temperature at 180 °C, manifold temperature at 40 °C, monitored mass range from 33 to 450 amu). Total PLFA concentration was determined as the sum of peaks in total ion chromatogram (TIC) eluting in retention window determined from a standard Bacterial Acid Methyl Esters CP Mixture (Matreya LLC, Pennsylvania, USA). Quantification was carried out using 11 calibration PLFAs curves from standard GLC-10 Mixture (Matreya LLC) and GLC-80 Mixture (Matreya LLC). Methyl nonadecanoate (Matreya LLC) was used as the internal standard particularly abundant. FAMEs were identified by comparison to commercial PLFAs standard (Matreya LLC).
Soil basal respiration (BR) and fluorescein diacetate hydrolytic activities (FDHA) were quantified according to methods stated by Al Souki et al. [30].
2.4. Soil and Plant δ13C Analysis
In order to determine and compare the contribution of the C4 photosynthesis perennial grass (Miscanthus × giganteus) and the C3 photosynthesis forage crop (T. aestivum L.), the stable isotopic composition of 13C was measured in all soil layers and different plant organs following tcarbonate removal from the ball milled samples. A Thermo Flash 2000 elemental analyzer connected to a Thermo Delta V Advantage isotope ratio mass spectrometer in a Continuous Flow IV system (Thermo Fisher Scientific) was used. All of the standards were referenced to the international standard Pee Dee Belemnite (PDB).
The 13C abundance in the analyzed samples was expressed in the delta units (δ13C ‰) referring to the following equation [21,31]:
where Rsample is the isotope ratio 13C/12C of the sample and Rstandard is the 13C/12C ratio of the PDB. The fraction of the soil C that is derived from the miscanthus (FM) or the wheat (FW) plants was determined according to the following equation:
where δ2 is the δ13C of the soil under miscanthus or wheat, δ0 is the δ13C of the soil before introduction of either miscanthus or wheat (as δ0 was undetermined at the beginning of the experiment, the unplanted soil in the present study was used instead as the reference), and δ1 is the δ13C of the plant material entering the soil (leaves, stems, roots for both plants and rhizomes in the miscanthus case).
δ13C = [(Rsample/Rstandard) − 1] × 1000,
FM or FW = (δ2 − δ0)/(δ1 − δ0),
Finally, the SOC was also expressed as the amount of C per unit crop surface (Mg C. ha−1) based on the average bulk density of the soil under both plantations. The annual contribution was calculated as well.
2.5. Statistical Analysis
Data were first subjected to Jarque-Bera normality test. Analysis of variance (one way or multiple in case of interactions) was performed for modalities comparison. In the few cases where the significant Levene’s test showed inhomogenity of variance, the Kruskal-Wallis was used. If statistically significant (p ≤ 0.05) differences were present, Fisher (LSD) test was carried out for pair-wise comparisons. The results of tests and interaction graphs were used for interpretation of uncovered differences. Spearman coefficients of order correlation along with their ρ values were calculated in order to explain dependences between quantitative variables. All statistical analyses were performed using XLSTAT software, Statgraphics Centurion 18 and PAST 4.02.
3. Results
3.1. Soil Physico-Chemical Parameters
The upcoming results present the variations and comparisons detected among the different soil plantations at different depths.
The highest pH results presented in Figure 1. were detected in the unplanted soil. Values ranged between 6.43 and 6.65. A significant decrease was detected in the wheat (annual crop) cultivated soil, except for the 0–10 cm depth. In comparison with the unplanted control soil, the decline ranged between 2.7 and 7.4%. On the other hand, significant differences were detected at all soil depths under miscanthus culture (perennial grass). In comparison with the unplanted control soil, the decline ranged between 9.4 and 10.6%.
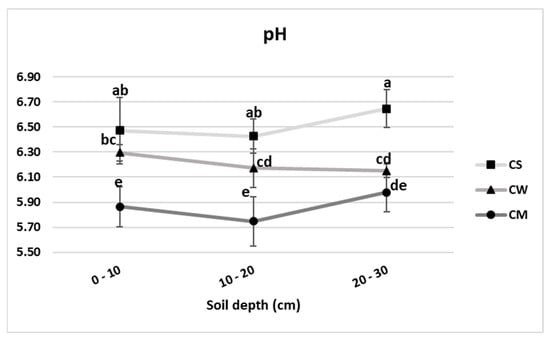
Figure 1.
pH values of unplanted soil (CS), soil cultivated by wheat (CW) and soil cultivated by miscanthus (CM) at depths (0–10, 10–20 and 20–30 cm). Values are presented as means ± SD. Different letters refer to significant differences in soils (Fisher LSD test, n = 4, p ≤ 0.05).
The highest bulk density was recorded in the unplanted soil recording 1.27, 1.39 and 1.32 g.cm−3 in the 0–10, 10–20 and 20–30 cm depths respectively (Figure 2). Values were significantly lower under both cultures, with miscanthus-cultivated soil possessing the minimal values. The average rate of decline was 13.8 and 29.7% under the wheat and miscanthus cultivated soils respectively.
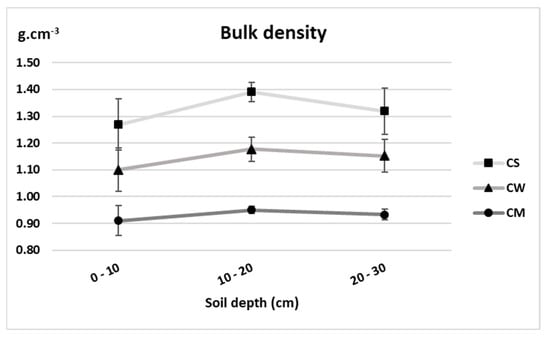
Figure 2.
Bulk density (g.cm−3) of unplanted soil (CS), soil cultivated by wheat (CW) and soil cultivated by miscanthus (CM) at depths (0–10, 10–20 and 20–30 cm). Values are presented as means ± SD. Different letters refer to significant differences in soils (Fisher LSD test, n = 4, p ≤ 0.05).
As demonstrated in Figure 3, the lowest SOC concentrations were detected in the unplanted soils recording 21.68, 20.18 and 17.58 g.kg−1 at 0–0, 10–20 and 20–30 cm depths respectively. The most significant increase was detected in the miscanthus cultivated soil at 0–10 cm depth (25.68 g.kg−1), with a concentration 18.5% higher than its corresponding unplanted reference.
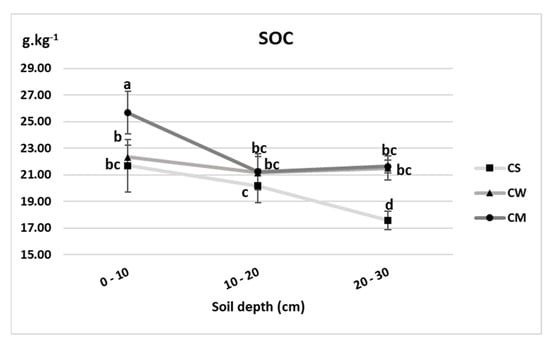
Figure 3.
Soil organic carbon concentrations (g.kg−1) of unplanted soil (CS), soil cultivated by wheat (CW) and soil cultivated by miscanthus (CM) at depths (0–10, 10–20 and 20–30 cm). Values are presented as means ± SD. Different letters refer to significant differences in soils (Fisher LSD test, n = 4, p ≤ 0.05).
3.2. Soil Biological Parameters
Due to the fact that the soil biological activity and biomass are most elevated and most representative globally at the top 0-10 cm layer and decrease with depth [29,32], and since the miscanthus roots were highly dense and intensified in this layer regarding other layers, it is noteworthy to mention that the soil biological parameters were only measured at 0–10 cm depth.
The total PLFA, their composition and the stress indicator under the unplanted, wheat and miscanthus cultivated soils are presented in Table 2. Despite that the concentrations of the total PLFA, quantitative indicator of living microbial biomass, were higher in the planted soils (29.35 and 26.53 mg.kg−1 corresponding to wheat and miscanthus cultivated soils respectively), no significant variations were detected among the different treatments. As for the other PLFA indicators, no differences were recorded in the fungal portion under the 3 different studied soils. Concerning the remaining PLFA (G+, G−, actino- and other bacteria), significant differences were always and only detected between the miscanthus cultivated soils and the un-planted ones, without any differences with the wheat cultivated ones. Finally, the values of cy/pre ratio, indicator of microbial transition to stationary growth phase, revealed the least stressed microorganisms under the miscanthus cultivated soils (0.58), followed by those under the wheat and unplanted soils (0.62 and 0.67 respectively).
Table 2.
Total PLFA concentrations (mg.kg−1), microbial community structure (%) based on indicator fatty acids and the cy/pre stress indicator in unplanted soil (CS), soil cultivated by wheat (CW) and soil cultivated by miscanthus (CM) at 0–10 cm depths. Values are presented as means ± SD. Different letters refer to significant differences in soils (Fisher LSD test, n = 4, p ≤ 0.05).
The lowest respiration activity was registered in the bare soil (2.09 mg C.kg−1 dry soil) as shown in Figure 4. An increase was detected in both wheat and miscanthus planted soils, with the latter recording the highest increment (10.05 mg C.kg−1 dry soil).
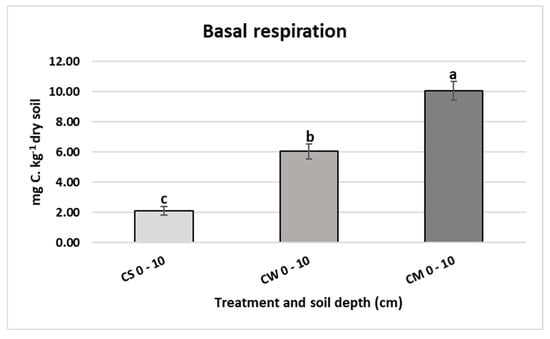
Figure 4.
Basal respiration (mg C.kg−1 dry soil) in unplanted soil (CS), soil cultivated by wheat (CW) and soil cultivated by miscanthus (CM) at 0–10 cm depths. Values are presented as means ± SD. Different letters refer to significant differences in soils (Fisher LSD test, n = 4, p ≤ 0.05).
The weakest FDHA was detected in the unplanted soil (0.41 mg fluo.g−1 dry soil.h−1) as shown in Figure 5. The activity increased significantly under both the perennial and annual plants, with miscanthus scoring the highest augmentation by 45.3% (0.59 mg fluo.g−1 dry soil.h−1).
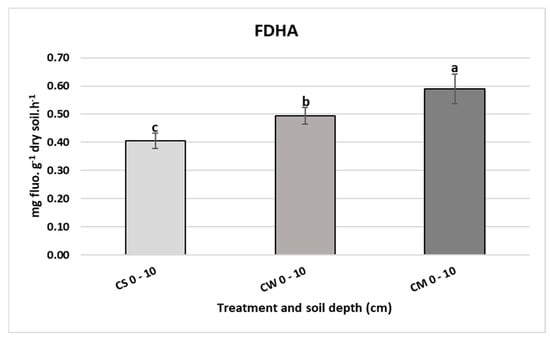
Figure 5.
Fluorescein diacetate hydrolytic activity (mg fluo.g−1 dry soil.h−1) in unplanted soil (CS), soil cultivated by wheat (CW) and soil cultivated by miscanthus (CM) at 0–10 cm depths. Values are presented as means ± SD. Different letters refer to significant differences in soils (Fisher LSD test, n = 4, p ≤ 0.05).
3.3. δ13. C Values and Plant Contribution to the Total SOC Stocks
The δ13C values, indicator of photosynthesis-based carbon input to the soil organic matter, (Figure 6) were influenced by the plant species. There was no significant difference among the unplanted and C3 annual crop (wheat), where values ranged between −26.90 and −26.37‰. On the other hand, the soil under the perennial C4 grass M. x giganteus witnessed remarkable increase in the total δ13C concentrations at the 0–10, 10–20 and 20–30 cm depths recording −25.26, −25.66 and −25.74‰ respectively. Moreover, the input of the C4 derived C from the miscanthus was mainly located in the 0–10 cm soil layer, with a contribution of 12.5% of the total C in that layer (Figure 7). This amount decreased in the lower layers to reach 7.9 and 7.1% in 10–20 and 20–30 cm depths respectively. Depending on these numbers, and after 3 years of miscanthus cultivation, the amount of the C4- derived organic carbon in the entire profile was 5.96 ± 0.63 Mg C. ha−1, averaging 1.98 ± 0.21 Mg C. ha−1.yr−1. On the other hand, the C3 annual wheat crop contribution to the total SOC stock was lower than that of the miscanthus, yet more evenly distributed throughout the different layers ranging between 3.1 and 5.3% at the 20–30 and 0–10 cm layers respectively (Figure 7). Overall, the total wheat contribution was estimated by 3.26 Mg C. ha−1, averaging 1.08 Mg C. ha−1.yr−1.
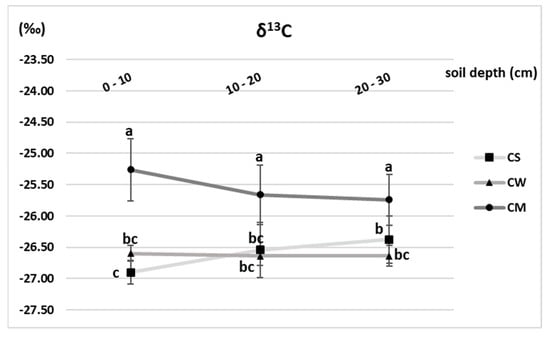
Figure 6.
δ13C values (‰) of unplanted soil (CS), soil cultivated by wheat (CW) and soil cultivated by miscanthus (CM) at depths (0–10, 10–20 and 20–30 cm). Values are presented as means ± SD. Different letters refer to significant differences in soils (Fisher LSD test, n = 4, p ≤ 0.05).
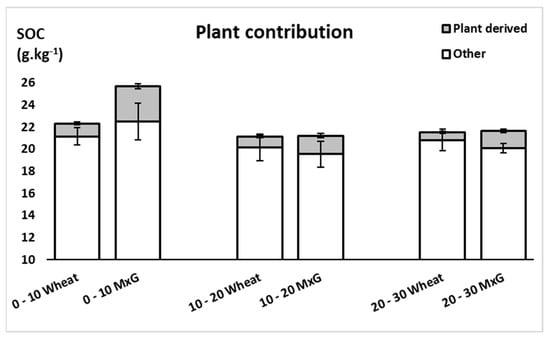
Figure 7.
Miscanthus and wheat derived carbon content (g.kg−1) at soil depths (0–10, 10–20 and 20–30 cm). Values are presented as means ± SD.
4. Discussion
This study was conducted on a low-quality agricultural field, during the establishment phase of the Miscanthus × giganteus plants (2–3 years old). The initial plan was to collect soil samples reaching 60 cm depth. However, as plants were still young, the root system was recognized at the 0–30 cm layer and not deeper. Therefore, the sampling plan was changed on spot to 30 cm depth only. Interestingly, several research papers took also the same choice. For instance, Dondini et al. [31], Zimmermann et al. [13] and Zatta et al. [11] collected soil samples until 30 cm depth and the miscanthus were either in the establishment phase or 6–7 years old. Finally, Ferchaud et al. [9] stated that during 5-year period, SOC concentrations under perennial crops increased in the surface layer (0–10 cm) and that changes in δ13C showed that C inputs were mainly located in the 0–18 cm layer. Therefore, in our context of newly grown miscanthus, 0–30 cm soil depth choice was the more practical and logic choice.
The results obtained thus represent the short-term impact of this perennial grass on the soil physico-chemical and biological properties, principally the total SOC stocks and the direct contribution of the cultivar in comparison with an adjacent annual forage crop (wheat, Triticum aestivum L.). It is also essential to state that the weeds in the miscanthus field were removed on regular basis and kept on the soil surface, and therefore the results represent mainly the miscanthus contribution to the soil quality.
4.1. Impact on Soil Physico-Chemical Parameters
Taking into consideration that there was no significant difference between the unplanted soil pH values and the one cultivated with wheat, the miscanthus impact on the soil pH was assessed. Our results of soil pH under miscanthus showed a trend of acidification, which is in harmony with the work of Jezowski et al. [33] and Hu et al. [34] who witnessed a decrease in the soil pH values especially in the topsoil upon miscanthus plantation. Indeed, several factors can play a role in determining the soil pH within the soil-plant interaction in the rhizosphere, among which are the protons (H+) or hydroxyl (OH−) at the root surface upon nutrients uptake [35,36]. Another factor which might explain the results obtained could be the root exudate composition and the ionic forms, that might lead to the soil acidification [36]. In a low soil quality, the modifications in the exudates and ionic forms in the rhizosphere are considered as one of the mechanisms the miscanthus plants apply to obtain optimal growth conditions and nutrient mobility and thus uptake [30,36]. In spite the fact that the pH values under miscanthus were still within acceptable range for agriculture, nevertheless, these results suggest that miscanthus cultivation holds potentials to cause soil acidification. On long term basis, such increased acidity might impact the soil sustainability and possibly have consequences on the crops following miscanthus removal at the end of its life cycle [13,34].
The soil bulk density decreased under both the miscanthus and wheat crops yet it was more evident under the former (18.5% lower). This decline agrees with the field experiments of Zatta et al. [11], Clifton-Brown et al. [24] and Hansen et al. [37] who recorded lower bulk soil densities under miscanthus plots in comparison with annual C3 crops. According to Guzman et al. [38], soil disturbances such as ploughing decrease soil permeability and increase soil bulk density by modifying its structure and aggregation. Moreover, the higher SOC concentrations in the miscanthus soils could play a role in the difference of bulk density values (Figure 8, ρ: −0.53, Table S2), since increased SOC positively improves soil porosity and thus decreases the bulk density [38,39]. The development of the roots and rhizomes especially in young plants could also explain the significant soil bulk density reduction under the miscanthus plants [11].
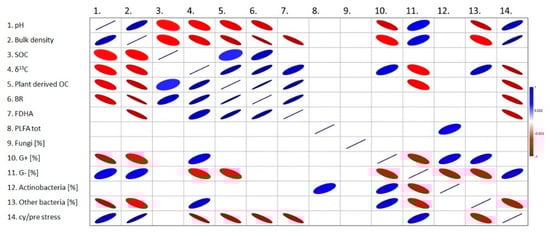
Figure 8.
Spearman correlation matrix between studied soil parameters (ρ: −1 strong negative, ρ: +1 strong positive). SOC: Soil organic carbon; δ13C: Ratio of carbon isotopes; OC: Organic carbon; BR: Basal respiration; FDHA: Fluorescein diacetate hydrolytic activity; PLFA tot: total PLFA (living microbial biomass); G+: Ratio of Gram-positive bacteria; G−: Ratio of Gram-negative bacteria; cy/pre stress: Indicator of cyclopropylated fatty acids to their precursors, indicator of transition of bacteria to stationary growth phase.
In the studied soils, the organic carbon concentration was more elevated than the initial concentrations under the miscanthus cultivars mainly in the upper 0–10 cm layer. These results are consistent with the work of Ferchaud et al. [9] and Hu et al. [34]. Similar results were also mentioned by Cattaneo et al. [21], who stated that the top soil layer (0–15 cm) showed the highest SOC content among the other 15–30 and 30–60 cm layers after 9-year conversion from annual crop system to the perennial miscanthus. In their pot experiment, Al Souki et al. [30] also obtained similar results with an increase in the SOC in miscanthus cultivated pots in comparison with the non-cultivated ones. In the present study, the increase of SOC under the miscanthus plot could be related to its perennial nature, in which tillage occurred only in the year of cultivation, and thus the soil erosion was reduced and the carbon content increased due to mineralization reduction [21,40]. Another reason might be the plant root exudates constituents (carbohydrates, proteins and amino acids) which are regarded as the main source of organic carbon [30,33,41] (Figure 8, ρ: 0.42, Table S2). Moreover, the return of the leaf residues and their subsequent incorporation into the soil (mainly the 0–10 cm layer) could be also a potential source of the significant SOC augmentation [42]. Another factor that could be taken into consideration, is the increase in the soil microbial biomass [43]. For instance, under field conditions Stępień et al. [44] found that in the miscanthus rhizosphere, the number of heterotrophic bacteria was more than three times higher compared to bulk soil. However, in the current work, this correlation was not confirmed.
4.2. Impact on Soil Biological Parameters
Microorganisms are essential players in the soil ecosystem functions and services [45,46]. It has been proved that land use change alters the soil microbial community composition [46,47,48]. In this work we used the PLFA profiling; well established method for characterization of soil microbial communities and assessment of their changes upon external factors [49]. Generally, the PLFA values (Table 2) corresponded to standard agricultural soils with the indication of slight disturbances. The total PLFA concentrations ranged between 22.6 ± 3.1 and 29.4 ± 2.0 mg.kg−1 dwt, which is common in low-tillage agricultural soils or grasslands; intensively used soil often possess lower values [50,51]. The proportion of fungal biomass was lower (4.9 ± 1.3% to 6.1 ± 1.0%), which is also common in agricultural soil [52]. Slight disturbances were indicated by the increased proportion of G− bacterial PLFA compared to G+ and the stress indicator values (cy/pre) compared to the normal average value of 0.4 [53]. Nevertheless, under both wheat and miscanthus, the microbial characteristics were significantly improved compared to bare soil. The decreased proportion of G− PLFA in favor of other dominant microbial groups which are supposed to be less resilient to harsher conditions than G− bacteria is interestingly remarked [52,54]. This observation confirms the usefulness of permanent soil coverage and tillage reduction. Moreover, miscanthus achieved significantly better improvement than wheat in some parameters. Of special interest is the stress indicator value (cy/pre ratio), often considered as an indicator of insufficient nutrients [52]. In fact, when it comes to the degradation of the simple and recalcitrant organic compounds, there exists a competition between the fungal and bacterial strains “niche differentiation” [55]. The outcome (cy/pre ratio) obtained in the present work supports this theory, suggesting that the bacterial strains were more active in cycling the recent and simple compounds within the rhizosphere under the miscanthus plots (Figure 8, ρ: −0.86, Table S2). Similar results were realized by Elias et al. [46], who observed the higher 13C concentrations in G+ and G− biomarkers in comparison with the fungal ones under the miscanthus. Some other papers also mentioned the rapid allocation of C to rhizosphere inhabiting bacteria [56], with G− bacteria playing the fundamental role in the decomposition of the labile C compounds from the exudates [57,58].
As for the global enzymatic activities expressed by the soil basal respiration and fluorescein diacetate hydrolytic activity, results showed that the highest activities were expressed in the miscanthus soil, opposing those obtained in the unplanted and wheat plots. These results are in harmony with the work of Al Souki et al. [30]. Some of the factors standing behind the variation between the activities could be the vegetation type (miscanthus in our case) that plays a decisive role in rendering the soil a suitable environment for the microbial communities and activities to prosper [59,60,61]. Miscanthus derived carbon could be the main driving component in the bacterial activity stimulation (Figure 8, ρ: 0.98 and 0.92 corresponding to BR and FDHA respectively, Table S2), via the easily metabolizable root exudates (sugars, amino acids, fatty acids, growth factors and nucleotides) or the easily available organic compounds of the incorporated miscanthus leaves [42]. These supplied elements enhance the enzymatic synthesis and simultaneously microbial development [62].
4.3. Plant δ13C Values and Contribution to the Total SOC Stocks
The most elevated δ13C values were observed under the perennial miscanthus crop at 0–10 cm depth (−25.26‰) in comparison to −26.60 and −26.90‰ under the annual wheat and unplanted soils. The lower values of δ13C obtained under the wheat crops in comparison with the miscanthus results are in harmony with several other papers [9,21,37]. According to these authors, this outcome could be referred to several factors such as the removal of the recoverable residues (straws), annual tillage of the field in the wheat case, versus accumulation of the aboveground plant residues which are later incorporated into the soil by the activity of soil organisms, absence of tillage and the strong root/rhizome development and deposition in the case of miscanthus. Similar results were also obtained by Zatta et al. [11] who demonstrated the increase in δ13C after 6 years of miscanthus cultivation. Schneckenberger and Kuzyakov [63] obtained similar results as well. Zimmermann et al. [13] also stated that after 2–3 years of conversion to miscanthus, there was a trend towards higher soil carbon contents originating directly from the plant in the upper 10 cm layer, which confirms the high potential of the perennial miscanthus to improve soil carbon stocks [13,64,65]. Moreover, Hu et al. [34] also found that the δ13C composition at all soil layers on the miscanthus fields had lower negative values than those from the grasslands (−24.46‰ versus −28.04‰ respectively) after 5 years of cultivation in the 0−10 cm layer. The fractions of miscanthus-derived SOC concentrations were higher than those of the wheat plants specifically in the upper 0−10 cm layer (12.5 versus 5.3%, corresponding to 1.98 and 1.08 Mg C. ha−1.yr−1 respectively). The tendency of decreasing with soil depth was presented in both plots, however values under miscanthus plants were always more elevated mostly due to the high annual inputs of miscanthus C as a consequence of the extensive root/rhizome mass and deposition along with the accumulation, incorporation and decomposition of the leaf litter on the upper layer of the soil [17,66]. These results are in agreement with the results obtained by Zimmermann et al. [13] who stated a miscanthus contribution to the SOC stock by 1.82 and 2.17 Mg.ha−1 after 2−3 years of miscanthus cultivation under former tilled and grassland fields. Another similar result was referenced in the work of Borzecka-Walker et al. [67], who compared the contribution of the C4 miscanthus and the C3 coppice willow to the net soil carbon sequestration and stated that the former accumulated 2 times more than the latter after 3 years of cultivation (0.64 versus 0.30 Mg C. ha−1.yr−1 respectively). It is clear that the shift towards the perennial C4 Miscanthus × giganteus has augmented the δ13C portion in the soil’s upper layer (0−10 cm), along with enriching to the total SOC. It should be noted that the differences between miscanthus and wheat cannot be explained by history of the locality. Indeed, the 13C carbon indicates relatively recent input originating from the plant photosynthesis. Prior to wheat plantation in 2016, the locality was covered by perennial C3 grass Phalaris arundinacea, which is considered as a soil-meliorating plant, whereas the miscanthus plot was cultivated by rotating annual crops. Thus, based on the history the lower SOC should be expected under miscanthus, however our results indicated the opposite. On the other hand, it should be noted that planting of wheat for four years on one place is not considered sustainable and negative effect on the soil could be expected.
The amount of annual carbon gain in our experiment is relatively intermediate between the ones obtained by Dondini et al. [30] (3.2 Mg C. ha−1.yr−1) and those mentioned by Hansen et al. [37] (0.6 and 0.9 Mg C. ha−1.yr−1 after 9 and 16 years of the grass cultivation). These outcome variations could be related to several factors such as the climate differences, soil types, sampling depths and mainly the initial SOC levels [21]. Several characteristics of the perennial miscanthus (as mentioned previously in the paragraph) should be also taken into consideration while explaining the variations, including the quantity of the aboveground biomass accumulated on the soil surface and its rate of decomposition/incorporation into the soil by the soil organisms, in addition to the root/rhizome biomass which is considered one of the most important factors predicting potential SOC stocks along with their corresponding depositions (quantity and composition) [17,66,67,68].
5. Conclusions
After 3 years of miscanthus cultivation in a poor-quality agricultural soil, the soil physico-chemical parameters (SOC and BD) were enhanced throughout the surface soil profile (0−30 cm) in comparison with the adjacent annual wheat crop, and mainly in the upper 0−10 cm layer. However, a trend of soil acidification was under miscanthus plants was detected as well. In addition, biological parameters were boosted too. Through the δ13C estimation, miscanthus represented considerable potentials to sequester C in the soil and contributed to the increase in the total SOC stocks by means of its extensive root system. This study is the first in Czechia, and shows that the miscanthus is a good candidate to replace arable crops especially in low-quality soils as well as marginal lands, thus growing these cultivars in such degraded areas could be a promising and sustainable answer, not only for energy production, but also for restoring the soil fertility and increasing the C pool. Further investigations concerning the mid and long-term impacts of miscanthus on soil quality should be carried out in the future to validate the obtained results.
Supplementary Materials
The following are available online at https://www.mdpi.com/2073-4395/11/2/293/s1.
Author Contributions
Conceptualization, K.S.A.S.; methodology, K.S.A.S., H.B., J.Š., J.T. (Jakub Trubač); software, J.P.; validation, K.S.A.S., J.T. (Josef Trögl); formal analysis, H.B., S.K., I.M., D.N., H.A.M.; investigation, S.U., R.H.; data curation, K.S.A.S.; writing—original draft preparation, K.S.A.S.; writing—review and editing, K.S.A.S., J.T. (Josef Trögl), P.K., K.K.; visualization, K.S.A.S.; supervision, J.T. (Josef Trögl); project administration, J.T. (Josef Trögl). All authors have read and agreed to the published version of the manuscript.
Funding
This research was funded by the European Union and the Ministry of Education, Youth and Sports of the Czech Republic via the project CZ.02.2.69/0.0/0.0/16_027/0008492 “U21-High Quality of HR for International Area Strengthening”. Long-term field experiments and involvement of students were supported by internal grant agency of J.E. Purkyně University (projects number UJEP-IGA-TC-2019-44-01-2 and UJEP-SGS-2018-44-001-3). Analyses of δ13C was supported by the Center for Geosphere Dynamics (UNCE/SCI/006). Analyses of PLFA and TOC were provided by the research infrastructure NanoEnviCZ supported by the Ministry of Education, Youth and Sports of the Czech Republic (LM2015073).
Institutional Review Board Statement
Not applicable.
Informed Consent Statement
Not applicable.
Data Availability Statement
Data sharing not applicable.
Acknowledgments
Karim Al Souki long-term research stay was funded by the European Union and the Ministry of Education, Youth and Sports of the Czech Republic via the project CZ.02.2.69/0.0/0.0/16_027/0008492 “U21 - High Quality of HR for International Area Strengthening”. Long-term field experiments and involvement of students were supported by internal grant agency of J.E. Purkyně University (projects number UJEP-IGA-TC-2019-44-01-2 and UJEP-SGS-2018-44-001-3). Analyses of δ13C was supported by the Center for Geosphere Dynamics (UNCE/SCI/006). Analyses of PLFA and TOC were provided by the research infrastructure NanoEnviCZ supported by the Ministry of Education, Youth and Sports of the Czech Republic (LM2015073). The authors would like to thank Petra Veronesi Dáňová and Vladislava Nebeská for technical assistance during sampling.
Conflicts of Interest
The authors declare no conflict of interest
References
- Holder, A.J.; Clifton-Brown, J.; Rowe, R.; Robson, P.; Elias, D.; Dondini, M.; McNamara, N.P.; Donnison, I.S.; McCalmont, J.P. Measured and modelled effect of land use change from temperate grassland to Miscanthus on soil carbon stocks after 12 years. GCB Bioenergy 2019, 11, 1173–1186. [Google Scholar] [CrossRef]
- Martins, F.; Felgueiras, C.; Smitkova, M.; Caetano, N. Analysis of fossil fuel energy consumption and environmental impacts in european countries. Energies 2019, 12, 964. [Google Scholar] [CrossRef]
- Buck, M.; Graf, A.; Graichen, P. Agora Energiewende: European Energy Transition 2030: The Big Picture. Ten Priorities for the Next European Commission to Meet the EU’s 2030 Targets and Accelerate towards 2050. 2019. Available online: https://www.agora-energiewende.de/fileadmin2/Projekte/2019/EU_Big_Picture/153_EU-Big-Pic_WEB.pdf (accessed on 15 December 2020).
- González-García, S.; Dias, A.C.; Clermidy, S.; Benoist, A.; Maurel, V.B.; Gasol, C.M.; Gabarell, X.; Arroja, L. Comparative environmental and energy profiles of potential bioenergy production chains in Southern Europe. J. Clean. Prod. 2014, 76, 42–54. [Google Scholar] [CrossRef]
- Zhao, F.; Wu, Y.; Wang, L.; Liu, S.; Wei, X.; Jinfeng, X.; Qiu, L.; Sun, P. Multi-environmental impacts of biofuel production in the U.S. Corn Belt: A coupled hydro-biogeochemical modeling approach. J. Clean Prod. 2020, 251, 119561. [Google Scholar] [CrossRef]
- Hess, J.R.; Kenney, K.L.; Wright, C.T.; Perlack, R.; Turhollow, A. Corn stover availability for biomass conversion: Situation analysis. Cellulose. 2009, 16, 599–619. [Google Scholar] [CrossRef]
- Wu, Y.; Liu, S.; Li, Z. Identifying potential areas for biofuel production and evaluating the environmental effects: A case study of the James river basin in the Midwestern United States. GCB Bioenergy 2012, 4, 875–888. [Google Scholar] [CrossRef]
- Raman, S.; Mohr, A.; Helliwell, R.; Ribeiro, B.; Shortall, O.; Smith, R.; Millar, K. Integrating social and value dimensions into sustainability assessment of lignocellulosic biofuels. Biomass Bioenergy 2015, 82, 49–62. [Google Scholar] [CrossRef] [PubMed]
- Ferchaud, F.; Vitte, G.; Mary, B. Changes in soil carbon stocks under perennial and annual bioenergy crops. GCB Bioenergy 2016, 8, 290–306. [Google Scholar] [CrossRef]
- Mi, J.; Liu, W.; Yang, W.; Yan, J.; Li, J.; Sang, T. Carbon sequestration by Miscanthus energy crops plantations in a broad range semi-arid marginal land in China. Sci. Total Environ. 2014, 496, 373–380. [Google Scholar] [CrossRef]
- Zatta, A.; Clifton-Brown, J.; Robson, P.; Hastings, A.; Monti, A. Land use change from C3 grassland to C4 Miscanthus: Effects on soil carbon content and estimated mitigation benefit after six years. GCB Bioenergy 2014, 6, 360–370. [Google Scholar] [CrossRef]
- Yuan, J.S.; Tiller, K.H.; Al-Ahmad, H.; Stewart, N.R.; Stewart, C.N. Plants to power: Bioenergy to fuel the future. Trends Plant Sci. 2008, 13, 421–429. [Google Scholar] [CrossRef]
- Zimmermann, J.; dauber, J.; Jones, M.B. Soil carbon sequestration during the establishment phase of Miscanthus × giganteus: A regional-scale study on commercial farms using 13C natural abundance. GCB Bioenergy 2012, 4, 453–461. [Google Scholar] [CrossRef]
- Eurostat. Agri-Environmental Indicator-Cropping Patterns. Available online: https://ec.europa.eu/eurostat/statistics-explained/index.php/Agri-environmental_indicator_-_cropping_patterns (accessed on 29 May 2018).
- Popp, J.; Lanker, Z.; Harangi-Rakos, M.; Fari, M. The effect of bioenergy expansion: Food, energy and environment. Renew. Sustain. Energy Rev. 2014, 32, 559–579. [Google Scholar] [CrossRef]
- Anderson-Texeira, K.J.; Davis, S.C.; Masters, M.D.; Delucia, E.H. Changes in soil organic carbon under biofuel crops. GCB Bioenergy 2009, 2, 75–96. [Google Scholar] [CrossRef]
- Zang, H.; Blagodatskaya, E.; Wen, Y.; Xu, X.; Dyckmans, J.; Kuzyakov, Y. Carbon sequestration and turnover in soil under the energy crop Miscanthus: Repeated 13C natural abundance approach and literature synthesis. GCB Bioenergy 2018, 10, 262–271. [Google Scholar] [CrossRef]
- Heděnec, P.; Novotny, D.; Ustak, S.; Honzik, R.; Kovarova, M.; Simackova, H.; Frouz, J. Allelopathic effect of new introduced biofuel crops on the soil biota: A comparative study. Eur. J. Soil Biol. 2014, 63, 14–20. [Google Scholar] [CrossRef]
- Wu, Y.; Liu, S.; Young, C.J.; Dahal, D.; Sohl, T.L.; Davis, B. Projection of corn production and stover-harvesting impacts on soil organic carbon dynamics in the U.S. Temperate Prairies. Sci. Rep. 2015, 5, 10830. [Google Scholar] [CrossRef] [PubMed][Green Version]
- Nsanganwimana, F.; Pourrut, B.; Mench, M.; Douay, F. Suitability of Miscanthus species for managing inorganic and organic contaminated land and restoring ecosystem services. A review. J. Environ. Manag. 2014, 143, 123–134. [Google Scholar] [CrossRef] [PubMed]
- Cattaneo, F.; Barbanti, L.; Gioacchini, P.; Ciavatta, C.; Marzadori, C. 13C abundance shows effective soil carbon sequestration in Miscanthus and giant reed compared to arable crops under Mediterranean climate. Biol. Fertil. Soils 2014, 50, 1121–1128. [Google Scholar] [CrossRef]
- Sumiyoshi, Y.; Crow, S.E.; Litton, C.M.; Deenik, J.L.; Taylor, A.D.; Turano, B.; Ogoshi, R. Belowground impacts of perennial grass cultivation for sustainable biofuel feedstock production in the tropics. GCB Bioenergy 2017, 9, 694–709. [Google Scholar] [CrossRef]
- Poeplau, C.; Don, A. Soil carbon changes under Miscanthus driven by C4 accumulation and C3 decomposition–toward a default sequestration function. GCB Bioenergy 2014, 6, 327–338. [Google Scholar] [CrossRef]
- Clifton-Brown, J.C.; Breuer, J.; Jones, M.B. Carbon mitigation by the energy crop, Miscanthus. Glob. Chang. Biol. 2007, 13, 2296–2307. [Google Scholar] [CrossRef]
- Dondini, M.; Jone, E.O.; Richards, M.; Pogson, M.; Rowe, R.L.; Keith, A.M.; Perks, M.P.; McNamara, N.P.; Smith, J.U.; Smith, P. Evaluation of the ECOSSE model for simulating soil organic carbon under Miscanthus and short rotation coppice-willow crops in Britain. GCB Bioenergy 2015, 7, 527–540. [Google Scholar] [CrossRef]
- OECD. Fossil Fuel Support Country Note: Organisation for Economic Co-Operation and Development (Czech Republic). 2020. Available online: http://www.oecd.org/fossil-fuels/data/ (accessed on 15 December 2020).
- Menšík, L.; Hlisnikovský, L.; Kunzová, E. The State of the Soil Organic Matter and Nutrients in the Long-Term Field Experiments with Application of Organic and Mineral Fertilizers in Different Soil-Climate Conditions in the View of Expecting Climate Change. In Organic Fertilizers—History, Production and Applications; Larramendy, M.L., Soloneski, S., Eds.; IntechOpen: London, UK, 2019; pp. 23–42. [Google Scholar]
- Šarapatka, B.; Bednář, M. Assessment of potential soil degradation on agricultural land in the Czech Republic. J. Environ. Qual. 2015, 44, 154–161. [Google Scholar] [CrossRef]
- Holík, L.; Hlisnikovsky, L.; Honzik, R.; Trogl, J.; Burdova, H.; Popelka, J. Soil microbial communities and enzyme activities after long-term application of inorganic and organic fertilizers at different depths of the soil profile. Sustainability 2019, 11, 3251. [Google Scholar] [CrossRef]
- Al Souki, K.S.; Louvel, B.; Douay, F.; Pourrut, B. Assessment of Miscanthus × giganteus capacity to restore the functionality of metal-contaminated soils: Ex situ experiment. Appl. Soil Ecol. 2017, 115, 44–52. [Google Scholar] [CrossRef]
- Dondini, M.; Hastings, A.; saiz, G.; Jones, M.B.; Smith, P. The potential of Miscanthus to sequester carbon in soils: Comparing field measurements in Carlow, Ireland to model predictions. GCB Bioenergy 2009, 1, 413–425. [Google Scholar] [CrossRef]
- Lavahum, M.F.E.; Joergensen, R.G.; Meyer, B. Activity and biomass of soil microorganisms at different depths. Biol. Fertil. Soils 1996, 23, 38–42. [Google Scholar] [CrossRef]
- Jezowski, S.; Mos, M.; Buckby, S.; Cerazy-Waliszewska, J.; Owczarzak, W.; Mocek, A.; Kaczmarek, Z.; McCalmont, J.P. Establishment, growth, and yield potential of the perennial grass Miscanthus × giganteus on degraded coal mine soils. Front. Plant Sci. 2017, 8, 726. [Google Scholar] [CrossRef] [PubMed]
- Hu, Y.; Schafer, G.; Duplay, J.; Kuhn, N.J. Bioenergy crop induced changes in soil properties: A case study on Miscanthus fields in the Upper Rhine Region. PLoS ONE 2018, 13, e0200901. [Google Scholar] [CrossRef]
- Blossfeld, S.; Perriguey, J.; Sterckeman, T.; Morel, J.L.; Losch, R. Rhizosphere pH dynamics in trace-metal-contaminated soils monitored with planar pH optodes. Plant Soil. 2010, 330, 173–184. [Google Scholar] [CrossRef]
- Hinsinger, P.; Plassard, C.; Tang, C.; Jaillard, B. Origins of root-mediated pH changes in the rhizosphere and their responses to environmental constraints: A review. Plant Soil 2003, 248, 43–59. [Google Scholar] [CrossRef]
- Hansen, E.M.; Christensen, B.T.; Jensen, L.S.; Kristensen, K. Carbon sequestration in soil beneath long-term Micanthus plantatios as determined by 13C abundance. Biomass Bioenergy 2004, 26, 97–105. [Google Scholar] [CrossRef]
- Guzman, J.G.; Ussiri, D.A.N.; Lal, R. Soil physical properties following conversion of a reclaimed minesoil to bioenergy crop production. Catena 2019, 176, 289–295. [Google Scholar] [CrossRef]
- Koestel, J.K.; Norgaard, T.; Luong, N.M.; Vendelboe, A.L.; Moldrup, P.; Jarvis, N.J.; Lamande, M.; Iversen, B.V.; Wollesen de Jonge, L. Links between soil properties and steady-state solute transport through cultivated topsoil at the field scale. Water Resour. Res. 2013, 49, 790–807. [Google Scholar] [CrossRef]
- King, A.; Bradley, R.I.; Harrison, R.; Carter, A.D. Carbon sequestration and saving potential associated with changes to the management of agricultural soils in England. Soil Use Manag. 2004, 20, 394–402. [Google Scholar] [CrossRef]
- Hromádko, L.; Vranova, V.; Techer, D.; Laval-Gilly, P.; Rejsek, K.; Formanek, P.; Falla, J. Composition of root exudates of Miscanthus × giganteus GREEF ET DEU. Acta Univ. Agric. Silvic. Mendel. Brun. 2010, 58, 71–76. [Google Scholar] [CrossRef]
- Al Souki, K.S.; Line, C.; Louvel, B.; Waterlot, C.; Douay, F.; Pourrut, B. Miscanthus × giganteus culture on soils highly contaminated by metals: Modelling leaf decomposition impact on metal mobility and bioavailability in the soil–plant system. Ecotoxicol. Environ. Saf. 2020, 199, 110654. [Google Scholar] [CrossRef]
- Techer, D.; D’Innocenzo, M.; Laval-Gilly, P.; Henry, S.; Bennasroune, A.; Martinez-Chois, C.; Falla, J. Assessment of Miscanthus × giganteus secondary root metabolites for the biostimulation of PAH-utilizing soil bacteria. Appl. Soil Ecol. 2012, 62, 142–146. [Google Scholar] [CrossRef]
- Stępień, W.; Górska, E.B.; Pietkiewicz, S.; Kalaji, M.H. Long-term mineral fertilization impact on chemical and microbiological properties of soil and Miscanthus × giganteus yield. Plant Soil Environ. 2014, 60, 117–122. [Google Scholar] [CrossRef]
- Blagodatskaya, E.; Kuzyakov, Y. Active microorganisms in soil: Critical review of estimation criteria and approaches. Soil Biol. Biochem. 2013, 67, 192–211. [Google Scholar] [CrossRef]
- Elias, D.M.O.; Rowe, R.L.; Pereira, M.G.; Stott, A.W.; Barnes, C.J.; Bending, G.D.; McNamara, N.P. Functional differences in the microbial processing of recent assimilates under two contrasting perennial bioenergy plantations. Soil Biol. Biochem. 2017, 114, 248–262. [Google Scholar] [CrossRef]
- French, K.E.; Tkacz, A.; Turnbull, L.A. Conversion of grassland to arable decreases microbial diversity and alters community composition. Appl. Soil Ecol. 2017, 110, 43–52. [Google Scholar] [CrossRef]
- Tosi, M.; Correa, O.S.; Soria, M.A.; Vogrig, J.A.; Sydorenko, O.; Montecchia, M.S. Land-use change affects the functionality of soil microbial communities: A chronosequence approach in the Argentinian yungas. Appl. Soil. Ecol. 2016, 108, 118–127. [Google Scholar] [CrossRef]
- Watzinger, A. Microbial phospholipid biomarkers and stable isotope methods help reveal soil functions. Soil Biol. Biochem. 2015, 86, 98–107. [Google Scholar] [CrossRef]
- Bailey, V.L.; Peacock, A.D.; Smith, J.L.; Bolton, H. Relationships between soil microbial biomass determined by chloroform fumigation-extraction, substrate-induced respiration, and phospholipid fatty acid analysis. Soil Biol. Biochem. 2002, 34, 1385–1389. [Google Scholar] [CrossRef]
- Trogl, J.; Pavlorkova, J.; Packova, P.; Sejak, J.; Kuran, P.; Popelka, J.; Pacina, J. Indication of importance of including soil microbial characteristics into biotope valuation method. Sustainability 2016, 8, 253. [Google Scholar] [CrossRef]
- Kaur, A.; Chaudhary, A.; Choudhary, R.; Kaushik, R. Phospholipid fatty acid—A bioindicator of environment monitoring and assessment in soil ecosystem. Curr. Sci. 2005, 89, 1103–1112. [Google Scholar]
- Moore-Kucera, J.; Dick, R.P. PLFA profiling of microbial community structure and seasonal shifts in soils of a Douglas-fir chronosequence. Microb. Ecol. 2008, 55, 500–511. [Google Scholar] [CrossRef] [PubMed]
- Frostegard, A.; Tunlid, A.; Baath, E. Use and misuse of PLFA measurements in soils. Soil Biol. Biochem. 2011, 43, 1621–1625. [Google Scholar] [CrossRef]
- Boer, W.; de Folman, L.B.; Summerbell, R.C.; Boddy, L. Living in a fungal world: Impact of fungi on soil bacterial niche development. FEMS Microbiol. Rev. 2005, 29, 795–811. [Google Scholar] [CrossRef]
- Vandenkoornhuyse, P.; Mahe, S.; Ineson, P.; Staddon, P.; Ostle, N.; Cliquet, J.B.; Francez, A.J.; Fitter, A.H.; Young, J.P.W. Active root-inhabiting microbes identified by rapid incorporation of plant-derived carbon into RNA. Proc. Natl. Acad. Sci. USA 2007, 104, 16970–16975. [Google Scholar] [CrossRef] [PubMed]
- Bird, J.A.; Herman, D.J.; Firestone, M.K. Rhizosphere priming of soil organic matter by bacterial groups in a grassland soil. Soil Biol. Biochem. 2011, 43, 718–725. [Google Scholar] [CrossRef]
- Koranda, M.; Kaiser, C.; Fuchslueger, L.; Kitzler, B.; Sessitsch, A.; Zechmeister-Boltenstern, S.; Richter, A. Fungal and bacterial utilization of organic substrates depends on substrate complexity and N availability. FEMS Microbiol. Ecol. 2014, 87, 142–152. [Google Scholar] [CrossRef]
- Bais, H.P.; Weir, T.L.; Perry, L.G.; Gilroy, S.; Vivanco, J.M. The role of root exudates in rhizosphere interactions with plants and other organisms. Annu. Rev. Plant Biol. 2006, 57, 233–266. [Google Scholar] [CrossRef] [PubMed]
- Epelde, L.; Becerril, J.M.; Mijangos, I.; Garbisu, C. Evaluation of the efficiency of a phytostabilization process with biological indicators of soil health. J. Environ. Qual. 2009, 38, 2041–2049. [Google Scholar] [CrossRef]
- Wenhao, Y.; Hong, H.; Mei, R.; Wuzhong, N. Changes of microbial properties in (near-) rhizosphere soils after phytoextraction by Sedum alfredii H: A rhizobox approach with an artificial Cd-contaminated soil. Appl. Soil Ecol. 2013, 72, 14–21. [Google Scholar] [CrossRef]
- Pardo, T.; Clemente, R.; Epelde, L.; Garbisu, C.; Bernal, M.P. Evaluation of the phytostabilisation efficiency in a trace elements contaminated soil using soil health indicators. J. Hazard. Mater. 2014, 268, 68–76. [Google Scholar] [CrossRef]
- Schneckenberger, K.; Kuzyakov, Y. Carbon sequestration under Miscanthus in sandy and loamy soils estimated by natural 13C abundance. J. Plant Nutr. Soil Sci. 2007, 170, 538–542. [Google Scholar] [CrossRef]
- Rowe, R.L.; Street, N.R.; Taylor, G. Identifying potential environmental impacts of large-scale deployment of dedicated bioenergy crops in the UK. Renew. Sustain. Energy Rev. 2009, 13, 260–279. [Google Scholar] [CrossRef]
- Smith, P. Carbon sequestration in croplands: The potential in Europe and the global context. Eur. J. Agron. 2004, 20, 229–236. [Google Scholar] [CrossRef]
- Felten, D.; Emmerling, C. Accumulation of Miscanthus-derived carbon in soils in relation to soil depth and duration of land use under commercial farming conditions. J. Plant Nutr. Soil Sci. 2012, 175, 661–670. [Google Scholar] [CrossRef]
- Borzecka-Walker, M.; Faber, A.; Borek, R. Evaluation of carbon sequestration in energetic crops (Miscanthus and coppice willow). Int. Agrophys. 2008, 22, 185–190. [Google Scholar]
- McGowan, A.R.; Nicoloso, R.S.; Diop, H.E.; Roozeboom, K.L.; Rice, C.W. Soil organic carbon, aggregation, and microbial community structure in annual and perennial biofuel crops. Agron. J. 2019, 111, 128–142. [Google Scholar] [CrossRef]
Publisher’s Note: MDPI stays neutral with regard to jurisdictional claims in published maps and institutional affiliations. |
© 2021 by the authors. Licensee MDPI, Basel, Switzerland. This article is an open access article distributed under the terms and conditions of the Creative Commons Attribution (CC BY) license (http://creativecommons.org/licenses/by/4.0/).