Article

A Variable Rate Drip Irrigation Prototype for Precision Irrigation

1
Department of Biological and Ecological Engineering and Water Resource Engineering, School of Engineering, Oregon State University, Corvallis, OR 97331, USA
2
Department of Soil and Water Resource, College of Agriculture, Al-Qasim Green University, Al-Qasim District 964, Babylon 51013, Iraq
3
Department of Civil and Environmental Engineering, Michigan State University, East Lansing, MI 48824, USA
4
North Willamette Research and Extension Center, Department of Horticulture, College of Agricultural Science, Oregon State University, Aurora, OR 97002, USA
*
Author to whom correspondence should be addressed.
Agronomy 2021, 11(12), 2493; https://doi.org/10.3390/agronomy11122493
Submission received: 17 November 2021 / Revised: 3 December 2021 / Accepted: 5 December 2021 / Published: 8 December 2021

Abstract

:
A new Variable Rate Drip Irrigation (VRDI) emitter that monitors individual water drops was designed, built, and tested. This new emitter controllers water application directly by monitoring the volume applied in contrast to uniform drip irrigation systems that control water application indirectly by pressure compensation and operational times. Prior approaches assumed irrigation volumes based on flow rates and time and typically did not verify the applied amount of water applied at each water outlet. The new VRDI emitter self-monitors the total volume of water applied and halts the flow once the desired total water application has been achieved. This study performed a test for a new VRDI emitter design with two inner diameters of 0.11 cm and 0.12 cm and two outer diameters 0.3 cm and 0.35 cm compared to a commercial drip emitter. Laboratory tests verify that the integrated volume measurements of the VRDI system are independent of pressure. Conversely, the flow rates of the commercial pressure-compensated drip lines were not independent of pressure. These results demonstrate that this form of VRDI is technically feasible and is shown to be energy efficient, requiring lower system operating pressures than pressure-compensated lines. The VRDI system can reduce water consumption and related water costs.

1. Introduction

1.1. Background

Drip irrigation has proliferated as an irrigation technology in recent decades. Drip accounted for 5% of irrigation systems in the US in 1988. By 2010, micro/drip accounted for ≈40% of the irrigated land in California [1]. Drip irrigation has high efficiency and reduces water losses [2]. Chitra et al. [3] studied the effect of drip irrigation on water use efficiency, plant growth, and yield of turmeric compared with flood irrigation. They found significant increases in water use efficiency and plant growth (number of leaves, leaf area, plant height, and matter production). Ayars et al. [4] reviewed a series of subsurface drip irrigation case studies that showed increased yield and crop quality, and reduced water application, weed control, fertilization, and tillage relative to surface irrigation. These efficiency gains lead to increased agriculture production and reduced water loss, and they follow the irrigation innovation technology pathway toward agriculture sustainability [5,6].
One of the principal concerns for field-scale drip irrigation is the potential for non-uniform water application as a result of pressure changes within the drip line. Pressure changes can result from energy losses within the drip line or elevation changes from uneven ground. This concern is addressed with pressure-compensated emitters along the drip line. To improve the watering uniformity, researchers have used high-efficiency pressure control inside the drip line Chapin [7]. Confirmation of the local drip application and its uniformity or lack thereof is also lacking. There are few viable point-of-application sensor options that could be used to verify in real time that the irrigation uniformity is acceptable. This lack of monitoring can make it challenging to identify clogged or otherwise fouled emitters, unexpected irrigation line damages that lead to unexpected pressure losses, or emitter points that have been expanded or eroded from silt and water exclusions without regular visual inspection.
Variable-rate irrigation (VRI) can also increase irrigation efficiency through targeted, site-specific water application [8,9]. VRI is available for moving overhead sprinkler irrigation systems, but there are no variable rate drip irrigation (VRDI) systems in the current marketplace. Recently, researchers patented the use of a segmented variable drip irrigation system by using a flow control valve to supply water for two horizontal pipes [10]. This system is promising but does not yet enable full control of the flow at each emitter. Sanchez et al. [11] performed a field trial of VRDI by segmenting the field into management zones, each controlled with a valve. They found that VRDI led to an increase in yield of 10% and an increase in water use efficiency of 17%. In this manuscript, we present a VRDI method where each drip emitter inlet and/or outlet is individually outfitted with a flow meter to monitor the flow, a valve to manipulate the flow, a communication unit to relay that data, and a microprocessor to control everything. More advanced versions could incorporate localized sensors (humidity, soil moisture, temperature, pH, rain sap flow, dendrometers, or other observables) to automate the irrigation control [12,13]. The advances in data telemetry, miniaturized valves, and electronic controllers have made flow control possible at the emitter and field scale. For example, researchers have utilized the advancements in flow control to build automated drip irrigation systems at the field scale (not VRDI), which control water based on environmental conditions and relay the irrigation and environmental data to a centralized computer. Parameswaran and Sivaprasath [14] made an automated drip irrigation system that integrates the soil moisture, temperature, and pH data in conjunction with an Arduino microcontroller to drive a solenoid valve that controls the irrigation system. Recently, Al-agele et al. [15] compared the volumetric water flow rate between conventional drip emitters and new Variable Rate Drip Irrigation (VRDI) emitters and found that the volumetric water flow rate in the conventional drip tube was 88% larger than the VRDI emitter for all pressures. In addition, increasing pressures lead slightly to changes in the volumetric water flow rate in the VRDI emitter compared to the conventional drip tube.
The aim of this paper is to propose a novel way to monitor and control drip irrigation at the point of application. The sensor proposed is cost with no moving parts and consists of two wire ends with a small voltage differential applied. As a drop passes these ends, it connects the circuit, allowing the sensor to count irrigation droplets in real time. In this way, this study focuses on an approach that measures the cumulative volume of water applied by the drip emitter rather than attempting to measure the instantaneous water flow rate.

1.2. Methodology

The VRDI system was designed to the increase irrigation precision in the amount of water applied. This manuscript outlines the design details and data from a test of the prototype in the lab.

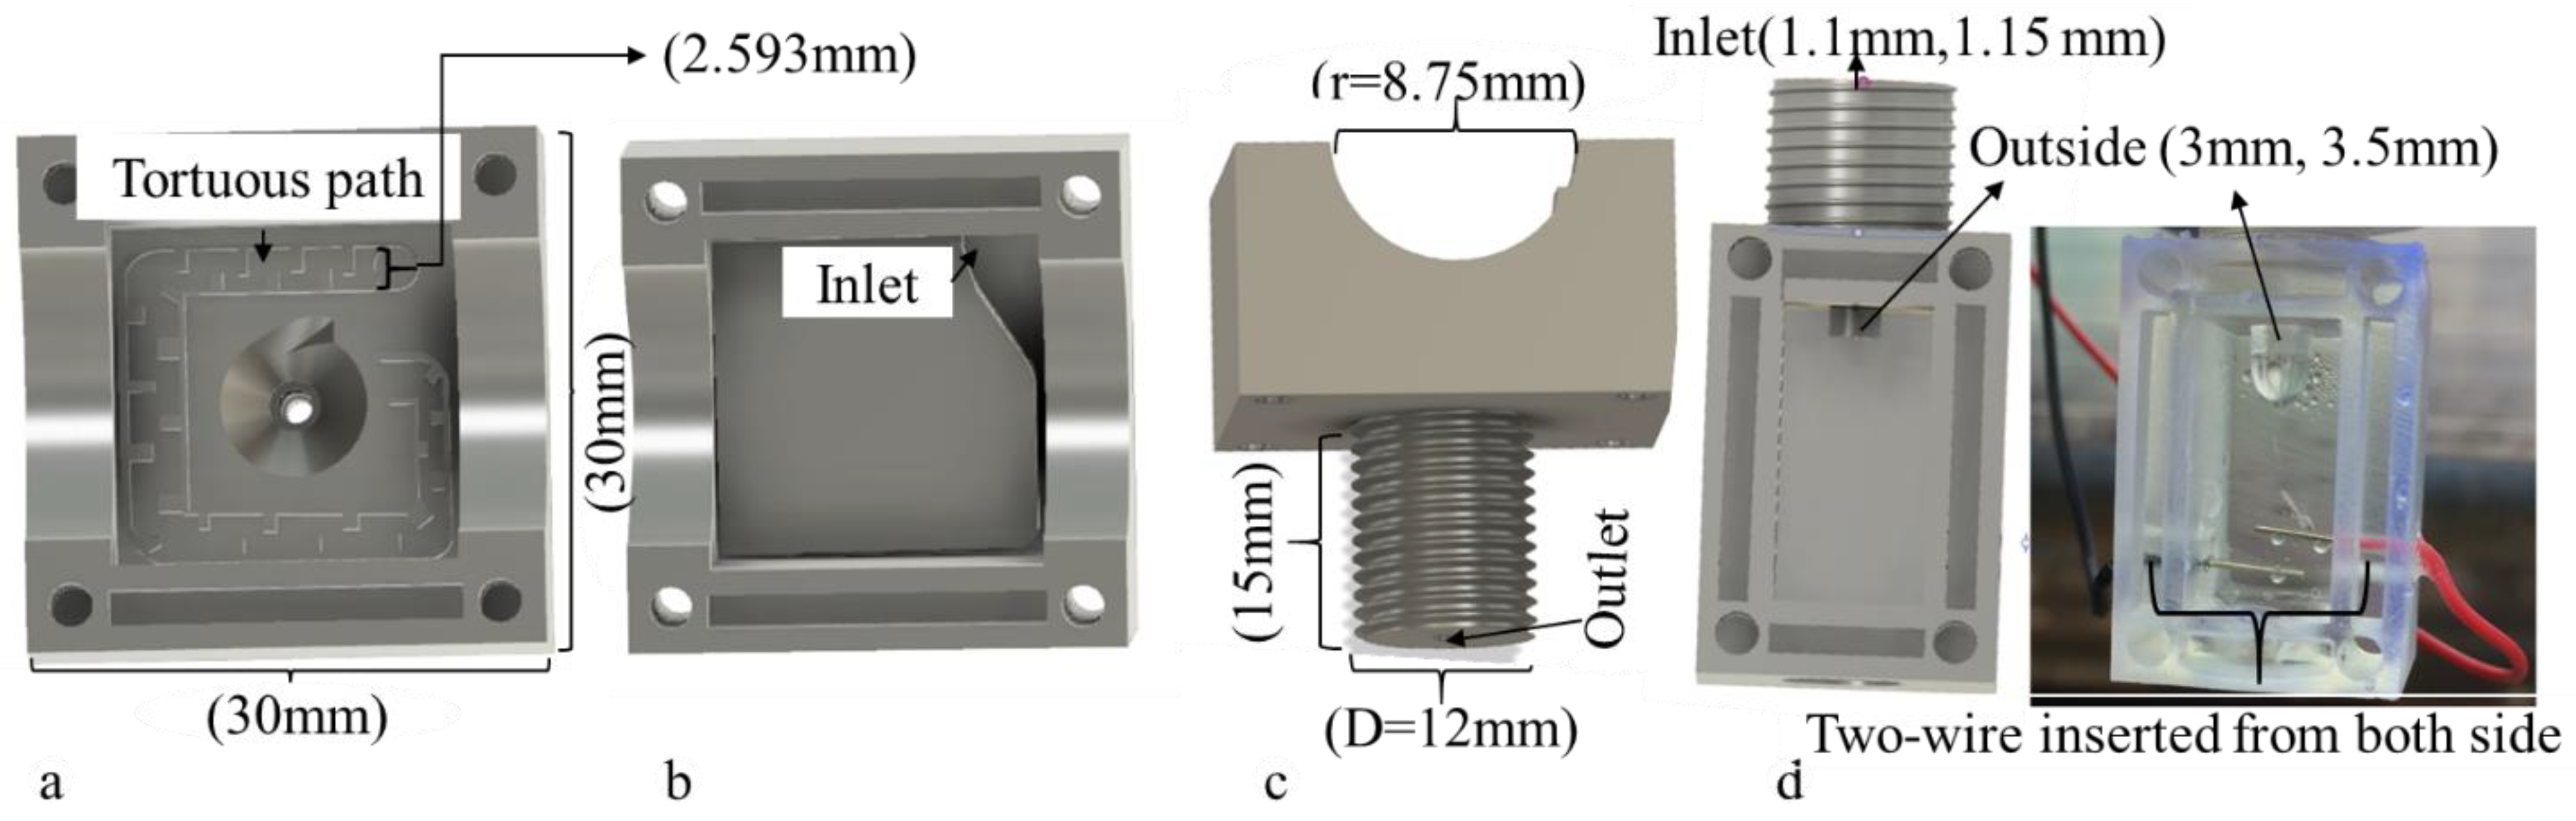
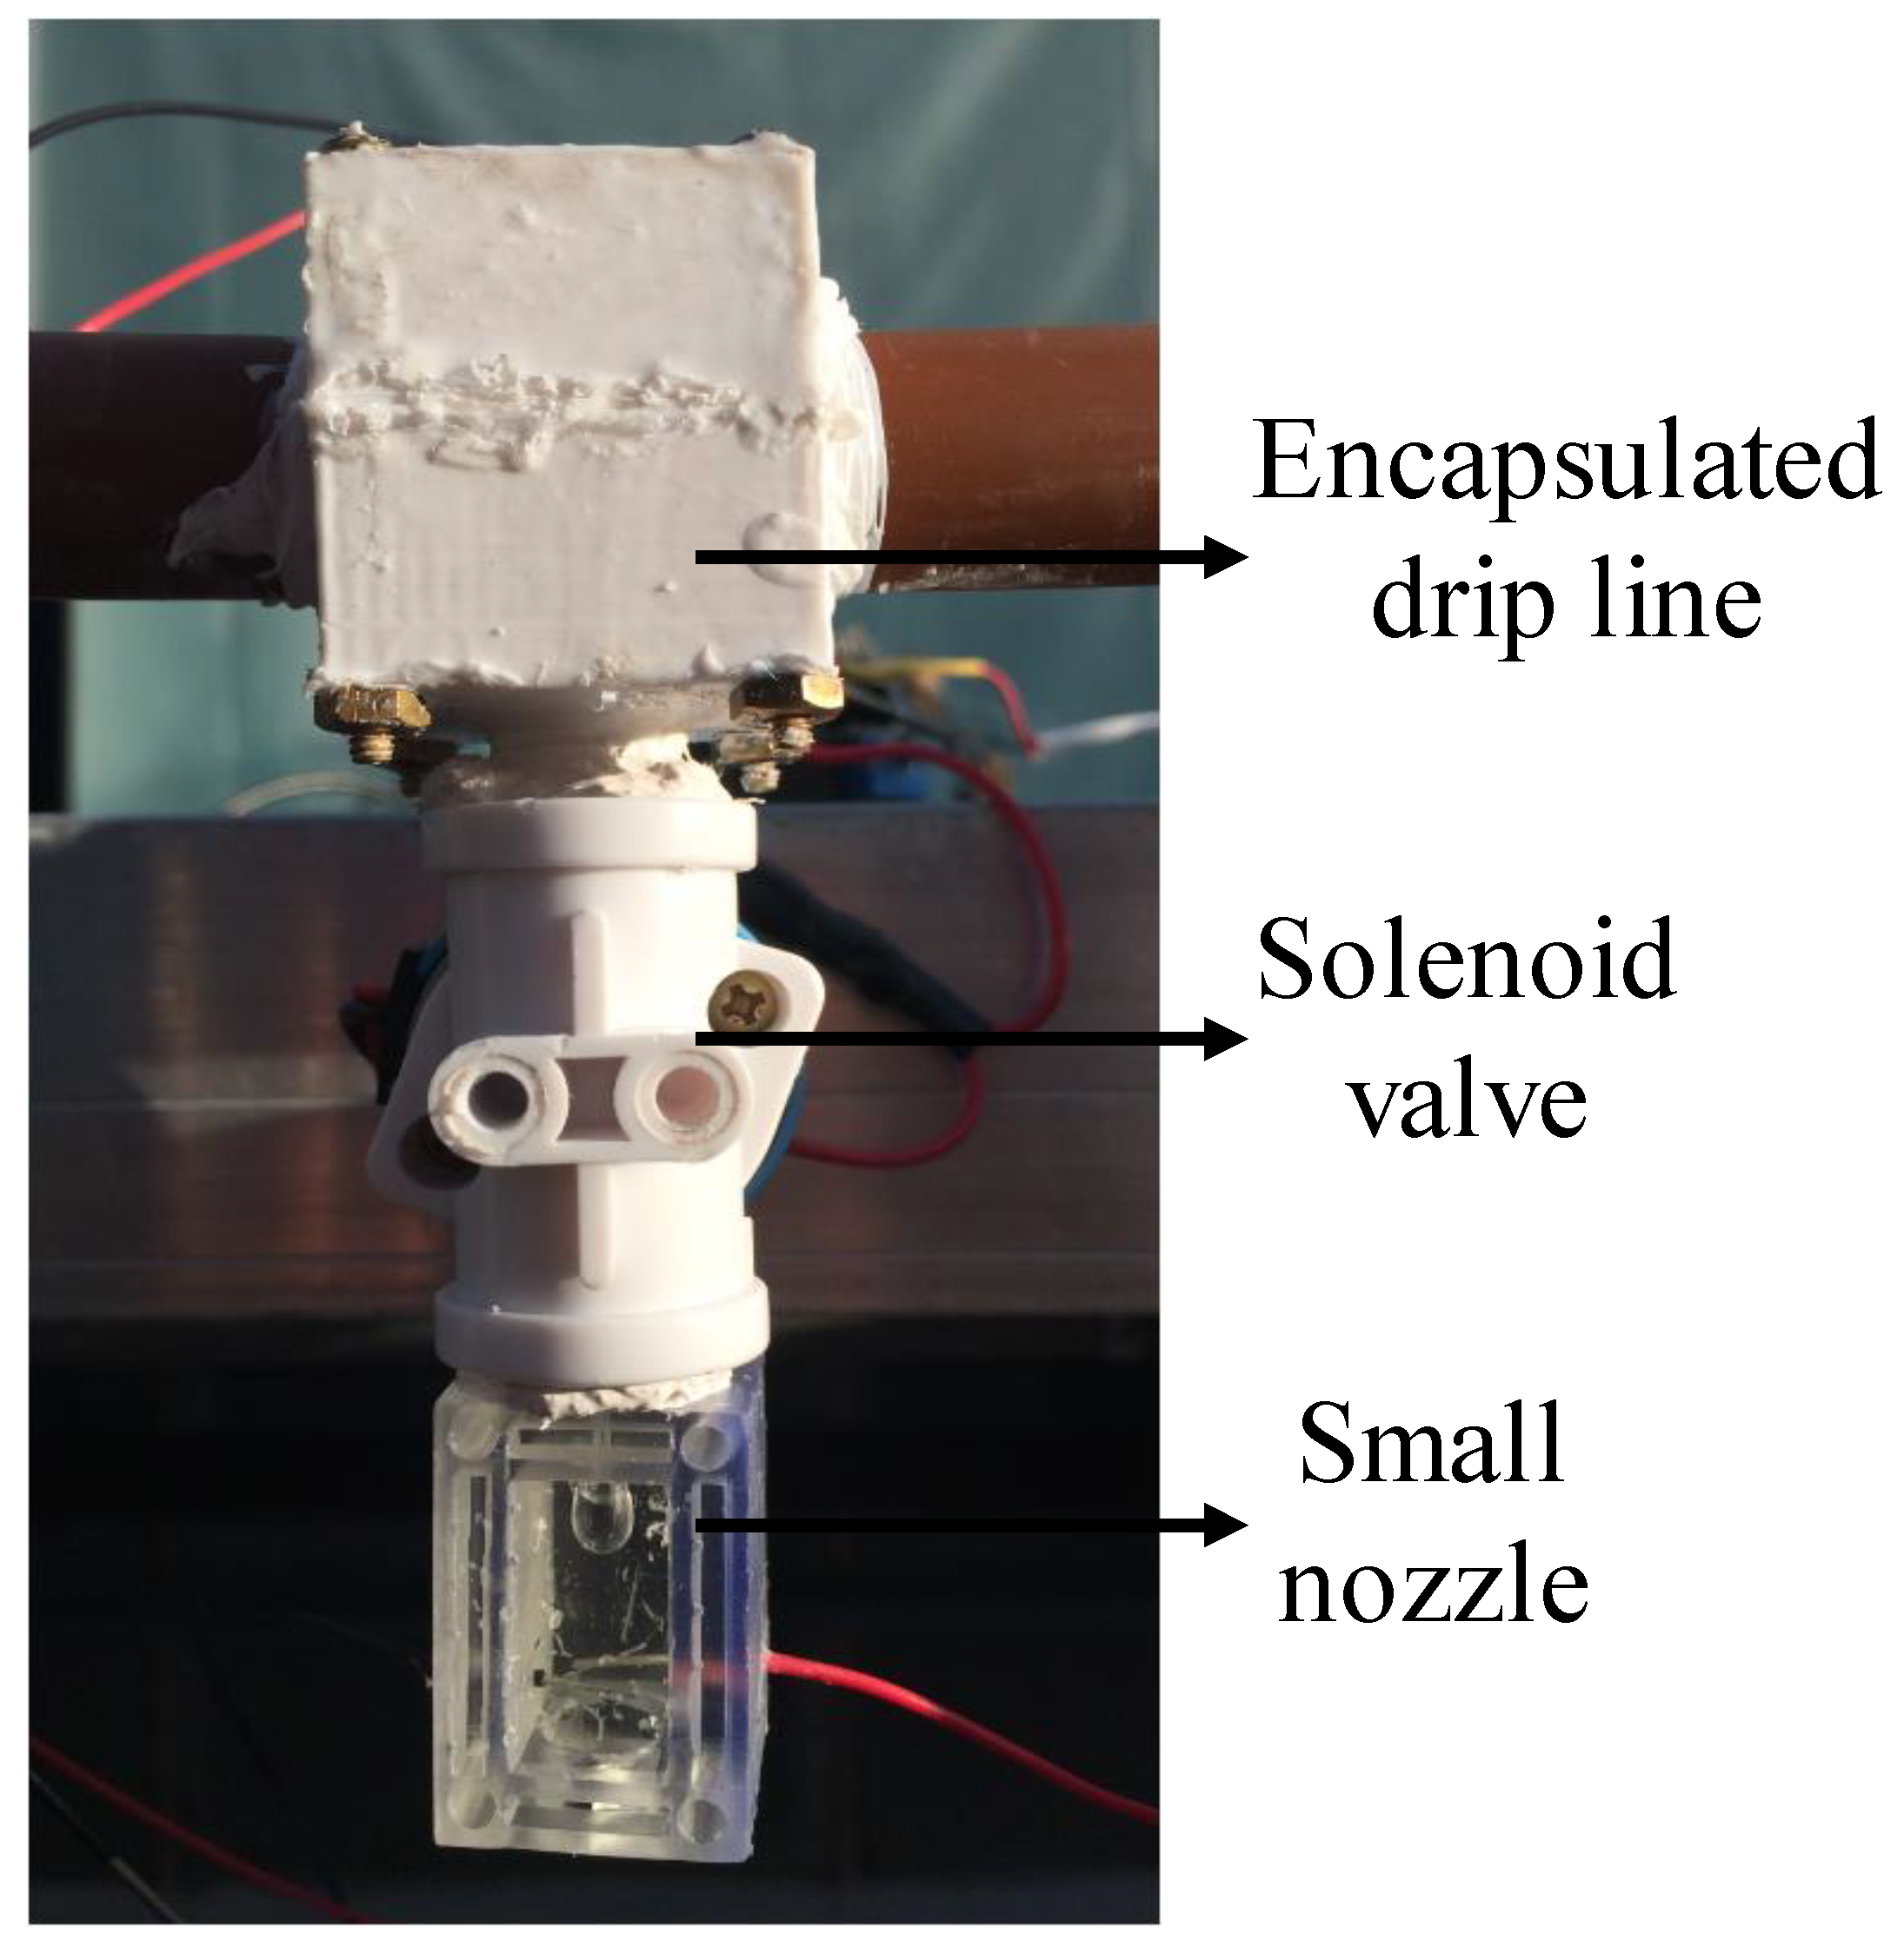
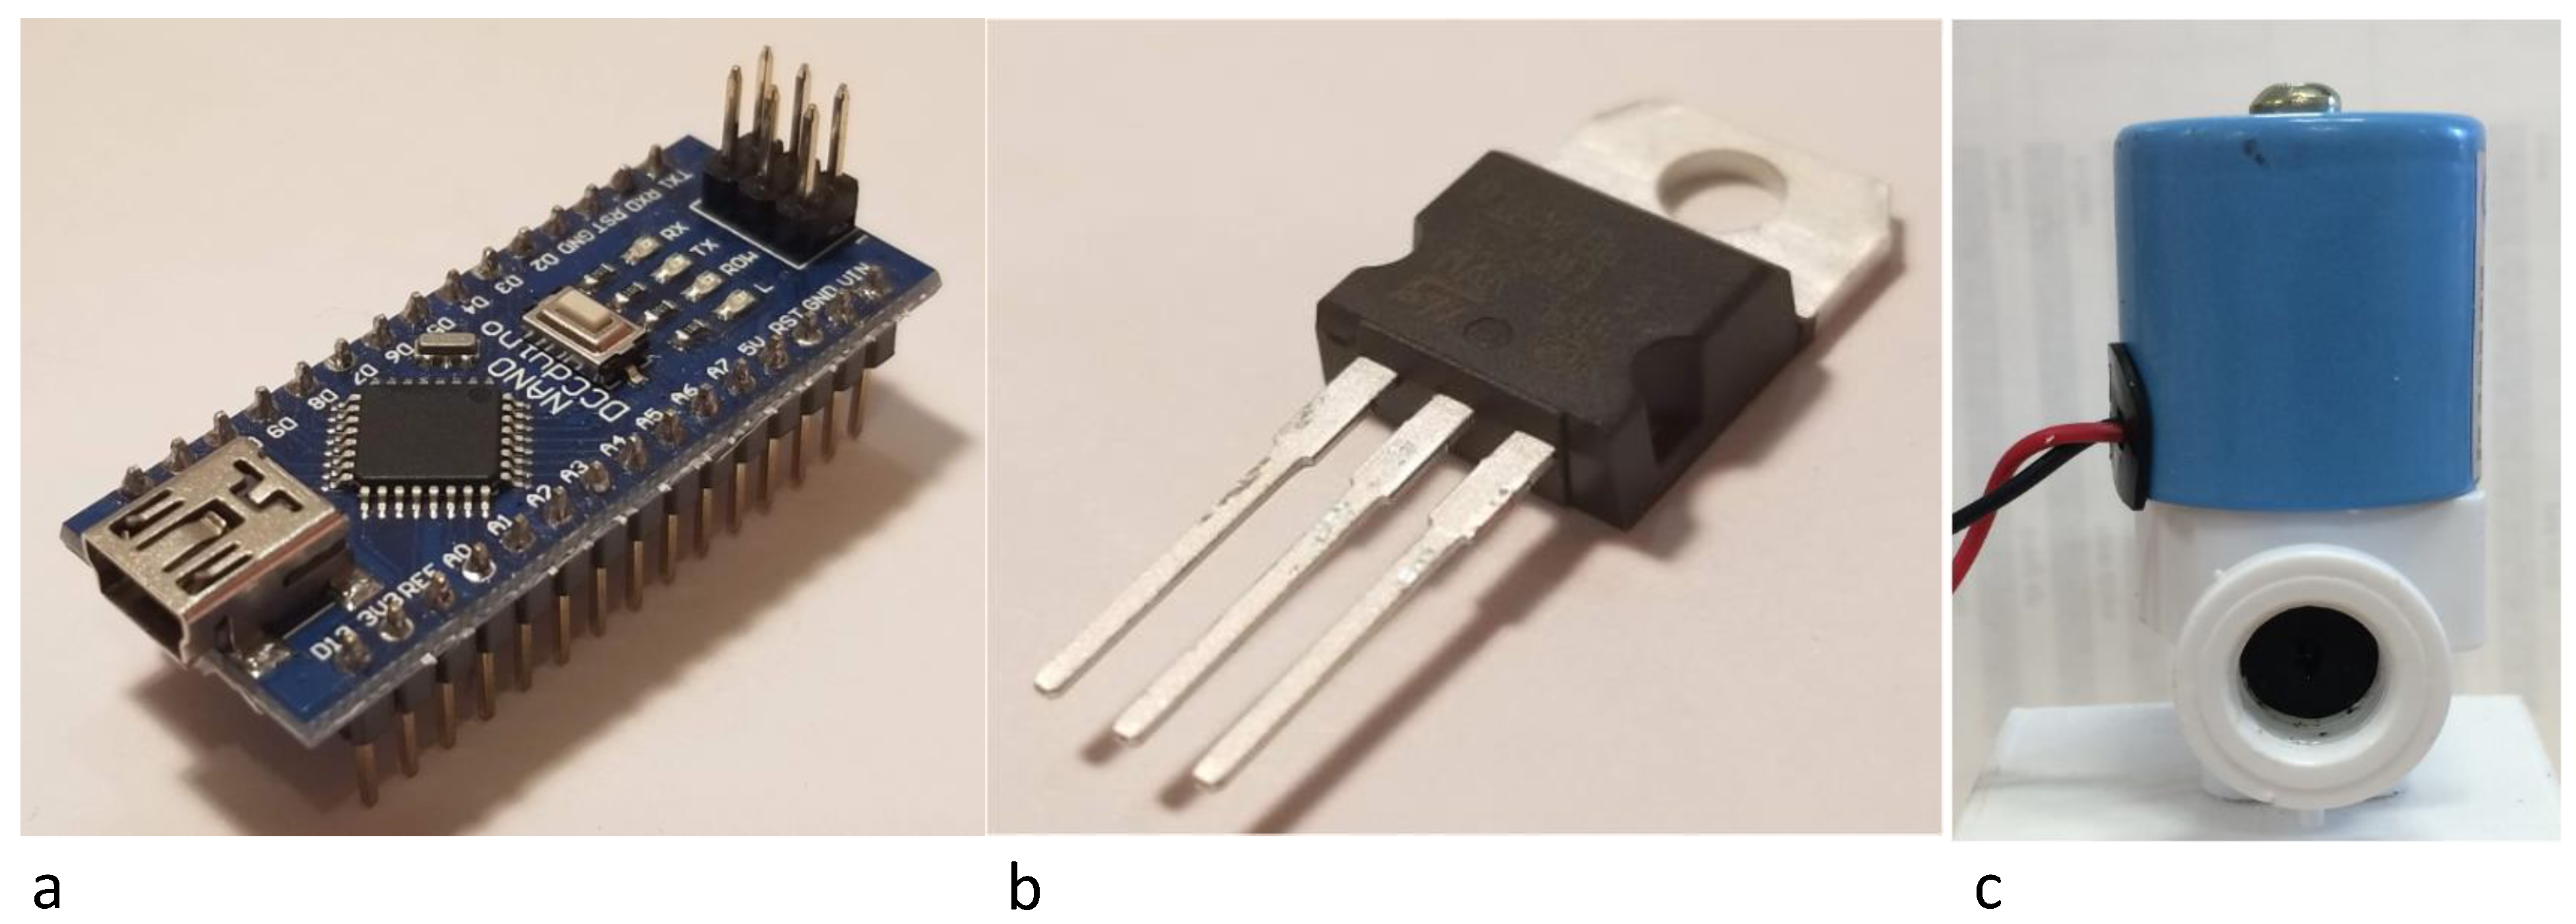
1.3. VRDI Emitter Design

The new VRDI design (Figure 1) controls the water application at the point of delivery. The prototype consists of a custom piece that encapsulates a drip line with an integrated tortuous path to reduce pressure, an electronic solenoid valve (DC12V G 1/4″ Electric Solenoid Valve N/C Feed for RO Water Air Quick Connector from HongQin Water purification Equipment Factory) to regulate the flow, a small nozzle, two wire leads, and circuitry to connect and control the components (DCCDuino Nano and STP16NF06 N MOSFET, 60V, 16A, GDS Newark, NJ, USA) (Figure 2). The VRDI design was created with the Autodesk Fusion model 360 software, and the plastic (ABS) components were 3D printed (FUSION3 F410 and Resins Architecture Industry Form3 SLA 3D Printer by Formlabs, Preform). The physical dimensions of the plastic components were selected to match a standard ¾″ dripline and the inlet on an off-the-shelf solenoid valve (DC12V G 1/4″ Electric Solenoid Valve N/C Feed for RO Water Air Quick Connector from HongQin Water purification Equipment Factory). The tortuous path geometry was determined experimentally through trial and error by adding additional length and tortuosity to the path until drops, rather than a stream, exited the emitter. The emitter was secured to the drip lines using four screws and silicon to prevent water leaks (Figure 1). The small nozzle was designed such that it forms water drops of known and constant diameter. Each drop connects two electric leads (normally separated by an air gap) as it is falling. An electric circuit is closed when the drop passes between the leads. The electric circuitry keeps a running count of the number of times the circuit is closed, which is equal to the number of water drops applied. A control value is actuated to cease the flow when the total volume (number of drops times water volume per drop) reaches the desired water application volume. The full system was designed to increase the precision of water application by literally counting the water drops applied and only applying the number specified to be the water manager. Here, a water manager can be a person, an electronic control system, or a sensor(s) that monitors components of the agricultural system. A photo of the built prototype is shown in Figure 1.
The dimensions of the dripline connection part were 3.4 × 3 × 3 cm (L × W × H, respectively). The thread size was (½ inch * 20) with a length of 0.15 cm, the hole diameter inside the thread is 5 mm, and the drip tube diameter was 0.17 cm. These dimensions were selected to match the female threaded port of the solenoid valve (Figure 2c). This first stage of the flow path also includes a tortuous path to reduce the pressure of the flow (path width is 0.26 cm with +/−0.08 mm, Figure 3a).
The dimensions of the measurement unit were 3 × 2 × 2.5 cm (L × W × H, respectively). The thread size was (½ inch * 20) 0.12 cm long to match the outlet side of the solenoid control valve. The prototype was built to work with flow channels of two different sizes. A 0.11 cm or 0.12 cm (+/−0.08 mm) inner diameter flow channel connects the solenoid to the measurement chamber. Inside the chamber, there is a nozzle with an outside diameter of 0.3 cm or 0.35 cm (+/−0.08 mm). The final dimension of the created drops depends on this outer nozzle diameter as it is the last point of contact for the formed drops. Thus, the orifice diameters can be customized to alter the drop sizes.
A diagram of the designed electronic circuit is presented in Figure 4. The DCCDuino Nano Nano connects to the measurement unit, the STP16NF06 N MOSFET, 60 V, 16 A, GDS, and an electronic solenoid valve. The wire leads, used to count the number of drops passing through the system, were housed just downstream of the narrow orifice (Figure 3). Water drops connect these electronic leads to close the electric circuit. The DCCDuino Nano counts the water drops number (number of circuit closures) and closes the valve depending on the received irrigation instruction. The VRDI system electronics were operated with 3 V.

1.4. VRDI Emitter Cost

The prototype VRDI emitter, as built for this manuscript, is not economically viable, and efforts must still be made to reduce its cost. First, we do not envision that each emitter has its own battery, charger, solar, and telemetry solution. Rather, we envision a system where the emitters are hard-wired along a drip line. These costs are included in the ‘wire’ line item below. The total cost of the components used to build the current system was $9 for each emitter. Table 1 depicts the detailed cost of each component.
The most straightforward way to reduce the total cost is to (1) use injection molding for the plastic parts; (2) create a custom-printed circuit board for the electronics that incorporates the MOSFET; and (3) reduce the cost of the solenoid. The solenoid valve is the most expensive component and will always have a higher cost floor due to the copper content. The next stage of research and design is to miniaturize or replace the solenoid. Potential replacements include piezoelectric devices or other MEMS. Given these considerations, the estimated reduced price would be $3–4. This restricts potential applications to high-value crops that require very precise water management e.g., wine grapes.

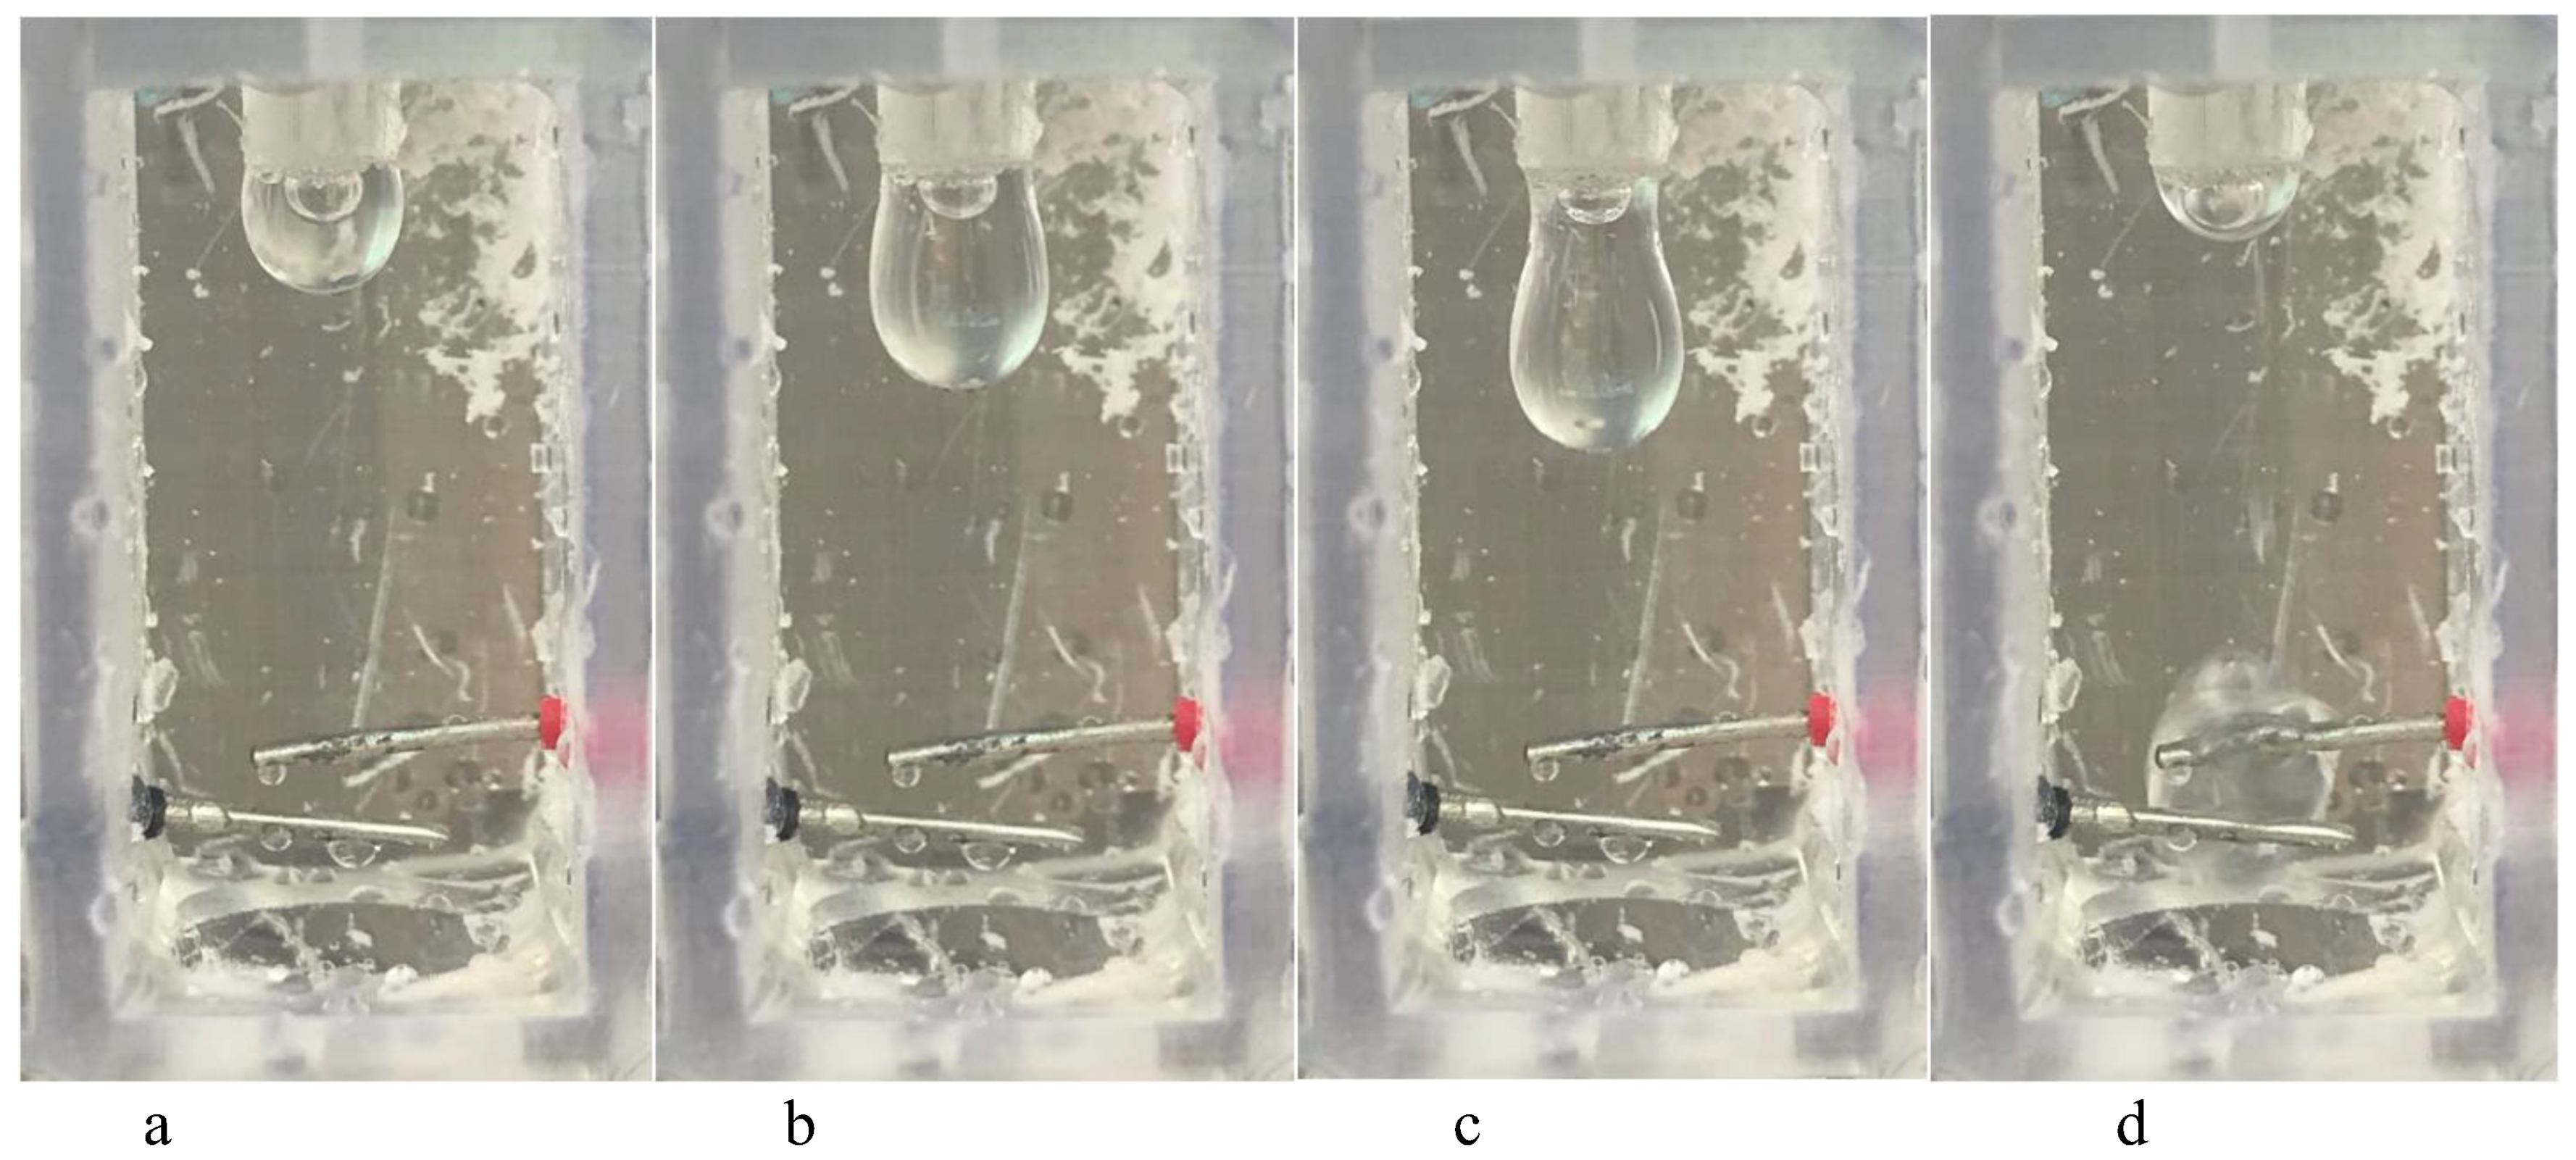
1.5. Experimental Design

A test of the VRDI prototype was performed at Oregon State University to (1) demonstrate that a drop-counting device is technically feasible and (2) determine the range of variability in water application volumes as a function of pressure. A pressure-regulated flow was provided for conventional, pressure-compensated drip lines (DIG’s Earthline Brown) and the new VRDI design. Two versions of the VRDI design were tested to determine the potential for the nozzle design to affect drop size. The test was done for two inside diameters of 0.11 cm and 0.12 cm (+/−0.08 mm) with two outside diameters of 0.3 cm and 0.35 cm (+/−0.08 mm). All drip irrigation systems were operated for 10 min, 20 min, 30 min, and 60 min. All tests were performed for a range of operating pressures: 14 kPa, 28 kPa, 41 kPa, 55 kPa, 69 kPa, and 83 kPa (Table 2). Note that the minimum working pressure of the commercial system is 69 kPa. One advantage of the VRDI emitter is that it can operate at much lower pressures and save energy; therefore, we included low-pressure values, outside the range of the commercial line to challenge the new design. The pressure was regulated with a pressure regulator (Stettler support company, Salem, OR). This regulator has an error of +/−7 kPa or (1 psi). Water exiting the VRDI units, and the convention drip line were collected in graduated cylinders to measure the total volume of water applied. These were rainfall measurement cylinders, which contain two cylinders: the first one was 31 cm high and 10 cm in diameter, and the second was 25.4 cm high and 3.1 cm in diameter. The smaller cylinder was placed inside the larger one, leaving a 0.6 cm free space to allow water to spill to the large cylinder if the smaller one was full. A time series of the progression of a drop from formation to emission is presented in Figure 4. A summary of all measurements, including the mean and standard deviation for water drops count and water volume emitters (0.3 cm and 0.35 cm) at the different times of operation with different pressures are presented in Table 2. The drip count by the system with time is presented in Figure 5. The system counted cumulative water drops with the time. The water flow or drip count was slightly affected by increasing pressures compared to the commercial drip emitter.
To better understand the relationship between the independent variables and the dependent variable (water volume), a factorial design of 3 × 4 × 6 (72 scenarios) was chosen for this data set. Three independent variables were included in the model: (1) the design type, which has 3 levels (0.30 cm VRDI emitter design, 0.35 cm VRDI emitter design, and the conventional design); (2) four levels of time (10 min, 20 min, 30 min, and 60 min); and (3) six levels of pressure (14 kPa, 28 kPa, 41 kPa, 55 kPa, 69 kPa, and 83 kPa). Data were analyzed in the R software package. All tests were performed at a 95% confidence level. Three-way ANOVA was performed on the water volume to determine whether the average volume differed among the variables [16].

2. Result and Discussion

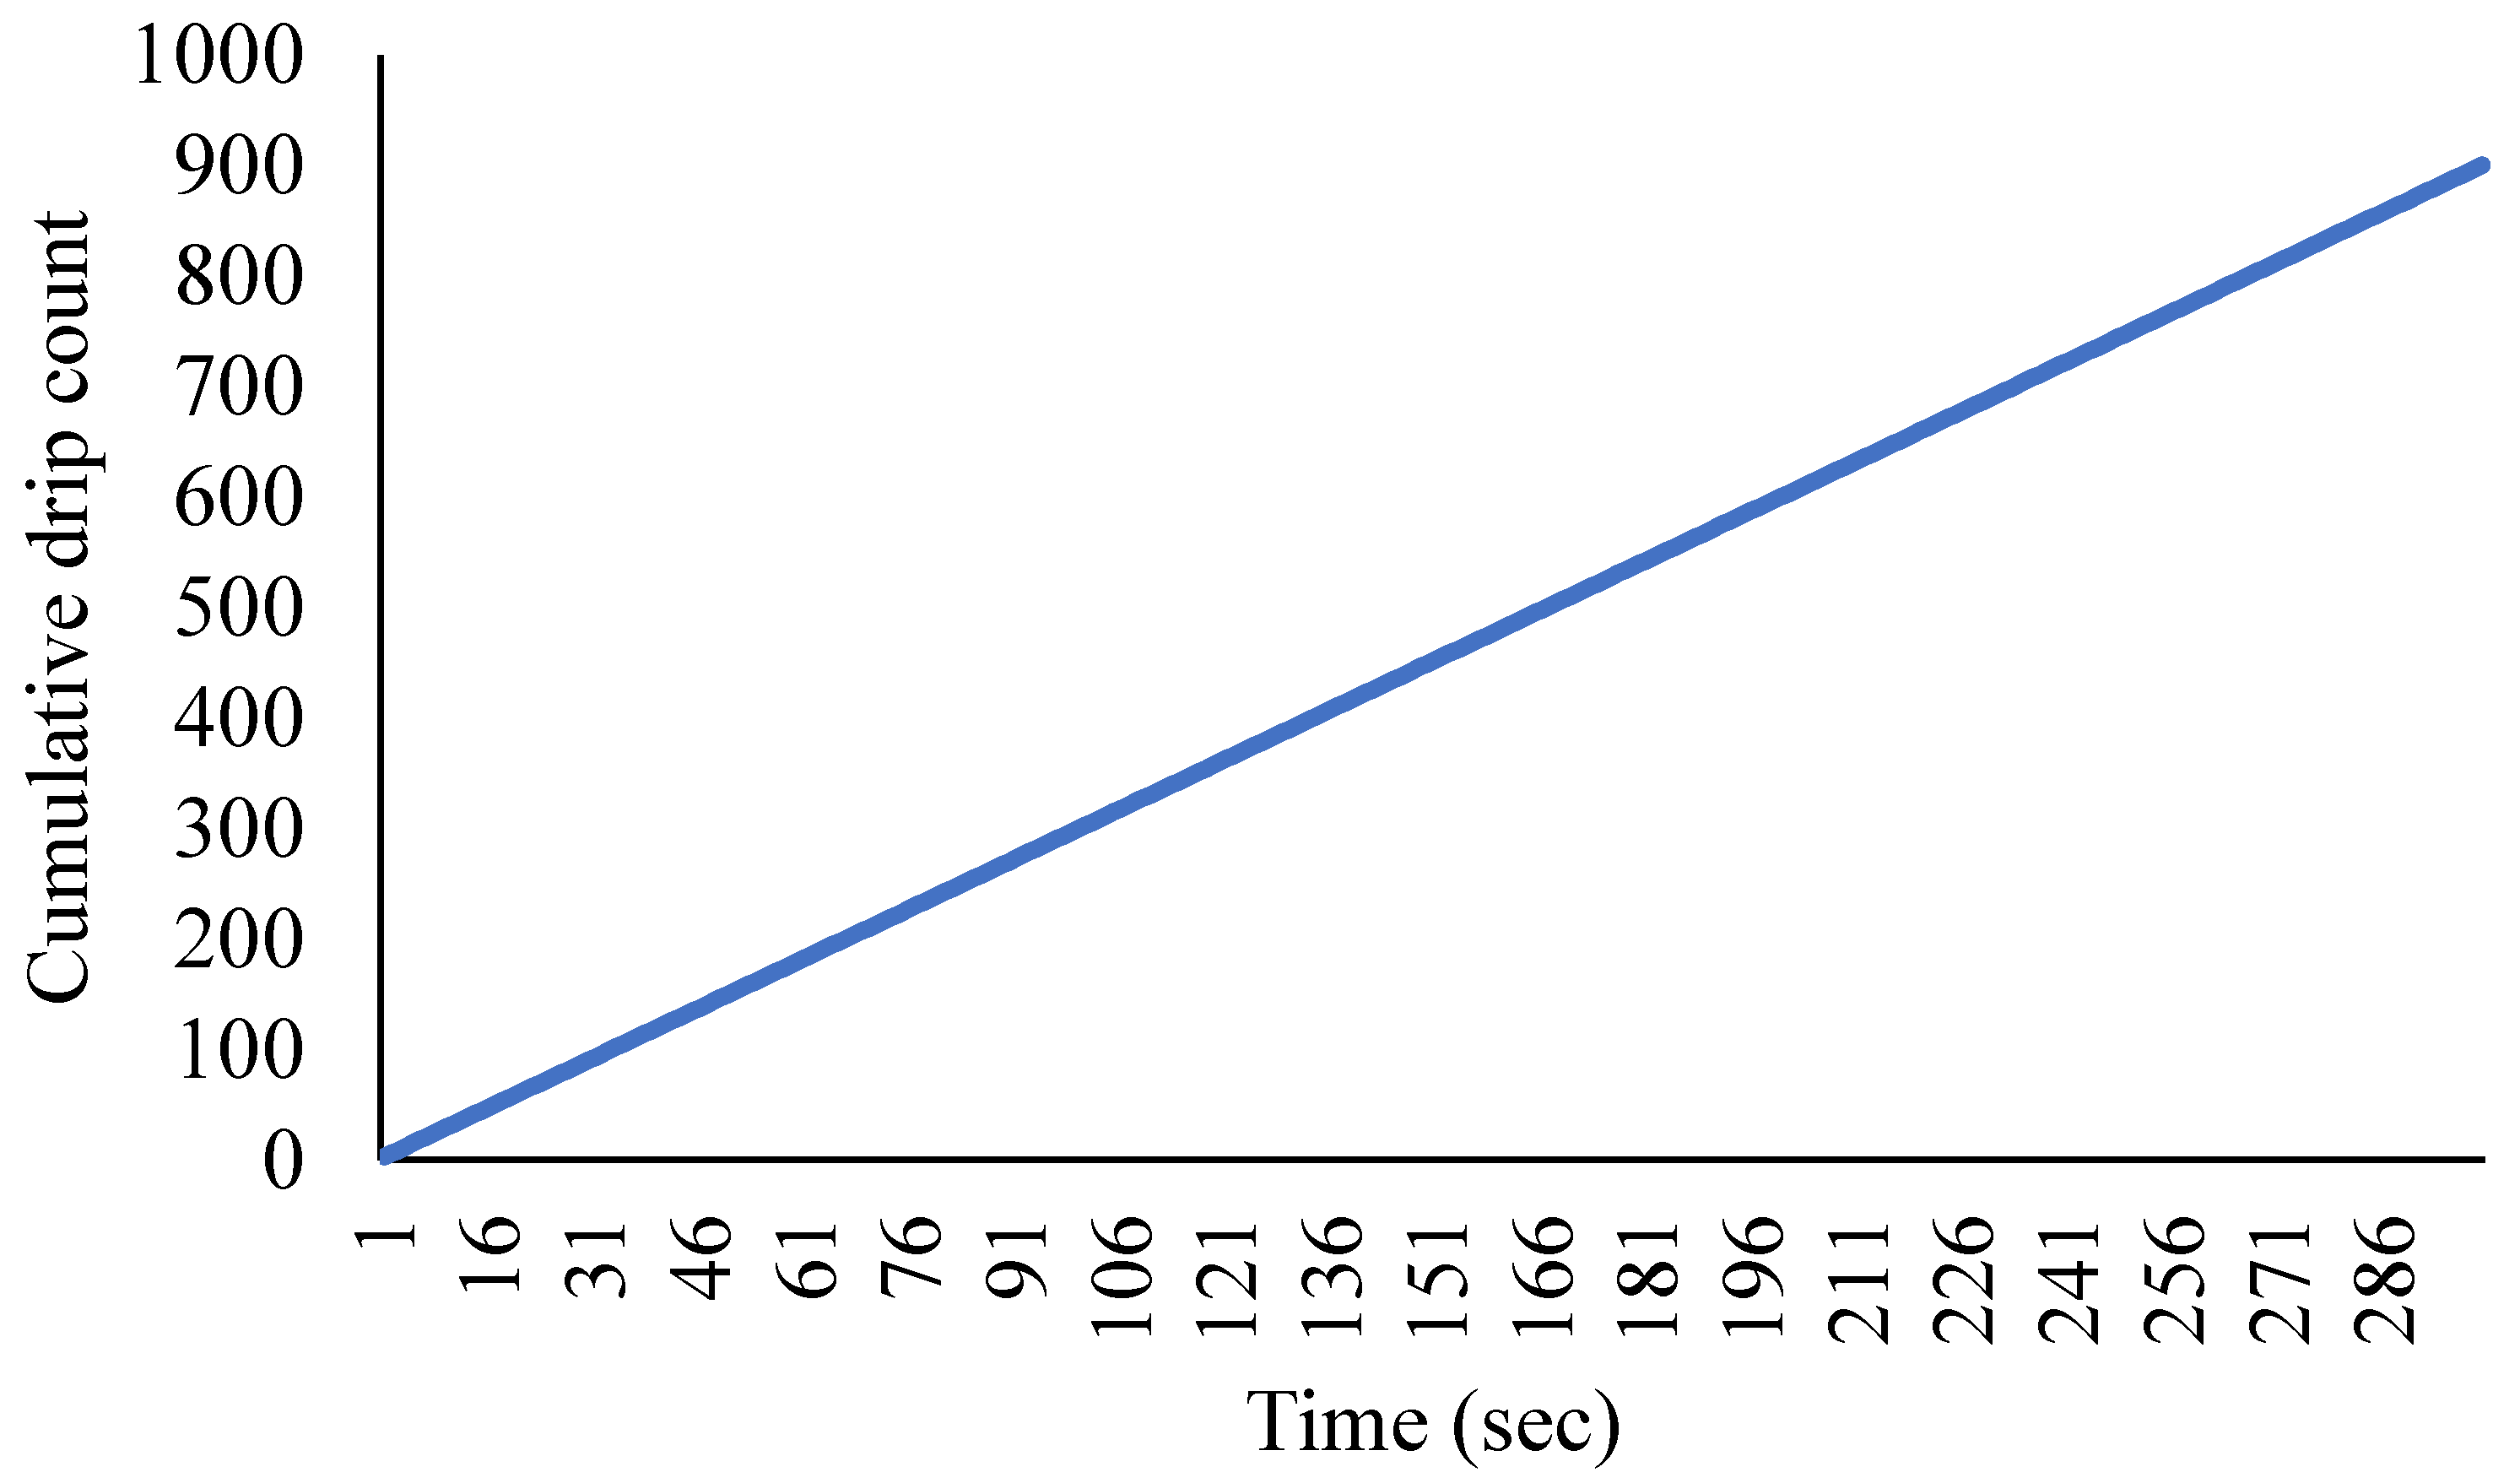
2.1. Flow Rate Measurements

The volumetric flow rates from each emitter as a function of operating pressure were also calculated. A flow rate comparison is chosen, as typical irrigation practice is to operate the drip system for a set amount of time, and thus, the total applied water would be the flow rate multiplied by the operational time. If the flow rate was not constant through the entire line, then the application uniformity would be impacted. These variations in flow rate may be caused by pressure variations within the line due to head losses or elevation changes.
The results show that both the new VRDI design and the conventional pressure compensated drip line have flow rates that depend on operational pressure in this pressure range. The VRDI design has lower flow rates (significant difference p-value < 0.05), but these rates are not impacted by the changes in inner (0.11 cm and 0.12 cm) or outer (0.3 cm and 0.35 cm) nozzle diameter (p-value > 0.05). The lower flow rate in the VRDI is intentional. It removes the possibility of a solid stream exiting the nozzle.

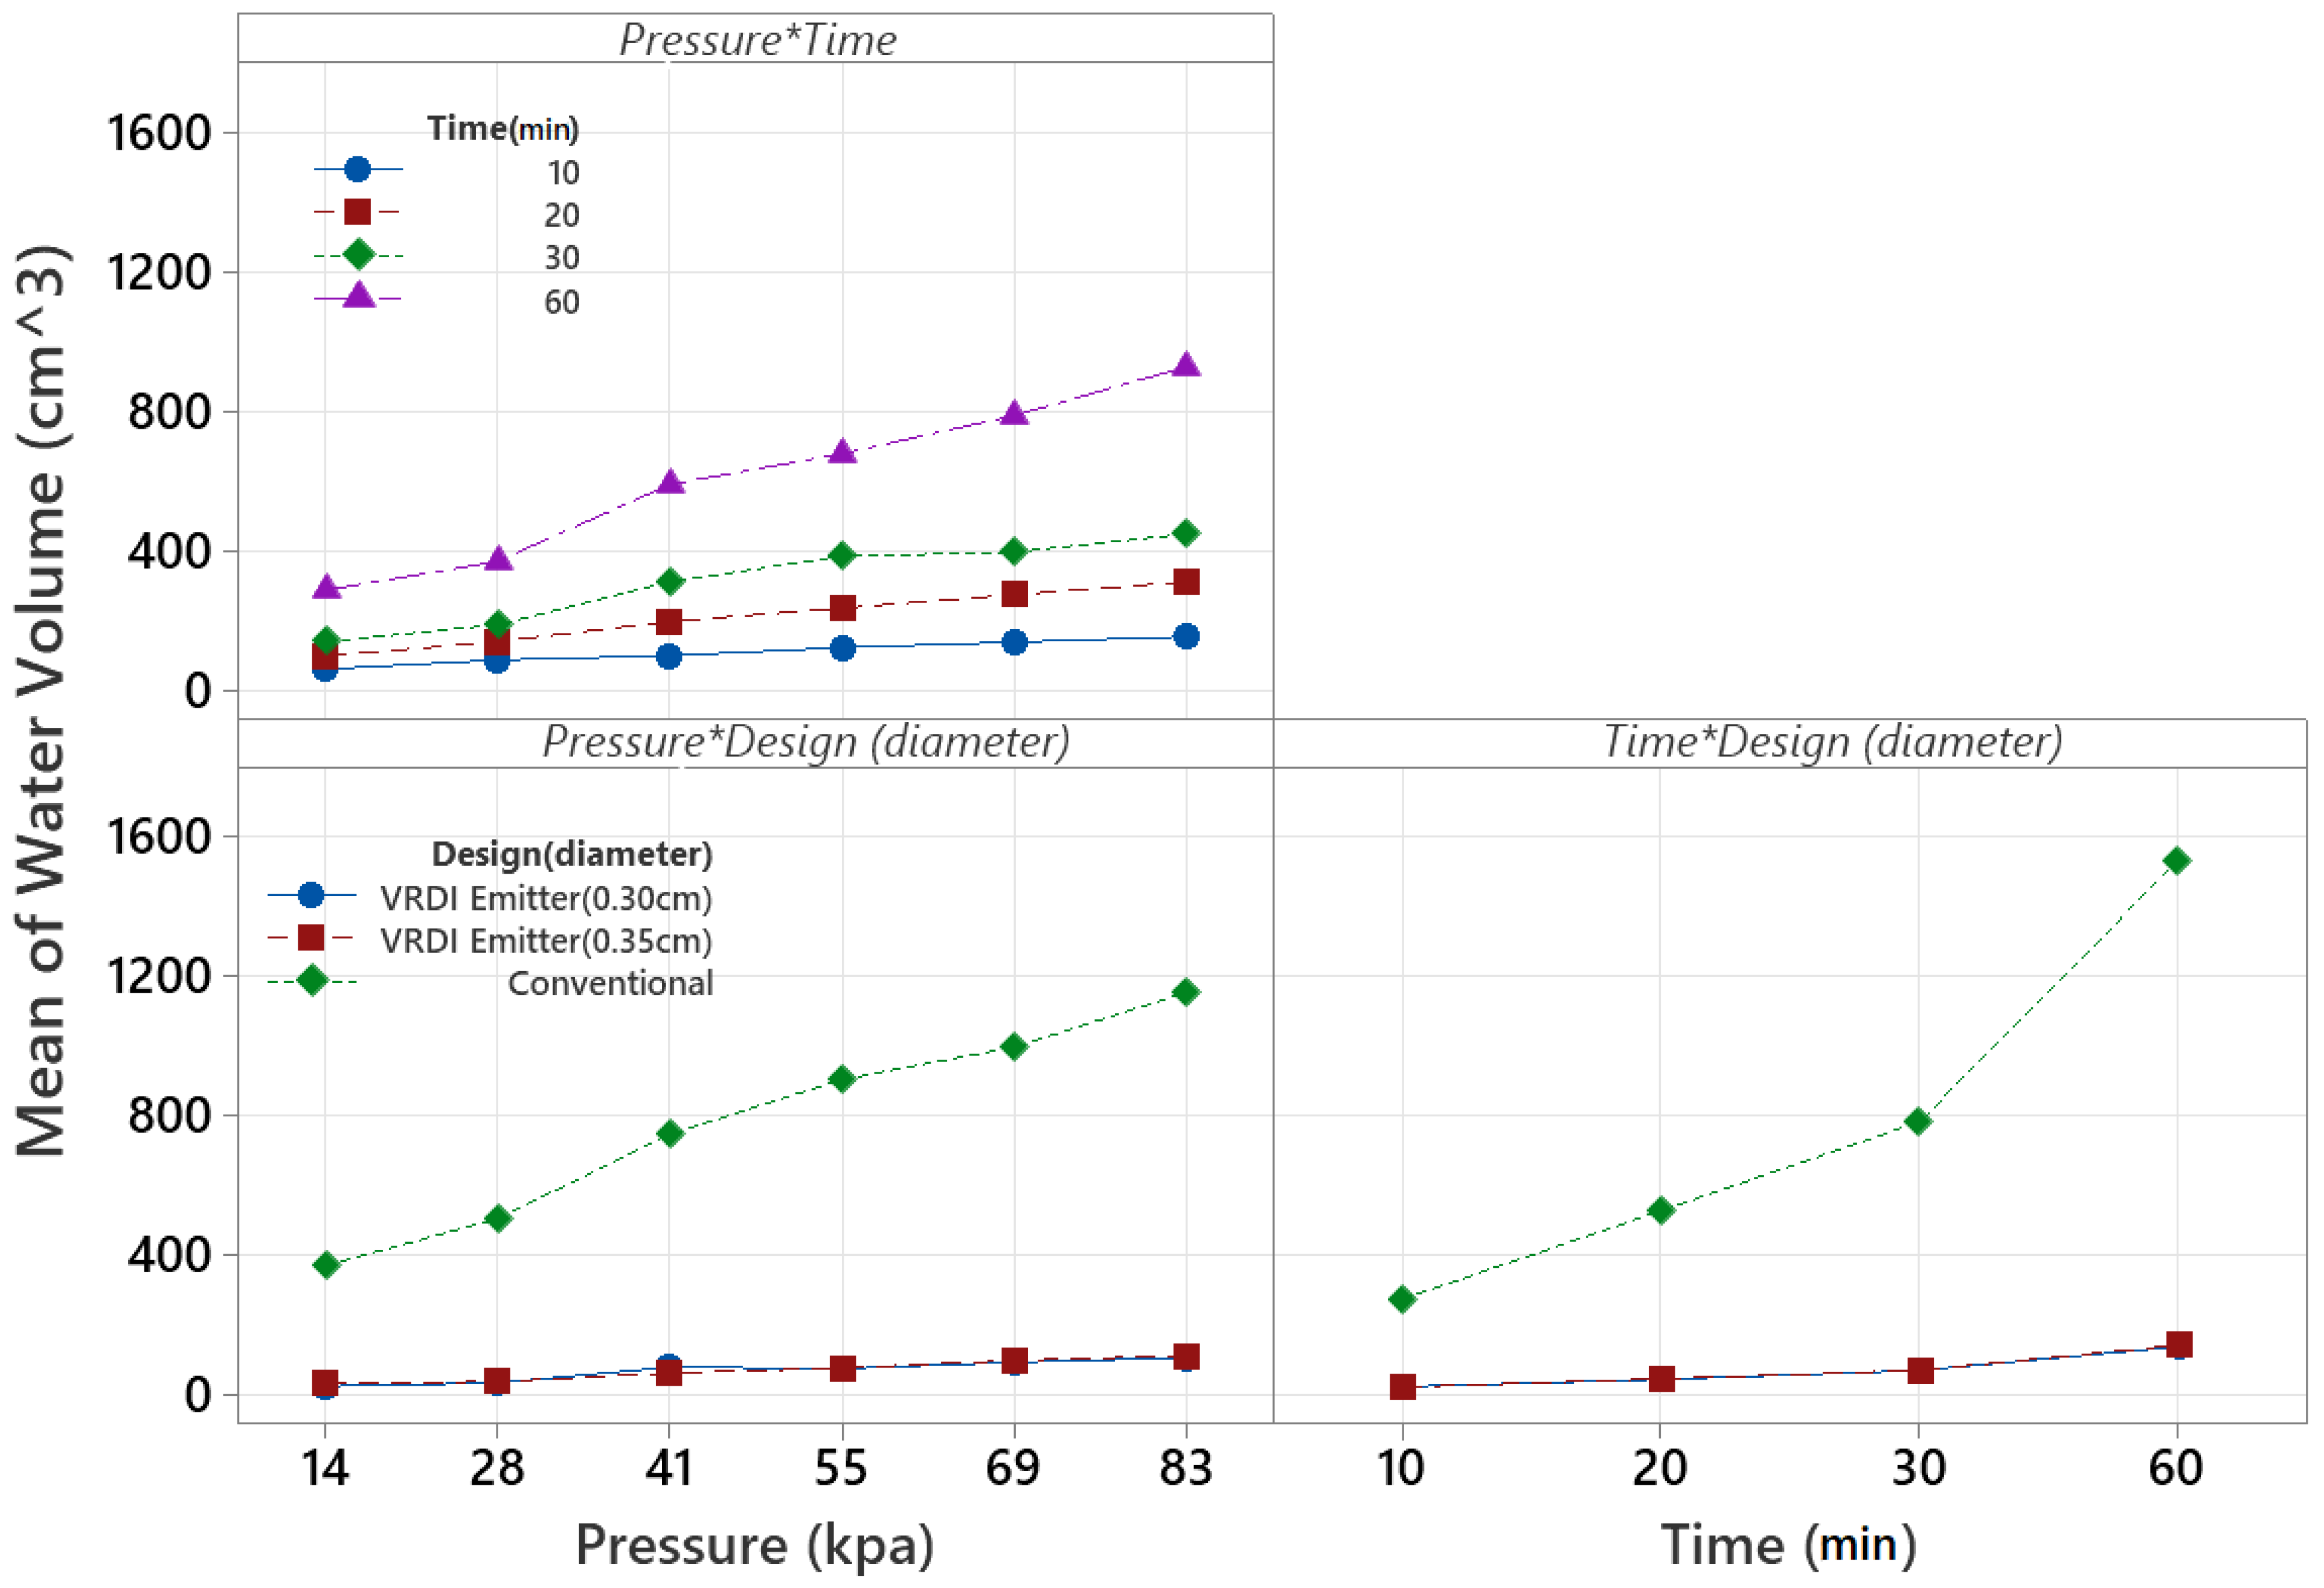
2.2. Total Volume Applied

The volume of water per drop in the VRDI emitter, which is calculated as the total volume of emitted water divided by the measured drop count, is plotted as a function of operational pressure in Figure 6. It shows that the drop diameter is not significantly affected by the operational pressure.
Since the drop volume is not affected by the operational pressure, and on the other hand, the flow rate is significantly affected by the operational pressure (Figure 6), it can be concluded that the number of drops per minute increases as a function of operational pressure. Thus, variations in pressure within the drip line will not impact the total water volume applied, which is dictated by the number of drops allowed by the controller. However, the variance in the water drop volume itself potentially leads to a proportional variability in the total volume of applied water.
A force balance illustrates the pressure-drop size relationship. Just prior to release, the forces acting on the drop are the surface tension force, weight, and pressure force expressed mathematically as:
V = π γ ( σ D o P D i 2 4 )
where D o is the drop diameter, D i is the inner nozzle diameter, V is the drop volume, σ is the surface tension, and γ is the specific weight. The available head at the nozzle outlet is ( Q π r 1 2 ) 2 / 2 g , where v is the fluid velocity at the nozzle’s outlet, g is the acceleration of gravity, Q is the discharge, and r i is the inner radius of the nozzle. Application of Brenoulli’s principle from the nozzle’s outlet to the drop center reveals that the total change in the piezometric head is equivalent to the velocity head at the outlet. Converting this to pressure units leads to:
P γ ( Q π r 1 2 ) 2 2 g 1.8   Pa .
This leads to a value of P D i 2 4 4 10 6   N , and σ D o 2 10 4   N . For the range of pressures tested, P D i 2 / 4 is two orders of magnitude less than σ D o ; therefore, we neglect the pressure term in Equation (1).
We would expect the ratio of drop diameters (0.86 ± 0.03) and the ratio of measured volumes (0.94 ± 0.08) to be equivalent based on the simple hydraulic analysis above.

3. Statistical Analysis

As previously noted, a three-way ANOVA was used to estimate the relationship between the independent variables and the water volume. The results of the model are shown in Table 3. The ANOVA results showed that all independent variables and their two-way and three-way interactions were statistically significant (<0.001).
The interaction terms between the independent variables were also investigated. In the case of statistically significant effects, custom post hoc contrasts were performed for multiple comparisons using Tukey’s HSD test [17]. Figure 6 plots the mean of water volume (cm3) at each level of design, pressure, and time, as well as pairwise comparisons. Regardless of the time, during the testing, the water volume for the VRDI design was lower at all pressure levels when compared to the conventional design. Similarly, when the pressure is held constant, the water volume was lower for the VRDI design when compared to the conventional one for all periods.
The variable rate drip irrigation approach can provide value to growers by reducing the yield variability within a plot by bolstering the production of underperforming areas. Growers could also potentially save on electricity costs due to the lower pressures required. The potential economic benefits associated with reduced yield variability in wine grapes were shown by [18,19] to be $2100/ha. The same authors report a water savings of 10%. Energy savings by the reduced pressure can be estimated as: p V t o t Δ P where p is the price of electricity, V t o t is the total annual applied volume per hectare, and Δ P is the change in pressure. Taking respective quantities of $0.13 kWh, 7000 m3/ha, and 69 kPa leads to an estimated energy savings of approximately $18/ha. Other factors not considered (e.g., changes in quality, fertilizer, and other chemical applications) may also contribute to savings.
There are additional factors that have not yet been considered such as the impacts of water quality: the addition of fertilizer, salinity, and turbidity. These water quality considerations can impact the emitter’s output in two important ways: (1) chemical additions to the water can change the surface tension, which would impact the expected drip volume, as anticipated in Equation (1); and (2) some chemicals can corrode or precipitate onto the sensor’s wire leads and have the potential to impact the fidelity of measurements and the potential lifetime of the sensor. The second concern can be addressed with gold plating or other wire armoring solutions (at added costs). The first concern is more problematic and requires an extensive, factorial, experiment, which will be presented in the next publication.

4. Conclusions

The new VRDI emitter prototype was designed, built, and tested. The results demonstrated that using the proposed emitter, VRDI, is technically feasible. The proposed method for the control of drip irrigation at the emitter level is based on drop counting rather than flow rate monitoring. The tests revealed that the new VRDI emitter had flow rates that increased as the operating pressure increased. It was shown that the size of the drops from the VRDI emitter was not a function of pressure. Nevertheless, significant differences in the water volume per drop were found between designs that had outside diameters of 0.35 cm and 0.3 cm. This indicates that the outside diameter of the nozzle might provide a method to manipulate the drop size in a wider range. The electronic components used to control the VRDI prototype emitter presented here are readily compatible with off-the-shelf data telemetry solutions. Each emitter could be controlled remotely and could send data back to a centralized data repository or decision-maker. A number of such emitters could be used to enable field-scale VRDI.
The final device will be designed to tolerate field conditions. The electronics will be integrated within the nozzle’s body and made water-tight. Wire leads will be embedded in the plastic to reduce the chance of their misalignment in the case of impact with equipment. The material choices should be altered to a more impact-resistant plastic such as HDPE. HDPE is also inert in the presence of acid, fertilizers, herbicides, and pesticides, which is a significant advantage. It is expected that any clogging due to biofouling would be maintained with a diluted acid solution as is standard practice. The overall size of a commercially produced device would be less than 0.5 m long and less than 0.2 m in diameter. Another limitation is that the placement of the electric leads used to measure falling drops are directly below the emission nozzle. This necessitates that the crops where the proposed VRDI is applied have suspended drip lines (e.g., grapes or cane berries).

Author Contributions

Conceptualization, C.H. and H.A.A.-a.; methodology, H.A.A.-a. and H.J.; software, H.A.A.-a.; validation, H.A.A.-a.; formal analysis, C.H., H.A.A.-a. and H.J.; investigation, H.A.A.-a. and H.J.; resources, C.H.; data curation, H.A.A.-a.; writing and original draft preparation, H.A.A.-a., H.J. and C.H.; writing, review and editing, H.A.A.-a., H.J., C.H. and L.N.; visualization, C.H. and H.A.A.-a.; supervision, C.H. and L.N.; project administration, C.H.; funding acquisition, C.H.; All authors have read and agreed to the published version of the manuscript.

Funding

This research was funded by US National Science Foundation NSF-GEO 1740082 and NSF- GEO 1712532.

Institutional Review Board Statement

Not applicable.

Informed Consent Statement

Not applicable.

Data Availability Statement

Data attached.

Acknowledgments

The work was supported by Al-Qasim Green University, and the Ministry of Higher Education and Scientific Research in Iraq through a government scholarship, and the Oregon Department of Agriculture SCBG award ODA-4190-GR. The authors would like to thank Kyle Proctor for reviewing the paper and Greyston Brady, Pre-Elect and Computer Engineer; Luke Goertzen and Bao Nguyen, coding developer at Opens Lab, BEE for assistance on code development, sensor assembly, and 3D printing at Oregon State University for their help during the laboratory tests.

Conflicts of Interest

The authors declare no conflict of interest.

References

  1. Tindula, G.N.; Orang, M.N.; Snyder, R.L. Survey of irrigation methods in California in 2010. J. Irrig. Drain. Eng. 2013, 139, 233–238. [Google Scholar] [CrossRef]
  2. van der Kooij, S.; Zwarteveen, M.; Boesveld, H.; Kuper, M. The efficiency of drip irrigation unpacked. Agric. Water Manag. 2013, 123, 103–110. [Google Scholar] [CrossRef]
  3. Chitra, R.; Havaraddi, R.M.; Subramanian, S.; Suresh, J. Effect of scheduling of drip irrigation on growth, yield and water use efficiency of turmeric (Curcuma longa L.) var. CO2. J. Spices Aromat. Crop. 2017, 26, 8–15. [Google Scholar] [CrossRef]
  4. Ayars, J.E.; Fulton, A.; Taylor, B. Subsurface drip irrigation in California—Here to stay? Agric. Water Manag. 2015, 157, 39–47. [Google Scholar] [CrossRef]
  5. Al-Agele, H.A.; Nackley, L.; Higgins, C.W. A pathway for sustainable agriculture. Sustainability 2021, 13, 4328. [Google Scholar] [CrossRef]
  6. Al-agele, H.A.; Mahapatra, D.M.; Prestwich, C.; Higgins, C.W. Dynamic Adjustment of Center Pivot Nozzle Height: An Evaluation of Center Pivot Water Application Pattern and the Coefficient of Uniformity. Appl. Eng. Agric. 2020, 36, 647–656. [Google Scholar] [CrossRef]
  7. Chapin, R.D. Drip Irrigation System. Google Patents (US4626130A*), 2 December 1986. [Google Scholar]
  8. Perry, C.; Dukes, M.; Harrison, K. Effects of variable-rate sprinkler cycling on irrigation uniformity. In Proceedings of the 2004 ASAE Annual Meeting, Ottawa, ON, Canada, 1–4 August 2004. [Google Scholar]
  9. Higgins, C.W.; Kelley, J.; Barr, C.; Hillyer, C. Determining the minimum management scale of a commercial variable-rate irrigation system. Trans. ASABE 2016, 59, 1671–1680. [Google Scholar]
  10. Rodriguez, S.A.B.; Hamann, H.F.; Klein, L.; Schappert, M.A. Segmented variable rate drip irrigation. Google Patents (US20160165817A1), 30 January 2018. [Google Scholar]
  11. Sanchez, L.A.; Sams, B.; Alsina, M.M.; Hinds, N.; Klein, L.J.; Dokoozlian, N. Improving vineyard water use efficiency and yield with variable rate irrigation in California. Adv. Anim. Biosci. 2017, 8, 574–577. [Google Scholar] [CrossRef]
  12. Shilpa, A. Smart Drip Irrigation System. Int. J. Trend Sci. Res. Dev. 2018, 2, 1560–1565. [Google Scholar]
  13. McCauley, D.M.; Nackley, L.L.; Kelley, J. Demonstration of a low-cost and open-source platform for on-farm monitoring and decision support. Comput. Electron. Agric. 2021, 187, 106284. [Google Scholar] [CrossRef]
  14. Parameswaran, G.; Sivaprasath, K. Arduino based smart drip irrigation system using Internet of Things. Int. J. Eng. Sci. 2016, 5518. [Google Scholar] [CrossRef]
  15. Al-agele, H.A.A.; Nackley, L.; Higgins, C. Testing Novel New Drip Emitter with Variable Diameters for a Variable Rate Drip Irrigation. Agriculture 2021, 11, 87. [Google Scholar] [CrossRef]
  16. Horne, D.; Jashami, H.; Hurwitz, D.S. Evaluation of low noise transverse rumble strips in proximity to a stop controlled intersection. Transp. Eng. 2020, 2, 100032. [Google Scholar] [CrossRef]
  17. Jashami, H.; Hurwitz, D.S.; Monsere, C.; Kothuri, S. Evaluation of driver comprehension and visual attention of the flashing yellow arrow display for permissive right turns. Transp. Res. Rec. 2019, 2673, 397–407. [Google Scholar] [CrossRef]
  18. Copeland, P. Managing Vineyard Variability with Variable Rate Irrigation: A Proof-of-Concept Prototype for Perennial Crops. Brent Sams E.&J. Gallo Winery Viticulture IBM. 2015. Available online: https://slideplayer.com/slide/11289977/ (accessed on 15 November 2021).
  19. Siebert, S.; Kummu, M.; Porkka, M.; Döll, P.; Ramankutty, N.; Scanlon, B.R. A global data set of the extent of irrigated land from 1900 to 2005. Hydrol. Earth Syst. Sci. 2015, 19, 1521–1545. [Google Scholar] [CrossRef] [Green Version]
Figure 1. VRDI emitter design connected with drip tube. A small waterproof box attached to the back (not shown) protects the electronic components (Figure 2a,b) from weather conditions.
Agronomy 11 02493 g001
Figure 2. Electronic components: (a) DCCDuino Nano Nano, (b) 16NF06 N MOSFET, (c) Solenoid electronic valve.
Agronomy 11 02493 g002
Figure 3. New VRDI emitter design: (a) Tortuous path, (b) Water inlet, (c) Water outlet, (d) Water drops counting unit.
Agronomy 11 02493 g003
Figure 4. Drop formation and measurement include (a) drop creation, (b) the drop becoming larger, (c) the drop before detachment, and (d) the drop touching the metal leads, closing the circuit, and being counted. The outer diameter of the upper nozzle is 0.35 cm for scale.
Agronomy 11 02493 g004
Figure 5. Arduino program shows cumulative drip count with time series.
Agronomy 11 02493 g005
Figure 6. Relationship between drop volume and pressure with new VRDI emitter design (0.30 and 0.35 cm) at different time intervals.
Agronomy 11 02493 g006
Table 1. Break down of the cost of individual components used to construct the prototype.
ComponentsCost ($)SourceOther Technical Details
Microcontroller, DCCDuino Nano$2Arduino Manufacturer3V
Voltage amplifier (or regulator), STP16NF06 N MOSFET$1Newark An Avnet Company60V, 16A, GDS
Control valve with solenoid$3DC12V G 1/4″ Electric Solenoid Valve N/C Feed for RO Water Air Q HongQin Water purification Equipment FactoryDC12V G 1/4″ Electric Solenoid Valve N/C Feed for RO Water Air Quick Connector
3D printing$1
Wire$2
TOTAL$9
Table 2. The descriptive statistics of the experimental setup.
Design (Diameter)Time (Min)Water
Volume (cm3)
Pressure (kPa)
142841556983
VRDI Emitter
(0.30 cm)
10Mean14.3421.1328.6831.7033.2138.12
SD0.381.512.261.511.510.38
20Mean18.1124.1555.8555.1064.1673.97
SD1.511.512.261.512.264.53
30Mean22.6436.98100.3880.7695.86110.20
SD0.381.512.263.021.510.75
60Mean61.8972.46150.95150.95197.75220.39
SD1.511.517.557.551.511.51
VRDI Emitter
(0.35 cm)
10Mean16.6013.5923.7828.6833.9642.27
SD1.511.510.382.262.262.26
20Mean25.1629.4446.0453.5968.6878.50
SD1.573.770.751.511.512.26
30Mean36.2342.2766.4283.40101.14120.01
SD2.262.262.260.382.260.75
60Mean69.4485.29130.57160.01207.56226.43
SD1.512.262.261.512.267.55
Conventional10Mean151.71225.68245.30306.44347.19380.40
SD0.753.021.512.267.553.02
20Mean250.58364.18490.60599.29689.86781.94
SD1.511.133.773.023.022.26
30Mean358.51484.18766.84988.75993.271114.54
SD3.771.132.267.554.534.61
60Mean730.62952.521491.421725.401960.892339.40
SD1.511.514.534.536.040.38
Table 3. Summary of ANOVA for the experiment.
Source of VariancedfMSFP
Design (0.30 cm VRDI, 0.35 cm VRDI, and Conventional)218,5642014.54<0.001 *
Pressure (14, 28, 41, 55, 69, 83)5226.3024.56<0.001 *
Time (10, 20, 30, 60) min31455.40157.94<0.001 *
Design × Pressure105715.70620.26<0.001 *
Design × Time653,204.405773.67<0.001 *
Pressure × Time151788194.03<0.001 *
Design × Pressure × Time3042,034.704561.55<0.001 *
Error1449.20
Notice: * Significant.
Publisher’s Note: MDPI stays neutral with regard to jurisdictional claims in published maps and institutional affiliations.

