Changes in Agronomic and Physiological Traits of Sugarcane Grown with Saline Irrigation Water


Abstract
1. Introduction
2. Materials and Methods
2.1. Growth Conditions
2.2. Saline Irrigation Water Treatment
2.3. Photosynthesis Measurement
2.4. Plant Sampling
2.5. Juice Analysis
2.6. Leaf Analysis
2.7. Statistical Analysis
3. Results
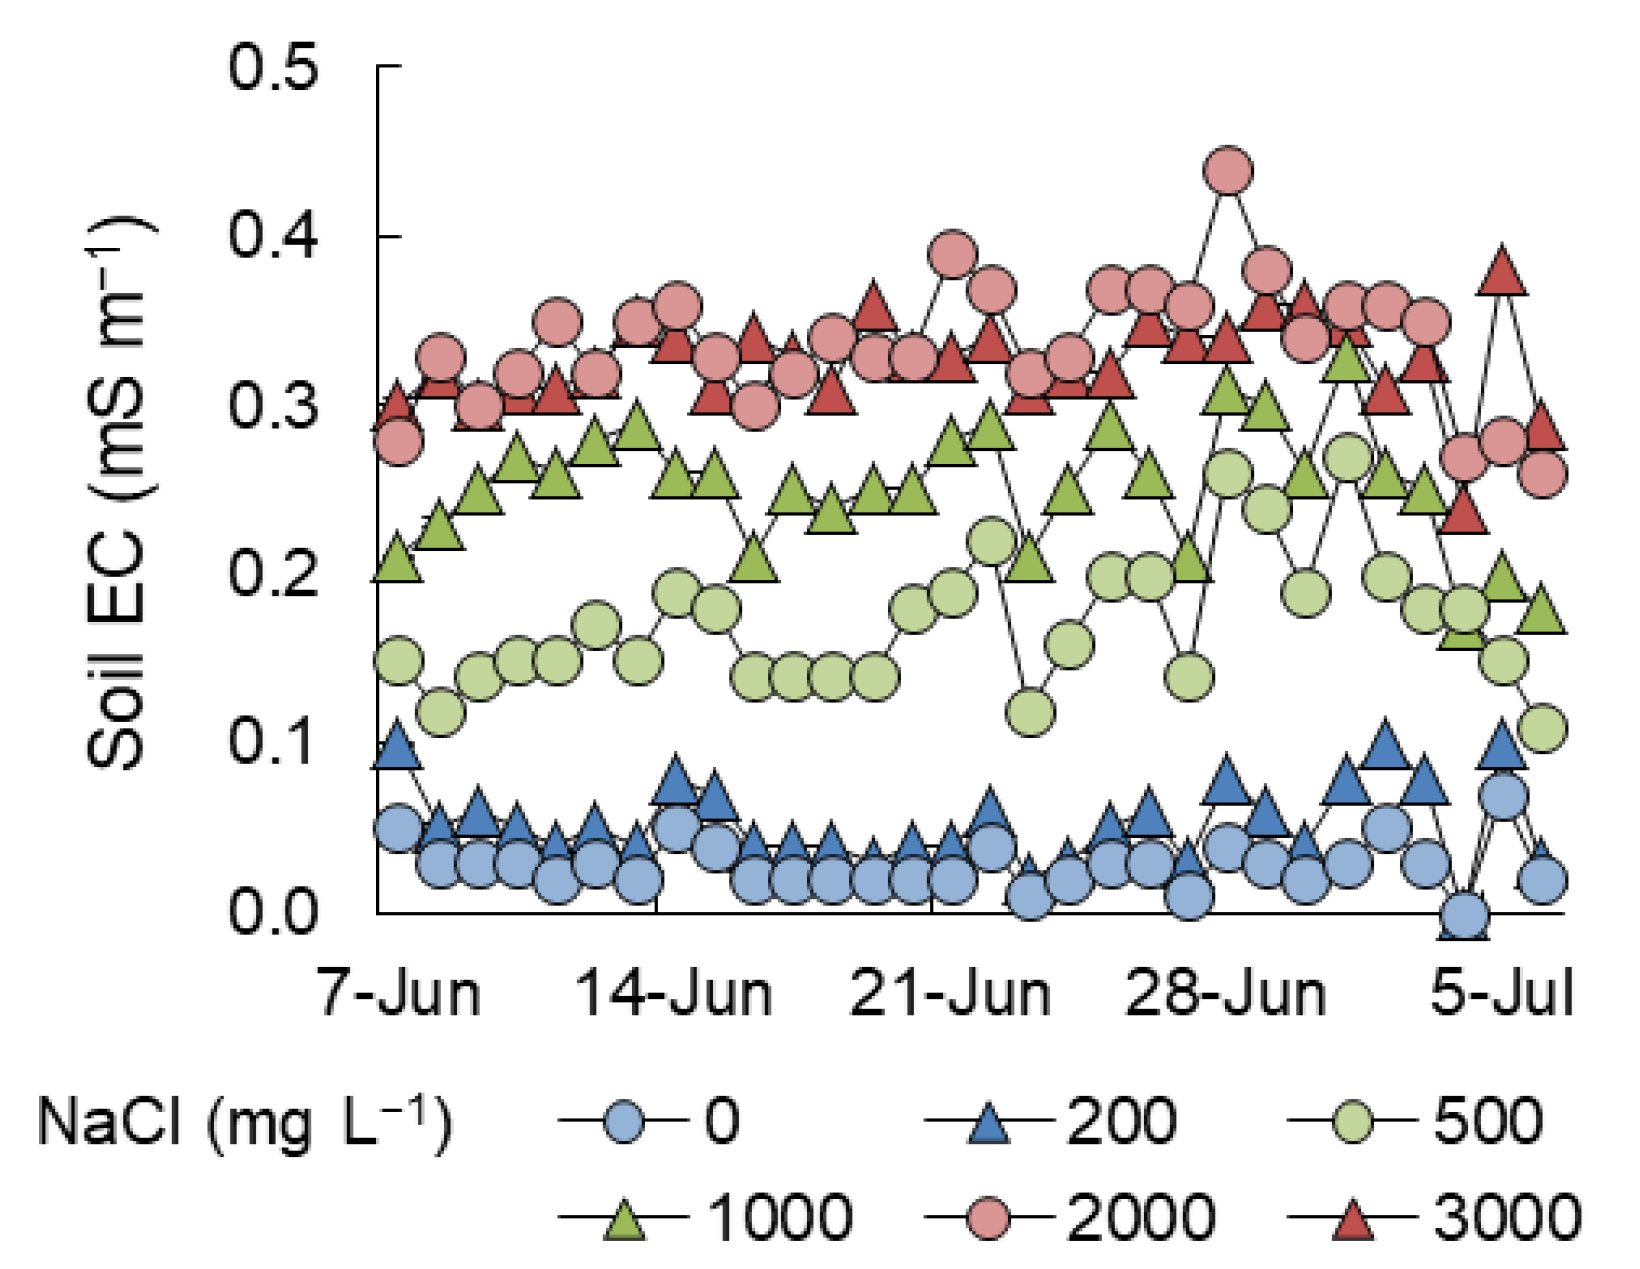
3.1. Soil EC
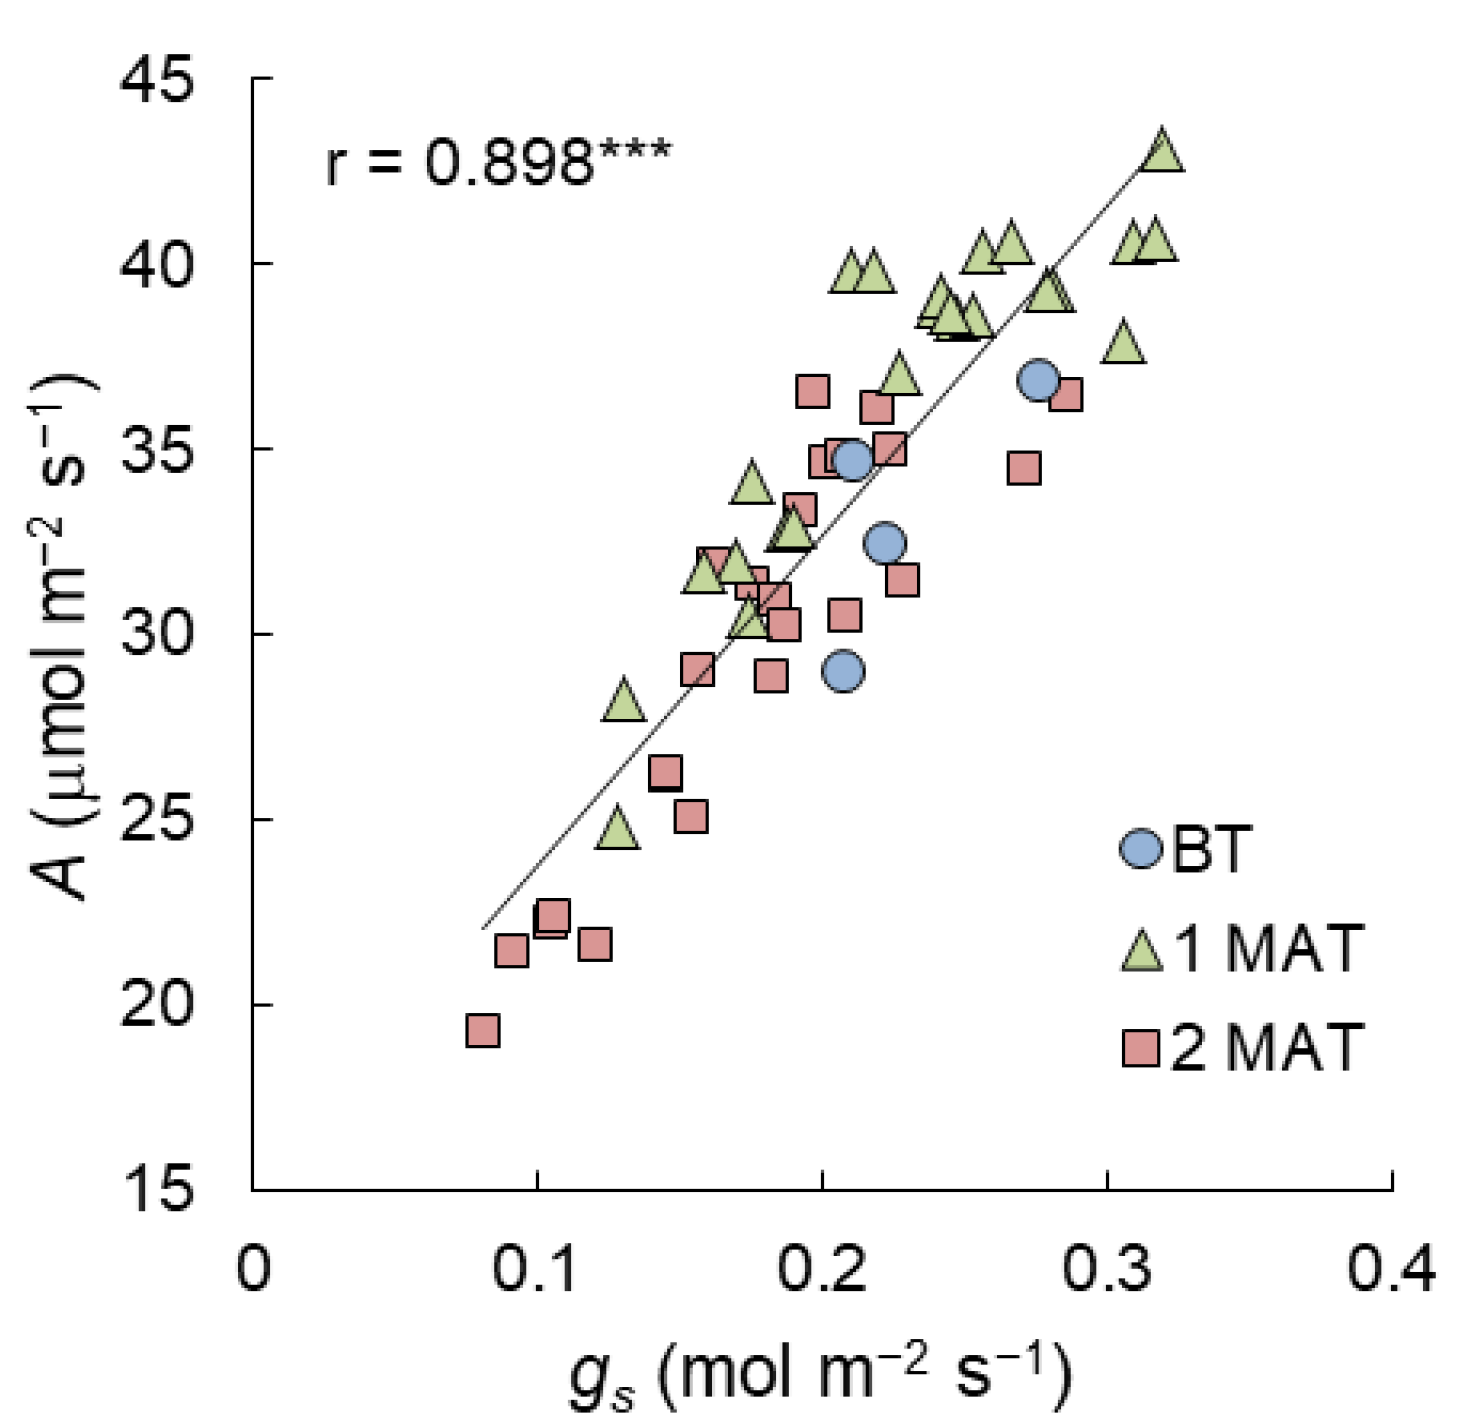
3.2. Photosynthesis
3.3. Growth
3.4. Juice Sugar and Ion Compositions
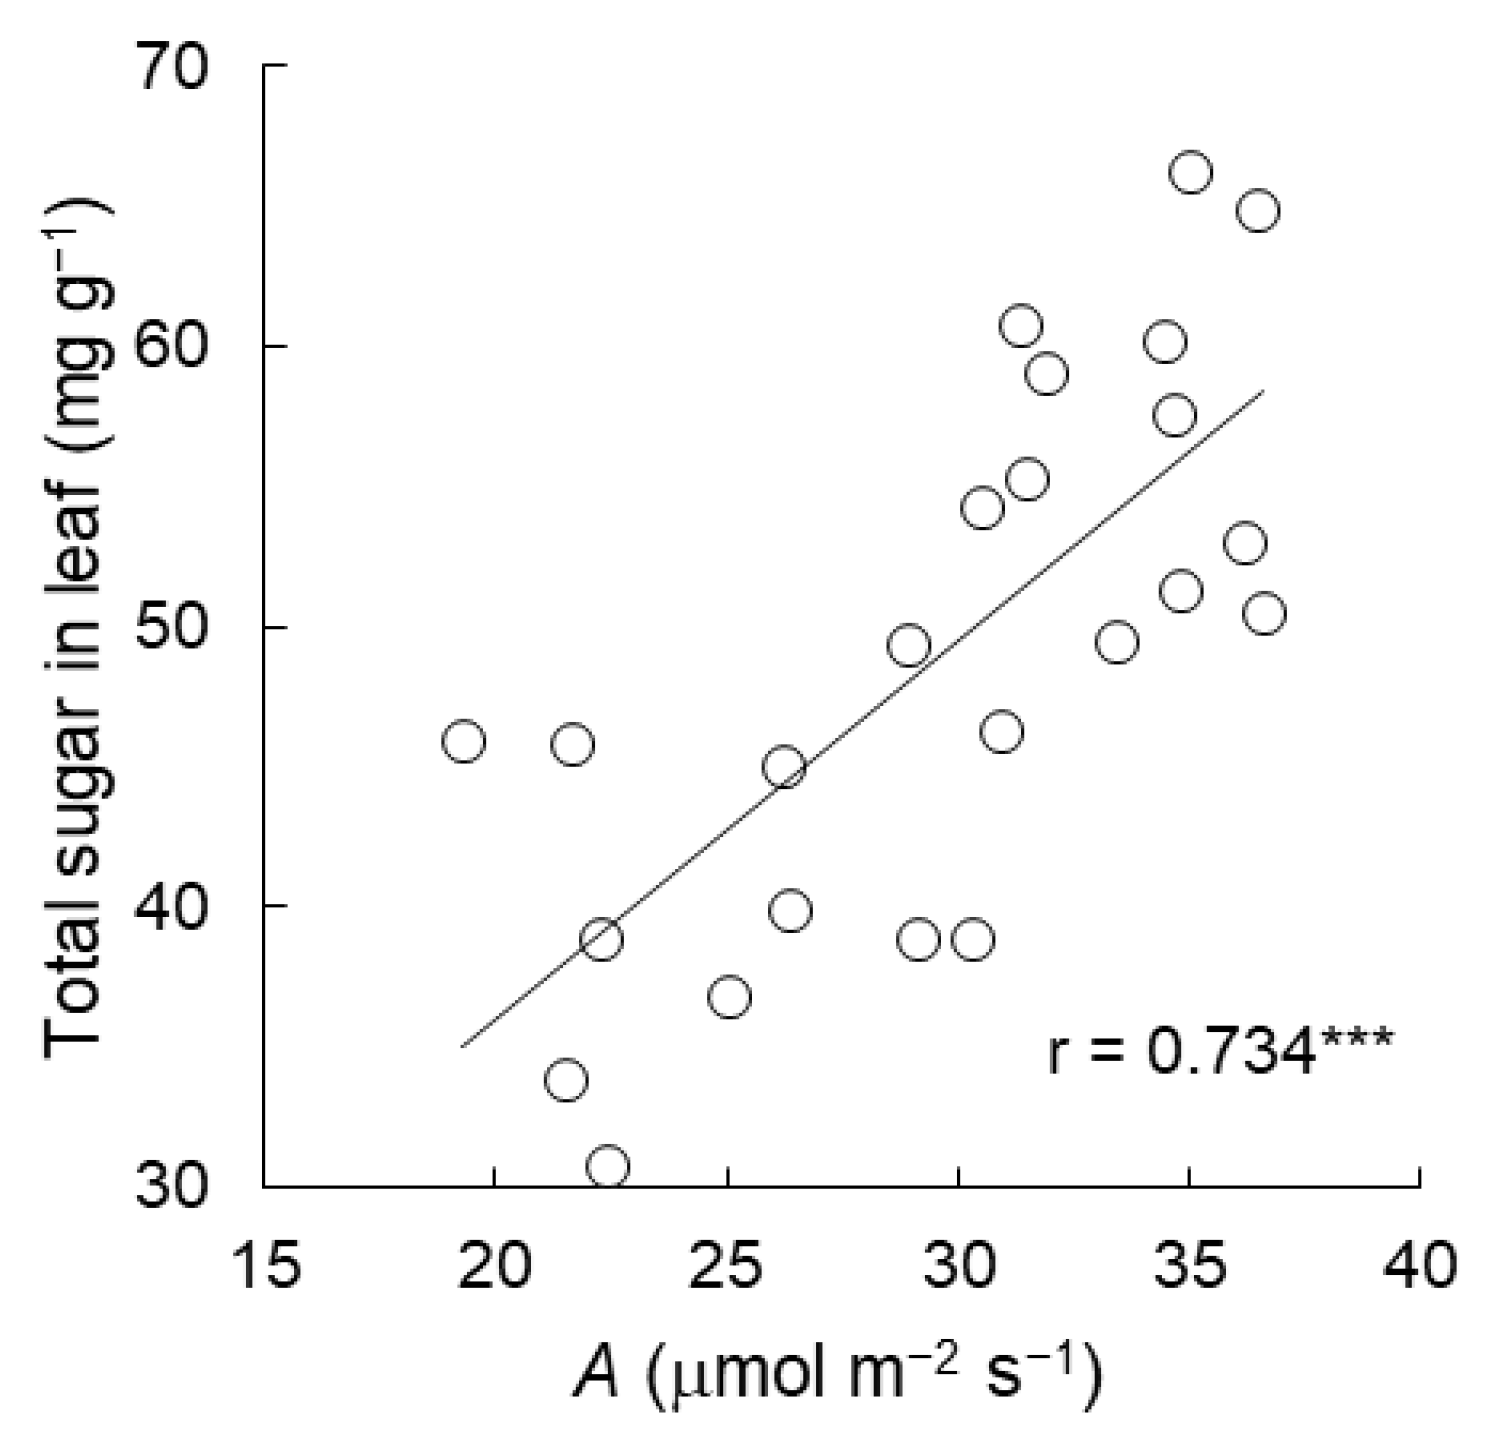
3.5. Leaf Sugar and Ion Compositions
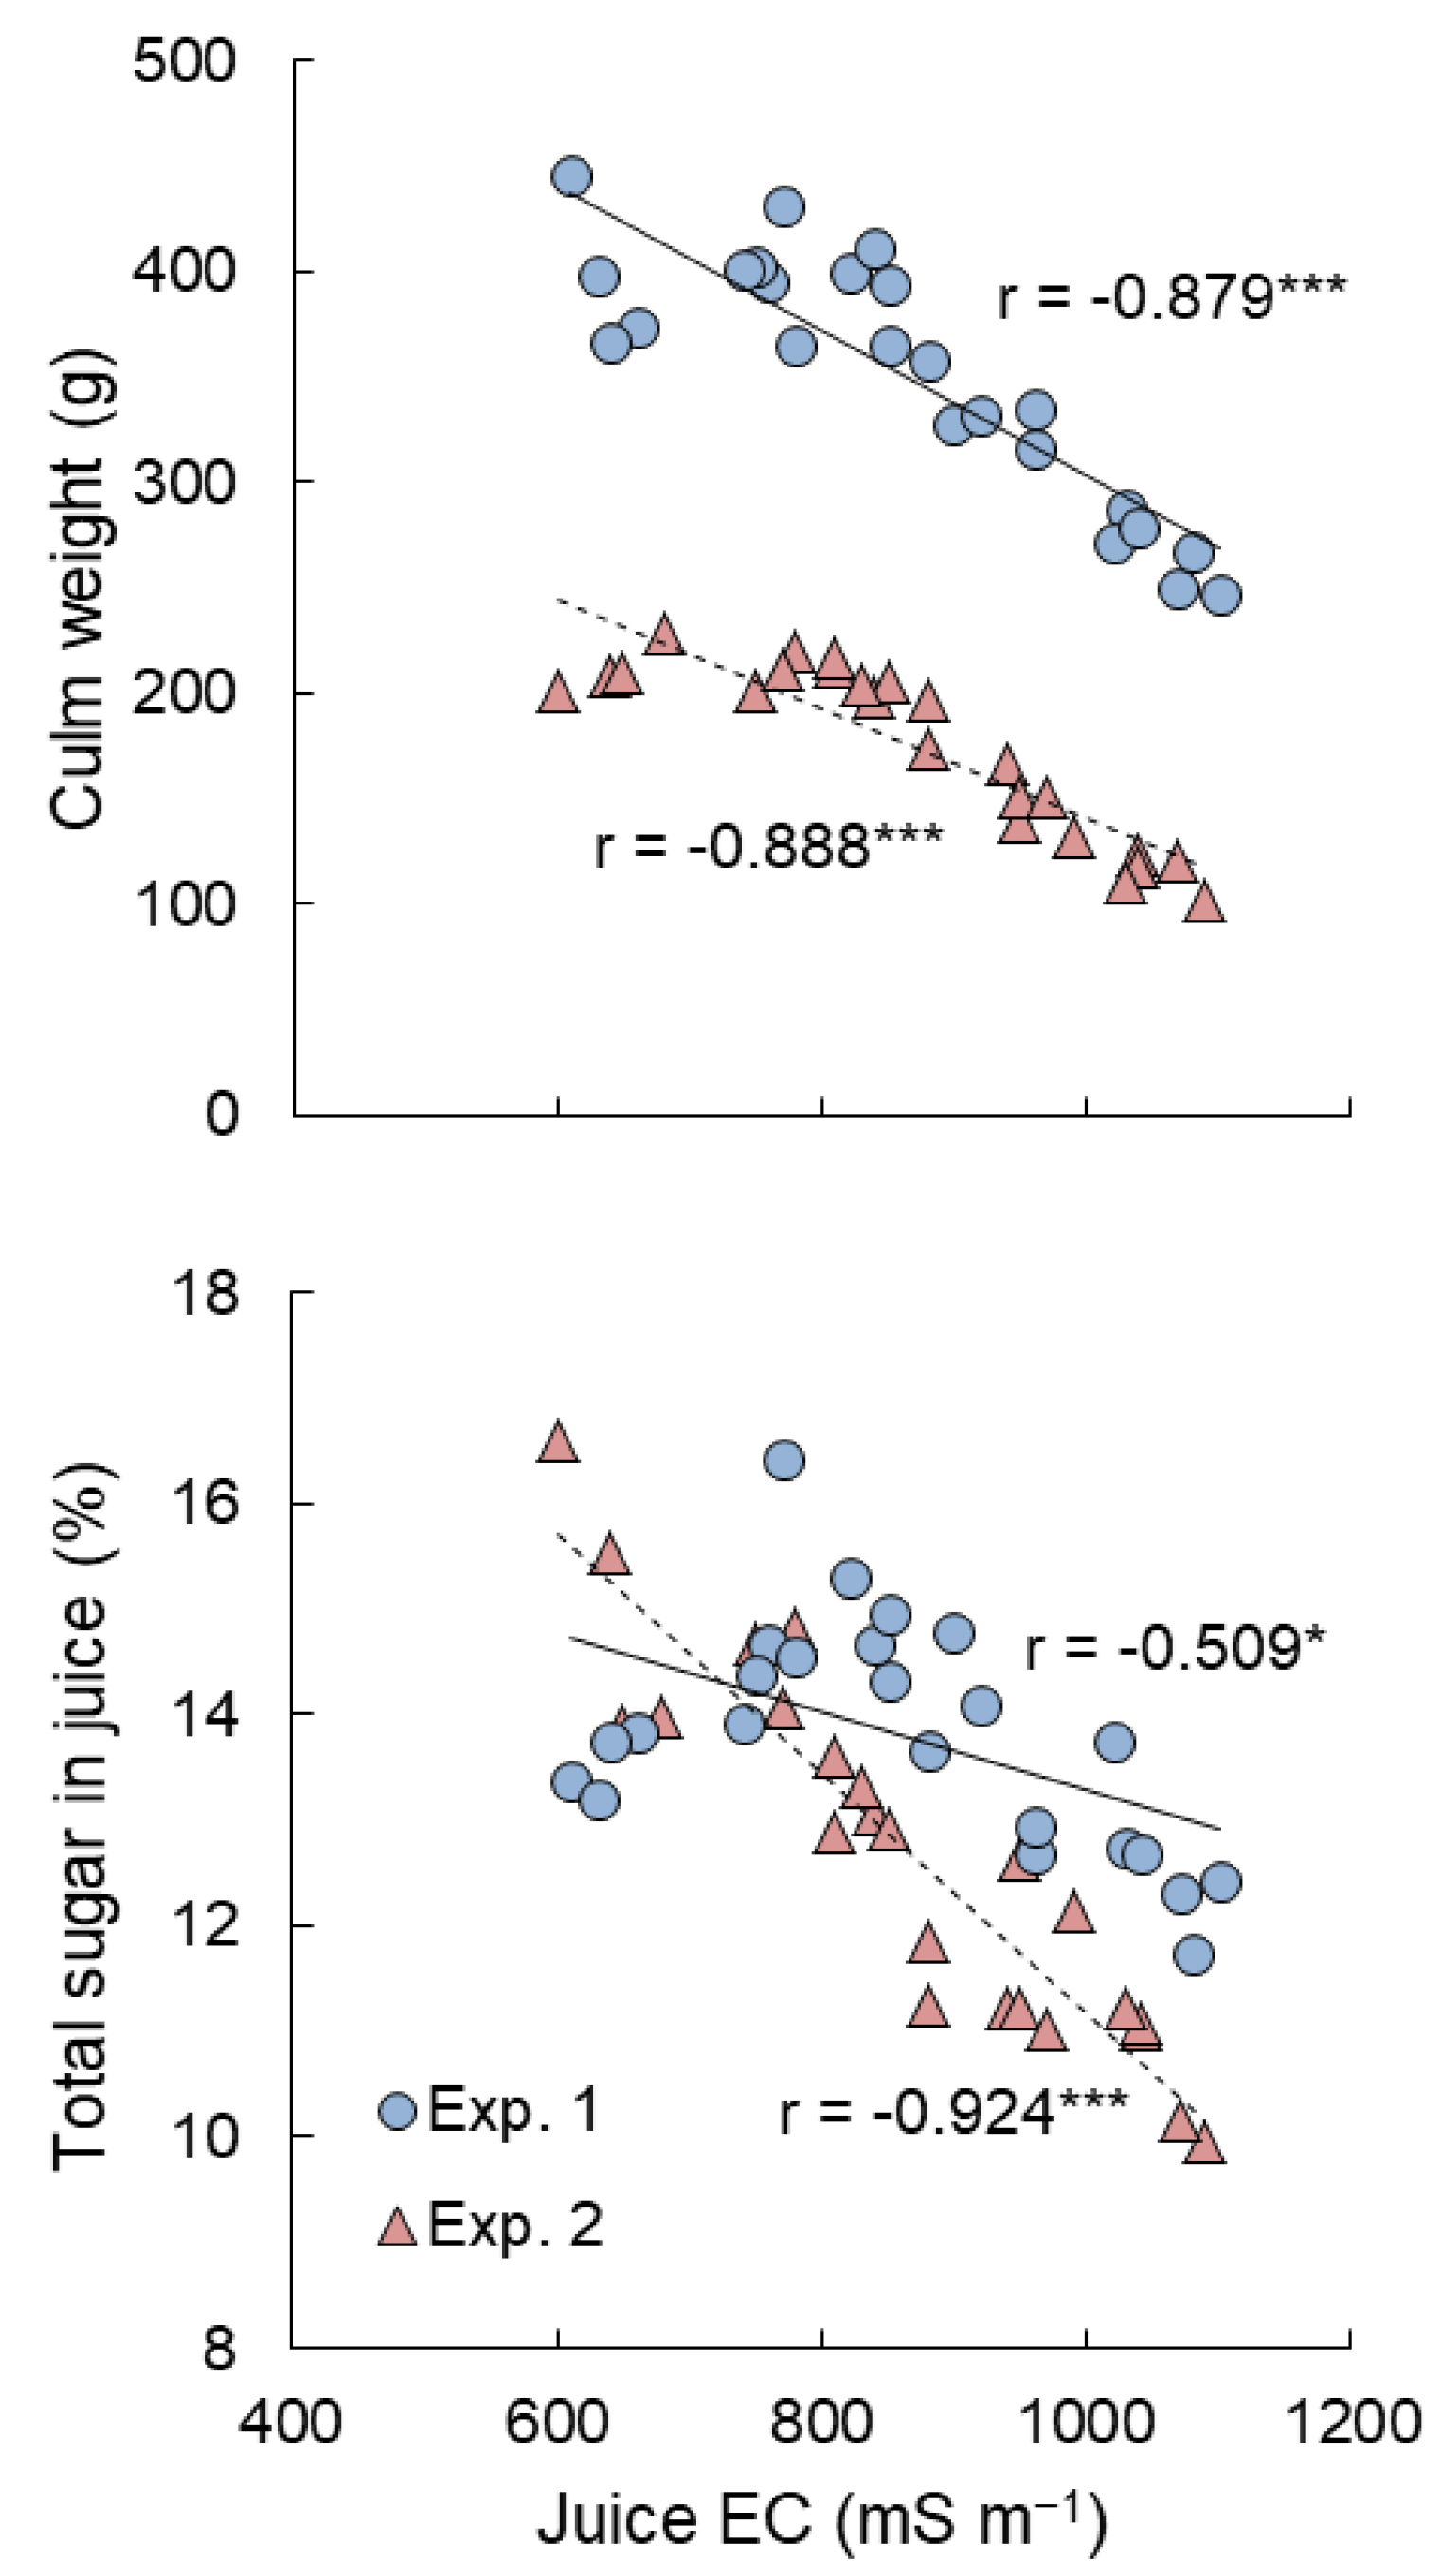
3.6. Relationships between Juice EC and Growth and Quality Parameters
4. Discussion
4.1. Growth and Juice Quality
4.2. Photosynthesis
4.3. Leaf and Juice Ion Compositions
5. Conclusions
Author Contributions
Funding
Acknowledgments
Conflicts of Interest
References
- Pitman, M.G.; Läuchli, A. Chapter 1. Global impact of salinity and agricultural ecosystems. In Salinity: Environment–Plants–Molecules; Läuchli, A., Lüttge, U., Eds.; Kluwer Academic Publishers: Dordrecht, The Netherlands, 2002; pp. 3–20. [Google Scholar]
- Munns, R.; Tester, M. Mechanism of salinity tolerance. Annu. Rev. Plant Biol. 2008, 59, 651–681. [Google Scholar] [CrossRef] [PubMed]
- FAO. FAO Soils Portal, Management, Salt-Affected Soils. Available online: http://www.fao.org/soils-portal/soil-management/management-of-some-problem-soils/salt-affected-soils/more-information-on-salt-affected-soils/en/ (accessed on 31 March 2020).
- Murad, A.M.; Molinari, H.B.C.; Magalhães, B.S.; Franco, A.C.; Takahashi, F.S.C.; de Oliveira, N.G.; Franco, O.L.; Quirino, B.F. Physiological and proteomic analyses of Saccharum spp. grown under salt stress. PLoS ONE 2014, 9, e98463. [Google Scholar] [CrossRef] [PubMed]
- Matsuoka, M. Sugarcane cultivation and sugar industry in Japan. Sugar Tech 2006, 8, 3–9. [Google Scholar] [CrossRef]
- FAO. FAOSTAT, Crops. Available online: http://www.fao.org/faostat/en/#data/QC (accessed on 31 March 2020).
- Patade, V.Y.; Suprasanna, P.; Bapat, V.A. Effects of salt stress in relation to osmotic adjustment on sugarcane (Saccharum officinarum L.) callus cultures. Plant Growth Regul. 2008, 55, 169–173. [Google Scholar] [CrossRef]
- Gomathi, R.; Thandapani, P. Influence of salinity stress on growth parameters and yield of sugarcane. J. Pharm. Biol. Sci. 2014, 9, 28–32. [Google Scholar] [CrossRef]
- Lingle, S.E.; Wiegand, C.L. Soil salinity and sugarcane juice quality. Field Crops Res. 1997, 54, 259–268. [Google Scholar] [CrossRef]
- Cha-um, S.; Chuencharoen, S.; Mongkolsiriwatana, C.; Ashraf, M.; Kridmanee, C. Screening sugarcane (Saccharum sp.) genotypes for salt tolerance using multivariate cluster analysis. Plant Cell Tissue Organ Cult. 2012, 110, 23–33. [Google Scholar] [CrossRef]
- Poonsawat, W.; Theerawitiya, C.; Suwan, T.; Mongkolsiriwatana, C.; Samphumphuang, T.; Cha-um, S.; Kridmanee, C. Regulation of some salt defense-related genes in relation to physiological and biochemical changes in three sugarcane genotypes subjected to salt stress. Protoplasm 2015, 252, 231–243. [Google Scholar] [CrossRef]
- Watanabe, K.; Takaragawa, H.; Kawamitsu, Y. Studies of the irrigation water salinity in sugarcane production areas and the effects of sodium chloride concentrations in irrigation water on growth and sugar accumulation of sugarcane in Japan. Res. Tropic. Agric. 2019, 12, 65–72, (In Japanese with English abstarct). [Google Scholar]
- Zhu, J.-K. Regulation of ion homeostasis under salt stress. Curr. Opin. Plant Biol. 2003, 6, 441–445. [Google Scholar] [CrossRef]
- Shabala, S.; Cuin, T.A. Potassium transport and plant salt tolerance. Physiol. Plant. 2007, 133, 651–669. [Google Scholar] [CrossRef] [PubMed]
- Chao, D.Y.; Dilkes, B.; Luo, H.; Douglas, A.; Yakubova, E.; Lahner, B.; Salt, D.E. Polypoids exhibit higher potassium uptake and salinity tolerance in Arabidopsis. Science 2013, 341, 658–659. [Google Scholar] [CrossRef] [PubMed]
- Ashraf, M.; Shahzad, S.M.; Arif, M.S.; Riaz, M.; Ali, S.; Abid, M. Effects of potassium sulfate on adaptability of sugarcane cultivars to salt stress under hydroponic conditions. J. Plant Nutr. 2015, 38, 2126–2138. [Google Scholar] [CrossRef]
- Watanabe, K.; Nakabaru, M.; Taira, E.; Ueno, M.; Kawamitsu, Y. Relationships between nutrients and sucrose concentrations in sugarcane juice and use of juice analysis for nutrient diagnosis in Japan. Plant Prod. Sci. 2016, 19, 215–222. [Google Scholar] [CrossRef]
- Okinawa Prefecture. 2014/15 Annual Report of Sugarcane and Cane Sugar Production; Okinawa Prefecture: Naha, Japan, 2015; p. 38. (In Japanese) [Google Scholar]
- Kagoshima Prefecture. 2014/15 Annual Report of Sugarcane and Cane Sugar Production; Kagoshima Prefecture: Kagoshima, Japan, 2015; p. 17. (In Japanese) [Google Scholar]
- Long, S.P.; Bernacchi, C.J. Gas exchange measurements, what can they tell us about the underlying limitations to photosynthesis? Procedures and sources of error. J. Exp. Bot. 2003, 54, 2393–2401. [Google Scholar] [CrossRef] [PubMed]
- R Core Team. R: A Language and Environment for Statistical Computing; R Foundation for Statistical Computing: Vienna, Austria, 2018. [Google Scholar]
- Pamenter, N.W.; Allison, J.C.S. Effects of treatments potentially influencing the supply of assimilate on its partitioning in sugarcane. J. Exp. Bot. 2002, 53, 123–129. [Google Scholar] [CrossRef]
- Gutiérrez-Miceli, F.A.; Morales-Torres, R.; Espinosa-Castañeda, Y.J.; Rincón-Rosales, R.; Montes-Molina, J.; Oliva-Liave, M.A.; Dendooven, L. Effects of partial defoliation on sucrose accumulation, enzyme activity and agronomic parameters in sugarcane. J. Agron. Crop Sci. 2004, 190, 250–261. [Google Scholar] [CrossRef]
- Wahid, A.; Rao, A.R.; Rasul, E. Identification of salt tolerance traits in sugarcane lines. Field Crops Res. 1997, 54, 9–17. [Google Scholar] [CrossRef]
- Lingle, S.E.; Wiedenfeld, R.P.; Irvine, J.E. Sugarcane response to saline irrigation water. J. Plant Nutr. 2000, 23, 469–486. [Google Scholar] [CrossRef]
- Wiedenfeld, B. Effects of irrigation water salinity and electrostatic water treatment for sugarcane production. Agric. Water Manag. 2008, 95, 85–88. [Google Scholar] [CrossRef]
- Mekaru, T.; Kuninaka, S.; Dana, K. Saline water irrigation for sugarcane. 1. Effects on growth and yield. Abs. Ann. Meet. Jpn. Soc. Soil Sci. Plant Nutr. 1982, 28, 314. (In Japanese) [Google Scholar]
- Thomas, J.R.; Salinas, F.G.; Oerrther, G.F. Use of saline water for supplemental irrigation of sugarcane. Agron. J. 1981, 73, 1011–1017. [Google Scholar] [CrossRef]
- O’Shea, M. Sugar Accumulation. In Manual of Cane Growing; Hogarth, D.M., Allsopp, P.G., Eds.; Fergies Printers: Brisbane, Australia, 2007; pp. 82–89. [Google Scholar]
- Meinzer, F.C.; Plaut, Z.; Saliendra, Z. Carbon isotope discrimination, gas exchange, and growth of sugarcane cultivars under salinity. Plant Physiol. 1994, 104, 521–526. [Google Scholar] [CrossRef] [PubMed]
- Cha-um, S.; Kridmanee, C. Proline accumulation, photosynthetic abilities and growth characters of sugarcane (Saccharum officinarum L.) plantlets in response to iso-osmotic salt and water-deficit stress. Agric. Sci. China 2009, 8, 51–58. [Google Scholar]
- Vasantha, S.; Venkataramana, S.; Gururaja Rao, P.N.; Gomathi, R. Long term salinity effect on growth, photosynthesis and osmotic characteristics in sugarcane. Sugar Tech 2010, 12, 5–8. [Google Scholar] [CrossRef]
- Cruz, F.J.R.; Júnior, D.C.F.; Santos, D.M.M. Low salt stress affects physiological parameters and sugarcane plant growth. Aust. J. Crop Sci. 2018, 12, 1272–1279. [Google Scholar] [CrossRef]
- Gomathi, R.; Thandapani, T.V. Salt stress in relation to nutrient accumulation and quality of sugarcane genotypes. Sugar Tech 2005, 7, 39–47. [Google Scholar] [CrossRef]
- Plaut, Z.; Meinzer, F.C.; Federman, E. Leaf development, transpiration and ion uptake and distribution in sugarcane cultivars under salinity. Plant Soil 2000, 218, 59–69. [Google Scholar] [CrossRef]
- Medeiros, C.D.; Ferreira, J.R.C.; Oliveira, M.T.; Rivas, R.; Pandolfi, V.; Kido, É.A.; Baldani, J.I.; Santos, M.G. Photosynthesis, antioxidant activities and transcriptional responses in two sugarcane (Saccharum officinarum L.) cultivars under salt stress. Acta Physiol. Plant. 2014, 36, 447–459. [Google Scholar] [CrossRef]
- Gandonou, C.B.; Bada, F.; Gnancadja, S.L.; Abrini, J.; Skali-Senhaji, N. Effects of NaCl on Na, Cl and K ions accumulation in two sugarcane (Saccharum sp.) cultivars differing in their salt tolerance. Int. J. Plant Physiol. Biochem. 2011, 3, 155–162. [Google Scholar]
- Ayers, R.; Westcot, D.W. 2.4 Management of salinity problems. In Water Quality for Agriculture, FAO Irrigation and Drainage Paper 29 Rev. 1; FAO: Rome, Italy, 1985. [Google Scholar]
- Ham, G.; McGuire, P.; Kingston, G. Chapter 10. Irrigation of Sugarcane. In Manual of Cane Growing; Hogarth, D.M., Allsopp, P.G., Eds.; Fergies Printers: Brisbane, Australia, 2007; pp. 194–225. [Google Scholar]


| NaCl (mg L−1) | qP | qN | ΦII | |||
|---|---|---|---|---|---|---|
| 0 | 0.392 | a | 0.789 | a | 0.162 | a |
| 200 | 0.364 | ab | 0.775 | a | 0.159 | a |
| 500 | 0.365 | ab | 0.792 | a | 0.153 | ab |
| 1000 | 0.382 | ab | 0.798 | a | 0.160 | a |
| 2000 | 0.316 | bc | 0.766 | a | 0.138 | ab |
| 3000 | 0.283 | c | 0.778 | a | 0.121 | b |
| Exp. | NaCl | Culm Height | Culm Weight | Leaf Area | |||
|---|---|---|---|---|---|---|---|
| (mg L−1) | (cm) | (g) | (cm2) | ||||
| 1 | 0 | 111 | ab | 397 | a | 3396 | a |
| 200 | 113 | a | 391 | a | 3182 | ab | |
| 500 | 112 | ab | 389 | a | 2871 | bc | |
| 1000 | 110 | ab | 367 | ab | 2729 | d | |
| 2000 | 101 | ab | 303 | bc | 2580 | cd | |
| 3000 | 94 | b | 261 | c | 2216 | d | |
| 2 | 0 | 71 | a | 212 | a | 2191 | a |
| 200 | 68 | a | 211 | a | 2303 | a | |
| 500 | 69 | a | 206 | a | 1774 | ab | |
| 1000 | 64 | a | 169 | b | 1472 | bc | |
| 2000 | 53 | b | 140 | bc | 1521 | bc | |
| 3000 | 50 | b | 113 | c | 1228 | c | |
| Exp. | NaCl | Sucrose | Glucose | Fructose | Total Sugar | ||||
|---|---|---|---|---|---|---|---|---|---|
| (mg L−1) | (%) | ||||||||
| 1 | 0 | 12.40 | bc | 0.65 | a | 0.49 | a | 13.54 | bcd |
| 200 | 13.54 | ab | 0.47 | b | 0.38 | ab | 14.38 | abc | |
| 500 | 14.30 | a | 0.34 | b | 0.30 | b | 14.94 | a | |
| 1000 | 13.96 | a | 0.36 | b | 0.31 | b | 14.63 | ab | |
| 2000 | 12.41 | bc | 0.33 | b | 0.30 | b | 13.03 | cd | |
| 3000 | 11.56 | c | 0.37 | b | 0.36 | ab | 12.30 | d | |
| 2 | 0 | 14.13 | a | 0.48 | a | 0.40 | a | 15.01 | a |
| 200 | 13.62 | a | 0.27 | a | 0.22 | a | 14.12 | ab | |
| 500 | 12.63 | ab | 0.32 | a | 0.28 | a | 13.23 | bcd | |
| 1000 | 11.02 | bc | 0.19 | a | 0.18 | a | 11.40 | d | |
| 2000 | 11.31 | bc | 0.21 | a | 0.19 | a | 11.71 | cd | |
| 3000 | 10.08 | c | 0.27 | a | 0.26 | a | 10.60 | d | |
| Exp. | NaCl | Na+ | K+ | Mg2+ | Ca2+ | Cl− | PO43− | SO42− | Total Ion | EC | |||||||||
|---|---|---|---|---|---|---|---|---|---|---|---|---|---|---|---|---|---|---|---|
| (mg L−1) | (mg L−1) | (g L−1) | (mS m−1) | ||||||||||||||||
| 1 | 0 | 40 | c | 2591 | e | 352 | a | 319 | a | 1216 | e | 154 | a | 1295 | a | 6.0 | d | 635 | e |
| 200 | 91 | bc | 3413 | de | 423 | a | 375 | a | 2128 | d | 209 | a | 1332 | a | 8.0 | c | 758 | d | |
| 500 | 102 | bc | 3718 | cd | 507 | a | 468 | a | 2544 | c | 246 | a | 1465 | a | 9.1 | bc | 830 | cd | |
| 1000 | 123 | bc | 3900 | bc | 490 | a | 460 | a | 2708 | bc | 351 | a | 1588 | a | 9.6 | b | 878 | c | |
| 2000 | 273 | b | 4230 | ab | 483 | a | 404 | a | 3012 | ab | 349 | a | 1542 | a | 10.3 | b | 993 | b | |
| 3000 | 490 | a | 4495 | a | 495 | a | 402 | a | 3401 | a | 768 | a | 1629 | a | 11.7 | a | 1073 | a | |
| 2 | 0 | 30 | b | 3151 | e | 445 | c | 359 | ab | 1075 | e | 457 | b | 960 | a | 6.5 | e | 643 | e |
| 200 | 90 | b | 4037 | d | 544 | ab | 398 | a | 2883 | d | 860 | a | 908 | a | 9.7 | d | 778 | d | |
| 500 | 133 | b | 4585 | cd | 527 | abc | 366 | ab | 3285 | cd | 1167 | a | 940 | a | 11.0 | c | 833 | d | |
| 1000 | 272 | b | 5050 | bc | 552 | a | 401 | a | 3748 | c | 1011 | a | 954 | a | 12.0 | bc | 913 | c | |
| 2000 | 555 | a | 5279 | ab | 466 | bc | 319 | b | 4379 | b | 1004 | a | 928 | a | 12.9 | b | 988 | b | |
| 3000 | 728 | a | 5854 | a | 475 | abc | 323 | b | 5248 | a | 1118 | a | 1022 | a | 14.8 | a | 1058 | a | |
| NaCl | Sucrose | Glucose | Fructose | Total Sugar | ||||
|---|---|---|---|---|---|---|---|---|
| (mg L−1) | (mg g−1) | |||||||
| 0 | 52.12 | a | 4.79 | a | 4.22 | a | 61.13 | a |
| 200 | 48.10 | a | 4.25 | ab | 3.46 | a | 55.80 | a |
| 500 | 45.50 | ab | 2.63 | ab | 2.64 | a | 50.77 | ab |
| 1000 | 42.66 | ab | 2.50 | ab | 3.08 | a | 48.23 | ab |
| 2000 | 33.68 | b | 2.14 | b | 2.59 | a | 38.41 | b |
| 3000 | 33.93 | b | 2.51 | ab | 2.72 | a | 39.16 | b |
| NaCl | Na+ | K+ | Mg2+ | Ca2+ | Cl− | PO43− | SO42− | Total Ion | SPAD | |||||||||
|---|---|---|---|---|---|---|---|---|---|---|---|---|---|---|---|---|---|---|
| (mg L−1) | (mg g−1) | |||||||||||||||||
| 0 | 0.22 | a | 6.83 | c | 1.73 | a | 2.46 | a | 6.86 | b | 1.01 | c | 0.90 | a | 20.0 | b | 33.8 | b |
| 200 | 0.22 | a | 7.80 | bc | 1.54 | a | 2.25 | ab | 8.49 | a | 1.29 | c | 0.77 | a | 22.4 | a | 35.3 | b |
| 500 | 0.21 | a | 8.03 | bc | 1.49 | a | 2.12 | ab | 8.27 | a | 1.65 | bc | 0.71 | a | 22.5 | a | 37.4 | ab |
| 1000 | 0.18 | a | 7.95 | bc | 1.71 | a | 2.13 | ab | 8.11 | a | 2.39 | ab | 1.05 | a | 23.5 | a | 37.5 | ab |
| 2000 | 0.25 | a | 9.59 | ab | 1.33 | a | 1.54 | b | 7.32 | ab | 2.21 | a | 0.91 | a | 23.1 | a | 37.5 | ab |
| 3000 | 0.20 | a | 9.90 | a | 1.37 | a | 1.54 | b | 7.46 | ab | 2.48 | a | 0.92 | a | 23.9 | a | 40.1 | a |
© 2020 by the authors. Licensee MDPI, Basel, Switzerland. This article is an open access article distributed under the terms and conditions of the Creative Commons Attribution (CC BY) license (http://creativecommons.org/licenses/by/4.0/).
Share and Cite
Watanabe, K.; Takaragawa, H.; Ueno, M.; Kawamitsu, Y. Changes in Agronomic and Physiological Traits of Sugarcane Grown with Saline Irrigation Water. Agronomy 2020, 10, 722. https://doi.org/10.3390/agronomy10050722
Watanabe K, Takaragawa H, Ueno M, Kawamitsu Y. Changes in Agronomic and Physiological Traits of Sugarcane Grown with Saline Irrigation Water. Agronomy. 2020; 10(5):722. https://doi.org/10.3390/agronomy10050722
Chicago/Turabian StyleWatanabe, Kenta, Hiroo Takaragawa, Masami Ueno, and Yoshinobu Kawamitsu. 2020. "Changes in Agronomic and Physiological Traits of Sugarcane Grown with Saline Irrigation Water" Agronomy 10, no. 5: 722. https://doi.org/10.3390/agronomy10050722
APA StyleWatanabe, K., Takaragawa, H., Ueno, M., & Kawamitsu, Y. (2020). Changes in Agronomic and Physiological Traits of Sugarcane Grown with Saline Irrigation Water. Agronomy, 10(5), 722. https://doi.org/10.3390/agronomy10050722