Article

Salinity Stress as an Elicitor for Phytochemicals and Minerals Accumulation in Selected Leafy Vegetables of Brassicaceae

1
Department of Molecular Biology, Ruđer Bošković Institute, Bijenička cesta 54, 10 000 Zagreb, Croatia
2
Department of Food Technology, University North, Trg dr. Žarka Dolinara 1, 48000 Koprivnica, Croatia
*
Author to whom correspondence should be addressed.
Agronomy 2021, 11(2), 361; https://doi.org/10.3390/agronomy11020361
Submission received: 16 January 2021 / Revised: 4 February 2021 / Accepted: 16 February 2021 / Published: 17 February 2021
(This article belongs to the Special Issue How Plants Perceive Salt during the Irrigation)

Abstract

:
The potential role of NaCl (50–200 mM) as an eustressor for the accumulation of health promoting phytochemicals and maintaining the homeostasis of macro- and micro-elements in three, hydroponically grown Brassica leafy vegetables (Chinese cabbage, white cabbage, and kale) was investigated. Considering K+/Na+ ratio and proline contents as reliable stress markers, we confirmed more prominent stress status in Chinese cabbage followed by white cabbage and kale. Low to moderate salinity treatments (50 and 100 mM NaCl) caused an increase in most of the phenolic compounds in the analyzed Brassica leafy vegetables. Total glucosinolates were elicited by NaCl in a dose dependent manner. Salt treatment caused an increase in total chlorophylls but did not significantly affect carotenoid content. Furthermore, low to moderate treatments did not significantly disturb homeostasis of macro- and micro-elements, particularly in white cabbage and kale where the K level did not decrease significantly and Ca was even increased in white cabbage. We may conclude that salinity may elicit phytochemical accumulation in selecting vegetables grown on saline soils without undesirable disturbance in macro- and micro-elements homeostasis depending on salt concentration and species/varieties. This information may be of great importance in the selection of crops grown on saline soils.

1. Introduction

In recent years, plant based food, in addition to providing basic nutrients, have become popular due to the presence of health promoting compounds, which may prevent or reduce symptoms of several chronic diseases. Consequently, food producers are orientated toward the production of crops with increased levels of ’healthy compounds’ or at least stable levels of these desirable compounds in ever-changing environments. There are two strategies in producing crops with increased desirable compounds: one is by selecting species/genotypes/cultivars that contain a genetically determined higher level of phytochemicals, and the second is by manipulating growth factors and environmental conditions during plant growth [1]. In general, during unfavorable environmental conditions that may be caused by biotic (pathogen attacks) or abiotic (drought, salinity, temperature, exposure to UV radiation) stressors, plants activate defense mechanisms, which include the accumulation of specialized metabolites or phytochemicals [2,3,4]. An elicitation of defense mechanisms in plants, in order to enrich synthesis of specialized metabolites without negative effects on crop growth and productivity, has been recently considered as an economic and sustainable technique for increasing the content of specialized metabolites in plants grown for better human nutrition [5]. Various biological, physical, or chemical stressful factors that trigger the signaling pathways leading to a higher bioactive compound content and quality attributes of plant products are also known as eustressors [6].
Leafy vegetables may be sources of natural antioxidants such as different pigments, phenolic acids, and flavonoids [7,8]. These are not only essential sources of natural antioxidants, but may also contribute to human health due to the presence of different minerals, dietary fibers, and vitamins [9,10]. Cruciferous (Brassicaceae) vegetables have been grown and consumed by different cultures worldwide from ancient times. In recent years, Brassica vegetables have gained popularity as a functional food due to the presence of specialized metabolites or phytochemicals whose bioactivity is linked with beneficial effects to human health [11]. In addition, some of the vegetables from this group are a source of minerals and vitamins necessary for human health [12]. They pose good environmental adaptation and may be ideal crops for the application of elicitors in order to produce plants with increased phytochemical content. Although salt stress is considered an abiotic factor associated with crop productivity reduction, salinity eliciting is able to improve the quality of the final product [6]. Several studies have explored salinity as an eustressor, and found positive physical properties, flavor compounds, bioactive compounds, and anti-nutrients as a result of salt application [6,13,14,15]. Under increased salinity, Brassica crops experience a reduction in photosynthetic system capacity, yield, and changes in hormonal parameters [16], but may also result in increased phytochemical content [17], which is species-specific and depends on applied salt concentration. Rapeseed germination under moderate salinity increases phenolic content and antioxidant activity in sprouts [18]. In broccoli sprouts, 160 mM NaCl treatment significantly enhanced the level of total phenolic, glucoraphanin, sulforaphane, antioxidant, and myrosinase activity, while it significantly decreased ascorbic acid content [19]. NaCl treatment (100 mM) increased glucoraphasatin, total glucosinolates, total phenol contents, and myrosinase activities in radish sprouts [20]. Our previous research on three Brassica species (kale, white cabbage, and Chinese cabbage) showed that low (50 mM) and moderate (100 mM) salinity significantly increased total phenolic acids in kale sprouts, while total glucosinolates were increased in sprouts of all three species in a dose dependent manner upon salt application (50–200 mM NaCl) [14]. It was generally shown that salt-tolerant varieties (kale and white cabbage) had higher levels of some phenolic acids and suffered less from metabolic stress disorders under salinity stress.
According to Rouphael et al. [6], in the next few years, the major challenge for the research community will be the application of eustress such as salinity, in order to enhance the nutritional and functional attributes of vegetables without compromising yield. However, the molecular and physiological mechanisms behind the enhancement of phytochemicals under salinity eliciting are still not completely understood. Thus, parameters such as time of exposure, growing stage of plants, the type of salt source, and concentration should be determined [6]. The vast majority of research on salinity as an eustressor for increased phytochemical content in Brassica species have been undertaken on sprouts, but the manipulation of physical properties, flavor, and bioactive compounds as well as undesirable anti-nutrients of vegetables under salinity eliciting should also be realized in grown plants [6]. In addition, little is known about how treatments with NaCl influence mineral content in the plant, whose intake may be beneficial for human health.
The aim of the present study was to determine how treatments with increasing NaCl concentration (50–200 mM) influenced the content of total phenols, phenolic acids, flavonoids, flavanols, glucosinolates, and carotenoids, in hydroponically grown Chinese cabbage (Brassica rapa ssp. pekinensis), white cabbage (B. oleracea var. capitata), and kale (B. oleracea var. acephala). In addition, to evaluate how salinity treatment influenced mineral content, we determined the changes in the content of Na, K, Ca, Mg, Mn, Fe, Cu, and Zn in plants under applied salt stress conditions.

2. Materials and Methods

2.1. Plant Growing and Salt Treatments

Seeds of Chinese cabbage (B. rapa L. ssp. pekinensis (Lour.) Hanelt cv. Cantonner Witkrop), white cabbage (B. oleracea var. capitata cv. Varaždinski), and kale (B. oleracea var. acephala cv. IJK9) were purchased from ISP International Seed Processing GmbH, Quedlinburg, Germany, the Agricultural Advisory Service of Varaždin Region, Croatia, and the family farm Srđan Franić, Vrgorac, Croatia, respectively. Plant growing and salinity treatments were performed as reported earlier [16]. In brief, plants were grown in a home-made hydroponic growth system supplying commercially available nutrient solutions (Flora Series and GHE Hydroponics) according to the manufacturer’s instructions, at 21 °C, with photoperiod 16/8 h light (115 mmol m−2 s)/dark. At the four fully developed leaf stages, plants were subjected to salinity stress to final concentrations of 50, 100, and 200 mM NaCl for 24 h. The corresponding controls were grown at the same conditions without salt application. After 24 h of exposure to the final salt concentrations, leaves and roots were harvested separately for analysis.

2.2. Determination of Proline Content

For proline determination, we extracted 30 mg of the freeze-dried tissue in 70% ethanol as we reported earlier [17]. Reaction mixture (1000 µL) containing 1% ninhydrin [w/v], 60% acetic acid [v/v], and 20% ethanol [v/v] was mixed with 100 µL of extract and heated at 95 °C for 20 min. Proline levels were measured at 520 nm using a UV–VIS spectrophotometer. For creation of the calibration curve, proline standard was used and results are expressed as µmol proline per mg of dry weight (µmol mg−1 dw).

2.3. Determination of Polyphenolic Compounds

Total polyphenols, total phenolic acids, total flavonoids, and total flavanol content were determined spectrophotometrically using methods optimized and described earlier for Brassica plants [21]. Standards of gallic acid (GA), caffeic acid (CA), and catechin (C) were used for calibration curves created for the determination of total polyphenols, total phenolic acids as well as total flavonoids and flavanols, respectively. Results were expressed as milligrams of equivalents: mg GAE g−1 dw for total polyphenols, mg CAE g−1 dw for total phenolic acids, mg CE g−1 dw for total flavonoids, and µg CE g−1 dw for total flavanols.

2.4. Determination of Pigments Content

Content of pigments, chlorophyll a, chlorophyll b, total chlorophylls, and carotenoids were determined according to the method of Lichtenthaler and Buschmann [22] with modification [18]. Plant material was extracted with 80% acetone until discoloration and pigments levels were measured at three different wavelengths, 663.2 nm for chlorophyll a, 646.8 nm for chlorophyll b, and 470 nm for carotenoids. Results are expressed as µg g−1 dw (dry weight).

2.5. Determination of Glucosinolate Content

Glucosinolates were determined using the method previously reported by Aghajanzaden et al. [23] with some modification [17]. In brief, freeze-dried tissue (30 mg) was extracted in 80% methanol, heated at 95 °C for 2 min in order to inactivate the myrosinase enzyme, cooled, and centrifuged (5 min at 13 000 rpm). Glucosinolate levels were determined in a reaction mixture containing 30 µL methanolic plant extract and 900 µL 2 mM disodium tetrachloropalladate (Na2PdCl4) using a UV–VIS spectrophotometer (BioSpec-1601 E, Shimadzu) at 425 nm. Results were expressed as milligrams of sinigrin equivalent per gram of dry weight (mg sin g−1 dw).

2.6. Determination of Elemental Content

Mineral content was measured according to the method reported by Fiket et al. [24] using high-resolution inductively coupled plasma mass spectrometry, Thermo Fisher Scientific HRICP-MS Element 2 instrument equipped with an ESI-a SC-2 DX FAST autosampler and indium as an internal standard. Before analysis, powdered lyophilized tissue samples were subjected to microwave-assisted acidic digestion in HNO3/HF (60:1, v/v) using a Multiwave 3000 at 1400 W.

2.7. Statistical Analysis

The data were analyzed with the STATISTICA program (Version Stat Soft. Statistica.v 1 0.0.Enterprise). ANOVA was used to analyze the relevant factors, and values were considered to be significant at p < 0.05. Post-hoc multiple mean comparison (Tukey’s HSD test) was used for multiple comparisons.

3. Results

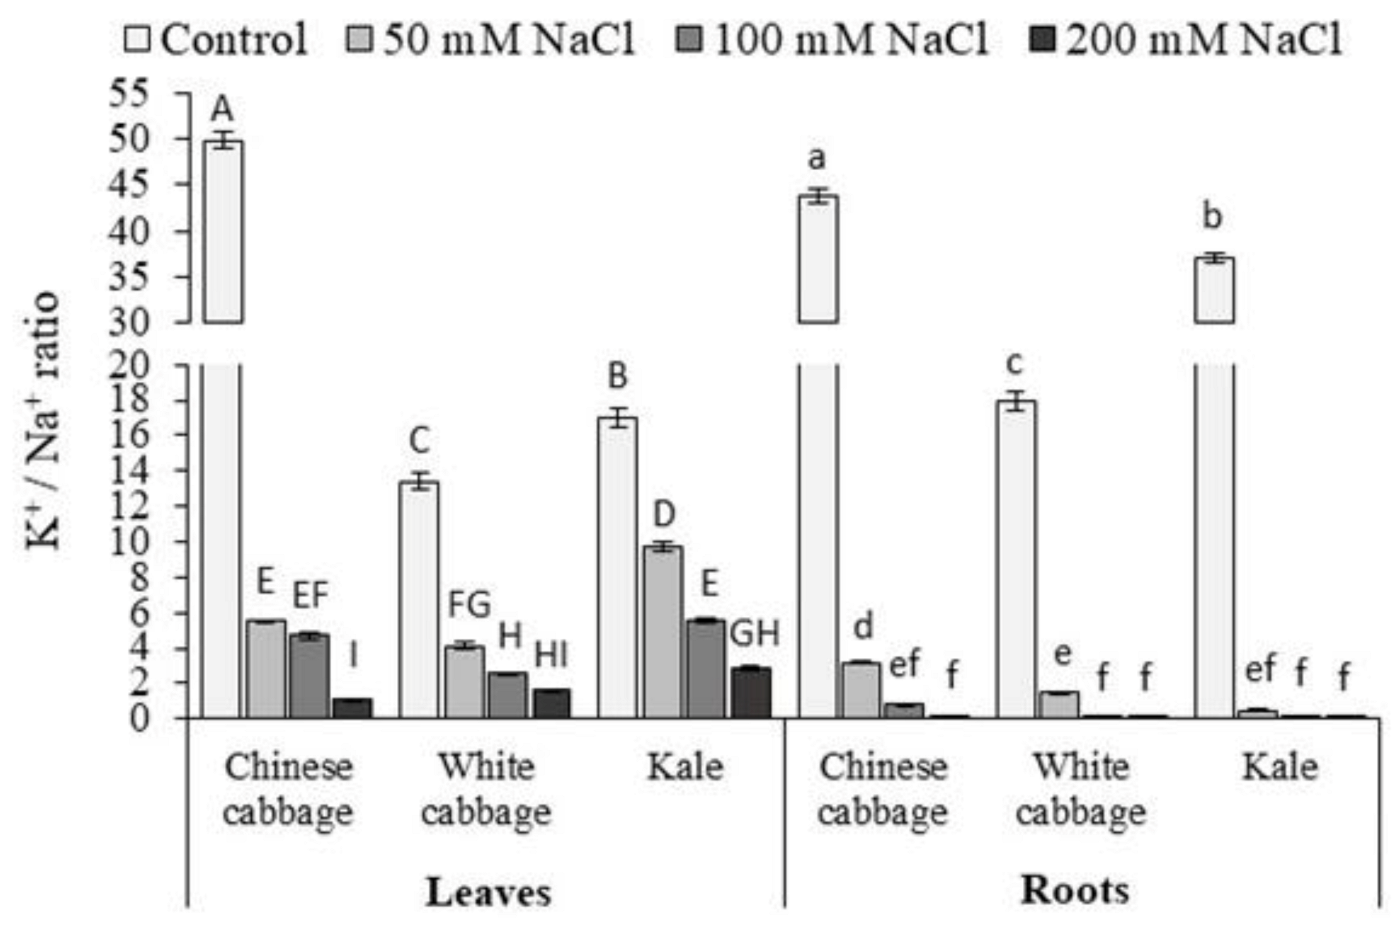
3.1. Proline and K+/Na+ Ratio

In order to examine the stress status of hydroponically grown and salt treated Brassica plants, we analyzed two main stress markers: K+/Na+ ratio (Figure 1) and the level of osmoprotectant proline (Figure 2).
The increase in sodium, and decrease in potassium ions resulted in lower K+/Na+ ratio upon salinity compared with the control plants. In control plants, it was shown that the K+/Na+ ratio was the highest in the leaves and roots of Chinese cabbage compared to white cabbage and kale. It was interesting that white cabbage and kale had a higher ratio of K+/Na+ in the roots than leaves while the situation was the opposite in Chinese cabbage. Following the salinity treatments, the K+/Na+ ratios decreased in a dose dependent manner in all samples. The most drastic decrease was obtained in the leaves of Chinese cabbage upon 200 mM NaCl treatment (43-fold), then white cabbage (8.4-fold) and kale (6-fold). On the other hand, in root tissues, the K+/Na+ ratio was decreased 254-, 290-, and 589-fold in Chinese cabbage, white cabbage, and kale respectively.
From Figure 2, it is evident that proline content was increased in a dose dependent manner with salinity concentration, particularly in the leaves of all analyzed Brassica leafy vegetables, while in the roots, significant increases were obtained only at the highest NaCl concentration (200 mM). In Chinese cabbage and white cabbage leaves, proline content increased approximately 20-fold while in kale, it was 6-fold at 200 mM NaCl treatment.

3.2. Pigment Concentration

The concentration of chlorophyll a, chlorophyll b, and total chlorophyll content in the analyzed samples are presented in Table 1. In the control plants, kale contained slightly higher chlorophyll a (around 7 µg g−1 dw) and total chlorophyll content (around 10.5 µg g−1 dw) than the other two analyzed Brassica leafy vegetables. In Chinese cabbage and white cabbage, 50 and 100 mM NaCl treatments increased chlorophyll a, b, and consequently total chlorophyll content, while 200 mM NaCl treatment caused decreased pigment concentration in comparison with the control. In contrast, content of chlorophyll a, b, and consequently total chlorophyll content in kale did not significantly change under the NaCl treatment.

3.3. Specialized Metabolites Level

The levels of different specialized metabolites groups under salt stress in the leaves and roots of three Brassica species are presented in Table 2. As expected, the leaves contained a higher amount of all analyzed specialized metabolites in comparison with the roots. As is evident from Table 2, salinity treatment, which is one of the abiotic stresses, influences the polyphenolic compound level. Salinity treatments caused an increase in total polyphenols, total phenolic acids, and total flavonoid level in all three analyzed Brassica leafy vegetables, but the most effective NaCl concentration depends on species and group of specialized metabolites. The highest total polyphenol level in Chinese cabbage and white cabbage was observed in plants treated with 100 mM NaCl, while in kale, it was measured upon 50 mM NaCl treatment. Total phenolic acid content was the highest in all three analyzed crops under 100 mM NaCl treatment. Total flavonoid content was the highest in Chinese cabbage and kale after 50 mM NaCl, while 200 mM NaCl treatment caused the same effect in white cabbage. Total flavanols showed little change under salinity treatments with the tendency of decreasing under salinity treatments.
Glucosinolates were increased in all analyzed Brassica leafy vegetables in a dose dependent manner with salt concentration reaching the highest level at 200 mM NaCl treatment. Increase in glucosinolate accumulation observed in leaves was much stronger than in roots for all three leafy vegetables. Consequently, it is interesting to note the trend that the roots that were in direct contact with NaCl were less sensitive to the changes in glucosinolate content under salinity treatments than the leaves.
The third important group of specialized metabolites in Brassica plants, together with polyphenols and glucosinolates, are carotenoids [11]. As expected, we did not detect carotenoids in roots, while in leaves, their content depends on the species. Chinese cabbage had lower total carotenoid content than white cabbage and kale. As opposed to other analyzed groups in our study, salinity treatment did not influence carotenoid content.

3.4. Element Composition

Element composition under salinity treatment in leaves and roots is presented in Table 3. Salinity treatment with NaCl causes an accumulation of Na and affects the accumulation of other ions. In the control, white cabbage had slightly higher Na concentration than Chinese cabbage and kale. After NaCl treatments, Na concentration increased gradually in a dose dependent manner, reaching the highest increase at 200 mM NaCl, (for roots 54×, 47×, and 45× and for leaves 28×, 7.5×, and 4× for Chinese cabbage, white cabbage, and kale, respectively).
Salinity treatments decreased K concentration in the leaves and roots in all three species which caused, in parallel with increased levels of Na, significant decrease in K+/Na+ (Figure 1). Besides K and Na disturbance, salinity stress affected the levels of other macro- and micro-nutrients. Salinity treatments caused a decrease in the Ca content in the roots of all three species, while in the leaves, a decrease was observed for Chinese cabbage and kale. In white cabbage, low salinity (50 mM NaCl) significantly increased Ca content in comparison with the control. White cabbage showed the highest Mg content in the control leaves but concentration decreased due to salinity treatments, significantly under the 200 mM NaCl. The same trend was observed for kale leaves, while in the roots, Mg content decreased with an increased salinity for all three species. In contrast, increased salinity caused an increase in the Mg content of Chinese cabbage leaves.
According to our results, salinity treatments did not cause changes in the leaves’ Cu content in all three analyzed species while in the roots, increased salinity caused the accumulation of Cu. Furthermore, the influence of salinity on Fe and Zn content was species specific. In Chinese cabbage and kale, salinity treatments caused a decrease in Fe and Zn content, while in white cabbage, salinity treatments caused an increased accumulation of those elements in the leaves. In roots, with increased salinity, we observed increased Fe and decreased Zn accumulation in white cabbage and kale.

4. Discussion

The primary effects of salinity on plants are: (1) the osmotic stress due to a water deficit caused by increased concentrations of salt in growing medium and (2) ion-specific stress leading to K+ deficiency due to altered K+/Na+ ratios [25]. Alteration of the K+/Na+ ratio is due to the increase in the influx of Na+. Reducing Na+ in the shoot, while maintaining K+ homeostasis, is a key component of salinity tolerance in many plants [26]. According to our results, the K+/Na+ ratio decreased in all analyzed Brassica leafy vegetables, but the decrease was the most prominent in kale root samples. This may indicate that kale has the best mechanisms of accumulating the sodium in the root tissue and preventing Na+ influx to the upper plant parts, then white cabbage, while Chinese cabbage suffered from high Na+ influx from the roots to leaves. Proline accumulates in many plant species in parallel with increased external salinity and is considered a reliable biochemical marker of salt stress [27]. Increased proline accumulation was observed under salt stress in all three Brassica leafy vegetables. These results are in parallel with our previous studies and other authors’ published papers that reported increased proline levels in Brassica plants under salt stress [16,17,28,29], and confirmed proline as a reliable biochemical marker of salt stress, indicating stress in plants before any visible damages. In Chinese cabbage and white cabbage leaves, the proline content increase was significantly higher in comparison with the kale at the highest salt concentration. Taking together this observation and K+/Na+ ratio, we confirmed more prominent stress status in Chinese cabbage, then white cabbage, and kale, which is in accordance with the previously reported salinity tolerance of these species [16,17].
That kale is more tolerant to salinity stress than Chinese and white cabbage may also indicate the results of chlorophyll a, b, and total chlorophyll content. In kale, we noticed higher content of pigments than in Chinese and white cabbage, and the amounts are comparable with the chlorophyll content of four-week old kale samples grown under the same condition, as analyzed in our previous study [12]. In addition, in kale, levels of chlorophyll a, b, and total chlorophyll content did not significantly change under the NaCl treatment, which also may indicate their better stress tolerance. It was reported that under increased salinity, Brassica vegetables experienced a reduction in photosynthetic performance [16], which may influence the market value of these crops. Total chlorophyll content directly influences the green color of the Brassica vegetables, which is usually connected with freshness and quality of vegetables. According to our results, treatments with 50 and 100 mM NaCl increased chlorophyll content in white and Chinese cabbage, without visible damage and may possibly make these vegetables more attractive for consumers.
In Brassica leafy vegetables, three groups of specialized metabolites are associated with their health benefits: polyphenols, glucosinolates, and carotenoids [11], all of which we analyzed in our study. Polyphenols are the largest group of plant specialized metabolites, generally recognized as molecules involved in plant stress protection [30]. They are involved in plant defense against biotic stresses (insect attack and pathogen infection) and abiotic stresses (light, temperature, nutrient supplies, water availability, growing conditions, and UV radiation) [30,31]. Therefore, it is not surprising that salinity treatment, which is one of the abiotic stressors, influenced the polyphenolic compound level in our study. Salinity treatments caused an increase in all analyzed polyphenolic groups for all three Brassica leafy vegetables, but the most effective NaCl concentration depends on the species and group of specialized metabolites. It is known that the accumulation of polyphenolic compounds is genotype and even cultivar-dependent in Brassica crops [9,12,21]. Our previous study showed that salt-tolerant varieties (kale and white cabbage) accumulate higher levels of some phenolic acids and suffer less from metabolic stress disorders under salinity stress [17]. The trend that the highest total polyphenol level in Chinese cabbage and white cabbage was observed in plants treated with 100 mM NaCl, while in kale, it was measured upon 50 mM NaCl treatment, which is in accordance with Falcinelli et al. [18], who found that moderate salinity (25–50 mM NaCl) caused the highest relative increase in phenolic content in rapeseed sprouts. In another study on broccoli sprouts, 160 mM NaCl treatment significantly enhanced the level of total phenolic contents [19], while 100 mM NaCl treatment increased total phenol contents in radish sprouts [20]. Several authors reported that changes in polyphenolic content under salt stress are cultivar/genotype specific for Brassica vegetables such as broccoli [19,28,32] or cabbage [29], which is in parallel with our results. In addition to polyphenols, compounds in relation with the health benefits of cruciferous vegetables are glucosinolates, actually, their hydrolysis products [11]. In this study, we observed increased glucosinolate content under salt stress in leaves for all analyzed Brassica leafy vegetables where glucosinolate content increased with increased salt concentration. According to our results, glucosinolate content did not significantly change in roots under salt treatments. A similar trend was previously observed by Aghajanzadeh et al. [33], who reported that 50 mM and 100 mM NaCl treatments did not cause changes in total glucosinolate content in roots of 21-day-old Brassica rapa seedlings. Several authors reported a positive effect of increased salinity on glucosinolate content in Brassica crops; for example, Guo et al. [19] found that 160 mM NaCl treatment significantly increased the content of glucosinolate sulforaphane in broccoli sprouts, Yuan et al. [20] showed that 100 mM NaCl treatments significantly increased total glucosinolate content in radish sprouts, while Petretto et al. [34] reported low salt concentration (65 mM NaCl) as beneficial for glucosinolate accumulation in rocket. Brassica plants are also recognized as a good source of carotenoids, which are strong antioxidants and may have positive effects to human health upon consumption [11]. As opposed to other analyzed groups, in our study, salinity treatment did not influence carotenoid content. Similar findings were reported for the same species in the juvenile stage as sprouts [17]. Some other authors have also reported that salt stress does not change carotenoid level in castor bean (Ricinus communis L.) [35] and safflower (Carthamus tinctorius L.) [36] seedlings. On the other hand, with increasing salinity, a decrease in carotenoid content was published for salt tolerant Turkish taxa Salicornia prostrata Pall. and Suaeda prostrata Pall. subsp. prostrata [37] and for purslane (Portulaca oleracea L.) [38], while salt treatment increased carotenoid content in buckwheat (Fagopyrum esculentum M.) sprouts [1] and tomato (Lycopersicon esculentum Mill.) fruits [39].
As shown above, salt stress may influence the content of specialized metabolites, but may also influence the content of different elements, some of which may be important for human health. From the healthy eating point of view, accumulation of sodium in an edible part of the plants is not desirable. According to the Dietary Guidelines for Americans [40], the recommendation is to consume less than 2300 mg of sodium per day as part of a healthy eating pattern. Therefore, the amount of sodium in Brassica leaves should also be taken into account when using NaCl as an elicitor. As evident from our results for sodium content presented in Table 3, kale and white cabbage possess better mechanisms that prevent the influx of sodium from the root to leaves than Chinese cabbage. This is probably in line with the better salinity tolerance of kale and white cabbage in comparison with Chinese cabbage [16]. Brassica vegetables are considered as a good source of Ca, where Ca is highly bioavailable [38,39,40,41,42]. Kale is considered as a vegetable with high Ca content [43] in comparison with other Brassica vegetables [44]. This is evident from our results where kale showed a higher Ca content in the control leaves than white and Chinese cabbage. Salinity treatments caused a decrease in Ca content in the roots of all three species, while in the leaves, a decrease was observed for Chinese cabbage and kale. The highest decrease in Ca content was observed for kale and these results suggest that salinity treatment would not be recommended as an elicitor if we consider kale as a Ca source. A decrease in Ca and K under salinity treatments has already been published for kale and other leafy vegetables such as radicchio, curly endive, pac choi, tatsoi, cooking greens, mustard greens, spinach, and Swiss chard [45]. Besides Ca, according to the United States Department of Agriculture (USDA) Food Composition Databases [45] kale contains higher amounts of Mg than other Brassica vegetables [44]. This was not confirmed in our study, where white cabbage showed the highest Mg content in the control leaves, but concentration decreased due to salinity treatments, significantly under the 200 mM NaCl. The same trend was observed for kale leaves, while in the roots, Mg content decreased with increased salinity for all three species. In contrast, increased salinity caused an increase in the Mg content of Chinese cabbage leaves, similar to the results published by Grieve et al. [46], who reported an increase in Mg content under the salinity treatments for Brassica rapa subsp. narinosa.

5. Conclusions

In our study, we analyzed specialized metabolites and element levels in three Brassica leafy vegetables under salt stress. We confirmed that K+/Na+ ratio and proline are reliable biochemical markers of salt stress, indicating stress in plants before any visible damage. Based on this research, we may conclude that low (50 mM NaCl) and moderate (100 mM NaCl) salinity may elicit accumulation of the most specialized metabolites in selected Brassicas. However, as is evident from our results, maintaining ion homeostasis can be particularly challenging for plants under saline conditions, as the accumulation of toxic Na+ can influence the plant’s ability to control the accumulation of other ions, particularly those whose presence in edible parts may be beneficial for human health. Therefore, when considering the use of NaCl as an elicitor for specialized metabolite production, we need to take into account the possible loss of health beneficial effects, which may be decreased due to the decrease in elemental content.

Author Contributions

Conceptualization, D.Š. and B.S.-S.; Methodology, D.Š. and B.S.-S.; Investigation, I.L., D.Š., and B.S.-S.; Analysis, I.L., Writing—original draft preparation, D.Š. and B.S.-S.; Writing—review and editing, B.S.-S., D.Š., and I.L.; Visualization, I.L. and D.Š.; Supervision, B.S.-S.; Project administration, B.S.-S.; Funding acquisition, B.S.-S. All authors have read and agreed to the published version of the manuscript.

Funding

This work was supported by the Croatian Science Foundation (project no. IP-2014-09-4359) and by the Operational Program Competitiveness and Cohesion 2014–2020 and the European regional fund under specific Scheme “Scheme to strengthening applied research in proposing actions for climate change adaptation (project no. KK.05.1.1.02.0005).

Institutional Review Board Statement

Not applicable.

Acknowledgments

We thank Branimir Urlić and Mara Bogović for providing the kale and white cabbage seeds used in this research, respectively; Iva Pavlović for help with plant growth; and Niko Bačić for assistance with HR-ICP-MS.

Conflicts of Interest

The authors declare no conflict of interest.

References

  1. Lim, J.-H.; Park, K.-J.; Kim, B.-K.; Jeong, J.-W.; Kim, H.-J. Effect of salinity stress on phenolic compounds and carotenoids in buckwheat (Fagopyrum esculentum M.) sprout. Food Chem. 2012, 135, 1065–1070. [Google Scholar] [CrossRef]
  2. Thakur, M.; Bhattacharya, S.; Khosla, P.K.; Puri, S. Improving production of plant secondary metabolites through biotic and abiotic elicitation. J. Appl. Res. Med. Aromat. Plants 2019, 12, 1–12. [Google Scholar] [CrossRef]
  3. Sarker, U.; Oba, S. Response of nutrients, minerals, antioxidant leaf pigments, vitamins, polyphenol, flavonoid and antioxidant activity in selected vegetable amaranth under four soil water content. Food Chem. 2018, 252, 72–83. [Google Scholar] [CrossRef]
  4. Zia, M.; Zafar, H.; Gul, F.Z.; Abbasi, B.H.; Rizvi, Z.F.; Mannan, A. Synergistic influence of CuO nanoparticles and spectral lights transforms biomass, antioxidative response, and antioxidants in Brassica nigra. Plant. Cell Tiss. Organ. Cult 2021, in press. [Google Scholar] [CrossRef]
  5. Hassini, I.; Rios, J.J.; Garcia-Ibañez, P.; Baenas, N.; Carvajal, M.; Moreno, D.A. Comparative effect of elicitors on the physiology and secondary metabolites in broccoli plants. J. Plant Physiol. 2019, 239, 1–9. [Google Scholar] [CrossRef]
  6. Rouphael, Y.; Petropoulos, S.A.; Cardarelli, M.; Colla, G. Salinity as eustressor for enhancing quality of vegetables. Sci. Hortic. 2018, 234, 361–369. [Google Scholar] [CrossRef]
  7. Sarker, U.; Oba, S. Leaf pigmentation, its profiles and radical scavenging activity in selected Amaranthus tricolor leafy vegetables. Sci. Rep. 2020, 10, 18617. [Google Scholar] [CrossRef] [PubMed]
  8. Moyo, S.M.; Serem, J.C.; Bester, M.J.; Mavumengwana, V.; Kayitesi, E. African Green Leafy Vegetables Health Benefits Beyond Nutrition. Food Rev. Int. 2020, in press. [Google Scholar] [CrossRef]
  9. Šamec, D.; Pavlović, I.; Radojčić Redovniković, I.; Salopek-Sondi, B. Comparative analysis of phytochemicals and activity of endogenous enzymes associated with their stability, bioavailability and food quality in five Brassicaceae sprouts. Food Chem. 2018, 269, 96–102. [Google Scholar] [CrossRef]
  10. Punchay, K.; Inta, A.; Tiansawat, P.; Balslev, H.; Wangpakapattanawong, P. Nutrient and Mineral Compositions ofWild Leafy Vegetables of the Karen and Lawa Communities in Thailand. Foods 2020, 9, 1748. [Google Scholar] [CrossRef] [PubMed]
  11. Šamec, D.; Salopek-Sondi, B. Cruciferous (Brassicaceae) vegetables. In Nonvitamin and Nonmineral Nutritional Supplements; Nabavi, S.M., Sanches Silva, T., Eds.; Academic Press: Cambridge, MA, USA, 2019; pp. 195–202. [Google Scholar]
  12. Šamec, D.; Kruk, V.; Ivanišević, P. Influence of seed origin on morphological characteristics and phytochemicals levels in Brassica oleracea var. acephala. Agronomy 2019, 9, 502. [Google Scholar] [CrossRef] [Green Version]
  13. Sarker, U.; Oba, S. Augmentation of leaf color parameters, pigments, vitamins, phenolic acids, flavonoids and antioxidant activity in selected Amaranthus tricolor under salinity stress. Sci. Rep. 2018, 8, 12349. [Google Scholar] [CrossRef] [PubMed] [Green Version]
  14. Sarker, U.; Oba, S. Salinity stress enhances color parameters, bioactive leaf pigments, vitamins, polyphenols, flavonoids and antioxidant activity in selected Amaranthus leafy vegetables. J. Sci. Food Agric. 2018, 99, 2275–2284. [Google Scholar] [CrossRef]
  15. Sarker, U.; Islam, T.; Oba, S. Salinity stress accelerates nutrients, dietary fiber, minerals, phytochemicals and antioxidant activity in Amaranthus tricolor leaves. PLoS ONE 2018, 13, e0206388. [Google Scholar] [CrossRef] [PubMed] [Green Version]
  16. Pavlović, I.; Mlinarić, S.; Tarkowská, D.; Oklestkova, J.; Novák, O.; Lepeduš, H.; Vujčić Bok, V.; Radić Brkanac, S.; Strnad, M.; Salopek-Sondi, B. Early Brassica crops responses to salinity stress: A comparative analysis between Chinese cabbage, white cabbage and kale. Front. Plant Sci. 2019, 10, 450. [Google Scholar] [CrossRef] [PubMed] [Green Version]
  17. Linić, I.; Šamec, D.; Grúz, J.; Vujčić Bok, V.; Strnad, M.; Salopek Sondi, B. Involvement of Phenolic Acids in Short-Term Adaptation to Salinity Stress is Species-Specific among Brassicaceae. Plants 2019, 8, 155. [Google Scholar] [CrossRef] [Green Version]
  18. Falcinelli, B.; Sileoni, V.; Marconi, O.; Perretti, G.; Quinet, M.; Lutts, S.; Benincasa, P. Germination under Moderate Salinity Increases Phenolic Content and Antioxidant Activity in Rapeseed (Brassica napus var oleifera Del.) Sprouts. Molecules 2017, 22, 1377. [Google Scholar] [CrossRef] [Green Version]
  19. Guo, L.; Yang, R.; Wang, Z.; Guo, Q.; Gu, Z. Effect of NaCl stress on health-promoting compounds and antioxidant activity in the sprouts of three broccoli cultivars. Int. J. Food Sci. Nutr. 2014, 65, 476–481. [Google Scholar] [CrossRef]
  20. Yuan, G.; Wang, X.; Guo, R.; Wang, Q. Effect of salt stress on phenolic compounds, glucosinolates, myrosinase and antioxidant activity in radish sprouts. Food Chem. 2010, 121, 1014–1019. [Google Scholar] [CrossRef]
  21. Šamec, D.; Bogović, M.; Vincek, D.; Martinčić, J.; Salopek-Sondi, B. Assessing the authenticity of the white cabbage (Brassica oleracea var. capitata f. alba) cv. ‘Varaždinski’ by molecular and phytochemical markers. Food Res. Int. 2014, 60, 266–272. [Google Scholar] [CrossRef]
  22. Lichtenthaler, H.K.; Buschmann, C. Chlorophylls and carotenoids: Measurement and characterization by UV–VIS spectroscopy. In Current Protocols in Food Analytical Chemistry; John Wiley & Sons, Inc.: Hoboken, NJ, USA, 2001; p. 4. [Google Scholar]
  23. Aghajanzadeh, T.; Hawkesford, M.J.; Kok, L.J. The significance of glucosinolates for sulfur storage in Brassicaceae seedlings. Front. Plant Sci. 2014, 5, 704. [Google Scholar] [CrossRef] [Green Version]
  24. Fiket, Ž.; Mikac, N.; Kniewald, G. Mass fractions of forty-six major and trace elements, including rare earth elements, in sediment and soil reference materials used in environmental studies. Geostand. Geoanalytical. Res. 2016, 41, 123–135. [Google Scholar] [CrossRef]
  25. Keisham, M.; Mukherjee, S.; Bhatla, S.C. Mechanisms of sodium transport in plants—progresses and challenges. Int. J. Mol. Sci. 2018, 19, 647. [Google Scholar] [CrossRef] [PubMed] [Green Version]
  26. Negrao, S.; Schmockel, S.M.; Tester, M. Evaluating physiological responses of plants to salinity stress. Ann. Bot. 2017, 119, 1–11. [Google Scholar] [CrossRef] [Green Version]
  27. Boscaiu, M.; Lull, C.; Llinares, J.; Vicente, O.; Boira, H. Proline as a biochemical marker in relation to the ecology of two halophytic Juncus species. J. Plant Ecol. 2013, 6, 177–186. [Google Scholar] [CrossRef] [Green Version]
  28. Zaghdoud, C.; Alcaraz-Lopez, C.; Mota-Cadenas, C.; Martınez-Ballesta, M.C.; Moreno, D.A.; Ferchichi, A.; Carvajal, M. Differential Responses of Two Broccoli (Brassica oleracea L. var Italica) Cultivars to Salinity and Nutritional Quality Improvement. Sci. World J. 2012, 2012, 291435. [Google Scholar] [CrossRef] [Green Version]
  29. Sanoubar, R.; Cellini, A.; Veroni, A.M.; Spinelli, F.; Masia, A.; Antisari, L.V.; Orsini, F.; Gianquinto, G. Salinity thresholds and genotypic variability of cabbage (Brassica oleracea L.) grown under saline stress. J. Sci. Food Agric. 2016, 96, 319–330. [Google Scholar] [CrossRef] [PubMed]
  30. Šamec, D.; Karalija, E.; Šola, I.; Vujčić-Bok, V.; Salopek-Sondi, B. The Role of Polyphenols in Abiotic Stress Response: The Influence of Molecular Structure. Plants 2021, 10, 118. [Google Scholar] [CrossRef]
  31. Cartea, M.E.; Francisco, M.; Soengas, P.; Velasco, P. Phenolic Compounds in Brassica Vegetables. Molecules 2011, 16, 251–280. [Google Scholar] [CrossRef]
  32. Dominguez-Perles, R.; CarmenMartinez-Ballesta, M.; Riquelme, F.; Carvajal, M.; Garcia-Viguera, C.; Morenoa, D.A. Novel varieties of broccoli for optimal bioactive components under saline stress. J. Sci. Food Agric 2011, 9, 1638–1647. [Google Scholar] [CrossRef] [PubMed]
  33. Aghajanzadeh, T.A.; Reich, M.; Kopriva, S.; De Kok, L.J. Impact of chloride (NaCl, KCl) and sulphate (Na2SO4, K2SO4) salinity on glucosinolate metabolism in Brassica rapa. J. Agron Crop Sci. 2018, 204, 137–146. [Google Scholar] [CrossRef]
  34. Petretto, G.L.; Urgeghe, P.P.; Massa, D.; Melito, S. Effect of salinity (NaCl) on plant growth, nutrient content, and glucosinolates hydrolysis products trends in rocket genotypes. Plant Physiol. Biochem. 2019, 141, 30–39. [Google Scholar] [CrossRef] [PubMed]
  35. Li, G.; Wan, S.; Zhou, J.; Yang, Z.; Qin, P. Leaf chlorophyll fluorescence, hyperspectral reflectance, pigments content, malondialdehyde and proline accumulation responses of castor bean (Ricinus communis L.) seedlings to salt stress levels. Ind. Crop. Prod. 2010, 31, 13–19. [Google Scholar] [CrossRef]
  36. Gengmao, Z.; Yu, H.; Xing, S.; Shihui, L.; Quanmei, S.; Changhai, W. Salinity stress increases secondary metabolites and enzyme activity in safflower. Ind. Crop. Prod. 2015, 64, 175–181. [Google Scholar] [CrossRef]
  37. Akcin, A.; Yalcin, E. Effect of salinity stress on chlorophyll, carotenoid content, and proline in Salicornia prostrata Pall. and Suaeda prostrata Pall. subsp. prostrata (Amaranthaceae). Braz J. Bot. 2016, 39, 101–106. [Google Scholar] [CrossRef]
  38. Alam, A.; Juraimi, A.S.; Rafii, M.Y.; Hamid, A.A.; Aslani, F.; Alam, M.Z. Effects of salinity and salinity-induced augmented bioactive compounds in purslane (Portulaca oleracea L.) for possible economical use. Food Chem. 2015, 169, 439–447. [Google Scholar] [CrossRef]
  39. Pascale, S.D.; Maggio, A.; Fogliano, V.; Ambrosino, P.; Ritieni, A. Irrigation with saline water improves carotenoids content and antioxidant activity of tomato. J. Hortic. Sci. Biotechnol. 2001, 76, 447–453. [Google Scholar] [CrossRef]
  40. USDA, U.S. Department of Agriculture. Dietery guidelines for Americans 2015–2020, 8th ed. 2015. Available online: https://health.gov/dietaryguidelines/2015/resources/2015-2020_Dietary_Guidelines.pdf (accessed on 14 December 2020).
  41. Lucarini, M.; Canali, R.; Cappelloni, M.; Lullo, G.D.; Lombardi-Boccia, G. In vitro calcium availability from brassica vegetables (Brassica oleracea L.) and as consumed in composite dishes. Food Chem. 1999, 64, 519–523. [Google Scholar]
  42. Kamchan, A.; Puwastien, P.; Sirichakwal, P.P.; Kongkachuichai, R. In vitro calcium bioavailability of vegetables, legumes and seeds. J. Food Compos. Anal. 2004, 17, 311–320. [Google Scholar] [CrossRef]
  43. Armesto, J.; Gomez-Limia, L.; Carballo, J.; Martinez, S. Effects of different cooking methods on the antioxidant capacity and flavonoid, organic acid and mineral contents of Galega Kale (Brassica oleracea var. acephala cv. Galega). Int. J. Food Sci. Nutr. 2019, 70, 136–149. [Google Scholar] [CrossRef]
  44. Šamec, D.; Urlić, B.; Salopek-Sondi, B. Kale (Brassica oleracea var. acephala) as a superfood: Review of the scientific evidence behind the statement. Crit. Rev. Food Sci. Nutr. 2019, 59, 2411–2422. [Google Scholar] [CrossRef] [PubMed]
  45. U.S Department of Agriculture, Agricultural Research Service. FoodData Central. 2019. Available online: https://fdc.nal.usda.gov/ (accessed on 20 December 2020.).
  46. Grieve, C.M.; Shannon, M.C.; Poss, J.A. Mineral Nutrition of Leafy Vegetable Crops Irrigated with Saline Drainage Water. J. Veg. Crop. Prod. 2001, 7, 37–47. [Google Scholar] [CrossRef]
Figure 1. K+/Na+ ratio in Brassica leafy vegetables (Chinese cabbage, white cabbage, and kale) leaves and roots upon salinity treatments. Data labeled with different letters differed significantly at p < 0.05. Statistical analysis was performed among three Brassica leafy vegetables, separately for leaves (capital letters) and roots (small letters).
Agronomy 11 00361 g001
Figure 2. Proline level in Brassica leafy vegetables (Chinese cabbage, white cabbage, and kale) leaves and roots upon salinity treatments. Data labeled with different letters differed significantly at p < 0.05. Statistical analysis was performed among the three Brassica leafy vegetables, separately for leaves (capital letters) and roots (small letters).
Agronomy 11 00361 g002
Table 1. Chlorophyll contents in Brassica leafy vegetables (Chinese cabbage, white cabbage, and kale) upon salinity treatments (0–200 mM NaCl). Data labeled with different letters (a–e) differed significantly at p < 0.05 in each column.
Brassica
Leafy Vegetables
NaCl (mM)Chlorophyll aChlorophyll bTotal Chlorophylls
µg g−1 dwµg g−1 dwµg g−1 dw
Chinese cabbage04.67 ± 0.46 cd4.30 ± 0.53 abc8.97 ± 0.95 cd
505.92 ± 0.25 bc4.91 ± 0.11 ab10.83 ± 0.30 abc
1007.20 ± 0.20 ab5.04 ± 0.11 a12.24 ± 0.10 a
2003.71 ± 024 d4.55 ± 0.56 abc8.26 ± 0.60 de
White cabbage04.69 ± 0.40 cd2.17 ± 0.87 de6.86 ± 0.76 ef
506.31 ± 0.40 ab3.22 ± 0.57 cd9.52 ± 0.20 cd
1006.84 ± 0.45 ab3.71 ± 0.78 abc10.55 ± 0.34 abc
2003.66 ± 0.54 d1.60 ± 0.33 e5.26 ± 0.86 f
Kale07.21 ± 0.19 a3.50 ± 0.48 bcd10.71 ± 0.66 abc
507.04 ± 0.45 ab3.51 ± 0.26 bcd10.54 ± 0.59 abc
1006.77 ± 0.31 ab3.50 ± 0.26 bcd10.27 ± 0.20 bc
2007.33 ± 0.88 a4.23 ± 0.41 abc11.56 ± 1.26 ab
Table 2. Groups of specialized metabolites measured in Brassica leafy vegetables: Chinese cabbage, white cabbage, and kale, upon salinity treatments (0–200 mM NaCl). Data labeled with different letters differed significantly at p < 0.05 for each particular group of specialized metabolites among the three species. Statistical analysis was performed in each column, separately for leaves (capital letters) and roots (small letters).

NaCl mMTotal
Phenols
mg GAE g−1 dw
Total
Phenolic Acids
mg CAE g−1 dw
Total
Flavonoids
mg CE g−1 dw
Total
Flavanols
µg CE g−1 dw
Total
Glucosinolates
mg sin g−1 dw
Carotenoids
µg g−1 dw
leavesChinese cabbage019.16 ± 0.63 G3.67 ± 0.05 BCD5.36 ± 0.08 C43.48 ± 2.84 EF41.79 ± 2.52 G0.35 ± 0.06 C
5022.83 ± 0.18 D3.86 ± 0.22 AB5.93 ± 0.16 AB53.17 ± 1.82 BC48.21 ± 1.34 F0.70 ± 0.05 BC
10024.93 ± 0.25 C4.17 ± 0.10 A5.09 ± 0.03 CD41.20 ± 2.03 F49.92 ± 1.88 EF0.74 ± 0.09 BC
20020.71 ± 0.34 F3.38 ± 0.07 DE5.74 ± 0.13 B50.44 ± 2.97 BCD60.77 ± 0.56 BC0.27 ± 0.07 C
White cabbage021.90 ± 0.31 E3.55 ± 0.10 BCD4.54 ± 0.07 E54.58 ± 1.83 AB54.20 ± 2.85 DE1.61 ± 0.38 A
5018.83 ± 0.27 G3.15 ± 0.17 E3.96 ± 0.06 F52.88 ± 2.70 BC56.63 ± 1.21 CD1.65 ± 0.33 A
10024.34 ± 0.29 C3.73 ± 0.14 BC3.27 ± 0.07 G41.12 ± 2.20 F60.51 ± 1.52 BC1.60 ± 0.32 A
20022.97 ± 0.22 D3.13 ± 0.09 E4.97 ± 0.10 D48.75 ± 1.83 B-E70.23 ± 1.14 A1.28 ± 0.06 AB
Kale026.14 ± 0.22 B3.79 ± 0.084 B5.24 ± 0.10 CD60.56 ± 2.80 A46.61 ± 0.95 FG1.71 ± 0.30 A
5030.50 ± 0.27 A3.58 ± 0.08 BCD6.15 ± 0.06 A53.30 ± 1.61 BC56.59 ± 2.18 CD1.75 ± 0.15 A
10024.63 ± 0.06 C3.85 ± 0.04 AB5.09 ± 0.13 CD47.68 ± 2.45 C-F60.64 ± 1.31 BC1.97 ± 0.25 A
20023.03 ± 0.30 D3.45 ± 0.04 CDE4.58 ± 0.13 E45.19 ± 2.44 DEF65.02 ± 0.71 B1.81 ± 0.36 A
rootsChinese
cabbage
05.59 ± 0.30 g0.74 ± 0.06 abc0.79 ± 0.05 cde19.44 ± 2.49 ef27.08 ± 1.32 efND
508.13 ± 0.24 e0.74 ± 0.14 abc0.73 ± 0.12 de19.88 ± 2.54 ef29.25 ± 0.87 b-eND
10011.39 ± 0.05 bc0.85 ± 0.15 ab1.00 ± 0.15 bc18.14 ± 1.86 f28.68 ± 0.80 cdeND
2009.53 ± 0.32 d0.91 ± 0.07 a0.65 ± 0.04 e16.75 ± 2.48 f30.14 ± 1.13 bcdND
White
cabbage
010.81 ± 0.19 c0.64 ± 0.08 bc1.36 ± 0.07 a65.04 ± 2.84 a27.84 ± 1.32 defND
5011.40 ± 0.20 b0.53 ± 0.07 c0.92 ± 0.08 cd52.95 ± 1.82 b30.63 ± 0.78 bcND
1008.17 ± 0.10 e0.82 ± 0.04 ab1.38 ± 0.06 a33.85 ± 2.73 c31.82 ± 0.75 bND
2007.44 ± 0.12 f0.87 ± 0.05 ab0.76 ± 0.03 de26.02 ± 1.90 de35.12 ± 0.39 aND
Kale
012.02 ± 0.17 a0.70 ± 0.07 abc1.16 ± 0.03 ab70.50 ± 1.59 a22.90 ± 0.67 gND
509.96 ± 0.12 d0.52 ± 0.09 c1.01 ± 0.06 bc49.59 ± 2.31 b25.93 ± 0.97 fND
1009.52 ± 0.26 d0.64 ± 0.05 bc0.76 ± 0.09 de27.34 ± 2.45 cd26.99 ± 0.70 efND
2008.59 ± 0.08 e0.67 ± 0.10 abc0.88 ± 0.08 cde22.91 ± 2.98 def28.31 ± 0.96 c-fND
Table 3. Macro- and micro-elements in Brassica leafy vegetables leaves and root upon salinity treatments (0–200 mM NaCl). Data labeled with different letters differed significantly at p < 0.05 for each particular element among the three species, separately for leaves (small letters) and roots (capital letters).
NaCl
mM
Na
mg g−1 dw
K
mg g−1 dw
Ca
mg g−1 dw
Mg
mg g−1 dw
Mn
µg g −1 dw
Fe
µg g −1 dw
Cu
µg g−1 dw
Zn
µg g−1 dw
leavesChinese
cabbage
01.16 ± 0.03 G57.81 ± 0.72 A14.62 ± 0.17 BC12.29 ± 0.03 CDE244.96 ± 6.85 B 121.06 ± 0.99 AB5.51 ± 0.06 B37.45 ± 0.50 B
508.64 ± 0.39 D47.84 ± 2.40 B12.91 ± 0.80 CD10.85 ± 0.78 E188.64 ± 13.25 DE136.61 ± 10.12 A7.86 ± 0.47 A29.62 ± 4.81 BC
1009.71 ± 0.41 D45.90 ± 0.61 BC13.77 ± 0.29 CD12.35 ± 0.26 CDE206.55 ± 0.32 CD 123.55 ± 3.89 AB5.55 ± 0.08 B25.67 ± 2.58 BCD
20033.14 ± 0.01 A38.10 ± 0.52 DE12.85 ± 0.01 CD13.30 ± 0.05 CD189.40 ± 1.80 DE 108.14 ± 2.03 ABC4.95 ± 0.05 BC21.65 ±1.76 CD
White
cabbage
03.04 ± 0.07 F40.85 ± 1.94 CD13.48 ± 0.14 CD17.40 ± 0.34 A245.16 ± 4.31 B 50.15 ± 2.34 D3.56 ± 0.08 EF21.96 ±1.90 CD
508.52 ± 0.26 D35.30 ± 1.97 DEF16.16 ± 0.62 AB15.99 ± 0.22 AB287.93 ± 3.88 A 57.09 ± 5.07 D3.47 ± 0.11 EF24.13 ± 2.03 BCD
10016.06 ± 0.20 C41.96 ± 0.12 BCD9.79 ± 0.19 E15.89 ± 0.62 AB190.60 ± 1.41 DE 65.17 ± 12.04 D3.98 ± 0.14 DE24.51 ± 2.22 BCD
20022.67 ± 0.47 B36.13 ± 0.84 DEF13.16 ± 0.36 CD13.98 ± 0.45 BC227.52 ± 8.09 BC 64.78 ± 0.35 D3.02 ± 0.16 FG57.73 ± 3.50 A
Kale02.29 ± 0.04 FG39.12 ± 0.12 CDE17.78 ± 0.36 A13.80 ± 0.40 BC315.63 ± 9.12 A 98.95 ± 2.29 BC4.92 ± 0.13 BCD26.01 ± 0.82 BCD
503.03 ± 0.14 F29.53 ± 0.76 FG9.38 ± 0.16 E12.33 ± 0.23 CDE150.53 ± 0.39 F 58.62 ± 0.46 D2.65 ± 0.05 FG15.56 ± 0.76 D
1005.88 ± 0.26 E32.79 ± 0.81 EFG12.13 ± 0.47 D13.49 ± 0.44 C165.53 ± 2.57 EF 78.55 ± 5.72 CD4.02 ± 0.15 CDE22.44 ±3.58 CD
2009.20 ± 0.08 D26.08 ± 1.18 G7.00 ± 0.05 F11.18 ± 0.14 DE104.61 ± 1.92 G 59.16 ± 0.89 D2.41 ± 0.06 G15.95 ±1.43 CD
roots
Chinese
cabbage
01.467 ± 0.01 e64.02 ± 1.05 a3.36 ± 0.05 a3.68 ± 0.09 b680.35 ± 12.83 b244.52 ± 5.44 bc32.69 ± 0.56 de50.29 ± 4.49 a
5015.96 ± 0.03 de50.48 ± 0.83 c2.56 ± 0.09 b2.56 ± 0.00 d769.86 ± 5.37 a 305.79 ± 1.27 ab44.27 ± 0.42 bcd49.12 ± 2.04 ab
10037.21 ± 0.45 bc32.15 ± 0.16 e2.27 ± 0.02 b2.46 ± 0.04 d92.09 ± 1.75 d 236.26 ± 2.55 c48.23 ± 0.87 bc36.16 ± 1.46 cd
20079.30 ± 0.04 a13.62 ± 0.21 f1.26 ± 0.04 cde1.62 ± 0.02 fg21.63 ± 0.05 h168.60 ± 1.50 de 39.49 ± 0.38 cd23.63 ± 0.17 e
White cabbage02.48 ± 0.02 e44.67 ± 1.38 d1.32 ± 0.03 cd4.48 ± 0.03 a48.32 ± 0.42 fg 143.07 ± 1.76 e23.94 ± 0.13 e 32.45 ± 1.48 cde
5021.07 ± 0.34 d31.45 ± 1.26 e1.28 ± 0.05 cde2.40 ± 0.06 d75.77 ± 2.65 de 135.04 ± 6.94 e29.74 ± 0.96 de 36.19 ± 1.99 cd
10051.32 ± 0.21 b3.05 ± 0.04 g0.52 ± 0.05 g0.72 ± 0.01 h30.55 ± 0.20 gh 267.33 ± 6.11 abc41.63 ± 0.56 bcd 21.5 1 ± 1.60 e
20070.12 ± 0.61 a4.34 ± 0.06 g0.89 ± 0.04 efg0.89 ± 0.01 h14.83 ± 0.17 h 328.99 ± 1.72 a79.34 ± 0.39 a 38.38 ± 0.48 bc
Kale
01.52 ± 0.04 e56.41 ± 0.98 b2.50 ± 0.04 b3.16 ± 0.09 c152.88 ± 3.98 c 158.67 ± 1.35 de22.44 ± 0.56 e 39.17 ± 0.18 abc
5024.73 ± 0.72 cd12.56 ± 0.14 f1.35 ± 0.07 c2.26 ± 0.01 de38.92 ± 0.85 fgh 136.11 ± 4.17 e34.87 ± 1.37 cde 25.45 ± 0.12 de
10042.54 ± 1.65 b9.86 ± 0.42 f1.00 ± 0.03 def1.87 ± 0.05 ef57.75 ± 1.32 ef 155.61 ± 2.81 de49.08± 0.92 bc 26.08 ± 2.29 de
20068.80 ± 9.48 a4.35 ± 0.70 g0.73 ± 0.17 fg1.33 ± 0.20 g26.18 ± 4.07 gh213.47 ± 38.01 cd54.83± 8.64 b 22.77 ± 3.34 e
Publisher’s Note: MDPI stays neutral with regard to jurisdictional claims in published maps and institutional affiliations.

