Article

Germination and Emergence Responses of Alfalfa, Triticale and Quinoa Irrigated with Brackish Groundwater and Desalination Concentrate

1
Plant and Environmental Sciences Department, New Mexico State University, P.O. Box 30003, MSC 3Q, Las Cruces, NM 88003, USA
2
Economics, Applied Statistics & International Business Department, New Mexico State University, Las Cruces, NM 88003, USA
3
Entomology, Plant Pathology, and Weed Science, New Mexico State University, Las Cruces, NM 88003, USA
*
Author to whom correspondence should be addressed.
Agronomy 2020, 10(4), 549; https://doi.org/10.3390/agronomy10040549
Submission received: 18 March 2020 / Revised: 6 April 2020 / Accepted: 7 April 2020 / Published: 10 April 2020
(This article belongs to the Special Issue How Plants Perceive Salt during the Irrigation)

Abstract

:
Increasing human population has raised the demand for food and forage production for a secure future. Current agriculture is challenged by increasing salinity and decreasing vegetation, especially in the arid and semi-arid regions of the world. Western United States, especially, New Mexico is confronting continued drought, sodic soils, and degrading rangelands. Groundwater is increasingly used to supplement surface water for irrigation, despite being brackish, with an EC greater than 3 dSm−1. One way to supplement irrigation water supply is to desalinize brackish groundwater using a reverse osmosis (RO) process and utilize the RO concentrate to irrigate food and forage crops. The objective of this study were to determine the germination and emergence of three species, alfalfa (Medicago sativa-VNS (variety not stated)), triticale (×Triticosecale (VNS)), and quinoa (Chenopodium californicum-hand selected from native stand in S. California), when irrigated with brackish and RO concentrate waters. A germination experiment was conducted with alfalfa, triticale, and quinoa for 20 days in growth chambers set at their optimum germination temperatures of 29/18 °C, 17/7 °C, and 17/7.2 °C day/night, respectively, with a 12-hour photoperiod. An emergence experiment was conducted with the same species under controlled conditions in a greenhouse. In both the experiments, seeds were irrigated with four irrigation water salinity treatments (EC 0.7 dSm−1 (tap water as control)), 4.0 dSm−1 brackish groundwater (BGW), 8.0 dSm−1 reverse osmosis concentrate (RO), and 10.0 dSm−1 (BGW + NaCl) irrigation. Germination %, and emergence %, mean germination and emergence time, germination and emergence index, Timson’s index and Timson’s modified index were calculated. Results showed triticale had the highest germination % (80.5% as soils main effect and 87.84 % as species main effect irrespective of salinity) and emergence % (91.25% with control and BGW, 87.19% with RO) while quinoa was the most sensitive to salinity. Sand soil was favorable promoting higher germination up to 8 dSm−1 and clay soil promoted good emergence in alfalfa and triticale. The mean germination and emergence time was the shortest for triticale followed by alfalfa and longest for quinoa. This clearly demonstrates triticale as a promising salt tolerant forage species that can be cultivated in dry and degraded rangelands.

1. Introduction

Soil salinity is one of the major environmental constrains for crop production, especially in arid and semi-arid regions of the world [1]. With increasing human population and industries, the demand for land and water use has worsened. Dry and arid regions are expanding often characterized by low rainfall, high evaporation, and low quality groundwater. In addition, rangeland soil and vegetation is degrading which has a huge implication on groundwater availability and its quality [2]. Some parts of United States, especially the southwestern states, such as New Mexico has severely degraded rangelands and saline groundwater. Approximately 75% of the available groundwater is saline with an electrical conductivity (EC) > 3 dSm−1 [3,4] and are predicted to get much drier in future [5]. In these regions, despite higher salinity of groundwater, more often, it is increasingly being used to supplement shortage of surface water for irrigation.
In this context, where water is becoming a scarce commodity, desalination and beneficial reuse of brackish groundwater and reverse osmosis concentrates to grow food and forage crops on arid and semi-arid rangelands is gaining importance with researchers. Instead of disposing the concentrated saline water into the evaporation tanks, where the valuable water is lost by evaporation, leaving behind the salts, this water can be utilized for growing crops. Though the wastewater application to grow crops is yet an understudied area of research, there is evidence from some studies that RO concentrate can be used to irrigate salt-tolerant species in water-scarce arid and desert regions [6,7].
Plants respond to salinity differently. Halophytes can survive and grow in harsh saline conditions, and display stimulated growth due to salinity [8,9,10]. They have a unique ability to accumulate sodium ions, avoid water deficit and excess ion conditions. Glycophytes are sensitive to salts in the irrigation water and soil. These salts can potentially harm seed germination, emergence, growth and productivity. Maas [11] reported that many salt tolerant crops experience delay in the germination process when subjected to salinity. Shalaby et al. [12] and Almansouri et al. [13] found that salinity tolerance differs at various life stages of a plant growth. Ungar and Khan [14,15] reported halophytes to be salt sensitive, particularly during germination and seedling emergence stages. In addition to salinity [16,17], other environmental factors such as light [18,19,20] and temperature [21] also influence germination and emergence of a species. Baskin et al. [22] reported, optimum temperature for germination of halophytes ranged between 5 to 35/25 °C and the mean optimum temperature of 21 °C. Mueller [23] found alfalfa seeds germinate best at soil temperatures 18–29 °C. If the temperature drops below 4 °C, it takes more time to germinate. Under optimum conditions, alfalfa seeds are reported to emerge rapidly, but at sub-optimal temperatures alfalfa germination and root growth rates differ [24,25,26]. Alfalfa seedlings at 25 °C, produced roots (3 roots) with good length (5 mm) while at 15 °C–20 °C produced no laterals [24]. Based on the literature, the optimum temperatures for germination ranged between 29–18 °C for alfalfa, 17–7 °C for triticale, and 17–7.2 °C day/night for quinoa respectively.
For effective utilization of wastewater to grow halophytes successfully, a better understanding of site-specific germination and emergence responses of these species is needed. Our current research explores germination and emergence of two forage crops, alfalfa (Medicago sativa), and triticale (× Triticosecale) and one food crop, quinoa, (Chenopodium californicum), at their optimum temperatures of germination and emergence, when irrigated with BGW and RO concentrate.
Alfalfa is an important high value perennial, leguminous forage crop from the pea family Fabaceae. It has a deep tap root system with nitrogen-fixing bacteria, Rhizobium meliloti in its root nodules. The species is known for high productivity, feed value, and moderate sensitivity to salt damage during emergence [27,28,29,30]. Triticale is a new small grain synthetic hybrid forage crop produced by crossing wheat and rye. It belongs to grass family Poaceae with extensive fibrous root system that enables it to mine soil more efficiently in poor soil fertility conditions. It is known for higher yields on marginal lands, a good source of protein, and tolerant to drought and biotic stresses [31,32]. Quinoa is a genetically diverse, herbaceous annual, Andean crop belonging to Amaranth family. It is known for its high nutrition and health benefits. The species has a tap root system that is highly branched enabling it to adapt to various agro-climatic systems including drought, salinity, and nutrient poor soils [33,34,35,36]. We hypothesized that alfalfa, triticale, and quinoa will remain unaffected with increasing salinity and continue to germinate and emerge at their optimum temperatures in sand and clay soils.

2. Materials and Methods

Alfalfa seeds were purchased from Curtis & Curtis Inc., in Clovis, NM, triticale seeds from Helena Chemical Company, Mesquite, NM and quinoa from S & S Seeds Inc., in Carpinteria, CA. Two lots of each species were obtained for the study. Seeds were stored under cooler temperatures to avoid any fungal infection or pests. Two soil types chosen were sand and clay. Sand soil was collected from West Mesa, Las Cruces, NM and clay from NMSU Leyendecker Plant Science Centre, Mesilla, NM. Knowledge of soil physiochemical properties is considered essential to understand whether the soil structure is suitable for germination and emergence of the seeds, growth of the roots, storage and supply of water, nutrients, gases and heat for the plant growth and fertility (Table 1).
BGW and RO water were obtained from Brackish Groundwater National Desalination Research Facility (BGNDRF) located in Tularosa Basin in Alamogordo, New Mexico. Four water treatments were selected; tap water (EC = 0.7 dSm−1), BGW (EC = 4 dSm−1), RO (EC = 8 dSm−1), and BGW + NaCl (EC = 10 dSm−1) irrigation water. RO irrigation water was calcium dominant, BGW + NaCl irrigation water was prepared in the laboratory by adding appropriate amount of NaCl to BGW to raise EC to 10 dSm−1 (Table 2). Care was taken to thoroughly mix NaCl until it is dissolved completely.

2.1. Germination Experiments

Germination experiments with four replications for each species and irrigation water, each of twenty days’ duration (last week of March to 1st week of April and end of July to 1st week of Aug 2017) were carried out using two germination chambers “Percival Intellus control system.” Petri plates of 25 × 150 mm diameter, each filled with 20 gm soil were randomly arranged in the germination chamber. Twenty-five seeds were placed at half-an-inch depth inside the soil in each Petri plate and irrigated with respective irrigation water treatments. One germination chamber with alfalfa was set at 25/32 °C (day/night), while the other with ×Triticosecale and quinoa was set at 7/17 °C, with a 12-hour photo period. Photosynthetic photon flux density was approximately at 30 mol µm−2 s−1. The Petri plates were checked daily for their germination for 20 days. Seeds were considered germinated with the protrusion of the embryo from the soil. Two experiments were run with each experiment using two germination chambers, where one germination chamber contained one species and another germination chamber had two of the other species, each chamber was set at their optimum temperatures of germination.

2.2. Emergence Experiment

Two simultaneous sets of emergence experiments with four replications for each species and irrigation water, each of thirty days’ duration (1st week of June to 1st week of July and mid-July to mid-August 2017) were carried out in a greenhouse at Fabian Garcia Science Center of New Mexico State University. Small square injection molded 5” pots were packed with 350 g soil. Prior to packing, soil was air-dried, sieved through 4 mm sieve, and autoclaved at 80 °C for 4 hrs. The perforated bottom of each pot was covered with cheese cloth to prevent soil loss followed by 10 g of gravel spread on top of it to allow free drainage. Soil was added in increments to allow for uniform packing in the pot. Initially, soils were washed with tap water 3 to 4 times until the EC of leachate reached below 1 dSm−1. The pots were then irrigated with the treatment waters to raise the salinity to the desired levels. Each pot was divided in half with lot 1 and lot 2 seeds separated by distance and sown at 1½ cm deep inside the soil. The pots were sub-irrigated when the soil water content depleted to about 30% of the saturated water content by weight [37]. Initially, all the pots were sub-irrigated to saturation with respective irrigation water treatments and their weights recorded. At an interval of every two days, the pots were weighed to check if they reached 30% of saturated water content. Once reached, the pots were irrigated again to saturation and their weights recorded. Plants were considered emerged with the beginning of vegetative growth from the cotyledons. Emergence data were recorded daily for 30 days after sowing.

2.3. Germination and Emergence Variables Computation

The effect of irrigation water treatment on germination of these species was evaluated using the parameters germination %, mean germination time (MGT), germination index (GI), Timson’s index (TI), and Timson’s modified index (Tmod). These parameters were calculated using the following equations [38].
Germination   % = ( n i ) S 100
GT = ( n i t i ) / ( n i )
GI = | ( 20 t i ) n i | / S
TI = ( g i ( K j ) )
Tmod = T ( g i )
Similarly, the effect of irrigation water treatment on emergence of these species was evaluated using the parameters emergence %, mean emergence time (MET), emergence index (EI), Timson’s Index (TI), and Timson’s modified index (Tmod)
Emergence   % = ( n i ) S 100
MET = ( n i t i ) / ( n i )
EI = | ( 20 t i ) n i | / S
TI = ( g i ( K j ) )
Tmod = T / ( g i )
where, ni represents the number of newly germinated/emerged seeds on day I;
S represents total number of seeds in an experimental unit (germinated/emerged/viable/non-germinated/non emerged);
ti is the number of days from the start of the experiment to day I;
20 days were spent in the germination experiment test plus 1, while 30 days were spent in the emergence experiment test plus 1;
gi is the number of newly germinated/emerged seeds in time interval I;
K is the total number of time intervals (days), and j = I − 1.
The above parameters calculate the total percentage of viable seeds in a seed sample that complete the germination (germination %) or emergence process (emergence %), measures the time taken by the seeds to germinate or emerge (GI/EI and TI), and also gives a time measurement that accounts for the total number of seeds that germinated/ emerged within the Petri plate/pot (MGT/MET and Tmod). According to Goodchild et al. [39], TI is the sum of partial germination and measures germination rate with precision, while Tmod minimizes the effect of final germination %.

2.4. Statistical Analysis

Data were analyzed using SAS version 9.4 (TS1M3) (SAS Institute Inc., Cary, NC, USA, 2002–2012) and significance was defined at α ≤ 0.05.
For the germination experiment, each of the five response variables (germination %, mean germination time, germination index, timson’s index and Tmod) were analyzed using a mixed model with fixed factors soils (sand and clay), salinity (Tap water (< 0.7 dSm−1), 4 dSm−1, 8 dSm−1, 10 dSm−1), species (alfalfa, triticale, quinoa) and lots within species, and all interactions among these factors. Several mixed models were run and the model with the smallest AICC (small sample size corrected Akaike information criterion) was chosen, which accounted for the random experiment, germination chamber effect, and different variances among the species. All final models chosen included, random effects for germination chamber vs. experiment combinations; soil × salinity × species × germination chamber vs. the experiment.
Additionally, some of the models included random effects for experiment, or lots within species × soils × salinity × germination chamber vs. experiment combination, and some models fitted separate residual variances to the species or separate species variances to the soil × salinity × species × germination chamber vs. experiment effects. The focus was on soils, salinity, species, and their interactions. The lots were of secondary interest and hence were averaged across, for the purpose of core of analysis.
Salinity and species comparisons were made with two soil types, just to see how consistently the salinity affects. The DDFM = KR option was used to compute denominator degrees of freedom and adjust standard errors. For significant effects, involving soils, salinity, or species, least squares means and model-based standard errors were used in pairwise comparisons to obtain means separation.
Similar to the germination experiment, emergence data were analyzed using mixed models for all five response variables (emergence %, mean emergence time, emergence index, timson’s index and Tmod). The basic model comprised of fixed effects of interaction between soils, salinity, species (soils × salinity × species) and lots within the species (lots (species)); soils and lots within the species (lots (species)). All mixed models used in the emergence experiment reflected the basic split-plot design with lots as the split-plot factor, accounting the random effects for the experiment and the whole plots, which are individual pots, identified by reps (soils × salinity × species × experiment). Several mixed models that included additional random effects, accounting for correlations among groups within an experimental run or non-constant species residual variances were considered. The covariance structure with lowest AICC was chosen. For emergence % there were no missing cells. Soils × salinity × species term was replaced with main effects and its interactions. There were missing cells for mean emergence time (MET), emergence index (EI), timson’s index (TI), and Timson’s modified index (Tmod) of quinoa. Contrasts using the complete data structure corresponding to soils, species, and the lowest three salinity levels were used to determine the differences among treatment groups. For EI and TI none of the soil, salinity, or species were significant. Salinity x species means are used to increase the power of salinity and species comparisons.

3. Results

3.1. Germination Experiments

3.1.1. Germination Percent

Germination % showed soils and species significance. The data analysis for germination % showed soils (p = 0.028) and species (p = 0.047) main effects as well as lots × soils (species) effects (Table 3). Germination % was 11.27 (±4.80) points higher in sand soil than in clay soil (Figure 1a). Among all the three species triticale displayed the highest germination % of 87.84% which was 18.75 (±5.87) points higher than quinoa and 20.19 (±7.87) points higher than alfalfa (Figure 1b).

3.1.2. Germination Index (GI), Timson’s Index (TI), and Timson’s Modified Index (Tmod)

GI and TI showed soils and species significance while Tmod showed salinity and species significance. Germination index was estimated to be 1.74 (±0.69) points higher in sand soil than clay soil (Table 4), probably showing sand soil is more suitable for alfalfa, triticale, and quinoa germination. All three species were significantly different from each other with the highest GI index for triticale, followed by alfalfa and quinoa. Triticale GI was 3.11 (±1.12) points higher than alfalfa and alfalfa’s GI was 5.28 (±1.09) points higher than quinoa (Table 4).
Timson’s Index was estimated to be 46.32 (±18.52) points higher and significantly different in sand soil than in clay soil (Table 4). Similar to GI, TI of all three species were significantly different from each other with the highest TI index of 396.73 for triticale, followed by alfalfa (313.83) and quinoa (182.28). Triticale TI was 82.91 (±24.41) points higher than alfalfa and alfalfa’s TI was 131.55 (±29.16) points higher than quinoa (Table 4).
Tmod-salinity × species interaction was only significantly different for quinoa irrespective of salinity and significant at the highest salinity irrespective of the species. Tmod estimates for quinoa decreased steadily with increasing salinity and reached the lowest (7.96) at 10 dSm−1. Means separation corresponding to salinity main effect suggests salinity at 10 dSm−1 differed from the control (0.7 dSm−1) and at 4 dSm−1 salinity levels (Table 5).

3.1.3. Mean Germination Time (MGT in Days)

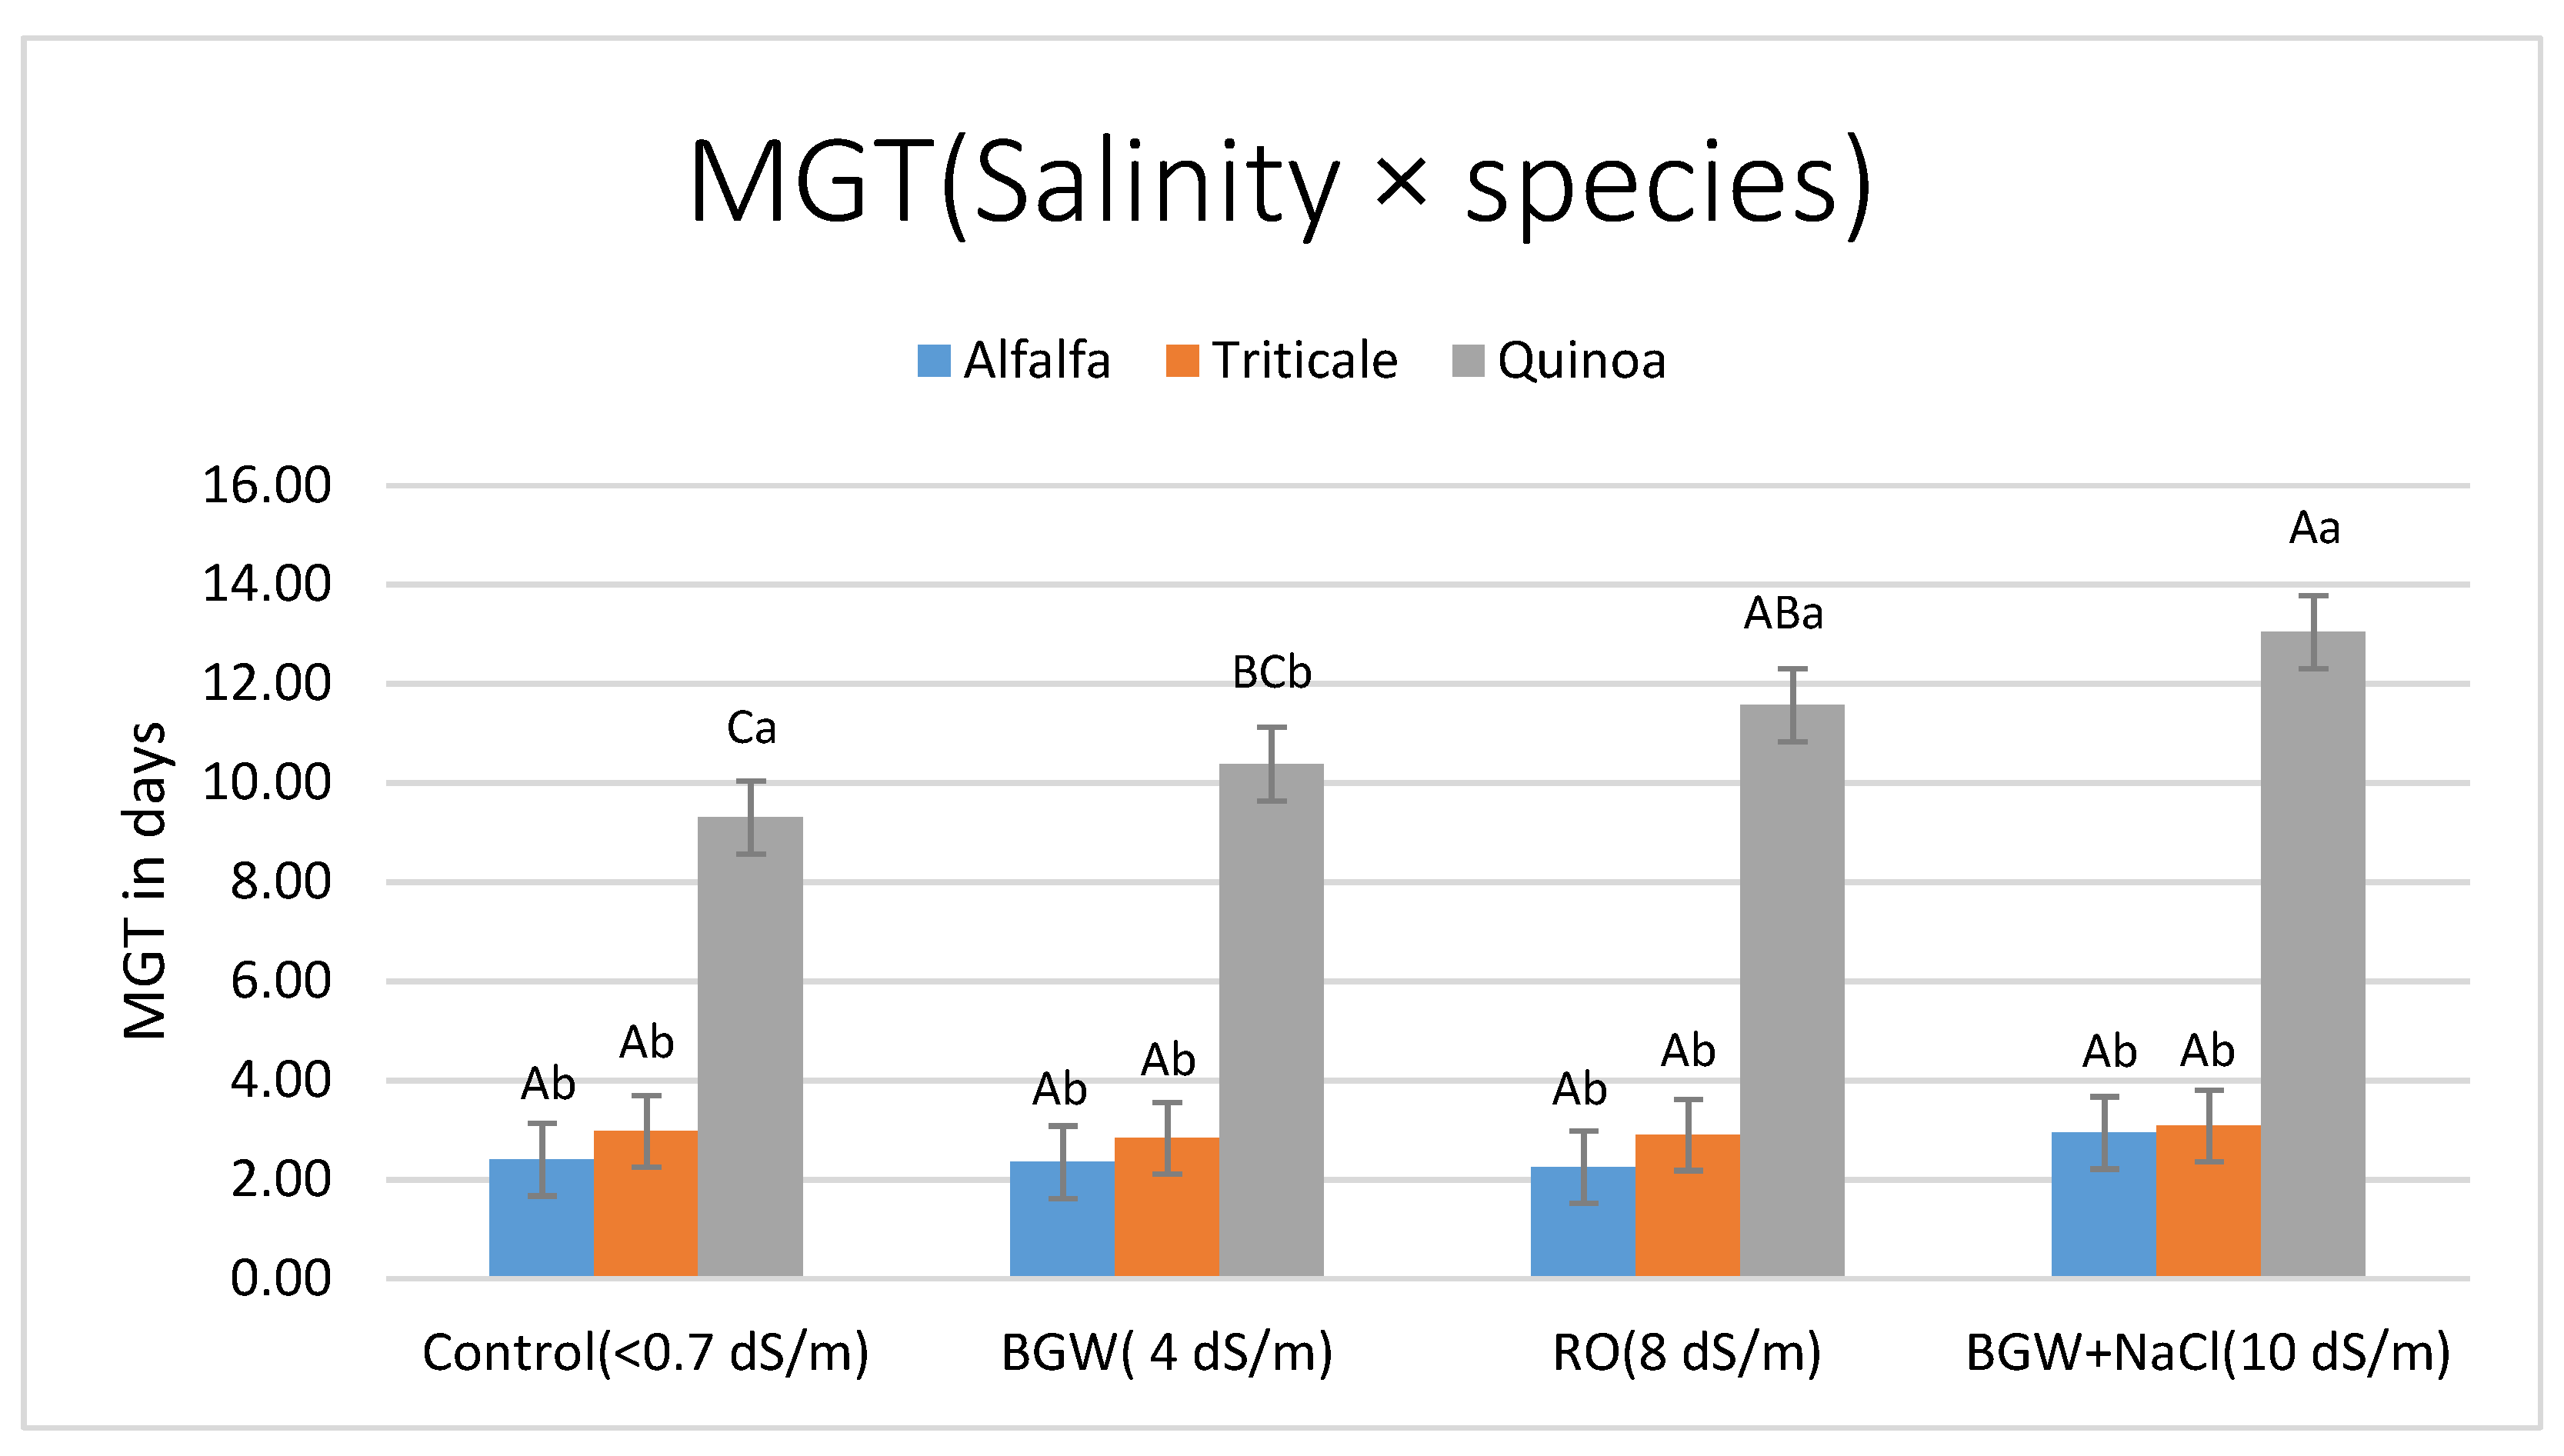
MGT showed salinity and species significance. Among all the species the MGT for quinoa was highest at all four salinity levels including control (Figure 2). This indicated that quinoa needed the longest time to germinate. For alfalfa and triticale, salinity differences in MGT were not significant. But for quinoa, increasing salinity increased the time for the seeds to germinate. MGT for quinoa at 0.7 dSm−1(control) was 2.27 (±0.73) days lower than at 8 dSm−1 while it was 2.66 (±0.73) days lower at 4 dSm−1 than at 10 dSm−1 (Figure 2). But for MGT, all other variables were related to the germination % of a species. Results showed that increasing salinity had little influence on germination parameters of alfalfa and triticale but increasing salinity delayed the germination of quinoa seeds.

3.2. Emergence Experiments

An overview of percentage of experimental units with some emergence in two different soil types at four different salinity levels is available in Table 6. Some emergence was observed in all control (0.7 dSm−1) experimental units but no emergence was observed in some quinoa experimental units at salinity levels as low as 4 dSm-1. In alfalfa and triticale some emergence was observed in all the experimental units at lower salinity levels while in quinoa no emergence was observed at higher salinity levels.

3.2.1. Emergence Percent

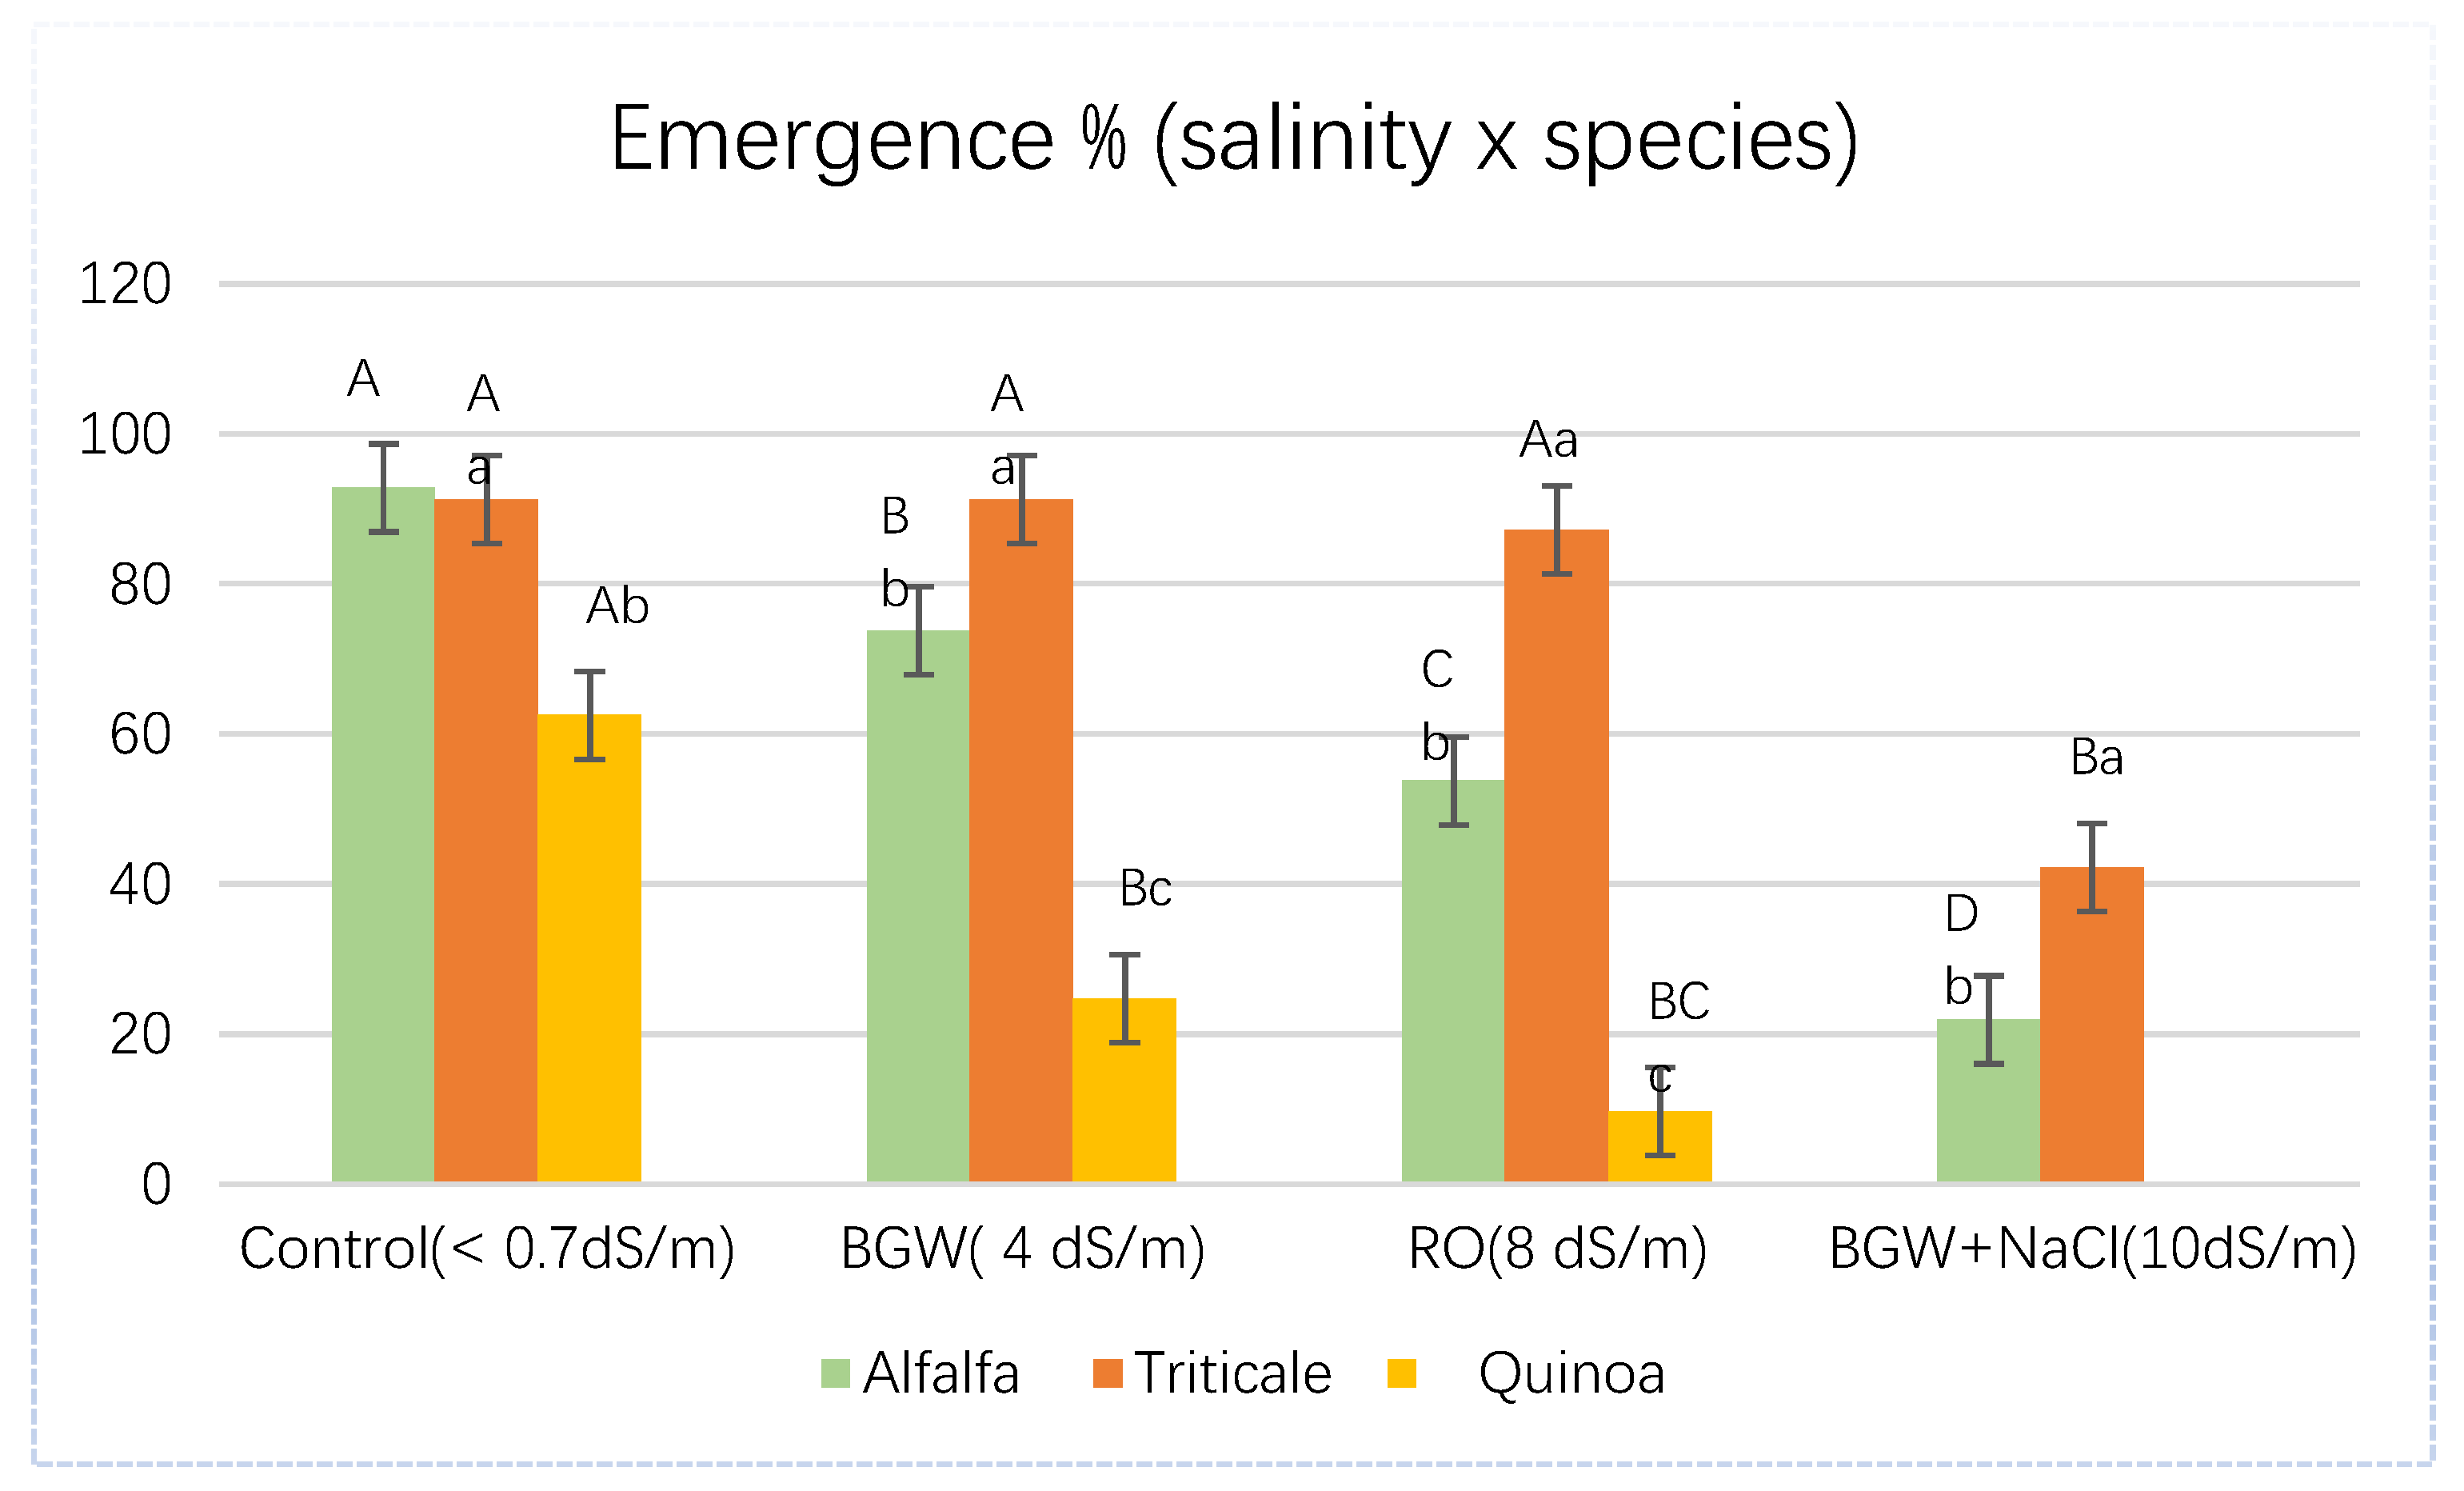
Emergence % decreased with increasing salinity in all the three species, however, the degree to which they differed varied within the species. Triticale emergence % did not differ along the salinity gradient initially, but decreased from 91.25 (±5.59) at control (< 0.7 dSm−1) to 42.19 (±5.59) at 10 dSm−1 (Figure 3). Triticale displayed consistently higher emergence % than other species at salinities of 4 dSm−1 and higher. Alfalfa emergence % was significantly different from each other at all salinities. Quinoa displayed significant differences between control, 4 dSm−1 and 10 dSm−1 with no emergence at 10 dSm−1 (Figure 3). Among all the three species, at control, alfalfa and triticale behaved similar but were significantly different from quinoa. However, with increasing salinities all the three species were significantly different from each other with quinoa showing no emergence at 10 dSm−1. There was lot main effect difference observed in alfalfa and triticale which were considered to be of secondary importance for this experiment. Figure 3 shows the emergence % of alfalfa, triticale, and quinoa.

3.2.2. Mean Emergence Time (MET in Days)

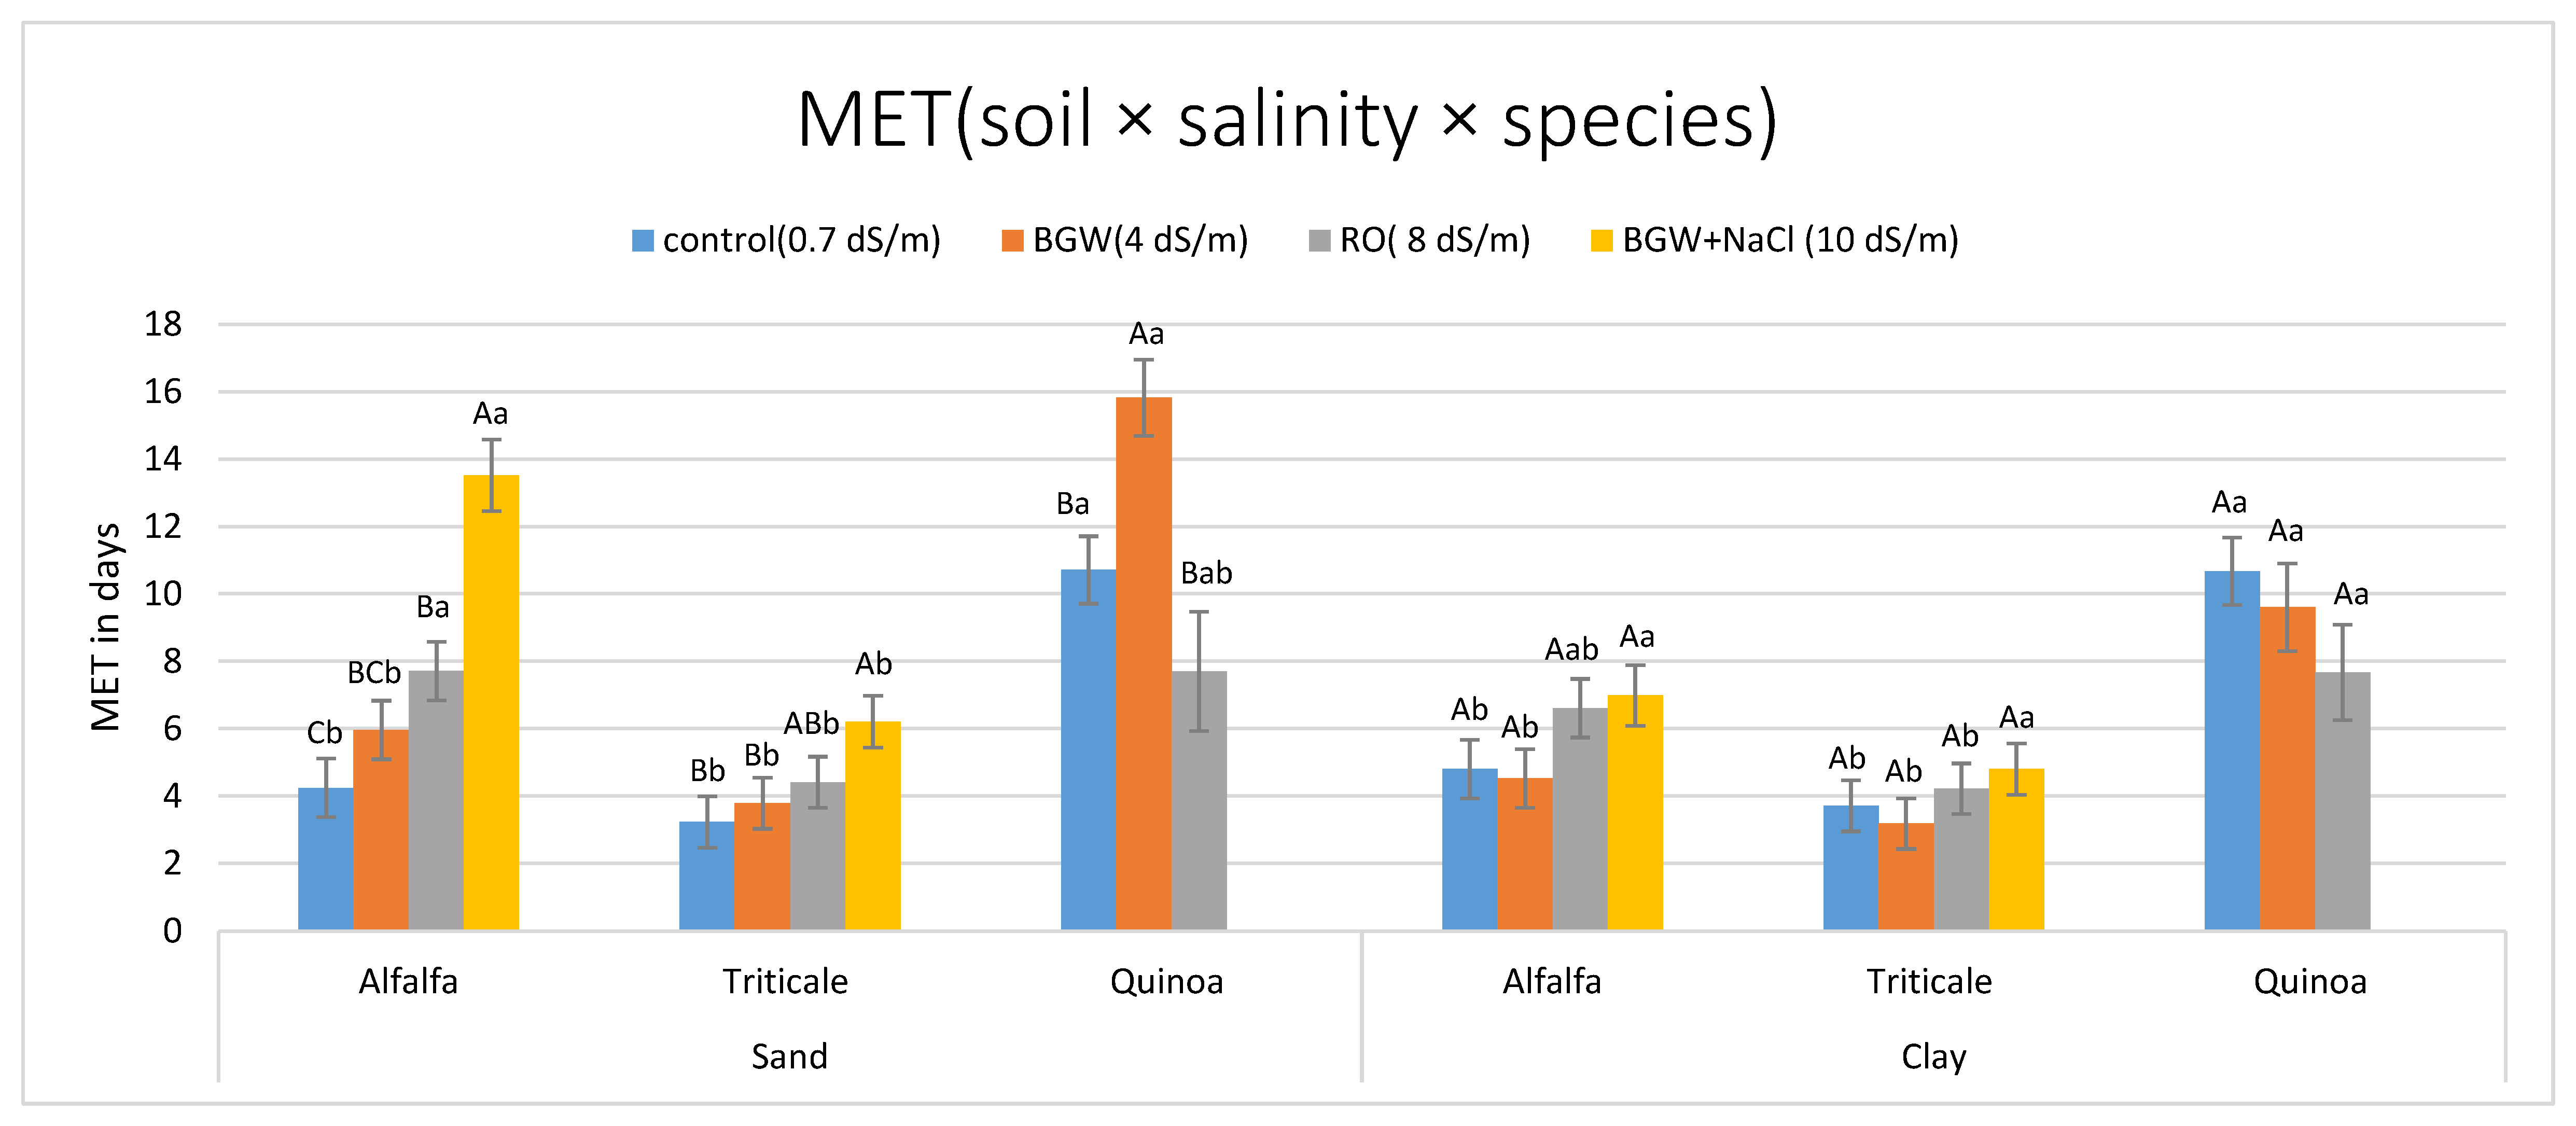
Among all the three species, MET was the highest for quinoa in both soil types, at each salinity level followed by alfalfa and the triticale. The mean emergence time (MET) for all the three species increased with salinity in sand soil, however, the degree varied depending on the species ability to tolerate salinity. Triticale was comparatively more salt tolerant and was able to emerge even up to 8 dSm−1 without any significant differences while quinoa started showing high MET even at control, most likely because of missing cells corresponding to experimental units where no emergence was observed, with increasing salinity and reached zero at 10 dSm−1. In sand soils, alfalfa MET increased with increasing salinity and was high at 10 dSm−1, while triticale was still able to emerge despite increasing salinity. Quinoa exhibited high MET in the beginning at 4 dSm−1. Soil differences were observed for alfalfa at 10 dSm−1 and quinoa at 4 dSm−1. In clay soils, MET was low for alfalfa and triticale compared to sand suggesting clay soils are more suitable for emergence of quinoa (Figure 4). Soils, salinity, and species influence the MET of a species.

3.2.3. Emergence Index (EI), Timson’s Index (TI), and Timsons Modified Index (Tmod)

It was observed that along with the increasing salinity gradient EI and TI decreased in all the three species but the degree to which they decreased differed in each species. In triticale detectable impact was recorded at the highest salinity (10 dSm−1) but for alfalfa the impact began to show at 4 dSm−1 itself. Triticale EI did not differ significantly along the salinity gradient compared to alfalfa and quinoa. Alfalfa and quinoa EI at control versus other salinity levels showed significant differences (Table 7). Similarly, TI for triticale was not significantly different up to 8 dSm−1, but decreased at 10 dSm−1. Alfalfa TI significantly differed from each other with increasing salinity. TI for quinoa showed a quick drop from control and was significantly different when compared to other higher salinity levels. TI in quinoa decreased to 68.80 (±15.46) at 4 dSm−1 and 54.28 (±20.57) at 8 dSm−1, respectively, compared to control 129.06 (±12.95) (Table 8).
In alfalfa and triticale, Tmod estimates decreased with increasing salinity, however, in alfalfa the estimates were significantly different at 10 dSm−1 in sand soils, and no differences were observed in clay soils (Table 9).

4. Discussion

According to Shannon [40] and Smith [41] a plant’s response to soil salinity is linked with its stage of development. The most salt-sensitive stages of crop growth are seed germination and seedling establishment [42]. Therefore, our study explored germination and emergence responses of alfalfa, triticale, and quinoa to salinity. Based on the results from the germination experiment, triticale displayed the highest germination % followed by quinoa and alfalfa which were not significantly different. Sand soils promoted increased germination % compared to clay soils. At the end of the germination experiment, we recorded the EC of sand soils planted with triticale and alfalfa. Control irrigation water (0.7 dSm−1) increased the salinity to 2.00 dSm−1 in alfalfa and 2.35 dSm−1 in triticale. Irrigation with 4 dSm−1 water increased the salinity in alfalfa to 6.05 dSm−1 and 7.75 dSm−1 in triticale. Similarly, irrigation with 8 dSm−1 water led to a very close increase of 10.50 and 10.25 dSm−1 in alfalfa and triticale respectively. Finally, the highest salinity irrigation water (10 dSm−1) resulted in much higher salinity in triticale pots with 12.28 dSm−1 compared to alfalfa at 10.40 dSm−1.
In general, according to Ungar [43,44] most species either halophytes or glycophytes display some decrease in germination with increasing salinity. Flores et al. [6] in their germination study reported triticale to be able to germinate with salinity up to 8 dSm-1 and we found the species was able to tolerate salinity even up to 10 dSm−1. There was no delay in germination in triticale and no longer than two-day delay in alfalfa and quinoa at the highest salinity. Our results indicate extended salinity tolerance potential of triticale.
Scasta and Foster [45] in their study suggested a positive correlation between germination at severe salinity (342 mM of NaCl) with regrowth potential under salt stress in a greenhouse and under field conditions [44]. This condition seemed similar to triticale in our experiment, because the species exhibited stimulatory germination effect rather than retarding action at higher salinity. Therefore, it can be said that there is some correlation between a seeds ability to germinate involving water uptake and osmotic adjustment that enables it to continue germination at higher salinities.
Studies have indicated a large variance in salt tolerance depending upon alfalfa varieties. Many of the newer alfalfa varieties are more salt tolerant that those that were available in the 1980s [11]. In general, alfalfa displays good seed germination and seedling establishment with adequate soil moisture and cool temperatures. However, increasing salinity can have a negative influence on alfalfa seed germination. We found alfalfa had very little influence on germination with increasing salinity. According to Ries and Hofmann [46], many forage species respond negatively to salinity for germination based on their study on eight forage species (thick spike wheatgrass, switch grass, alkali secaton, red clover, little bluestem, canby bluegrass, green needlegrass, fourwig saltbush) when treated with salinity of sodium sulphate (Na 2SO4) (10.3 dSm−1), magnesium sulphate (MgSO4) (8.8 dSm−1), and a combination of (Na 2SO 4 + MgSO4) (9.2 dSm−1).
Quinoa, in general is regarded as an unusually high salt tolerant crop. Many quinoa varieties can grow well under high salt concentrations, as high as those found in seawater (40 dSm−1) [33,34,47].
Quinoa has an efficient antioxidant mechanism, which gets activated by salts during germination and early seedling growth. Quinoa is also influenced by osmotic and ionic stress factors making it a facultative halophyte. Panuccio et al. [48] in their study demonstrated that all salts (NaCl2, CaCl2, KCl, and MgCl2) at lower concentrations increased the germination rate but not the germination percentage in quinoa. However, our results were not supportive to the above findings, probably because the quinoa variety that we studied was very sensitive to salinity and displayed significant delay in germination with increasing salinity.
According to Munns [49] increasing salinity has the most detrimental effect on the seedling emergence, and most predominantly it is due to ionic effect. Similar to the germination results, our emergence findings showed, triticale remained unaffected as salinity increased but decreased in alfalfa and quinoa.
In a greenhouse emergence experiment by Ozturk et al. [50] with six halophytes (Atriplex canescens, Hordeum vulgare, Lepidium alyssoides, Distichlis stricta, Panicum virgatum, ×Triticosecale) in sandy loam soils at 0.8, 5, 8, and 10 dSm−1 salinities, triticale displayed no change in the emergence % even up to 10 dSm−1 while the emergence % decreased at 10 dSm-1 in our experiment. This difference could be possibly due to soil types. Triticale responds to salinity much better in sandy loam than sand soils. The mean emergence time (MET) for triticale in our study increased with every incremental increase in salinity with a higher MET at the highest salinity.
Studies have shown that alfalfa is susceptible to salinity at seedling establishment and therefore delays emergence. Post germination, when the hypocotyl and cotyledons pass through the surface of the soil where salts are accumulated, it causes hypocotyl salt injuries and mortality [51]. Assadian and Miyamoto [52] reported, alfalfa seeds germinated well in saline soils, but their emergence decreased when irrigation water salinity exceeded above 4 dSm-1 and the sowing depth is more than 1 to 2 cm. Our findings resonate with the above because alfalfa emergence % decreased with the lowest salinity (4 dSm−1) introduced in our study. Alfalfa is also found to be more sensitive to salinity at emergence than at germination.
Emergence in quinoa can be explained as being dependent upon the species efficient antioxidant mechanism. High salts and salinity stress at 40 dSm−1 and above activates the antioxidant mechanism and increases its emergence % [33,34]. However, quinoa variety in our study was highly sensitive to salinity event at 0.7 dSm−1. It showed no emergence at all at 10 dSm−1 and took the longest time to emerge in sand soils.

5. Conclusions

New Mexico is a southwestern state located in arid and semiarid region of United States with mostly poor quality groundwater and many degraded rangelands. This study examined the salinity tolerance characteristics of two extensively cultivated native forage crops and a food seed crop utilizing saline irrigation for their germination and emergence performance at their optimum temperatures of growth in sand and clay soils to be able to suggest potential candidate species for revegetation on degraded rangelands and other desert margins.
Our findings suggest triticale as the most salt tolerant species in sand soil followed by quinoa and alfalfa. Triticale demonstrated its ability to withstand harsh dryland conditions. Based on its performance, triticale is a confirmed halophyte and the most promising candidate for cultivation in degraded rangelands as a forage crop. Alfalfa proved to be moderately salt tolerant and can germinate well in clay soil. Quinoa was reported to be the most salt sensitive species among all. Sand soils promoted higher germination % than in clay soils irrespective of the species.
The germination and emergence findings from this research have a larger context applicability when deciding potential forage crop for revegetation in saline and dry rangelands. Further research at later crop growth stages would increase our understanding on the survival and production.

Author Contributions

Conceptualization: M.K.S. and V.K.; Methodology: V.K., M.K.S. and B.J.S.; Software: D.V.; Validation: V.K., M.K.S., and B.J.S.; Formal analysis: M.K.S., G.A.P. and V.K.; Investigation: M.K.S. and V.K.; Writing (Original draft preparation): V.K. and D.V.; Writing (review and editing): D.V., M.K.S., G.A.P., and V.K.; Visualization: M.K.S.; Supervision: M.K.S.; Project administration: M.K.S., V.K., B.J.S., and G.A.P.; Funding acquisition: M.K.S. All authors have read and agreed to the published version of the manuscript.

Funding

This research was funded by NMSU Agricultural Experiment station, NIFA, Nakayama Professorship, and Bureau of Reclamation, grant number ST-2018-1780-001.

Acknowledgments

We thank NMSU Agricultural Experiment Station, NIFA, Nakayama Professorship, and Bureau of Reclamation for their support.

Conflicts of Interest

The authors declare no conflict of interest. The funders have no role in the design of the study; in the collection, analysis, or interpretation of data; in the writing of the manuscript, or in the decision to publish the results.

References

  1. D’Antonio, C.; Myerson, L.A. Exotic plant species as problems and solutions in ecological restoration: A Synthesis. Restor. Ecol. 2002, 10, 703–713. [Google Scholar] [CrossRef] [Green Version]
  2. Herrick, J.E.; Lessard, V.C.; Spaeth, K.E.; Shaver, P.L.; Dayton, R.S.; Pyke, D.A.; Jolley, L.; Goebel, J.J. National ecosystem assessments supported by scientific and local knowledge. Front. Ecol. Environ. 2010, 8, 403–408. [Google Scholar] [CrossRef]
  3. Lansford, R.; Hernandez, J.; Enis, P.; Truby, D.; Mapel, C. Evaluation of Available Saline Water Resources in New Mexico for the Production of Microalgae; Solar Energy Research Institute: Golden, CO, USA, 1990.
  4. WRRI (Water Resources Research Institute). Transboundary Aquifers of the El/Ciudad Juarez/Las Cruces Region, VI; Texas Water Development Board and New Mexico Water Resources Research Institute, U.S. Environmental Protection Agency: Region, Philippines, 1997.
  5. Setter, T.L.; Waters, I. Review of prospects for germplasm improvement for waterlogging tolerance in wheat, barley and oats. Plant Soil 2003, 253, 1–34. [Google Scholar] [CrossRef]
  6. Flores, A.M.; Schutte, B.J.; Shukla, M.K.; Picchioni, G.A.; Ulery, A.L. Time-integrated measurements of seed germination for salt-tolerant plant species. Seed Sci. Technol. 2015, 43, 541–547. [Google Scholar] [CrossRef]
  7. Flores, A.M.; Shukla, M.K.; Schutte, B.J.; Picchioni, G.; Daniel, D. Daniel Physiologic response of six plant species grown in two contrasting soils and irrigated with brackish groundwater and RO concentrate. J. Arid Land Res. Manag. 2017, 31, 182–230. [Google Scholar] [CrossRef]
  8. Flowers, T.J.; Läuchli, A. Sodium versus potassium: Substitution and compartmentation. In Inorganic Plant Nutrition. Encyclopedia of Plant Physiology; New Series; Läuchli, A., Bieleski, R.C., Eds.; Springer: New York, NY, USA, 1983; Volume 15B, pp. 651–681. [Google Scholar]
  9. Subbarao, G.V.; Ito, O.; Berry, W.L.; Wheeler, R.M. Sodium—A functional plant nutrient. Crit. Rev. Plant Sci. 2003, 22, 391–416. [Google Scholar]
  10. Flowers, T.J.; Colmer, T.D. Salinity tolerance in halophytes. New Phytol. 2008, 179, 945–963. [Google Scholar] [CrossRef]
  11. Maas, E.V. Crop salt tolerance. In Agricultural Salinity Assessment and Management; ASCE Manuals and Reports on Engineering Practice No. 71; Tanji, K.K., Ed.; American Society of Civil Engineers: New York, NY, USA, 1990; pp. 262–304. [Google Scholar]
  12. Shalaby, E.E.; Epstein, E.; Qualset, C.O. Variation in salt tolerance among some wheat and triticale genotypes. J. Agron. Crop Sci. 1993, 171, 298–304. [Google Scholar] [CrossRef]
  13. Almansouri, M.; Kinet, J.M.; Lutts, S. Effect of salt and osmotic stresses on germination in durum wheat (Triticum durum Desf.). Plant Soil 2001, 231, 243–254. [Google Scholar] [CrossRef]
  14. Ungar, I.A. Effect of salinity on seed germination, growth, and ion accumulation of Atriplex patula (Chenopodiaceae). Am. J. Bot. 1996, 83, 604–607. [Google Scholar] [CrossRef]
  15. Khan, M.A.; Abdullah, Z. Salinity-sodicity induced changes in reproductive physiology of rice (Oryza sativa) under dense soil conditions. Environ. Exp. Bot. J. 2003, 49, 145–157. [Google Scholar] [CrossRef]
  16. Ungar, I.A. Seed germination and seed-bank ecology in halophytes. In Seed Development and Germination, Tailor and Francis; Kigel, J., Galili, G., Eds.; Marcel Dekker: New York, NY, USA, 1995; pp. 599–628. [Google Scholar]
  17. Khan, M.A.; Gul, B.; Weber, D.J. Seed germination in the Great Basin halophyte Salsola iberica. Can. J. Bot. 2002, 80, 650–655. [Google Scholar] [CrossRef] [Green Version]
  18. Gutterman, Y. Seed germination in desert plants. In Adaptations of Desert Organisms; Springer: Berlin, Germany, 1993. [Google Scholar]
  19. Huang, Z.; Gutterman, Y. Artemisia monosperma achene germination in sand: Effects of sand depth, sand/water content, cyanobacterial sand crust and temperature. J. Arid Environ. 1998, 38, 27–43. [Google Scholar] [CrossRef]
  20. Huang, Z.; Gutterman, Y. Water absorption by mucilaginous achenes of Artemisia monosperma: Floating and germination affected by salt concentrations. ISR J. Plant Sci. 1999, 47, 27–34. [Google Scholar] [CrossRef]
  21. Badger, K.S.; Ungar, I.A. The effects of salinity and temperature on the germination of the inland halophyte Hordeum jubatum. Can. J. Bot. 1989, 67, 1420–1425. [Google Scholar] [CrossRef]
  22. Baskin, C.C.; Baskin, J.M. Seeds: Ecology, Biogeography, and Evolution of Dormancy and Germination; Academic Press: San Diego, CA, USA, 1998. [Google Scholar]
  23. Mueller, S.C. Consideration for successful alfalfa stand establishment in the central San Joaquin Valley. In Proceedings of the California Alfalfa and Forage Symposium, San Diego, CA, USA, 12–14 December 2005. [Google Scholar]
  24. Brar, G.S.; Gomez, J.F.; Matches, A.G.; Taylor, H.M.; McMichael, B.L. Root development of 12 forage legumes as affected by temperature. Agron. J. 1990, 82, 1024–1026. [Google Scholar] [CrossRef]
  25. Brar, G.S.; Gomez, J.F.; McMichael, B.L.; Matches, A.G.; Taylor, H.M. Tailor Germination of twenty forage legumes as influenced by temperature. Agron. J. 1991, 83, 173–175. [Google Scholar] [CrossRef]
  26. Klos, K.L.E. Variation in Alfalfa (Medicago sativa L.) for Germination and Seedling Vigor at Suboptimal Temperatures; and Laboratory and Field Responses to Selection within Six Alfalfa Populations. Ph.D. Thesis, Iowa State University, Ames, IA, USA, 1999. [Google Scholar]
  27. Lacefield, G.D.; Henning, J.C.; Rasnake, M.; Collins, M. Alfalfa, the Queen of Forage Crops; Agr-76; Cooperative Extention Service, University Kentucky: Lexington, Kentucky, 1997. [Google Scholar]
  28. Lehman, W.F.; Robinson, F.E. Progress in developing salt tolerance in alfalfa. In Proceedings of the 9th California Alfalfa Symp, Fresco, CA, USA, 12–13 December 1979; University of California Cooperative Extension Service: Davis, CA, USA, 1979; pp. 73–75. [Google Scholar]
  29. Stone, J.E.; Marx, D.B.; Dobrenz, A.K. Interaction of sodium chloride and temperature on germination of two alfalfa cultivars. Agron. J. 1979, 75, 425–427. [Google Scholar] [CrossRef]
  30. Cornacchione, M.V.; Suarez, D.L.; Cornacchione, M.V.; San, I.-E.E.A. Emergence, Forage Production, and Ion Relations of Alfalfa in Response to Saline Waters, (february). Crop Sci. 2015, 55, 444–457. [Google Scholar] [CrossRef] [Green Version]
  31. Cantale, C.; Petrazzuolo, F.; Correnti, A.; Farneti, A.; Felici, F.; Latini, A.; Galeffi, P. Triticale for Bioenergy Production. Agric. Agric. Sci. Procedia 2016, 8, 609–616. [Google Scholar] [CrossRef]
  32. Hill, G.M. Quality: Triticale in animal nutrition. In Proceedings of the 2nd Int. Triticale Symp, Passo Fundo, Rio Grande do Sul, Brazil, 1–5 October 1990; pp. 422–427. [Google Scholar]
  33. Jacobsen, S.-E.; Mujica, A.; Jensen, C.R. The resistance of quinoa (Chenopodium quinoa Willd.) to adverse abiotic factors. Food Rev. Int. 2003, 19, 99–109. [Google Scholar] [CrossRef]
  34. Jacobsen, S.-E.; Monteros, C.; Corcuera, L.J.; Bravo, L.A.; Christiansen, J.L.; Mujica, A. Frost resistance mechanisms in quinoa (Chenopodium quinoa Willd.). Eur. J. Agron. 2007, 26, 471–475. [Google Scholar] [CrossRef]
  35. Jacobsen, S.-E.; Liu, F.; Jensen, C.R. Does root-sourced ABA play a role for regulation of stomata under drought in quinoa (Chenopodium quinoa Willd). Sci. Hortic. J. Elsevier 2009, 122, 281–287. [Google Scholar] [CrossRef] [Green Version]
  36. Sun, Y.; Liu, F.; Bendevis, M.; Shabala, S.; Jacobsen, S.-E. Sensitivity of two quinoa (Chenopodium quinoa Willd.) varieties to progressive drought stress. J. Agron. Crop Sci. 2014, 200, 12–23. [Google Scholar] [CrossRef]
  37. Hargreaves, H.G.; Merkley, P.G. Irrigation Fundamental; Water Resources Publications, LLC: Colorado, CO, USA, 1998; pp. 90–91. [Google Scholar]
  38. Ranal, M.A.; Santana, D.G. How and why to measure the germination process? Rev. Bras. Bot. 2006, 29, 1–11. [Google Scholar] [CrossRef] [Green Version]
  39. Goodchild, N.A.; Walker, M.G. A method of measuring seed germination in physiological studies. Ann. Bot. 1971, 35, 615–621. [Google Scholar] [CrossRef]
  40. Shannon, M.C. Adaptation of plants to salinity. In Advances in Agronomy; Donald, L.S., Ed.; Academic Press: Cambridge, MA, USA, 1997; pp. 75–120. [Google Scholar]
  41. Smith, S.E. Salinity and the production of alfalfa (Medicago sativa L.). In Handbook of Plant and Crop Stress; Pessarakli, M., Ed.; Marcel Dekker: New York, NY, USA, 1994; pp. 431–448. [Google Scholar]
  42. Ashraf, M.; Foolad, M.R. Pre-sowing seed treatment—A shotgun approach to improve germination, plant growth, and crop yield under saline and non-saline conditions. Adv. Agron. 2005, 88, 223–271. [Google Scholar] [CrossRef]
  43. Ungar, I.A. An ecological study of the vegetation of the Big Salt Marsh, Stafford County, Kansas. Univ. Kansas Sci. Bull. 1965, 46, 1–98. [Google Scholar]
  44. Ungar, I.A. Vegetation-soil relationships on saline soils in northern Kansas. Am. Midl. Nat. 1966, 78, 98–120. [Google Scholar] [CrossRef]
  45. Scasta, J.D.; Trostle, C.L.; Foster, M.A. Evaluating alfalfa (Medicago sativa L.) cultivars for salt tolerance using laboratory, greenhouse and field methods. J. Agric. Sci. 2012, 4, 90. [Google Scholar] [CrossRef] [Green Version]
  46. Ries, R.E.; Hofmann, L. Effect of sodium and magnesium sulfate on forage seed germination. J. Range Manag. 1983, 36, 658–662. [Google Scholar] [CrossRef] [Green Version]
  47. Wilson, C.; Read, J.J.; Abo-Kassem, E. Effect of mixed-salt salinity on growth and ion relations of a quinoa and a wheat variety. J. Plant Nutr. 2002, 25, 2689–2704. [Google Scholar] [CrossRef]
  48. Panuccio, M.R.; Jacobsen, S.E.; Akhtar, S.S.; Muscolo, A. Effect of saline water on seed germination and early seedling growth of the halophyte quinoa. AoB Plants 2014, 6, 1–18. [Google Scholar] [CrossRef] [PubMed]
  49. Munns, R. Comparative physiology of salt and water stress. Plant Cell Environ. 2002, 25, 239–250. [Google Scholar] [CrossRef] [PubMed]
  50. Ozturk, O.F.; Shukla, M.K.; Stringam, B.; Picchioni, G.A.; Gard, C. Irrigation with brackish water changes evapotranspiration, growth and ion uptake of halophytes. Agric. Water Manag. 2018, 195, 142–153. [Google Scholar] [CrossRef]
  51. Miyamoto, S.; Piela, K.; Davis, J.; Petticrew, J. Salt effects on germination and seedling emergence of several vegetable crops and guayule. Irrig. Sci. 1985, 6, 159–170. [Google Scholar] [CrossRef]
  52. Assadian, N.W.; Miyamoto, S. Salt Effects on Alfalfa Seedling Emergence. Agron. J. 1987, 14, 710–714. [Google Scholar] [CrossRef]
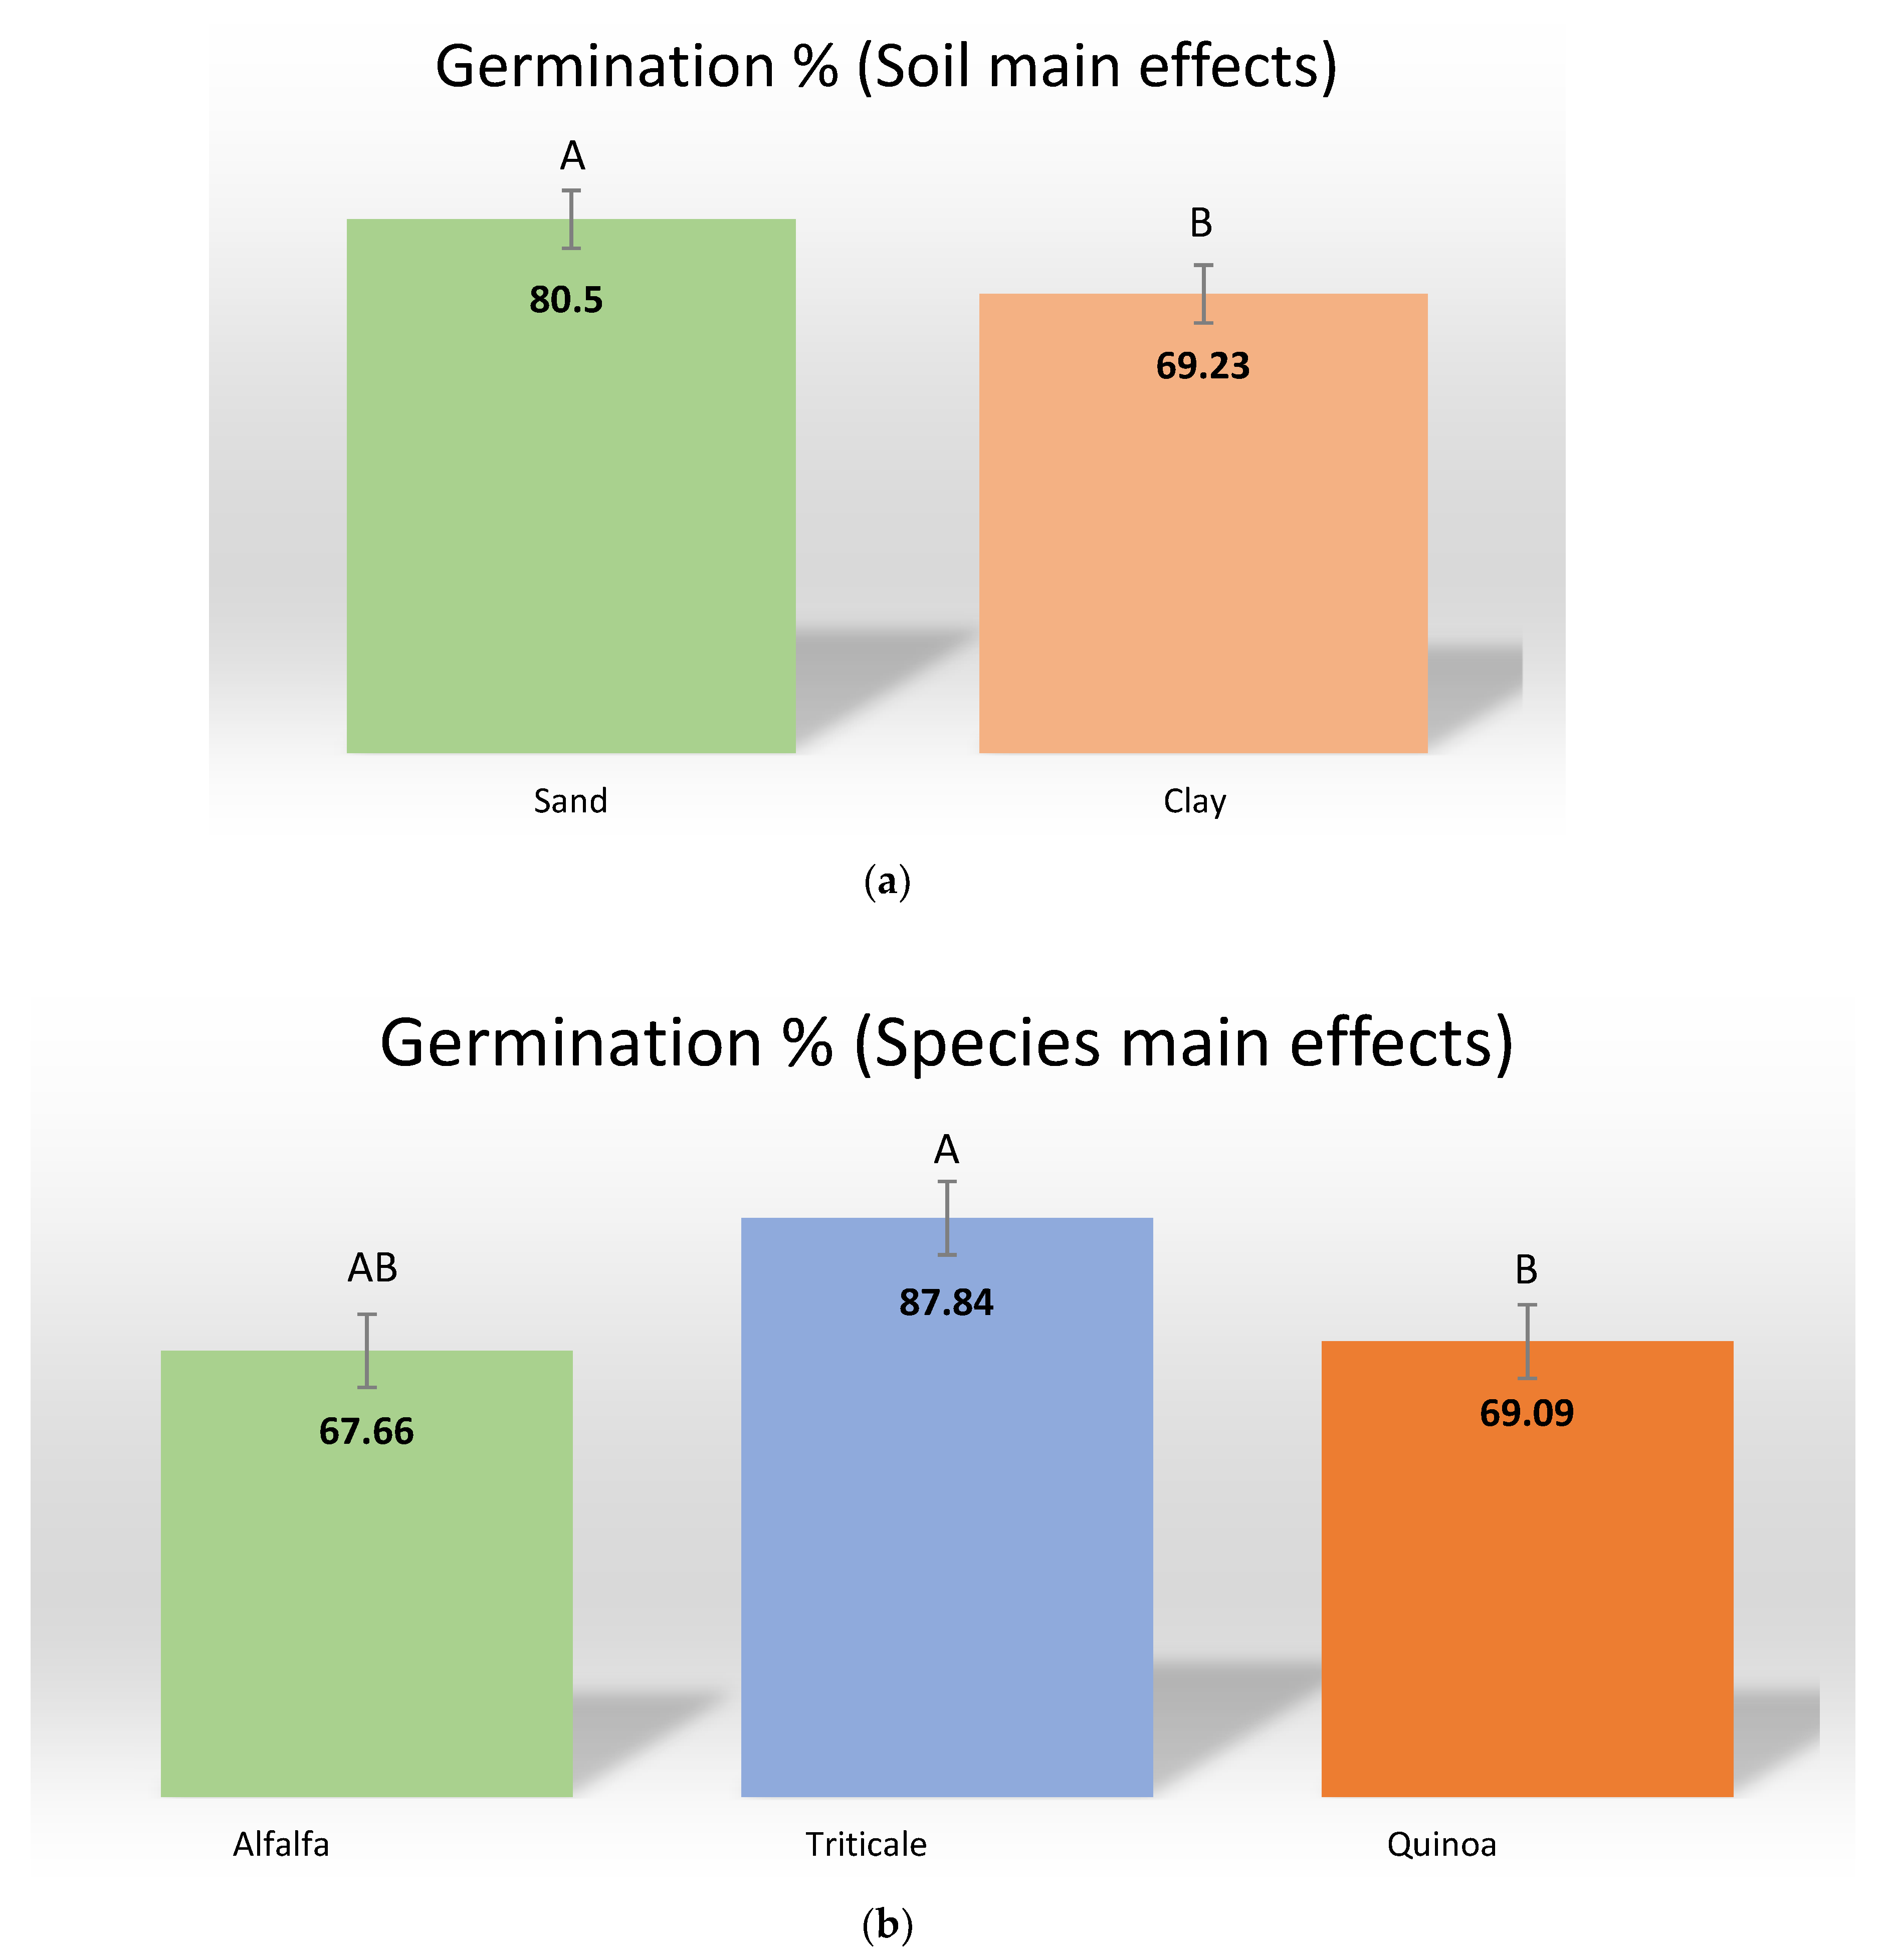
Figure 1. (a) Soil main effects on germination %. (b) Species main effects on germination %. A, B letters correspond to statistically significant differences at α ≤ 0.05. Results are the mean ±SEs (standard errors). Standard errors for germination% (±4.37) are constant under soil main effects of sand and clay soils. Standard errors for germination% (±5.57) are constant for species main effects of alfalfa, triticale, and quinoa.
Agronomy 10 00549 g001
Figure 2. Mean germination time (MGT) (days) of alfalfa, triticale, and quinoa. MGT in days for alfalfa, triticale, and quinoa with salinity × species interaction at four different salinity levels. A, B, C letters correspond to significant differences in the MGT within the species at different salinity levels and a, b letters correspond to statistically significant differences in the MGT between the species at α ≤ 0.05. Standard errors for MGT of species x salinity are constant for alfalfa (±0.73), triticale (±0.72), and quinoa (±0.73) respectively.
Agronomy 10 00549 g002
Figure 3. Emergence % of alfalfa, triticale, and quinoa with salinity × species interaction at four different salinity levels. A, B, C letters correspond to significant differences in the emergence % within the species at different salinity levels and a, b, c letters correspond to statistically significant differences in the emergence % between the species at α ≤ 0.05. Standard errors for emergence % of species × salinity are constant for alfalfa (±5.87), triticale (±5.59), and quinoa (±5.80) respectively.
Agronomy 10 00549 g003
Figure 4. Mean emergence time (MET) (days) of alfalfa, triticale, and quinoa. MET in days for alfalfa, triticale, and quinoa with soils × salinity × species interaction at four different salinity levels. A, B, C letters correspond to significant differences in the MET within the species at different salinity levels and a, b letters correspond to statistically significant differences in the MET between the species at α ≤ 0.05. Results are the mean ± SEs (standard errors).
Agronomy 10 00549 g004
Table 1. Some of the physiochemical properties of soils used for the experiment.
Soils
(dSm−1)
Sand
(%)
Silt
(%)
Clay
(%)
BD
(gcm−3)
Ca
(meq L−1)
Mg
(meq L−1)
Na
(meq L−1)
K
(meq L−1)
SARpHEC
(dSm−1)
Sand835121.170.460.348.372.113.186.671.43
Clay38.9629.6031.441.273.042.5815.326.19.137.180.73
BD: bulk density, SAR: sodium absorption ratio, EC: electrical conductivity.
Table 2. Chemical properties of irrigation waters used for the experiment; tap water as control from the greenhouse (control, EC = 0.7 dSm−1); brackish groundwater (EC = 4 dSm−1) from BGNDRF, RO concentrate (conc.) (EC = 8 dSm−1) from BGNDRF; BGW + NaCl (EC = 10 dSm−1) irrigation.
Ion Concentration
dSm−1meq L−1meq L−1meq L−1mg L−1 mg L−1
SalinityNa+Ca2+Mg2+K+ClSAR
< 0.72.532.590.795.3357.21.95
415.8720.416.546.74697.73.69
830.0934.8830.1214.0892.75.28
1084.3519.8116.0519.13024.319.92
0.7 dSm−1 is Tap water as control, EC: electrical conductivity, SAR: sodium absorption ratio.
Table 3. Statistically significance differences at (α ≤ 0.05) for fixed factors soils, salinity, species, lots, and their interactions for five germination response variables; germination %, MGT, GI, and TI and Tmod for alfalfa, triticale and quinoa. Abbreviations: MGT, mean germination time; GI, germination index; TI, Timson’s index; and Tmod, Timson’s modified index.
p-Value
EffectGerminationMGTGITITmod
Soils0.02790.05130.01990.02010.0910
Salinity0.34410.01080.21360.21920.0404
Soils × Salinity0.86310.99660.97940.97610.9973
Species0.04650.00010.00020.00030.0026
Soils × Species0.66570.45110.76820.77330.5827
Salinity × Species0.37820.03430.26600.27090.2528
Soils × Salinity × Species0.87960.99090.90570.90570.9868
Lots(Species)0.42170.00260.36060.36160.0026
Lots × Soils(Species)0.05000.01850.04850.04810.0188
Lots × Salinity(Species)0.86550.10890.87820.87660.1072
Lots × Soil × Salinity(Species)0.88900.66190.79700.80250.6610
Table 4. Soil and species main effects on GI and TI of alfalfa, triticale, and quinoa. Abbreviations: GI, germination index; TI, Timson’s index.
GITI
Soils main effects
Sand12.03 (A)320.78 (A)
Clay10.28 (B)274.45 (B)
Species main effects
Alfalfa 11.88 ± 0.79 (B)313.83 ± 20.98 (B)
Triticale14.99 ± 0.77 (A)396.73 ± 20.60 (A)
Quinoa6.60 ± 0.76 (C)182.28 ± 20.25 (C)
A, B, C letters down the column correspond to statistically significant differences at α ≤ 0.05. Results are the mean ± SEs (standard errors). Standard errors for germination% (±4.37), GI (±0.69), and TI (±18.52) are constant under soil main effects of sand and clay soils. Standard errors for germination% (±5.57) are constant for species main effects.
Table 5. Germination Experiment. Tmod for salinity × species interaction for alfalfa, triticale, and quinoa at four different salinity levels.
Tmod Values for Salinity × Species Interactions
Salinity (dSm−1)AlfalfaTriticaleQuinoa
< 0.7(control)18.6018.0311.7016.11(A)
418.6518.1710.6215.81(A)
818.7518.109.4215.42(AB)
1018.0617.927.9614.65(B)
18.51 ± 0.44(a)18.05 ± 0.38(a)9.93 ± 0.57(b)
A, B letters down the columns correspond to significant differences in the Tmod within the species at different salinity levels and a, b letters across the rows correspond to statistically significant differences in the Tmod between the species at α ≤ 0.05. Standard errors for Tmod of salinity × species are constant for alfalfa (±0.57), triticale (±0.42), and quinoa (±0.87) respectively and 0.43 for salinity averaged across species.
Table 6. Percentage of experimental units where some emergence was observed for species × soils × salinity species combinations for alfalfa, triticale, and quinoa in two soil types; sand and clay at four different salinity levels.
SoilsSpecies< 0.7 dSm−14 dSm−18 dSm−110 dSm−1
SandAlfalfa100.00100.00100.0050.00
Triticale100.00100.00100.0087.50
Quinoa100.0068.7525.000.00
ClayAlfalfa100.00100.00100.0087.50
Triticale100.00100.00100.0093.75
Quinoa100.0056.2550.000.00
Percentage of some emergence in experimental units is expressed by taking into consideration all the experimental units that emerged.
Table 7. Emergence index (EI) for salinity × species interaction for alfalfa, triticale, and quinoa at four different salinities.
Emergence Index (EI) for Salinity × Species Interaction
Salinity (dSm−1)AlfalfaTriticaleQuinoa
< 0.7(control)23.66 ± 1.24 (A) (a)24.22 ± 1.17 (A) (a)12.28 ± 1.24 (A) (b)
418.15 ± 1.24 (B) (b)24.21 ± 1.17 (A) (a)6.50 ± 1.48 (B) (c)
812.34 ± 1.24 (C) (b)22.43 ± 1.17 (A) (a)5.19 ± 1.98(B) (c)
106.09 ± 1.42 (D) (b)11.46 ± 1.20 (B) (a)-
A, B, C letters down the columns correspond to significant differences in the EI within the species at different salinity levels and a, b, c letters across the rows correspond to statistically significant differences in EI between the species at α ≤ 0.05. Results are the mean ± SEs (standard errors).
Table 8. Timson’s Index (TI) for salinity × species interaction for alfalfa, triticale, and quinoa at four different salinities.
Timson’s Index (TI) for Salinity × Species Interaction
Salinity (dSm−1)AlfalfaTriticaleQuinoa
< 0.7(control)245.91 ± 12.83(A) (a)251.31 ± 12.14 (A) (a)129.06 ± 12.95 (A) (b)
4188.87 ± 12.83(B) (b)251.25 ± 12.14 (A) (a)68.80 ± 15.46 (B) (c)
8128.81 ± 12.83(C) (b)233.00 ± 12.14 (A) (a)54.28 ± 20.57(B) (c)
1063.85 ± 14.72 (D) (b))119.32 ± 12.40 (B) (a)-
A, B, C letters down the columns correspond to significant differences in the TI within the species at different salinity levels and a, b, c letters across the rows correspond to statistically significant differences in TI between the species at α ≤ 0.05. Results are the mean ± SEs (standard errors).
Table 9. Tmod for soils × salinity × species interaction for alfalfa, triticale, and quinoa in two soils types at four different salinities.
Tmod for Soils × Salinity × Species Interactions
Salinity (dSm−1) AlfalfaTriticaleQuinoa
< 0.7(control)Sand26.76 ±0.87 (A)(a)27.77 ±0.76 (A)(a)20.29 ±1.00 (A)(b)
4 25.04 ±0.87 (AB)(a)27.21 ±0.76 (A)(a)15.18 ±1.13 (B)(b)
8 23.29 ±0.87 (B)(b)26.59 ±0.76 (AB)(a)23.30±1.77 (A)(ab)
10 17.48±1.06 (C)(b)24.79 ±0.77 (B)(a)-
< 0.7(control)Clay26.20 ±0.87 (A)(a)27.29 ±0.76 (A)(a)20.33 ±1.00 (A)(b)
4 26.48 ±0.87 (A)(a)27.81 ±0.76(A)(a)21.40 ±1.30 (A)(b)
8 24.39 ±0.87 (A)(ab)26.77 ±0.76(A)(a)23.33 ±1.42 (A)(b)
10 24.01 ±0.90 (A)(a)26.20 ±0.76(A)(a)-
A, B, C letters down the columns correspond to significant differences in the Tmod within the species at different salinity levels and a, b letters across the rows correspond to statistically significant differences in the Tmod between the species at α ≤ 0.05. Results are the mean ± SEs (standard errors).