1. Introduction
Plastic gear systems are a common choice in precision mechanics. Compared to gears made from metallic materials, plastic gears are significantly lighter, reducing the overall weight of the mechanical systems in which they are integrated and consequently lowering the load on bearings [
1]. Another major advantage lies in their low engagement noise. The physical properties of the plastic materials contribute to the reduction in noise [
2] and, by extension, vibrations, making plastic gears suitable for integration in laboratory equipment that operates under strict conditions.
The evolution of 3D printing technologies has further enhanced the potential of plastic gear systems. With the increased degrees of freedom offered by modern 3D printing platforms, it is now possible to manufacture complex geometries with high dimensional accuracy while optimizing material usage, thus overcoming several limitations associated with conventional manufacturing methods [
3].
In the context of 3D printing technologies, numerous studies [
4,
5,
6,
7,
8] have investigated, in terms of strength, stiffness, and surface quality, how printing parameters such as layer height, infill density, and extrusion temperature affect the overall mechanical properties of printed parts. Another practical consideration in 3D printing is how the printed parts are colored. Typically, alcohol-based inks are used to color the filament, regardless of the thermoplastic type. Studies have demonstrated that the coloring process of the filament can significantly influence both the mechanical performance and surface roughness of 3D-printed components [
9].
The mechanical properties of thermoplastics such as polylactic acid (PLA) and acrylonitrile butadiene styrene (ABS) are significantly influenced by 3D printing parameters, including layer height, infill percentage, extrusion temperature, and printing speed. As shown by Shergill et al. [
10], reducing the layer height to 0.1 mm significantly improves the tensile strength of PLA and ABS. In a similar direction, Mushtaq et al. [
11] observed that printing at higher extrusion temperatures (up to 230 °C for ABS) and using lower speeds leads to improved surface quality. Jiang et al. [
12] highlighted through both theoretical modeling and experimental validation that surface roughness in extrusion-based 3D printing is closely linked to how printing speed, nozzle diameter, and layer height interact during fabrication. Moreover, the observed inverse relationship between layer thickness and compressive strength in both PLA and ABS highlights the importance of layer structuring in tailoring the structural performance of 3D-printed parts to support applied loads [
13,
14,
15]. In conclusion, all these parameters directly affect tensile strength, elastic modulus, and impact resistance, making process optimization critical for functional applications [
16].
Thermal post-processing through controlled annealing has been shown to substantially improve the compressive strength of PLA, confirming the potential of thermal conditioning as a method for enhancing mechanical integrity [
17,
18,
19,
20].
Beyond the mechanical performance improvements discussed above, recent studies have increasingly focused on how 3D printing parameters also influence the wear behavior of thermoplastic components [
21,
22,
23,
24,
25]. These investigations extend the role of process optimization from purely mechanical enhancement to addressing long-term durability under frictional contact and surface degradation. In the case of PLA used in Fused Deposition Modeling (FDM), extrusion temperature affects the friction coefficient in a nonlinear manner. An optimal temperature range, typically between 210 °C and 220 °C, can minimize friction, although this range may vary depending on material composition, extrusion speed, and printing platform adhesion. Lower temperatures may reduce interlayer bonding and increase friction, while excessively high temperatures can lead to surface irregularities and deformation.
With regard to polymer gears, 3D printing technologies have become an increasingly attractive alternative, enabling the production of functional components with complex geometries, short lead times, and relatively low cost [
26,
27,
28,
29]. Recent advances in 3D printing have significantly improved dimensional accuracy and surface quality, making these technologies suitable for precision mechanics applications, where operating loads are low but geometrical accuracy and repeatability are critical [
30,
31]. Although mechanical performance may still lag behind that of injection-molded parts, 3D-printed gears can meet the functional demands of prototyping, low-load transmission systems, and experimental setups. To enhance the strength of 3D-printed gears, a promising approach involves the design of hybrid structures incorporating metallic inserts. These inserts can serve to dissipate the heat generated at the tooth flanks during operation, thereby reducing thermal degradation and improving the overall reliability of the gear system [
32].
Studies on the friction, wear, and service life of plastic gears produced by both injection molding and 3D printing reveal distinct performance outcomes based on the material and manufacturing method. Injection-molded polyoxymethylene gears achieved the highest durability compared to ABS and high-density polyethylene gears [
33,
34]. Gears manufactured by 3D printing technology are a promising and efficient alternative to mechanisms for mechatronics applications. However, in order to achieve optimal performance, careful consideration must be given to all associated mechanical characteristics. In a previous study [
35], notable findings were obtained using a Frenco device for measuring wear, which provided valuable data on the abrasive wear characteristics of 3D-printed gears made from PLA, PA, and ABS materials. The results indicated that PLA gears demonstrated superior wear performance compared to the other materials tested. An important factor influencing the wear of PLA gears produced via FDM is the drive-side pressure angle. Research findings suggest that increasing this angle from 20° to 35° can lead to a reduction in the wear rate of up to 60%, underscoring the significant impact of tooth profile geometry on gear durability [
36].
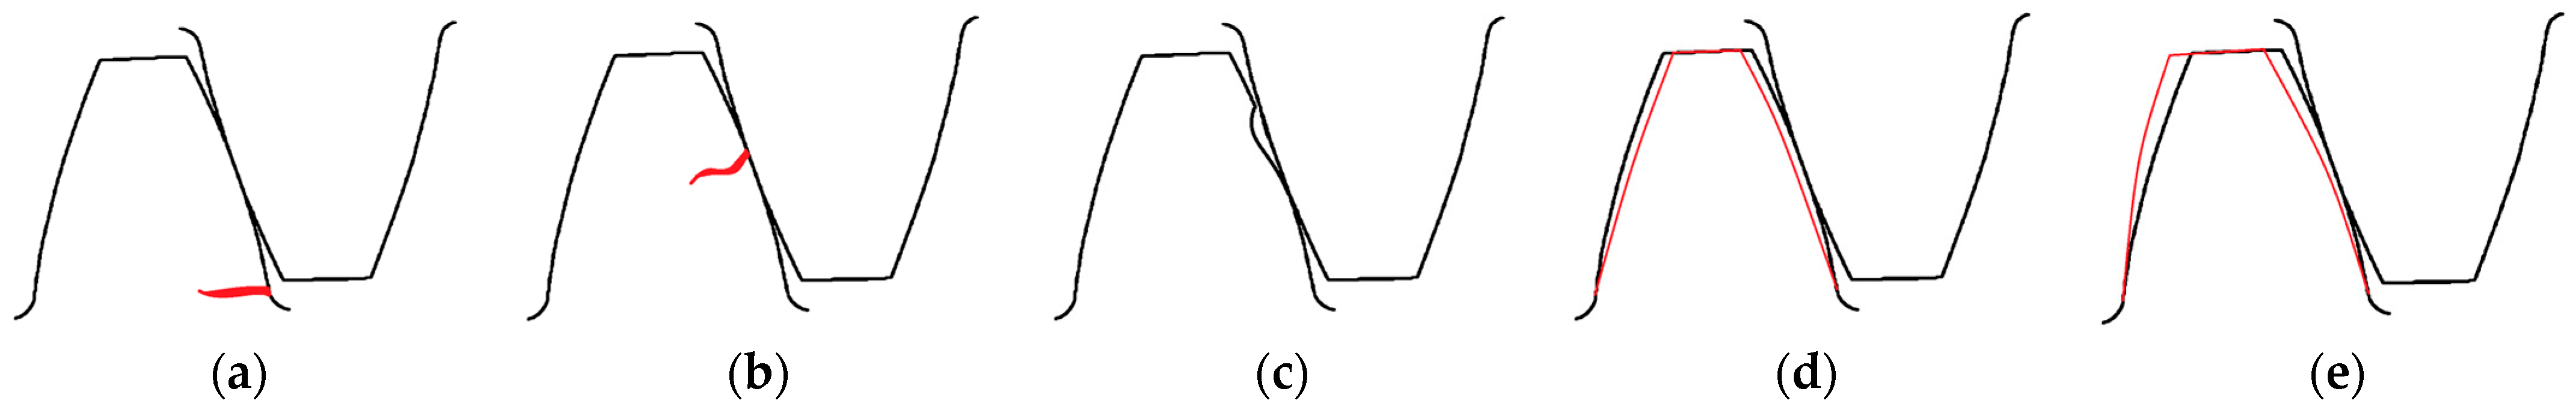
In the field of precision mechanics, the use of 3D-printed gears requires the development of gear pairs that meet stringent requirements regarding motion transmission. These requirements are related to vibrations and precision and are more closely associated with abrasive wear mechanisms than with sudden or catastrophic failures in gear operation, such as cracks at various levels of the tooth, pitting, or plastic deformation [
37] (
Figure 1).
Starting from the premise that wear and deformation (plastic and elastic) mutually influence each other and considering previous research findings showing that PLA gears exhibit the most favorable behavior in terms of abrasive wear [
35], this study investigates how tooth stiffness, in the case of FDM-manufactured PLA gears, affects the progression of wear along the tooth profile. Three PLA gears manufactured via FDM, with wall thicknesses of 0.6 mm, 1.0 mm, and 2.4 mm, corresponding to approximate solid cross-sectional ratios at the tooth base of 54%, 91%, and 100%, were subjected to abrasive wear testing and comparatively evaluated using 3D scanning before and after the tests. The solid cross-sectional ratio, as defined in this study, refers to the proportion of the tooth cross-section at the dedendum circle that consists entirely of solid material, i.e., regions with 100% material deposition. The experimental results enabled the development of a mathematical model capable of generating relevant insights into the characterization of abrasive wear occurring in 3D-printed gears.
3. Results
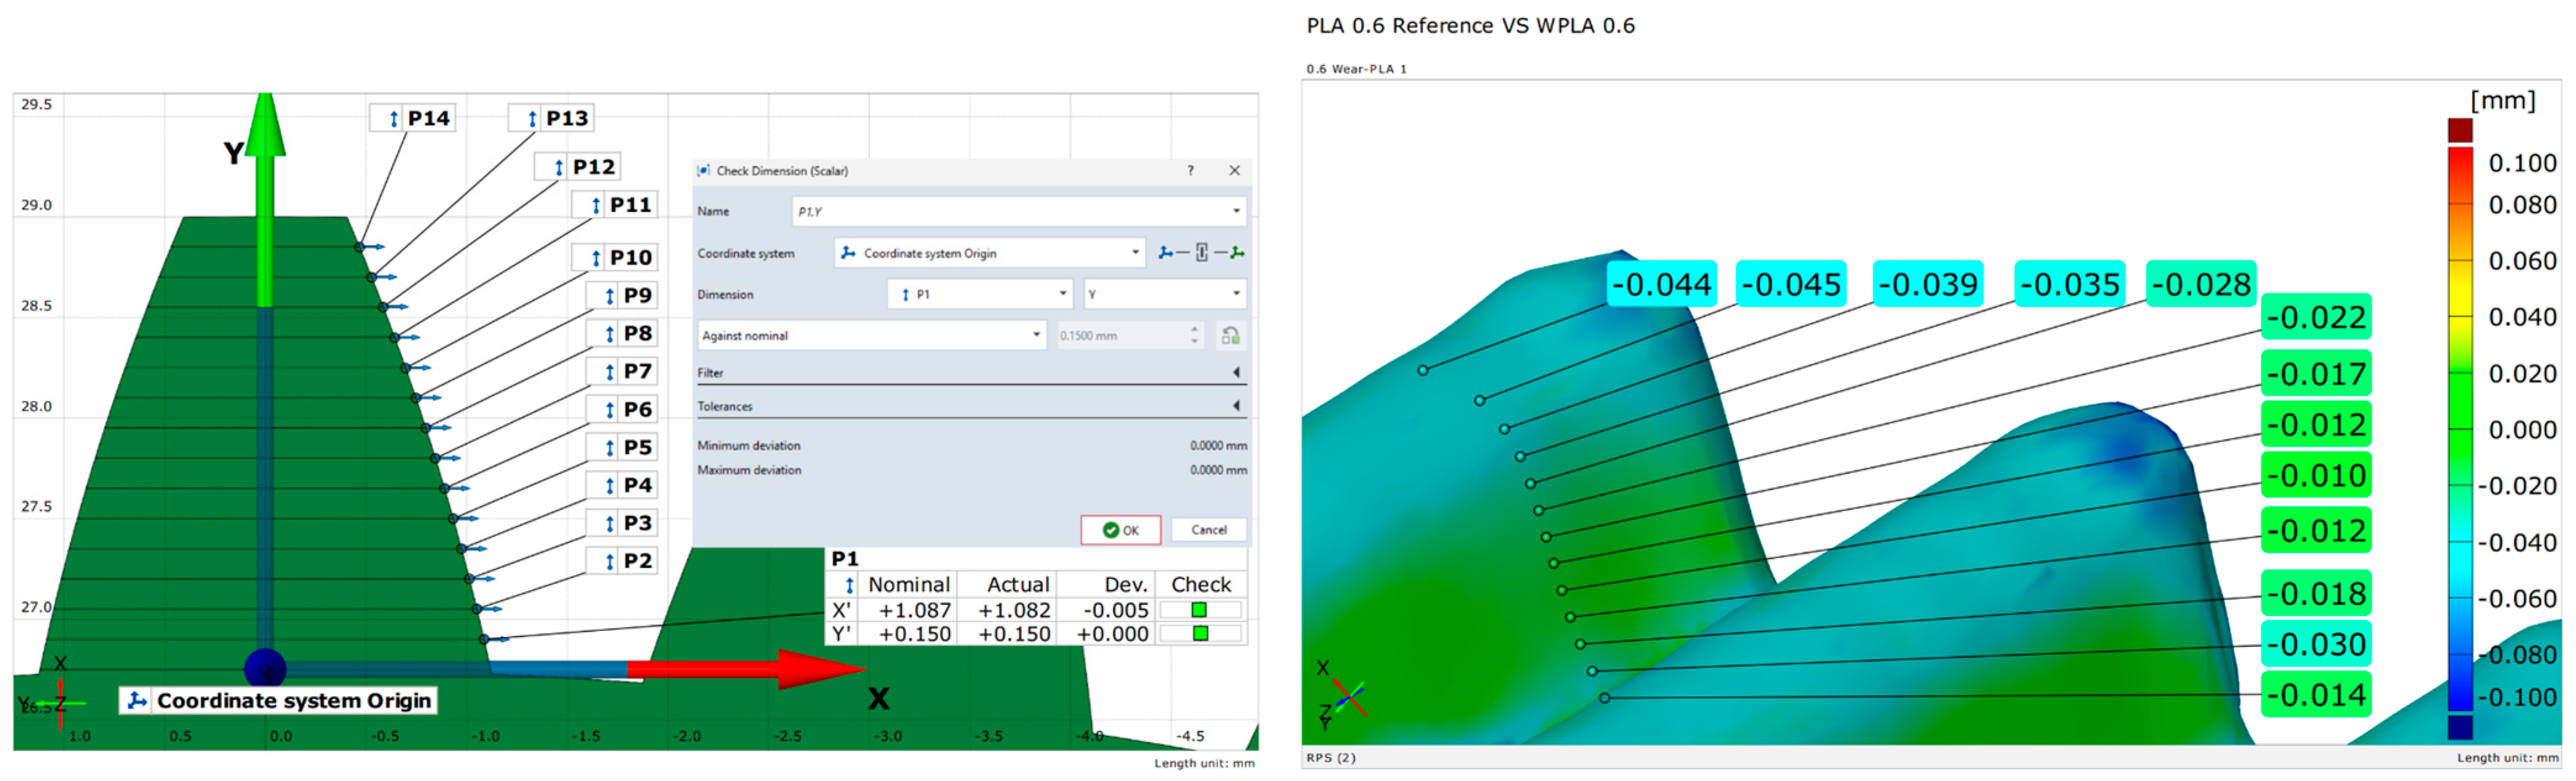
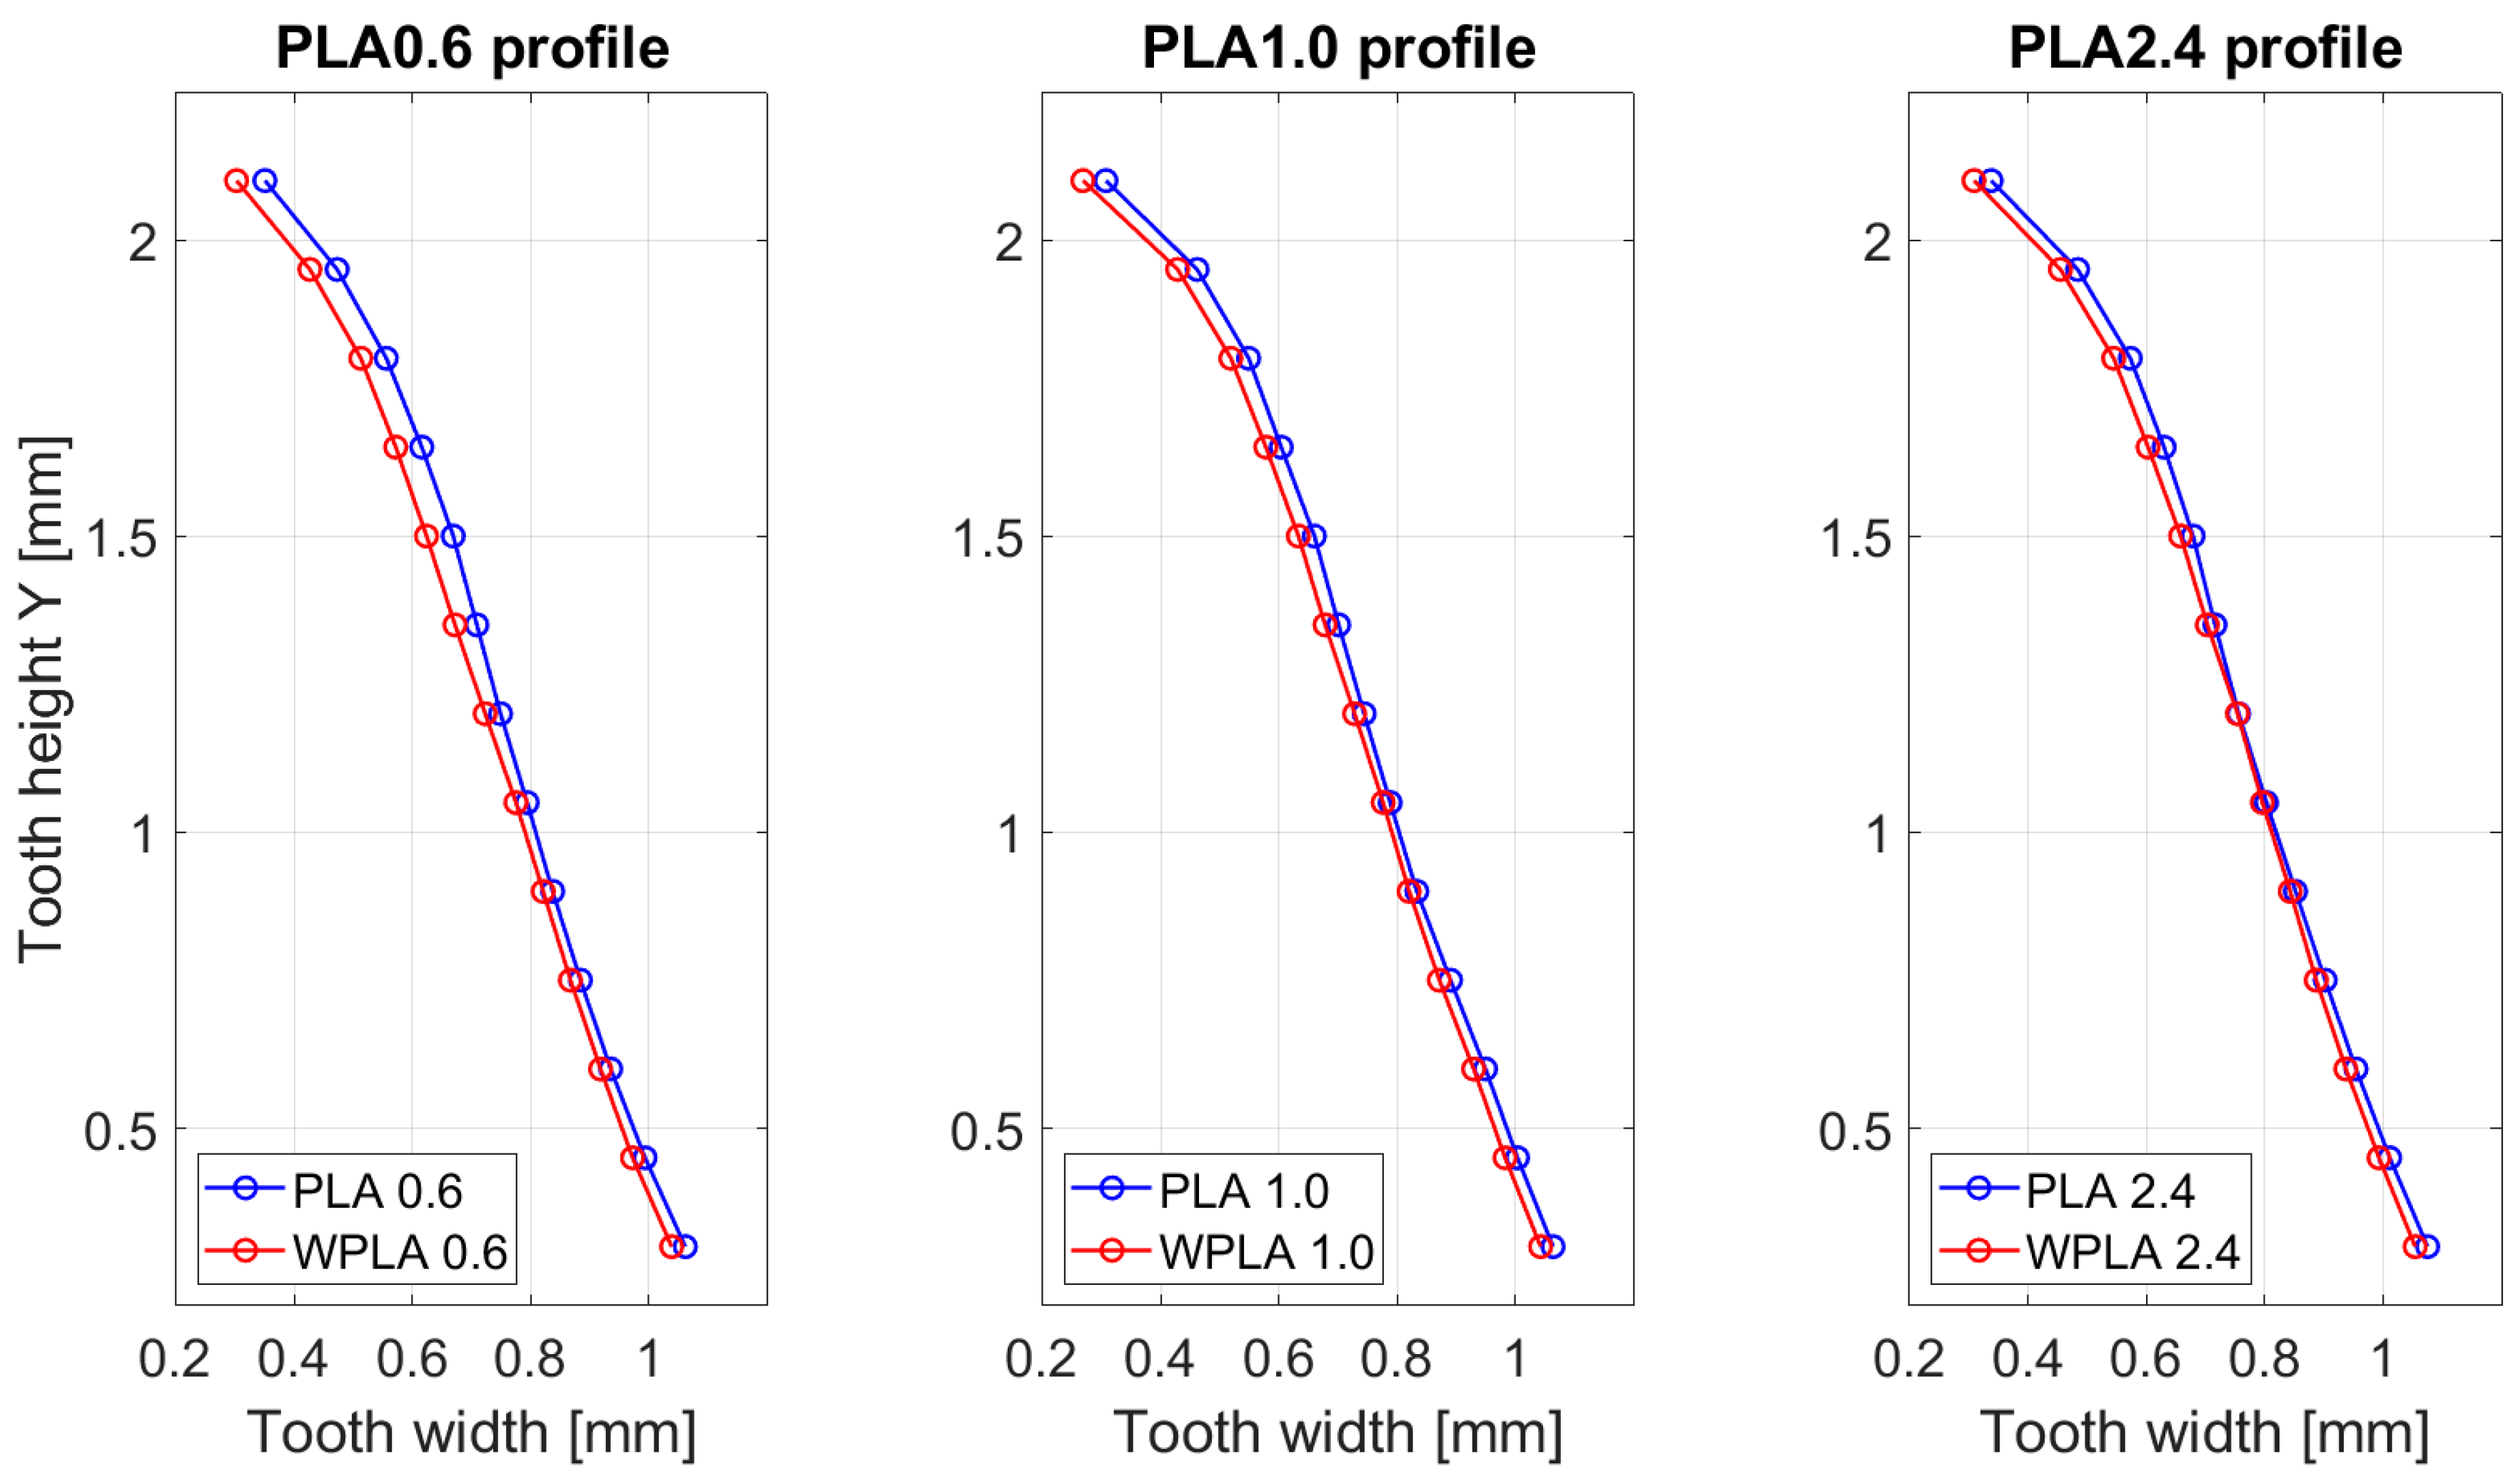
The wear of the PLA0.6, PLA1.0, and PLA2.4 gears was determined by comparing the 3D-scanned models obtained before and after the wear tests. The coordinates of the evaluated points along the tooth profile, both before and after the wear tests, are presented in
Table A1 (
Appendix A). At the level of the geometric profile of the tooth flank, the changes induced by wear testing are conclusive and provide valuable insights into the influence of tooth structural stiffness on the wear mechanism. The results indicate more pronounced wear in the gear with a wall thickness of 0.6 mm compared to those with wall thicknesses of 1.0 mm and 2.4 mm, respectively. For the gear with a 0.6 mm wall thickness, an average wear depth of 0.0309 mm was recorded, with a non-uniform distribution along the tooth flank. In contrast, the gear with a 2.4 mm wall thickness exhibited significantly lower wear of only 0.0181 mm.
For all three gears, PLA0.6, PLA1.0, and PLA2.4, the wear distribution is non-uniform, with a slight increase observed toward the tooth tip (
Figure 10).
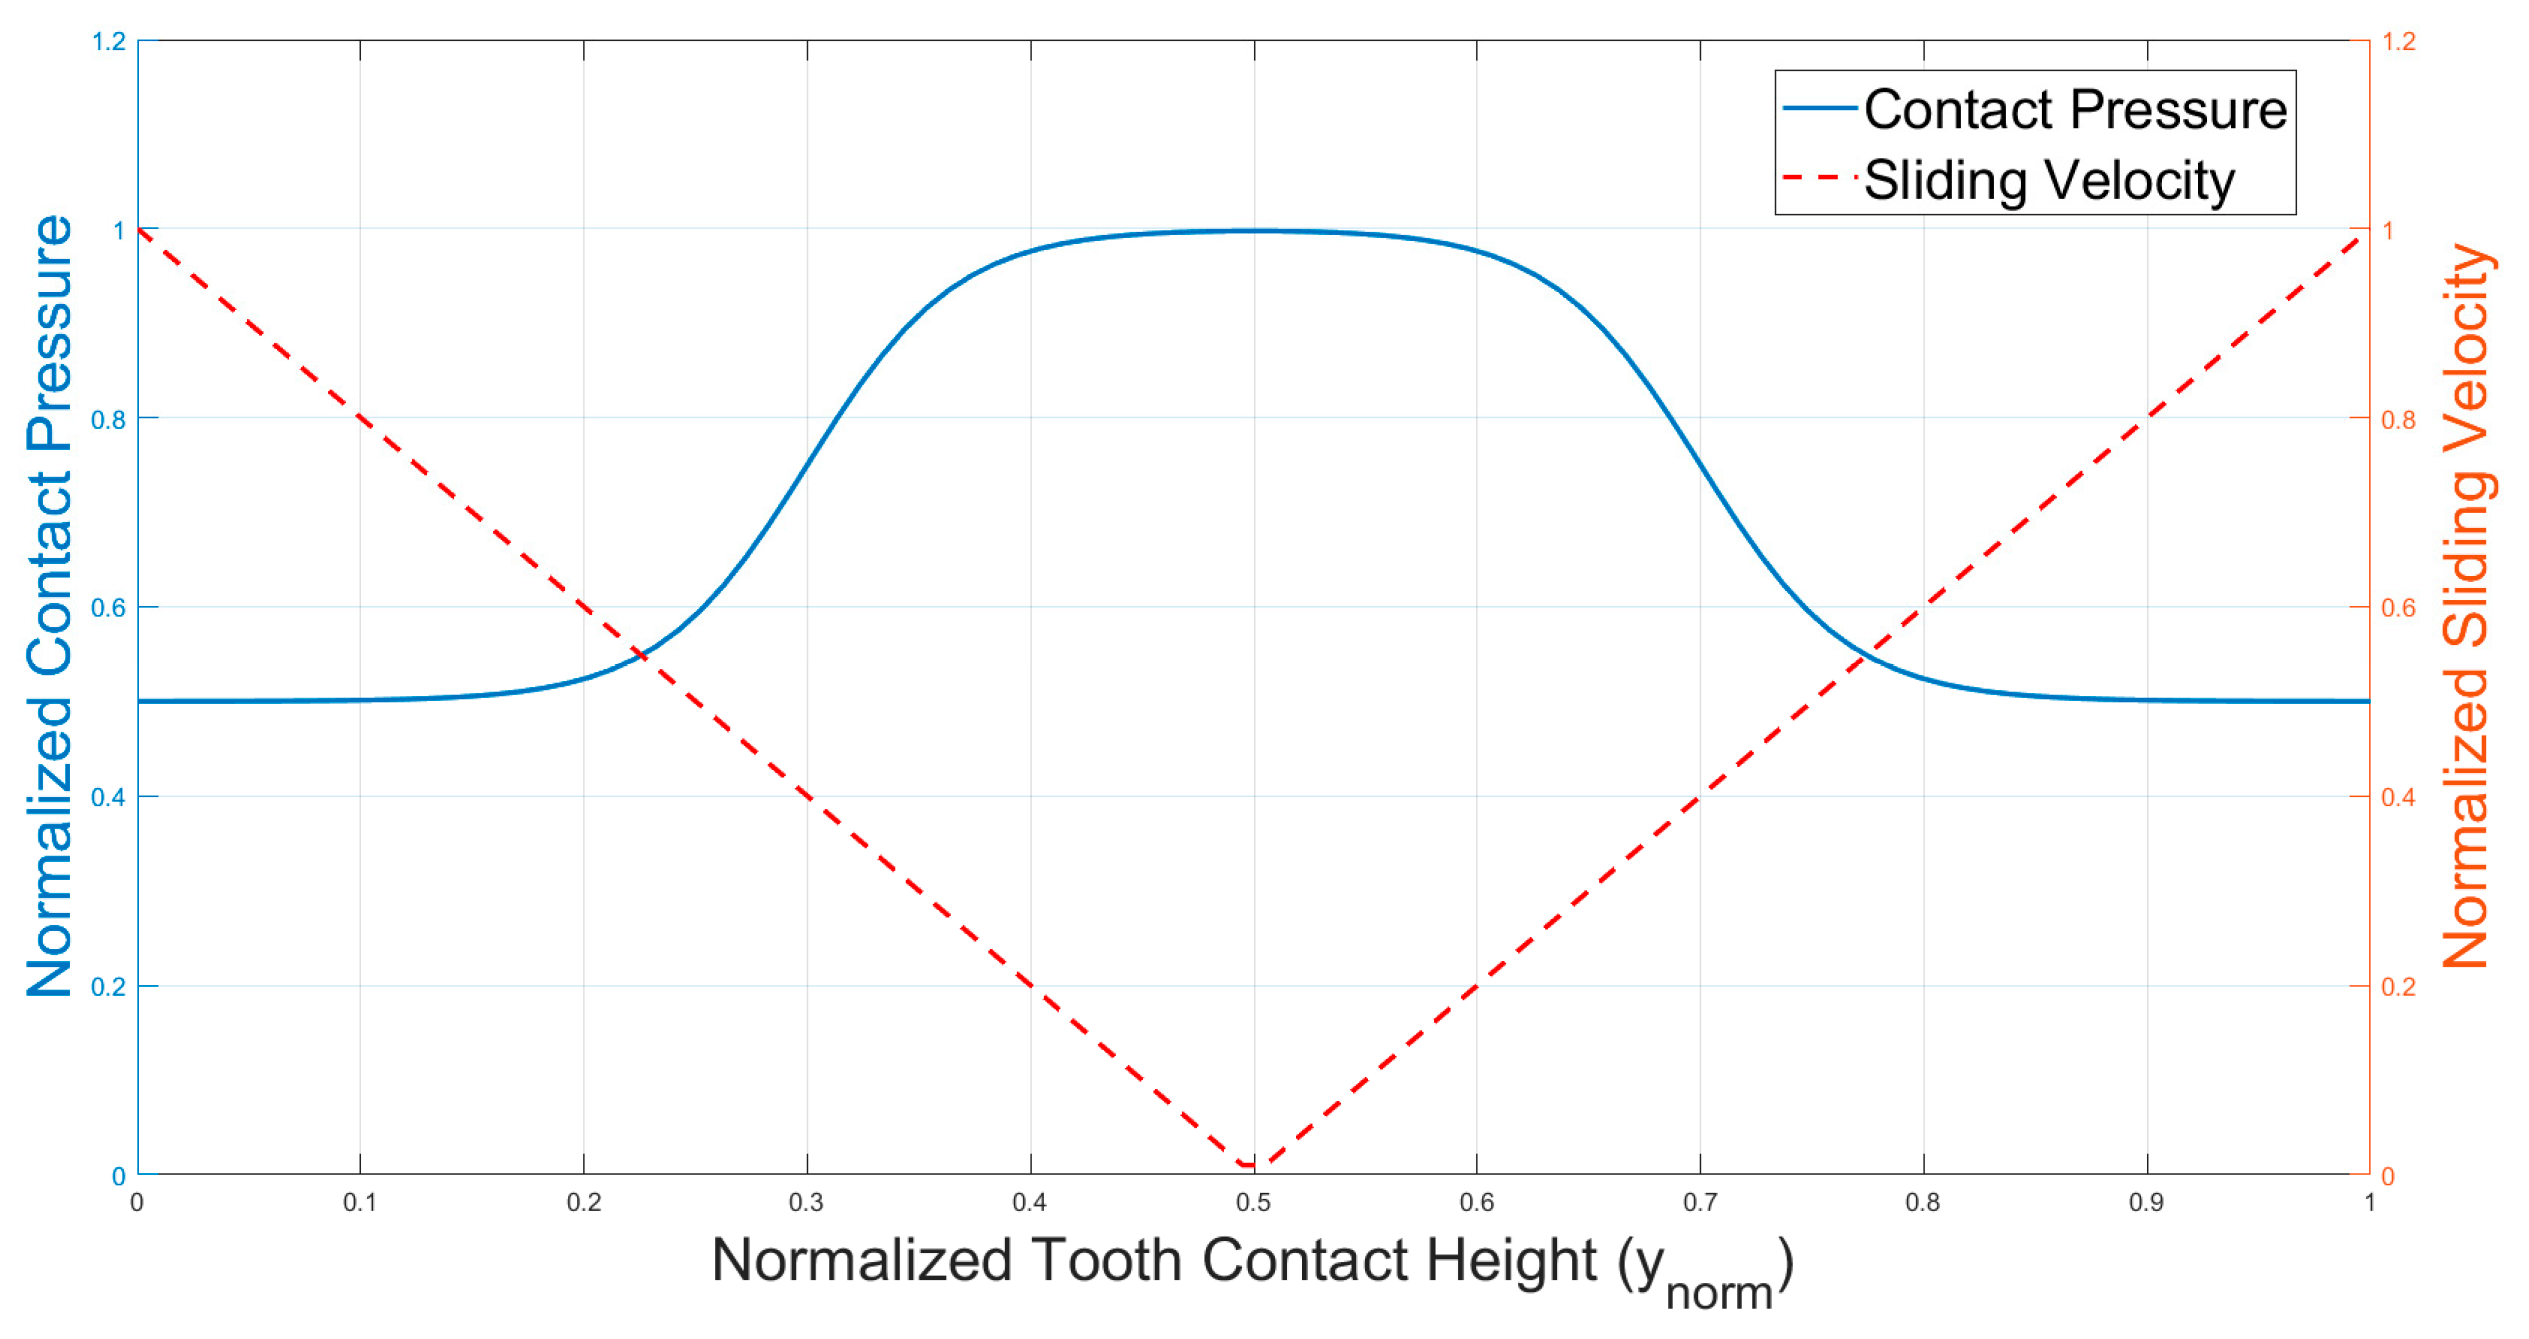
From a tribological and mechanical perspective, the main parameters underlying the modeling of abrasive wear are sliding velocity, contact pressure, and rotational speed (cycles). During the wear tests, a low and constant rotational speed of only 0.5 RPS was employed to avoid inducing direct structural changes in the material. Consequently, the influence of rotational speed on the wear process can be considered negligible and was excluded from the evaluation model.
An essential factor in modeling the abrasive wear of gear teeth is the relative sliding velocity between the mating flanks. This velocity governs the amount of tangential displacement and frictional work occurring at the contact interface, and therefore directly influences the local wear rate. Theoretically, the evolution of sliding velocity during meshing leads to a symmetric increase in wear toward both the root and the tip of the tooth, following a profile characterized by a minimum at the pitch point and maxima at the entry and exit points of engagement (
Figure 11) [
26,
35]. Sliding velocity can be modeled using the following function:
where
is the normalized tooth height, defined over the interval [0, 1], with
representing the local height at point
along the tooth flank, and
is the tooth height.
Another critical factor in modeling the wear behavior of polymer gears is the distribution of contact pressure along the tooth flank, which depends on the relative position of the meshing gears. From the moment when tooth
m−1 comes into the mesh, corresponding to a normalized height of
, down to approximately
, tooth
m remains in contact within the interval
. This leads to a redistribution of contact pressure between the two teeth over the intervals [0
] and [0
]. In the central interval [0.3
–0.7
], the meshing occurs exclusively on a single tooth, which bears the full contact load (
Figure 11). Although the classical literature often describes this pressure distribution as a step function [
26], it becomes evident that for polymer gears, a more realistic approach involves a polynomial or smooth transition function. Accordingly, the contact pressure distribution can be effectively modeled using a sigmoid function controlled by a sharpness parameter
, allowing for a gradual transfer of load between the two meshing teeth (
Figure 11):
In addition to the sliding and pressure components, accurately describing the experimentally observed differences in wear between the tooth root and tip requires incorporating a stiffness-related term into the mathematical wear model. Considering the manufacturing process of the gear, tooth stiffness can be correlated with the solid cross-sectional ratio, which is directly dependent on wall thickness. A lower value of solid cross-sectional ratio results in an overall increase in the structural elasticity of the tooth, which leads to greater deformation during operation and, consequently, more pronounced abrasive wear due to altered sliding velocity.
As a primary conclusion, for an accurate prediction of abrasive wear in polymeric gears manufactured through FDM, it is essential to develop a mathematical model that incorporates the key physical and structural factors influencing wear.
Considering the theoretical aspects discussed above, a general mathematical model that describes the evolution of abrasive wear on the flank of a gear tooth manufactured via FDM can be expressed by the following equation:
where
is a function describing the influence of tooth stiffness,
models the variation in sliding velocity along the flank as a function of height,
defines the contribution of contact pressure, and
is a function representing the influence of both angular velocity and the accumulated number of engagement cycles. The coefficients,
correspond to the weighting factors for each component contributing to wear.
The experimental results obtained for the three tested gears enabled the development and refinement of a specific mathematical model for simulating the distribution of abrasive wear along the tooth flank in PLA gears manufactured via FDM. The model incorporates independent functions and corresponding influence coefficients for each contributing component. Since the experimental input data did not include variations in angular velocity, its contribution within the model was integrated as a neutral term, defined as
. Additionally, the contact pressure component was kept at a normalized level and modeled using the sigmoid function, denoted as
. In modeling contact pressure for plastic gear meshing, it is particularly important to capture the transition from double-tooth to single-tooth contact, as a stepwise approximation does not realistically reflect how pressure evolves during engagement. In our mathematical model, this transition was represented through the sharpness factor
, derived from experimental data:
where
quantifies the contribution of flank height, reflecting the vertical gradient in bending rigidity.
is the coefficient related to the material’s physical properties. This parameter was introduced to account for the material’s elastic response, acting as a correction factor for the rigidity term in the wear model.
is the percentage of wall thickness relative to the base tooth width, where is the wall thickness.
is the sliding coefficient.
The description of the worn tooth profile obtained from the simulation
is carried out by subtracting the wear values from the base profile.
The influence coefficients
were determined based on experimental data using multi-objective optimization algorithms [
39]. The objective was to minimize the root mean square error (RMSE) between the simulated and experimentally measured wear profiles, ensuring a close alignment between model predictions and actual gear behavior. During the optimization process, initial values for all coefficients were selected based on engineering judgment and preliminary testing:
,
,
, and k = 10. Starting from these initial parameters, we defined the search space for the Pareto optimization process using the following ranges: α ∈ [0.02, 0.15],
∈ [0.65, 0.99], β ∈ [0.02, 0.15], and k ∈ [5, 25]. The final optimized set of parameters was determined as
,
,
, resulting in an RMSE of only 0.003429.
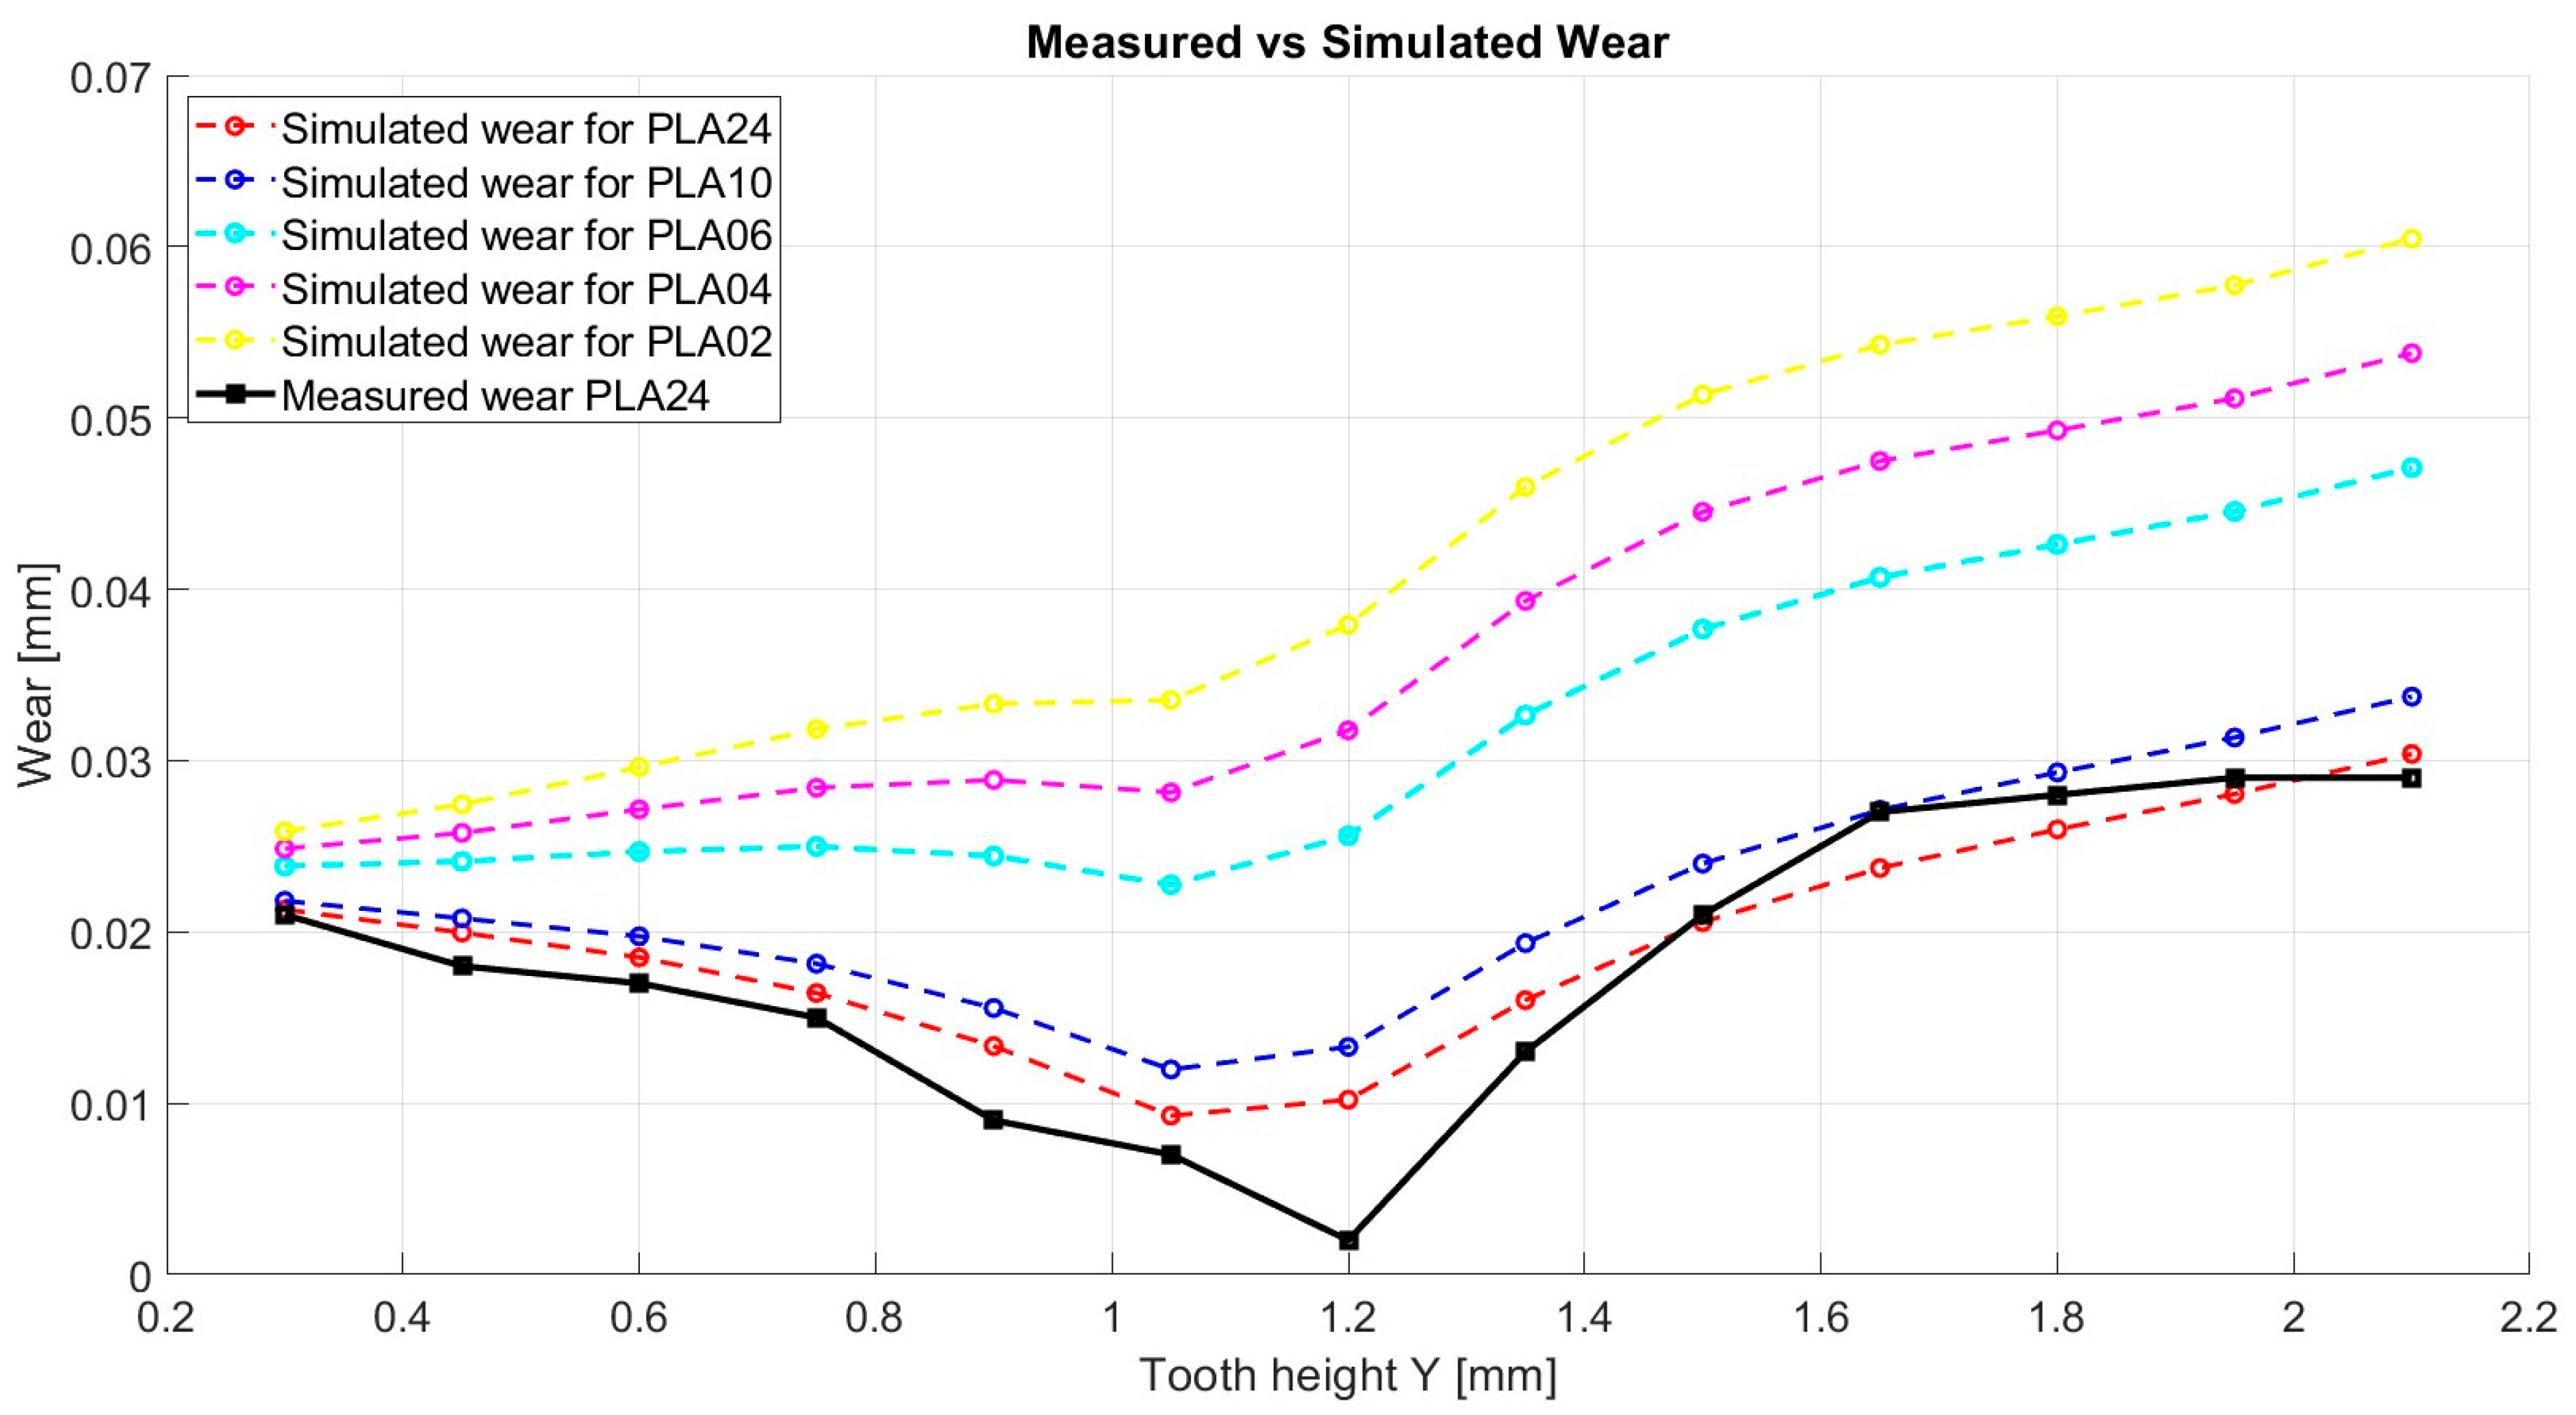
The simulation results are highly satisfactory, yielding small errors when compared to the input data (
Figure 12).
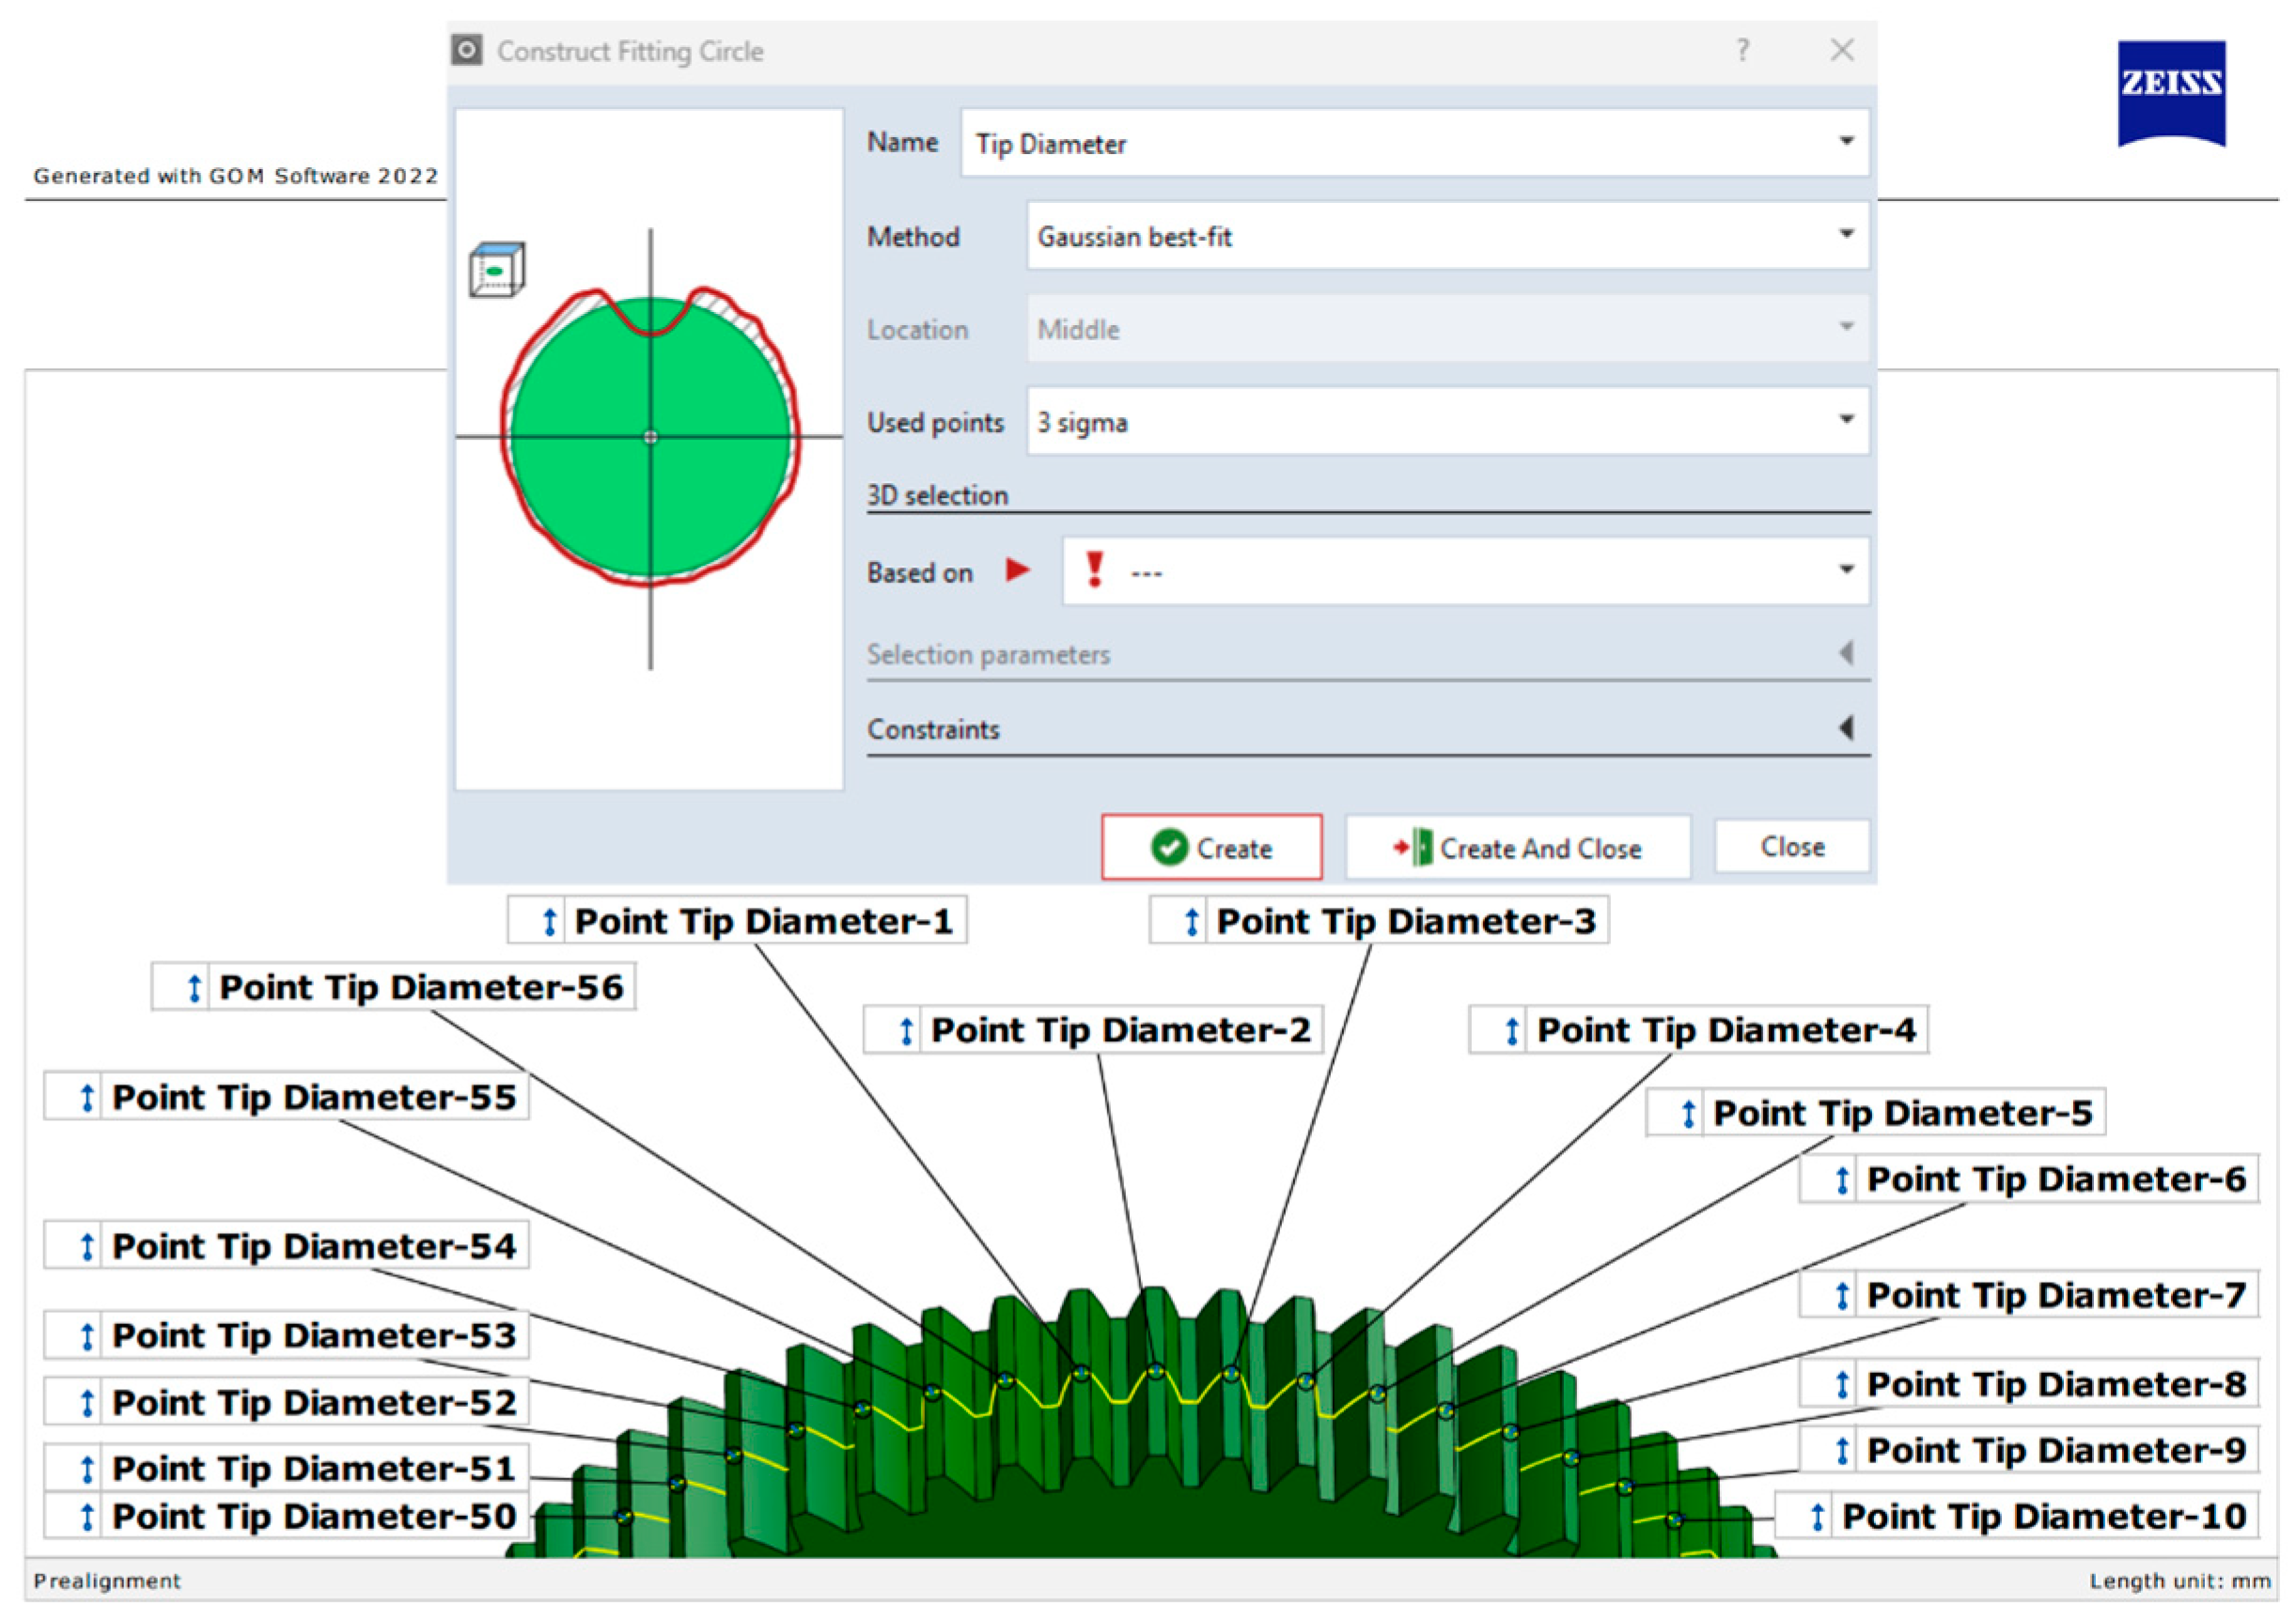
From the perspective of the tip diameter of the tested gears, abrasive wear testing did not reveal any significant changes (
Table 1), and no clear trend was observed in relation to wall thickness.
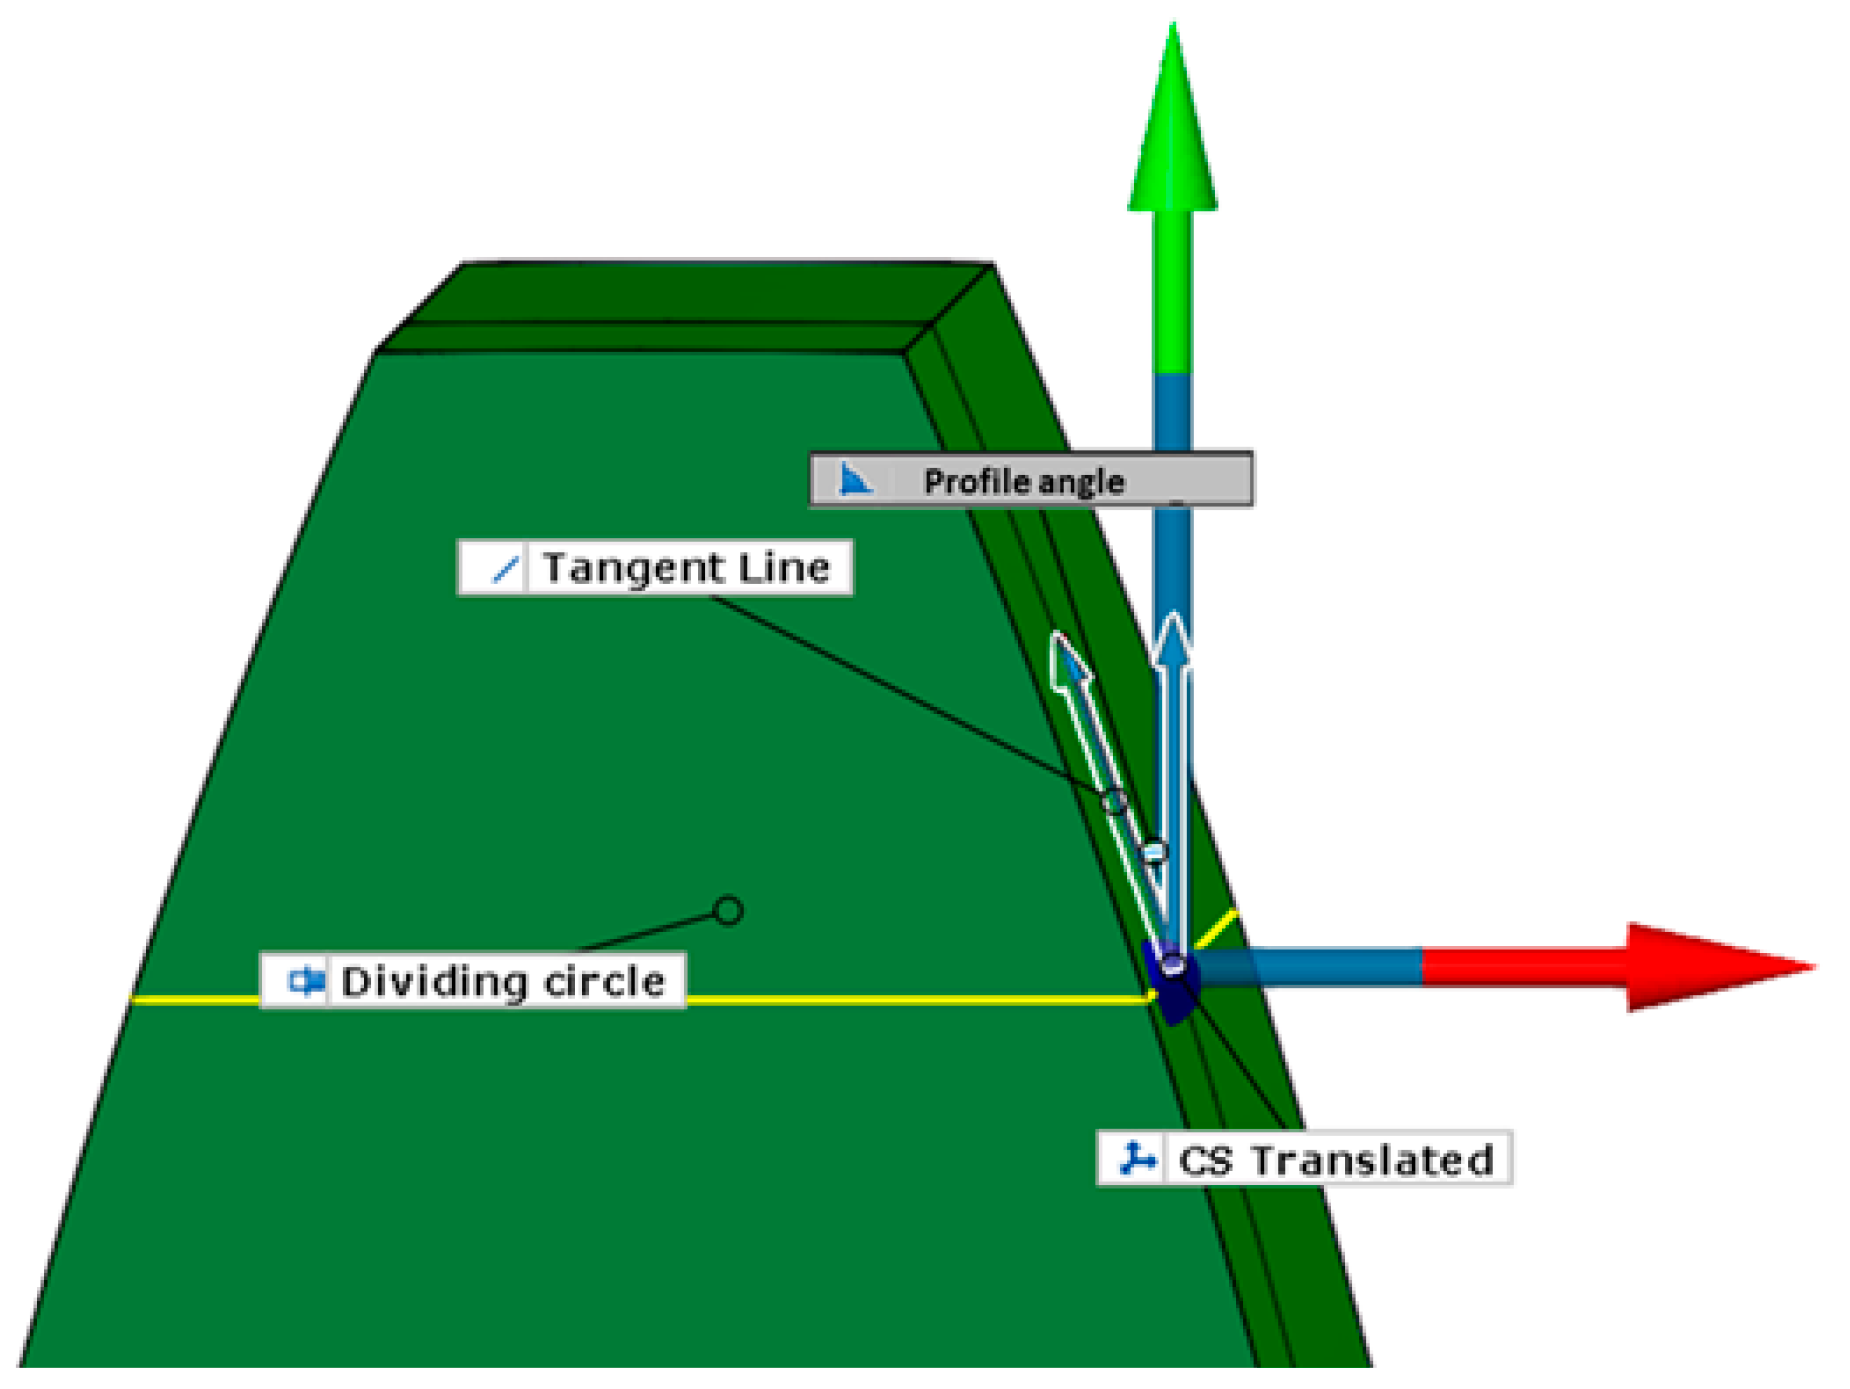
Analysis of the tooth profile angle for the evaluated gears showed no significant differences attributable to the manufacturing process across the three configurations (
Table 2). However, abrasive wear tests revealed an increase in the pressure angle in all cases. For the PLA0.6 gear, the pressure angle increased by 1.22°, while for the PLA2.4 gear, the increase reached 1.44°.
4. Discussion
The results obtained are valuable, as they highlight the main influencing factors in the evolution of abrasive wear on the flank of FDM 3D-printed gears. Furthermore, these findings allow for a reassessment of the manufacturing process in order to improve the overall quality of the 3D-printed gear meshing performance. Using the pitch point corresponding theoretically to zero sliding velocity as a reference for evaluating abrasive wear on the flank of the gear, all three cases demonstrate a more significant progression of wear toward the tooth tip relative to the root. In the case of PLA1.0 and PLA2.4 gears, the wear reaches a minimum approximately at the pitch circle (
Figure 10). An exception is noted for the PLA0.6 gear, where the minimum wear point is shifted toward the tooth root.
Experimental findings reveal an inverse proportionality between abrasive wear and the tooth stiffness of PLA gears manufactured via FDM. This behavior is primarily attributed to micro-deformations occurring at the tooth tip during meshing. Although such deformations may suggest a reduction in wear at the tip based on the assumption that the contact pressure is partially transferred to the base of the adjacent tooth (m + 1) when tooth m enters the mesh with its tip, this assumption is contradicted by the results. The findings indicate that sliding velocity remains the dominant factor governing abrasive wear. These micro-deformations alter the peak value and the progression of the sliding velocity along the flank, which further explains the shift in the wear minimum from the pitch point toward the root in the case of the PLA0.6 gear.
Furthermore, the experimental data supported the development of a practical mathematical model that not only accounts for sliding velocity and contact pressure but also introduces a stiffness-related term to better reflect the mechanical behavior of the gear tooth. Based on this model and using input data from the PLA2.4 gear, simulations were carried out for gear configurations with wall thicknesses of 0.2 mm, 0.4 mm, 0.6 mm, 1.0 mm, and 2.4 mm (
Figure 13). The simulation results indicate a pronounced degradation at the tooth tip compared to the root as structural rigidity decreases. As the internal structure of the tooth becomes less solid, reflected by a cross-sectional solid ratio below 100%, the wear pattern predicted by the model tends to evolve linearly along the tooth height. This reduction in structural integrity accounts for the significantly more pronounced wear observed between PLA10 and PLA0.6 compared to the relatively minor difference seen between PLA10 and PLA2.4, both of which preserve a largely solid internal composition. However, it must be understood that there is a threshold beyond which wear progresses uniformly at both the tip and the root of the tooth, while still preserving their inherent differences. Over time, this intensified wear at the tip may result in tooth fracture. Nevertheless, the primary objective of this study is the monitoring and characterization of the wear of PLA gears manufactured via FDM, aiming to evaluate their suitability for integration into precision mechanical systems, not the determination of their failure limits.
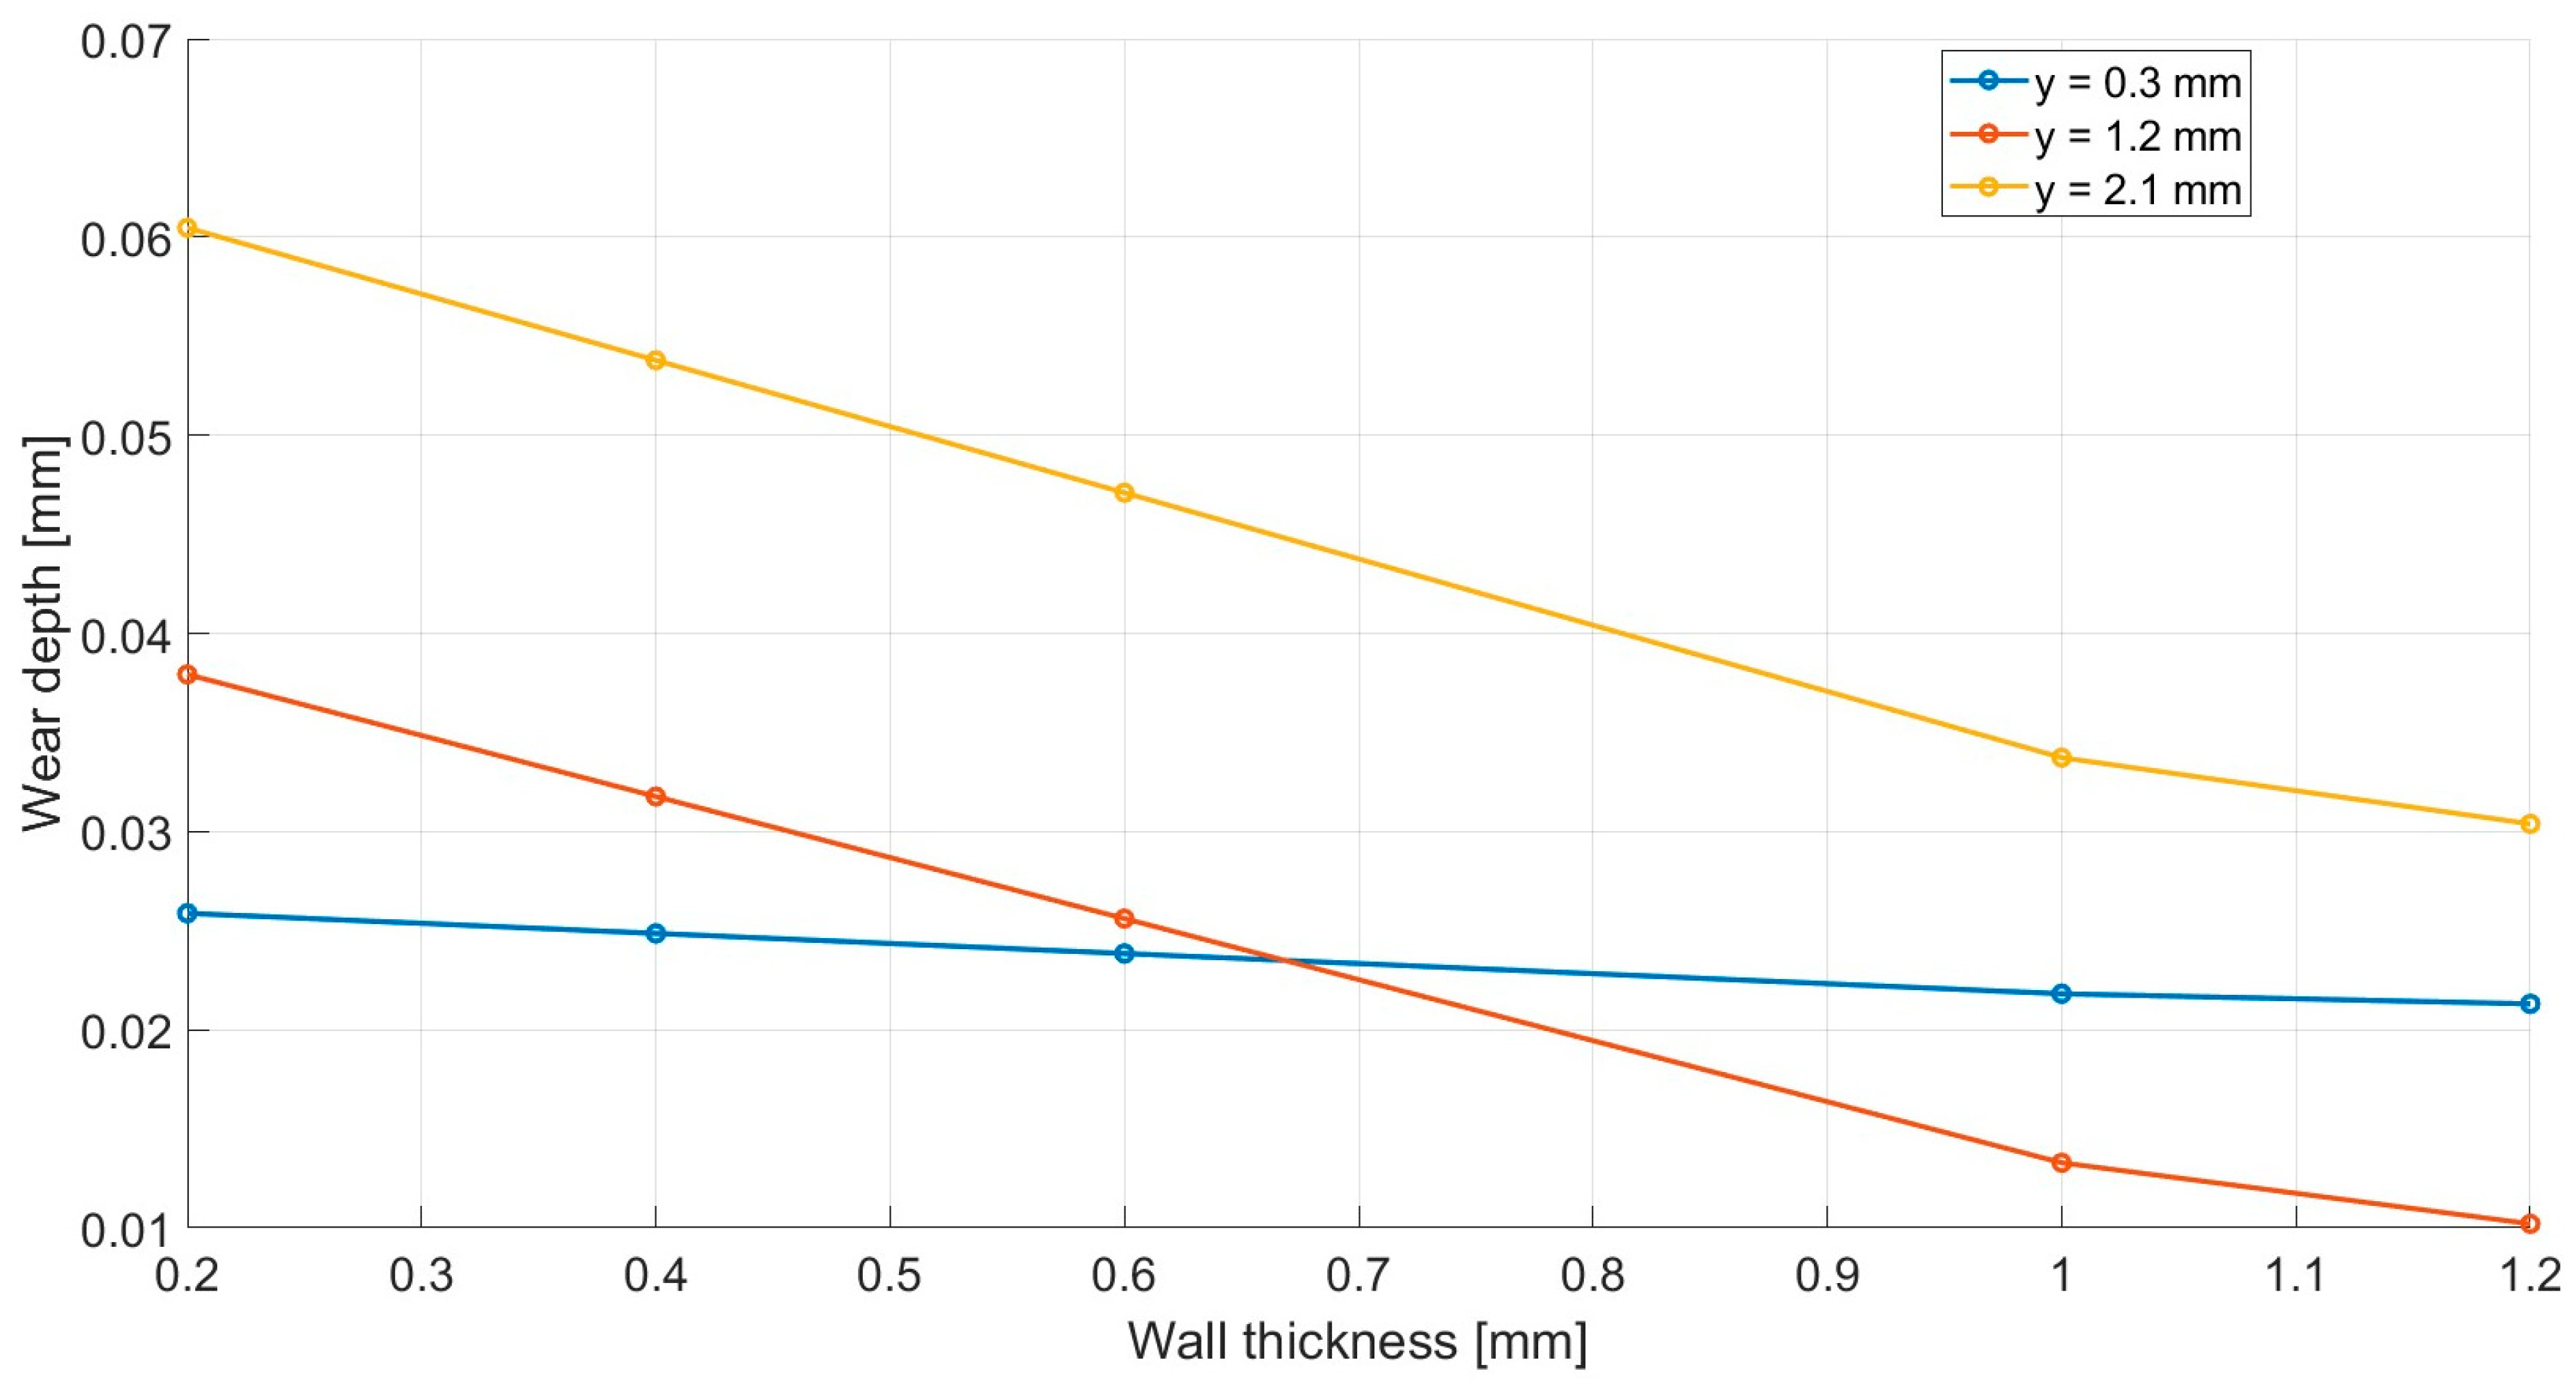
The simulation data, correlated with experimental results, indicate that abrasive wear in gears manufactured through FDM is influenced by the solid cross-sectional ratio, which directly affects the resulting tooth stiffness. From a theoretical perspective, abrasive wear in polymer gears is governed by sliding velocity and contact pressure. Based on the mathematical expressions modeling these two phenomena, one would expect a uniform wear distribution along the tooth profile. However, the results obtained exhibit a distinct behavior, primarily due to the dominant effect of sliding velocity, compounded by the intrinsic material flexibility and the overall structural compliance of the tooth. With sliding velocity as the dominant factor, for a perfectly rigid tooth structure, as in conventionally molded polymer gears, wear tends to be symmetrical about the pitch point, with comparable maxima at both the root and tip of the tooth. In contrast, for PLA gears fabricated via FDM, simulations show that the wear profile aligns with the theoretical behavior only when the solid cross-sectional ratio approaches 100% (
Figure 14).
An important observation emerged from the monitoring of the pressure angle. Geometrical changes occurring at the tooth profile level in the gear with an optimal structure, PLA2.4, led to a greater increase in the pressure angle compared to the PLA0.6 gear. This phenomenon is primarily attributed to the fact that the meshing behavior of the PLA0.6 gear does not conform to theoretical formulations. In this case, the contact pressure and sliding velocity follow a distinct pattern: the sliding velocity is no longer zero at the pitch point but shifts toward the tooth root. As a result, wear intensifies in the region of the pitch point, thereby explaining the smaller increase in the pressure angle for the PLA0.6 gear, in contrast to PLA2.4, where wear is minimal, nearly zero at the pitch point, and reaches its maximum value toward the tooth tip.
5. Conclusions
In precision mechanical systems, gear transmissions typically employ gears with a maximum module value of 1 mm. Under these conditions, the degradation of PLA gears manufactured via FDM must be assessed in terms of the performance of the gear assembly, rather than in terms of gear failure. A gear transmission operating outside optimal conditions introduces vibrations and inaccuracies, which are the primary adversaries in precision mechanics.
From a theoretical standpoint, abrasive wear in plastic gear transmissions is influenced by the sliding velocity, contact pressure, and angular velocity, all of which alter the physical parameters of the material. Considering that FDM technology allows general control over structural stiffness by adjusting printing parameters, it naturally introduces the challenge of monitoring abrasive wear as a function of tooth stiffness, which can be quantified as a fill factor in the tooth cross-section at the root circle. Tooth stiffness has a general influence on abrasive wear: less rigid tooth structures tend to degrade more rapidly.
For the three evaluated gears, PLA06, PLA10, and PLA24, a higher degree of abrasive wear was observed at the tooth tip compared to the tooth root. These findings indicate that the predominant factor influencing abrasive wear in polymer gears is the sliding velocity. This observation is further supported by the fact that contact pressure exhibits a step-like mathematical behavior. However, in the case of PLA gears manufactured via FDM, the transition from single-tooth to double-tooth meshing occurs progressively, due to both the material’s elasticity and the elastic deformation of the tooth; no pronounced peaks in abrasive wear are observed in the transition zone.
The non-uniform distribution of abrasive wear along the tooth profile led to increases in the pressure angle for all three gears, with the highest increase observed in the PLA2.4 gear. Notably, in the case of the PLA06 gear, the point of minimal wear was found to shift from the pitch point toward the tooth root, which explains the alterations observed in the pressure angle.
Based on the experimental data, a mathematical model was developed, which can be further scaled by incorporating a term accounting for the influence of angular velocity and the number of operating cycles. Moreover, the model can be adapted for gears manufactured from injection-molded plastics, enabling the generation of characteristic thresholds relevant to predictive maintenance strategies in gear applications.
In the case of PLA gears manufactured via FDM, simulations suggest that wear progression closely follows theoretical predictions when the tooth structure has a 100% solid cross-sectional ratio.


