Composition of ω-Phase Particles in Ti(Mo) Alloys Studied by Anomalous X-ray Diffraction


1
Department of Physics of Materials, Charles University, Ke Karlovu 5, 121 16 Prague, Czech Republic
2
Department of Solid State Physics, Charles University, Ke Karlovu 5, 121 16 Prague, Czech Republic
3
CEITEC, Masaryk University, Kotlářská 2, 611 37 Brno, Czech Republic
*
Author to whom correspondence should be addressed.
Crystals 2019, 9(9), 440; https://doi.org/10.3390/cryst9090440
Submission received: 29 July 2019
/
Revised: 19 August 2019
/
Accepted: 20 August 2019
/
Published: 23 August 2019
(This article belongs to the Special Issue Investigation of Nanostructures with X-ray Scattering Techniques)
Abstract
:Nanoparticles of hexagonal phase in bcc-Ti(Mo) single crystals ( phase) occur due to a diffusionless athermal to transformation and they grow during follow-up ageing at elevated temperatures, while the alloying atoms (Mo in our case) are expelled from the nanoparticle volumes. We investigated the Mo content in growing nanoparticles by anomalous X-ray diffraction and demonstrate that the Mo expulsion from the phase is not full; a thin shell of a nanoparticles where the to transformation is not complete still contains a considerable amount of Mo atoms.
1. Introduction
Nanoparticles of metastable phase occur at a certain composition range in the metastable alloys of Group IV elements, including important engineering alloys of Ti and Zr [1]. These particles are either ellipsoidal in low misfit systems [2,3] or cuboidal in systems with a higher misfit [4,5]. The particles are several tens of nanometers in size and homogeneously distributed throughout the parent matrix. From a crystallographic viewpoint, the particles have a hexagonal structure and are coherent with the body-centered cubic matrix [6]. It has been shown recently that the particles of the phase are spontaneously ordered along directions in the cubic phase [7].
Since its discovery by Frost et al. [8], there has been a considerable interest in the phase due to its influence on mechanical and superconducting properties of Ti and Zr alloys [9,10]. Until recently, it was widely believed that the formation of the phase is a purely displacive transformation accomplished by the collapse of two neighboring (111) planes and that in this stage the particles have the same composition as the parent matrix [11]. The transformation is sketched schematically in Figure 1, where the atomic positions in the and phases are denoted by black and red spheres, respectively. The lattice parameter of the body-centered phase and the lattice parameters of the hexagonal phase obey the formulas
However, Nag et al. gave an evidence of a mixed-mode transformation during which the structural as well as compositional instabilities play a role during formation [12]. During ageing, the particles grow by a diffusion-assisted, displacement controlled process [13].
There are still discussions regarding the chemical composition of the particles and its evolution during thermal treatment. Hickman studied formation in various Ti alloys including Ti-Mo systems and estimated the phase composition from changes of its lattice parameter and volume fraction determined by transmission electron microscope [14,15]. One-dimensional atom probe was used to study the formation of the particles in Ti–10V–2Fe–3Al (wt.%) alloy [16]. More recently, three-dimensional atom-probe technique was used to investigate the composition of the phase in Ti-Mo alloys [3,17], Ti–5Al–5Mo–5V–3Cr (wt.%) alloy [18], Ti–5Al–5Mo–5V–2Cr–1Fe (wt.%) [19]. From these studies it follows that the phase tends to reject all alloying elements, including the stabilizers such as Al. The rejected atoms of alloying elements create clouds around growing particles. We studied this effect by small-angle X-ray scattering measured in-situ during ageing of Ti(Mo) single crystals; we determined the maximum Mo concentration in the cloud to be approximately 10–15% [20].
In Ref. [21], we showed that the -Ti nanoparticles contain thin shell layers, in which the phase transformation is not complete, and estimated the shell layer thickness to about 1 nm. In our previous paper [22], we used anomalous X-ray diffraction (AXRD) for the study of Mo-rich “clouds” around the growing -Ti nanoparticles [23]. The method consists in measuring the energy dependence of the reciprocal-space distribution of X-ray intensity diffracted from the -Ti matrix for the energies E of the primary photons slightly below and above the MoK absorption edge keV. AXRD experimental data are affected both by the radial profile of the Mo density in the cloud and by the local elastic strains around the nanoparticles so that their interpretation is not straightforward and must be supported by numerical simulations.
In this paper, we present the results of AXRD measurements on a selected diffraction peak in Ti-15wt.%Mo alloy. Using a detailed analysis of the pre-edge region of the AXRD spectra, we were able to determine the chemical composition of particles, since the AXRD signal is not affected by the structure and chemical composition of the -Ti matrix. We demonstrate that a shell layer at the particle/matrix interface contains a reasonable amount of Mo atoms. This method of determination of particle composition can be regarded as a precise technique complementary to other methods reviewed above.
2. Experiments
For the purpose of this experiment, oriented single crystals of Ti-15wt.%Mo alloy (corresponding to Ti-8at.%Mo) were grown using a floating zone technique; details of the growth procedure can be found in our previous papers [24,25]. Individual samples were solution-treated (ST) at 860 for 4 h in an evacuated quartz tube and quenched to water. Subsequently, different heat treated conditions were prepared by ageing in salt baths at temperatures 300 , 335 and 370 for times ranging from 15 min to 512 h. All heat treatments were terminated by water quenching. The aged samples were polished using SiC papers; final polishing was done on a vibratory polisher employing and alumina suspensions and colloidal silica.
The anomalous X-ray diffraction (AXRD) experiments were carried out on a dedicated anomalous X-ray scattering and diffraction beamline BM02 at ESRF, Grenoble, France. The measured energies were near the Mo K absorption edge ( keV) in the energy range of 19.6–20.6 keV. The Ti K absorption edge at approximately 4.96 keV is useless, since the corresponding AXRD signal were hardly sensitive to the presence of Mo atoms. The sample was mounted on a kappa geometry diffractometer; the primary as well as the diffracted beam were in evacuated flight tubes in order to minimize the influence of scattering by air. The diffracted intensity was detected by a two-dimensional pixel detector IMXPAD S70. We acquired the images of the diffraction maximum of the hexagonal lattice for the energies from the above mentioned range with the energy step of 2 eV. We chose this diffraction maximum since it does not coincide with any diffraction peak of the phase and it was easily accessible in the used diffraction geometry and sample orientation.
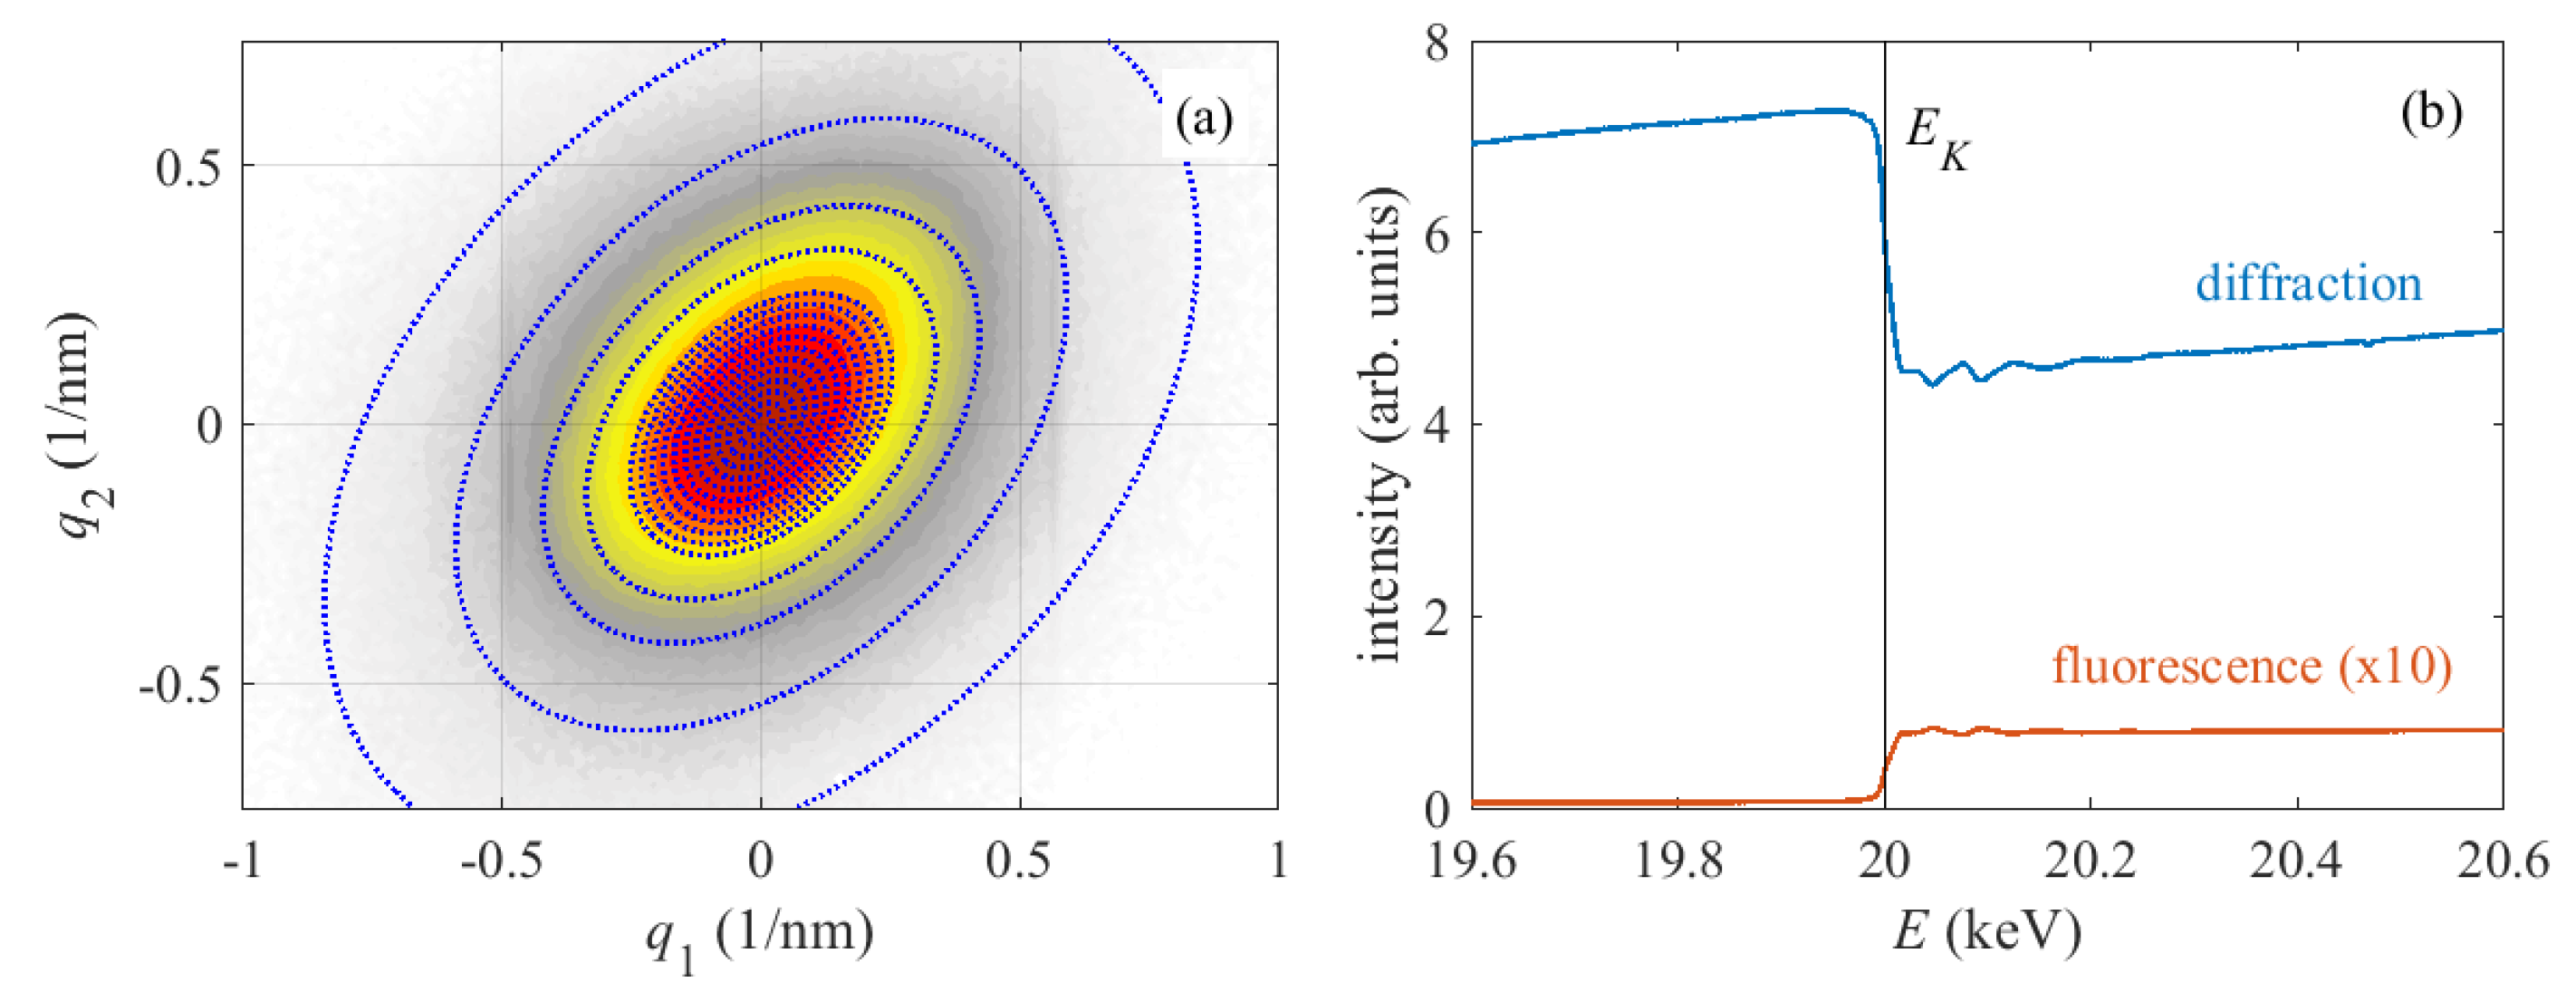
As an example, in Figure 2a, we show one detector image of the diffraction maximum of the sample aged at 370 for 64 h taken at 19.96 keV. The axes of the image are the orthogonal components of the reciprocal-space vector
parallel to the detector plane, are the wave vectors of the primary and scattered X-rays, is the reciprocal-lattice vector (diffraction vector).
The elliptical shape of the maximum is caused by the ellipsoidal particle shapes, the half-axes of the iso-intensity ellipses are inversely proportional to the half-axes of the particle ellipsoids and depend also on the orientation of the ellipsoid axes with respect to the detector plane [21,22].
From the numerical simulations of the AXRD spectra described below, it follows that the AXRD spectra are the same in all points in reciprocal space lying on an iso-intensity contour. To assess the profile of the Mo density in the particles, we define regions of interest (ROIs) in the detector plane from which we extract the AXRD spectra. We chose elliptical ROI boundaries, with the ratios of the axes identical to those of the elliptical iso-intensity contours. In Figure 2a, the ROI boundaries are depicted by blue dotted ellipses; the ROIs are the regions between two subsequent boundaries. Figure 2b displays the AXRD spectrum taken from the whole intensity maximum, i.e., the sum of the signals of all ROIs (blue line), and the fluorescence signal (red), measured in the same setup tilting the sample away from a diffraction maximum. Tiny oscillations on both curves are caused by the absorption fine-structure effects (EXAFS and XANES) as well as by DAFS (diffraction anomalous fine structure); we ignore these oscillations in this paper.
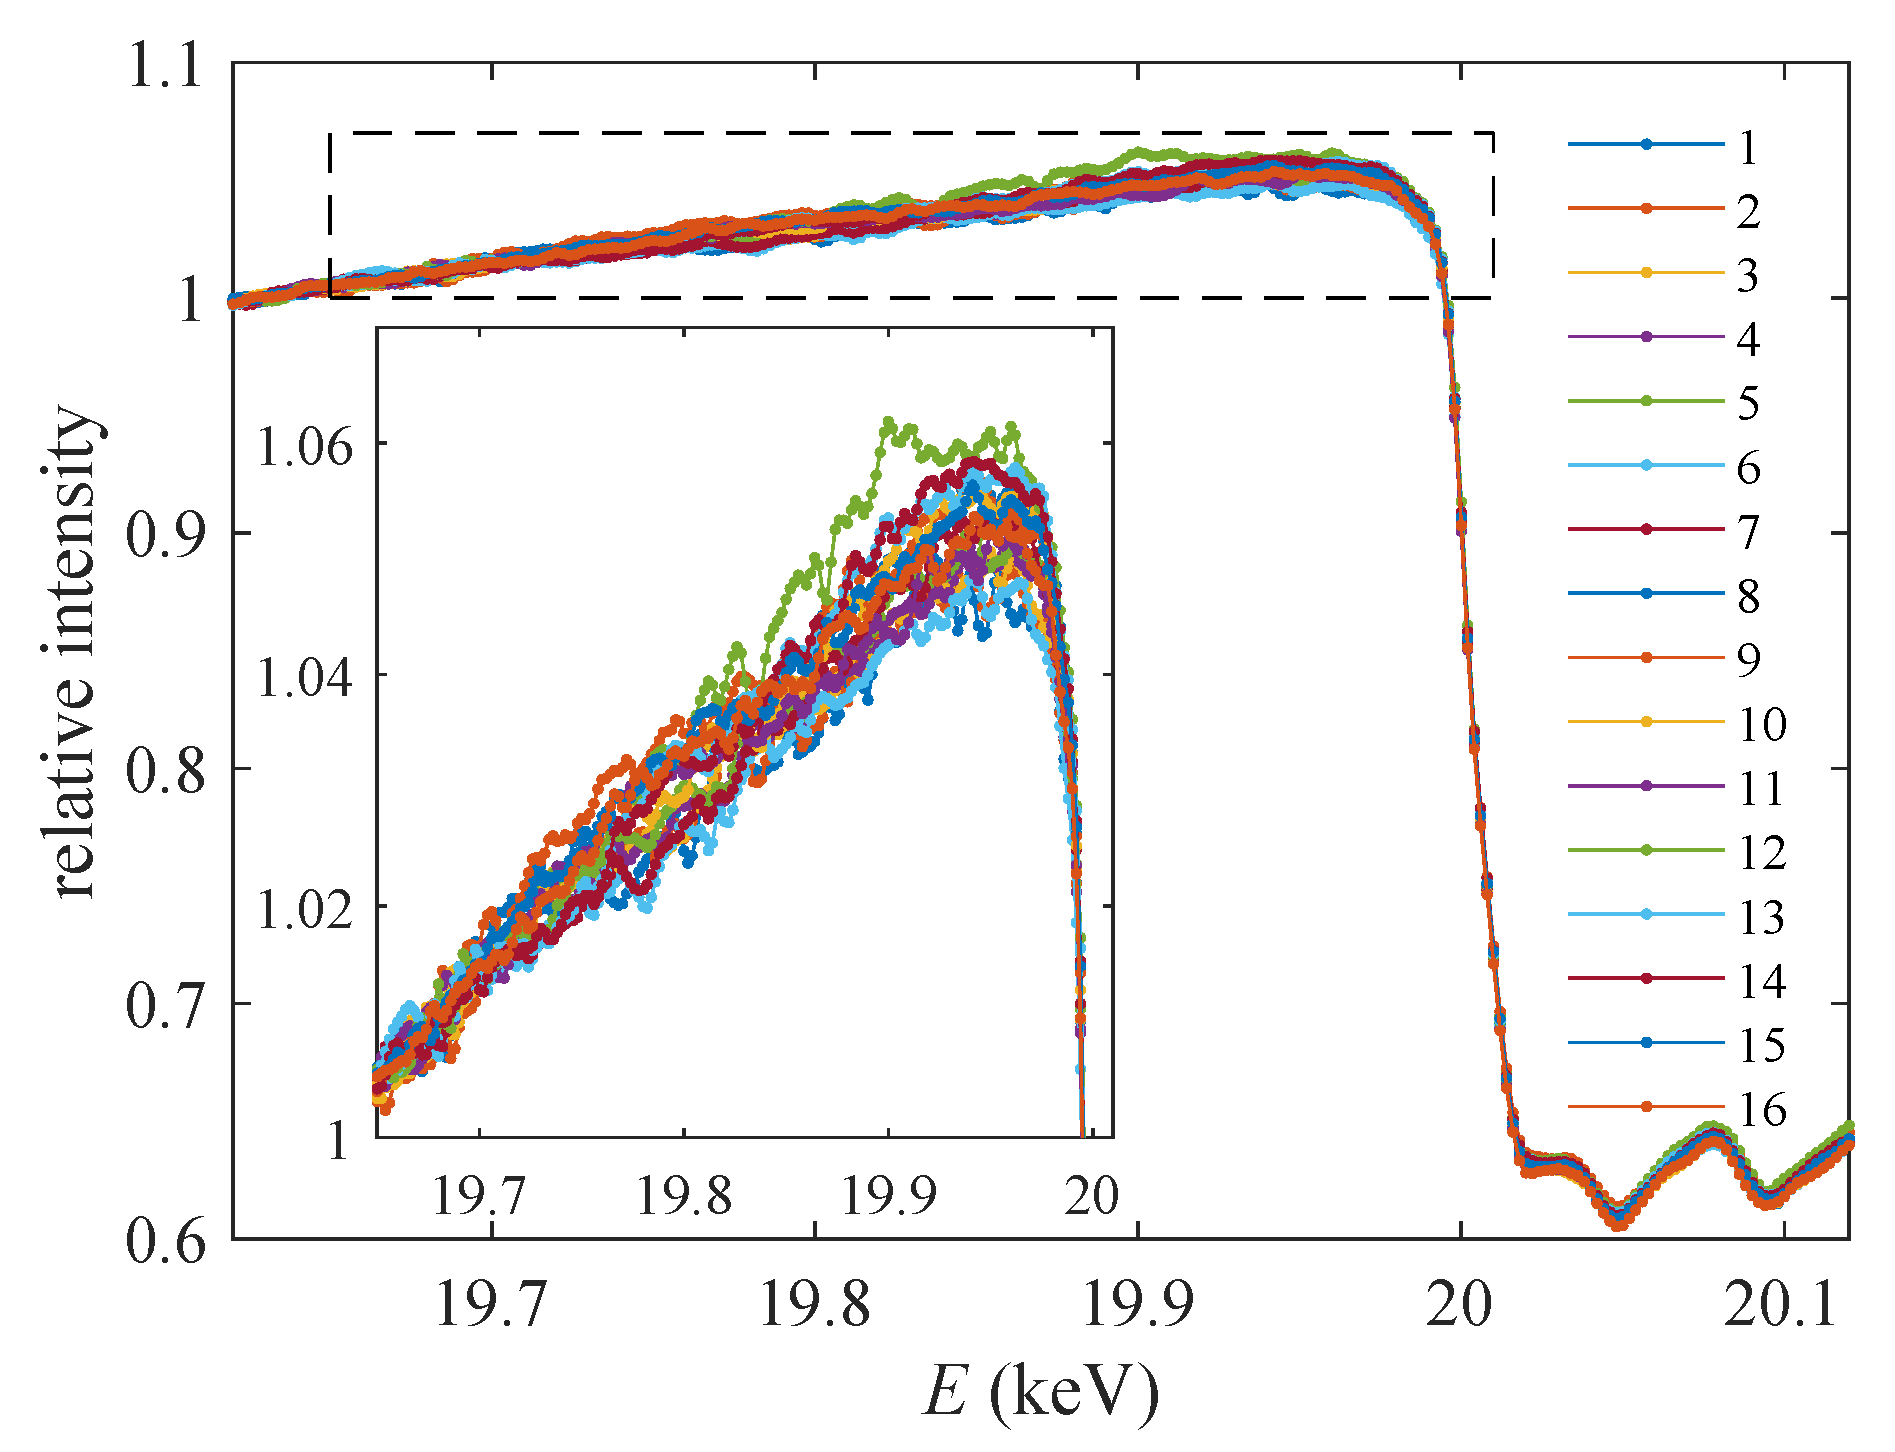
In Figure 3, we plot the AXRD spectra of individual ROIs of sample 370 /64 h after subtraction of the fluorescence background. The spectra are normalized to their values at keV. The inset shows the details of the spectra just below ; it is obvious that the spectra differ indeed, and their differences are larger than the experimental data noise. The ROIs are defined in Figure 2a, the parameter of the curves is the ROI number, ROI#1 is inside the smallest ellipse, ROI#16 is between the largest and second largest ellipses. Note that the outer ROIs are larger than the inner ones, which reduces slightly statistical fluctuations of the quite weak signals from the outer ROIs.
Figure 4 presents the details of the AXRD spectra just below of all investigated samples; the spectra were obtained as sums of the diffracted signal over the whole detector window, corrected to the fluorescence. Similar to the previous figure, the intensities were normalized to their values at keV. The tendency is obvious: with increasing ageing time the AXRD intensity below decreases. Unfortunately, very small diffracted intensities for samples aged at 300 and 335 did not allow us to analyze the AXRD spectra from individual ROIs and only total integrated intensities of these samples could be investigated instead.
3. Simulation of AXRD Spectra
Since the heoretical description of AXRD effect in -Ti nanoparticles is presented in detail in our previous paper [22], here we show only a short overview. In contrast to the previous study, where we investigated the AXRD in the -Ti matrix, here we completely neglect inhomogeneous deformation in the very small volumes of the -Ti nanoparticles, which makes the whole theoretical description much simpler. Then, the AXRD intensity obeys the formula
where the averaging is performed over particle sizes; is a energy-dependent pre-factor containing the polarization factor, irradiated sample surface, and the primary intensity; its energy dependence can be approximated by a smooth polynomial function; n is the density of the particles; is the energy dependent linear absorption coefficient of the matrix material; and is proportional to the penetration depth of the incoming radiation. The linear absorption coefficient depends on the Mo concentration in the host material, and exhibits a steep increase at . The particle shape factor is defined as the Fourier transformation of the position- and energy-dependent structure factor of the -Ti lattice :
the Fourier integral is calculated over the particle volume .
In the following, we consider particles having the form of uniaxial ellipsoids, the rotation axis of which being . We denote the mean particle radii perpendicular and parallel to the rotation axis, respectively (“lateral” and “vertical” radii). In agreement with Ref. [21], we assume a thin shell at the particle/matrix interface, in which the transition is not complete. The shell structure is characterized by its thickness , the Mo concentration , and by the parameter describing the completeness of the transition ( and correspond to and phases, respectively). Our general model of the particle includes also Mo atoms in the particle cores with the concentration . The structure factor of the pure -Ti phase in the particle core is a product of the weighted atomic scattering factor of the Ti(Mo) alloy in the core with the sum of the phase factors of the atoms in the elementary unit cell of the phase
The structure factor of the shell is expressed as a weighted sum of the structure factors of the and phases:
In Equations (5) and (6), we denote the position vectors of the atoms in the elementary unit cell of the and phases, respectively. The values of the atomic scattering factors including the E-dependent Hönl dispersion corrections have been taken from Refs. [26,27].
Figure 5 presents examples of the simulation results. Figure 5a shows the detector image simulated for the diffraction maximum on ellipsoidal nanoparticles with the mean radii nm and nm. The particle sizes are random and we consider Gamma distribution of the radii with the relative root-mean-square (rms) deviation of %. We choose ellipsoidal ROIs; their boundaries are indicated in Figure 5a by blue dotted lines. Figure 5b shows the AXRD spectra taken from the ROIs, ROI#1 corresponds to the smallest ellipse in Figure 5a. The spectra are normalized to their values at 19.6 keV; the EXAFS/DAFS oscillations above are not included in the simulation. In the AXRD simulations, we used the Mo concentrations , , and ; the degree of completeness of the transformation in the shell was ; and the shell thickness nm. It follows from the results in Figure 5 that the AXRD spectra differ especially in the energy region below the absorption edge . We repeated the simulations for and various values of parameter p; in these cases, the normalized AXRD signals from different ROIs are identical.
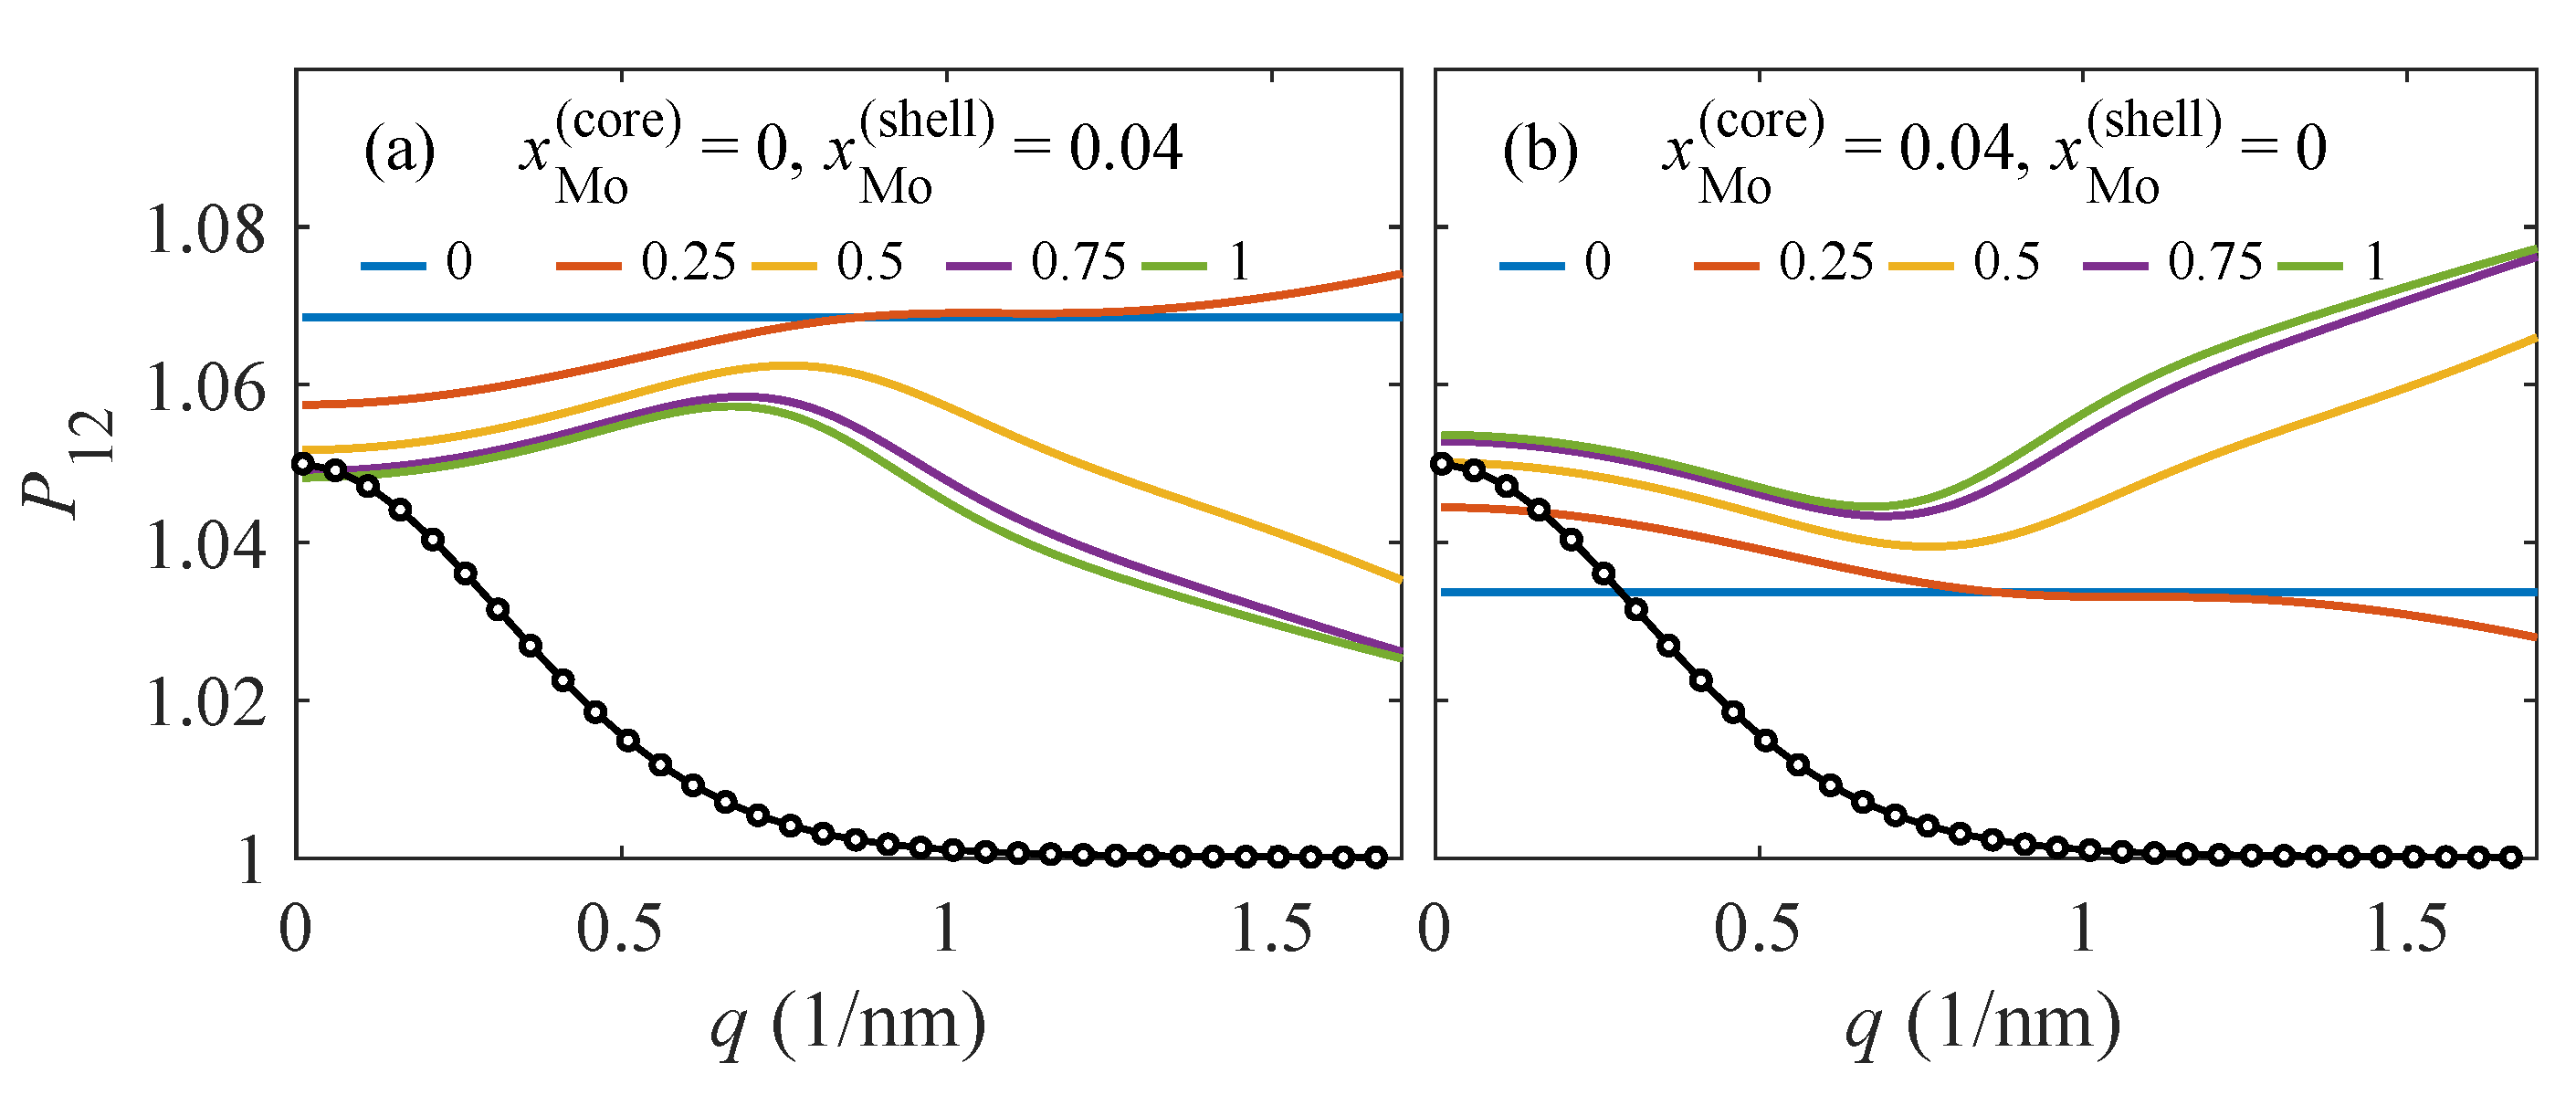
To quantify the influence of the Mo concentration in the non-complete shell on the AXRD spectra, we calculated the dependence of the ratio of the intensities
at energies keV (far below ) and keV (the energy for which the ROI signal is most sensitive to the Mo content). For spherical particles, depends only on the length q of the reciprocal-space vector and not on its direction. In the case of ellipsoidal particles, the curve calculated for a fixed direction of depends only on , where is the radius of the particle in this direction. Figure 6 shows the q-dependences of the ratio calculated for Mo atoms in the shell (Figure 6a) and in the core (Figure 6b). In the simulation, we used the values nm, and nm; the latter is consistent with our experimental finding in Ref. [21]. If , the ratio does not depend on q.
From the results in Figure 6, it follows that the shape of the q-dependence of is decisive for small q, for which the diffracted intensity is large enough (the black dots in Figure 6). Namely, if the increases and decreases with q, the Mo atoms are present mainly in the shell and core, respectively. This behavior is valid for any value of the completeness parameter p. For larger q, depends on p as well, however the corresponding intensities are very weak and the values could be determined from measured data only with large experimental errors.
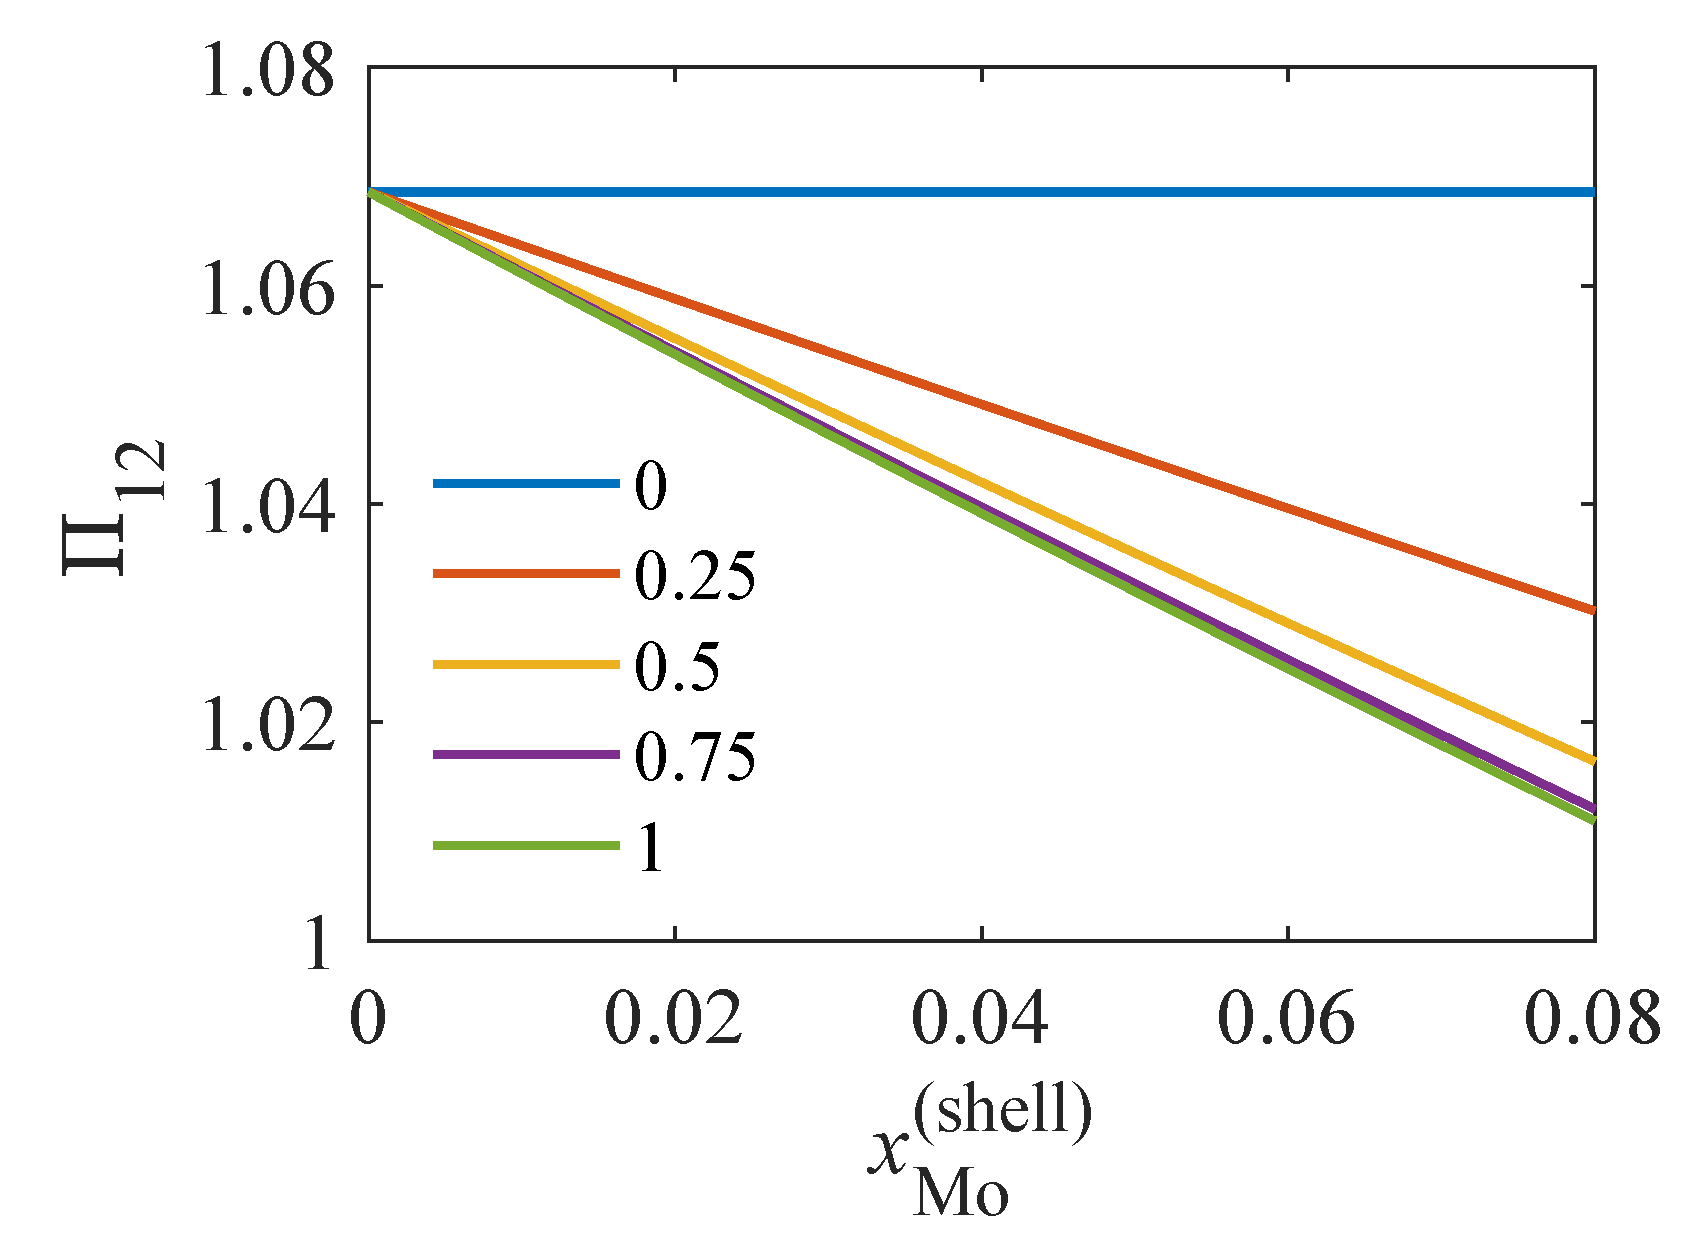
Similarly, we define the ratio of the integrated intensities
linearly decreases with increasing (see Figure 7).
4. Results
From the detector images (see Figure 2a as an example), we determined the particle radii using a simple ellipsoidal model [24], and the results are plotted in Figure 8a. The particle radii are between 2 and 8 nm; these data are in agreement with the results of X-ray small-angle scattering in Refs. [7,20], as well as with transmission electron microscopy [22]. From the shape of the diffraction maximum, we were also able to roughly estimate the relative rms deviation of the radii to %; however, this parameter has almost no influence on the resulting values of . It is worth noting that the particles grow according to the -dependence (t is the ageing time), according to the Lifhshitz, Slyozov and Wagner growth model (LSW) [28,29].
In Figure 8b, we plot the dependence of the ratio of the integrated intensities on the ageing time t and temperature T (parameter of the curves). With increasing t and/or T, the ratio decreases with regard to Figure 7, which means that the effective value of increases.
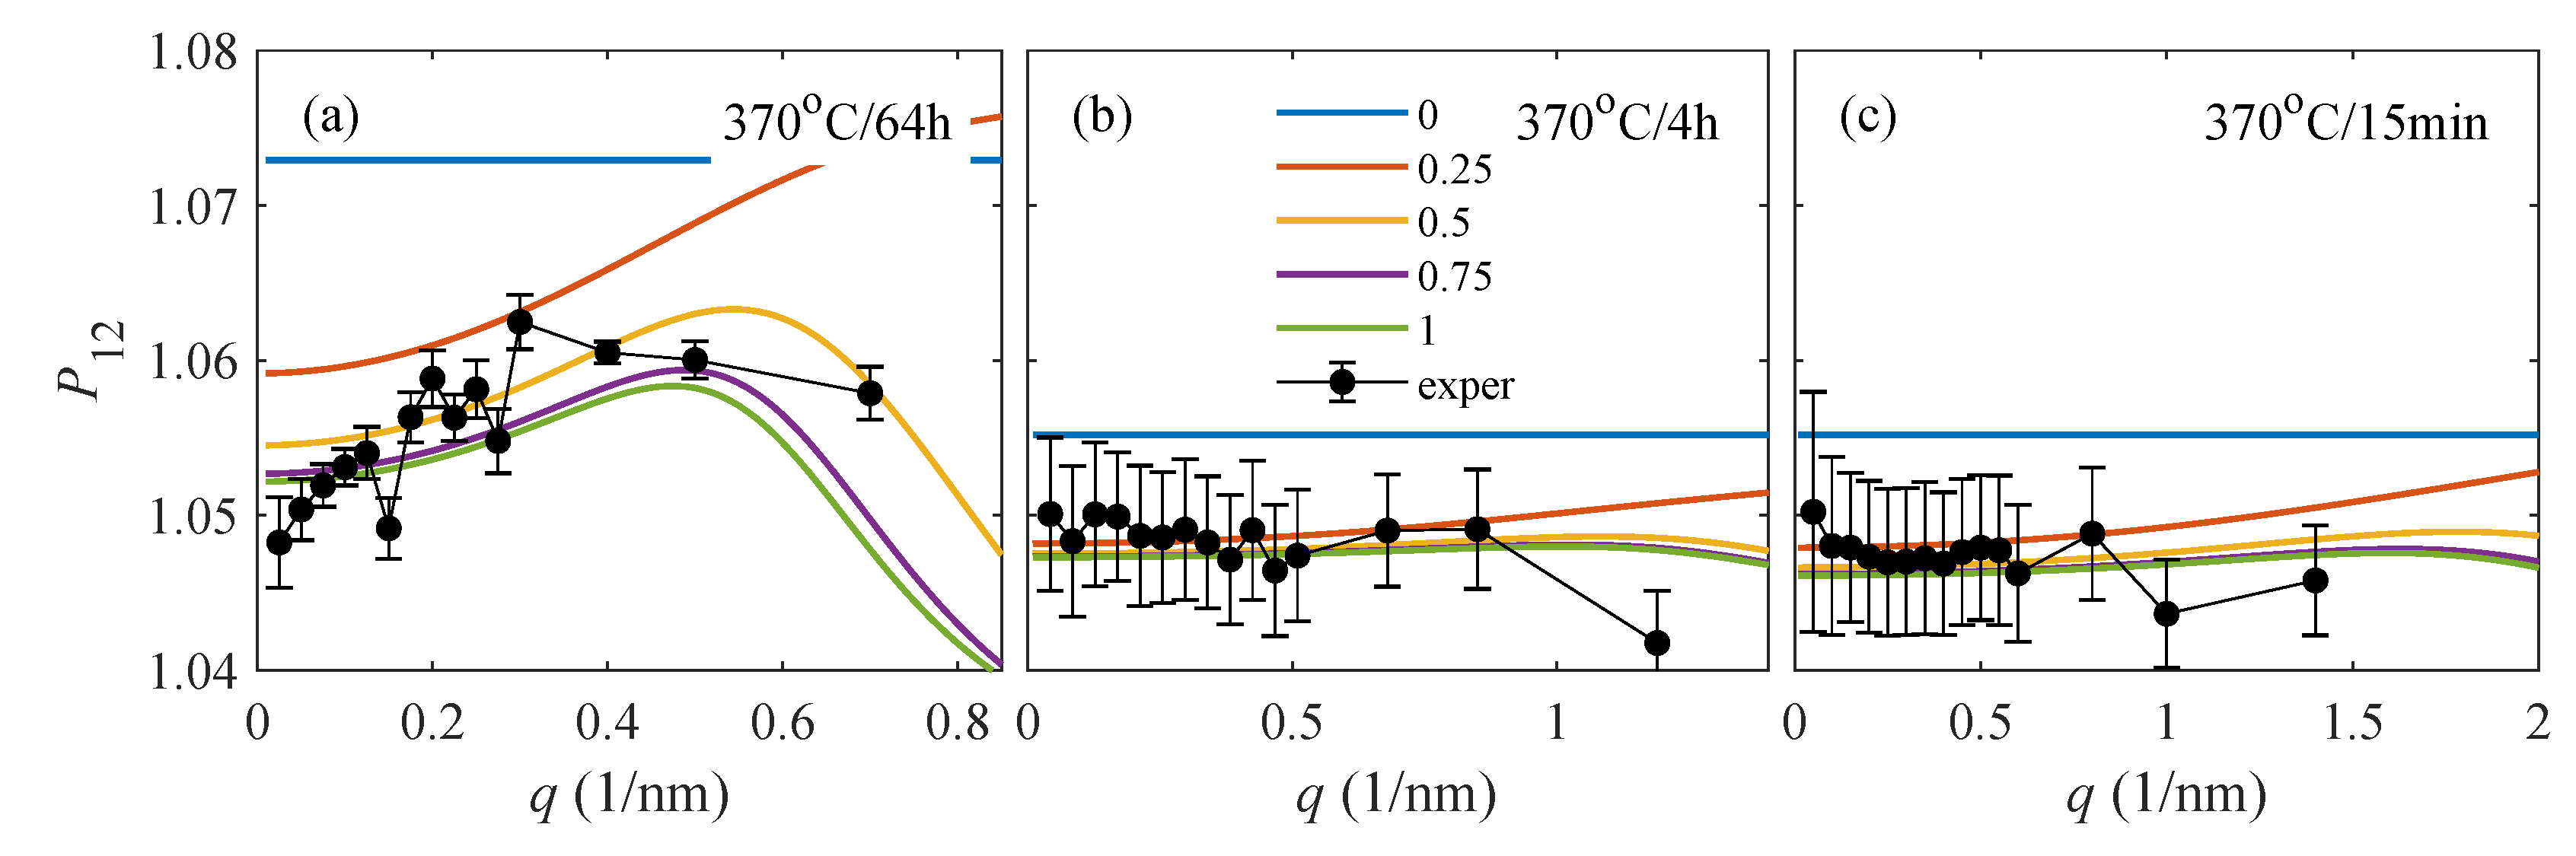
Good quality of experimental data made it possible to determine the q-dependent intensity ratio of samples aged at 370. Figure 9 compares the measured ratios (black dots) with the simulations performed for various p values (parameters of the color curves). The black dots represent individual ROIs; their coordinate q corresponds to the mean value of q measured in the direction of the longer axes of the ROIs. For the simulations, we used the radii determined above; we set , and in Figure 9a–c, respectively. These concentration values yield a relatively better match to the experimental data (see Section 5 for details). Following Šmilauerová et al. [21], we used the shell layer thickness of nm.
5. Discussion
Figure 8b shows a surprising effect, namely a decrease of the ratio of the integrated intensities during ageing. A simple explanation of this fact could be an increase of the Mo concentration in the nanoparticles; however, in the light of the values in Figure 9, this conclusion is misleading. The ratio depends on an effective concentration, which is affected also by p and . Therefore, a simple interpretation of is not possible and additional information must be included in order to understand the values.
The q-dependent ratio sheds light on this problem. From the qualitative behavior of for small q, for which the ROI signal is strong enough, one can distinguish Mo atoms in the shell from Mo atoms in the particle core; in the former case, increases with q, while, in the latter case, it decreases. This behavior does not depend on the completeness factor p; however, the effect is pronounced only if the total number of Mo atoms in the particle is large enough. From the curve, one can also estimate the value of , however only if the shell layer thickness is known with sufficient accuracy.
In sample 370/64 h, the ratio obviously increases with increasing q (Figure 9a), therefore the Mo density in the shell is larger than in the core. Moreover, in our previous work [21], we estimated the shell thickness to nm and the completeness factor in all samples of the 370 series. Using these additional results and putting , we obtained in sample 370/64 h. In the other samples of the 370 series, the q-dependence of was not distinct enough. Nevertheless, keeping , we could estimate the Mo concentrations in the shell to and for samples aged at 4 h and 15 min, respectively. These results suggest that the Mo concentration in the shell layer slightly increases during ageing.
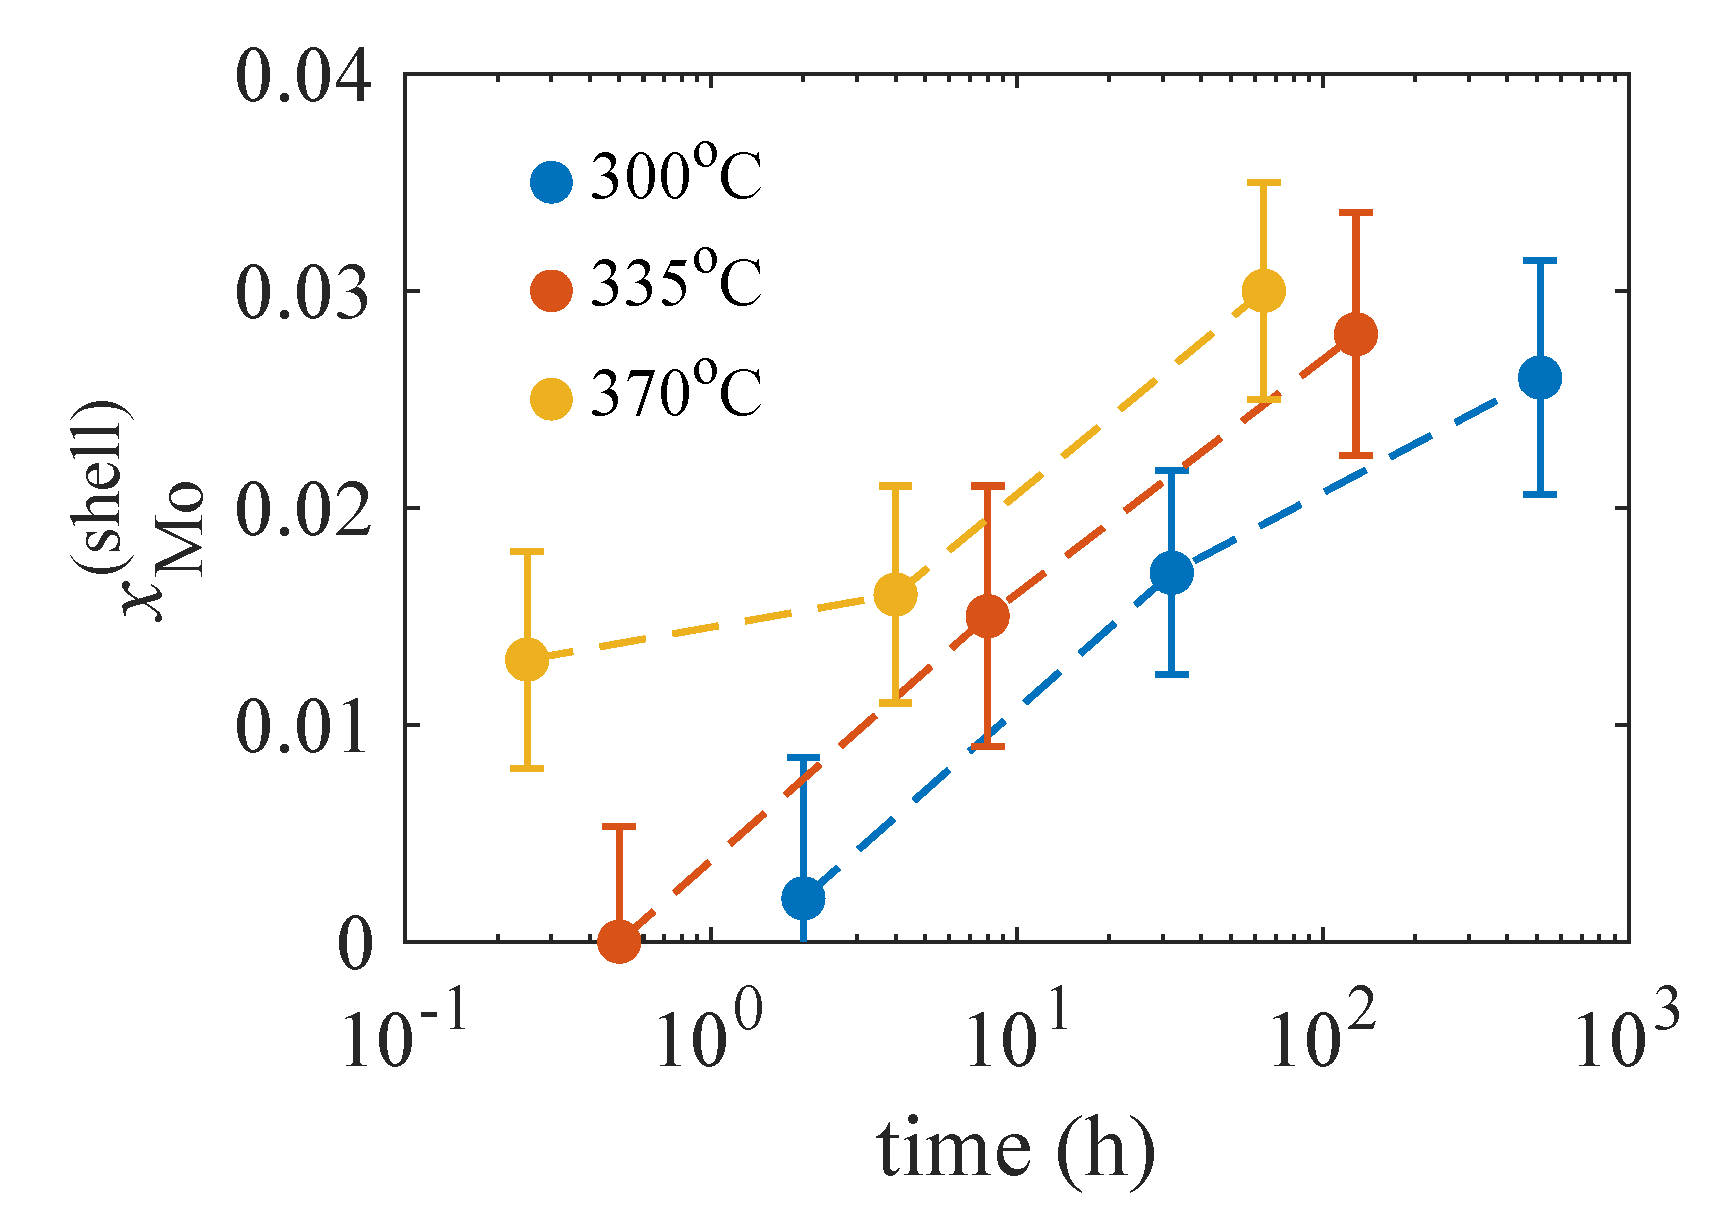
In the 300 and 335 sample series, the diffracted intensity is weak and the values of suffer from errors up to 100%, even if we increase the ROI sizes, so that in these samples we could determine only with reasonable accuracy. However, using the values determined above, and p from our previous work [21], and assuming , we could estimate ; the results along with those for the 370 series are plotted in Figure 10. The tendency of the increase of is obvious in all sample series; however, the numerical values for the 300 and 335 samples must be handled with care, since they are based only on .
The AXRD method presented here can also be used for other chemically non-homogeneous nanoparticles; the form of the function for small q is characteristic for the presence of a shell with a different chemical composition. The minimum ROI size and consequently the q-resolution of is limited by signal fluctuations, which increase with decreasing ROI size. If the diffracted intensity is not sufficient, which is the case for very small particles, only the integrated ratio can be determined. In this case, for the determination of the chemical composition of the shell, a priori information on the composition of the core region must be used.
6. Summary
We measured the energy dependence of the X-ray intensity diffracted (anomalous X-ray diffraction) from hexagonal nanoparticles in Ti-8at.%Mo single crystals after ageing at elevated temperatures. The anomalous X-ray diffraction method is phase-selective, i.e., it investigates only the structure and chemical composition of the diffracting crystallographic phase. Using X-ray photon energies around the MoK absorption edge, we estimated the Mo concentration in the particle shell layer, in which the transformation is not complete. The Mo density in the shell is larger than in the particle core, and, by assuming that no Mo atoms are present in the core, we could determine the Mo density in the particle shell. During ageing, the thickness of the shell remains almost constant, however the Mo concentration in the shell increases and it can reach almost the half of the Mo concentration in the -Ti matrix far from the particles.
Author Contributions
Original idea: J.Š., M.J.; X-ray diffraction experiment: P.H., J.Š., V.H.; development of the theoretical model: V.H.; data evaluation: J.Š., V.H.; manuscript preparation: V.H., J.Š, M.J.
Funding
The work was supported by the project NanoCent financed by European Regional Development Fund (ERDF, project No. CZ.02.1.01/0.0/0.0/15.003/0000485) and by the Czech Science Foundation (project No. 17-04871S). Partial financial support by the Ministry of Education, Youth and Sports under the project LTAUSA 18045 is also gratefully acknowledged.
Acknowledgments
The assistance of H. Renevier (LMGP, Grenoble) with the synchrotron measurements is gratefully acknowledged.
Conflicts of Interest
The authors declare no conflicts of interest.
References
- Banerjee, S.; Mukhopadhyay, P. Phase Transformations: Examples from Titanium and Zirconium Alloys; Elsevier: Amsterdam, The Netherlands, 2010; Volume 12. [Google Scholar]
- Langmayr, F.; Fratzl, P.; Vogl, G.; Miekeley, W. Crossover from ω-phase to α-phase precipitation in bcc Ti-Mo. Phys. Rev. B 1994, 49, 11759. [Google Scholar] [CrossRef] [PubMed]
- Devaraj, A.; Williams, R.E.A.; Nag, S.; Srinivasan, R.; Fraser, H.L.; Banerjee, R. Three-dimensional morphology and composition of omega precipitates in a binary titanium-molybdenum alloy. Scr. Mater. 2009, 61, 701–704. [Google Scholar] [CrossRef]
- Duerig, T.; Terlinde, G.; Williams, J. Phase transformations and tensile properties of Ti–10V–2Fe–3AI. Metall. Trans. A 1980, 11, 1987–1998. [Google Scholar] [CrossRef]
- Williams, J.C.; Blackburn, M.J. The influence of misfit on the morphology and stability of the omega phase in titanium–transition metal alloys. Trans. Metall. Soc. AIME 1969, 245, 2352–2355. [Google Scholar]
- Silcock, J.M. An X-ray examination of the to phase in TiV, TiMo and TiCr alloys. Acta Metall. 1958, 6, 481–493. [Google Scholar] [CrossRef]
- Šmilauerová, J.; Harcuba, P.; Stráský, J.; Stráská, J.; Janeček, M.; Pospíšil, J.; Kužel, R.; Brunátová, T.; Holý, V.; Ilavský, J. Ordered array of ω particles in β-Ti matrix studied by small-angle X-ray scattering. Acta Mater. 2014, 81, 71–82. [Google Scholar] [CrossRef]
- Frost, P.; Parris, W.; Hirsch, L.; Doig, J.; Schwartz, C. Isothermal transformation of titanium-chromium alloys. Trans. ASM 1954, 46, 231–256. [Google Scholar]
- Welsch, G.; Boyer, R.; Collings, E. Materials Properties Handbook: Titanium Alloys; ASM International: Materials Park, OH, USA, 1993. [Google Scholar]
- Bakonyi, I.; Ebert, H.; Liechtenstein, A. Electronic structure and magnetic susceptibility of the different structural modifications of Ti, Zr, and Hf metals. Phys. Rev. B 1993, 48, 7841. [Google Scholar] [CrossRef]
- De Fontaine, D.; Paton, N.E.; Williams, J.C. The omega phase transformation in titanium alloys as an example of displacement controlled reactions. Acta Metall. 1971, 19, 1153–1162. [Google Scholar] [CrossRef]
- Nag, S.; Devaraj, A.; Srinivasan, R.; Williams, R.; Gupta, N.; Viswanathan, G.; Tiley, J.; Banerjee, S.; Srinivasan, S.; Fraser, H.; et al. Novel mixed-mode phase transition involving a composition-dependent displacive component. Phys. Rev. Lett. 2011, 106, 245701. [Google Scholar] [CrossRef]
- Duerig, T.W.; Terlinde, G.T.; Williams, J.C. The Omega-Phase Reaction in Titanium Alloys; Metallurgical Society of AIME: Englewood, CO, USA, 1980; Volume 2. [Google Scholar]
- Hickman, B.S. Omega phase precipitation in alloys of titanium with transition metals. Trans. Metall. Soc. AIME 1969, 245, 1329–1336. [Google Scholar]
- Hickman, B.S. Precipitation of the omega phase in titanium-vanadium alloys. J. Inst. Met. 1968, 96, 330–337. [Google Scholar]
- Hadjadj, L.; Campagnac, M.; Vassel, A.; Menand, A. Atom-probe and TEM study of the isothermal ω and secondary α phases in a Ti-10 V-2 Fe-3 Al alloy. Microsc. Microanal. Microstruct. 1992, 3, 471–482. [Google Scholar] [CrossRef]
- Devaraj, A.; Nag, S.; Srinivasan, R.; Williams, R.E.A.; Banerjee, S.; Banerjee, R.; Fraser, H.L. Experimental evidence of concurrent compositional and structural instabilities leading to ω precipitation in titanium–molybdenum alloys. Acta Mater. 2012, 60, 596–609. [Google Scholar] [CrossRef]
- Coakley, J.; Vorontsov, V.A.; Jones, N.G.; Radecka, A.; Bagot, P.A.; Littrell, K.C.; Heenan, R.K.; Hu, F.; Magyar, A.P.; Bell, D.C.; et al. Precipitation processes in the beta-titanium alloy Ti–5Al–5Mo–5V–3Cr. J. Alloys Compd. 2015, 646, 946–953. [Google Scholar] [CrossRef]
- Ahmed, M.; Li, T.; Casillas, G.; Cairney, J.M.; Wexler, D.; Pereloma, E.V. The evolution of microstructure and mechanical properties of Ti–5Al–5Mo–5V–2Cr–1Fe during ageing. J. Alloys Compd. 2015, 629, 260–273. [Google Scholar] [CrossRef]
- Šmilauerová, J.; Harcuba, P.; Kriegner, D.; Janeček, M.; Holý, V. Growth kinetics of ω particles in β-Ti matrix studied by in situ small-angle X-ray scattering. Acta Mater. 2015, 100, 126–134. [Google Scholar] [CrossRef] [PubMed]
- Šmilauerová, J.; Harcuba, P.; Kriegner, D.; Stráská, J.; Holý, V. On the completeness of the β→ω transformation in metastable β-titanium alloys. J. Appl. Crystallogr. 2017, 50, 283–287. [Google Scholar] [CrossRef]
- Šmilauerová, J.; Harcuba, P.; Cieslar, M.; Holý, V. Anomalous X-ray diffraction from ω nanoparticles in β-Ti(Mo) single crystals. Acta Crystystallogr. A 2019, in press. [Google Scholar]
- Waseda, J. Anomalous X-ray Scattering for Materials Characterization: Atomic-Scale Structure Determination; Springer: Berlin/Heidelberg, Germany, 2002. [Google Scholar]
- Šmilauerová, J.; Harcuba, P.; Pospíšil, J.; Matěj, Z.; Holý, V. Growth of ω inclusions in Ti alloys: An X-ray diffraction study. Acta Mater. 2013, 61, 6635–6645. [Google Scholar] [CrossRef]
- Šmilauerová, J.; Pospíšil, J.; Harcuba, P.; Holý, V.; Janeček, M. Single crystal growth of TIMETAL LCB titanium alloy by a floating zone method. J. Cryst. Growth 2014, 405, 92–96. [Google Scholar] [CrossRef] [Green Version]
- Creagh, D.C. Mathematical, physical and chemical tables. In International Tables for Crystallography; Prince, E., Ed.; International Union of Crystallography: Chester, UK, 2006; Volume C. [Google Scholar]
- Henke, B.L.; Gullikson, E.M.; Davis, J.C. X-ray interactions: Photoabsorption, scattering, transmission, and reflection at E = 50–30,000 eV, Z = 1–92. At. Data Nucl. Data Tables 1993, 54, 181–342. [Google Scholar] [CrossRef]
- Lifshitz, I.M.; Slyozov, V.V. The kinetics of precipitation from supersaturated solid solutions. J. Phys. Chem. Solids 1961, 19, 35–50. [Google Scholar] [CrossRef]
- Wagner, C. Theorie der Alterung von Niederschlägen durch Umlösen (Ostwald-Reifung). Z. Elektrochem. Ber. Bunsenges. Phys. Chem. 1961, 65, 581–591. [Google Scholar]
Figure 1.
Sketch of the atomic positions of the body-centered cubic phase (black) and hexagonal phase (red). The lattice parameters and are denoted by full lines.
Figure 1.
Sketch of the atomic positions of the body-centered cubic phase (black) and hexagonal phase (red). The lattice parameters and are denoted by full lines.
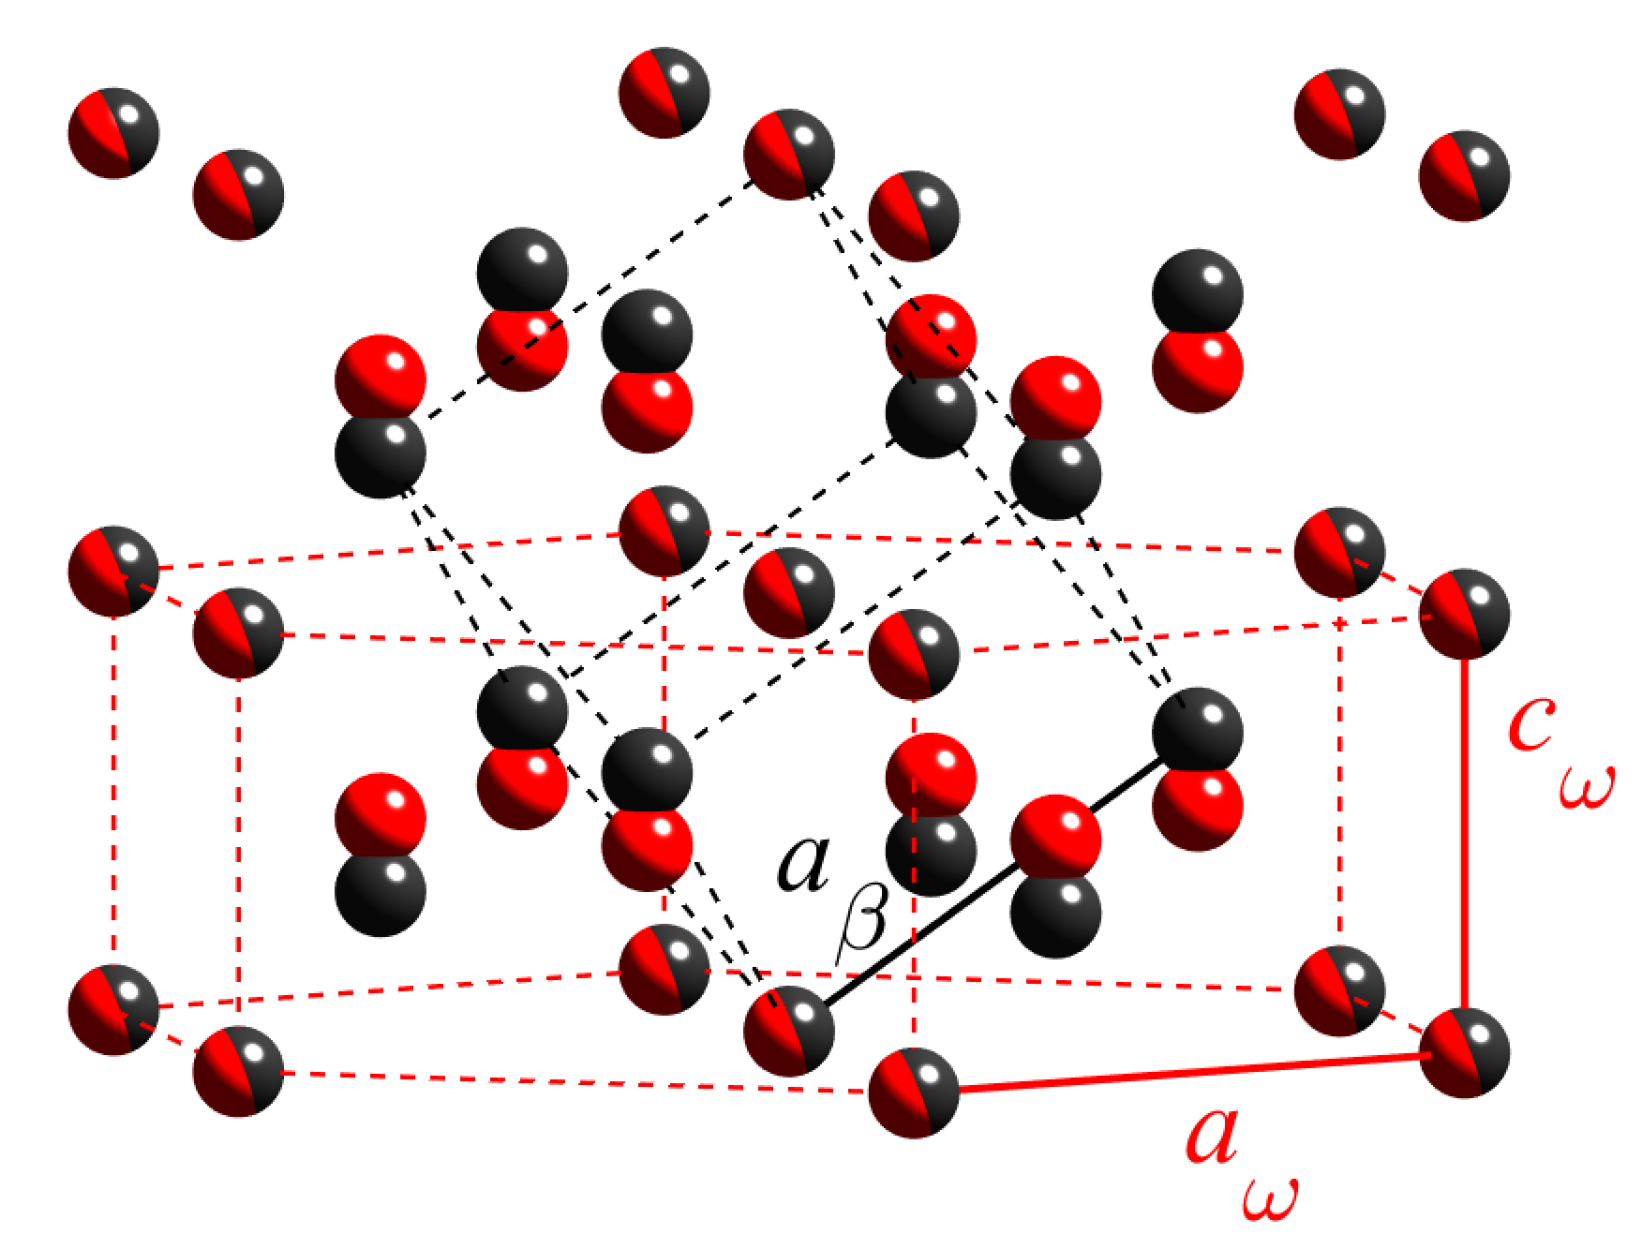
Figure 2.
(a) Diffraction maximum displayed as one detector frame taken at keV, sample annealed at 370 for 64 h. The intensity is plotted in logarithmic scale, the colors from white to dark red span over four decades. denotes the coordinates in reciprocal space parallel to the detector plane, corresponds to the reciprocal-lattice point . The elliptical ROIs are displayed by blue dotted lines. (b) Energy dependence of the diffraction signal taken from the largest ROI (blue) and the fluorescence background (red, enlarged). The vertical black line expresses the absorption-edge energy .

Figure 3.
The AXRD spectra of individual ROIS (parameters of the curves), sample aged at 370/64 h. The first ROI is inside the smallest ellipse in Figure 2a, while the last ROI is between the largest and second largest ellipses. The dashed rectangular region is enlarged in the inset.
Figure 3.
The AXRD spectra of individual ROIS (parameters of the curves), sample aged at 370/64 h. The first ROI is inside the smallest ellipse in Figure 2a, while the last ROI is between the largest and second largest ellipses. The dashed rectangular region is enlarged in the inset.

Figure 4.
The AXRD spectra of intensities integrated over the detector window of the whole sample series: (a–c) the spectra of samples aged at 300, 335, and 370, respectively. The intensities are normalized to their values at 19.6 keV.
Figure 4.
The AXRD spectra of intensities integrated over the detector window of the whole sample series: (a–c) the spectra of samples aged at 300, 335, and 370, respectively. The intensities are normalized to their values at 19.6 keV.
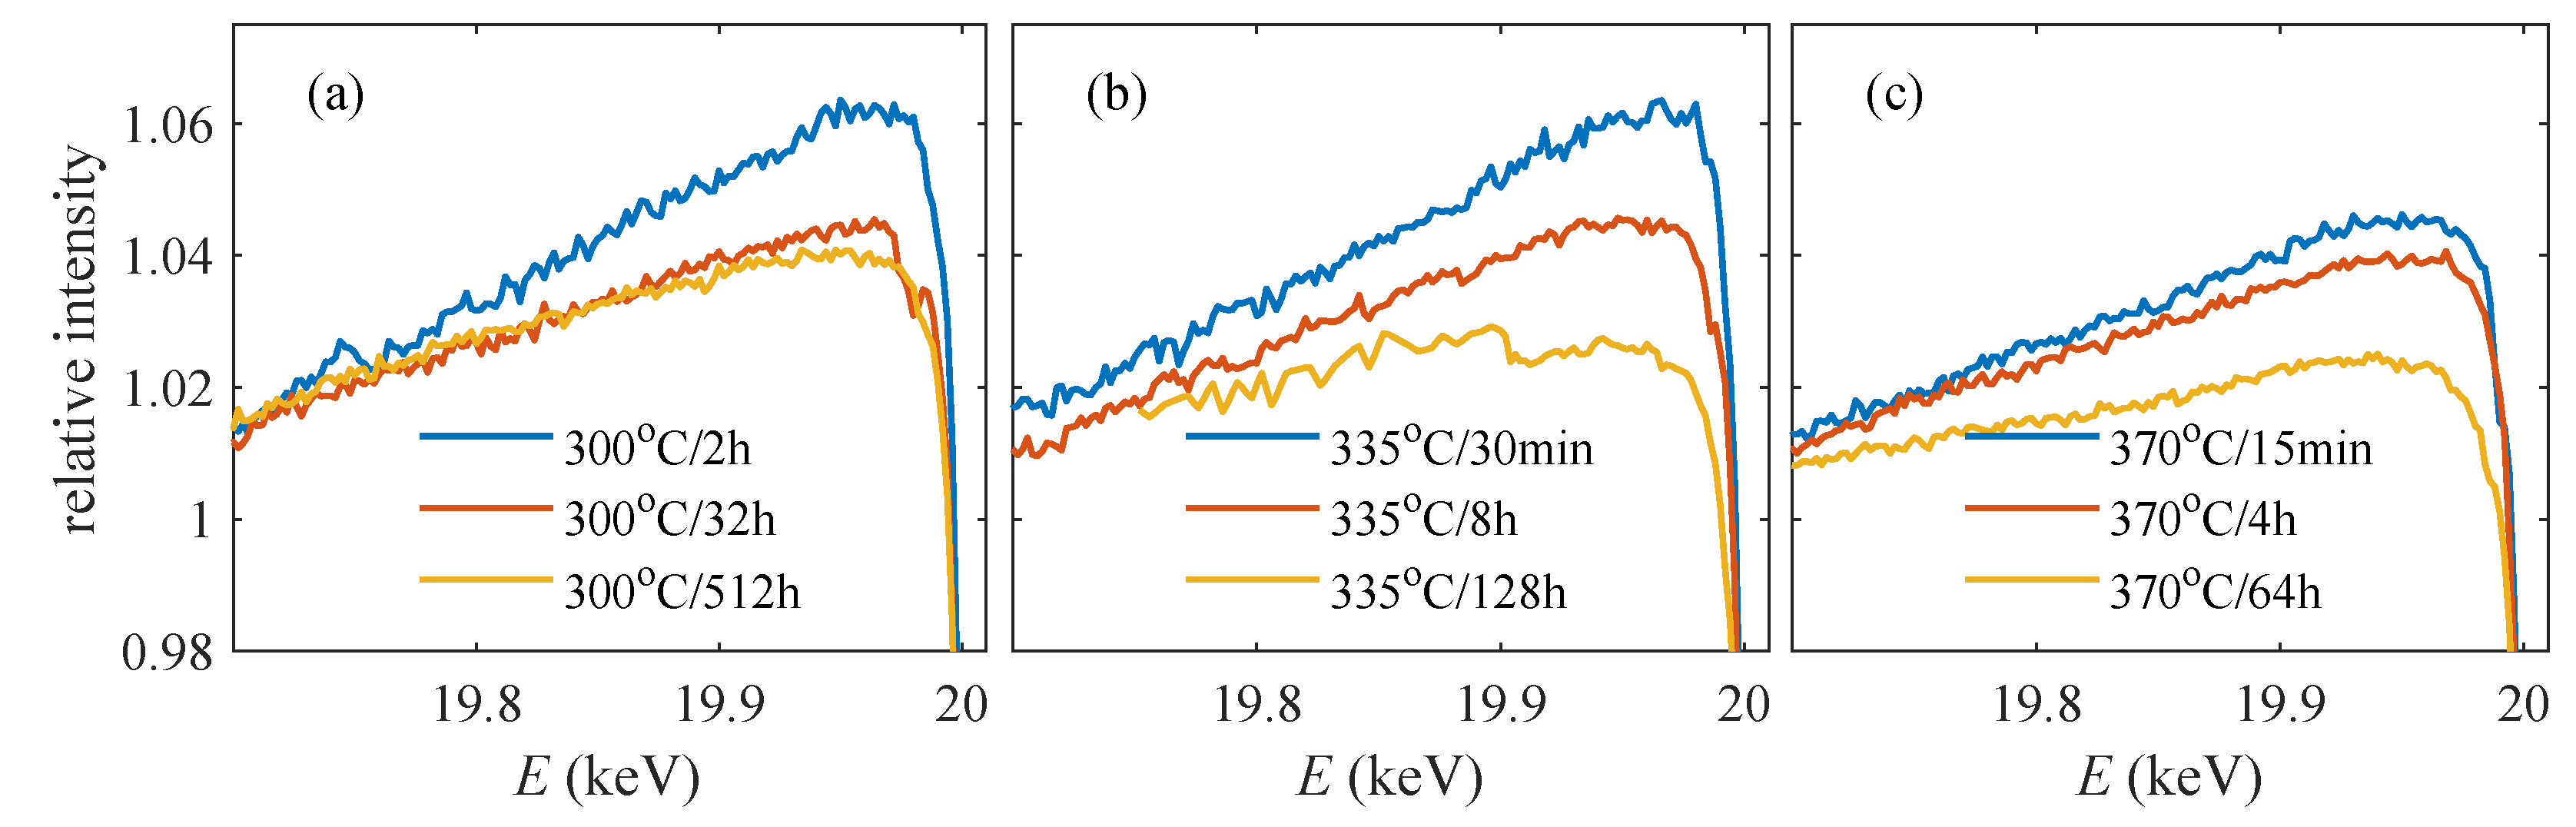
Figure 5.
(a) Simulated diffraction maximum , mean particle radii nm and nm, the intensity is plotted in logarithmic scale, the colors from white to dark red span over 4 decades. The elliptical ROIs are displayed by blue dotted lines. (b) The AXRD spectra of individual ROIs (parameters of the curves) from (a). The first ROI is inside the smallest ellipse, while the last ROI is between the largest and second largest ellipses. The dashed rectangular region is enlarged in the inset. The AXRD intensities are normalized to their values at 19.6 keV, see the main text for details.
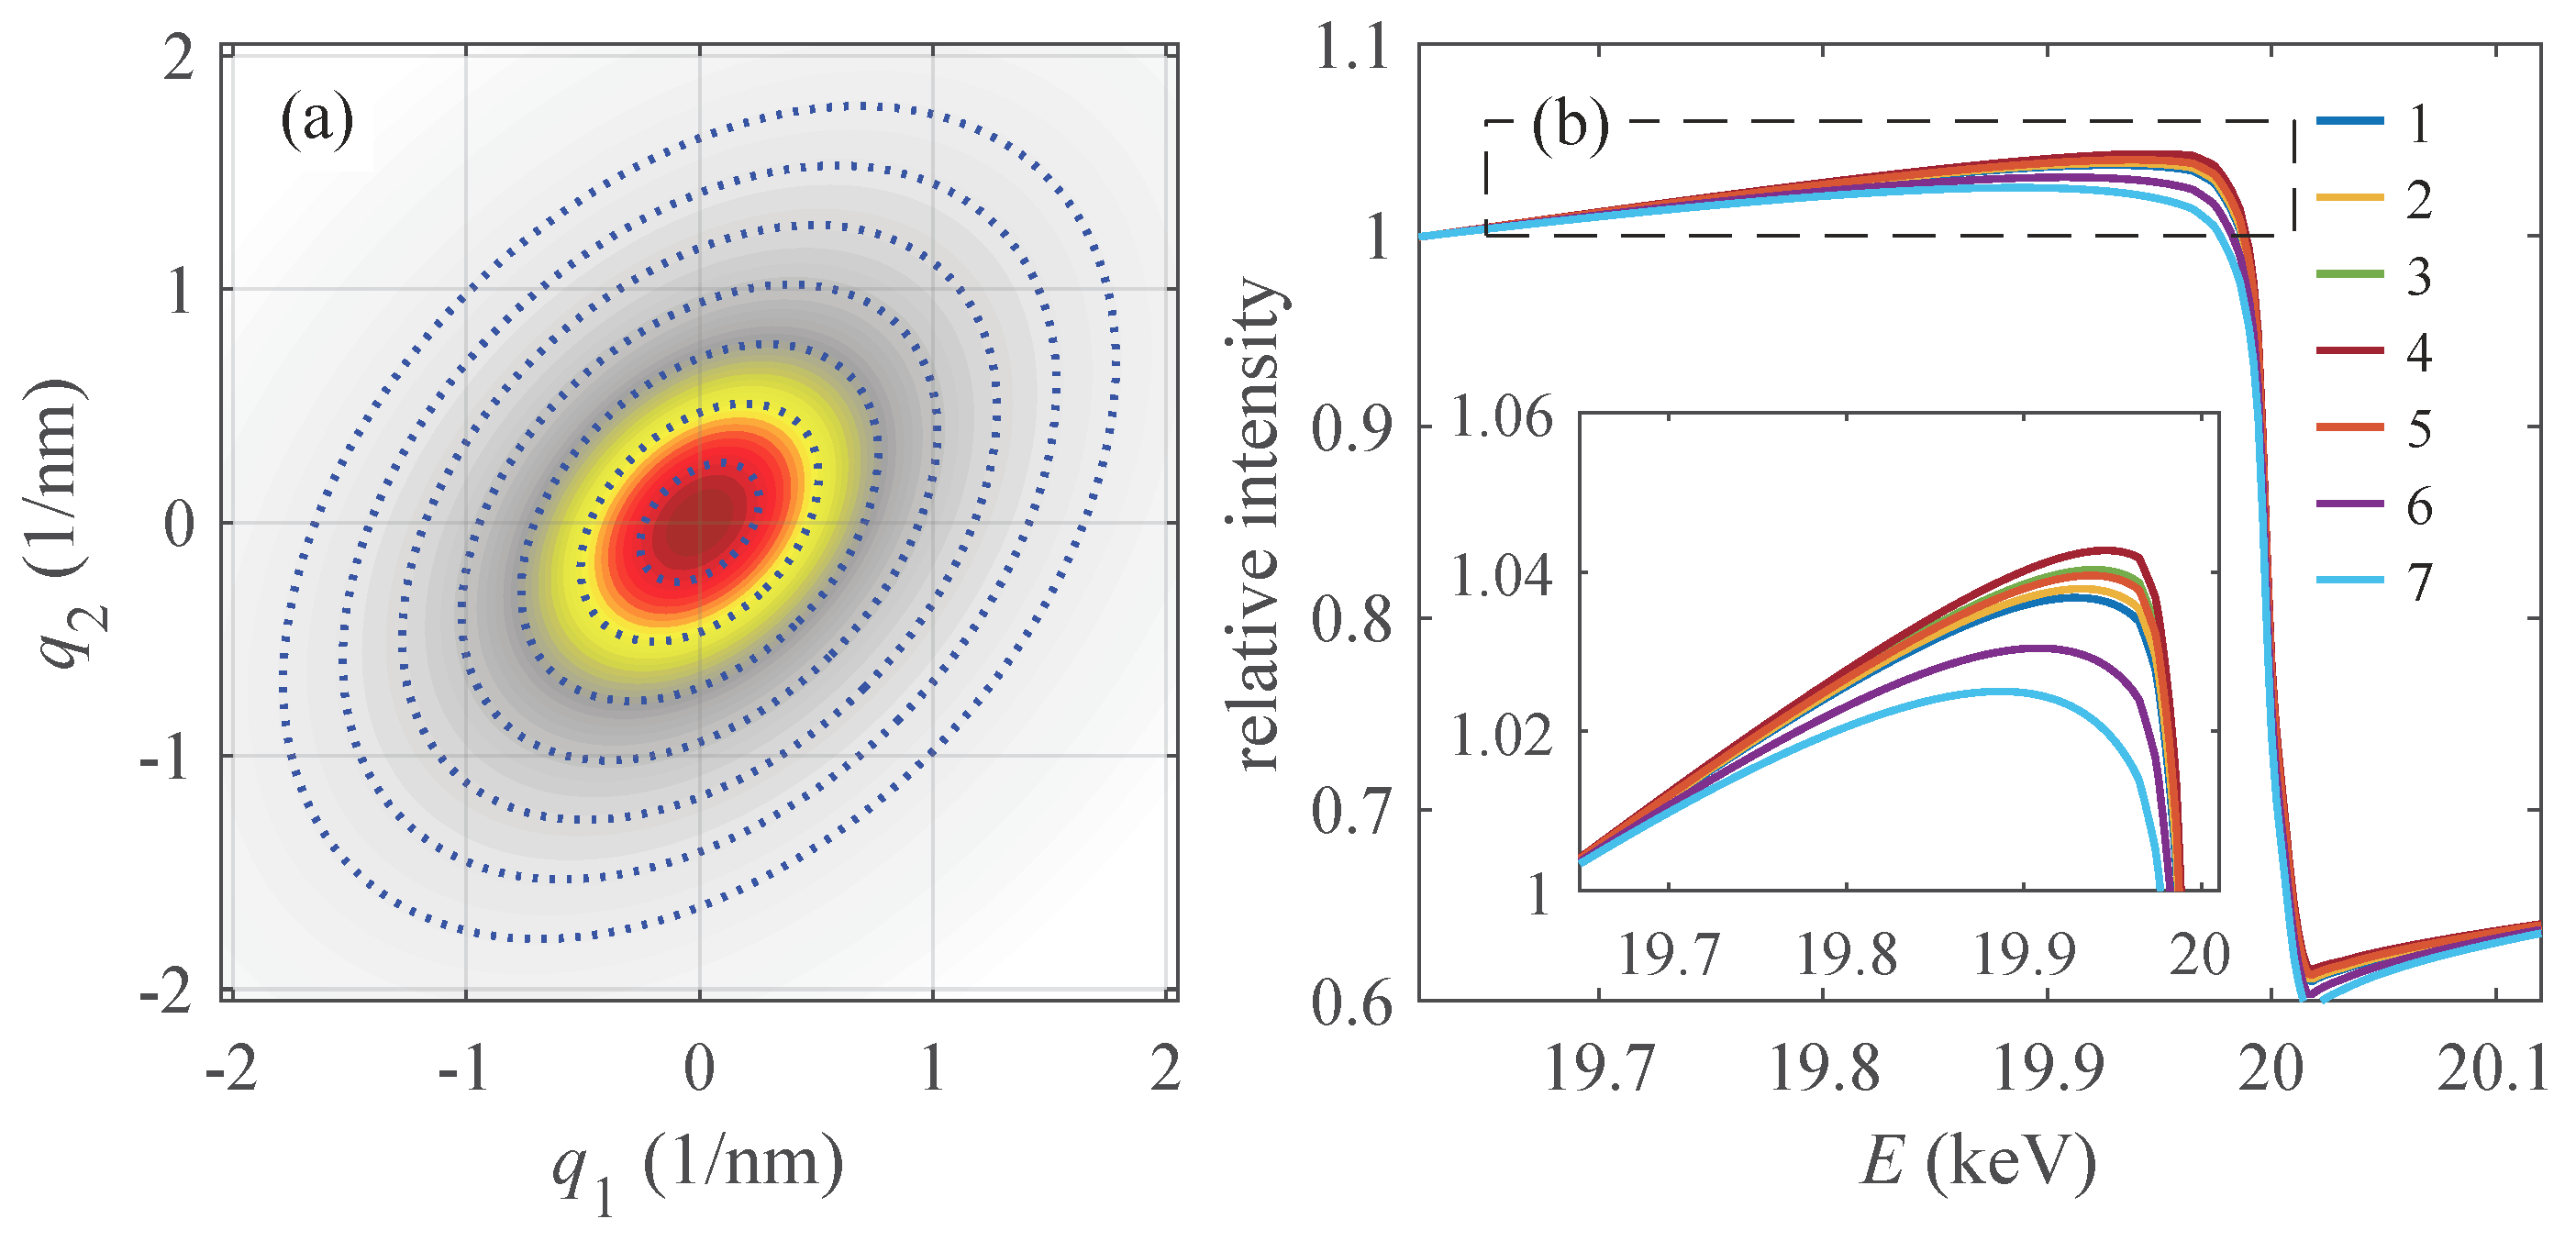
Figure 6.
Ratio of integrated intensities calculated for Mo atoms present in the shell (a) and in the core (b), and various parameters p (parameter of the curves). The black line with dots displays the q-dependence of the diffracted intensity; the vertical axis for this curve is not in scale.
Figure 6.
Ratio of integrated intensities calculated for Mo atoms present in the shell (a) and in the core (b), and various parameters p (parameter of the curves). The black line with dots displays the q-dependence of the diffracted intensity; the vertical axis for this curve is not in scale.

Figure 7.
Ratio of integrated intensities calculated for various Mo concentrations (we used ) and various parameters p (parameter of the curves).
Figure 7.
Ratio of integrated intensities calculated for various Mo concentrations (we used ) and various parameters p (parameter of the curves).

Figure 8.
(a) Vertical (, full) and lateral radii (, open circles) of the particles determined from the detector images as functions of the ageing time t and temperatures. The dashed lines are the fits following from the LSW model. (b) The ratio of the intensities measured at samples aged at various times and temperatures.
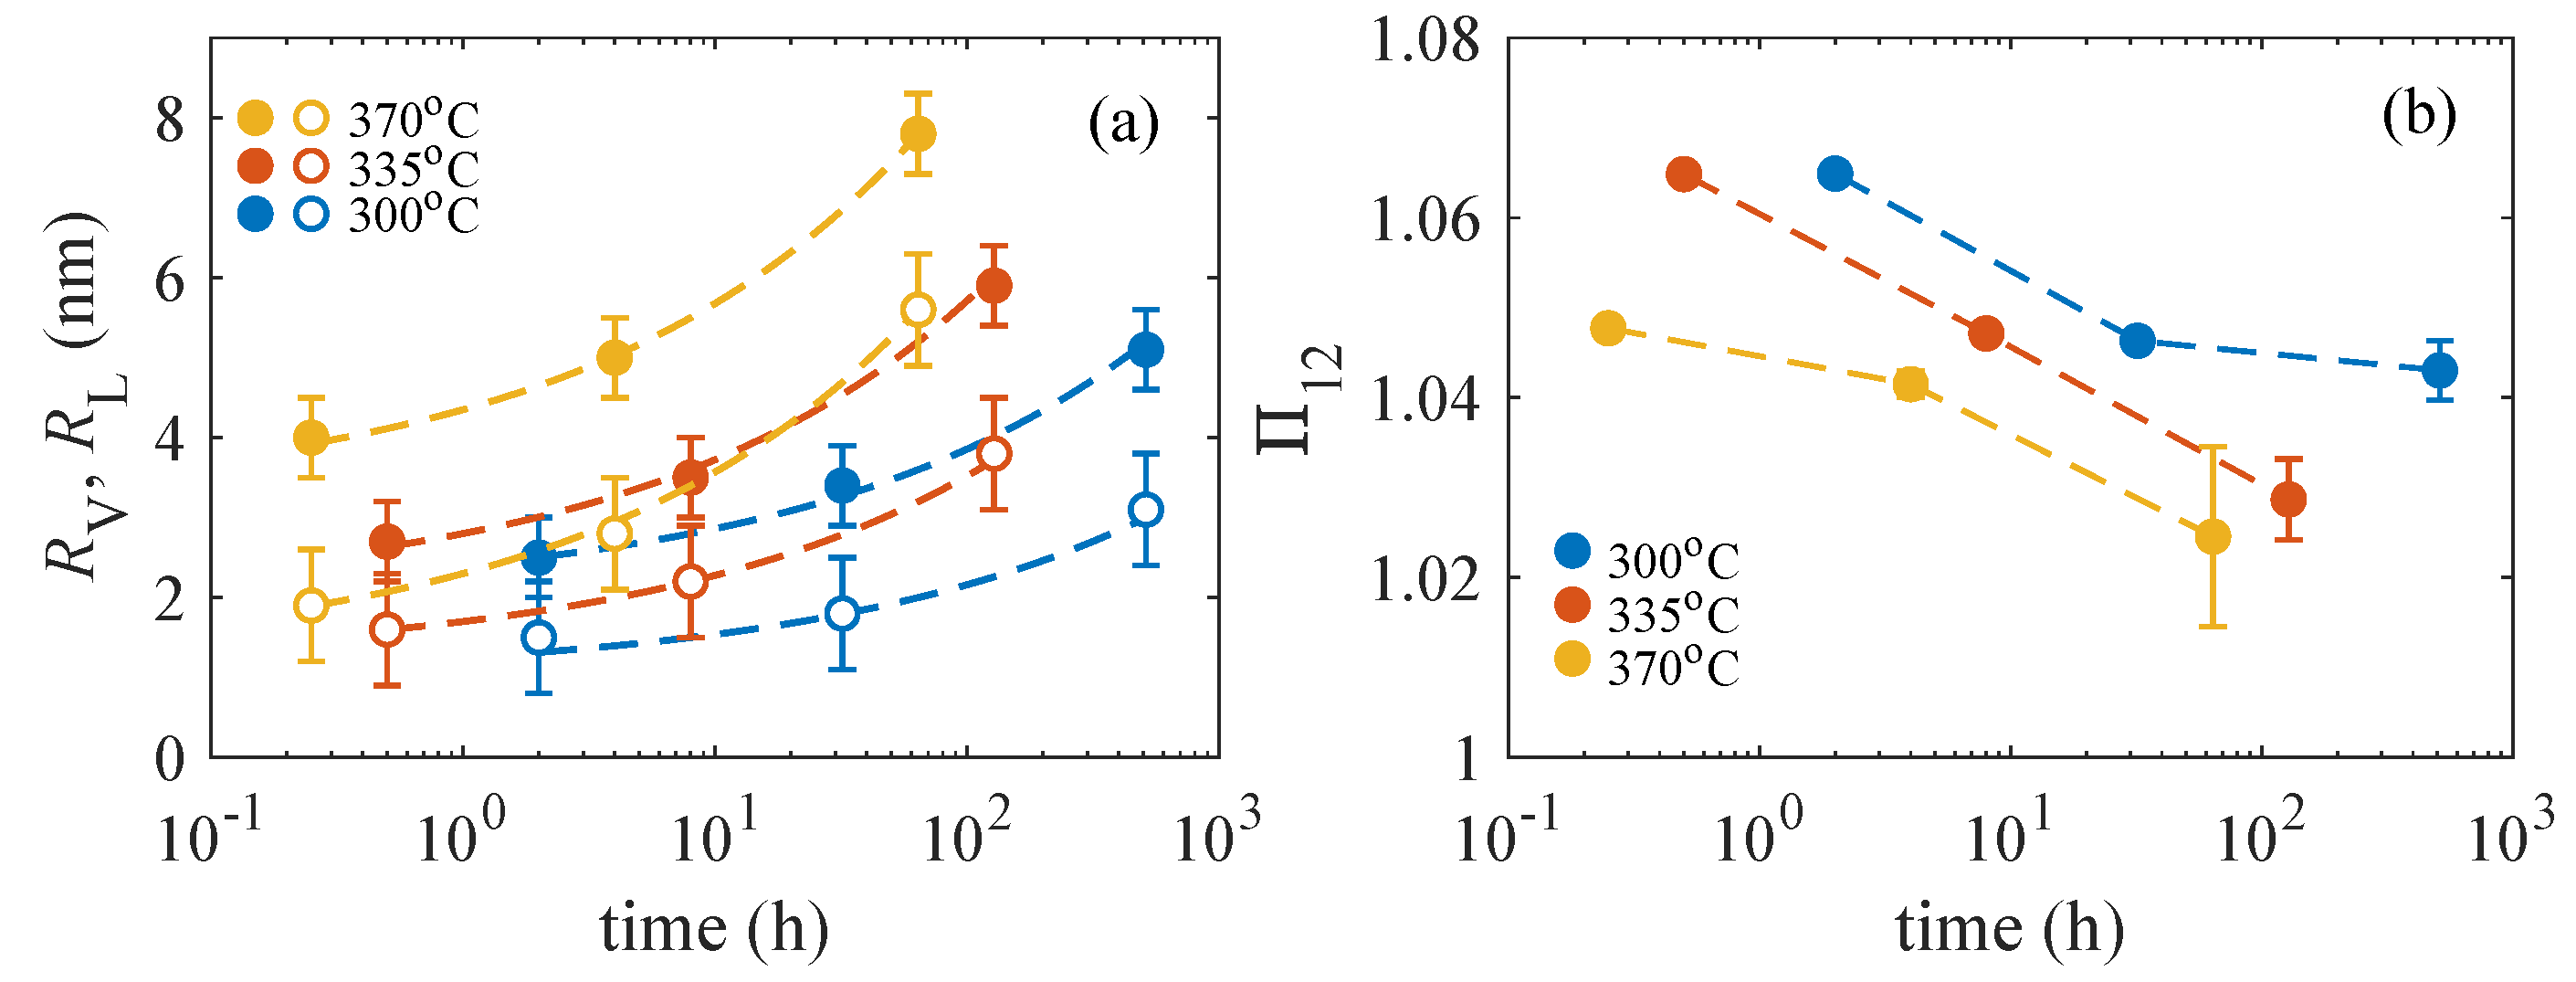
Figure 9.
Measured (black dots) and simulated (color lines) q-dependences of the intensity ratio for samples: 370/64 h (a); 370/4 h (b); and 370/15 min (c). The parameter of the simulated curves is the completeness factor p; see the main text for the simulation parameters.
Figure 9.
Measured (black dots) and simulated (color lines) q-dependences of the intensity ratio for samples: 370/64 h (a); 370/4 h (b); and 370/15 min (c). The parameter of the simulated curves is the completeness factor p; see the main text for the simulation parameters.

Figure 10.
The Mo densities in the particle shells as functions of the ageing time and temperature (parameter of the curves).
Figure 10.
The Mo densities in the particle shells as functions of the ageing time and temperature (parameter of the curves).
© 2019 by the authors. Licensee MDPI, Basel, Switzerland. This article is an open access article distributed under the terms and conditions of the Creative Commons Attribution (CC BY) license (http://creativecommons.org/licenses/by/4.0/).
Share and Cite
MDPI and ACS Style
Šmilauerová, J.; Harcuba, P.; Janeček, M.; Holý, V. Composition of ω-Phase Particles in Ti(Mo) Alloys Studied by Anomalous X-ray Diffraction. Crystals 2019, 9, 440. https://doi.org/10.3390/cryst9090440
AMA Style
Šmilauerová J, Harcuba P, Janeček M, Holý V. Composition of ω-Phase Particles in Ti(Mo) Alloys Studied by Anomalous X-ray Diffraction. Crystals. 2019; 9(9):440. https://doi.org/10.3390/cryst9090440
Chicago/Turabian StyleŠmilauerová, Jana, Petr Harcuba, Miloš Janeček, and Václav Holý. 2019. "Composition of ω-Phase Particles in Ti(Mo) Alloys Studied by Anomalous X-ray Diffraction" Crystals 9, no. 9: 440. https://doi.org/10.3390/cryst9090440
Note that from the first issue of 2016, this journal uses article numbers instead of page numbers. See further details here.