Abstract
This study investigates the influence of plastic deformation and temperature on the formation of mechanically induced martensite and the associated changes in hardness in AISI 304 austenitic stainless steel. Cold rolling was performed at three temperatures (20 °C, 0 °C, and −196 °C) and various degrees of deformation (10–70%). Microstructural changes, including the formation of ε and α′ martensite, were characterized using X-ray diffraction (XRD) and electron backscatter diffraction (EBSD). The results confirm that martensitic transformation proceeds via the γ → ε → α′ sequence, with transformation rates and martensite fractions increasing at lower temperatures and higher strains. The stacking fault energy of 25.9 mJ/m2 favors this transformation pathway. Transformation rates of α′ martensite fractions significantly increased at lower temperatures and higher strains, 91.8% α′ martensite was observed at just 30% deformation at −196 °C. Hardness measurements revealed a strong correlation with martensite content: strain hardening dominated at lower deformations, while martensite formation became the primary hardening mechanism at higher deformations, especially at cryogenic temperatures. The highest hardness (551 HV) was observed in samples deformed to 70% at −196 °C. The findings provide insights into optimizing the mechanical properties of AISI 304 stainless steel through controlled deformation and temperature conditions.
1. Introduction
Stainless steel can be defined as iron alloys with minimal chromium addition in the range between 10 and 12 wt. %. Chromium addition greatly improves atmospheric corrosion resistance due to the surface formation of the thin Cr2O3 passive film. Stainless steels can be used as structural materials where both mechanical strength and corrosion resistance are required [1].
AISI 304 (X5CrNi18-8) is the most commonly used Cr-Ni austenitic stainless steel, containing about 18% Cr and 10% Ni with a low C content (usually below 0.08%). Because it exhibits excellent corrosion resistance in the atmosphere and in fresh and seawater and has good weldability, it is widely used for modern applications in the automobile, aviation, and naval industries. Since austenitic stainless steels do not exhibit the ductile-to-brittle transition temperature, they can also be used in low temperature applications such as cryogenic pressure vessels. However, their drawback is pitting corrosion, a type of localized surface corrosion that is confined to a very small area (pits) and is characteristic of metals with protective surface film [2,3,4].
Austenitic stainless steels cannot be hardened by heat treatments. But they can be hardened by cold or warm work (drawing, rolling, forging, etc.). The greater the amount of plastic strain induced, the higher the stress required to further deform the material. This is known as strain (or work) hardening [5,6]. Austenitic stainless steels are characterized by a high strain-hardening rate, which is a result of low stacking fault energy (SFE) that makes it difficult for dislocations to cross-slip easily [1]. Since the composition of AISI 304 steel corresponds to the lowest austenite stabilizing alloying element, nickel, which still ensures a fully austenitic microstructure, the austenite in AISI 304 stainless steel is less stable. However, metastable austenite can be effectively used to improve strength through mechanically induced transformation. The mechanically induced transformation from austenite to martensite can only occur at certain temperature/deformation conditions. The portion of formed martensite depends on the amount, temperature, mode of deformation, strain rate, chemical composition, crystal grain size, and crystal grain orientation [7,8]. Martensite formation results in higher hardness and strength, and better wear resistance; moreover, it is also responsible for improving the plasticity (enhanced work hardening, inhibition of necking, and increased uniform elongation) known as the transformation-induced plasticity (TRIP) effect [1,9,10].
There are two types of mechanically induced transformations of austenite into martensite: (1) stress-induced, which takes place before the plastic deformation of austenite in the Ms—Msσ temperature range, and (2) strain-induced martensite, with the plastic deformation of austenite prior to the phase transformation and occurs at higher temperatures, in the Msσ—Md range [1,9,10]. The result of the mechanically induced transformation of austenite may be ε and/or α’ martensite. In the literature [11,12,13,14,15], two transformations, i.e., direct and indirect sequences, are described. Austenite can be directly transformed to α’ martensite (γ → α’) or through an intermediate ε martensite phase (γ → ε → α’). The direct transformation is characteristic of materials with SFE < 18 mJm−2 [16], while the indirect transformation occurs in materials with SFE > 18 mJm−2. The occurrence of ε martensite is also favored by low deformation temperatures [17,18]. ε martensite with a hexagonal close-packed (HCP) structure originates from the stacking faults, which are created by the movement of Shockley partial dislocations in austenite, and its growth occurs by overlapping of the stacking faults on every second {1 1 1} plane [7,9,19,20]. Nucleation sites of ε martensite thus involve the intersections of shear bands and mechanical twins formed when stacking fault overlap on successive {1 1 1} planes [9], while α’ martensite has a body-centered cubic (BCC) structure and forms at intersections of ε martensite plates and mechanical twins [7,11,21].
The present work aims to determine and characterize the effect of martensite obtained by different plastic deformation conditions (i.e., amount and temperature) on hardness. We studied the changes in the microstructure (with a focus on the development of ε and α’ martensite) and mechanical properties (hardness) of AISI 304 austenitic stainless steel. Different temperatures of cold rolling and reductions were employed to achieve different amounts of martensite and hardness.
2. Materials and Methods
In this study, 4.1 mm thick plates of AISI 304 stainless steel with the chemical composition in Table 1 were used for the experiments. The steel samples were cold-rolled at room temperatures of 23 °C, 0 °C, and −196 °C to produce thinner strips. The roller diameters were 200 mm, and the estimated logarithmic deformation speeds were around 0.1 s−1. The samples rolled at 0 °C were soaked in a mixture of ice and water, while the −196 °C samples were submerged in liquid nitrogen, and the soaking times were 10 min.

Table 1.
Chemical composition of AISI 304 in wt.%.
The deformation eh was calculated according to Equation (1).
The samples were prepared for metallographic analysis and Vickers hardness measurements, and X-ray diffraction analysis was performed. The specimens were analyzed with the light optical microscope Microphot FXA, Nikon (Nikon, Minato City, Japan), with the 3CCD video camera Hitachi HV-C20A (Hitachi, Ltd., Tokyo, Japan). Scanning electron microscopy (SEM) was performed using a Zeiss CrossBeam 550 FIB/SEM (Zeiss, Oberkochen, Germany) and a ThermoFisher Apreo 2S (Thermo Scientific, Waltham, MA, USA). Electron backscatter diffraction (EBSD) was conducted with a HikariSuper EBSD detector (Ametek, Berwyn, PA, USA). For EBSD measurements, an accelerating voltage of 15 keV and beam currents ranging from 10 to 15 nA were used to ensure high-quality pattern acquisition. Data analysis and visualization were carried out using OIM Analysis 8 software.
X-ray diffraction analysis was performed using Panalytical X’Pert Pro (Panalytical, Malvern, UK) instrument with Cu anode, operated at 45 kV and 40 A. Hardness (Vickers hardness HV10, Wilson Instruments, Norwood, MA, USA) was measured using an Instron Tukon 2100B Vickers hardness measurement instrument (Wilson Instruments, Norwood, MA, USA). The Vickers HV1 method was used with a 1 kgf (9.807 N) load and 10 s dwelling time.
The stacking fault energy can be calculated from the chemical composition using Equation (3) [22].
3. Results
The rolled samples were measured, and their achieved deformation was measured. The sample that was rolled at −196 °C to 70% deformation developed severe cracking, and no metallographic samples were extracted from it. The results of the cold rolling deformation are presented in Table 2.
Table 2.
Deformation and thickness of strip samples cold-rolled at different temperatures.
3.1. Microstructural Analysis
Metallographic analysis shows different martensite contents in the samples. The initial microstructure consisted of equiaxed austenite and some delta ferrite, as seen in Figure 1.
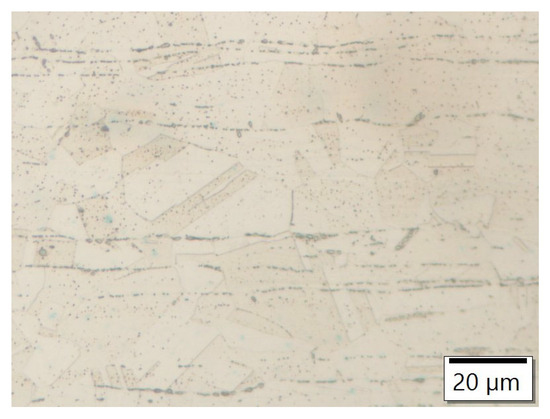
Figure 1.
The initial microstructure of AISI 304 consists of equiaxed austenite grains and delta ferrite stringers.
As the deformation is applied, deformation bands start to form. Figure 2, Figure 3, Figure 4 and Figure 5 show the increasing deformation in the material from 10 to 70% deformation at room temperature.
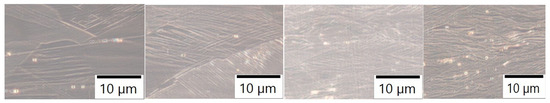
Figure 2.
Microstructure under increasing cold deformation at room temperature.
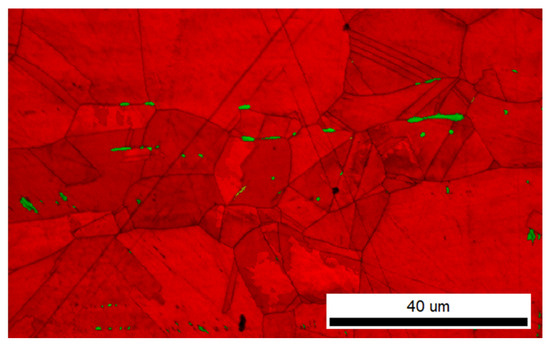
Figure 3.
EBSD of the initial microstructure. Austenite is marked with red, and delta ferrite is marked with green.
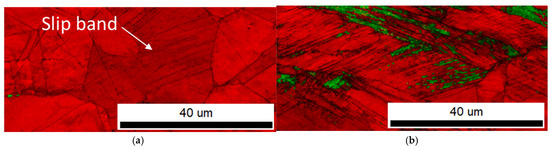
Figure 4.
Slip bands appear before martensite formation takes place. (a) EBSD of the sample with slip bands; 10% deformation at room temperature; austenite is marked with red and delta ferrite green. (b) EBSD of the sample with α’ martensite; 30% deformation at room temperature; austenite is marked with red, and α’ martensite is marked with green. Epsilon martensite only appears at lower temperatures.
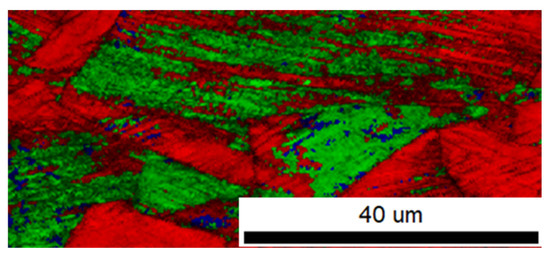
Figure 5.
The formation of ε martensite takes place on the slip bands, where it is transformed to α’martensite upon further deformation. EBSD of the sample with ε martensite; 30% deformation at 0 °C; austenite is marked with red, α’ martensite green, and ε martensite blue.
The EBSD phase analysis gave limited results, as indexation was possible only up to 30% deformation and 50% for 0 °C. At higher deformation, the microstructure is too deformed to produce usable patterns for indexation. The results of the volume fraction of the phases are given in Table 3, Table 4, Table 5 and Table 6.
Table 3.
Volume fraction of austenite and delta ferrite in the initial microstructure, EBSD analysis.
Table 4.
Volume fraction of austenite in samples, EBSD analysis.
Table 5.
Volume fraction of ε martensite in samples, EBSD analysis.
Table 6.
Volume fraction of α’ martensite in samples, EBSD analysis.
In addition to phase analysis, EBSD gave a good insight into the microstructural evolution during different processing conditions, as can be seen in Figure 6.
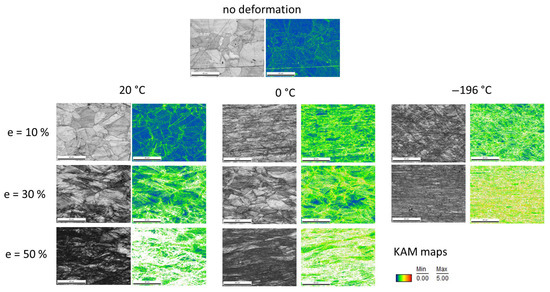
Figure 6.
EBSD IQ and KAM maps for different processing conditions.
3.2. XRD Analysis
We additionally determined the presence of austenite, ε martensite, and α’ martensite in the microstructure, based on XRD analysis. We compared the intensity of the peaks of the phases at the same degree of deformation and different temperatures. The results are shown in Figure 7, Figure 8, Figure 9 and Figure 10. Black dots and their corresponding peaks indicate the presence of austenite, red dots belong to α’ martensite and δ-ferrite, while green dots mark ε martensite.
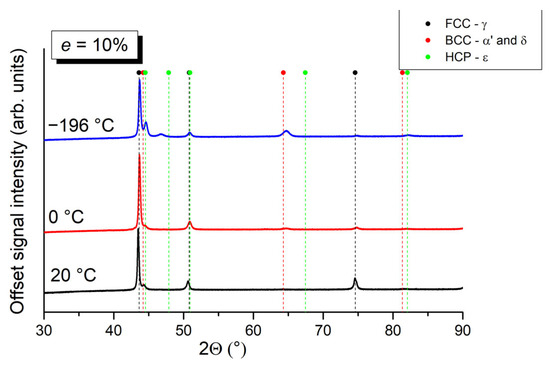
Figure 7.
Comparison of XRD analysis results of microstructural constituents in samples deformed at temperatures of 20 °C, 0 °C, and −196 °C and a 10% degree of deformation.
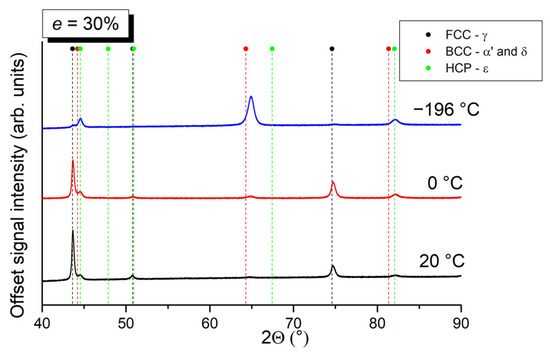
Figure 8.
Comparison of XRD analysis results of microstructural constituents in samples deformed at temperatures of 20 °C, 0 °C, and −196 °C and a 30% degree of deformation.
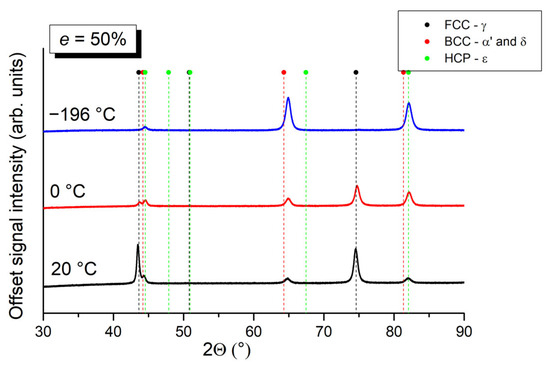
Figure 9.
Comparison of XRD analysis results of microstructural constituents in samples deformed at temperatures of 20 °C, 0 °C, and −196 °C and a 50% degree of deformation.
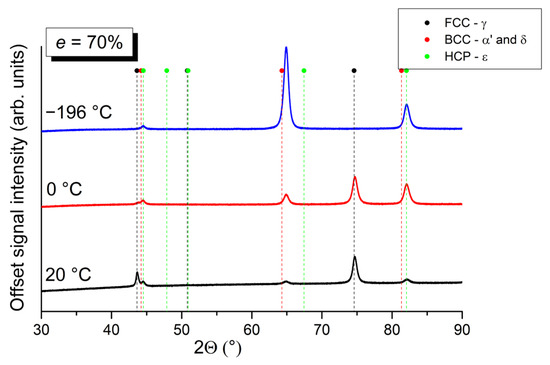
Figure 10.
Comparison of XRD analysis results of microstructural constituents in samples deformed at temperatures of 20 °C, 0 °C, and −196 °C and a 70% degree of deformation.
At 10% deformation, a decrease in the intensity of austenite diffraction peaks is evident with a decrease in the deformation temperature. With an increase in deformation to 30, 50, and 70%, the intensities of the austenite peaks decreased further at all deformation temperatures. At a 70% deformation, the austenite peaks can still be observed at deformation temperatures of 20 and 0 °C, but at −196 °C, they disappear above a 30% deformation. With the decrease in austenite diffraction peaks, the peaks belonging to ε martensite and α’ martensite increased. Peaks of ε martensite and α’ martensite first appear at the temperature of 20 °C and 30% deformation. At 0 and −196 °C, they are already present at a 10% deformation. At 70% deformation and temperature of −196 °C, a distinct peak belonging to α’ martensite is observed at a diffraction angle of 64.30°.
The results of the XRD analysis are comparable to those obtained by EBSD analysis. The changes in the intensity of the peak signals belonging to a specific phase are consistent with the changes in the fractions of individual phases determined by EBSD analysis and compiled in Table 3, Table 4, Table 5 and Table 6.
3.3. Vickers Hardness
Hardness measurements are presented in Figure 11. The hardness is increased by the degree of deformation. The lower the temperature at which the deformation took place, the higher the resulting hardness.
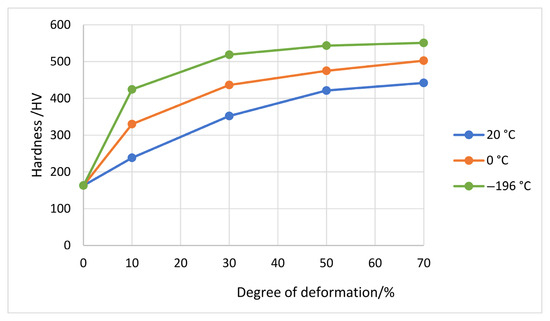
Figure 11.
Hardness of samples depends on different degrees of deformation at different temperatures.
3.4. Stacking Fault Energy
The stacking fault energy (SFE) of the investigated steel is 25.9 mJ/m2. It was calculated using empirical Equation (3), which, in addition to the chemical composition of the steel, also considers the interactions between the individual elements. The SFE values between 20 and 50 mJ/m2 favor the transformation of austenite into martensite through the intermediate epsilon phase (γ → ε → α’) [23,24]. This was observed in the microstructural analysis, but only in low-temperature samples.
SFE = 39 + 1.59(8.38) − 1.34(1.51) + 0.06(1.51)2 − 1.75(18.20)+ 0.01(18.20)2 + 15.21(0.35) − 5.59(0.31) − 60.69(0.042 + 1.2(0.048)) + 26.27(0.042 + 1.2(0.048))√(18.20 + 1.51 + 0.35) + 0.61√(8.38(18.20 +1.51))
4. Discussion
The microstructural change during cold deformation (10, 30, 50, and 70%) of austenitic stainless steel 304 at three different temperatures (20, 0, and −196 °C) showed a profound influence on the final properties. The lower degrees of deformation resulted in fewer slip bands in the crystal grains. However, at cryogenic temperatures, martensite forms even at low deformations.
At a 10% degree of deformation (Figure 12a), the number of shear bands within the austenite grains is low, and they are parallel to each other. With an increase in the degree of deformation, the number of shear bands within the grains also increased (Figure 12b).
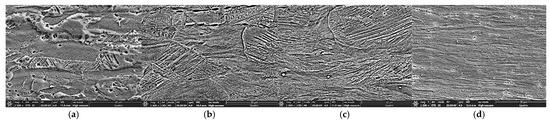
Figure 12.
Microstructure of samples deformed at 0 °C: (a) 10% deformation, (b) 30% deformation, (c) 50% deformation, (d) 70% deformation.
As the degree of deformation increases, the dislocation density and the number of mutual interactions in the steel increase. Most dislocations in FCC crystal systems are dissociated into Shockley partial dislocations, which are not capable of cross-slip and climb. Due to the reduction in mobility, cross-slip systems are activated, leading to intersections between shear bands, as seen at a 30% degree of deformation. At a 50% degree of deformation (Figure 12c), the number of shear bands is lower, as their intersections act as nucleation sites for the formation of ε martensite and α’ martensite. At a 70% degree of deformation (Figure 12d), most of the microstructure has already been overgrown by martensite. Higher deformations result in a microstructure where single grains cannot be identified.
The martensitic transformation proceeded via the reaction γ → ε → α’, which is consistent with the literature [25] on AISI 304 steel, where it was found that with increasing degree of deformation, the fractions of ε martensite and α’ martensite initially increase. The fraction of ε martensite increases more slowly and also reaches lower values than α’ martensite, as ε martensite also acts as a nucleation site for the formation of α’ martensite. In contrast to the previously mentioned research, in our case, the fraction of ε martensite increased at all temperatures and degrees of deformation, although according to reference [25], it should reach a maximum at a certain temperature and degree of deformation, after which its fraction would begin to decrease due to the formation of α’ martensite. This underlines ε martenite’s consistent presence as a precursor.
The martensitic transformation reaction is also consistent with previous research [18], where it was found that for a calculated stacking fault energy value of SFE = 25.87 mJ/m2, the transformation of austenite to α’ martensite occurs via the formation of ε martensite.
At low deformation temperatures, the stacking fault energy is also lower, which causes an increasing number of perfect dislocations to decompose into Shockley partial dislocations that are not capable of climb and cross-slip. Due to the limited mobility, cross-slip systems are activated, leading to intersections between shear bands. The intersections act as nucleation sites for the formation of ε martensite and α’ martensite. With the growth of martensite, the number of shear bands decreased, which is evident from the microstructure image at a deformation temperature of 0 °C (Figure 13a). At −196 °C, most of the microstructure is martensitic (Figure 13b).
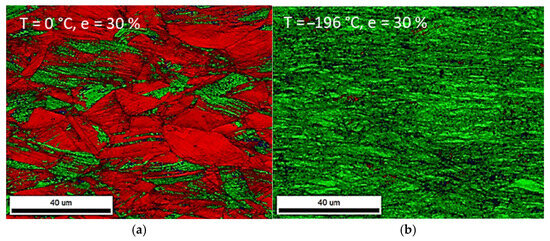
Figure 13.
The formation of α’martensite largely depends on the deformation temperature. EBSD mappings where austenite is marked with red, and α’martensite is marked with green; (a) 30% deformation at 0 °C, partial martensitic microstructure, and (b) 30% deformation at −196 °C, predominantly martensitic microstructure.
While α′ martensite is indeed the primary phase responsible for the significant increase in hardness, the γ → ϵ → α′ transformation sequence is not merely a pathway but an intrinsic and crucial mechanism that enables and enhances this hardening, especially at lower temperatures.
In materials with SFE > 18 mJ/m2 (AISI 304 with 25.9 mJ/m2), ε martensite forms first from stacking faults in the austenite. These ε martensite plates, particularly their intersections with each other or with mechanical twins, act as preferential nucleation sites for the harder α′ martensite [24,26].
Without this preceding ε martensite phase, the nucleation of α′ directly from austenite would be much more difficult, requiring higher driving forces (more deformation, lower temperatures) or a different crystallographic mechanism, thus affecting the efficiency of α′ formation and subsequently the hardening rate.
The formation of ε-martensite itself induces local stresses and lattice distortions, which contribute to the overall work hardening [27].
The transformation from ε to α′ involves additional lattice shear and rearrangements. This dynamic process during deformation continuously introduces new defects (dislocations, boundaries) and refines the microstructure, further increasing the steel’s resistance to plastic flow. This “dynamic” aspect of transformation is key to the TRIP effect.
We studied the influence of temperature and the degree of deformation on hardening based on the results of Vickers hardness measurements (Figure 12) and the fractions of α’ martensite. We did not consider the fraction of ε martensite in this analysis. Since there is significantly less ε martensite than α’ martensite in the microstructure, only small deviations are expected. First, we converted the engineering strains (e) into true strains (ε) using Equation (4).
ε = ln(1 + e)
The rate of α’ martensite formation was calculated according to Equation (5).
where represents the fraction of α′ martensite at a given deformation, and represents the fraction of α′ martensite at the previous deformation.
The difference in hardness was calculated according to Equation (6):
where H1 represents the hardness at the given deformation and H0 represents the hardness at the previous deformation.
ΔH = H1 − H0
The fraction of α′ martensite increases with increasing deformation, and a decreasing deformation temperature can be observed from diagrams in Figure 14a,c,e. Consequently, as the fraction of α′ martensite increases, the hardness also increases. This increase in the α′ martensite fraction is more rapid at lower temperatures, reaching higher overall values. Correspondingly, with the increasing fraction of α′ martensite, the hardness increases rapidly at lower deformations. At higher deformations, the rate of increase in the α′ martensite fraction slows, and the hardening effect also diminishes. The diagrams in Figure 14a,c show that hardness increased with deformation even before the formation of α′ martensite in the microstructure. This initial increase in hardness can be attributed to the strain hardening of the steel, resulting from the increased dislocation density and consequently shorter free slip paths. The effect of strain hardening is more pronounced at lower temperatures (Figure 14e), where the lower stacking fault energy leads to an increased decomposition of perfect dislocations into Shockley partial dislocations with limited mobility. Figure 14f illustrates that after most of the austenite has transformed into α′ martensite, the hardness increases minimally.
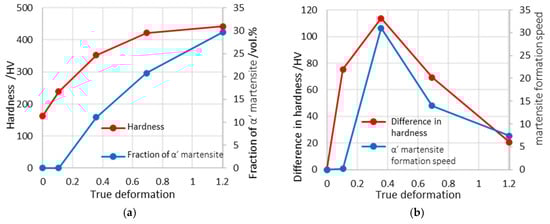
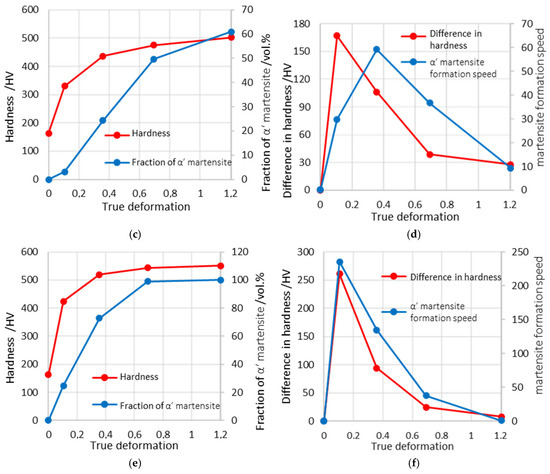
Figure 14.
Diagrams of hardness and α’ martensite fractions (a) 20 °C, (c) 0 °C, (e) −196 °C at different true deformations. Diagrams of difference in hardness and martensite formation rate (b) 20 °C, (d) 0 °C, (f) −196 °C at different true deformations.
At low deformations, both the difference in hardness and the rate of α′ martensite formation increase, as presented by the diagrams in Figure 14b,d,f. They reach a maximum at a certain deformation level, after which both values decrease with further deformation. In Figure 14b,f, the curve representing the hardness difference closely follows the curve representing the rate of α′ martensite formation. Following the maximum, which occurs at approximately the same deformation, the rate of α′ martensite formation decreases, and the hardening effect also diminishes. This decrease in rate occurs as the fraction of α′ martensite in the steel increases. The closer we are to the maximum fraction of α′ martensite at a given deformation temperature, the lower the rate of α′ martensite formation. In Figure 14d, a slight shift is observed between the maximums of the hardness difference and the rate of α′ martensite formation, indicating that hardness increased more rapidly at lower deformations. This rapid increase in hardness at low deformations is attributed to the strain hardening of the steel.
The martensite formation rates are the greatest at cryogenic temperatures, where they reach peak rates at 0.1 true deformation, while 20 and 0 °C peak at around 0.3 true deformation, as seen in Figure 15.
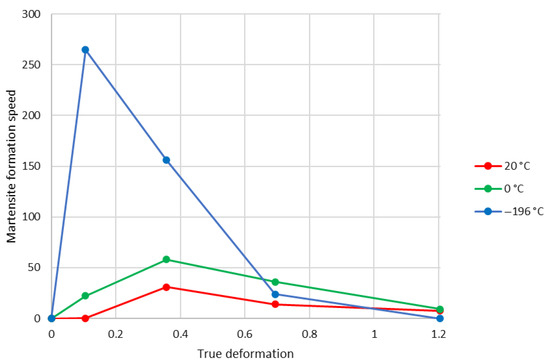
Figure 15.
Martensite formation rate at different true deformations for 20, 0, and −196 °C.
Therefore, the γ → ε → α′ sequence is not merely a crystallographic pathway but a critical aspect of the mechanical response and hardening mechanism in AISI 304. The formation of ε martensite from stacking faults, while itself contributing to initial hardening, primarily serves as a high-density nucleation platform for the significantly harder α′ martensite.
Furthermore, the increased ease of ε formation and its rapid subsequent transformation to α′ at lower temperatures explain the dramatically higher rates of α′ formation and corresponding hardness increases observed, particularly at −196 °C.
Beyond the strain hardening of austenite, the continuous formation of ε martensite and its subsequent transformation to α′ martensite during deformation provides a robust, dynamic hardening mechanism. The lattice strains and defect generation associated with the ε → α′ transformation contribute significantly to the observed increase in hardness, enhancing the TRIP effect by continually presenting new obstacles to dislocation motion.
While α′ martensite is the principal hard phase, the efficiency of its nucleation via the ε intermediate phase dictates the overall rate and extent of hardening. The observed rapid increase in hardness at cryogenic temperatures is a direct consequence of the accelerated ε formation and its efficient conversion to α′ under these conditions.
Additionally, the calculated SFE of 25.9 mJ/m2 indeed favors the γ → ε → α′ transformation pathway. This implies that the presence of ε martensite is a prerequisite for a more pronounced α′ formation in this steel, directly influencing its mechanical behavior. Thus, the SFE not only dictates the pathway but also the potential for strain-induced hardening through this specific two-step transformation.
5. Conclusions
This study effectively demonstrates the significant influence of cold rolling temperature and deformation degree on the mechanically induced martensitic transformation in AISI 304 stainless steel.
Upon deformation, shear bands form, increasing with strain. These bands, particularly their intersections, act as nucleation sites for martensite. Martensite (both ε and α’) forms at lower deformation levels with decreasing temperature (e.g., at 10% deformation at 0 °C and −196 °C, versus 30% at 20 °C).
The deformation-induced transformation primarily follows the γ → ε → α’ pathway. Lower temperatures and higher deformation degrees accelerate the formation and increase the fraction of both ε and α’ martensite, with α’ martensite showing a more rapid increase.
Critically, hardness directly correlates with martensite content. Initial hardening at lower deformations is due to strain hardening. However, as martensite forms, it becomes the dominant hardening mechanism. The highest hardness (551 HV) was achieved at −196 °C and 70% deformation, where martensite formation was maximized. The rate of martensite formation significantly influences the hardening effect, with faster transformation leading to greater hardness increases.
Author Contributions
Conceptualization, J.B. and A.N.; methodology, J.L., B.Š.B. and A.N.; validation, J.B., B.Š.B. and A.N.; formal analysis, J.L. and B.Š.B.; investigation, J.L. and B.Š.B.; resources, J.B.; data curation, J.B. and B.Š.B.; writing—original draft preparation, J.B. writing—review and editing, J.B., B.Š.B. and A.N.; visualization, J.B. and J.L.; supervision, J.B. and A.N. All authors have read and agreed to the published version of the manuscript.
Funding
Funding was provided by the Slovenian Research Agency ARRS program P2-0050 (C).
Data Availability Statement
The original contributions presented in the study are included in the article; further inquiries can be directed to the corresponding author.
Conflicts of Interest
Author Jernej Lindič was employed by the company SIJ Acroni d.o.o. The remaining authors declare that the research was conducted in the absence of any commercial or financial relationships that could be construed as a potential conflict.
References
- De Cooman, B.C.; Speer, J.G. Fundamentals of Steel Product Physical Metallurgy; AIST, Association for Iron & Steel Technology: Warrendale, PA, USA, 2011. [Google Scholar]
- Chakraborty, A.; Singh, J.K.; Sen, D.; Pityana, S.; Manna, I.; Krishna, S.; Dutta Majumdar, J. Microstructures, Wear and Corrosion Resistance of Laser Composite Surfaced Austenitic Stainless Steel (AISI 304 SS) with Tungsten Carbide. Opt. Laser Technol. 2021, 134, 106585. [Google Scholar] [CrossRef]
- Desu, R.K.; Nitin Krishnamurthy, H.; Balu, A.; Gupta, A.K.; Singh, S.K. Mechanical Properties of Austenitic Stainless Steel 304L and 316L at Elevated Temperatures. J. Mater. Res. Technol. 2016, 5, 13–20. [Google Scholar] [CrossRef]
- Cui, C.Y.; Cui, X.G.; Zhang, Y.K.; Zhao, Q.; Lu, J.Z.; Hu, J.D.; Wang, Y.M. Microstructure and Corrosion Behavior of the AISI 304 Stainless Steel after Nd:YAG Pulsed Laser Surface Melting. Surf. Coat. Technol. 2011, 206, 1146–1154. [Google Scholar] [CrossRef]
- Milad, M.; Zreiba, N.; Elhalouani, F.; Baradai, C. The Effect of Cold Work on Structure and Properties of AISI 304 Stainless Steel. J. Mater. Process. Technol. 2008, 203, 80–85. [Google Scholar] [CrossRef]
- Zhang, X.; Xiao, Y.; Cai, Y. Effect of Ni Element on Microstructure and Properties of Cold-Rolled 316 L Austenitic Stainless Steel. Mater. Res. Express 2024, 11, 036521. [Google Scholar] [CrossRef]
- Gilapa, L.C.M.; de Oliveira, C.A.S.; da Silva, M.R. Effect of Copper on the Formation of Strain-Induced Martensite in Two Austenitic Stainless Steels AISI 304. Mater. Sci. Eng. A 2015, 622, 212–218. [Google Scholar] [CrossRef]
- Solomon, N.; Solomon, I. Deformation Induced Martensite in AISI 316 Stainless Steel. Rev. Metal. 2010, 46, 121–128. [Google Scholar] [CrossRef]
- Sohrabi, M.J.; Naghizadeh, M.; Mirzadeh, H. Deformation-Induced Martensite in Austenitic Stainless Steels: A Review. Arch. Civ. Mech. Eng. 2020, 20, 124. [Google Scholar] [CrossRef]
- Denkena, B.; Breidenstein, B.; Dittrich, M.-A.; Wichmann, M.; Nguyen, H.N.; Fricke, L.V.; Zaremba, D.; Barton, S. Setting of Deformation-Induced Martensite Content in Cryogenic External Longitudinal Turning. Procedia CIRP 2022, 108, 170–175. [Google Scholar] [CrossRef]
- Pun, L.; Soares, G.C.; Isakov, M.; Hokka, M. Effects of Strain Rate on Strain-Induced Martensite Nucleation and Growth in 301LN Metastable Austenitic Steel. Mater. Sci. Eng. A 2022, 831, 142218. [Google Scholar] [CrossRef]
- Das, A.; Tarafder, S. Experimental Investigation on Martensitic Transformation and Fracture Morphologies of Austenitic Stainless Steel. Int. J. Plast. 2009, 25, 2222–2247. [Google Scholar] [CrossRef]
- Lecroisey, F.; Pineau, A. Martensitic Transformations Induced by Plastic Deformation in the Fe-Ni-Cr-C System. Metall. Trans. 1972, 3, 391–400. [Google Scholar] [CrossRef]
- Das, A.; Sivaprasad, S.; Ghosh, M.; Chakraborti, P.C.; Tarafder, S. Morphologies and Characteristics of Deformation Induced Martensite during Tensile Deformation of 304 LN Stainless Steel. Mater. Sci. Eng. A 2008, 486, 283–286. [Google Scholar] [CrossRef]
- Choi, J.Y.; Jin, W. Strain Induced Martensite Formation and Its Effect on Strain Hardening Behavior in the Cold Drawn 304 Austenitic Stainless Steels. Scr. Mater. 1997, 36, 99–104. [Google Scholar] [CrossRef]
- Shen, Y.F.; Li, X.X.; Sun, X.; Wang, Y.D.; Zuo, L. Twinning and Martensite in a 304 Austenitic Stainless Steel. Mater. Sci. Eng. A 2012, 552, 514–522. [Google Scholar] [CrossRef]
- Olson, G.B.; Cohen, M. Kinetics of Strain-Induced Martensitic Nucleation. Metall. Trans. A 1975, 6, 791–795. [Google Scholar] [CrossRef]
- Talonen, J.; Hänninen, H. Formation of Shear Bands and Strain-Induced Martensite during Plastic Deformation of Metastable Austenitic Stainless Steels. Acta Mater. 2007, 55, 6108–6118. [Google Scholar] [CrossRef]
- Yang, H.; Liu, Y. Factors Influencing the Stress-Induced Fcc ↔ Hcp Martensitic Transformation in Co-32Ni Single Crystal. Acta Mater. 2006, 54, 4895–4904. [Google Scholar] [CrossRef]
- Alves, J.M.; Brandão, L.P.; Dos Santos Paula, A. Mechanically Induced Martensitic Transformation of Hot Rolled and Annealed 304L Austenitic Stainless Steel at Room and Cryogenic Temperatures. Mater. Res. 2019, 22, e20190150. [Google Scholar] [CrossRef]
- Yang, H.; Zhang, J.H.; Xu, Y.; Meyers, M.A. Microstructural Characterization of the Shear Bands in Fe-Cr-Ni Single Crystal by EBSD. J. Mater. Sci. Technol. 2008, 24, 819–828. [Google Scholar]
- Dai, Q.-X.; Wang, A.-D.; Cheng, X.-N.; Luo, X.-M. Stacking Fault Energy of Cryogenic Austenitic Steels. Chin. Phys. 2002, 11, 596. [Google Scholar] [CrossRef]
- Weiß, A.; Gutte, H.; Scheller, P.R. Deformation Induced Martensite Formation and Its Effect on Transformation Induced Plasticity (TRIP). Steel Res. Int. 2006, 77, 727–732. [Google Scholar] [CrossRef]
- Kowalska, J.; Witkowska, M. The Influence of Cold Deformation and Annealing on Texture Changes in Austenitic Stainless Steel. Adv. Sci. Technol. Res. J. 2024, 18, 143–158. [Google Scholar] [CrossRef] [PubMed]
- De, A.K.; Speer, J.G. Deformation-Induced Phase Transformation and Strain Hardening in Type 304 Austenitic Stainless Steel. Metall. Mater. Trans. A 2005, 37A, 1875–1886. [Google Scholar] [CrossRef]
- He, C.; Zhu, X.; Hu, C.; Dong, H.; Wan, X.; Liu, E.; Li, G.; Wu, K. Processing an 18Cr-8Ni Austenitic Stainless Steel Without the Dilemma of the Strength and Ductility Trade-Off. JOM 2024, 76, 829–842. [Google Scholar] [CrossRef]
- Bachani, M.; Hayoune, A.; Fajoui, J.; Dubos, P.-A. Phase Transformations in Cold-Rolled 304L Stainless Steel by Dilatometry. Bull. Mater. Sci. 2024, 47, 64. [Google Scholar] [CrossRef]
Disclaimer/Publisher’s Note: The statements, opinions and data contained in all publications are solely those of the individual author(s) and contributor(s) and not of MDPI and/or the editor(s). MDPI and/or the editor(s) disclaim responsibility for any injury to people or property resulting from any ideas, methods, instructions or products referred to in the content. |
© 2025 by the authors. Licensee MDPI, Basel, Switzerland. This article is an open access article distributed under the terms and conditions of the Creative Commons Attribution (CC BY) license (https://creativecommons.org/licenses/by/4.0/).