1. Introduction
The operating frequency is a critical parameter that distinguishes engineering domains, from the static fields of electrostatics to the dynamic fields of modern technology. Contemporary applications leverage a wide range of the electromagnetic spectrum, operating at specific regimes from radiofrequency (including microwave (MW) [
1] and millimetre-wave (mmW) [
2,
3,
4]) to terahertz (THz) [
5,
6] and optical [
7,
8,
9,
10] wavelengths. These technologies enable advancements in diverse fields such as precision metrology [
11] and liquid crystal systems [
4,
12,
13]. More specifically, frequency is underpinning the material dispersion [
14] as well as the device geometry design [
3,
6,
9]. Phase, representing the angular position of an electromagnetic field (wave) in space and time, is playing a critical role in the above frequencies, targeting MW, mmW, THz, and optical applications concerning wavefront phase control [
15], e.g., phased array antenna [
16,
17] for electromagnetic beam steering, intelligent reconfigurable surface (wherein the phase shift of 180° is normally required) [
18,
19], liquid crystal on silicon (LCOS) [
8,
20], phase plate [
21], and orbital angular momentum (OAM) [
22], to name a few. For two-port passive phase shifters [
3,
4,
23], understanding the numerically simulated and experimentally measured results by correct interpretations is of equal importance to the measurement precision of electronic instrumentation.
Compared with group IV, III-V, and II-VI semiconductors [
24,
25], nematic liquid crystal (NLC) [
26,
27,
28,
29,
30,
31,
32] is typified by its continuous tunability, electronically, with low power consumptions [
3] (albeit magnetically possible but power-consuming [
31]), a remarkable property that enables an NLC-embedded device to be adept at reconfiguring its dielectric constant [
3,
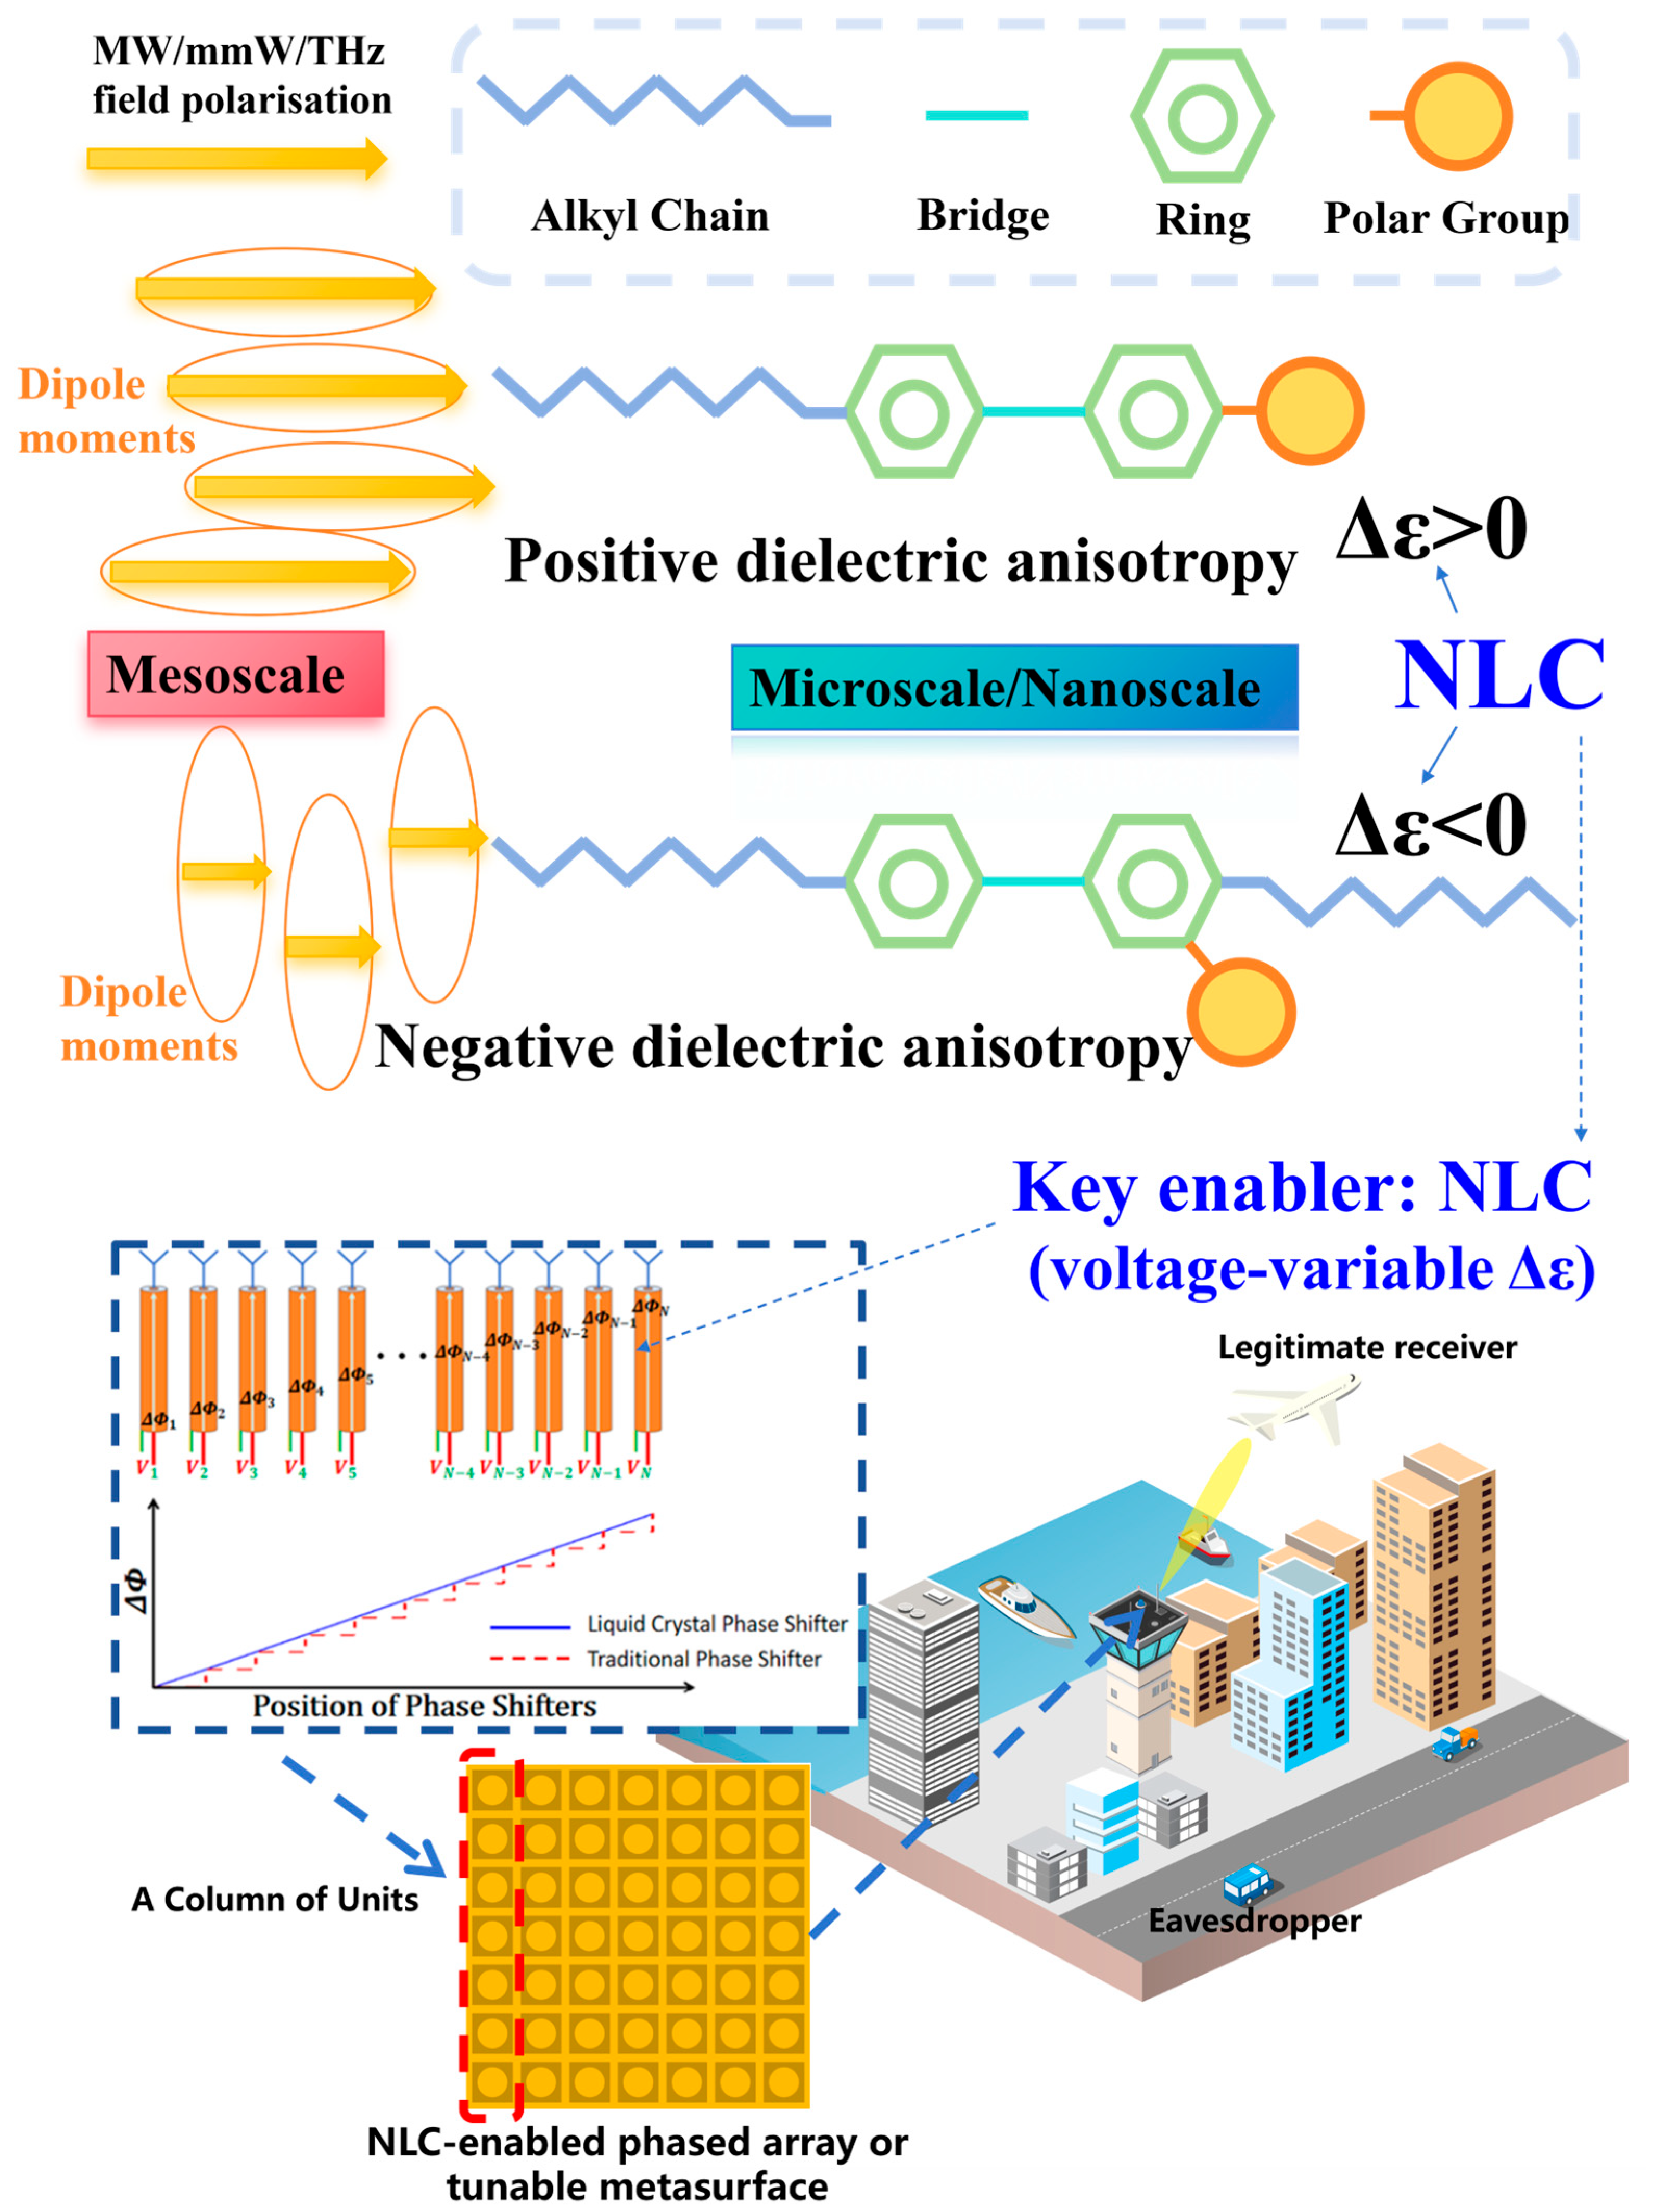
26] with a continuously addressable voltage, as depicted in
Figure 1 for the rod-like (calamitic) molecular shape exhibiting a positive dielectric anisotropy [
32] for phase-reconfiguring applications when deployed in MW/mmW/THz transmission lines.
Arguably, the fusion of NLC (a dielectric-adaptive material) and mmW passive devices tops the future global reconfigurable technology league table, albeit their potential and challenges [
33] have yet to be evidently unleashed and addressed. Specifically, fulfilling the dispatchable phase-shifting generation goal on demand requires precise manipulation of the NLC biasing state and the corresponding permittivity variation, hence the production of adjustable differential phase shifts (DPS) that feed a phased array antenna for applications in communications (5G, Beyond 5G, and 6G systems), sensing, detection, imaging [
34], wireless power transfer [
35], etc.
While the vast majority of past researchers primarily prioritise the longstanding insertion-loss optimisations [
3,
4,
6,
13] to compete against the solid-state switching device counterparts, few are capturing the vulnerability of interpreting the main functionality, i.e., phase shifts, and more specifically, the DPS (between two tuning states of NLC). It is worth taking a slightly deeper look at the frequency response of the phase shifts (data-processing sensitive issue) and the resulting DPS, the implications of which target both radio frequencies and optical regimes, towards wireless-optical convergence. More precisely, this work seeks to establish a sound understanding into the translation from phase shifts to DPS and FoM to guide informed decision-making.
2. Materials and Methods
2.1. Angular and Cumulative Angular Representations in Phase–Frequency Responses
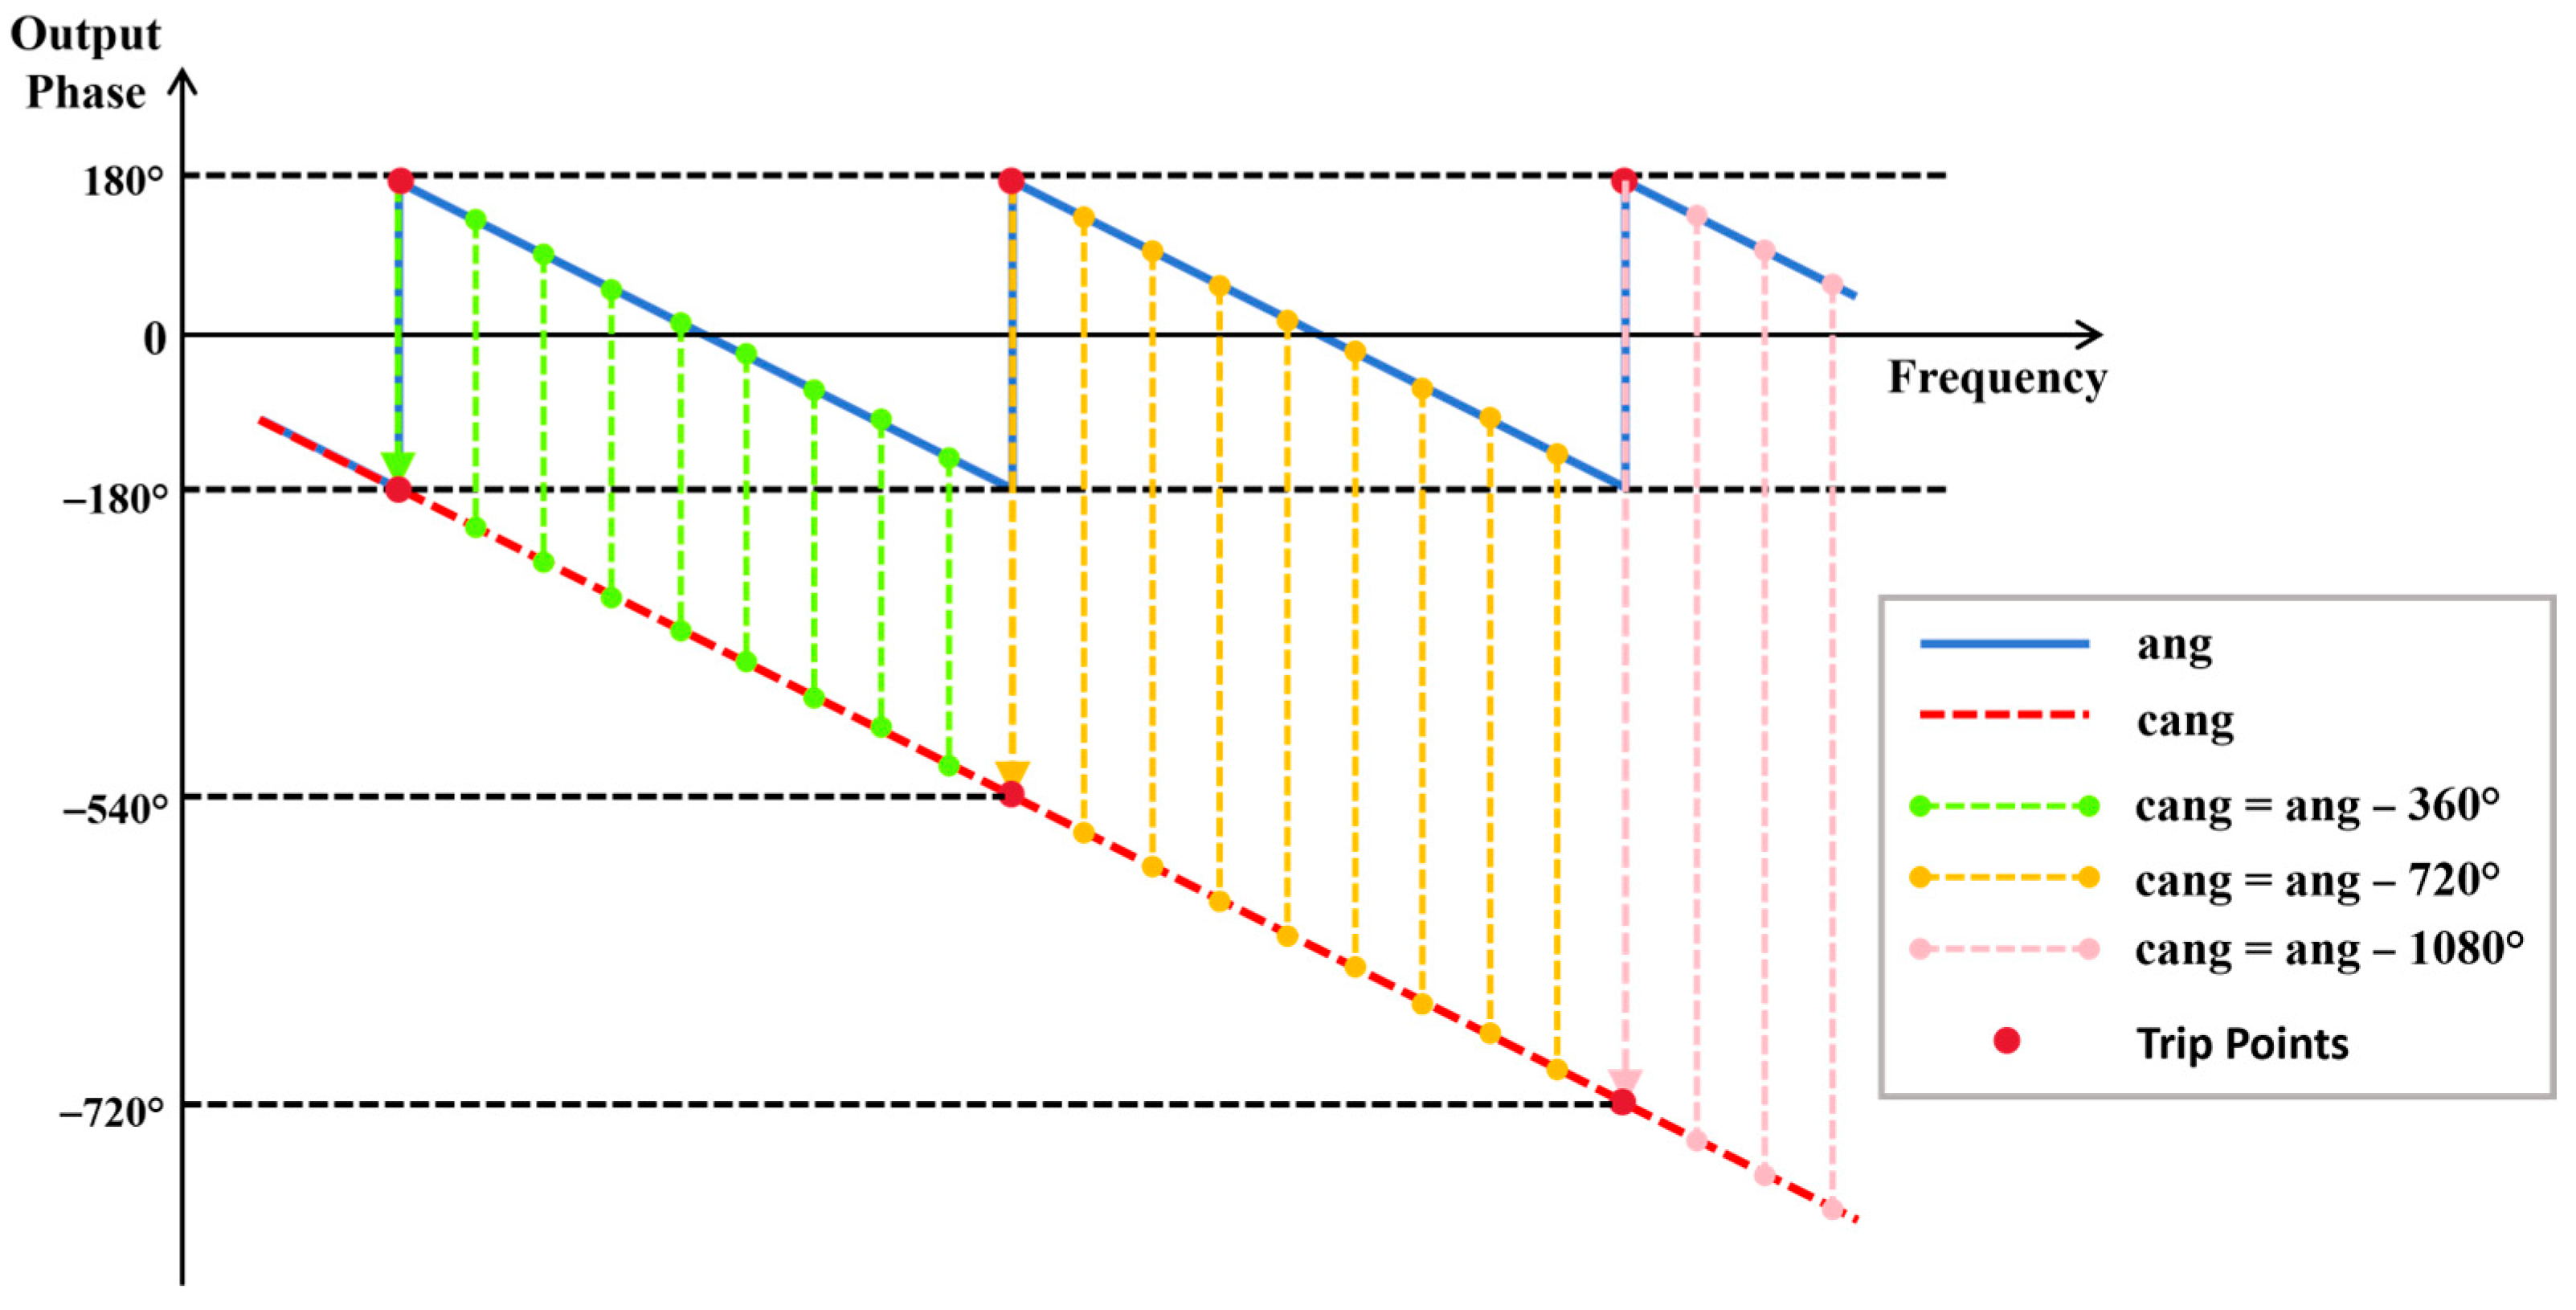
Keeping track of the phase representation across a frequency spectrum of measurement or simulation, angular (ang) and cumulative angular (cang) patterns are widely used in vector network analysers (VNA) [
36,
37,
38] as well as electromagnetic (EM) simulators [
6,
23]. At the outset, the mechanism and conversion mechanism between cang and ang formats are graphically explained in
Figure 2. The ang representation is typified by a hypotenuse that is periodically swapping at ±180° and wrapping the triangular shapes into a sawtooth wave. Conversely, the unwrapped phase pattern, i.e., in a continuously (cumulatively) descending angular manner is represented by the cang pattern. By way of real-world illustration,
Figure 3 displays the measured-forward transmission coefficient
(in both amplitude and phase), photographed during VNA characterisation of our developed X-band inverted microstrip phase shifters incorporating NLC.
Inspired by the former Editor-in-Chief of IEEE Antennas and Propagation Magazine [
39], who highlighted the misunderstanding and consequent misuse of terms such as “return loss”, this paper seeks to draw attention to a fundamental yet practical issue—namely, the correct method for computing DPS in NLC-based devices. Clarifying such foundational knowledge offers valuable know-how with practical benefits for both academics and engineers and contributes toward standardising design methodologies for high-performance NLC-based phase shifters. Accordingly, the focus of this work is not on enhancing the performance of existing NLC mmW devices, but rather on exposing hidden vulnerabilities in data processing and interpretation that critically affect the accuracy of results—results which are widely used as benchmarks within the NLC research community.
Driven by this motivation, this paper presents the first systematic investigation of vulnerabilities in the post-processing of DPS in NLC-based devices, using comparative analysis and cross-benchmarking. These vulnerabilities are often overlooked due to the seemingly straightforward nature of phase extraction. The overarching goal is to establish reliable methods for interpreting structured and unstructured phase and phase shift data. To ensure consistency across different post-processing approaches, results are sanity-checked and cross-validated using the fundamental DPS expression [
6,
23] given in Equation (1), where ∆∅ denotes the DPS between two bias states, f is the operating frequency, L is the effective line length of the NLC-filled transmission line, c is the speed of light in vacuum, and
(bias 2) and
(bias 1) represent the effective permittivities under two distinct bias voltages.
Furthermore, the computation of the maximum DPS,
, in Equation (2), corresponds to the phase shift achievable between two extreme bias states—typically a saturated bias and a reference state (e.g., 0 V). In the reference state, the NLC directors are aligned via mechanically rubbed alignment layers (e.g., polyimide) [
6], while the saturated state occurs when the dipolar moments are fully aligned with the applied field, as illustrated in
Figure 1 for NLCs with positive dielectric anisotropy.
Finally, to enable fair cross-topology and cross-technology benchmarking, a widely adopted figure-of-merit (FoM) is employed, defined in Equation (3) to incorporate the maximum insertion loss
:
The effective permittivity,
, and its tuning range—which directly influences the maximum DPS,
—depend not only on the intrinsic dielectric constant (Dk) of the NLC and its variation range (governed fundamentally by molecular shape anisotropy, resulting in variable dipolar moment and polarisability), but also on the transmission line topology employed [
3]. This topology governs the conversion of the material’s tunable Dk into a variable
of the phase-shifting device, as previously examined in [
3].
2.2. Schematics, Tuning Mechanisms, and NLC Materials Utilised in the Case Studies
To this end, without loss of generality, the vulnerable cases examined in the following sections are based on various transmission line structures—such as strip lines (case 1 studied in
Section 3.1) and coaxial lines (case 2 studied in
Section 3.2)—designed to accommodate NLCs. These structures were numerically simulated using a full-wave electromagnetic (EM) solver, specifically ANSYS HFSS (High-Frequency Structure Simulator, version 2022 R1), which employs the finite-element method (FEM) [
23]. Such semi- or fully enclosed transmission line configurations were selected for the Δ∅ vulnerability study due to their inherent immunity to electromagnetic interference, noise, and crosstalk-induced instabilities. The resulting higher-order-mode-free EM environment ensures that any identified susceptibility is reliable and attributable solely to the signal (data) post-processing strategy within the scope of this investigation. The NLC material used in these case studies, i.e., with a trade name of GT3-24002 (Merck KGaA, Darmstadt, Germany), exhibits relative permittivity or dielectric constant (Dk) ranging from 2.5 to 3.3, with a corresponding dissipation factor (DF) between 0.0123 and 0.0032 [
3,
6,
23].
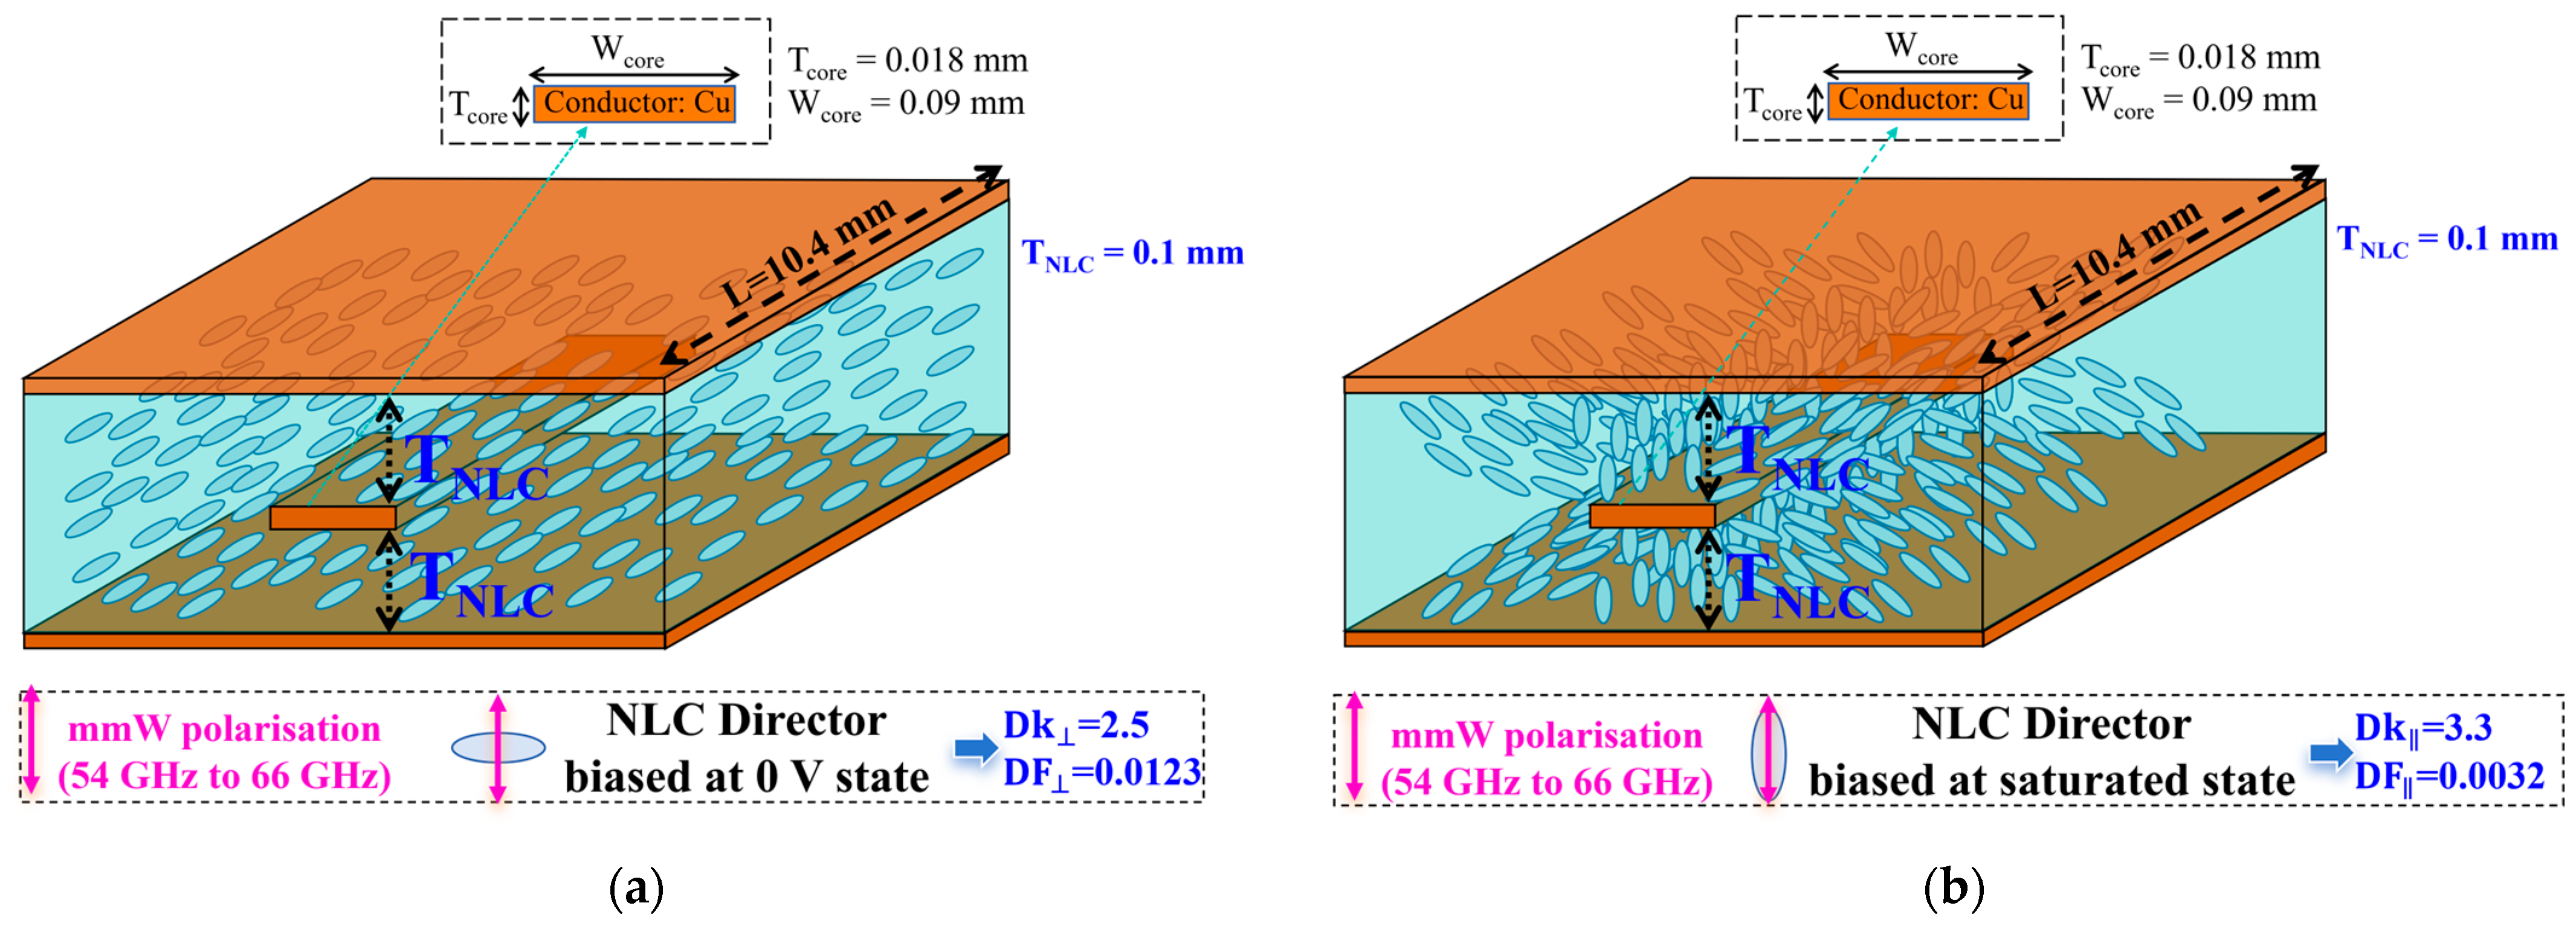
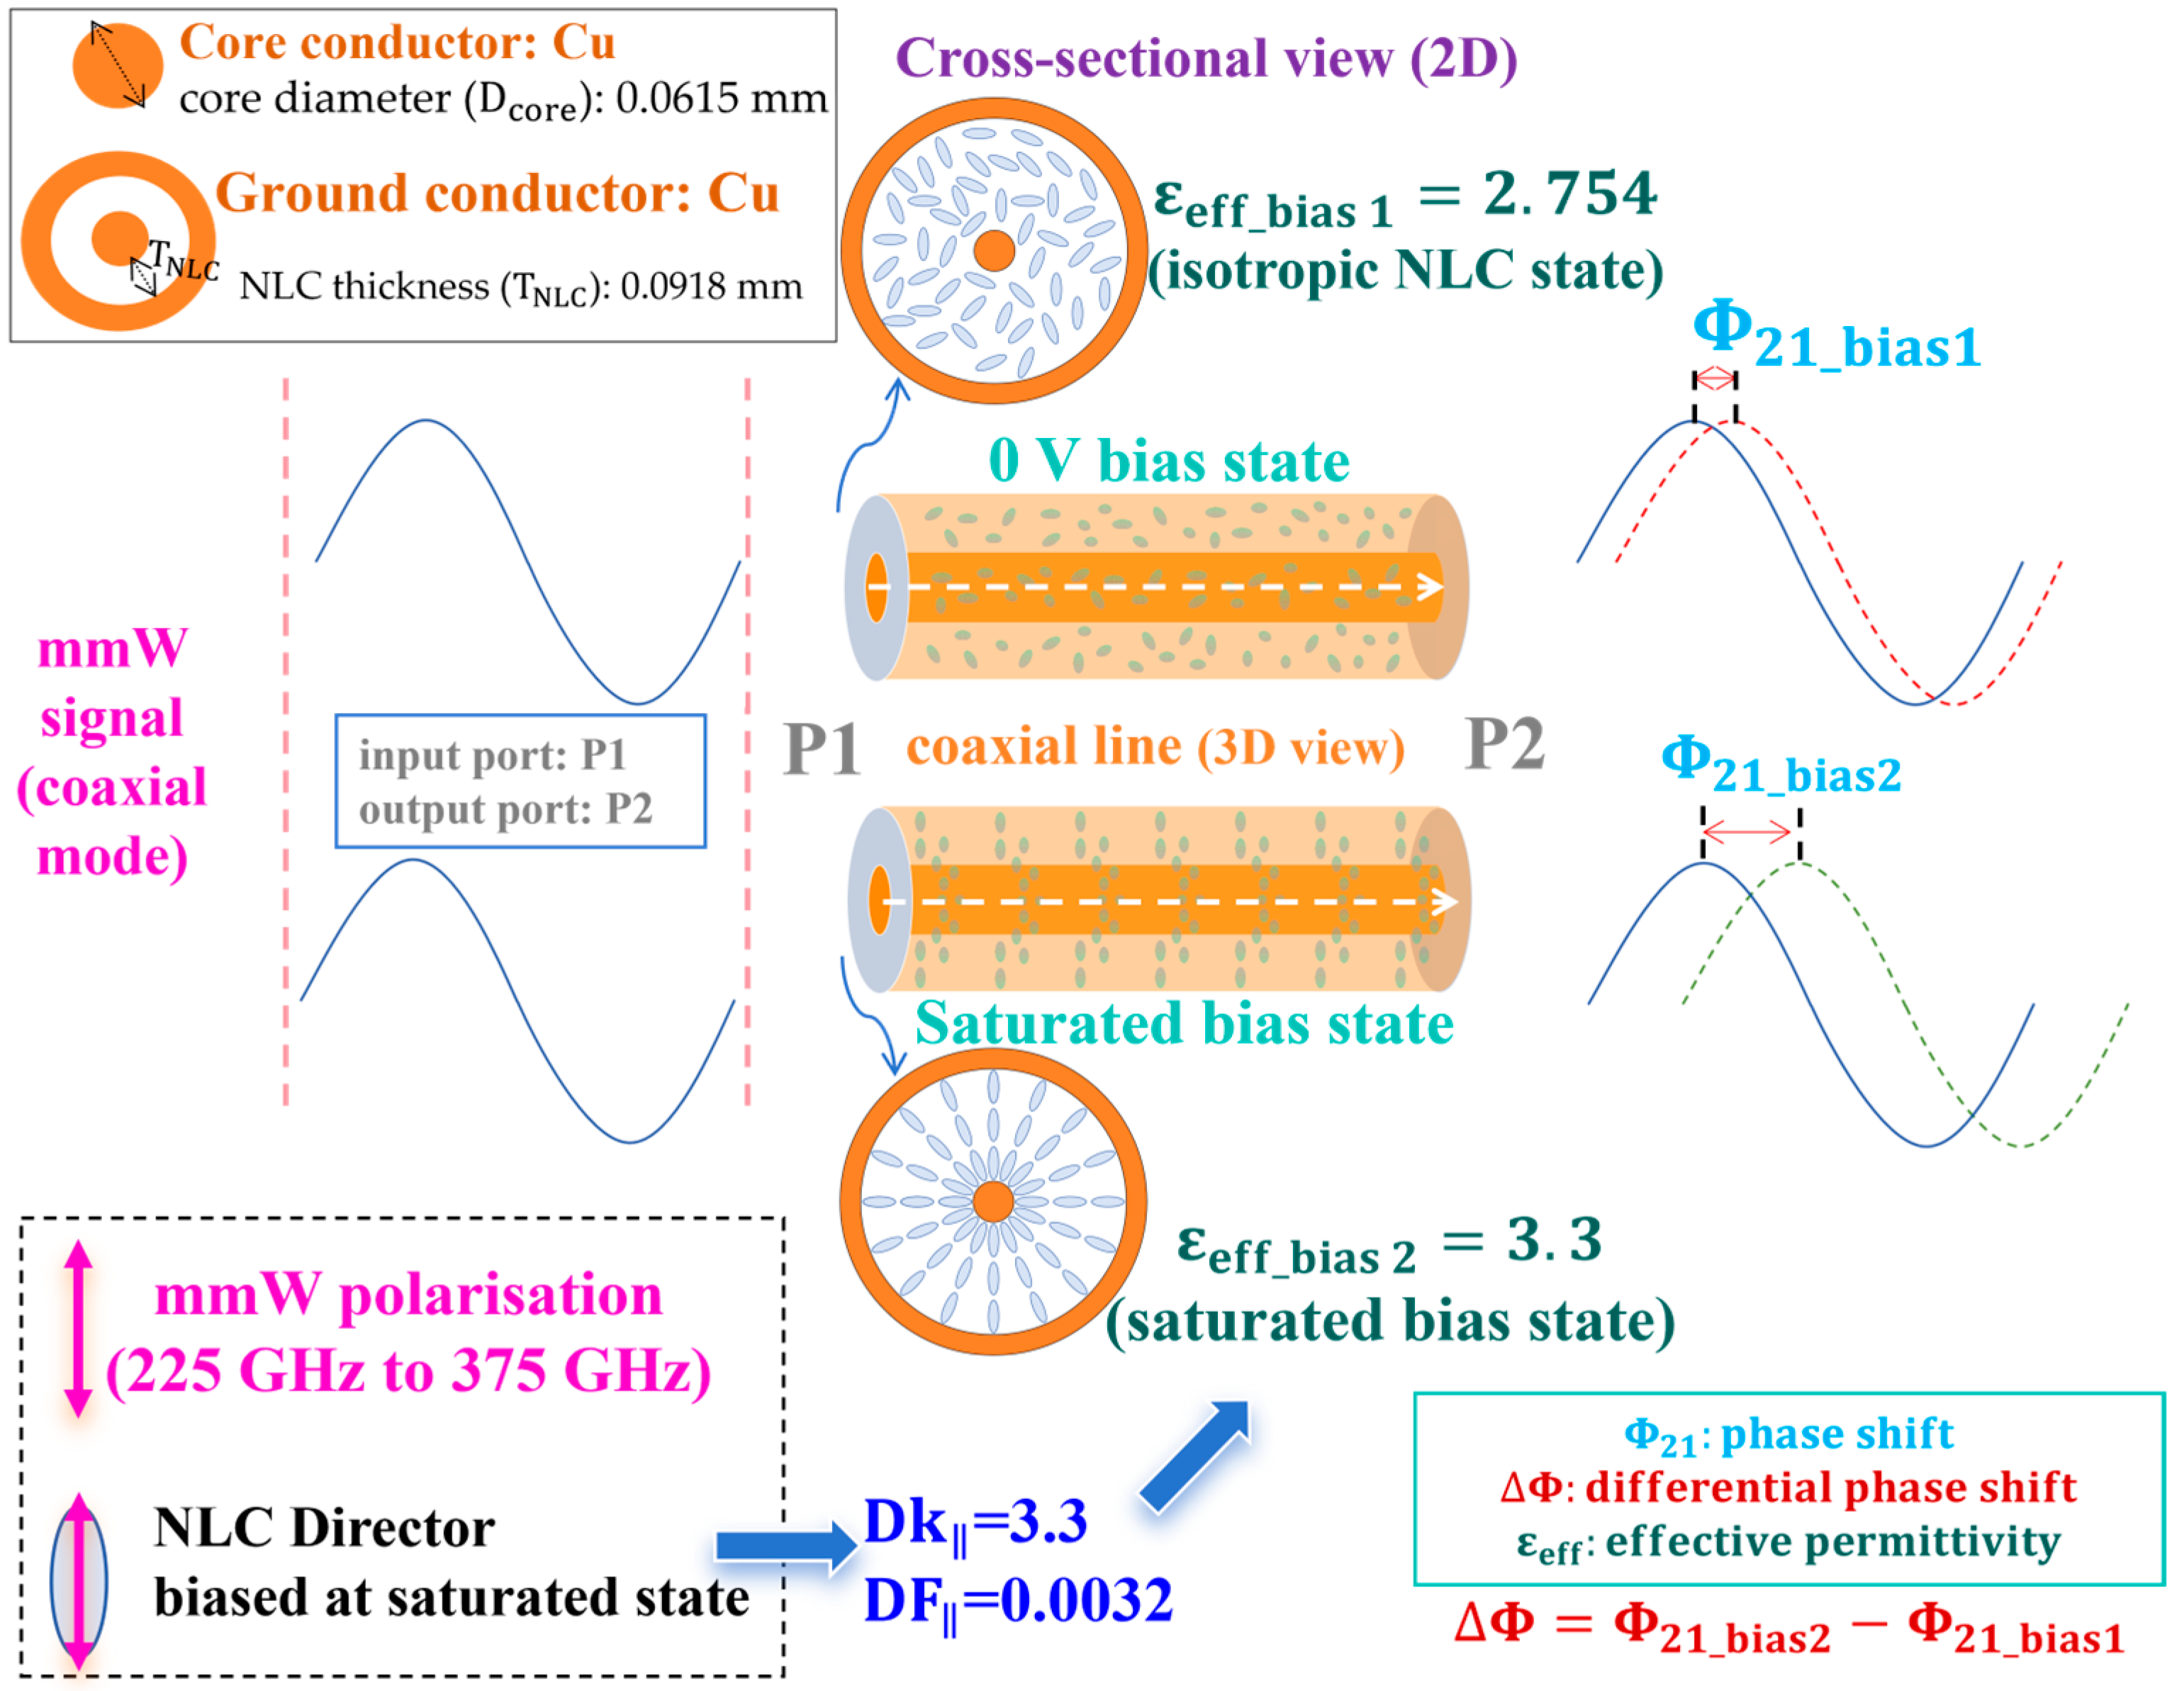
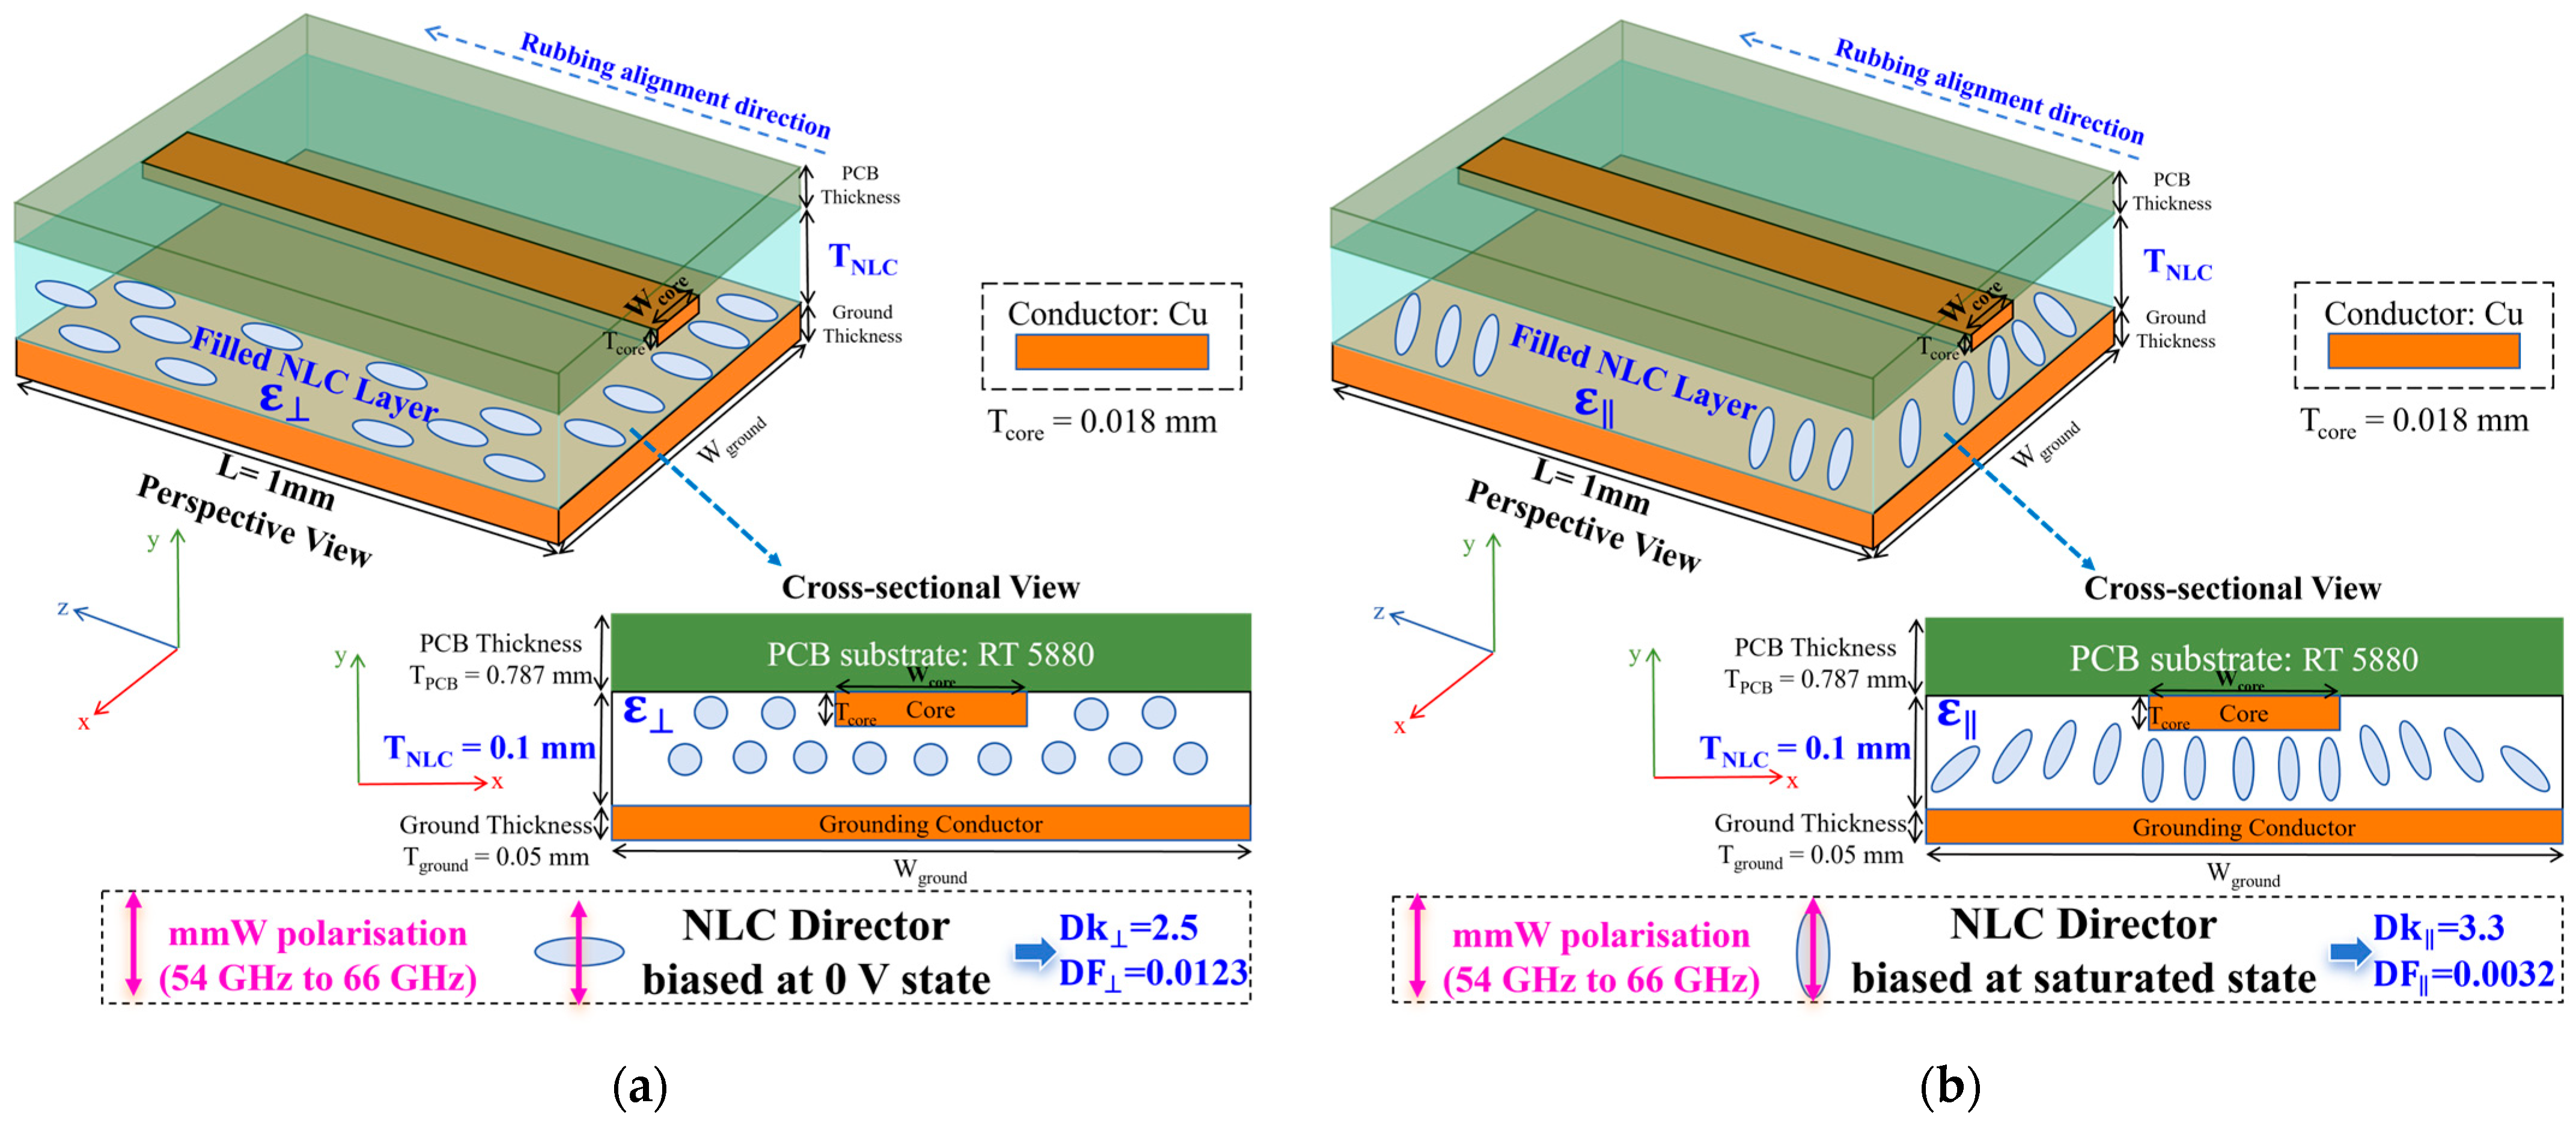
The NLC-filled transmission line phase shifter topologies utilised in this work are depicted schematically in
Figure 4,
Figure 5 and
Figure 6, highlighting the NLC-aligned states under 0 V bias and saturated bias, respectively. More specifically,
Figure 4 depicts the device’s structure for the vulnerable case 1 on an NLC-filled strip line phase shifter at 60 GHz (to be reported in
Section 3.1), as well as for the false-positive alert case 1 (to be reported later in
Section 5.1).
Figure 5 shows the device’s geometry for the vulnerable case 2 on an NLC-filled coaxial phase shifter at 300 GHz (to be examined in
Section 3.2).
Figure 6 sketches the cross-section and perspective view of the NLC-filled inverted microstrip line (IMSL) phase shifter investigated in the false-positive alert case 2 (to be reported later in
Section 5.2).
3. Vulnerability Case Study
Navigating the complex data landscape inherent in the performance evaluation of NLC-based phase shifters, we first identify the following vulnerable cases—which may lead to either overestimated performance predictions or overly conservative designs—and subsequently propose remedial strategies in the following section.
3.1. Vulnerable Case 1 on NLC Strip Line Phase Shifter at 60 GHz
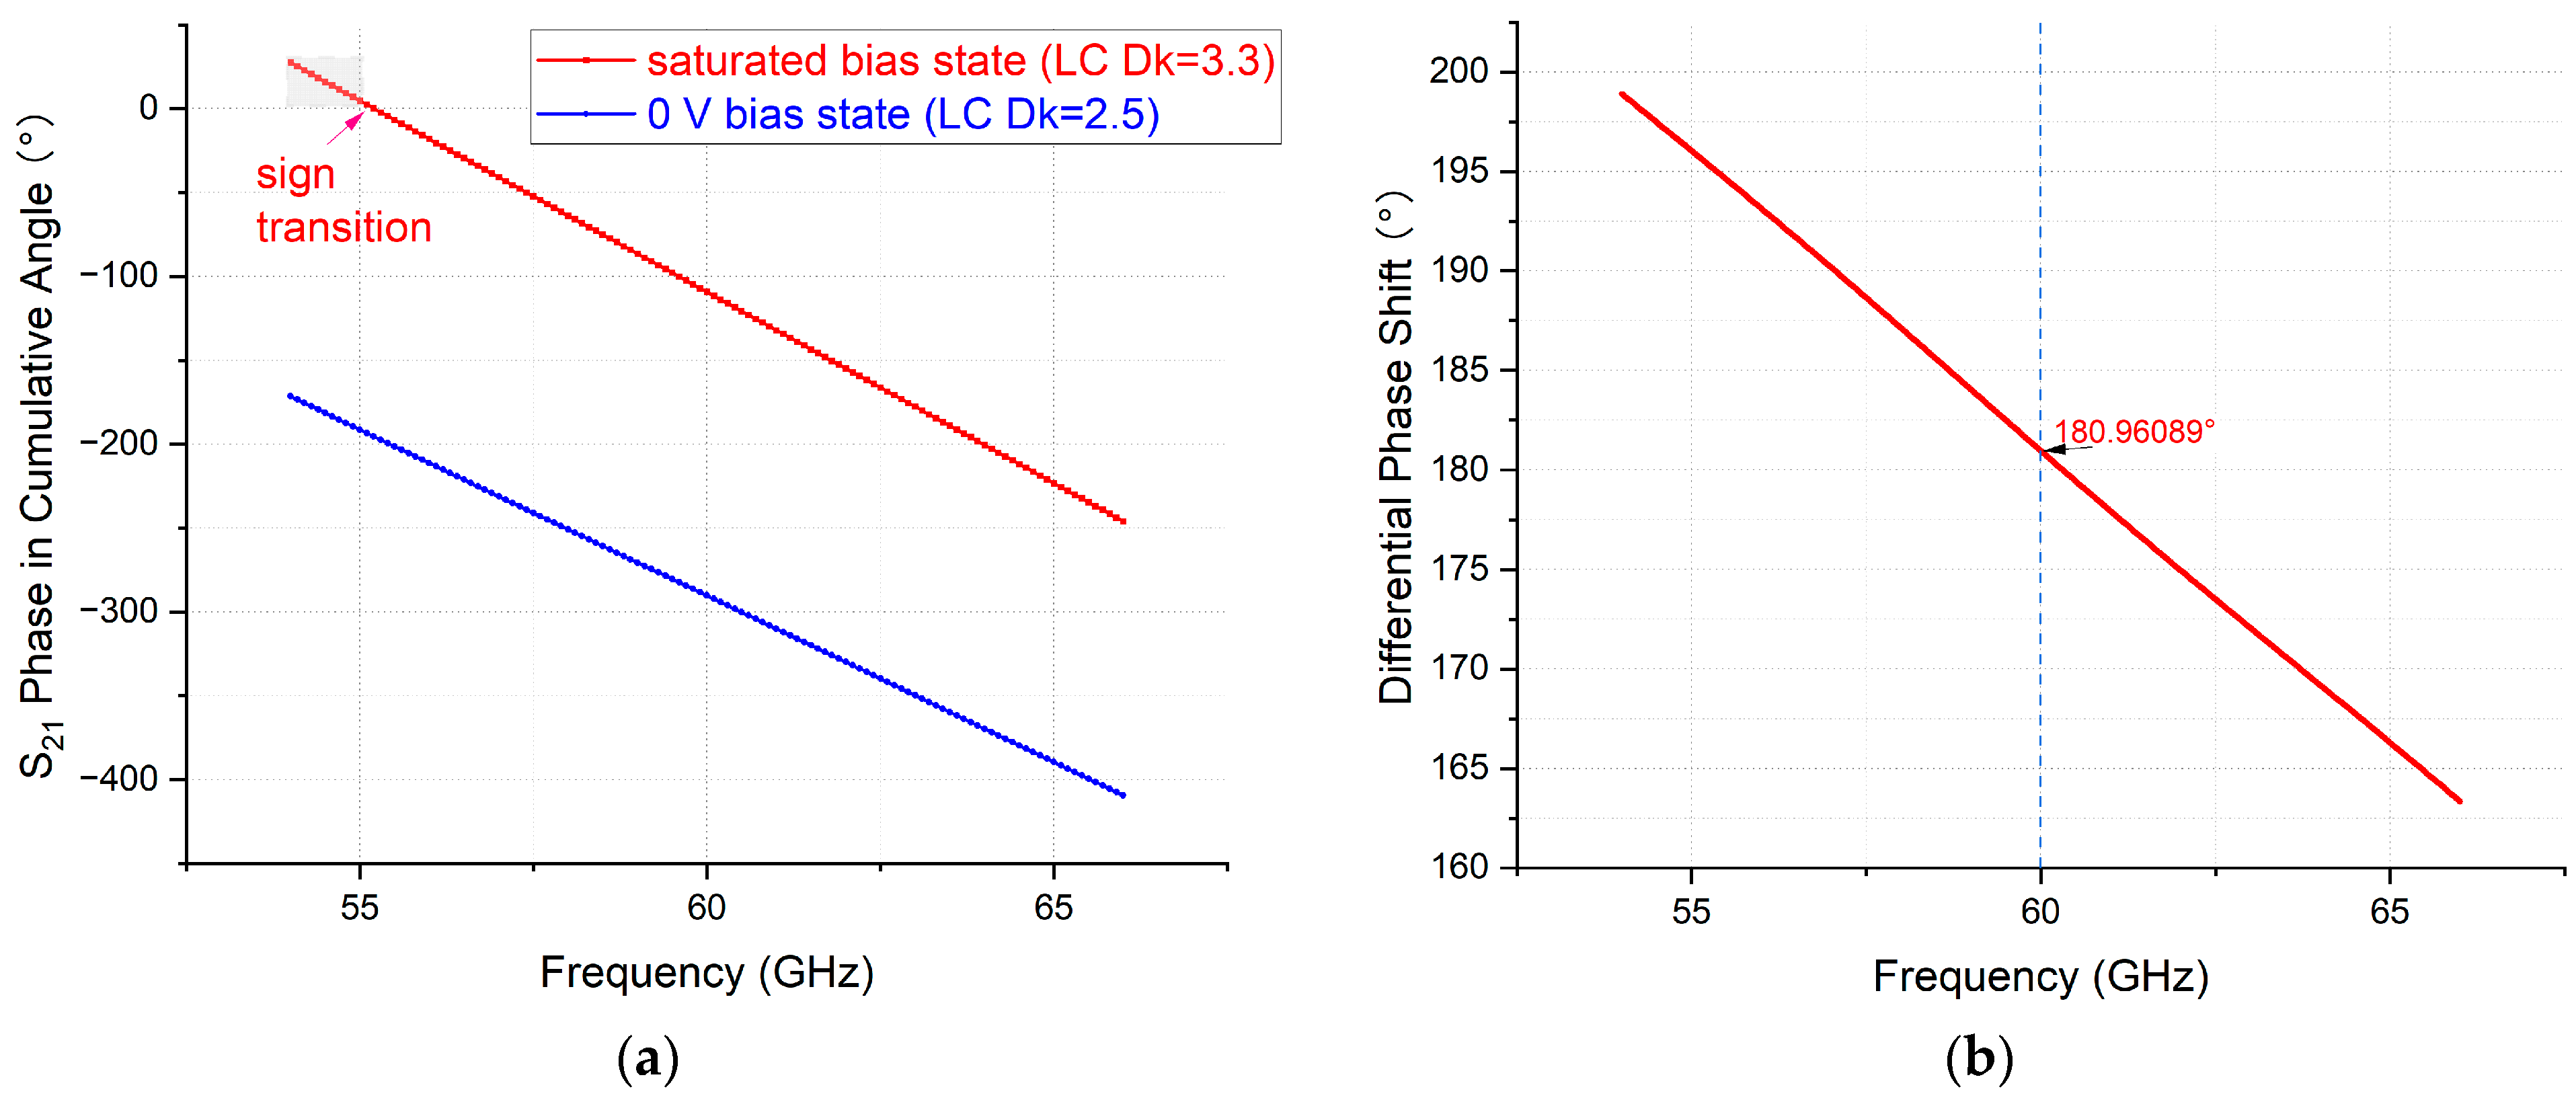
Figure 7a presents the cumulative angular (cang) phase results from 54 GHz to 66 GHz for an NLC-filled strip line phase shifter with a line length of 10.4 mm (geometry and material detailed in
Figure 4 shown earlier). The cross-sectional geometry was designed for 50 Ω impedance matching at the saturated tuning state of the NLC (Dk = 3.3, DF = 0.0032). The DPS corresponding to
as defined in Equation (2), was derived by directly subtracting the phase curves under reference bias (0 V) and saturated bias, as shown in
Figure 7b. The resulting DPS exhibits a declining trend over frequency, which contradicts the theoretical expectation from Equation (2) that DPS should increase monotonically with frequency.
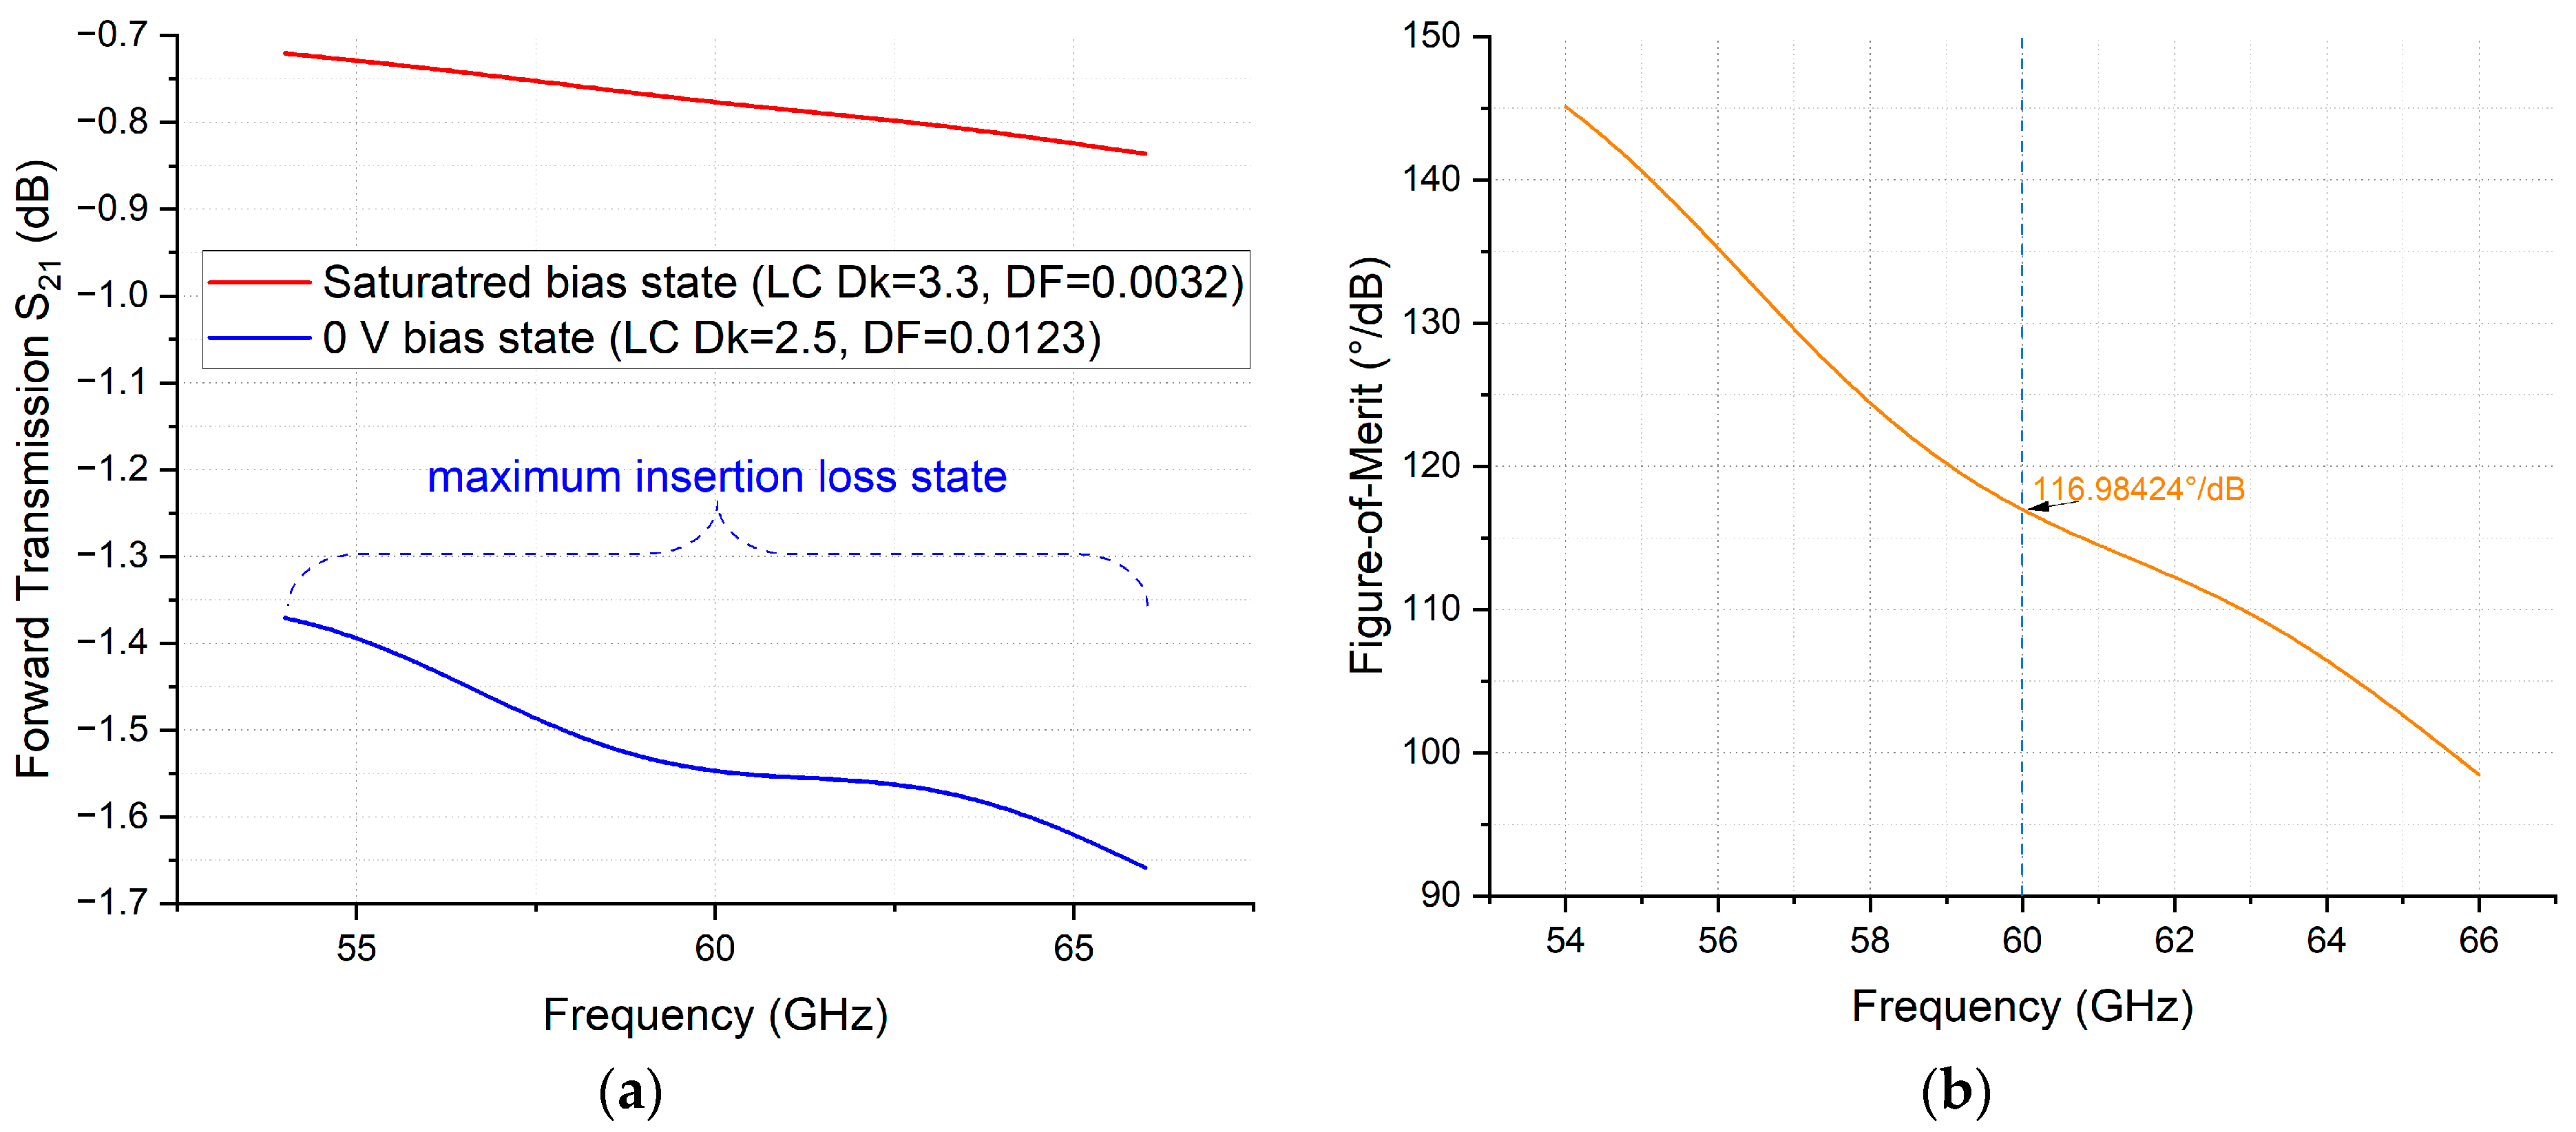
Based on the calculated maximally achievable DPS from
Figure 7b and the maximum insertion loss (IL) identified in
Figure 8a, the FoM—defined as the phase-shift-to-insertion-loss ratio according to Equation (3)—exhibits a declining trend with frequency, as shown in
Figure 8b. This decline has significant implications for device performance evaluation and decision-making in phase shifter design.
However, the observed descending trends in both DPS (
Figure 7b) and FoM (
Figure 8b) with respect to frequency are identified as artefacts resulting from flaws in the post-processing of the phase data. The mathematical origin of this susceptibility is illustrated graphically in
Figure 7a, where sign transitions in the cang phase output under saturated bias indicate improper phase unwrapping or differentiation. A proposed remediation strategy, addressing both the theoretical foundation and practical implementation of phase post-processing, is detailed in a later section.
3.2. Vulnerable Case 2 on NLC Coaxial Phase Shifter at 300 GHz
In this vulnerable case, the phase shifter employs a coaxially symmetric topology (
Figure 5) designed for operation at 300 GHz. As proposed and studied in our previous work [
6], this structure omits polyimide (PI) rubbing and pre-alignment, meaning that the NLC remains in an isotropic state at the 0 V reference bias, exhibiting a relative permittivity (Dk) of 2.754 as characterised in [
6]. For cross-benchmarking, two existing design approaches for the coaxial cross-section are evaluated.
The first design achieves 50 Ω impedance matching at the 0 V bias state (NLC Dk = 2.754), while suppressing TE
11 mode propagation below 375 GHz. Using the theoretical analysis method outlined above, the resulting geometric parameters are an NLC thickness (
) of 0.0918 mm and a core conductor diameter (
) of 0.0615 mm. The second design achieves 50 Ω matching at the saturated bias state (NLC Dk = 3.3), also suppressing TE
11 mode below 375 GHz. The corresponding dimensions for this configuration are
= 0.0895 mm and
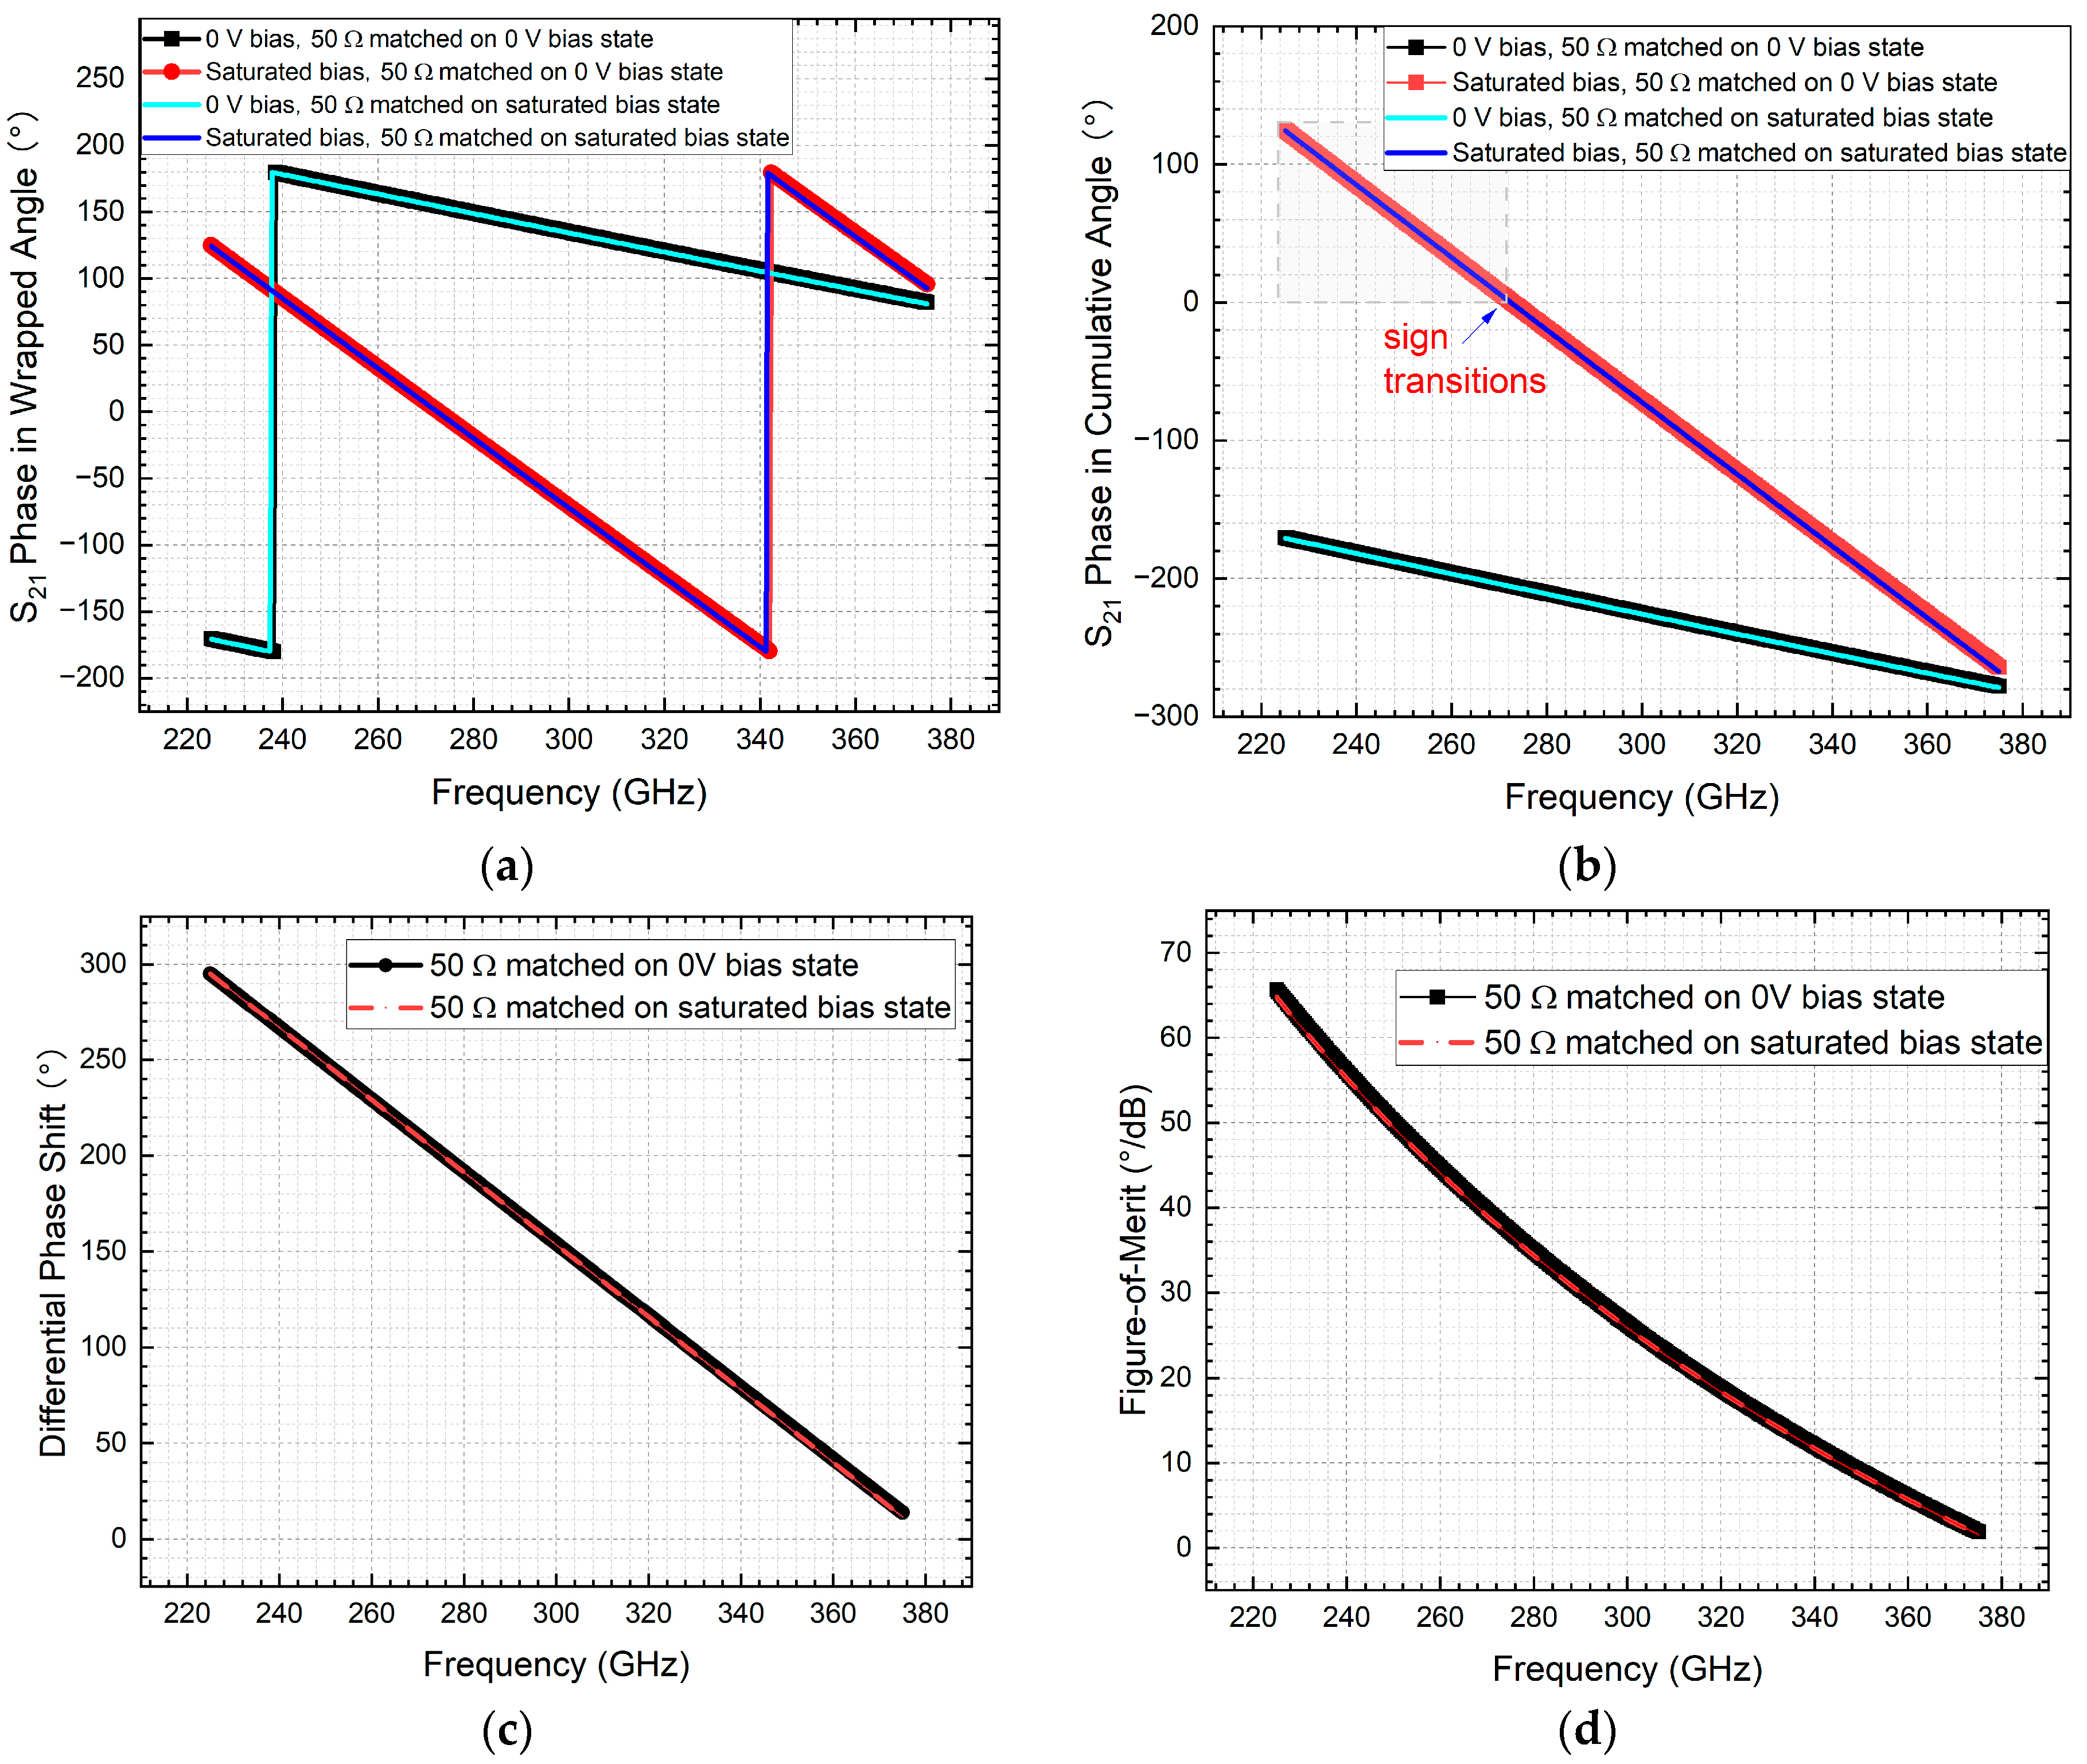
= 0.0505 mm. As evidenced by the nearly overlapping curves in
Figure 9a, the performance difference between the two designs is negligible. However, the derived frequency responses of both the DPS and FoM are flawed due to incorrect data processing of sign transitions in the cang phase pattern, as clearly demonstrated in
Figure 9b. The remediation strategy for addressing this issue, along with corrected results, are presented in the following section.
4. Re-Calibrations for Addressing Vulnerabilities
To address the errors inadvertently introduced in the two aforementioned vulnerable cases, corrective measures are proposed to realign the analysis with accurate results. The following sections present the remediated outcomes for Case 1 and Case 2, respectively.
4.1. Post-Processing Strategy and Results of Re-Calibrated Case 1
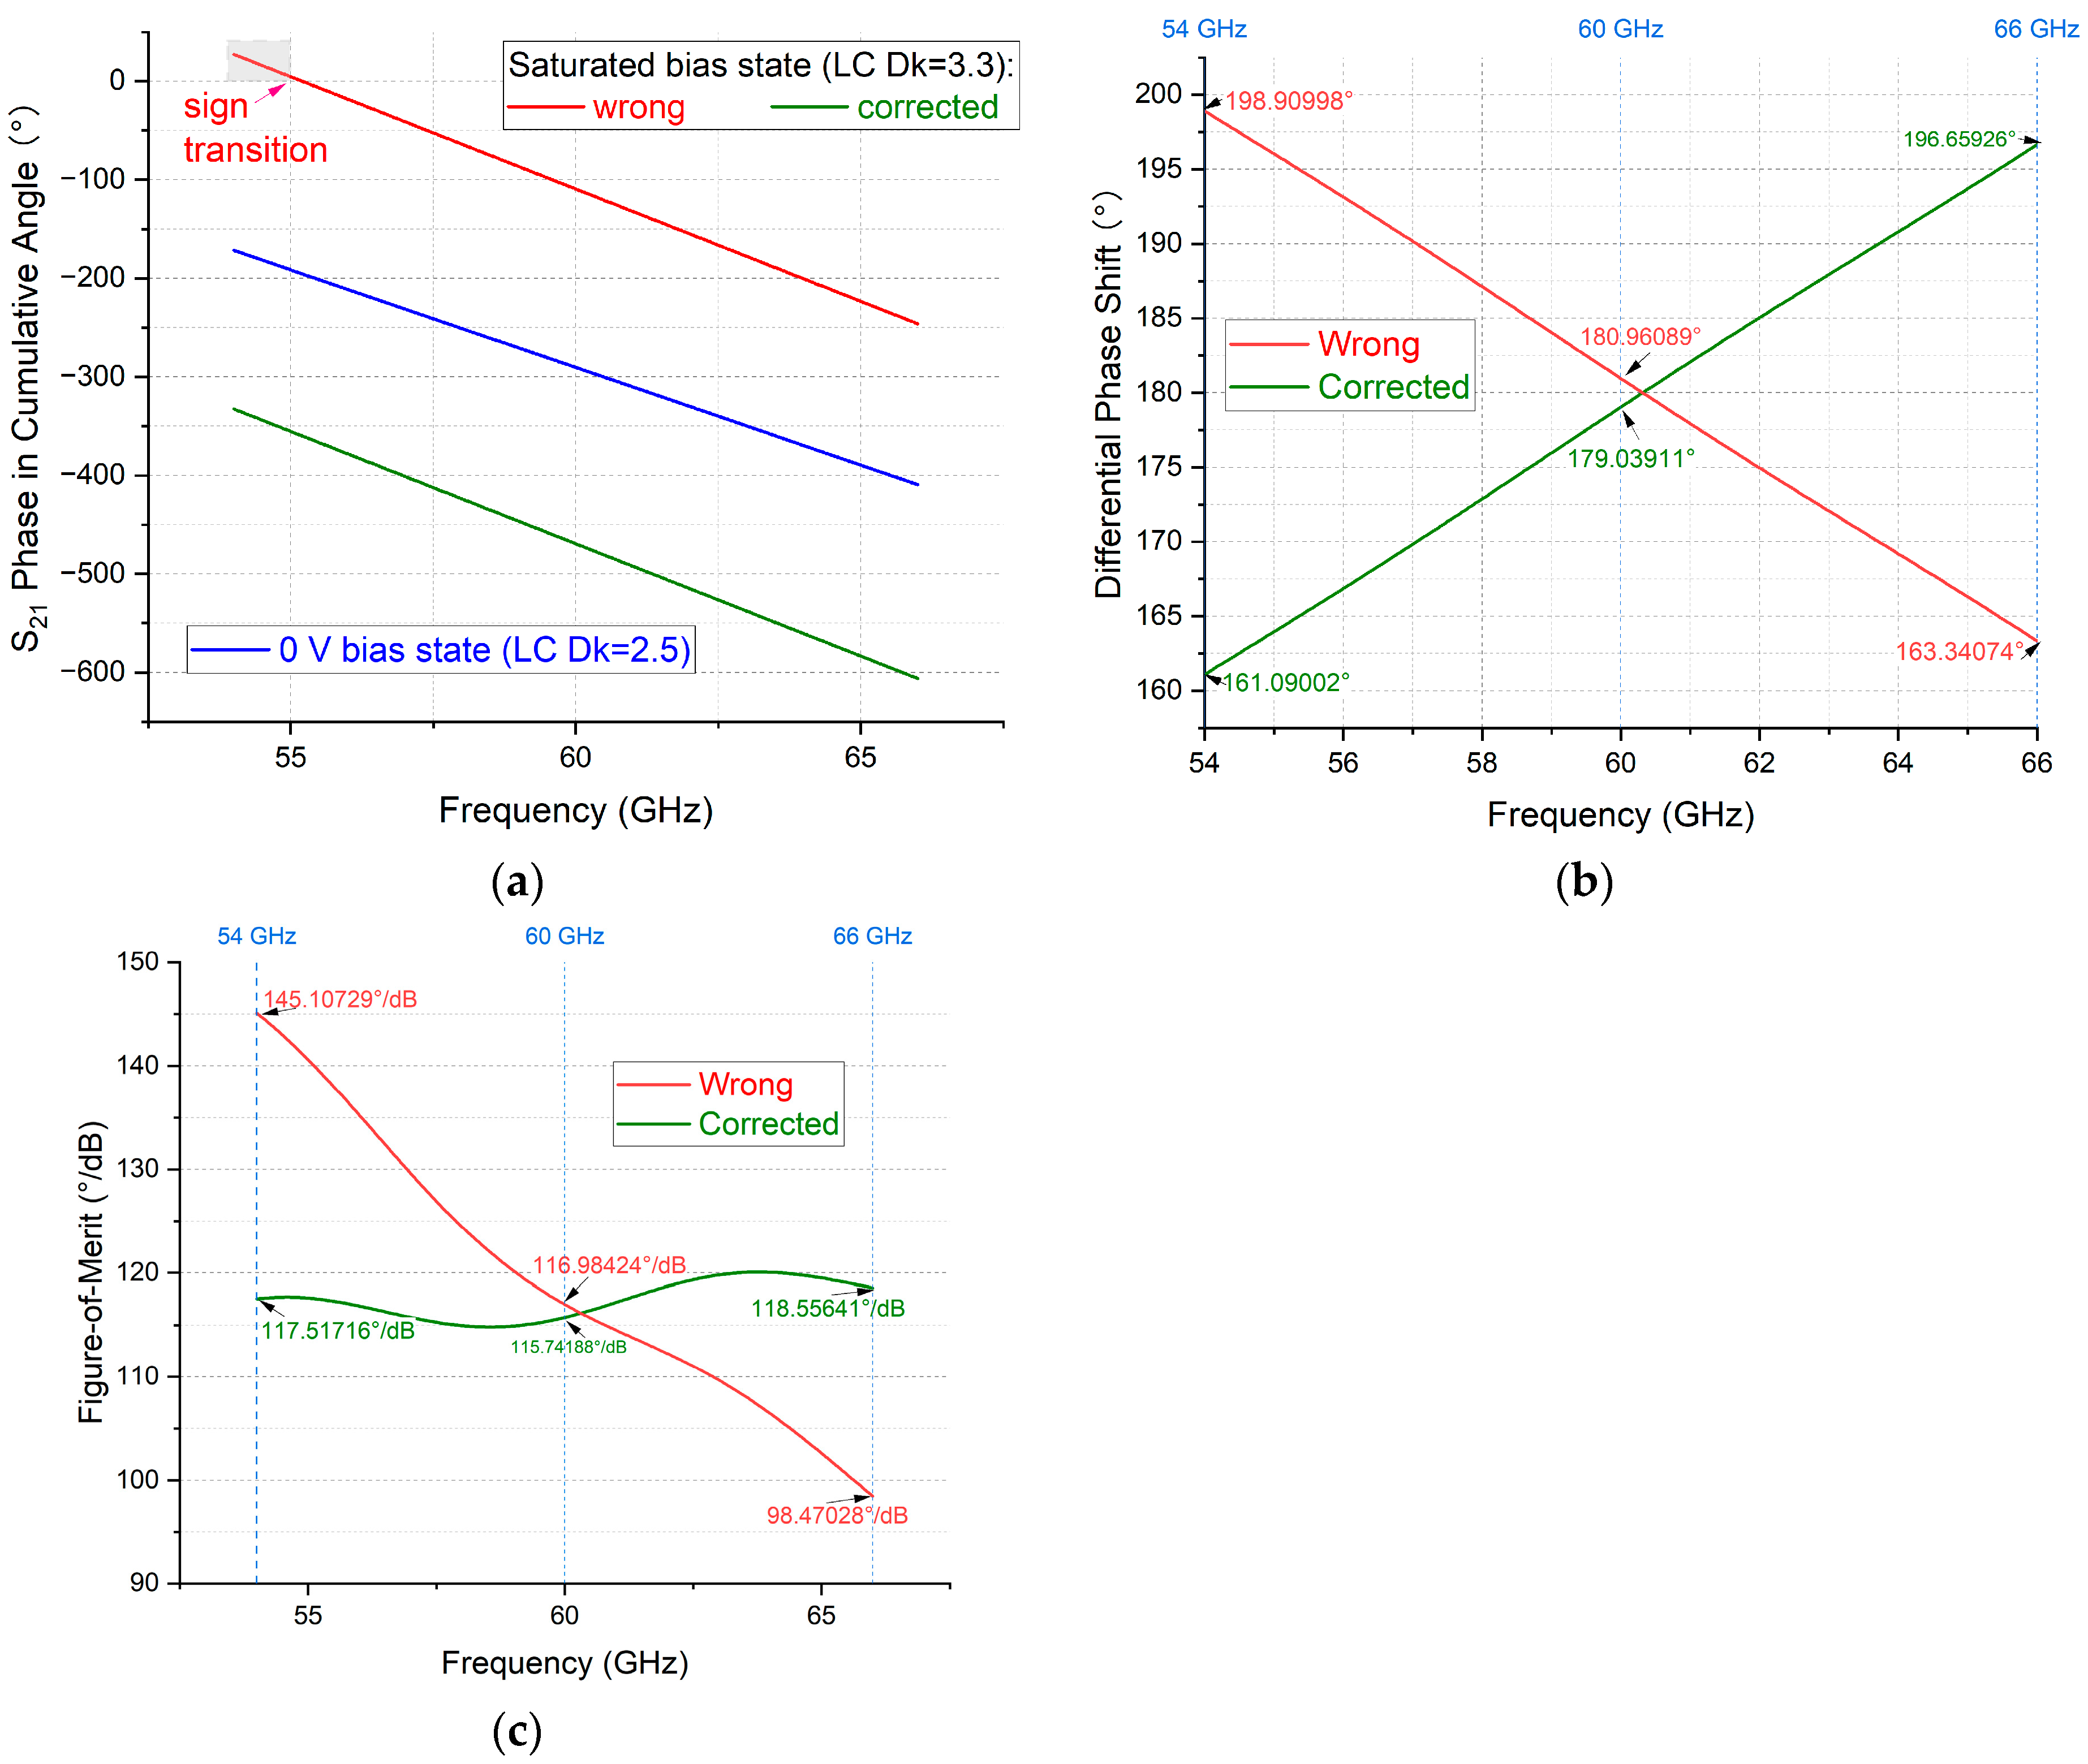
To correctly address the sign transition in the cang phase output pattern observed under the saturated biasing state in Vulnerable Case 1 (the NLC-filled strip line phase shifter), a phase correction strategy is implemented. As illustrated in
Figure 10a, the raw phase data for the saturated state (red curve) exhibits discontinuities due to periodic wrapping at ±180°. To mitigate this, a deduction of 360° is applied to the red curve segments where unwrapping artefacts occur, resulting in the adjusted green curve. This adjustment ensures continuity in the phase progression across the frequency spectrum. The corrected green curve now accurately represents the unwrapped phase response under saturated bias. The DPS is then computed by measuring the difference between this adjusted green curve (saturated state) and the blue curve (0 V reference bias state) at each frequency point. This method yields the maximally achievable DPS, which is critical for evaluating phase shifter performance without artefacts introduced by phase wrapping.
Interestingly, at 60 GHz, a seemingly minor discrepancy of 1.92178° between the faulty and corrected DPS values leads to fundamentally different frequency responses in performance evaluation. This highlights the critical sensitivity of the FoM and its frequency response to sign transitions in cang phase of post-processing. As evidenced in
Figure 10c, the erroneous processing method paints a pessimistic picture of the NLC strip line phase shifter’s performance above 54 GHz, suggesting significant degradation. In contrast, the corrected data reveals a stable FoM across 54–66 GHz, affirming the device’s robustness for high-frequency applications like 5G/6G beamforming.
4.2. Post-Processing Strategy and Results of Re-Calibrated Case 2
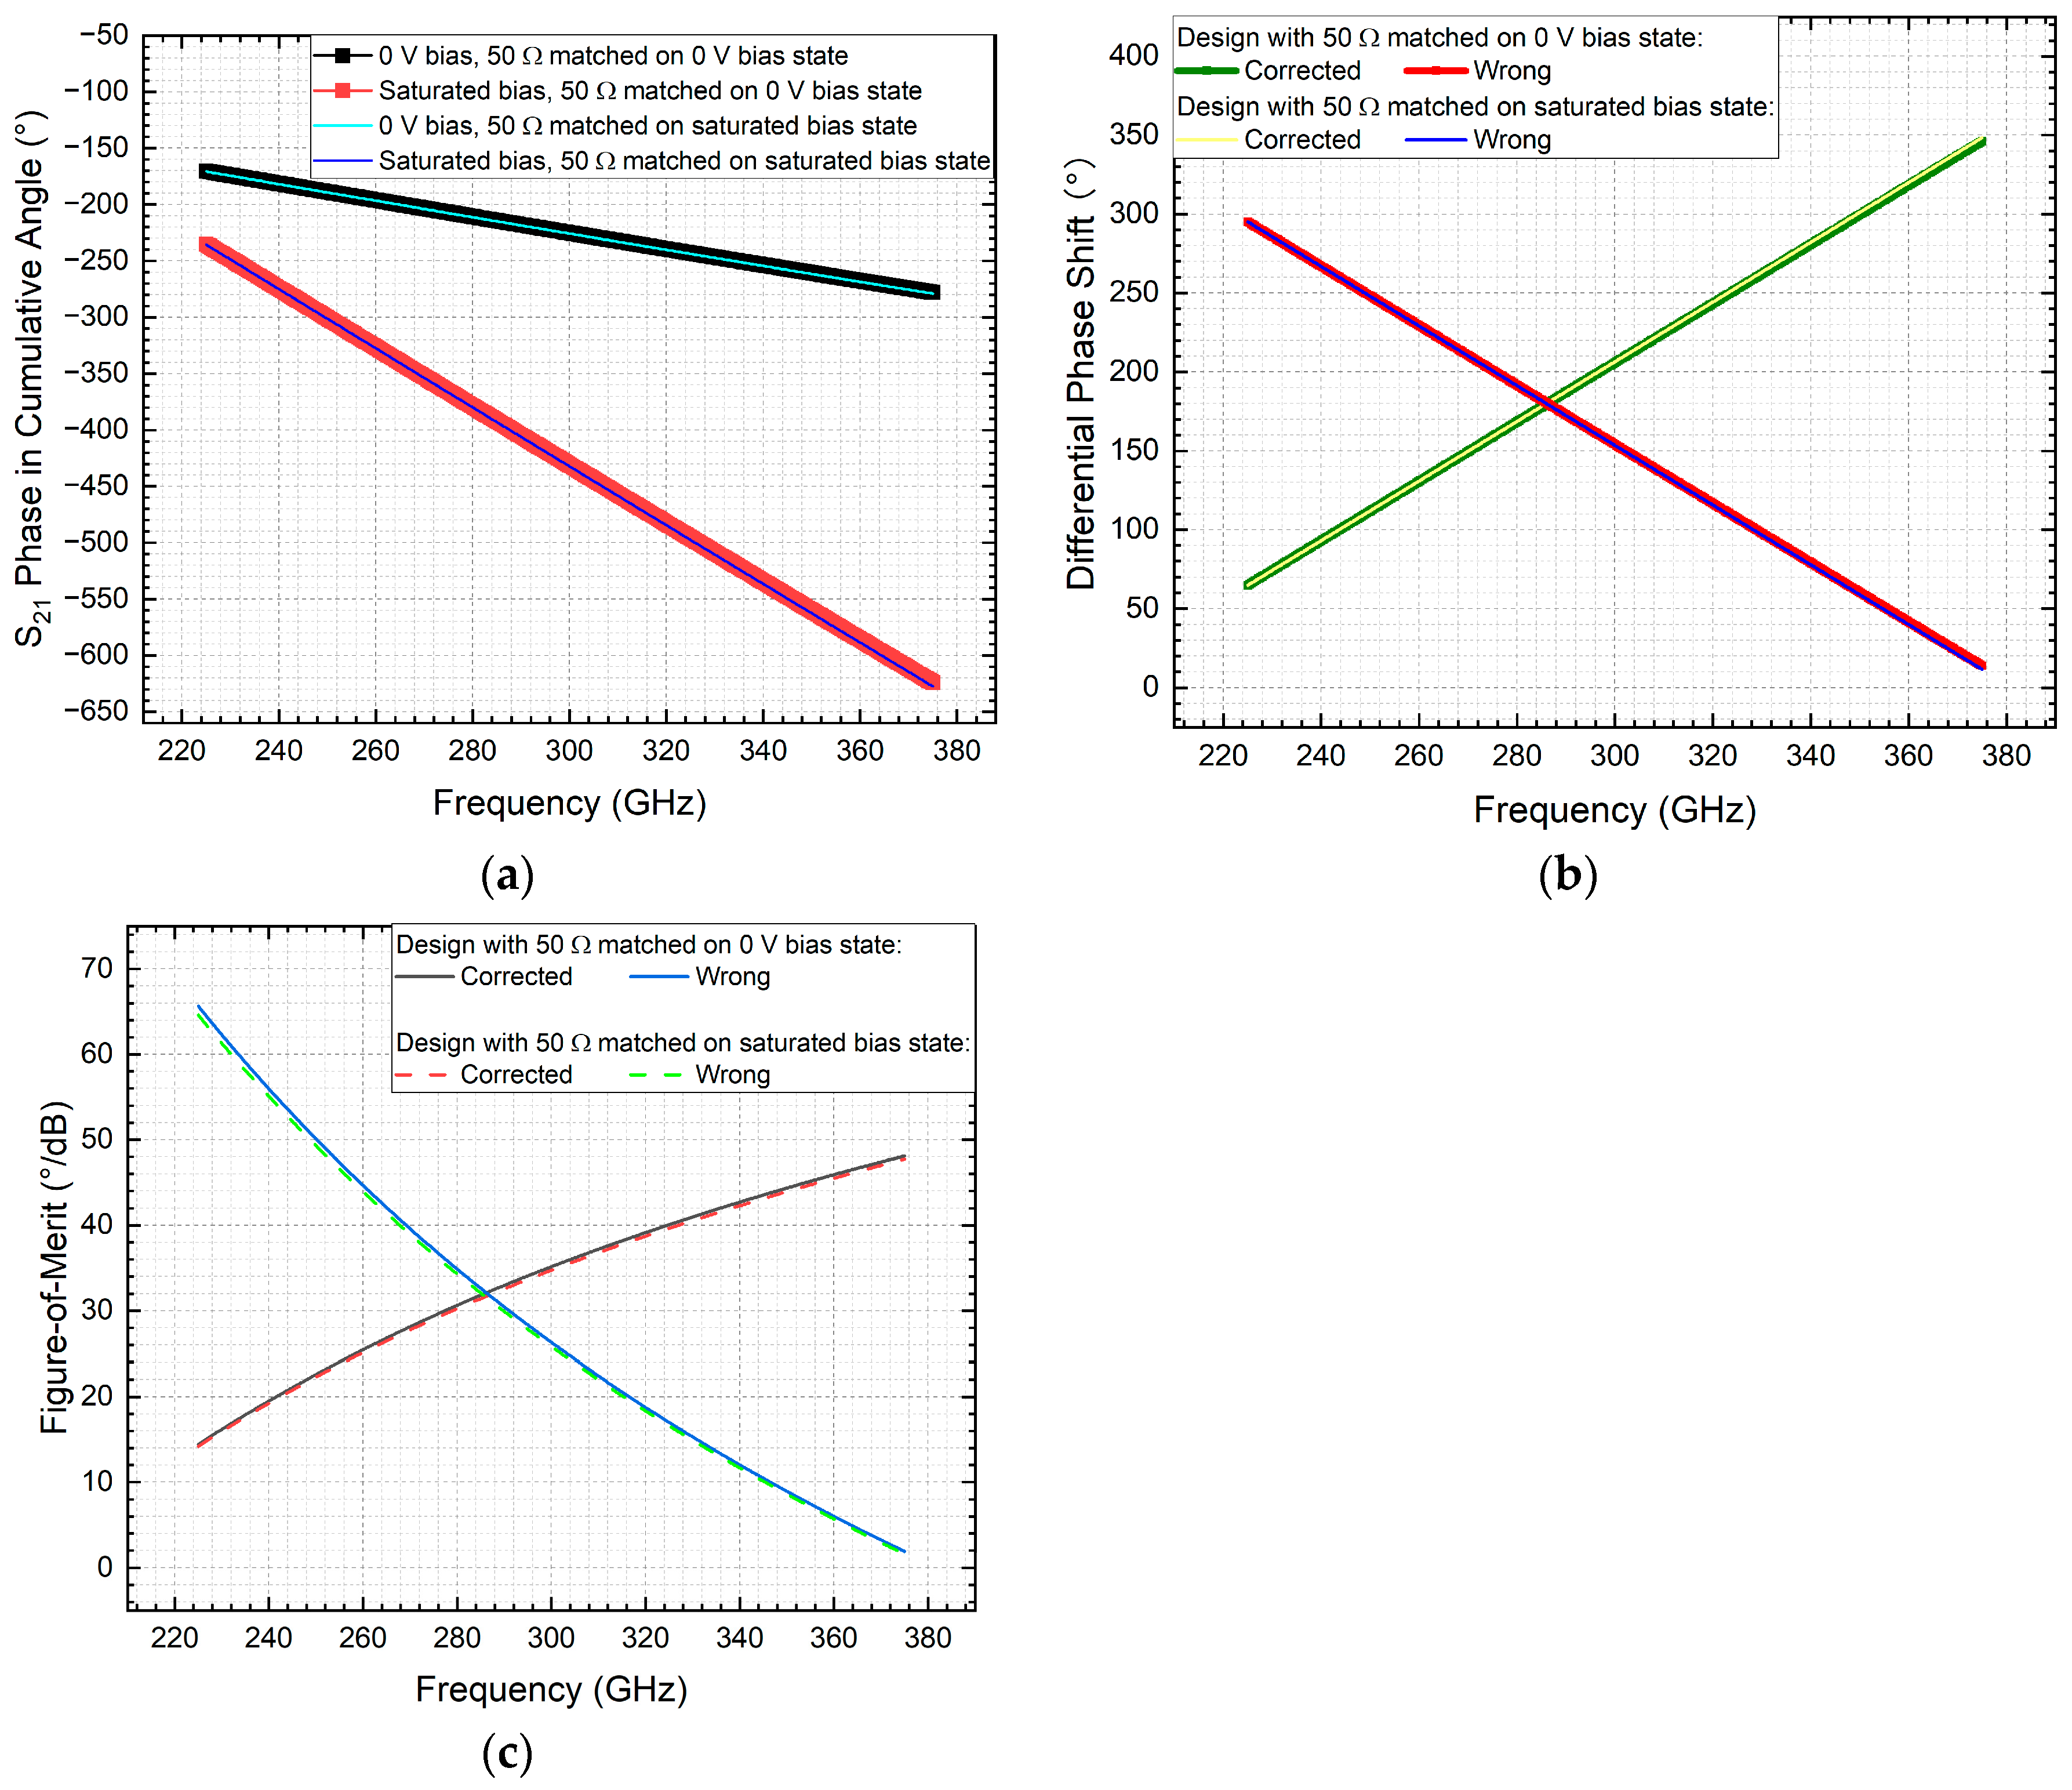
Similarly, the sign-transition vulnerability identified in Vulnerable Case 2 (the NLC-filled coaxial phase shifter) was addressed using a comparable phase correction approach. The corrected cang phase results are presented in
Figure 11a, while
Figure 11b,c compare the derived DPS and FoM against the previously flawed results. These comparisons reveal dramatically different frequency responses across the 225–375 GHz band. The erroneous post-processing method suggested a pessimistic performance degradation for both DPS and FoM with increasing frequency. In contrast, the corrected data demonstrates a promising increase in FoM with frequency. Although the absolute FoM level remains significantly lower than that observed in the corrected 60 GHz strip line case, this outcome highlights substantial optimisation potential for NLC-based coaxial phase shifters operating in the sub-mmW (THz) range.
In summary, the remediation of the two vulnerable cases demonstrates a clear pathway toward accurate phase characterisation—specifically through the correction of sign-transition artefacts—enabling reliable device evaluation and informed decision-making in high-frequency design. Nevertheless, exceptions to this approach do arise, as illustrated by the false-positive cases discussed in the following section.
5. False-Positive Cases That Survive the Vulnerabilities
Interestingly, two cases were observed to be resistant to the proposed vulnerability analysis framework. These survival cases highlight the incompleteness of current theoretical models in predicting all DPS anomalies. Researchers should exercise caution when encountering such outliers, as they indicate that existing sign-transition remediation strategies may not be universally applicable. This underscores the need for further refinement of both phase-processing techniques and theoretical foundations to achieve comprehensive predictive reliability.
5.1. False-Positive Alert Case 1
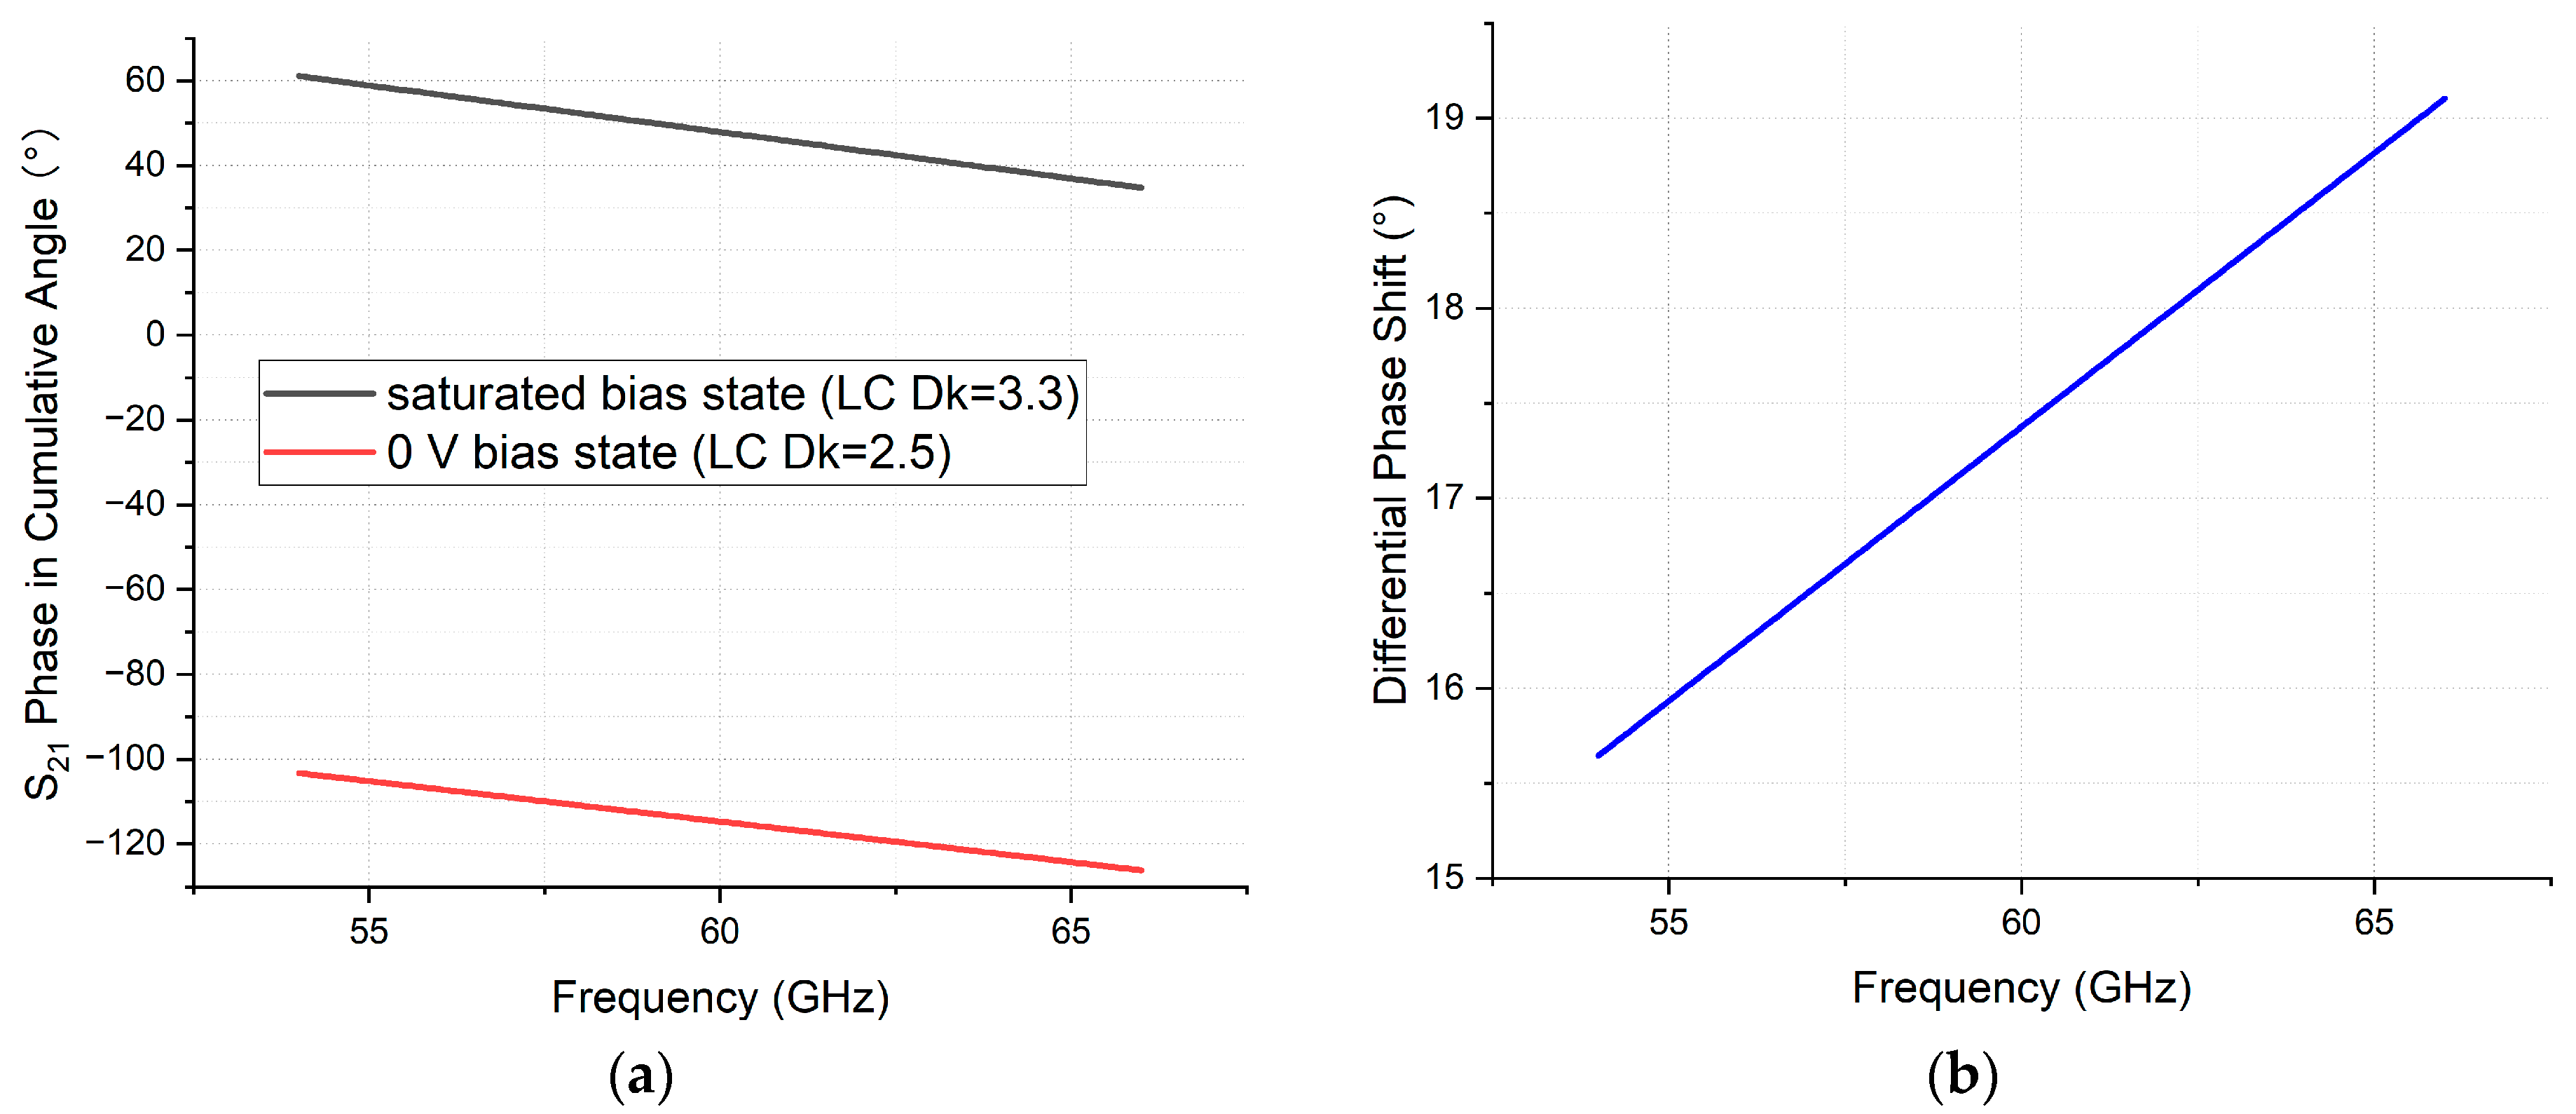
Caution is warranted in the following false-positive case, identified during further investigation of an NLC-filled strip line phase shifter with a reduced length of 1 mm—distinct from the 10.4 mm structure (
Figure 4) examined in Vulnerable Case 1. As shown in
Figure 12a, the likelihood of phase sign change diminishes across the 60 GHz spectrum in this shortened design. The cross-sectional geometry remains identical to that of Vulnerable Case 1, having been designed for 50 Ω impedance matching at the NLC’s saturated tuning state (Dk = 3.3), with the sole variation being the reduced axial line length.
In summary, Survival Case 1 exhibits a fully positive cang phase profile under one NLC tuning state and a fully negative profile under the other. In this scenario, the direct subtraction of the two cang curves functions correctly and yields a valid DPS. This case not only partially supports the initial conclusions of the vulnerability study—which highlighted risks associated with cang sign transitions—but also complements the understanding of the cang behaviour in fully positive scenarios. Inspired by this exception, a follow-on study investigating line-length-dependent vulnerability statistics is conducted. The occurrence rate of DPS misinterpretation across varying lengths is systematically analysed and reported in the next chapter.
5.2. False-Positive Alert Case 2
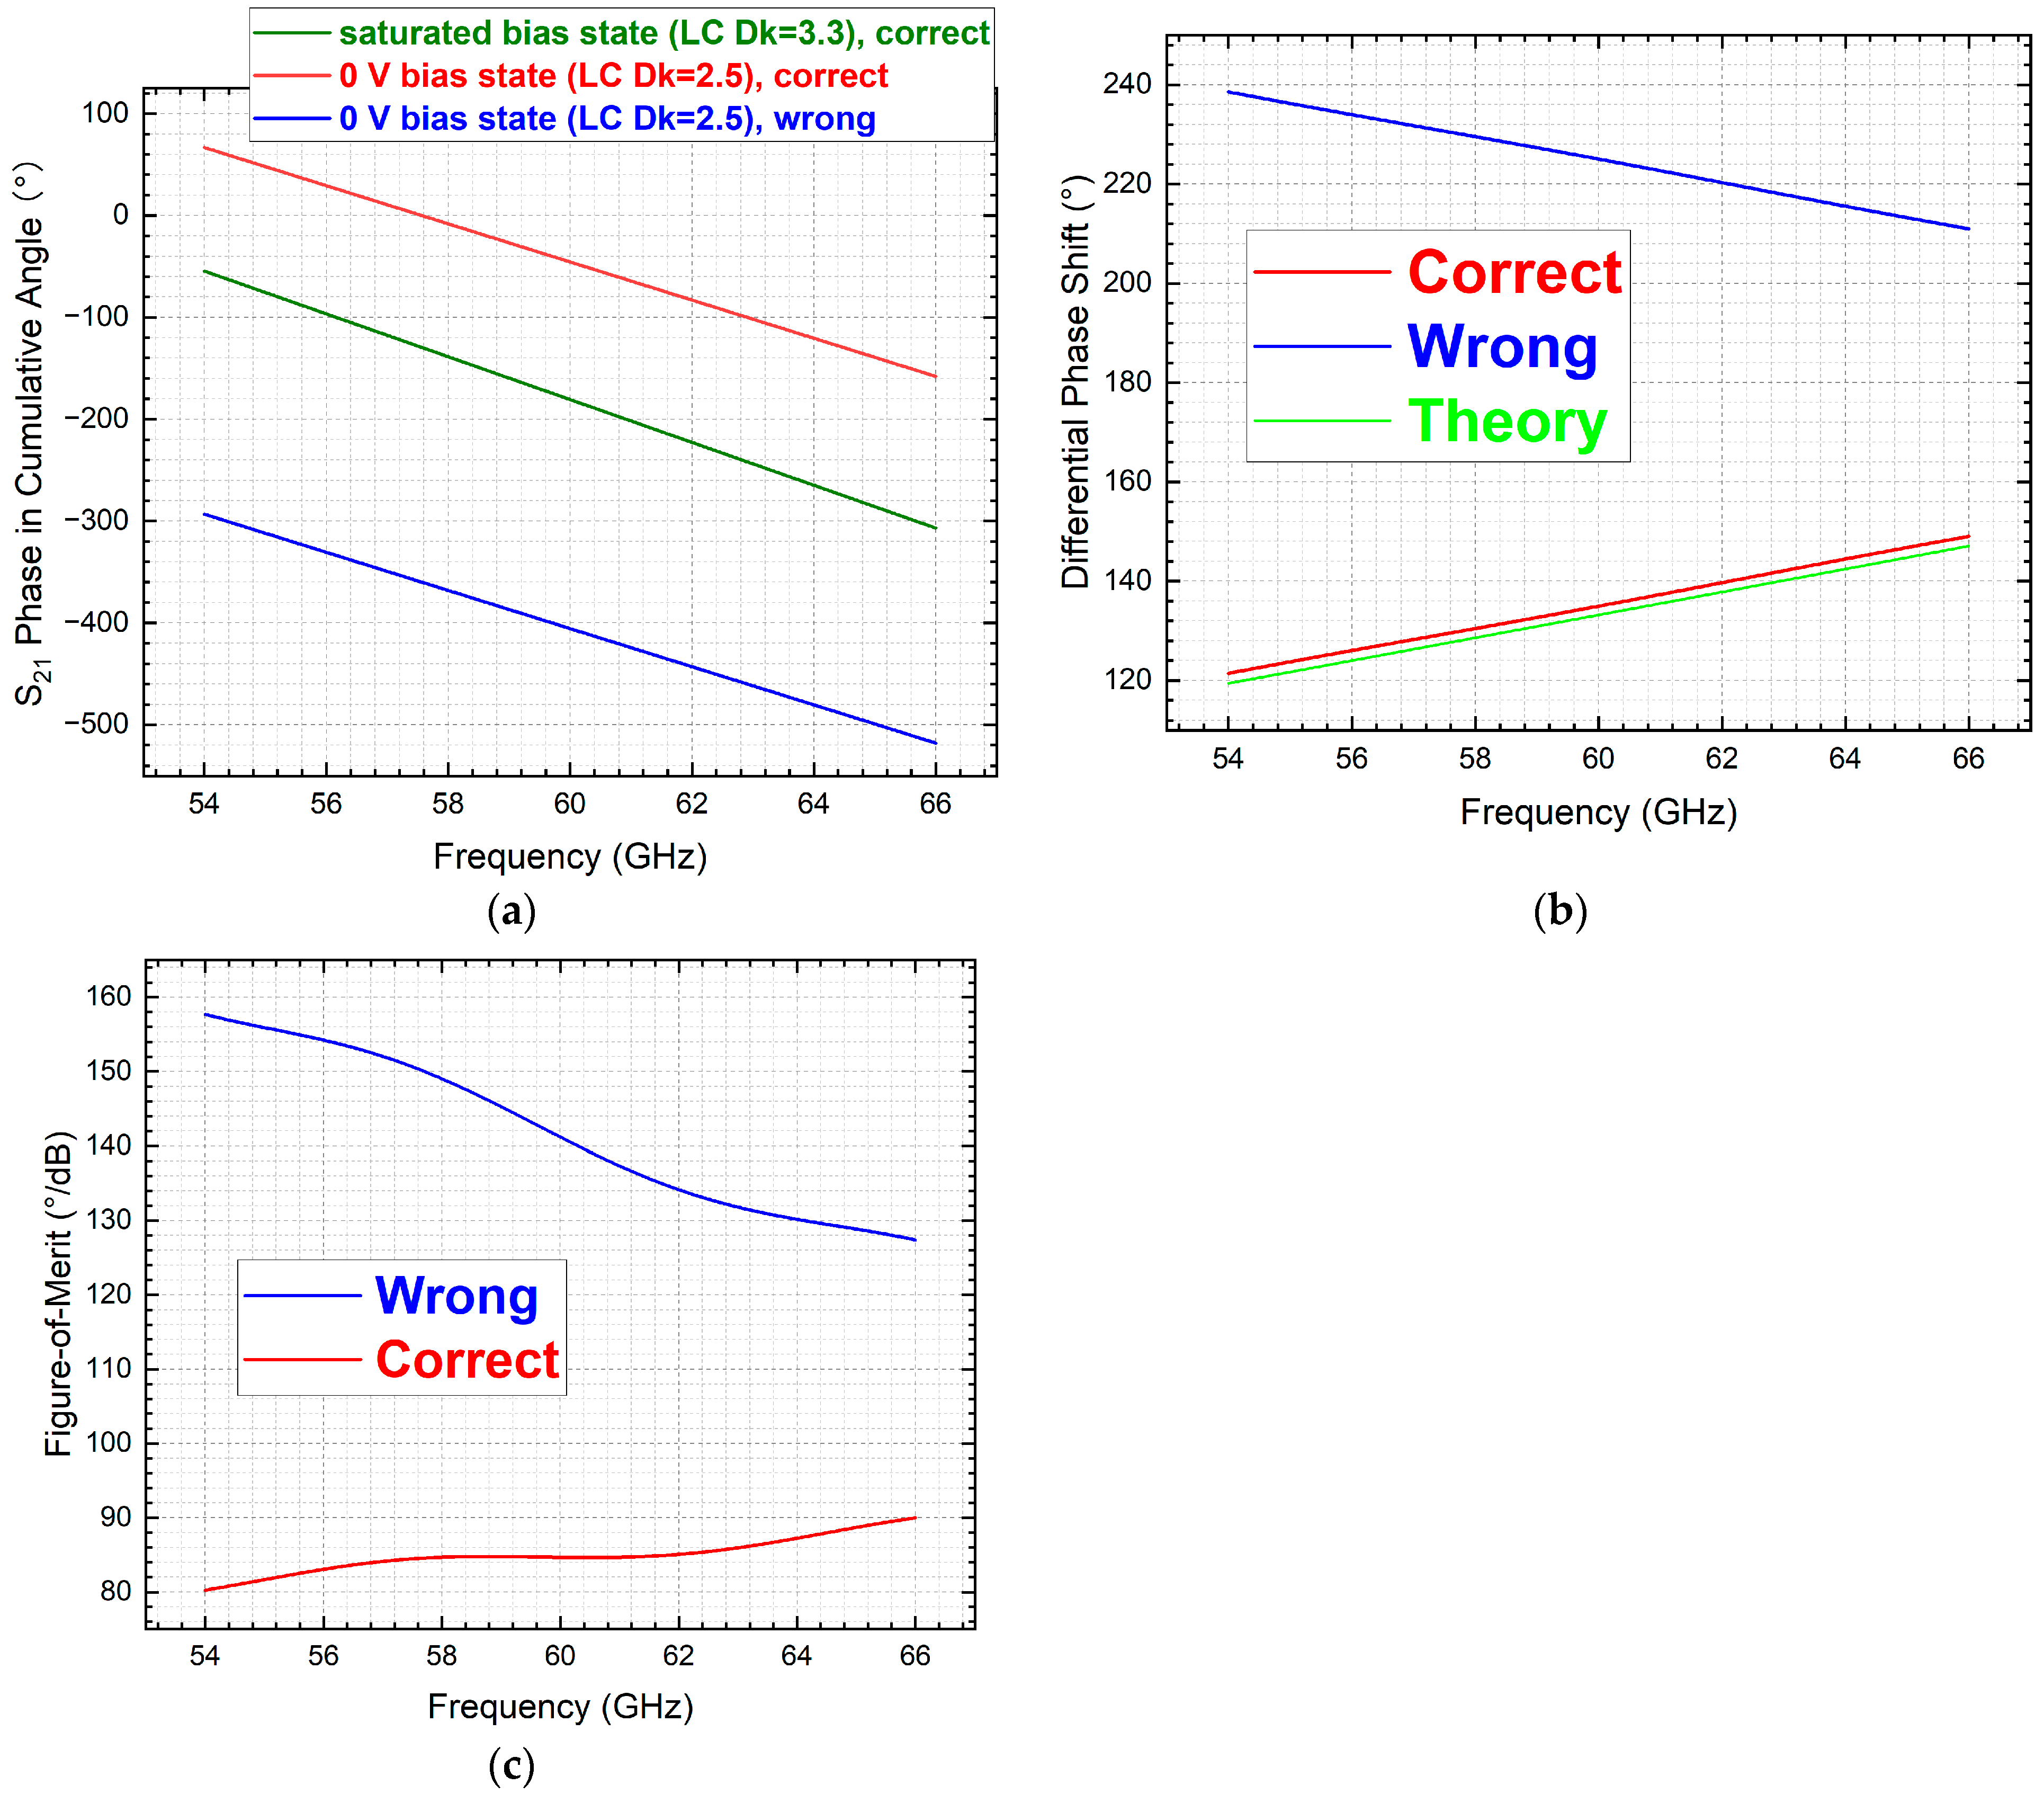
In some instances, excessive data processing can lead to erroneous interpretations—such as underestimation of the DPS—necessitating heightened caution even in cases that initially appear immune to such vulnerabilities. This is exemplified in the following survival case, which employs an inverted microstrip line (IMSL) phase shifter (
Figure 6) filled with the same type of NLC. Given that the IMSL structure is not fully enclosed, an airbox [
40] is incorporated into the full-wave simulation environment, and the results were renormalised to a 50 Ω reference impedance, as shown in
Figure 13. Although the phase data in
Figure 13a is processed using the seemingly correct methodology—converting the sign-transitioned curve (red) into a fully negative profile (blue) via 360° deduction—this approach ultimately produced unphysical results. As evidenced in
Figure 13b,c, both DPS and FoM decrease with frequency, contradicting the expected theoretical behaviours and highlighting the risks of over-processing even in topologies less prone to artefacts.
From these findings, we explicitly conclude that the correct method for calculating the DPS in NLC-based devices depends not on the presence or absence of sign transitions in the cang phase, but rather on the vertical separation between the two cang curves across frequency. When this separation increases monotonically with frequency, the direct subtraction of the phase values yields an accurate DPS.
The two survival cases reinforce this insight retrospectively: although their behaviours diverge from initial assumptions based on sign transitions, they ultimately affirm that frequency-dependent phase curve separation—not merely phase wrapping artefacts—determines the validity of direct DPS computation. This represents a conceptual advancement in the post-processing methodology for tunable phase-shifting devices.
6. Line Length-Inspired Vulnerability Statistics of DPS
For the characterisation of DPS’s frequency response (either data processing of numerically simulated cang results or experimentally measured ang results), there is an appetite for academics and designers to directly subtract the cang results of the two biasing states, leading to a series of faulty situations. In this section, we investigate the DPS misinterpretation vulnerability in another angle, i.e., from the lens of parameterising the line length (from 1 mm to 36 mm, with a step of 1 mm) to inspect the types and statistics of these faulty alerts.
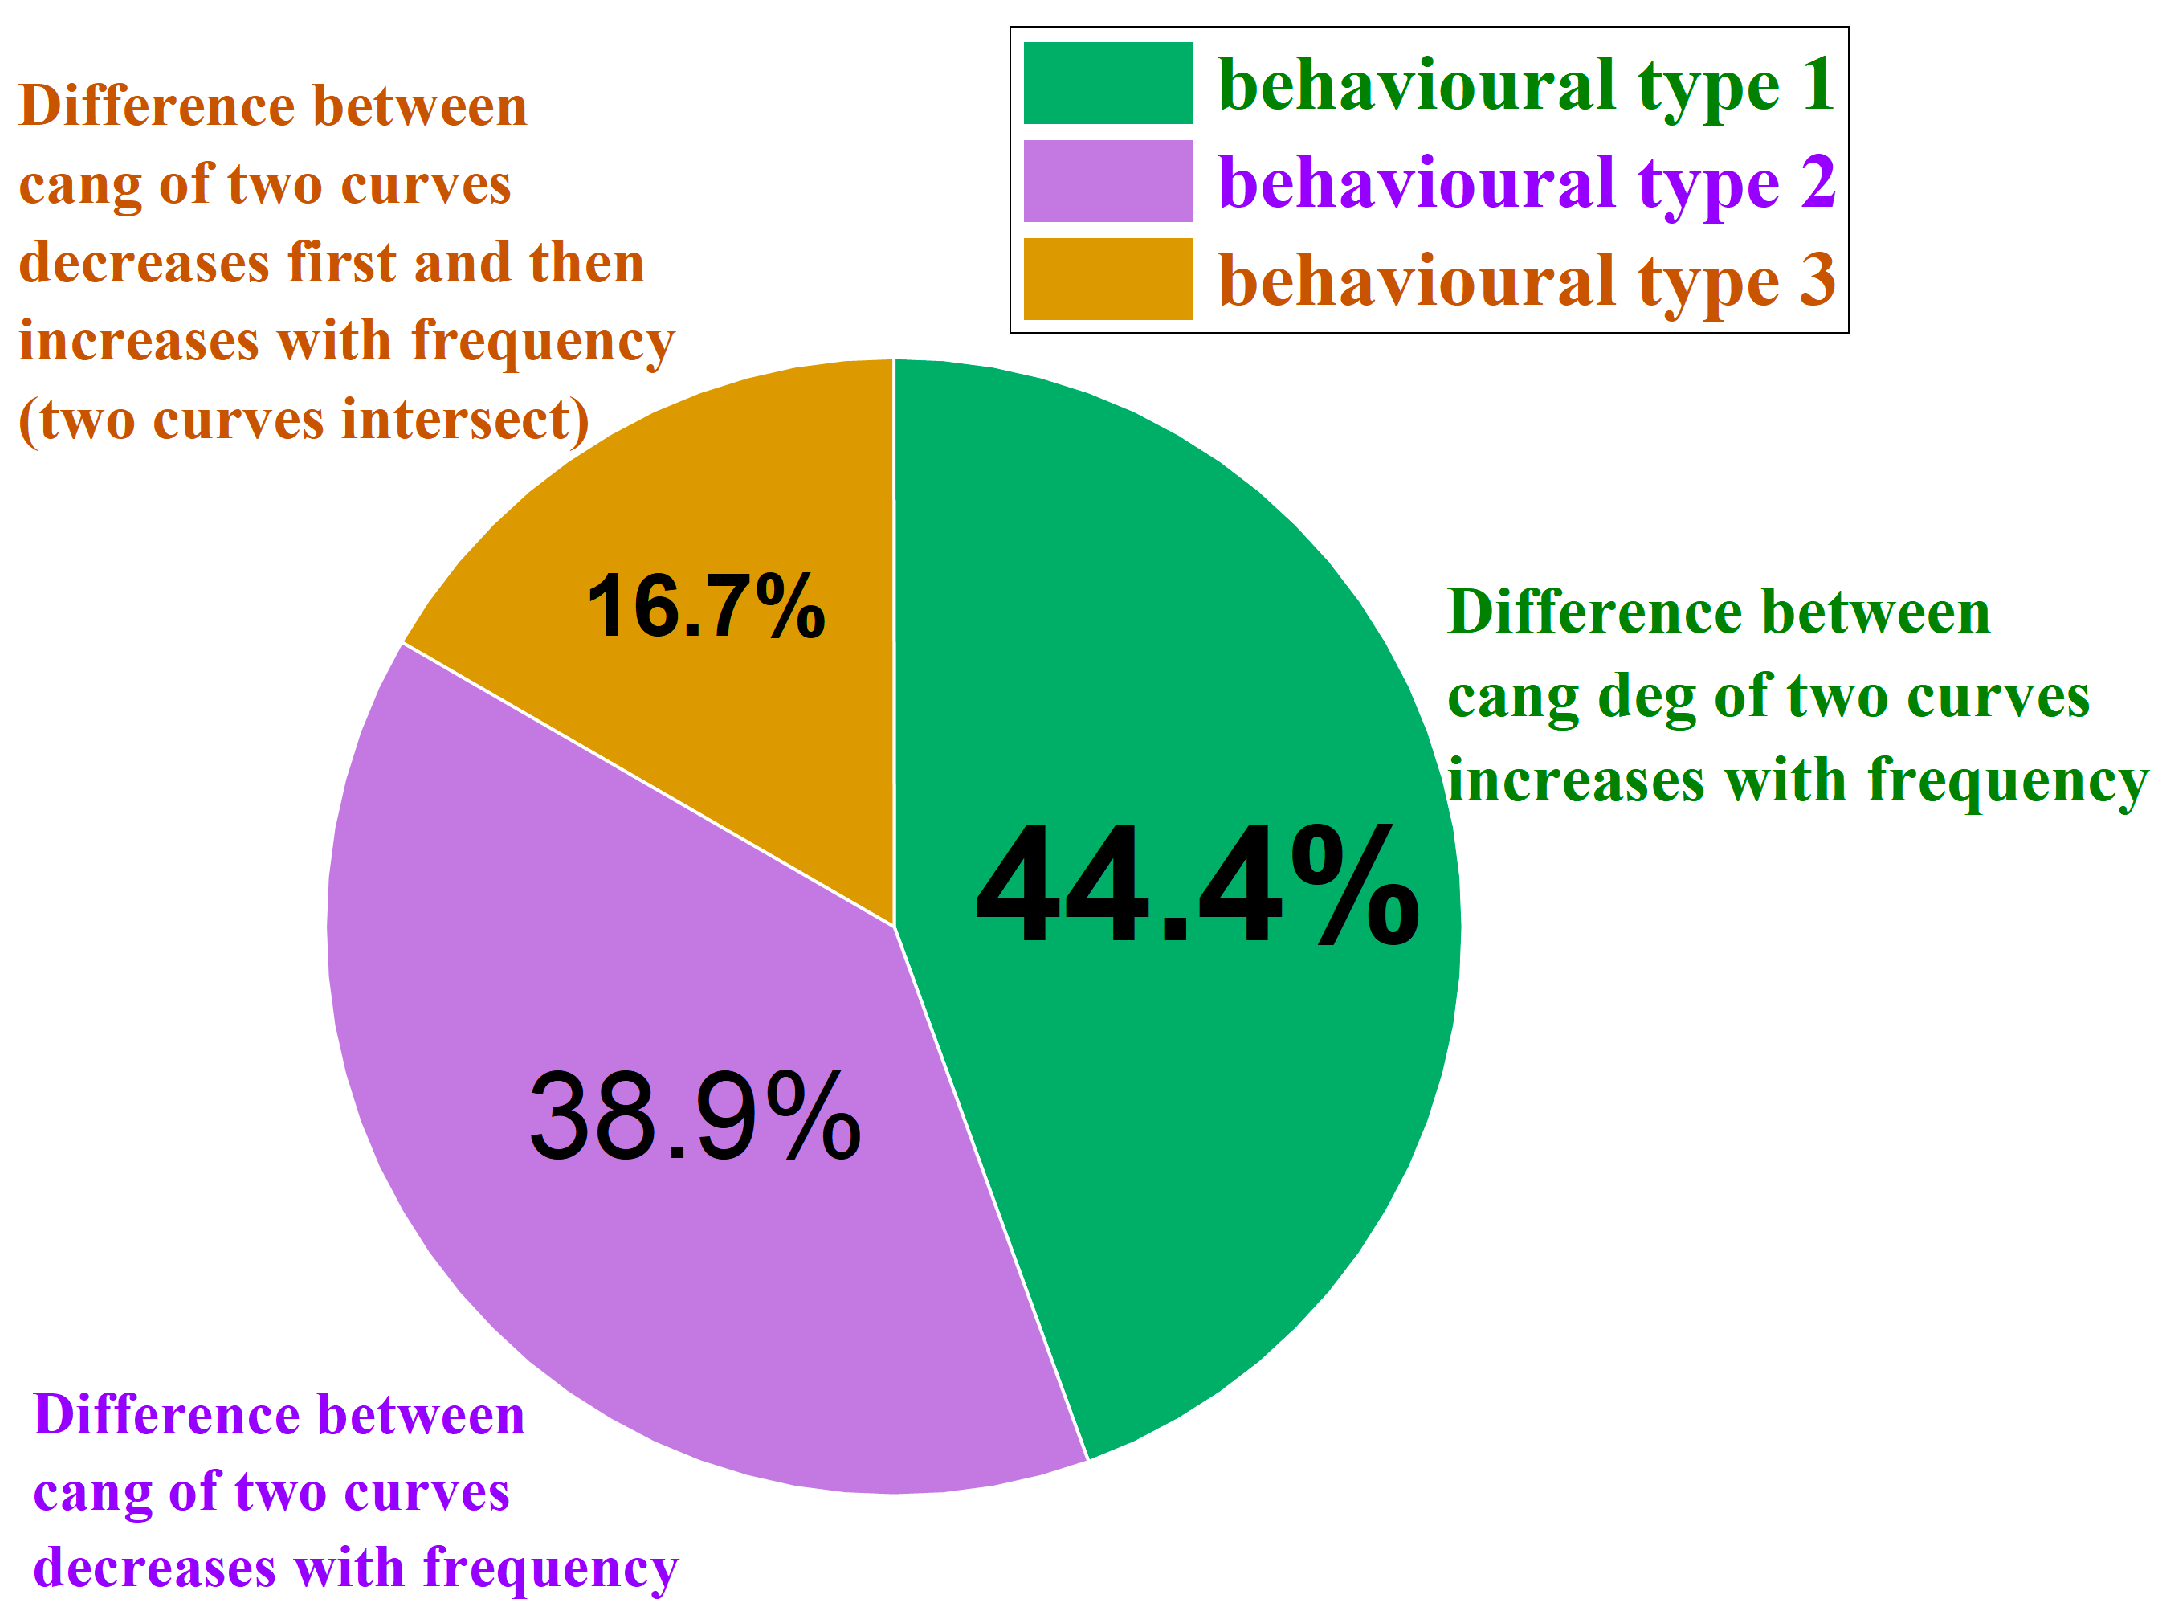
In the analysis of DPS across various lengths of the NLC-filled coaxial phase shifter (same cross-sectional geometry as the Vulnerable Case 1 reported above), it is observed that within the frequency range of 54 GHz to 66 GHz, the graphs of the cang for the two tuning states primarily exhibit three distinct behaviours: (1) the difference in cang between the two curves increases with increasing frequency; (2) the difference in cang between the two curves decreases with increasing frequency; and (3) the difference in cang between the two curves initially decreases and then increases with frequency, indicating an intersection between the two curves.
Among the 36 cases examined, a total of 16 cases conform to behaviour (1), with specific lengths as follows: 1, 2, 3, 4, 6, 7, 8, 9, 10, 12, 13, 16, 19, 22, 32, and 36 mm. Behaviour (2) is exhibited in 14 instances, corresponding to lengths of 5, 11, 14, 15, 17, 18, 20, 21, 23, 24, 25, 26, 27, and 28 mm. Finally, behaviour (3) is observed in six cases, with lengths of 29, 30, 31, 33, 34, and 35 mm. Statistics for these three situations are portrayed in the pie chart at
Figure 14.
By way of illustration,
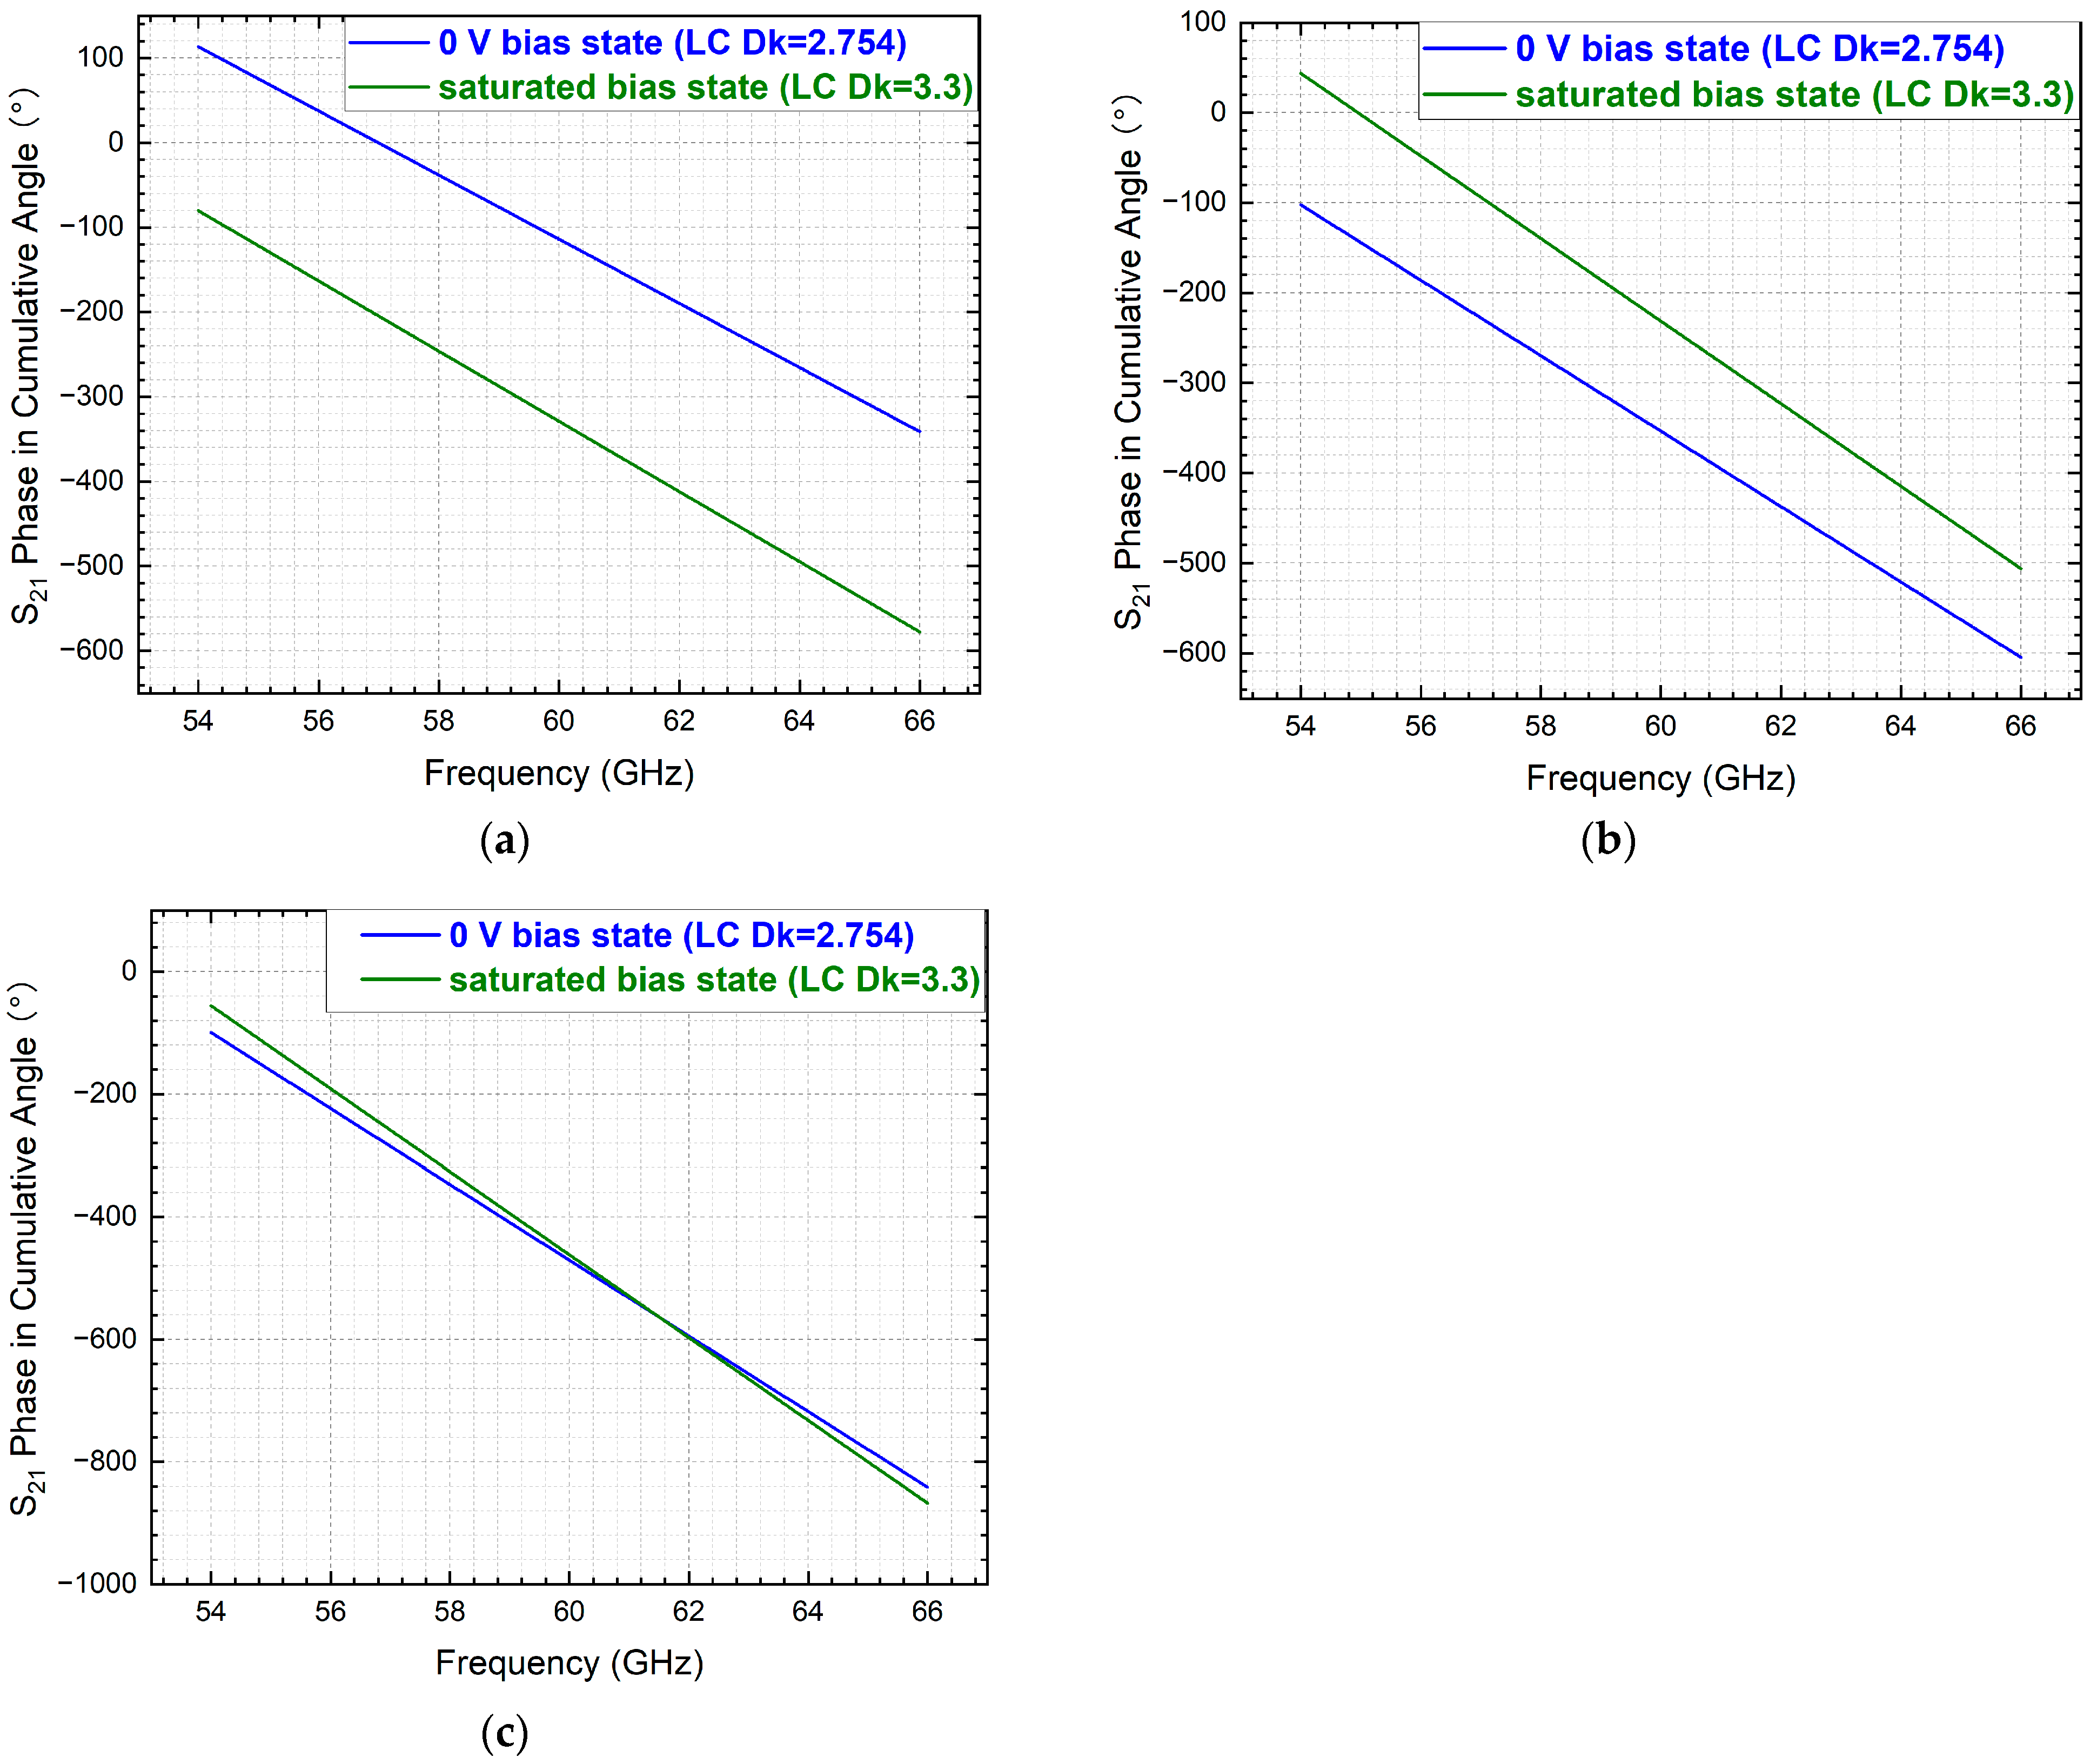
Figure 15a depicts the graphs of cang for the two tuning states corresponding to behaviour (1), using the 19 mm length as an example. In such cases, the DPS can be directly obtained by taking the absolute value of the difference between the cang value of the higher Dk state and that of the lower Dk state.
Figure 15b presents the curves of the cang for the two states corresponding to behaviour (2), using the 21 mm length as an example. In such cases, it is necessary to first subtract 360° from the cang value of the higher Dk state, then subtract the cang value of the lower Dk state from this adjusted value, and then, finally, take the absolute value of the result to obtain the DPS.
Figure 15c below displays the curves of the cang for the two states corresponding to behaviour (3), using the 31 mm length as an example. Similarly to the calculation method described for behaviour (2) above, the DPS is obtained by first subtracting 360° from the cang value of the higher Dk state, then subtracting the cang value of the lower Dk state from this adjusted value, and then finally taking the absolute value of the result.
Interestingly,
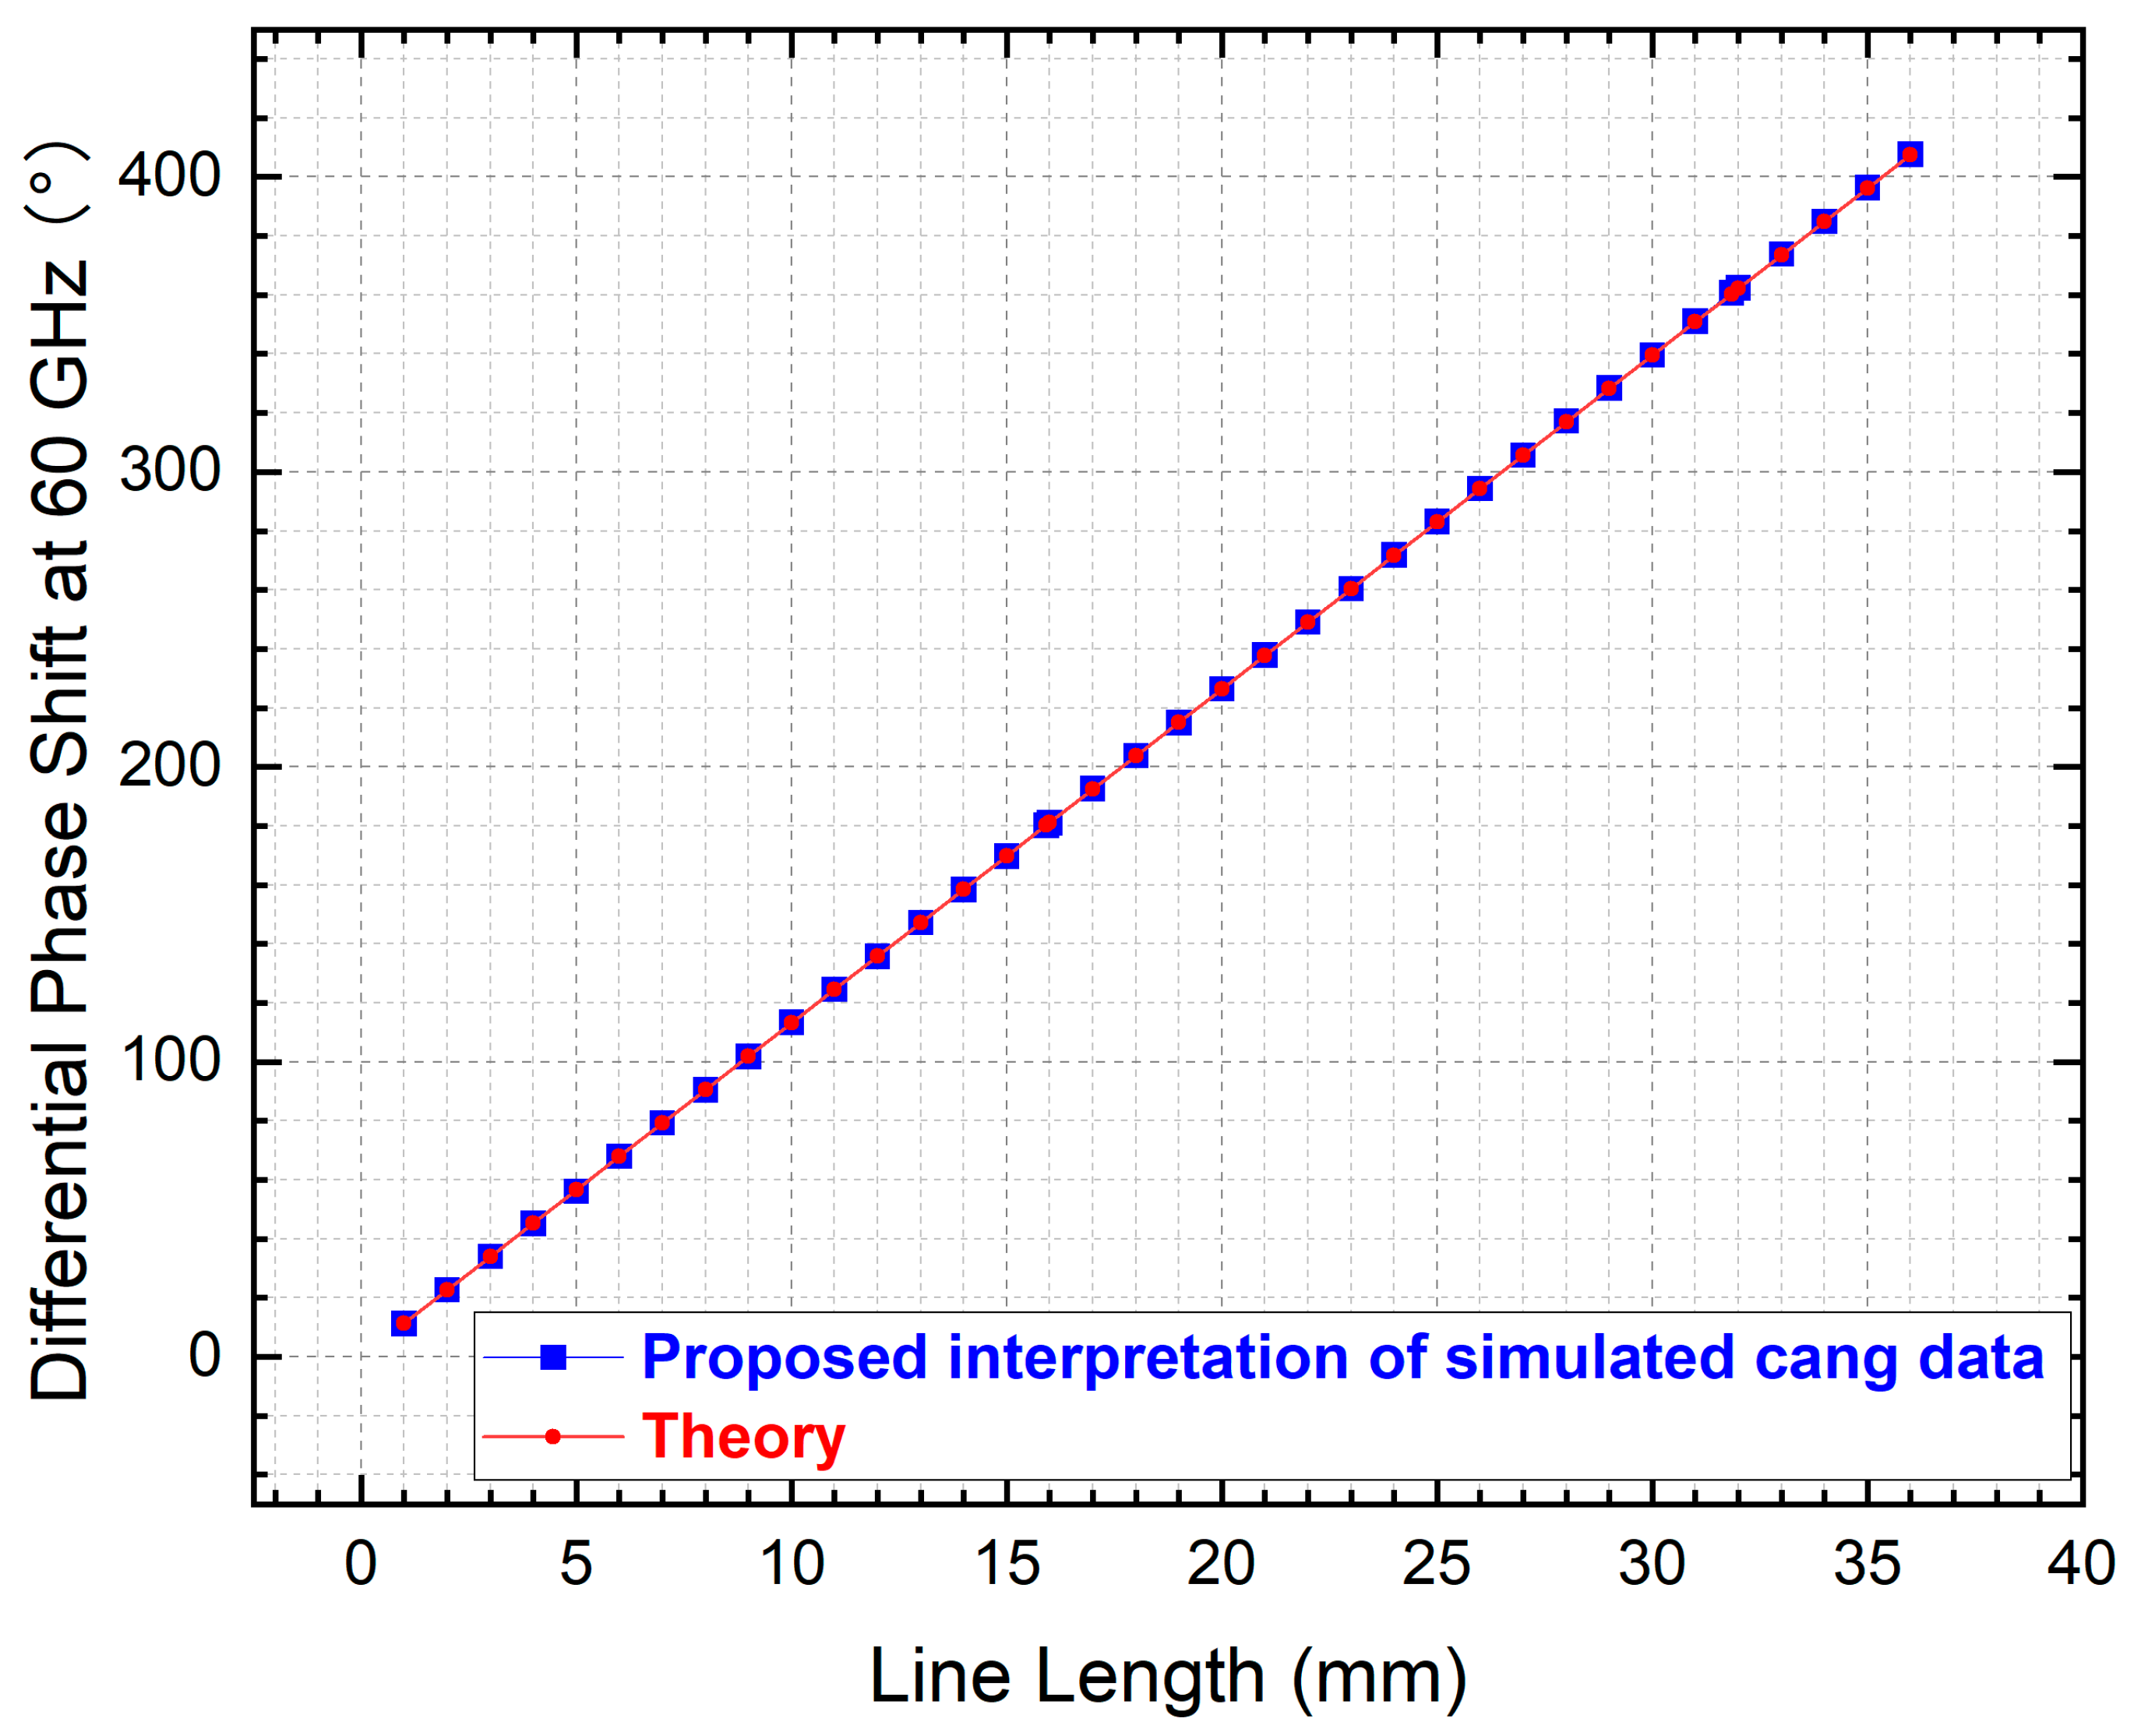
Figure 16 below illustrates a special case conforming to behaviour (1), observed at a length of 36 mm. Its calculation method aligns with those described for behaviour (2) and (3) above: it is necessary to first subtract 360° from the cang of the higher Dk state, then subtract the cang value of the lower Dk state from this adjusted value, and, finally, take the absolute value to obtain the correct phase shift. The DPS obtained by directly subtracting the cang values and taking the absolute value differs by exactly 360° from the result derived through this method. This indicates that when calculating DPS using cang, the actual DPS should be determined in conjunction with the theoretical formula (2), the results of which are depicted in
Figure 17. Otherwise, direct subtraction may yield a value that corresponds to a wrapping artefact (the residue modulo 360°), obscuring the true, unwrapped DPS.
7. Discussions and Concluding Remarks
In both measurement and simulation across a frequency spectrum, phase is commonly represented in two forms: angular (ang) and cumulative angular (cang). These representations are widely used in VNAs and EM simulators. For emerging applications in mmWave communications (e.g., 60 GHz WiGig), precise phase characterisation is non-negotiable. This example demonstrates that even minor post-processing oversights can skirt performance conclusions, undermine design confidence, or even impact resource allocation in research and development (R&D).
To address conceptual ambiguity and lack of methodological rigour in DPS characterisation, in-house-developed NLC phase shifters and their calculating methodologies for forming DPS predictions robustly are conveyed in this paper for boosting public understanding of the discipline and alerting relevant engineers to pay particular attention to the inaccurate vulnerabilities of DPS results that can easily be overlooked. Besides the tremendously evolving level of sophistication in the insertion loss mitigation, phase-shifting accuracy is unquestionably at the heart of a phase shifter. The new conceptual and original theoretical framework identified in this paper deciphers the seemingly simple yet confusing connection between the frequency-unwrapped cang in two extreme tuning states and the resulting DPS that can lead to a functional understanding of the phase shifter device’s behaviour.
In the preliminary vulnerability analysis, we observe that direct subtraction only makes sense in situations where the cang phase value does not change its sign. If there is a positive phase value at the start of the frequency spectrum, and the following spectrum becomes negative (i.e., the sign has changed), the DPS derived (between diverse tuning states of NLC) by direct subtraction is vulnerable to nonphysical results. These commonly encountered mistakes (particularly occurring for long line lengths that induce the phase sign variation) can be addressed by applying a 360° deduction to the sign change curve, forcing the phase spectrum to be purely negative.
Interestingly, two survival cases were observed to be resistant to the above vulnerabilities analysis proposal. The survived case 1 exhibits a fully positive cang profile for one tuning state of NLC, and a fully negative cang profile for another tuning state of NLC. In this case, the direct subtraction of the cang for the two states function properly in obtaining the DPS. This case not only partially supports the initial conclusion we have drawn from the vulnerability study regarding sign transition of cang but also complements the fully positive scenario of cang.
Another survival case follows the derived seemingly correct methodology to process the cang from a sign-transition one to a fully negative one (by 360° deduction) but resulting in unphysical result of DPS reducing with frequency. From this, we explicitly derived the conclusion regarding the correct way to calculate DPS with NLC, i.e., it is not the sign transition that matters, but the vertical distance between the two cang states with frequency that matters. For the distance increasing with frequency, direct subtraction works. For these two survival cases, the new advancement is observable retrospectively, albeit differing from the initial vision.
Besides the signal processing-related theory and practice tackled in this work for desirably reliable outcomes, computationally electromagnetics-based vulnerabilities of phase-shifting predictions have also been identified in our recent work [
23], concerning the port-to-port phase calibration ambiguity problem triggered by line length parameterisation of the phase shifter in a single model. Interested parties (students, educators, hardware and software engineers, experimentalists, etc.) can refer to [
6,
23] for a fuller picture.
Overall, these new insights redefine and challenge the existing understanding of the NLC phase-shifting subject. There is a strong belief that the applicability of these practices can be theoretically scaled to terahertz and optical frequencies for pervasive use, targeting the correct interpretations of the DPS for optical delay lines based on NLC that might have several possible applications in astrophysics, astronomical engineering, and other regimes [
41,
42,
43] towards 6G [
44,
45], wherein academics, students, and engineering designers can become informed commissioners. The outcome of this vulnerability study is envisaged to be rapidly translated into a phase-shifting-error threat detection-embedded computational electromagnetics remediation framework of strategic importance for digital twinning, informing decision-making by industry partners and research collaborators. Academically, it leads to new multi-physics multi-scale open-source programme development for NLC-based phase-shifting devices.
In conclusion, the corrected NLC-based phase-interpretation framework, detailed in the remediation strategy as well as the false-positive study, aligns best with practices in signal integrity analysis and ensures that performance evaluations reflect true device behaviours. This is critical for industries relying on high-fidelity phase shifters, such as phased-array radars and next-generation wireless systems.
Author Contributions
Conceptualisation, J.L.; methodology, J.L. and H.L.; software, J.L., H.L. and Y.X.; validation, J.L., H.L. and Y.X.; formal analysis, J.L., H.L. and Y.X.; investigation, J.L., H.L. and Y.X.; resources, J.L.; data curation, J.L. and H.L.; writing—original draft preparation, J.L. and H.L.; writing—review and editing, J.L.; visualisation, J.L., H.L. and Y.X.; supervision, J.L.; project administration, J.L.; funding acquisition, J.L. All authors have read and agreed to the published version of the manuscript.
Funding
This research was funded by the National Natural Science Foundation of China, grant number 62301043.
Data Availability Statement
Dataset available on request from the authors.
Conflicts of Interest
Author Yunchen Xiao was employed by the company SmartSens Technology (Shanghai) Co., Ltd. The remaining authors declare that the research was conducted in the absence of any commercial or financial relationships that could be construed as a potential conflict of interest. The funders had no role in the design of the study; in the collection, analyses, or interpretation of data; in the writing of the manuscript; or in the decision to publish the results.
Abbreviations
The following abbreviations are used in this manuscript:
| ang | Angular |
| cang | Cumulative angular |
| DF | Dissipation factor |
| Dk | Dielectric constant |
| Diameter of core conductor |
| DPS | Differential phase shift |
| EM | Electromagnetic |
| FEM | Finite-element method |
| FoM | Figure-of-merit |
| GHz | Gigahertz |
| Forward transmission coefficient |
| HFSS | High-frequency structure simulator |
| IMSL | Inverted microstrip line |
| IL | Insertion loss |
| LC | Liquid crystal |
| LCOS | Liquid crystal on silicon |
| RF | Radiofrequency |
| MW | Microwave |
| mmW | Millimetre-wave |
| NLC | Nematic liquid crystal |
| OAM | Orbital angular momentum |
| PI | Polyimide |
| R&D | Research and development |
| THz | Terahertz |
| Thickness of NLC |
| VNA | Vector network analysers |
| 5G | Fifth-generation wireless |
| 6G | Sixth-generation wireless |
References
- Massoni, E.; Perregrini, L.; Bozzi, M. Substrate Integrated Waveguide Two-Mode Coaxial Launcher. IEEE Trans. Microw. Theory Tech. 2025, 1–9. [Google Scholar] [CrossRef]
- Rivera-Lavado, A.; García-Muñoz, L.E.; Generalov, A.; Lioubtchenko, D.; Abdalmalak, K.A.; Llorente-Romano, S.; García-Lampérez, A.; Segovia-Vargas, D.; Räisänen, A.V. Design of a Dielectric Rod Waveguide Antenna Array for Millimeter Waves. J. Infrared Millim. Terahertz Waves 2017, 38, 33–46. [Google Scholar] [CrossRef]
- Li, J.; Chu, D. Liquid Crystal-Based Enclosed Coplanar Waveguide Phase Shifter for 54–66 GHz Applications. Crystals 2019, 9, 650. [Google Scholar] [CrossRef]
- Jakoby, R.; Gaebler, A.; Weickhmann, C. Microwave liquid crystal enabling technology for electronically steerable antennas in SATCOM and 5G millimeter-wave systems. Crystals 2020, 10, 514. [Google Scholar] [CrossRef]
- García-Muñoz, E.; Abdalmalak, K.A.; Santamaría, G.; Rivera-Lavado, A.; Segovia-Vargas, D.; Castillo-Araníbar, P.; Dijk, F.V.; Nagatsuma, T.; Brown, E.R.; Guzman, R.C.; et al. Photonic-based integrated sources and antenna arrays for broadband wireless links in terahertz communications. Semicond. Sci. Technol. 2019, 34, 054001. [Google Scholar] [CrossRef]
- Li, J.; Li, H. Modeling 0.3 THz Coaxial Single-Mode Phase Shifter Designs in Liquid Crystals with Constitutive Loss Quantifications. Crystals 2024, 14, 364. [Google Scholar] [CrossRef]
- Soares, M.S.; Gameiro, F.; Nedoma, J.; Santos, N.; Almeida, P.L.; Marques, C. Low-cost prototype for real-time analysis using liquid crystal optical sensors in water quality assessment. Photonics Res. 2025, 13, 541–549. [Google Scholar] [CrossRef]
- Vettese, D. Liquid crystal on silicon. Nat. Photonics 2010, 4, 752–754. [Google Scholar] [CrossRef]
- Soares, M.S.; Sobral, R.G.; Santos, N.; Marques, C.; Almeida, P.L. Liquid Crystal-Based Immunosensor for the Optical Detection of Escherichia Coli at Low Concentration Levels. IEEE Sens. J. 2024, 24, 8848–8856. [Google Scholar] [CrossRef]
- Rafique, A.; Ferreira, I.; Abbas, G.; Baptista, A.C. Recent Advances and Challenges Toward Application of Fibers and Textiles in Integrated Photovoltaic Energy Storage Devices. Nano-Micro Lett. 2023, 15, 40. [Google Scholar] [CrossRef]
- Boulder Atomic Clock Optical Network (BACON) Collaboration. Frequency ratio measurements at 18-digit accuracy using an optical clock network. Nature 2021, 591, 564–569. [Google Scholar] [CrossRef]
- Dierking, I. Liquid Crystal Research and Novel Applications in the 21st Century. Crystals 2025, 15, 321. [Google Scholar] [CrossRef]
- Maune, H.; Jost, M.; Reese, R.; Polat, E.; Nickel, M.; Jakoby, R. Microwave Liquid Crystal Technology. Crystals 2018, 8, 355. [Google Scholar] [CrossRef]
- Zografopoulos, D.C.; Ferraro, A.; Beccherelli, R. Liquid-crystal high-frequency microwave technology: Materials and Characterization. Adv. Mater. Technol. 2019, 4, 1800447. [Google Scholar] [CrossRef]
- Verdant, A.; Joly, P.L. Unlocking wavefront control potential with stacked technologies that jointly sense and shape light at pixel level. Nat. Rev. Electr. Eng. 2025, 2, 586–587. [Google Scholar] [CrossRef]
- Alkurt, F.O.; Unal, E.; Palandoken, M.; Altintarla, G.; Abdulkarim, Y.I.; Hasar, U.C.; Karaaslan, M. A study on electronically controllable beamforming monopole antenna for telecommunication applications. J. Electromagn. Waves Appl. 2022, 37, 549–561. [Google Scholar] [CrossRef]
- Ortiz-Fuentes, J.A.; Silva-Montero, J.; Galvan-Tejada, G.M.; Abdalmalak, K.A.; Segovia-Vargas, D. A Novel Super Wide Band Monopole Antenna with a Curved Ground Plane for 6G and Wireless Communications. IEEE Open J. Antennas Propag. 2025, 6, 1435–1443. [Google Scholar] [CrossRef]
- ALRikabi, H.T.H.S.; Sallomi, A.H.; KHazaal, H.F.; Magdy, A. Design and experimental evaluation of a reconfigurable intelligent surface for wireless applications. Results Eng. 2025, 26, 104694. [Google Scholar] [CrossRef]
- Neuder, R.; Späth, M.; Schüßler, M.; Sáez, A.J. Architecture for sub-100 ms liquid crystal reconfigurable intelligent surface based on defected delay lines. Commun. Eng. 2024, 3, 70. [Google Scholar] [CrossRef]
- Lazarev, G.; Chen, P.J.; Strauss, J.; Fontaine, N.; Forbes, A. Beyond the display: Phase-only liquid crystal on Silicon devices and their applications in photonics [Invited]. Opt. Express 2019, 27, 16206–16249. [Google Scholar] [CrossRef]
- Schwartz, O.; Axelrod, J.J.; Campbell, S.L.; Turnbaugh, C.; Glaeser, R.M.; Müller, H. Laser phase plate for transmission electron microscopy. Nat. Methods 2019, 16, 1016–1020. [Google Scholar] [CrossRef]
- Emile, O.; Emile, J. OAM of Light: Origins and Applications. Encyclopedia 2025, 5, 152. [Google Scholar] [CrossRef]
- Li, J.; Li, H. Assessing Vulnerabilities in Line Length Parameterization and the Per-Unit-Length Paradigm for Phase Modulation and Figure-of-Merit Evaluation in 60 GHz Liquid Crystal Phase Shifters. Symmetry 2024, 16, 1261. [Google Scholar] [CrossRef]
- Al-Yasir, Y.I.A.; Ojaroudi Parchin, N.; Tu, Y.; Abdulkhaleq, A.M.; Elfergani, I.T.E.; Rodriguez, J.; Abd-Alhameed, R.A. A Varactor-Based Very Compact Tunable Filter with Wide Tuning Range for 4G and Sub-6 GHz 5G Communications. Sensors 2020, 20, 4538. [Google Scholar] [CrossRef]
- Pitruzzello, G. Memristor phase shifters. Nat. Photonics 2023, 17, 1025. [Google Scholar] [CrossRef]
- Outram, B. Nematic liquid crystals. In Liquid Crystals, 1st ed.; IOP Publishing: Bristol, UK, 2018; Volume 4, pp. 1–14. [Google Scholar]
- Viciosa, M.T.; Nunes, A.M.; Fernandes, A.; Almeida, P.L.; Godinho, M.H.; Dionísio, M.D. Dielectric studies of the nematic mixture E7 on a hydroxypropylcellulose substrate. Liq. Cryst. 2002, 29, 429–441. [Google Scholar] [CrossRef]
- Trindade, A.C.; Almeida, A.P.C.; Canejo, J.P.; Patrício, P.; Pieranski, P.; Godinho, M.H. Elastomeric patterns probed by a nematic liquid crystal. Mol. Cryst. Liq. Cryst. 2017, 657, 136–146. [Google Scholar] [CrossRef]
- Almeida, S.; Almeida, A.; Almeida, P.; Godinho, M.H. Exploring the potential of cellulose liquid crystal devices: Insights from nature’s design. In Proceedings of the SPIE PC13016, Liquid Crystals Optics and Photonic Devices, Strasbourg, France, 18 June 2024; p. PC130160X. [Google Scholar]
- Trindade, A.C.; Canejo, J.P.; Almeida, P.L. New Insights into Polymeric Liquid Crystals and Their Applications. Molecules 2025, 30, 2997. [Google Scholar] [CrossRef]
- Nose, T.; Ito, T.; Ito, R.; Honma, M. Basic Performance of Rectangular Waveguide Type Liquid Crystal Phase Shifter Driven by Magnetic Field. In Proceedings of the 2018 43rd International Conference on Infrared, Millimeter, and Terahertz Waves (IRMMW-THz), Nagoya, Japan, 9–14 September 2018; pp. 1–2. [Google Scholar]
- De Gennes, P.G.; Prost, J. The Physics of Liquid Crystals; Oxford University Press: Oxford, UK, 1995. [Google Scholar]
- Li, J. Challenges and Opportunities for Nematic Liquid Crystals in Radio Frequency and Beyond. Crystals 2022, 12, 632. [Google Scholar] [CrossRef]
- Yöntem, A.Ö.; Li, J.; Chu, D. Imaging through a projection screen using bi-stable switchable diffusive photon sieves. Opt. Express 2018, 26, 10162–10170. [Google Scholar] [CrossRef]
- Liang, Y.G.; Liang, F.; Zhao, D.; Wang, B.Z. Dynamic Wireless Power Transfer Using 3-Bit Liquid Crystal Reflectarray. In Proceedings of the 2024 International Conference on Microwave and Millimeter Wave Technology (ICMMT), Beijing, China, 16–19 May 2024; pp. 1–3. [Google Scholar]
- Shin, S.-h.; Skinner, J. Application of Weighting Algorithm for Enhanced Broadband Vector Network Analyzer Measurements. Mathematics 2024, 12, 2871. [Google Scholar] [CrossRef]
- Yaakoubi, G.; Martineau, B. Direct Magnitude and Phase Measurement in an Inductorless Integrated Vector Network Analyzer for Wideband Ambient Environment Sensing. In Proceedings of the 2025 23rd IEEE Interregional NEWCAS Conference (NEWCAS), Paris, France, 22–25 June 2025; pp. 420–424. [Google Scholar]
- Grieco, A. Direct phase measurement of waveguides with a next generation optical vector spectrum analyzer. Light Sci. Appl. 2024, 13, 293. [Google Scholar] [CrossRef]
- Bird, T.S. Definition and Misuse of Return Loss [Report of the Transactions Editor-in-Chief]. IEEE Antennas Propag. Mag. 2009, 51, 166–167. [Google Scholar] [CrossRef]
- Li, J.; Li, H. Symmetry Implications of a 60 GHz Inverted Microstrip Line Phase Shifter with Nematic Liquid Crystals in Diverse Packaging Boundary Conditions. Symmetry 2024, 16, 798. [Google Scholar] [CrossRef]
- Farnes, J.; Mort, B.; Dulwich, F.; Salvini, S.; Armour, W. Science Pipelines for the Square Kilometre Array. Galaxies 2018, 6, 120. [Google Scholar] [CrossRef]
- Geler-Kremer, J.; Eltes, F.; Stark, P.; Stark, D.; Caimi, D.; Siegwart, H.; Jan Offrein, B.; Fompeyrine, J.; Abel, S. A ferroelectric multilevel non-volatile photonic phase shifter. Nat. Photonics 2022, 16, 491–497. [Google Scholar] [CrossRef]
- Ghorapade, V.; Wang, W.C. Electro-hydrodynamic programming reshapes liquid crystal dynamics in free-form director fields. Sci. Rep. 2024, 14, 4226. [Google Scholar] [CrossRef]
- Guirado, R.; Perez-Palomino, G.; Caño-Garcia, M.; Geday, M.A.; Carrasco, E. mm-Wave metasurface unit cells achieving millisecond response through polymer network liquid crystals. IEEE Access 2022, 10, 127928–127938. [Google Scholar] [CrossRef]
- Bhat, J.R.; Alqahtani, S.A. 6G Ecosystem: Current Status and Future Perspective. IEEE Access 2021, 9, 43134–43167. [Google Scholar] [CrossRef]
Figure 1.
Depiction of phase-shifting mechanisms employing NLCs (composed of rod-like molecules with positive dielectric anisotropy) and their envisioned integration into phased array subsystems or reconfigurable metasurfaces for emerging 5G/6G beam steering applications.
Figure 1.
Depiction of phase-shifting mechanisms employing NLCs (composed of rod-like molecules with positive dielectric anisotropy) and their envisioned integration into phased array subsystems or reconfigurable metasurfaces for emerging 5G/6G beam steering applications.
Figure 2.
Depiction of relationship between angular (ang) and cumulative angular (cang) representations in phase–frequency responses of NLC-based phase shifters.
Figure 2.
Depiction of relationship between angular (ang) and cumulative angular (cang) representations in phase–frequency responses of NLC-based phase shifters.
Figure 3.
VNA representations of measured phase responses, displayed in ang format (typical results from our previous experiments on NLC-based MW and mmW phase shifters across multiple frequency bands).
Figure 3.
VNA representations of measured phase responses, displayed in ang format (typical results from our previous experiments on NLC-based MW and mmW phase shifters across multiple frequency bands).
Figure 4.
Geometry and material details for our NLC-filled strip line phase shifter tuned between (a) the 0 V bias state of NLC and (b) the saturated bias state of NLC.
Figure 4.
Geometry and material details for our NLC-filled strip line phase shifter tuned between (a) the 0 V bias state of NLC and (b) the saturated bias state of NLC.
Figure 5.
Geometry and material details for our NLC-filled coaxial phase shifter tuned between the 0 V bias state (isotropic NLC) and the saturated bias state of NLC.
Figure 5.
Geometry and material details for our NLC-filled coaxial phase shifter tuned between the 0 V bias state (isotropic NLC) and the saturated bias state of NLC.
Figure 6.
Geometry and material details for our NLC-filled inverted microstrip line (IMSL) phase shifter tuned between (a) the 0 V bias state of NLC and (b) the saturated bias state of NLC.
Figure 6.
Geometry and material details for our NLC-filled inverted microstrip line (IMSL) phase shifter tuned between (a) the 0 V bias state of NLC and (b) the saturated bias state of NLC.
Figure 7.
Hasty post-processing of (a) cang for two extreme tuning states of NLC-filled strip line phase shifter, leading to erroneous estimation of (b) maximally achievable DPS derived.
Figure 7.
Hasty post-processing of (a) cang for two extreme tuning states of NLC-filled strip line phase shifter, leading to erroneous estimation of (b) maximally achievable DPS derived.
Figure 8.
Characterisation of NLC-filled strip line phase shifter from 54 GHz to 66 GHz: (
a) Insertion loss; (
b) FoM, derived from erroneous processed DPS data presented in
Figure 7b.
Figure 8.
Characterisation of NLC-filled strip line phase shifter from 54 GHz to 66 GHz: (
a) Insertion loss; (
b) FoM, derived from erroneous processed DPS data presented in
Figure 7b.
Figure 9.
Characterisation of NLC-filled coaxial phase shifter designs across 225 GHz to 375 GHz: (a) phase output in ang format; (b) phase output in cang format; (c) computed maximum DPS (faulty); (d) derived FoM (faulty).
Figure 9.
Characterisation of NLC-filled coaxial phase shifter designs across 225 GHz to 375 GHz: (a) phase output in ang format; (b) phase output in cang format; (c) computed maximum DPS (faulty); (d) derived FoM (faulty).
Figure 10.
Comparison of post-processed results for Vulnerable Case 1 (NLC-filled strip line phase shifter), showing corrected method versus erroneous one: (a) cang for both corrected and faulty processing; (b) derived DPS for corrected and faulty results; and (c) derived FoM for corrected and faulty results.
Figure 11.
Comparison of post-processed results for Vulnerable Case 2 (NLC-filled coaxial phase shifter), demonstrating corrected method versus erroneous one: (a) corrected cang; (b) derived DPS, comparing corrected and faulty results; and (c) derived FoM, comparing corrected and faulty results.
Figure 11.
Comparison of post-processed results for Vulnerable Case 2 (NLC-filled coaxial phase shifter), demonstrating corrected method versus erroneous one: (a) corrected cang; (b) derived DPS, comparing corrected and faulty results; and (c) derived FoM, comparing corrected and faulty results.
Figure 12.
False-positive case identified in modified Vulnerable Case 1 (NLC-filled strip line phase shifter with reduced length of 1 mm): (a) unprocessed cang raw data; (b) correctly derived DPS obtained by appropriately withholding remediation action described in re-calibration section.
Figure 12.
False-positive case identified in modified Vulnerable Case 1 (NLC-filled strip line phase shifter with reduced length of 1 mm): (a) unprocessed cang raw data; (b) correctly derived DPS obtained by appropriately withholding remediation action described in re-calibration section.
Figure 13.
False-positive alert case 2 (NLC-filled IMSL phase shifter): (a) cang showing raw data and over-interpreted data from incorrect processing; (b) derived DPS, comparing correct result with faulty one generated by misapplied remediation action; and (c) resulting FoM (correct vs. faulty).
Figure 13.
False-positive alert case 2 (NLC-filled IMSL phase shifter): (a) cang showing raw data and over-interpreted data from incorrect processing; (b) derived DPS, comparing correct result with faulty one generated by misapplied remediation action; and (c) resulting FoM (correct vs. faulty).
Figure 14.
Distribution of three observed cang evolution behaviours for NLC-filled coaxial phase shifters parameterised by line length (from 1 mm to 36 mm in 1 mm increments; 36 total cases). Device cross-section matches that of previously identified Vulnerable Case 1. Bars represent percentage prevalence of each behavioural type.
Figure 15.
Frequency response illustrations of cang interactions, classified into three behavioural types, across 36 cases with line lengths parameterised from 1 mm to 36 mm in NLC-filled coaxial phase shifters (sharing the cross-sectional geometry of Vulnerable Case 1): (a) behavioural type 1; (b) behavioural type 2; and (c) behavioural type 3.
Figure 16.
Frequency response of cang for special case exhibiting behaviour type (1) in NLC-filled coaxial phase shifter (length: 36 mm; cross-sectional geometry identical to Vulnerable Case 1).
Figure 16.
Frequency response of cang for special case exhibiting behaviour type (1) in NLC-filled coaxial phase shifter (length: 36 mm; cross-sectional geometry identical to Vulnerable Case 1).
Figure 17.
Line length dependence of DPS at 60 GHz for NLC-filled coaxial phase shifters (with identical cross-sectional geometry to Vulnerable Case 1), comparing properly processed simulation data with theoretical results.
Figure 17.
Line length dependence of DPS at 60 GHz for NLC-filled coaxial phase shifters (with identical cross-sectional geometry to Vulnerable Case 1), comparing properly processed simulation data with theoretical results.
| Disclaimer/Publisher’s Note: The statements, opinions and data contained in all publications are solely those of the individual author(s) and contributor(s) and not of MDPI and/or the editor(s). MDPI and/or the editor(s) disclaim responsibility for any injury to people or property resulting from any ideas, methods, instructions or products referred to in the content. |
© 2025 by the authors. Licensee MDPI, Basel, Switzerland. This article is an open access article distributed under the terms and conditions of the Creative Commons Attribution (CC BY) license (https://creativecommons.org/licenses/by/4.0/).
