1. Introduction
The transition towards sustainable and low-emission energy technologies has intensified global interest in high-efficiency systems capable of utilizing renewable and carbon-neutral fuels. Among the available electrochemical technologies, solid oxide fuel cells (SOFCs) have emerged as particularly promising due to their high electrical efficiency, low environmental impact, fuel flexibility, and ability to reform hydrocarbon-based fuels internally [
1]. Unlike low-temperature fuel cells, SOFCs can directly operate with hydrogen, methane, syngas, ammonia, and biogas, offering unique advantages for both distributed power generation and integration with renewable energy systems [
2]. Their high to intermediate operating temperature, typically between 600 and 1000 °C, enables internal reforming through endothermic reactions, including steam reforming (CH
4 + H
2O), dry reforming (CH
4 + CO
2), and partial oxidation of methane. The ability to internally convert chemical fuels into hydrogen-rich gas mixtures improves overall fuel utilization and reduces system complexity [
3].
Ni-YSZ (yttria-stabilized zirconia) has been considered as the state-of-the-art anode material for SOFCs, primarily due to its high electrical conductivity, catalytic activity towards hydrogen oxidation, availability, and compatibility with conventional fabrication techniques [
4]. However, its performance significantly degrades during operation with hydrocarbon and biogas fuels. Nickel, which forms the active phase in Ni–YSZ anodes, readily catalyzes methane cracking (CH
4 → C + 2H
2) and the Boudouard reaction (2CO → C + CO
2), both of which lead to carbon deposition [
4]. Accumulated carbon blocks triple-phase boundaries, hindering mass transport, restricting electrochemical activity, and inducing mechanical stress, eventually resulting in degradation, cracking or loss of electrical connectivity. It has been reported that carbon deposition preferentially initiates at the Ni-YSZ interface, where local microstructural features and stress gradients enhance carbon nucleation and accelerate electrode degradation [
5]. In addition to coking, Ni-YSZ anodes are highly susceptible to sulphur poisoning and microstructural coarsening, especially under realistic biogas compositions that can contain moisture and impurities such as H
2S [
6]. Therefore, improving the carbon tolerance and long-term stability of SOFC anodes is essential for enabling direct biogas utilization.
Perovskite-type oxides have gained growing interest as alternative or modifying anode materials due to their structural flexibility, tunable defect chemistry, and ability to host both electronic and ionic charge carriers [
1,
7,
8,
9]. Unlike Ni-YSZ, where catalytic performance relies primarily on metallic Ni, perovskites can incorporate transition metal ions, such as Ni, Co, and Fe, within the B-site of the lattice. Under appropriate redox conditions, these ions may be exsolved to the surface, forming metallic nanoparticles that function as catalytic sites for reforming and electrochemical reactions [
8]. This concept offers significant advantages over conventional catalyst infiltration or impregnation approaches, which often produce weakly bound nanoparticles that detach, agglomerate, or sinter during SOFC operation.
Exsolution is a redox-driven process where transition metal ions initially dissolved in the perovskite lattice migrate to the surface and nucleate as metallic nanoparticles when exposed to reducing atmospheres [
10]. The resulting particles are partially embedded into the oxide support, providing strong metal–support interactions and significantly improved thermal and mechanical stability [
11]. Compared to conventional catalyst layers, exsolved nanoparticles are more resistant to sintering, poisoning, and detachment under redox cycling and high-temperature conditions [
11]. It has been found that exsolved nanoparticles exhibit modified electronic structures resulting from strong metal–oxide interactions, which enhance catalytic activity, suppress carbon deposition, and improve resistance to sulphur poisoning [
11]. Moreover, exsolved nanoparticles may re-dissolve into the perovskite lattice under oxidizing conditions and re-emerge under reducing conditions, offering self-regeneration capabilities not available in conventional catalytic systems [
6].
Defect engineering is essential to control exsolution behavior. Oxygen vacancies, A-site deficiency, aliovalent doping, and lattice strain collectively influence nanoparticle size, dispersion, and socketing depth [
12]. It has been demonstrated that oxygen vacancy concentration reduces the energetic barrier for cation segregation and enhances nanoparticle formation efficiency [
12]. Furthermore, A-site non-stoichiometry promotes exsolution and results in higher nanoparticle density with improved anchorage to the perovskite support [
13]. These structural characteristics enhance resistance to thermal changes in the structure and mechanical detachment, making exsolution-based materials excellent candidates for SOFC anodes operating in harsh reforming environments [
6].
Exsolved nanoparticles, particularly those containing Ni or Co, have demonstrated excellent catalytic performance in methane activation and fuel reforming reactions, including steam reforming, dry reforming, and water–gas shift reactions [
11]. These reactions not only reduce carbon accumulation but also enrich hydrogen concentration, improving electrochemical oxidation efficiency at the anode. In biogas-fed systems, CO
2 present in the fuel stream can gasify deposited carbon through the reverse Boudouard reaction (C + CO
2 → 2CO), provided that sufficient oxygen mobility and active catalytic surfaces are available [
6]. Therefore, anodes with high coking resistance must exhibit both excellent reforming capability and sufficient oxygen transport to support continuous carbon gasification.
Cerium-containing materials offer additional benefits due to their redox flexibility and high oxygen storage and release capabilities. The Ce
4+/Ce
3+ redox couple facilitates lattice oxygen participation in carbon gasification and provides improved tolerance to reducing hydrocarbon atmospheres [
13]. It has been demonstrated that oxygen vacancies in CeO
2 promote a mechanism where deposited carbon migrates from the metallic surface to the oxide support, where it reacts with active oxygen species to form CO or CO
2 [
13]. This mechanism significantly enhances coking resistance and stabilizes catalytic performance, making Ce-doped perovskites attractive candidates for SOFC anode coatings in biogas environments.
In this study, the defect-engineered perovskite (La0.3Sr0.6Ce0.1)0.9Co0.1Ti0.9O3−δ (LSCCoT) has been investigated as an additional catalytic layer on the Ni–YSZ anode surface. A-site deficiency promotes cobalt exsolution, while cerium incorporation enhances oxygen vacancy formation and carbon oxidation pathways. The addition of titanium helps maintain structural stability under high-temperature and redox conditions. When applied as a coating on Ni–YSZ, LSCCoT is expected to generate socketed Co nanoparticles that catalyze methane reforming while suppressing carbon deposition, leading to improved electrochemical performance and long-term stability. By integrating exsolution, defect chemistry, and catalytic functionality, this approach offers a promising pathway for developing carbon-tolerant, durable SOFC anodes capable of efficient direct biogas utilization.
2. Results and Discussion
2.1. SEM Images
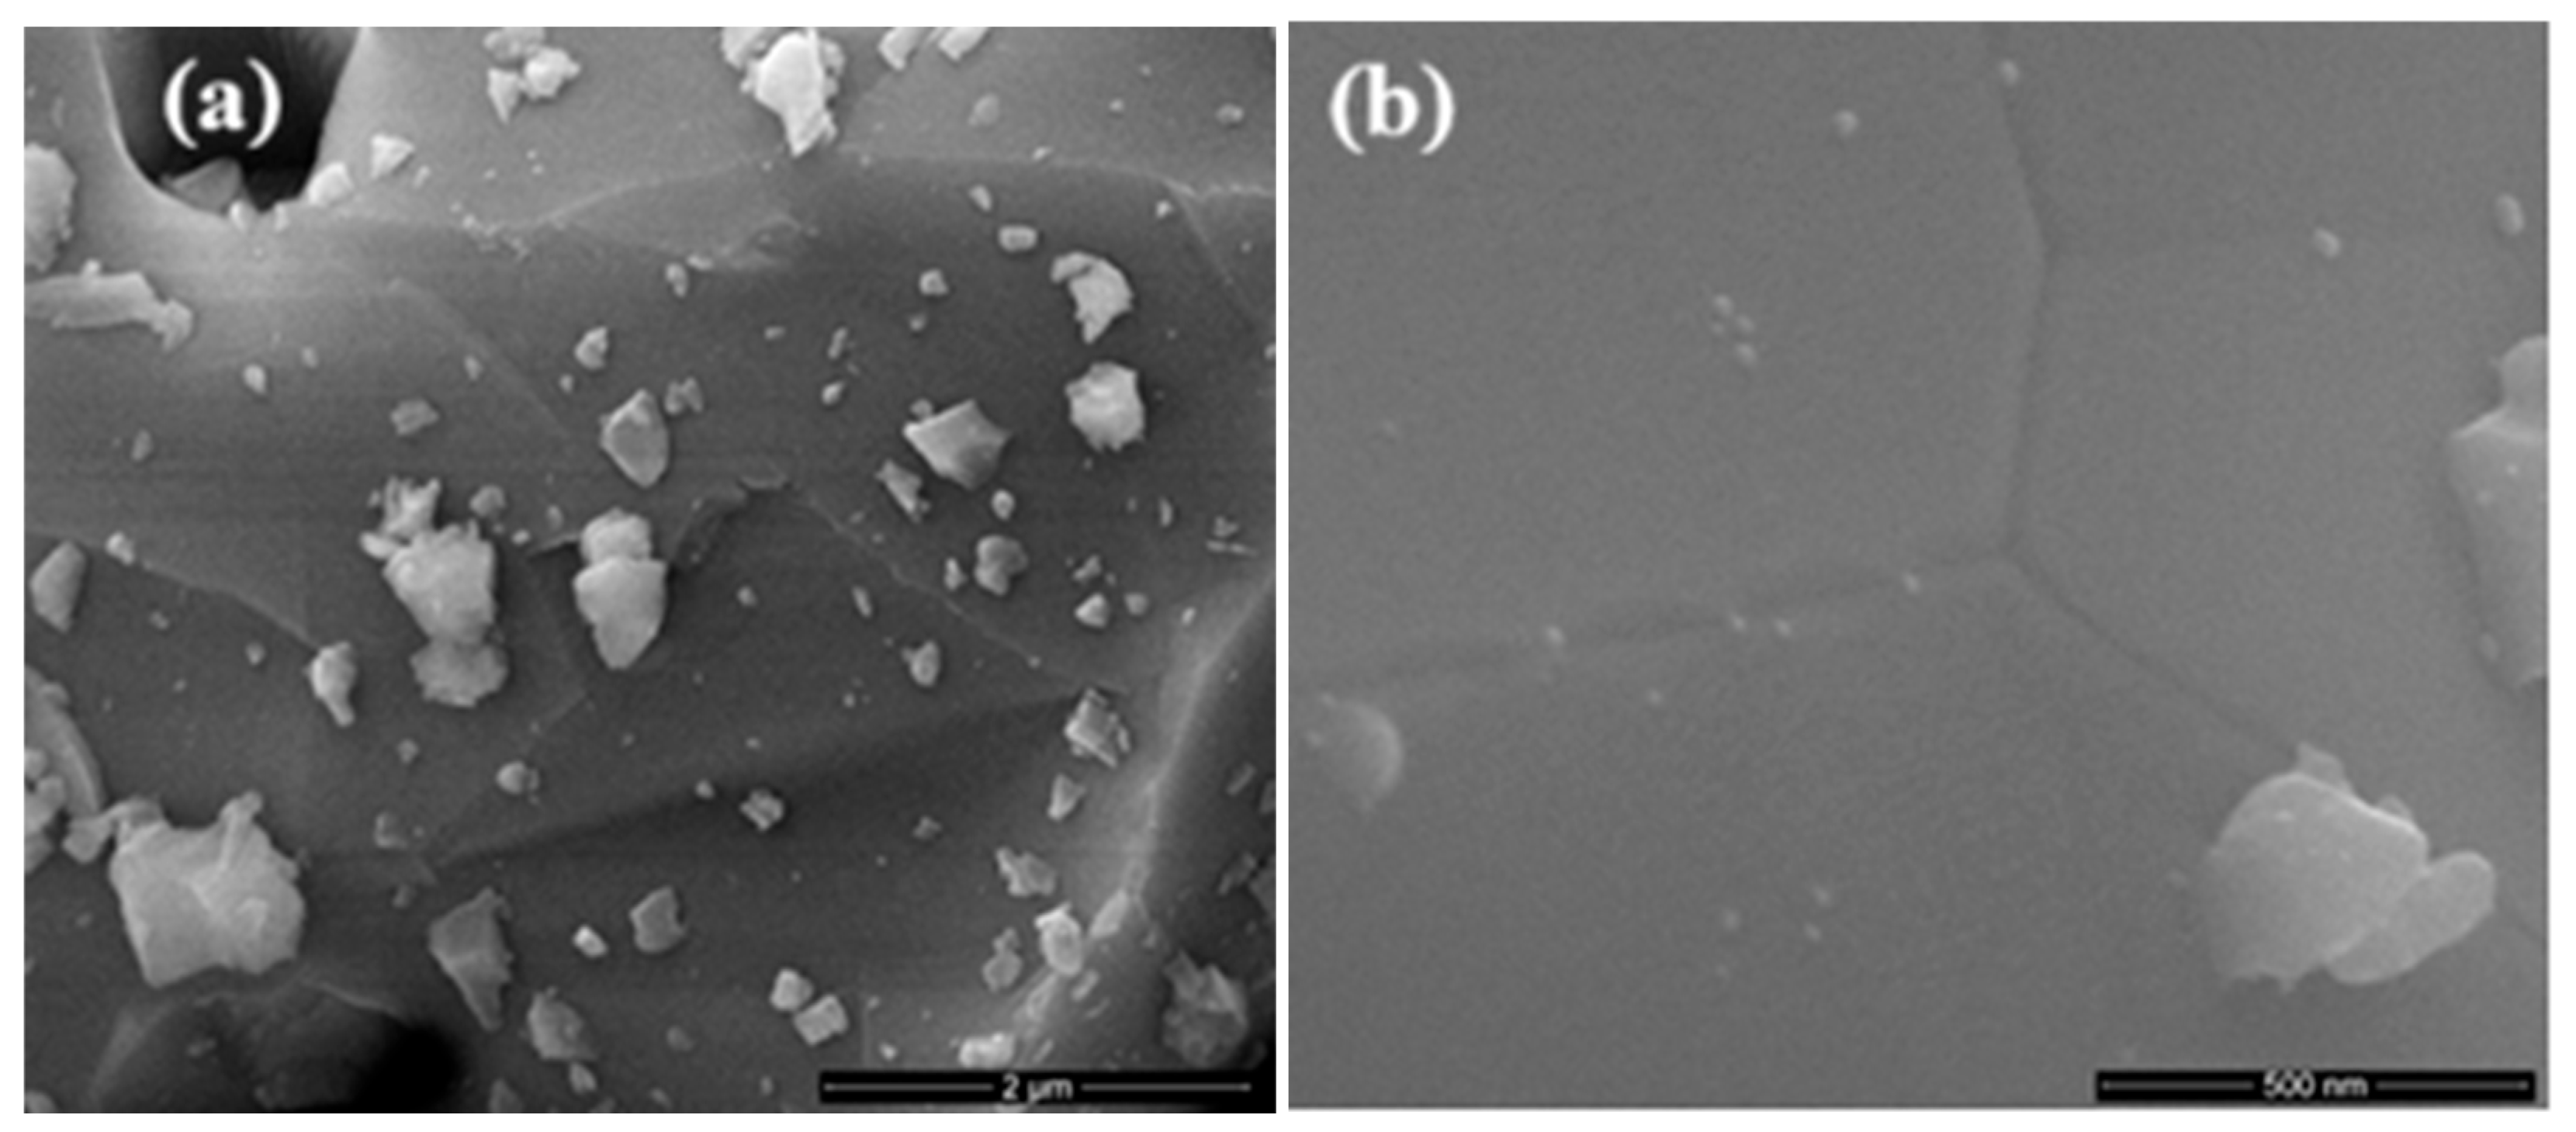
Figure 1 presents SEM images of both the as-prepared LSCCoT powder (
Figure 1a) and the powder after reduction in dry H
2 at 900 °C (
Figure 1b), captured at different magnifications.
The as-prepared sample (
Figure 1a) exhibits a sintered structure characterized by compact grains predominantly within the 3–5 µm size range, which is typical for powders synthesized at high temperatures. These conditions generally promote grain growth, resulting in a dense microstructure. The surface also features smaller, irregular characteristics distributed across the grains, likely associated with prior milling. Following reduction (
Figure 1b), the surface morphology changes significantly. The grains appear smoother and more uniform, and the grain boundaries become more distinctly defined. These observations suggest that the reduction treatment not only induced surface structural changes but also contributed to partial homogenization of the microstructure. However, the most notable change is the emergence of nanoparticles on the surface of the reduced sample. These nanoparticles, absent in the as-synthesized material, are well-dispersed across the grains, grain boundaries, and even within smaller surface features, exhibiting sizes in the range of 10–20 nm and a surface density of approximately 20 particles per square micrometer. Their presence confirms that the reduction process induced exsolution, wherein Co ions originally embedded in the perovskite lattice segregated to the surface and formed metallic nanoparticles. The distribution and anchoring of these nanoparticles suggest that the exsolution process was effective, indicating that they are likely to remain stable even at elevated temperatures. Although many studies report cobalt exsolution from perovskite oxides, it is difficult to directly compare nanoparticle size and distribution. Factors such as reduction temperature, gas atmosphere, partial pressure, treatment time, synthesis method, composition, and defect chemistry all influence these properties [
14]. As a result, reported particle sizes and densities often vary, even in similar systems. However, smaller nanoparticles are preferred because larger ones can destabilize the host structure during long, high-temperature treatment [
15].
It should be noted that nanoparticles tend to accumulate not only on flat grain surfaces but also along grain boundaries, as is typical for these systems. This location is generally considered an energetically favorable site for exsolution, as it often provides enhanced diffusion pathways and higher surface energy [
15,
16,
17]. This distribution could be beneficial for catalytic or electrochemical applications, as grain boundaries are often active sites for surface reactions.
2.2. XRD Results
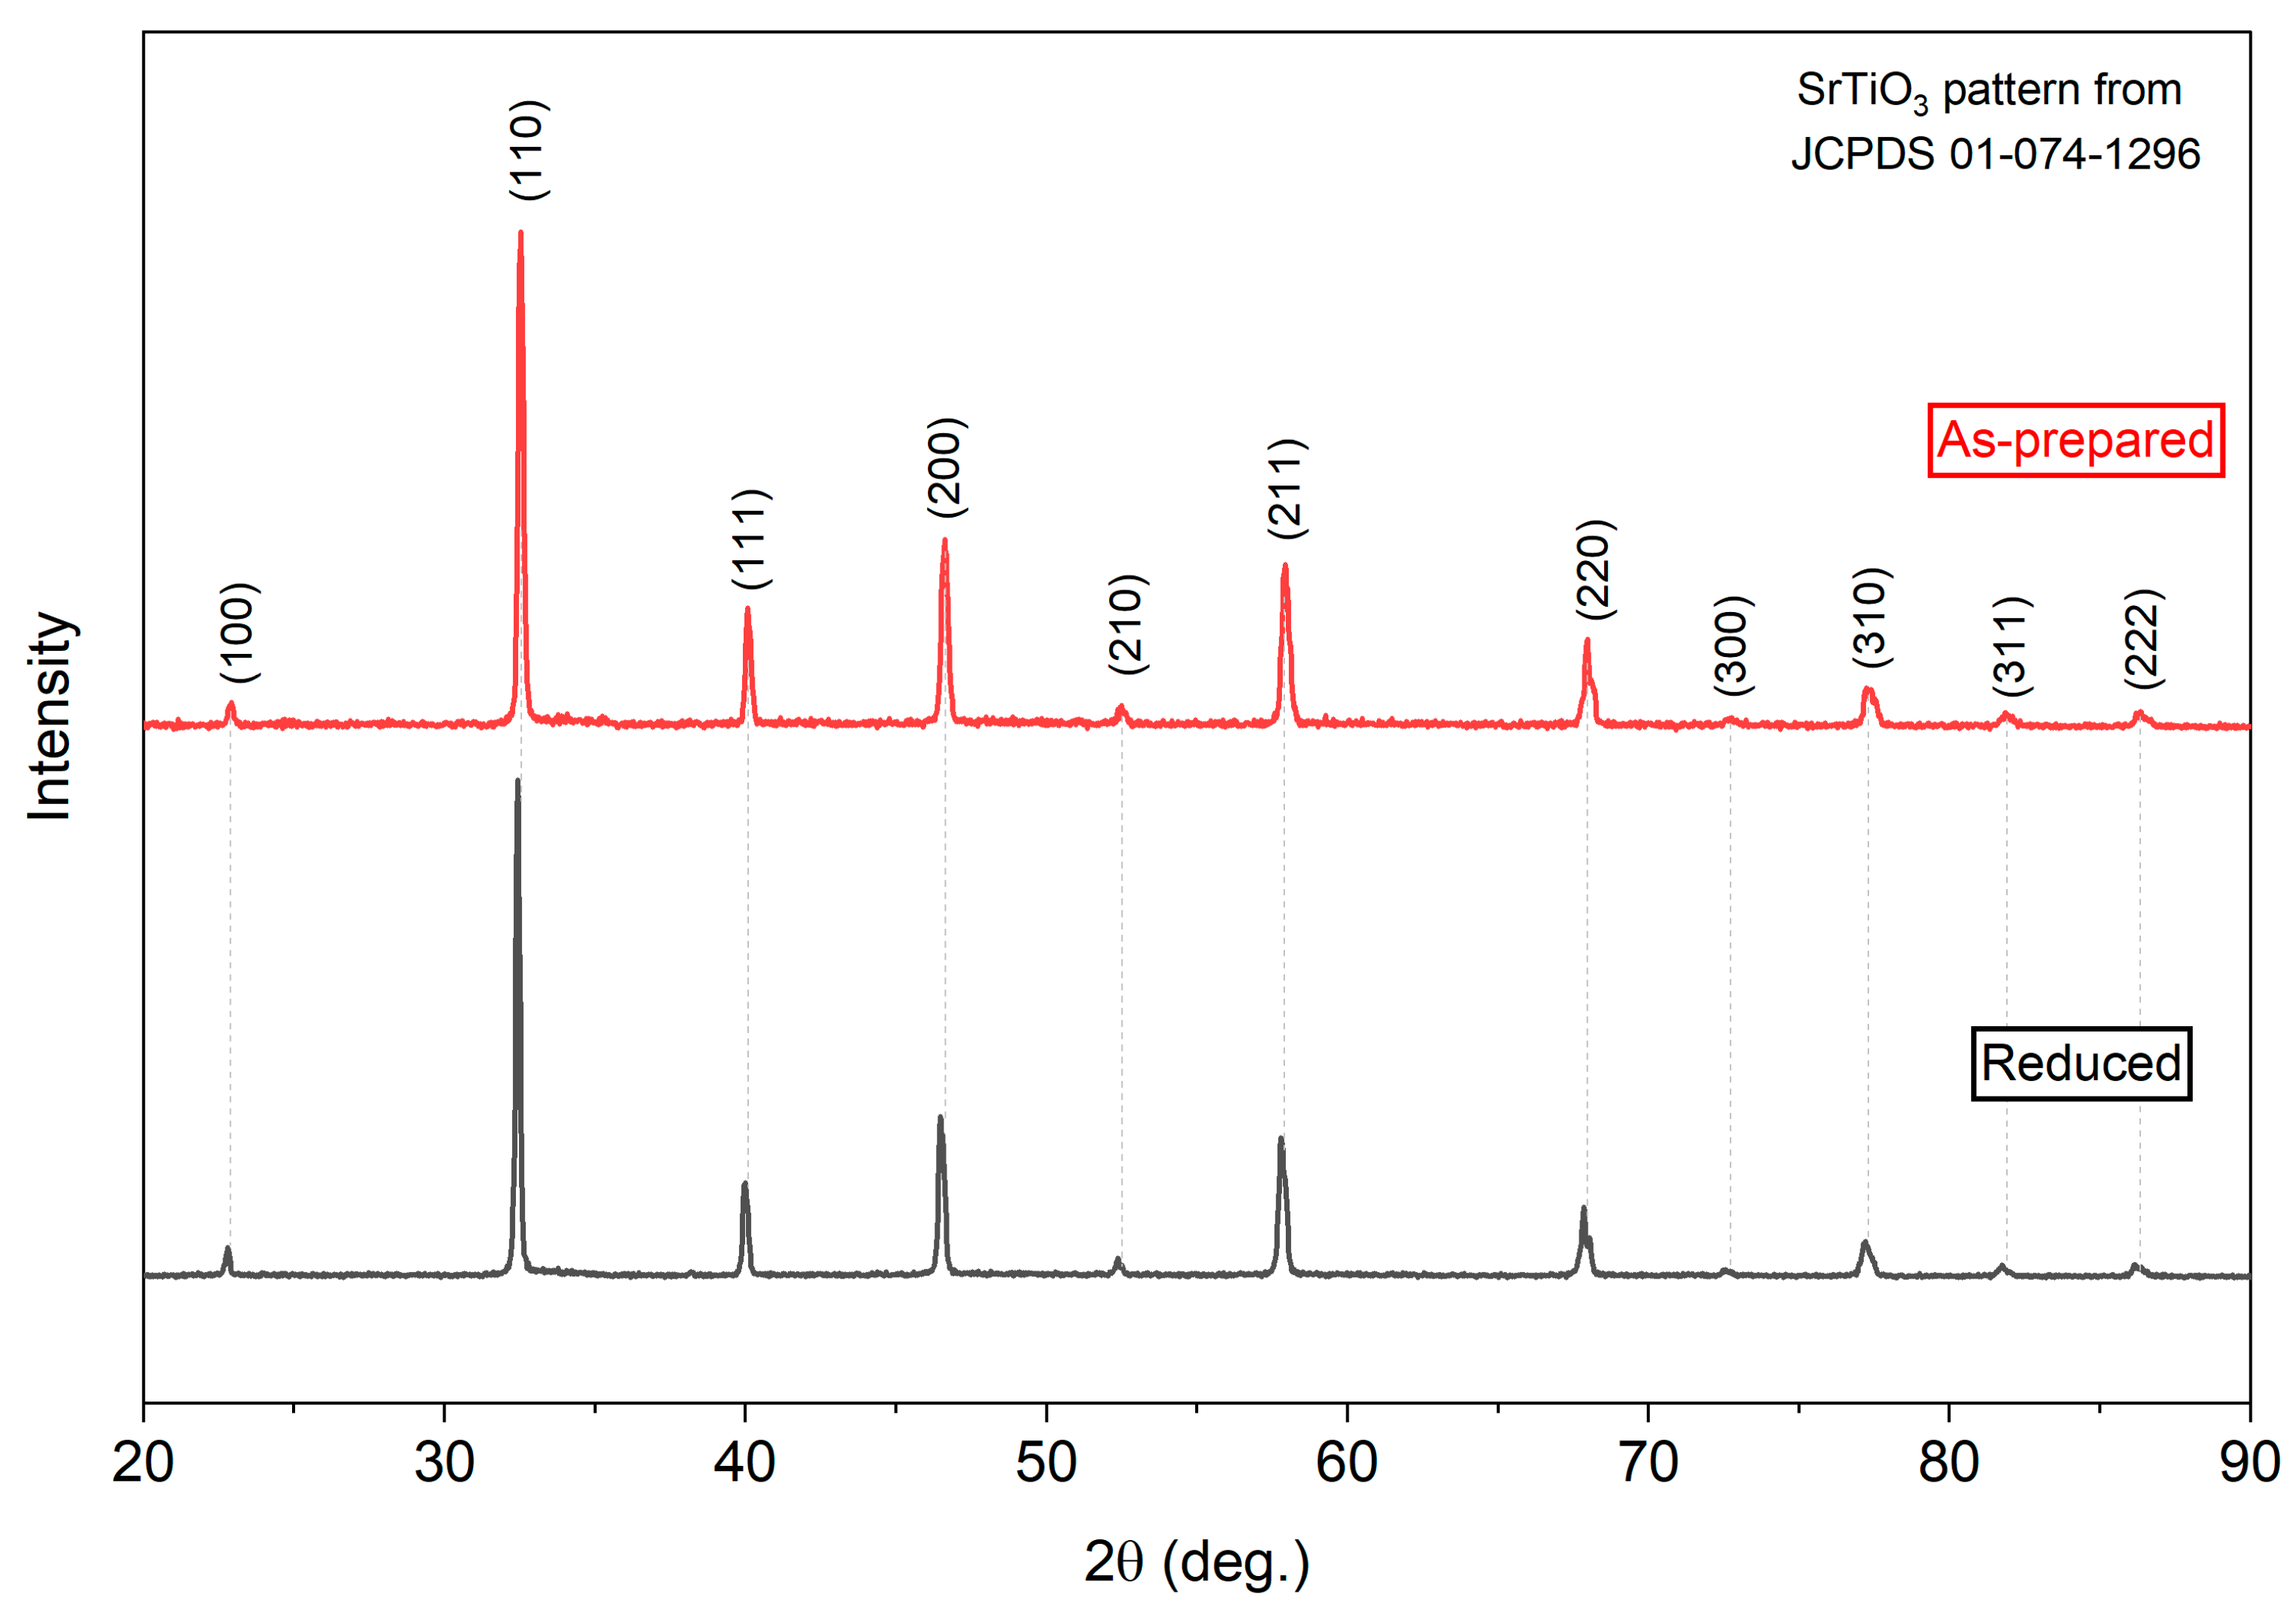
Figure 2 shows the XRD diffraction patterns of the LSCCoT sample before and after reduction in dry H
2 at 900 °C, while
Table 1 summarizes the unit cell parameters extracted from Rietveld refinement.
For both the as-prepared and reduced powders, only peaks corresponding to the perovskite phase with a cubic SrTiO3-type structure (indicated by the dashed lines) are observed, confirming that the material remains single-phase regardless of the reduction treatment. This agrees with the expected phase composition, since SrTiO3 is the dominant component in the LSCCoT sample and is known for its structural stability under both oxidizing and reducing conditions.
Nevertheless, subtle changes in the diffraction pattern were observed after the reduction process. The refined lattice parameter exhibits a marginal increase from 3.905 Å to 3.906 Å. However, this change remains within the experimental uncertainty of the measurement, and the observed difference could not be unambiguously attributed to any intrinsic modification of the perovskite lattice. Furthermore, the full width at half maximum (FWHM) of the diffraction peaks narrows after reduction (from 0.166° to 0.144°), suggesting an increase in crystallite size or a partial reduction in lattice strain. This observation is consistent with SEM results, which showed more uniform grains and well-defined grain boundaries after reduction.
The preservation of the single-phase perovskite structure, combined with signs of exsolution activity, suggests that LSCCoT maintains structural stability while allowing controlled generation of catalytically active nanoparticles, which is advantageous for SOFC anode applications.
2.3. Electrical Measurements
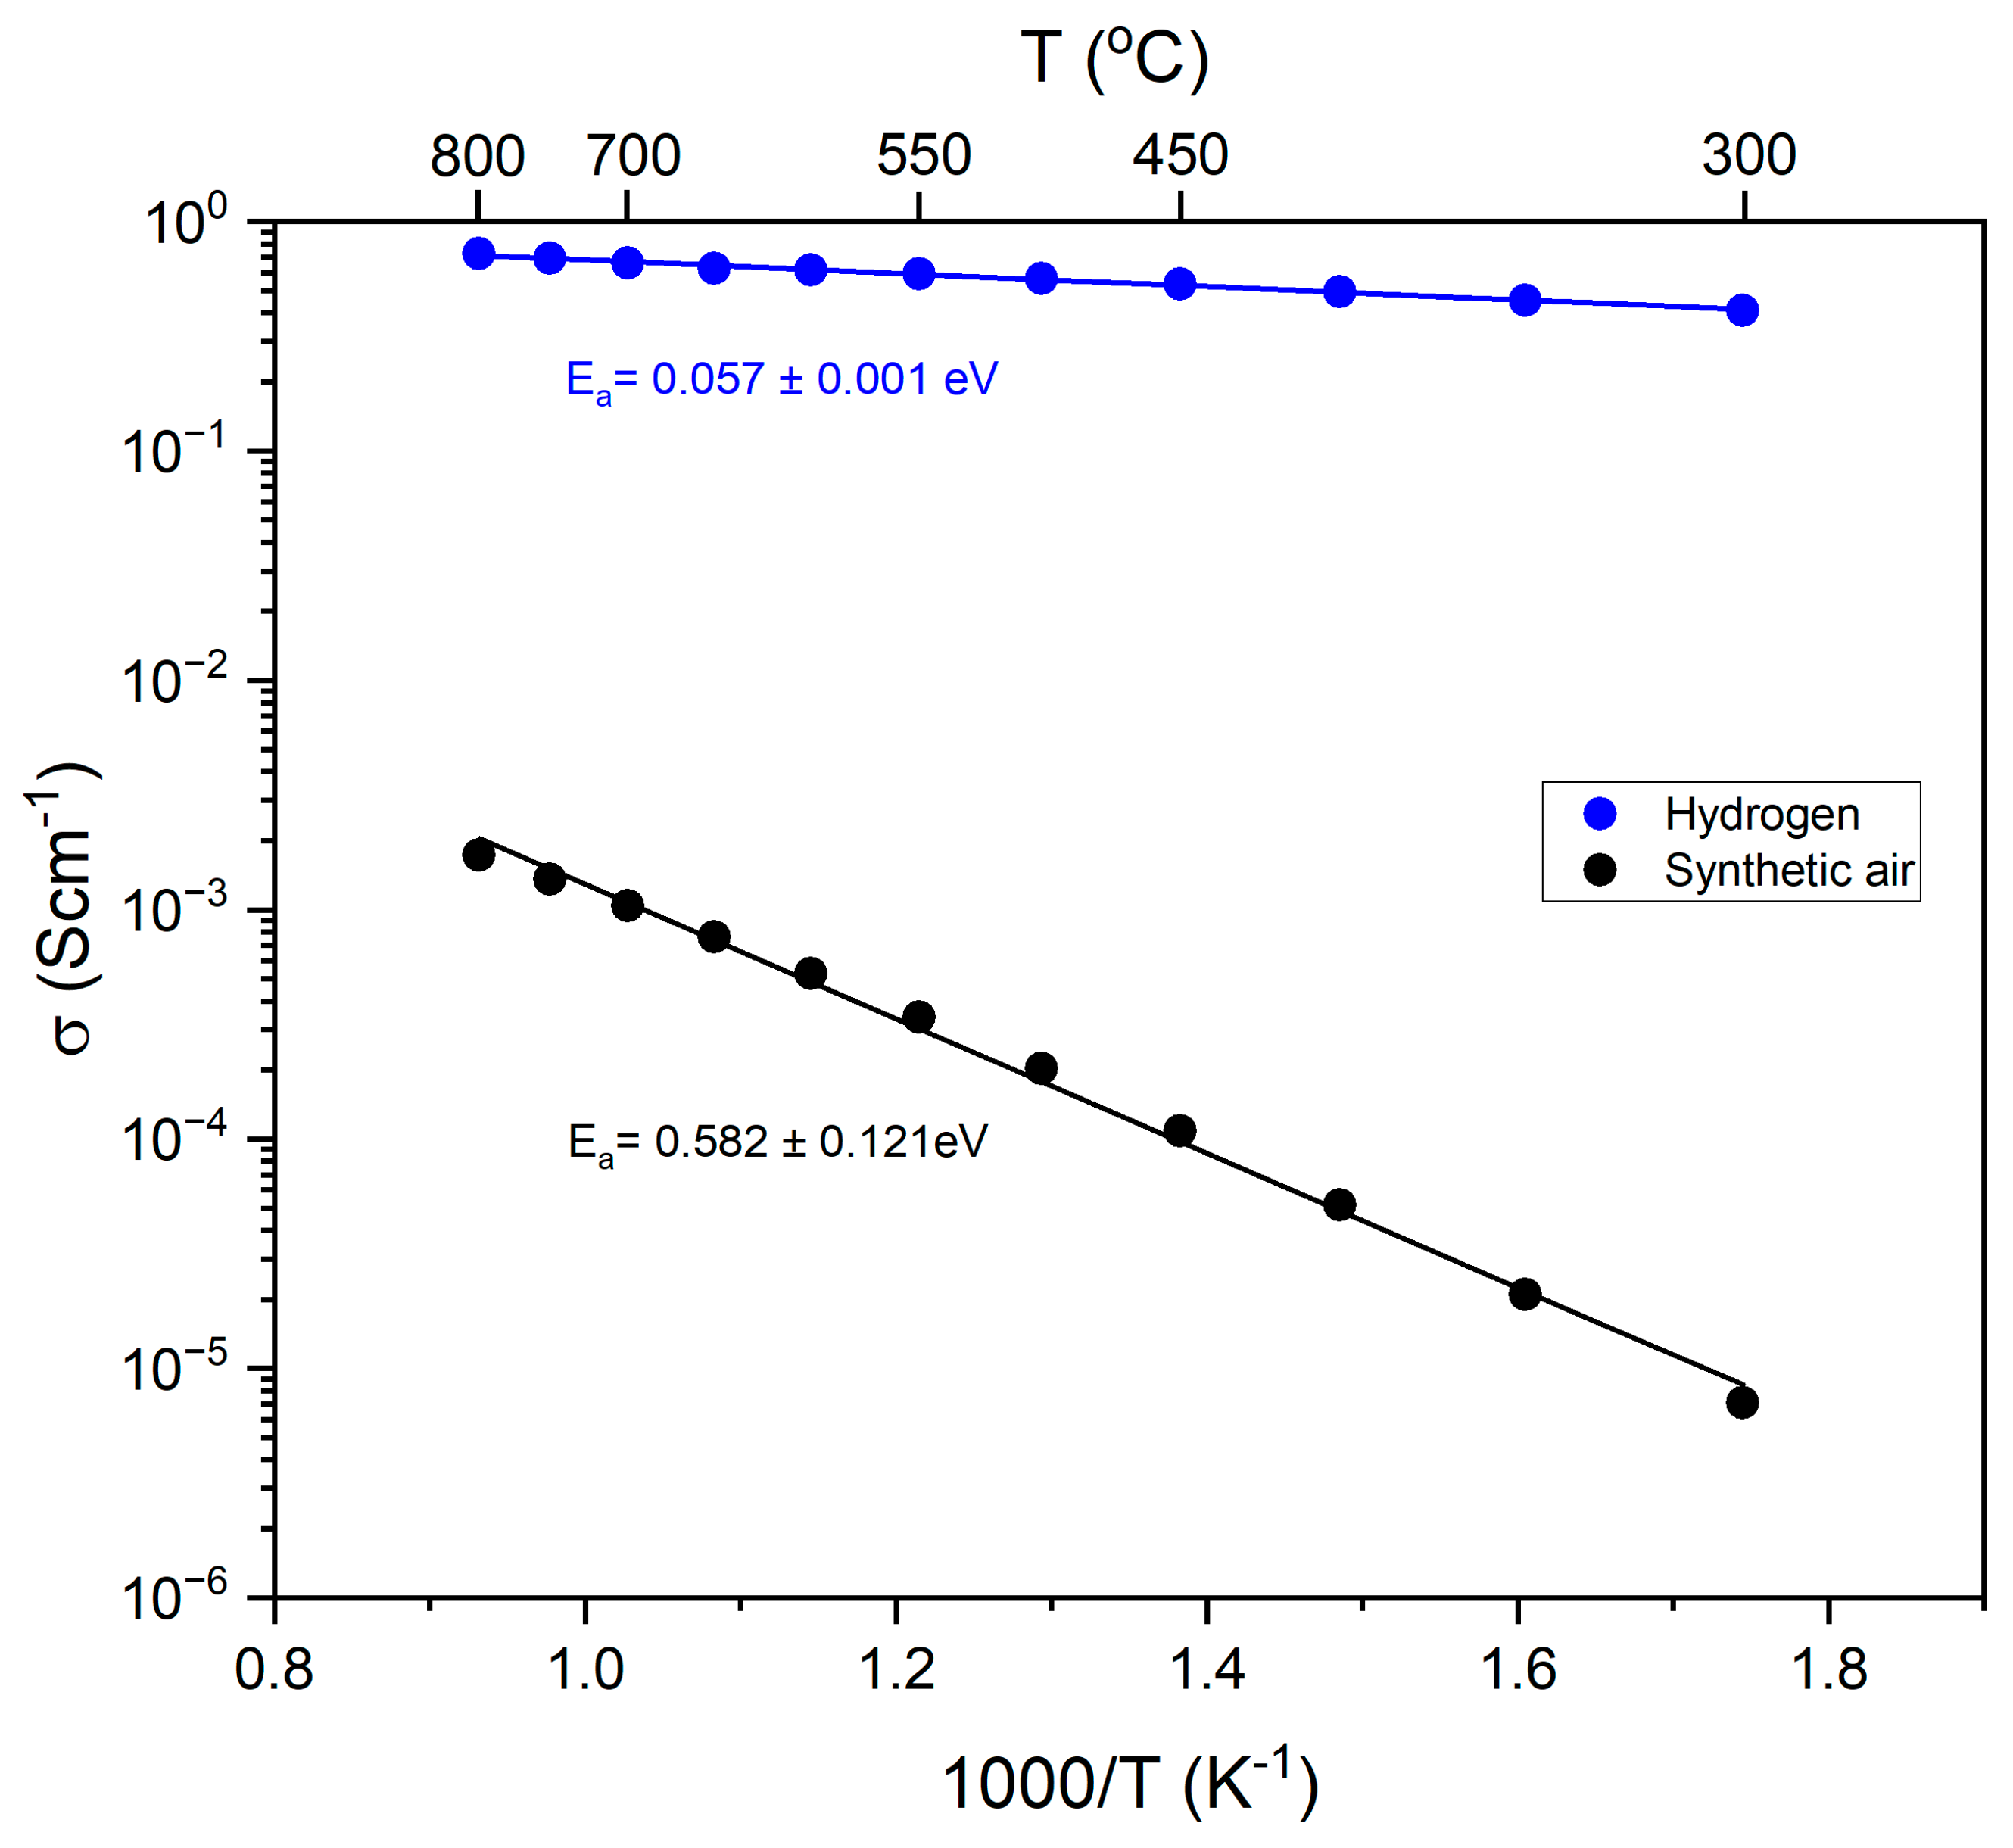
Figure 3 presents Arrhenius plots of the electrical conductivity of the LSCCoT dense pellet sample measured in synthetic air and in hydrogen.
In air, the LSCCoT sample exhibits thermally activated semiconducting behavior, with conductivity decreasing with decreasing temperature and an Arrhenius activation energy of E
a = 0.582 ± 0.121 eV. At 800 °C, the conductivity reaches σ = 1.67 × 10
−3 Scm
−1. Such behavior is characteristic of acceptor-doped, A-site-deficient SrTiO
3-based perovskites, where charge compensation involves both electronic carriers and oxygen-related point defects. In oxidizing conditions, the dominant charge carriers are electron holes and oxygen vacancies, indicating p-type conduction [
19,
20].
After a reduction in H
2, the electrical behavior changes significantly. The activation energy decreases to E
a = 0.057 ± 0.001 eV and the conductivity becomes only weakly temperature dependent, reaching σ = 0.724 Scm
−1 at 800 °C. This activation energy is extremely low compared to similar compounds reported in the literature. For example, M. Ke et al. synthesized cobalt-doped perovskite of composition La
0.5Sr
1.5Ti
1.5Co
0.5O
3−δ, where the activation energy was 0.324 eV [
21], indicating that chemical reactions in this compound will proceed more slowly. The significant increase in electrical conductivity after reduction can be caused by increased oxygen vacancy concentration and the generation of additional free electrons associated with the reduction in transition-metal cations. In a hydrogen atmosphere, oxygen is partially removed from the lattice, forming oxygen vacancies and releasing electrons. Simultaneously, partial reduction in Ti
4+ to Ti
3+ and Co cations to lower oxidation states increases the concentration of electronic charge carriers, enabling small polaron or metallic-like conduction, which improves n-type electronic transport [
21]. Additionally, the exsolution of cobalt nanoparticles on the surface enhances electronic transport by shortening charge carrier diffusion paths and creating additional conductive pathways [
22]. The formation of metallic nanoparticles effectively expands the electrochemically active region and facilitates faster electron transfer across the electrode. The examined compound also contains cerium, which exhibits mixed ionic-electronic conductivity and a reversible Ce
4+/Ce
3+ redox couple. As reported for Ce-doped titanates, cerium incorporation increases the concentration of oxygen vacancies and expands the electrochemically active reaction zone [
23,
24]. The combined effects of cobalt exsolution and cerium-induced defect chemistry contribute to the observed conductivity enhancement and the decrease in activation energy. Despite flattened σ(T) dependence, the transport remains semiconducting with near-metallic temperature dependence, which is typical for reduced SrTiO
3-based oxides with a high concentration of electronic carriers [
21].
It is crucial to highlight that electronic transport in doped SrTiO
3 systems is often discussed in terms of either small-polaron hopping or more delocalized, band-like conduction. Importantly, for SrTi
1−xFe
xO
3−δ, it has been reported that the electronic transport is better described as band-like rather than small-polaron hopping, particularly at elevated temperatures and high carrier concentrations [
25]. By analogy, the low activation energy and weak temperature dependence observed for reduced LSCCoT suggest a transition toward more delocalized electronic transport, driven by defect-induced band broadening and increased carrier density.
Additionally, SEM analysis confirms the exsolution of metallic Co nanoparticles on the surface of LSCCoT after H
2 reduction. It has been reported that exsolved metal nanoparticles in SrTiO
3-based materials could enhance electrical conductivity by providing highly conductive metallic pathways and by increasing the effective electronic carrier concentration in the perovskite matrix [
26]. The combined effects of electronic reduction in the oxide lattice and Co nanoparticle exsolution cause a large increase in conductivity and the small value of E
a observed after reduction.
2.4. Temperature-Dependent Cell Performance Tests
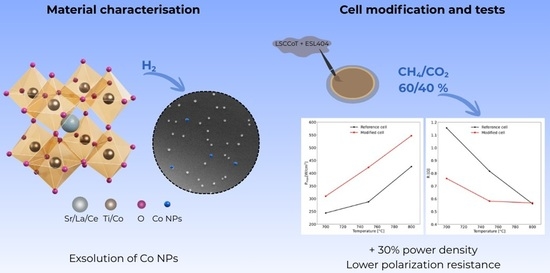
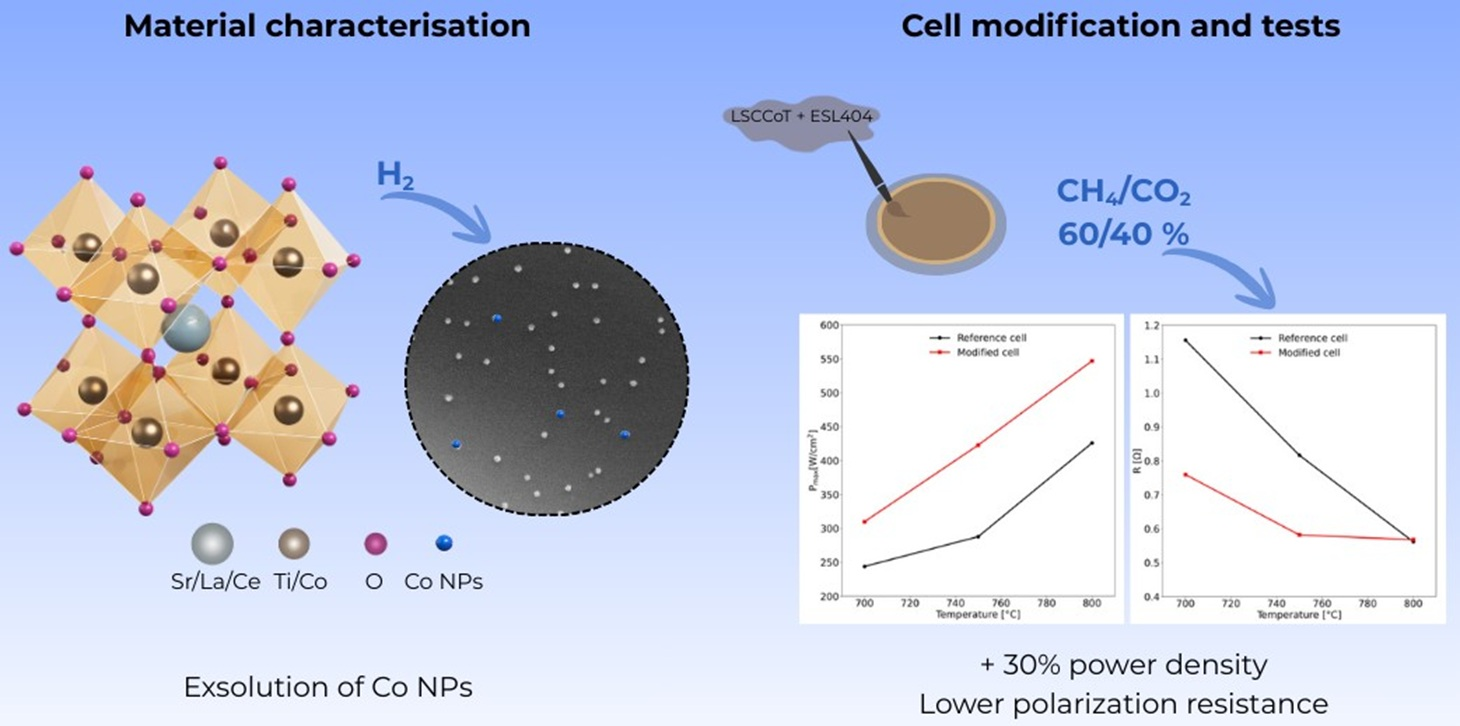
Next, the LSCCoT ceramic material was mixed with the ESL403 organic binder to fabricate a paste, which was then deposited on the Ni-YSZ anode side of the fuel cell. Then both the reference cell and a modified cell (with an LSCCoT layer) were investigated under SOFC operating conditions with 60% CH4 and 40% CO2 fuel at temperatures of 700–800 °C. Details of cell preparation and methodology are available in the Materials and Methods section of this manuscript.
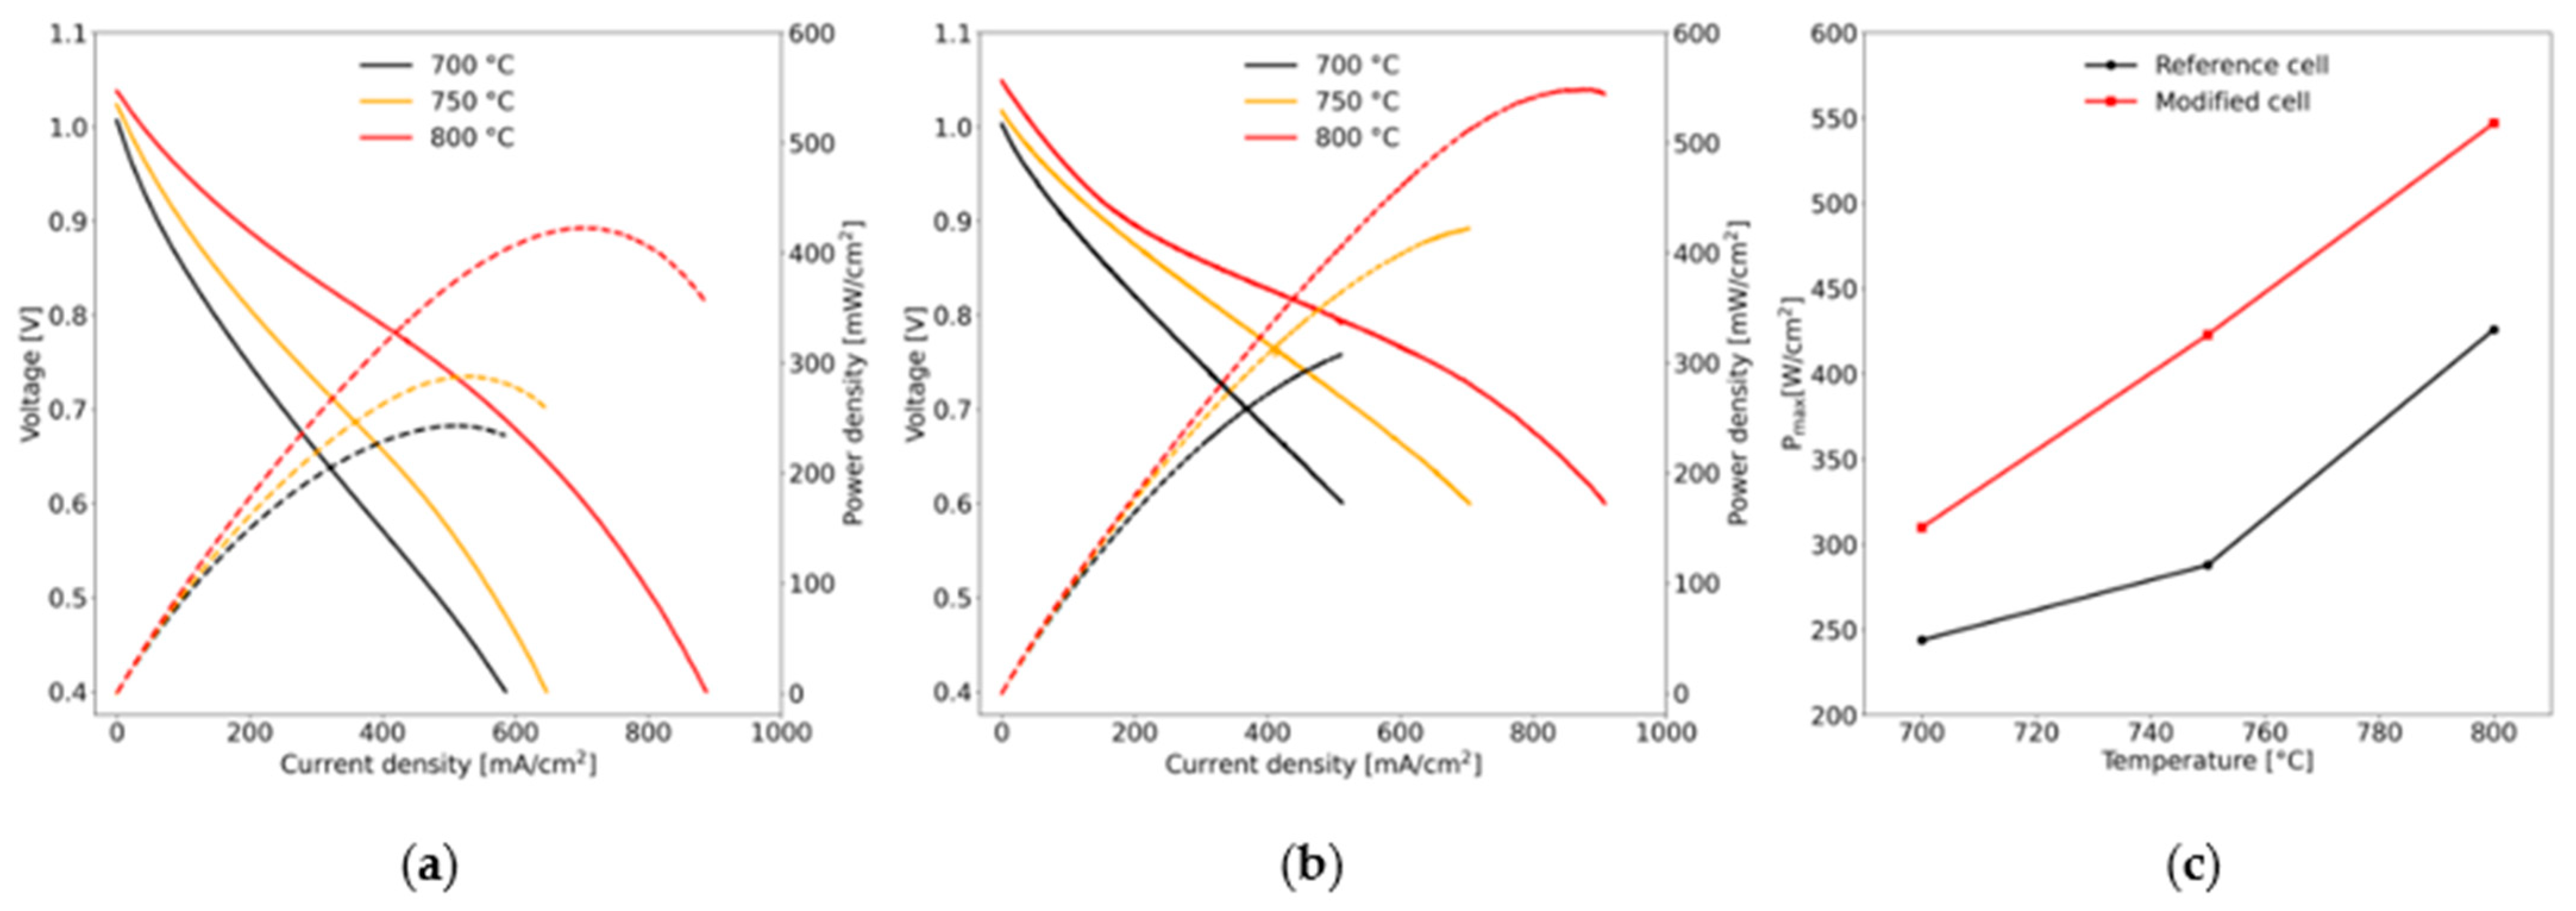
IV curves measured in the temperature regime are presented below. The Current–voltage function is drawn in solid, while the dotted line represents the power density function. The applied layer visibly increases the maximum power density and achievable current in the modified cell. The open-circuit voltage (OCV) of both cells decreases with increasing temperature, which appears counterintuitive given the Nernst equation alone. However, in biogas-fueled systems, this behavior is expected: lower temperatures suppress methane reforming kinetics, thereby reducing the amount of hydrogen available at the anode and lowering the effective OCV. The maximum power density increases noticeably with temperature (as shown in
Figure 4c), reaching 548 mW/cm
2 for the modified cell and 423 mW/cm
2 for the reference cell, yielding 30% increased power density for the modified system. The achieved peak power densities of biogas- and methane-containing fuels are competitive. For example, a direct-methane SOFC using wet CH
4 (3 vol% H
2O) reached a peak power density of 343 mW/cm
2 at 600 °C [
27]. In a CH
4/CO
2 (50/50%) dry-reforming SOFC, the peak power density was 420.1 mW/cm
2 at 800 °C before modification and 497.1 mW/cm
2 after adding an anode reforming layer [
28]. By comparison, hydrogen-fueled SOFCs often show higher peak power densities. These can approach or exceed 0.7 mW/cm
2, depending on the cell configuration, due to faster electrode kinetics and improved fuel utilization [
29].
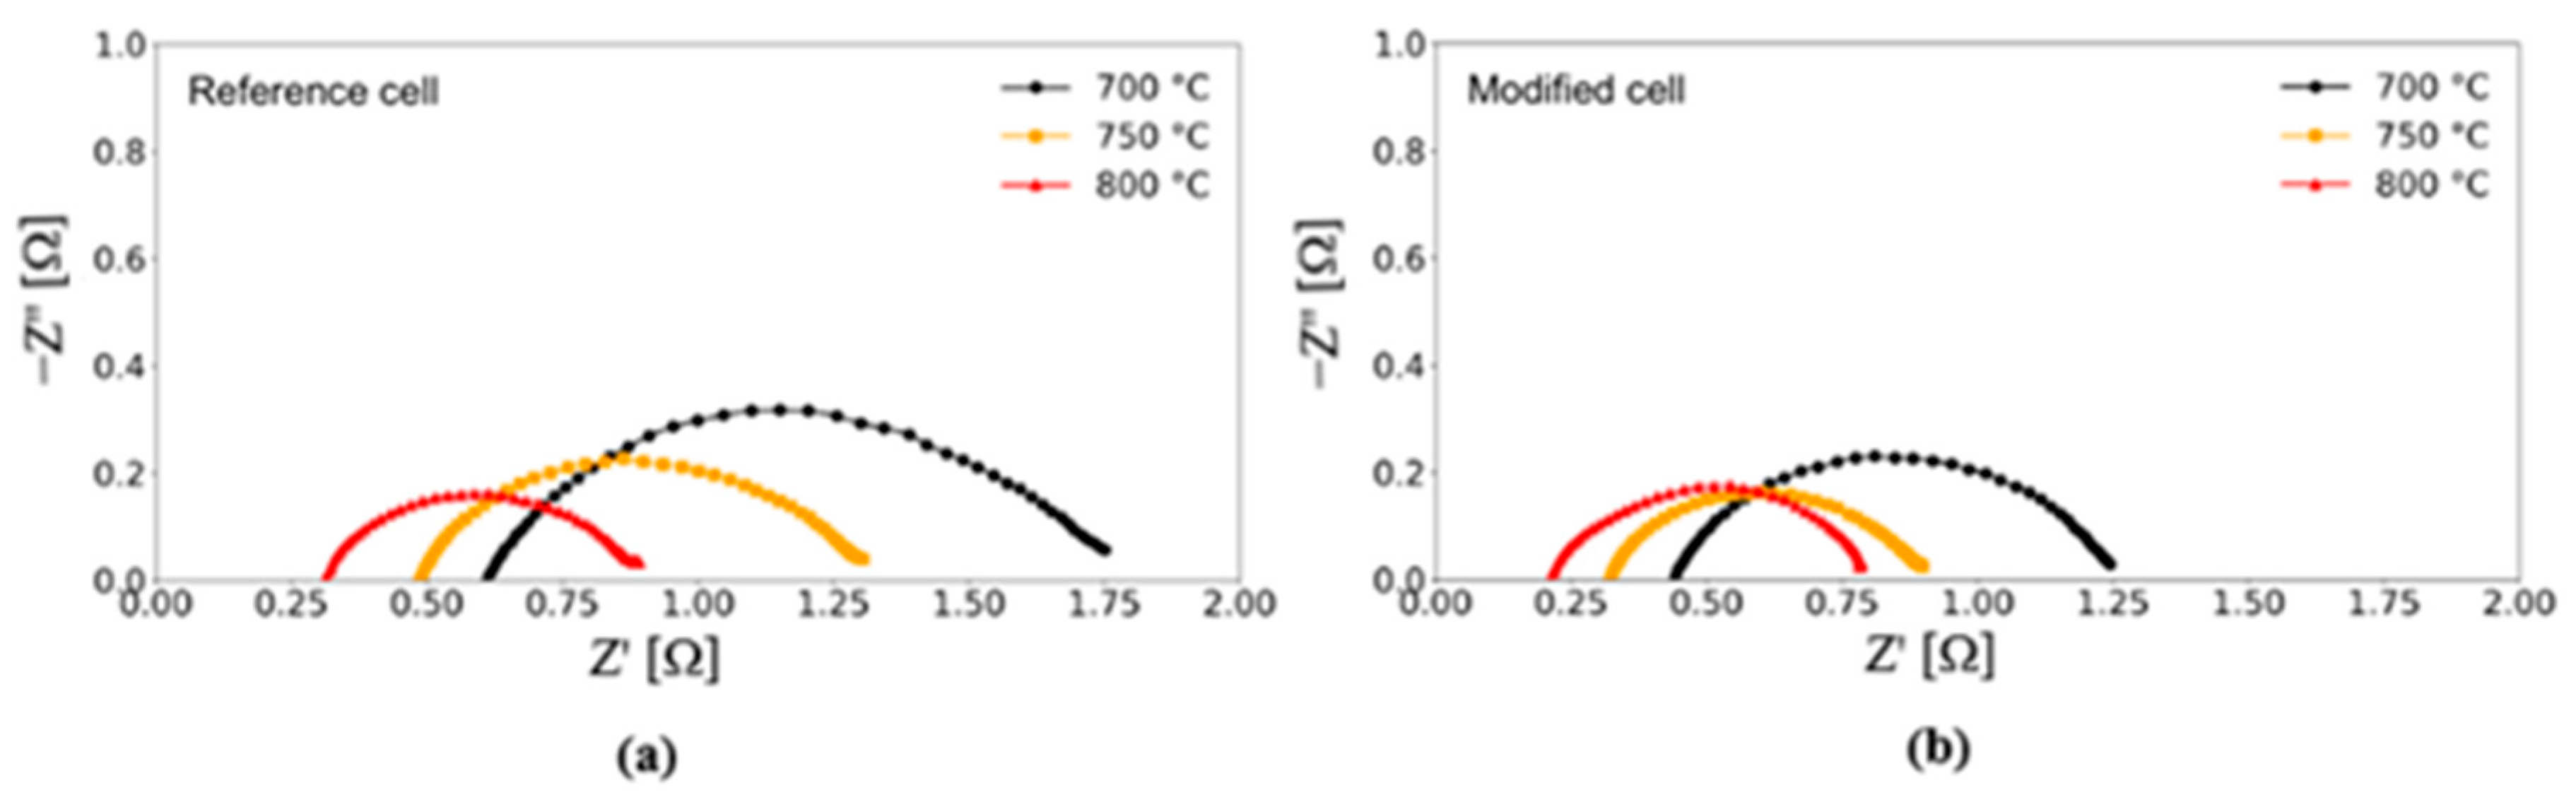
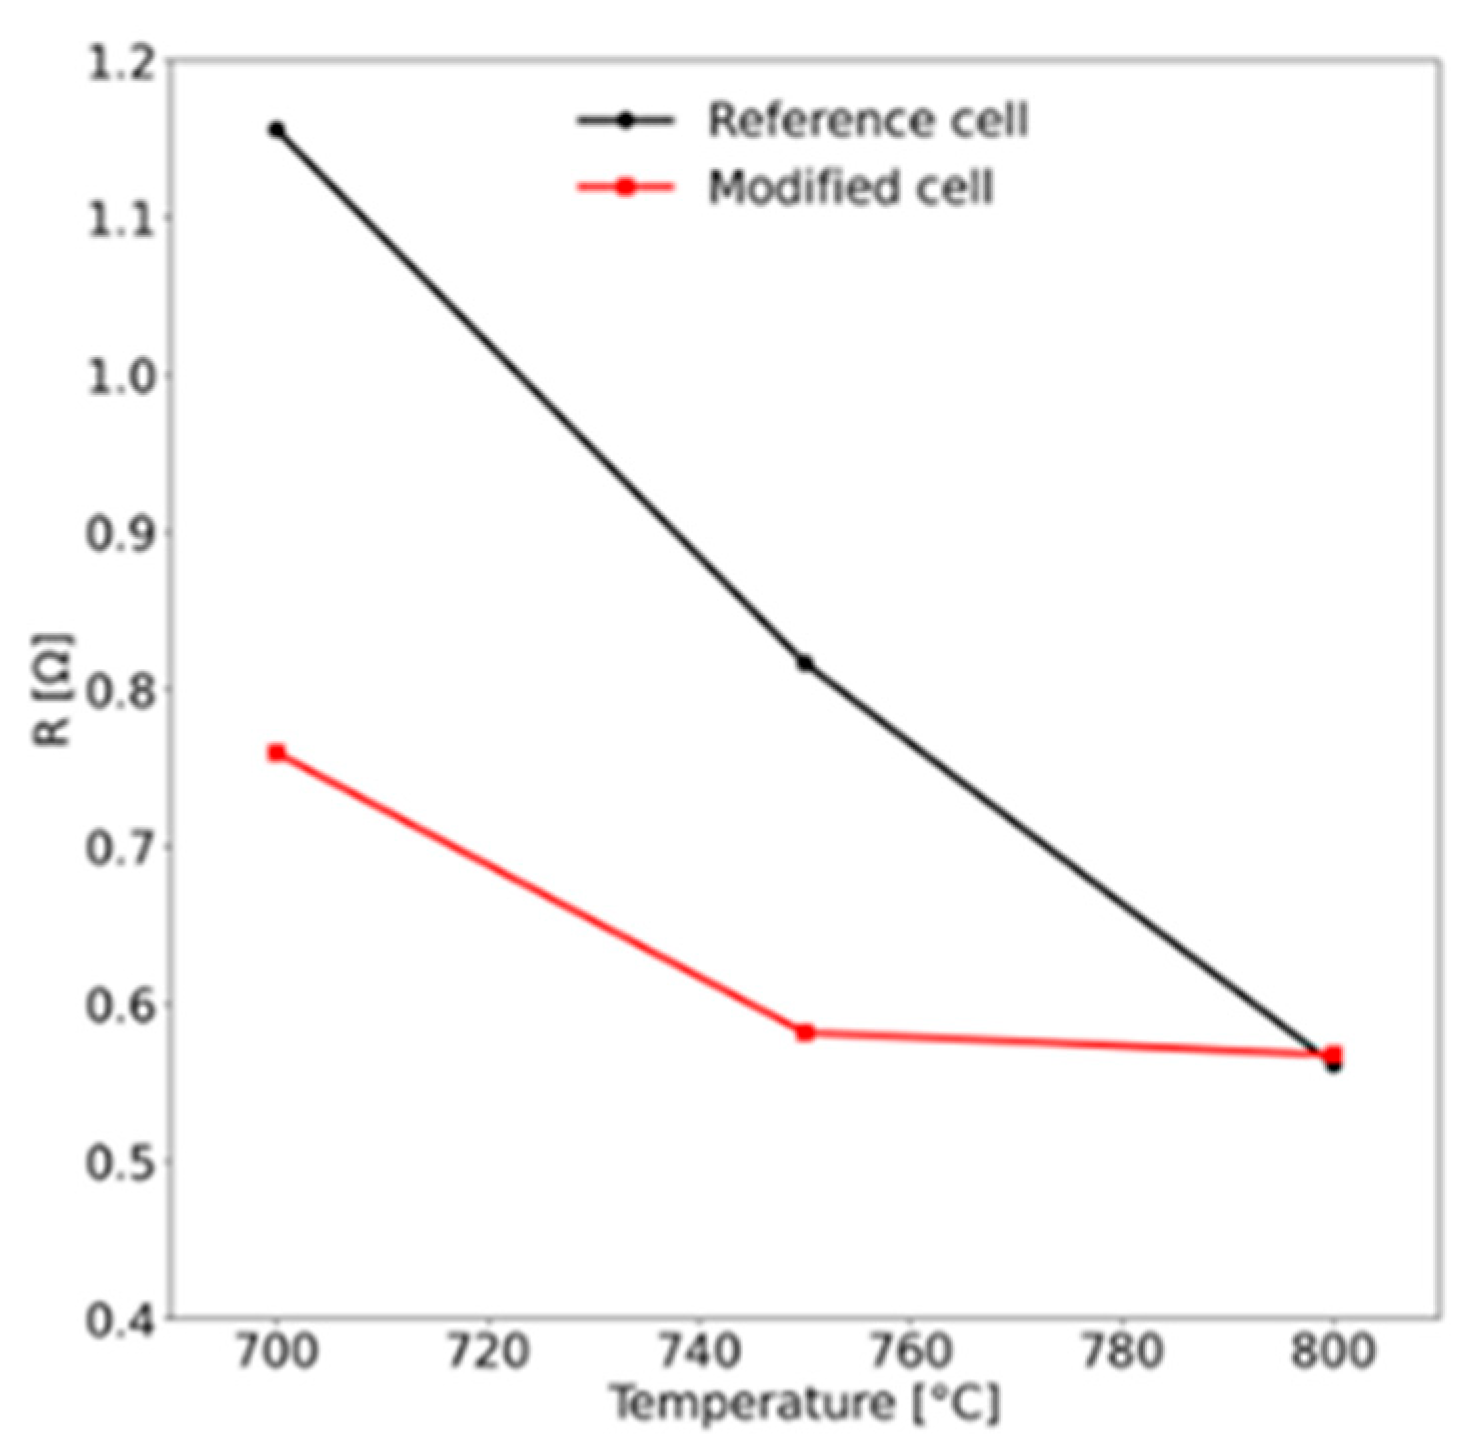
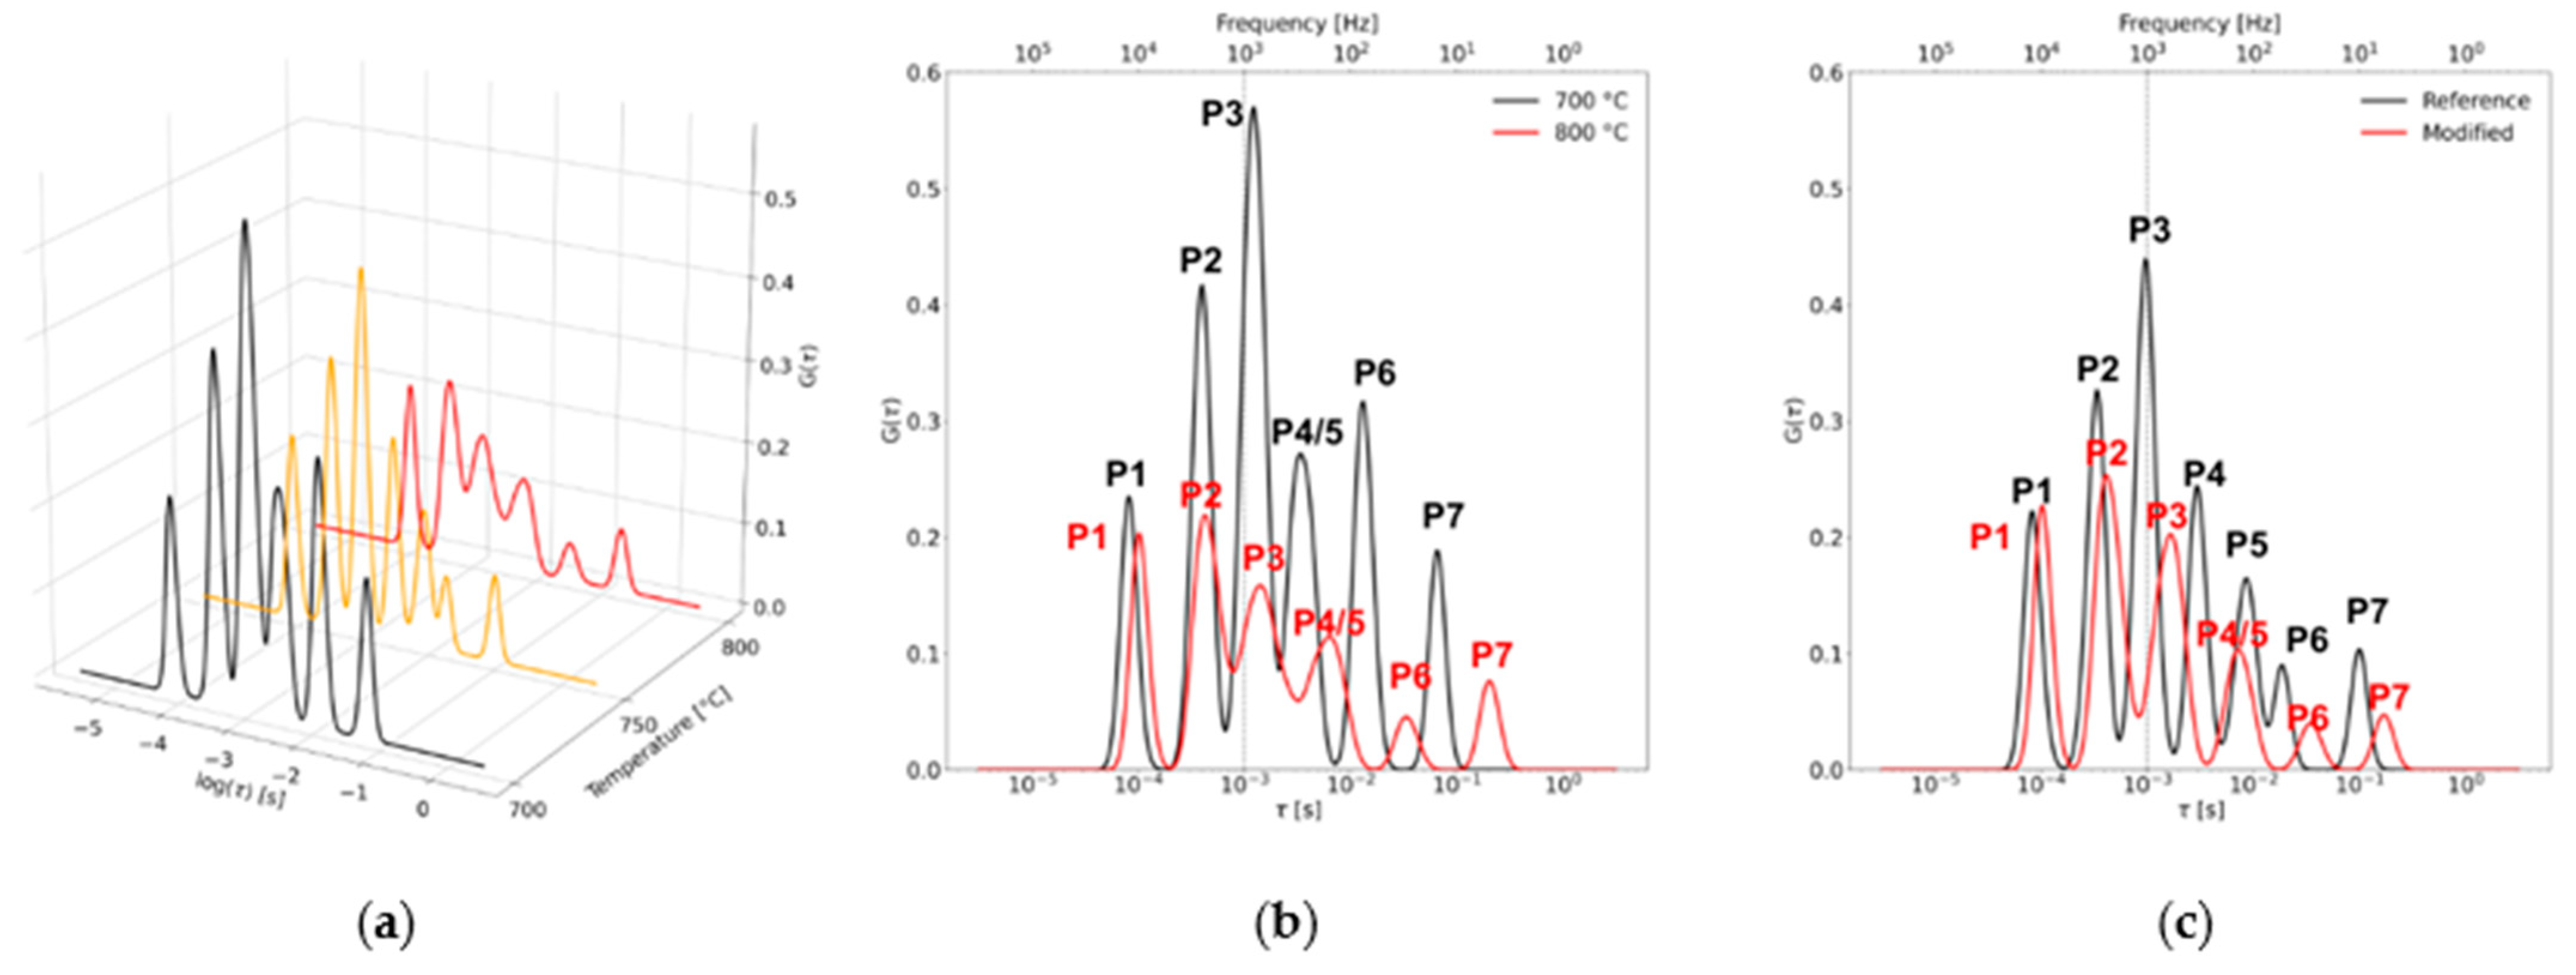
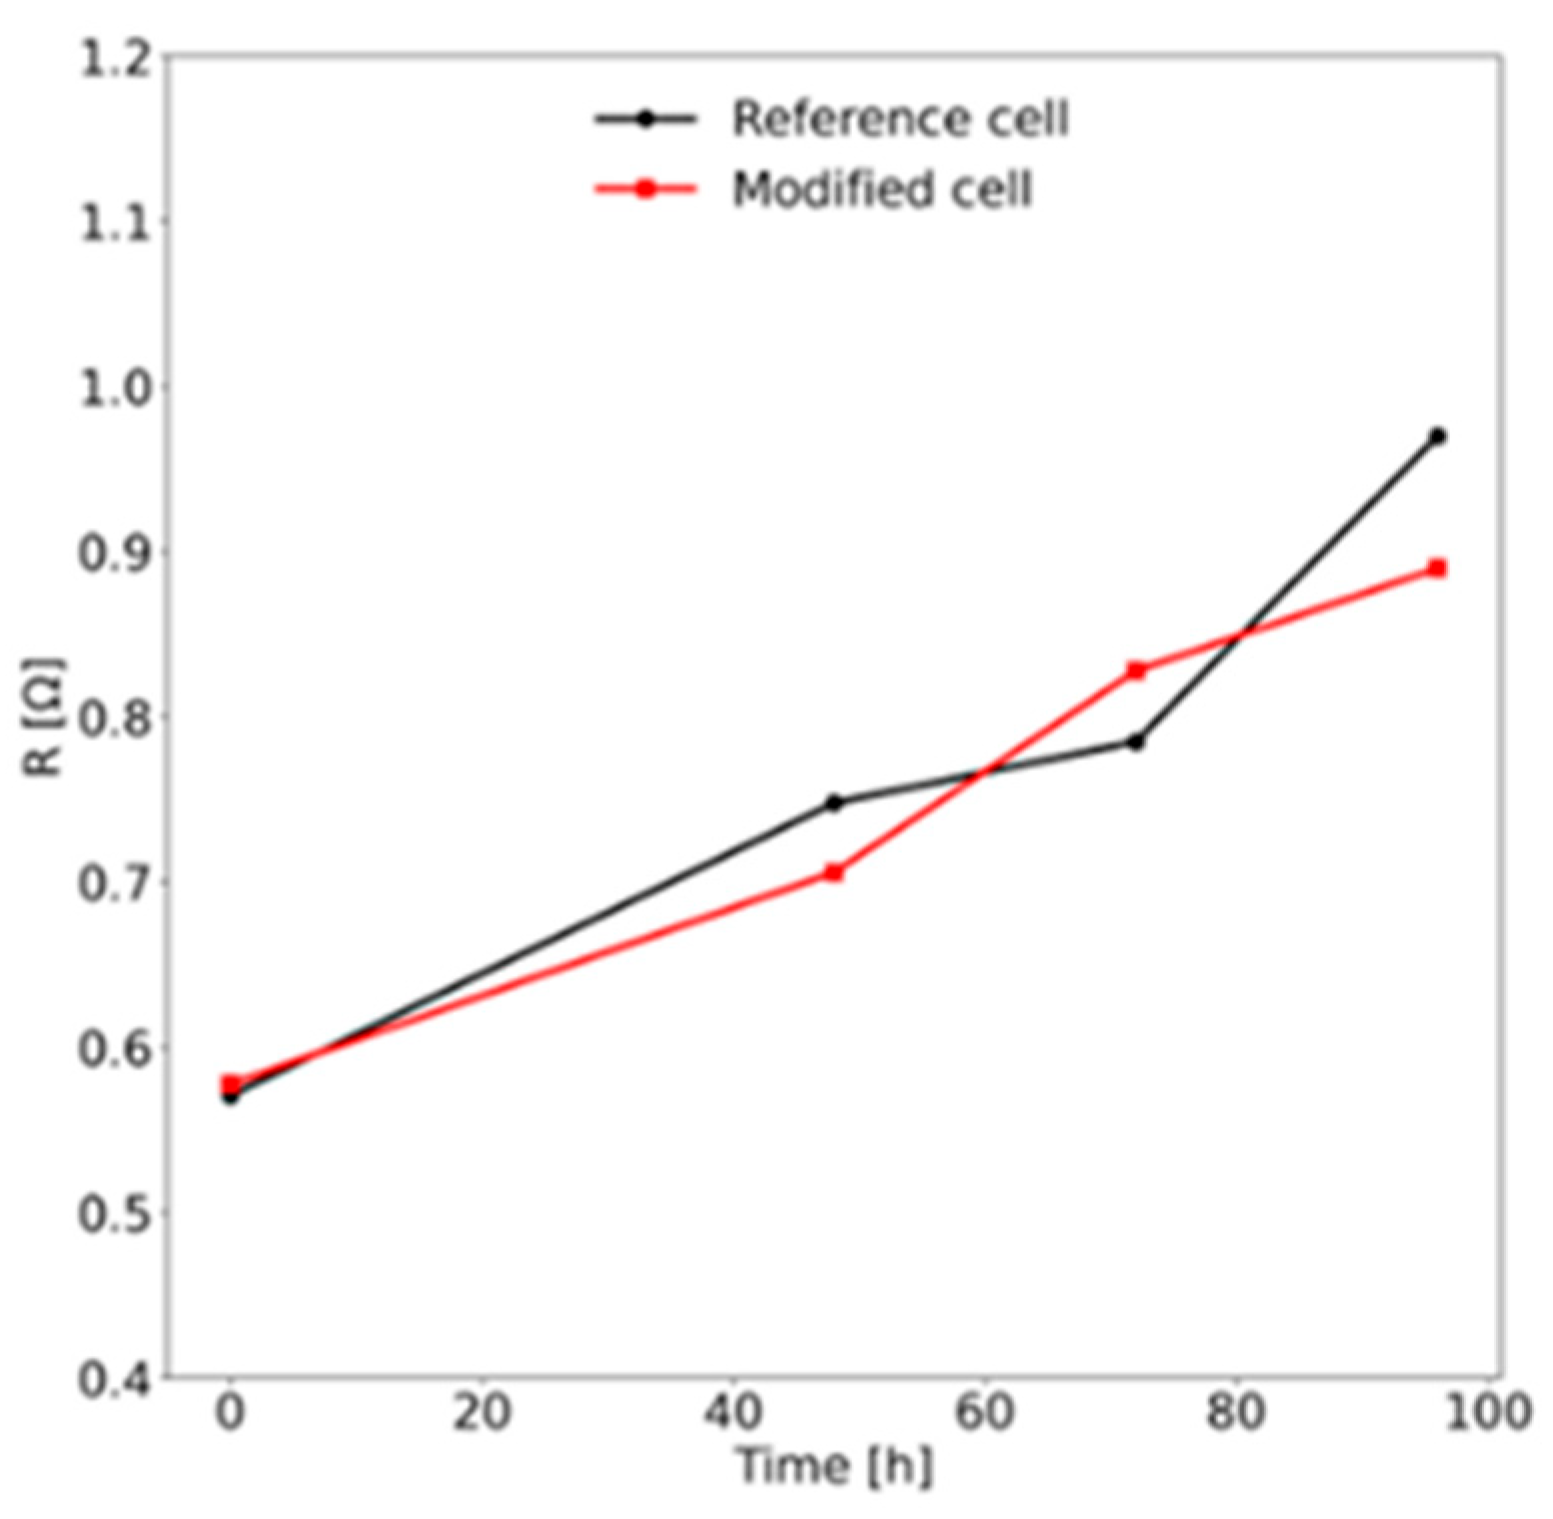
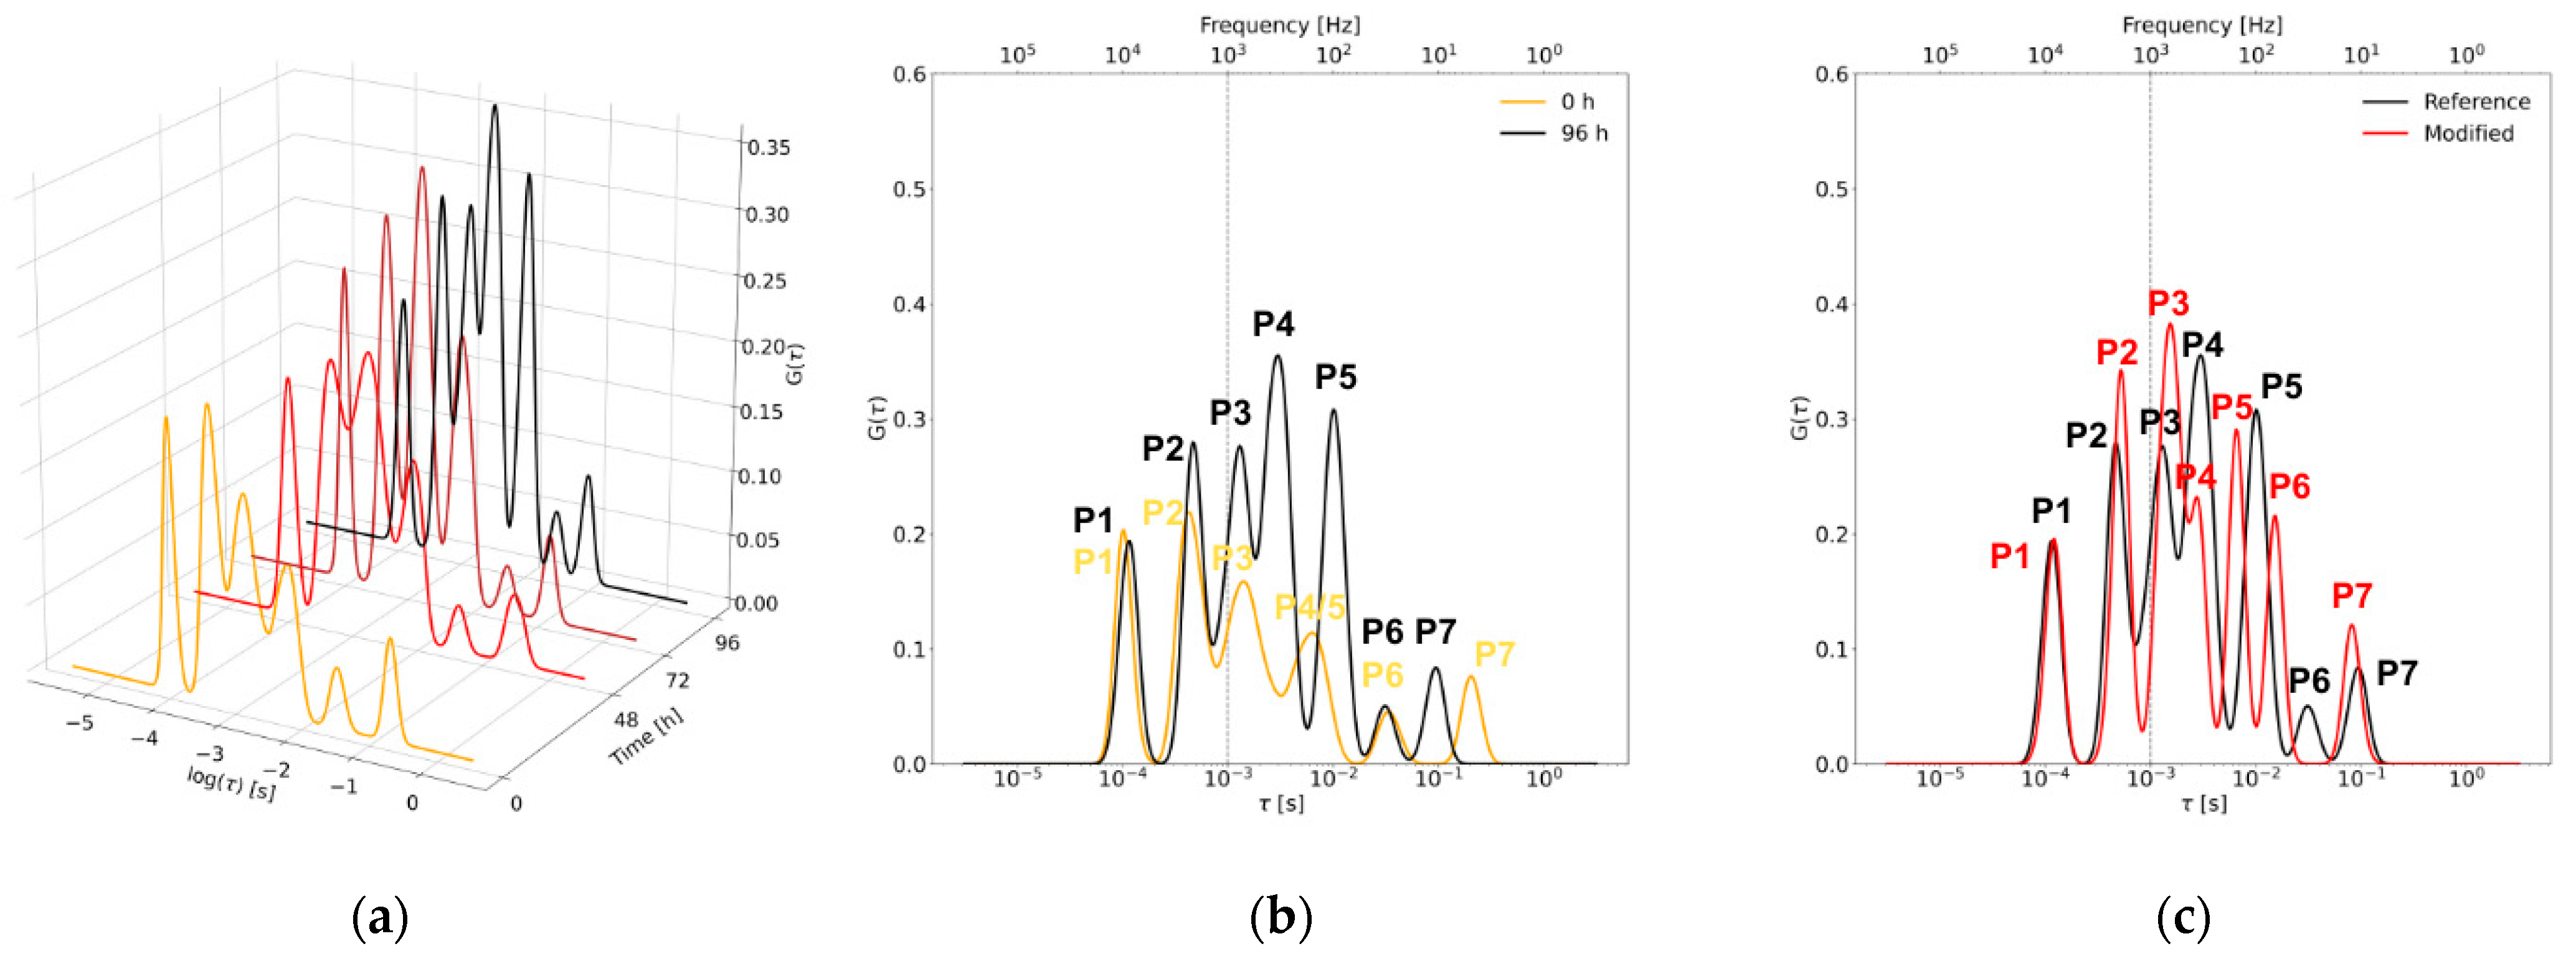
The electrochemical impedance spectroscopy (EIS) spectra and the corresponding distribution of relaxation times (DRT) analyses obtained across the tested temperature range are presented in
Figure 5,
Figure 6 and
Figure 7. The collected spectra indicate the presence of distinct transport phenomena occurring in the two samples. In general, the modified cell exhibits a lower overall polarization resistance, which further decreases with increasing temperature, consistent with semiconducting behavior. Upon careful examination of charge transfer processes in the samples via EIS in conjunction with DRT analysis, seven processes (denoted as P1–P7) were identified as being connected to electrochemical phenomena occurring at the electrodes. Notably, processes P4 and P5 are more clearly separated in the modified cell, whereas significant overlapping is observed in the reference cell. Detailed resistances associated with each process are summarized in
Table 2. The identified processes can be categorized into two distinct groups: processes P1–P3 and P4–P7, each exhibiting unique behaviors. The P1–P3 group processes demonstrate stability across the investigated temperature range, particularly in terms of their characteristic time constants. Furthermore, processes P1 and P2 exhibit consistent behavior between the two cells. Process P1 is characterized by a temperature-independent behavior, suggesting that it represents a saturated process within the temperature range of 700 °C to 800 °C. In contrast, all other investigated processes (P2–P7) display a strong temperature dependency. The applied modification significantly reduces losses, especially in processes P2 and P3, thereby contributing to an overall decrease in polarization resistance. This reduction in resistance highlights the effectiveness of the modification in enhancing the electrochemical performance of the cell, underlining its potential for improved efficiency in practical applications. DRT peak assignment in SOFC systems with CH4-CO
2 atmospheres is complex, primarily because electrochemical and catalytic processes often overlap. Building on this, previous impedance studies on biogas-fueled SOFCs show that the medium and low frequency range can involve multiple processes, such as reforming reactions, adsorption/desorption, gas diffusion, and charge transfer [
30]. Given these overlaps, the assignment of individual peaks in this study reflects dominant contributions rather than exclusive elementary processes.
2.5. Time-Dependent (Degradation) Cell Performance Tests
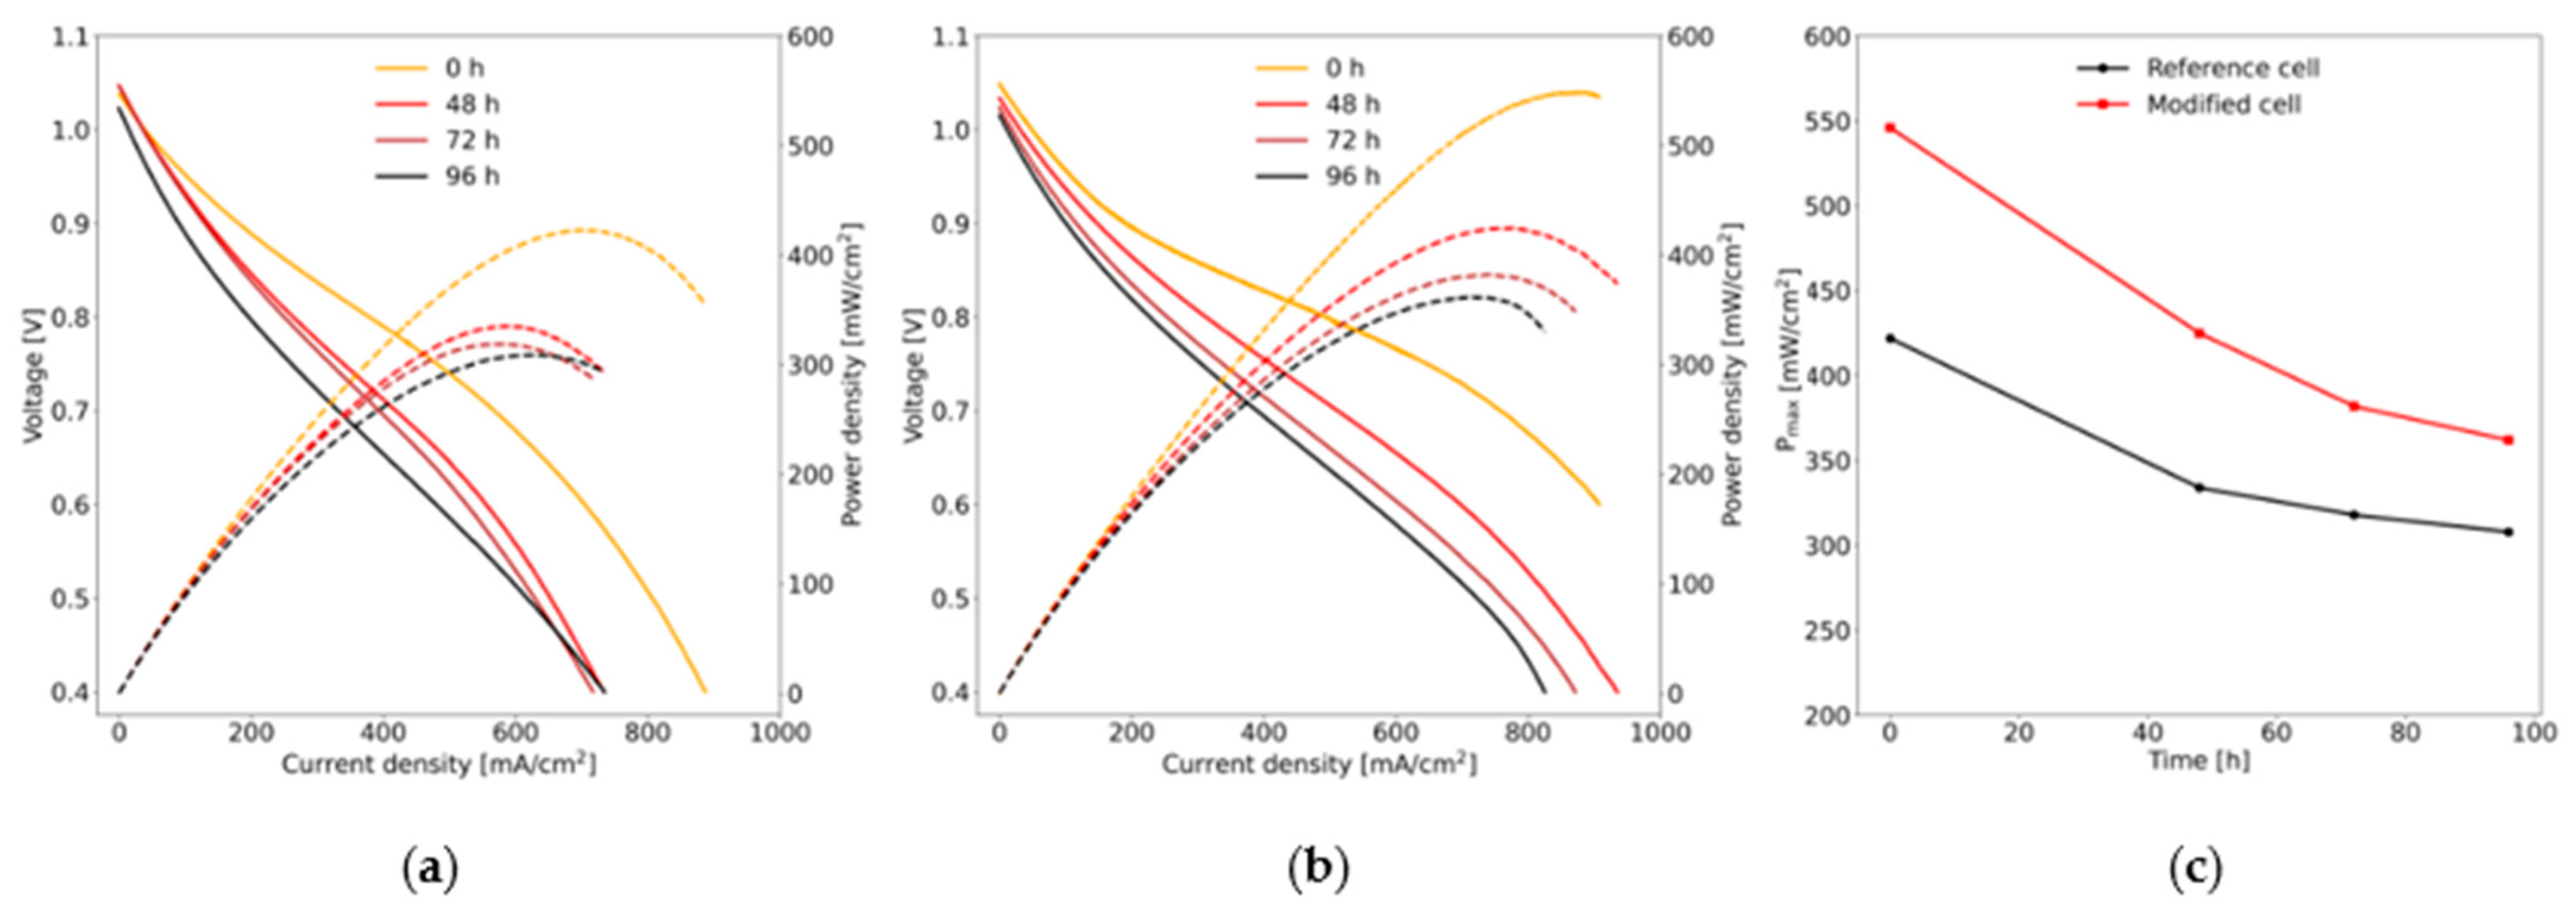
The I–V curves for biogas-fuelled operation in the time regime are shown in
Figure 8.
As anticipated in biogas operations, the degradation rate is pronounced, particularly for the unmodified cell.
Figure 8a shows that the power density of the reference cell exhibited a sharp decline after approximately 48 h, stabilizing at this reduced level for the remainder of the testing period. This rapid degradation underscores the inherent vulnerabilities of the unmodified cell under biogas conditions. In contrast, the degradation of the protected cell (
Figure 8b) occurred at a significantly slower rate, characterized by distinct step-like changes observed throughout the operational period. After 96 h of operation, the maximum power density recorded for the modified cell was 363 mW/cm
2, representing a 17% increase compared to the reference cell following degradation. This enhancement in power density illustrates the effectiveness of the modifications in mitigating performance loss over time.
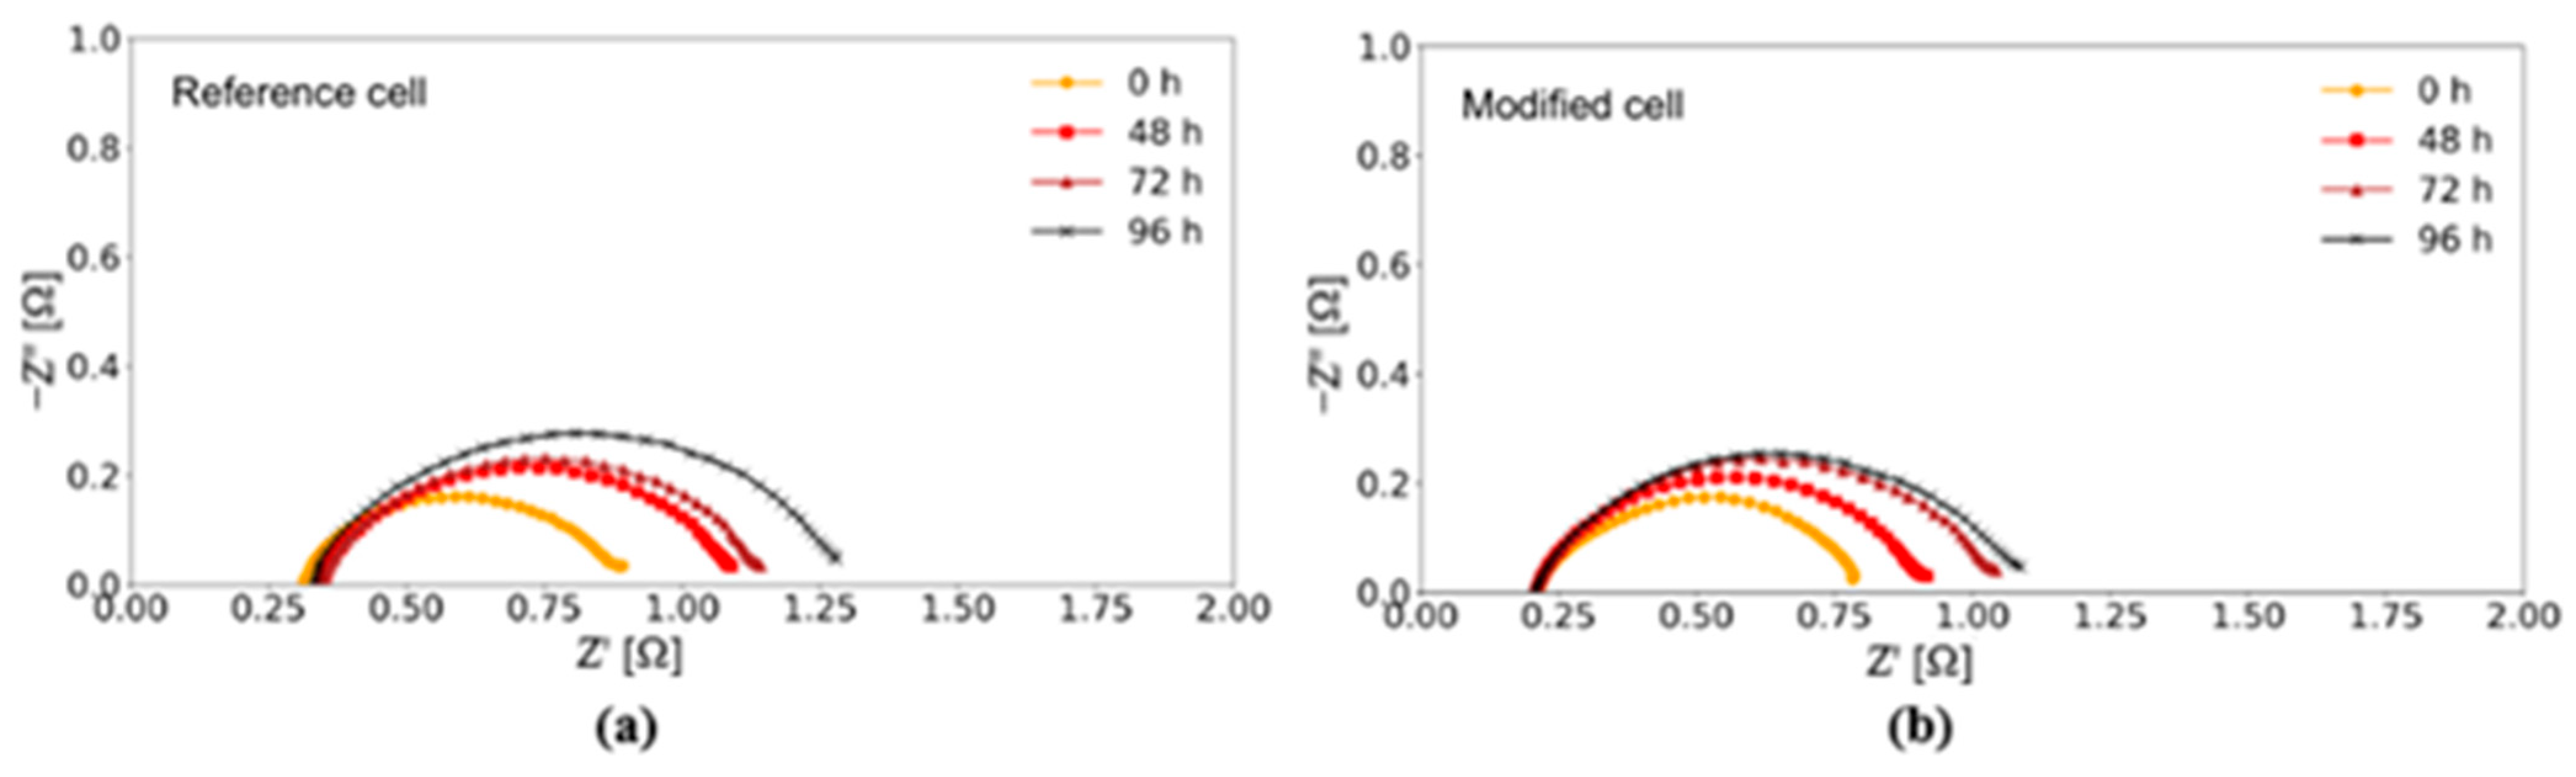
Figure 9 and
Figure 10 show that the electrochemical impedance spectroscopy (EIS) results and the corresponding distribution of relaxation times (DRT) spectra presented in
Figure 11 are well aligned with observations made during temperature regime studies, thereby reinforcing the validity of the seven-process model. However, due to changes in system chemistry and morphology during operation, as confirmed by post-mortem scanning electron microscopy (SEM), it becomes challenging to distinctly identify the specific processes responsible for the enhanced performance of the modified cell. During prolonged operation, high-frequency processes (P1 and P2) appear to be nearly time-independent in terms of their time constants and resistances. Process P6 exhibits a similar stability in the reference cell. Notably, processes P4 and P5 demonstrate a clear separation after 96 h of operation, indicating simultaneous increases and decreases in the time constants of both P4 and P5. The applied anode modification primarily preserves processes P1 and P2, which are linked to cathodic phenomena, as well as to some extent, process P5. As summarized in
Table 3, processes P3 and P4/P5 are chiefly responsible for the increasing cell resistance, which indicates degradation-related phenomena occurring at the biogas-exposed anode. The progressive increase in P3 and P4/5 during long-term operation is consistent with previous impedance studies on biogas-fueled SOFCs. In these studies, degradation is linked to changes in reforming kinetics, surface chemistry evolution, and mass-transport limitations rather than solely to charge-transfer resistance [
30]. Remarkably, the contribution of processes P4 and P5 is over two times smaller in the modified cell, highlighting their crucial role in the degradation of the reference cell. This observation suggests a choking point in the described system, further illustrating the advantages conferred by the modification.
In the modified cell, process P3 remains relatively stable after 48 h, suggesting that the system stabilizes following a reaction between the anode and the applied layer material. This stability indicates effective interaction between the anode and the modification layer, suggesting that the applied modifications enhance the robustness of the cell under biogas exposure. Collectively, these findings elucidate the complex interplay of processes governing cell performance and degradation. They underscore the potential for further optimization, paving the way for advancements in fuel cell technology that can enhance durability and efficiency in practical applications. The results not only reinforce the effectiveness of the modifications but also provide valuable insights into future research aimed at improving biogas fuel cells.
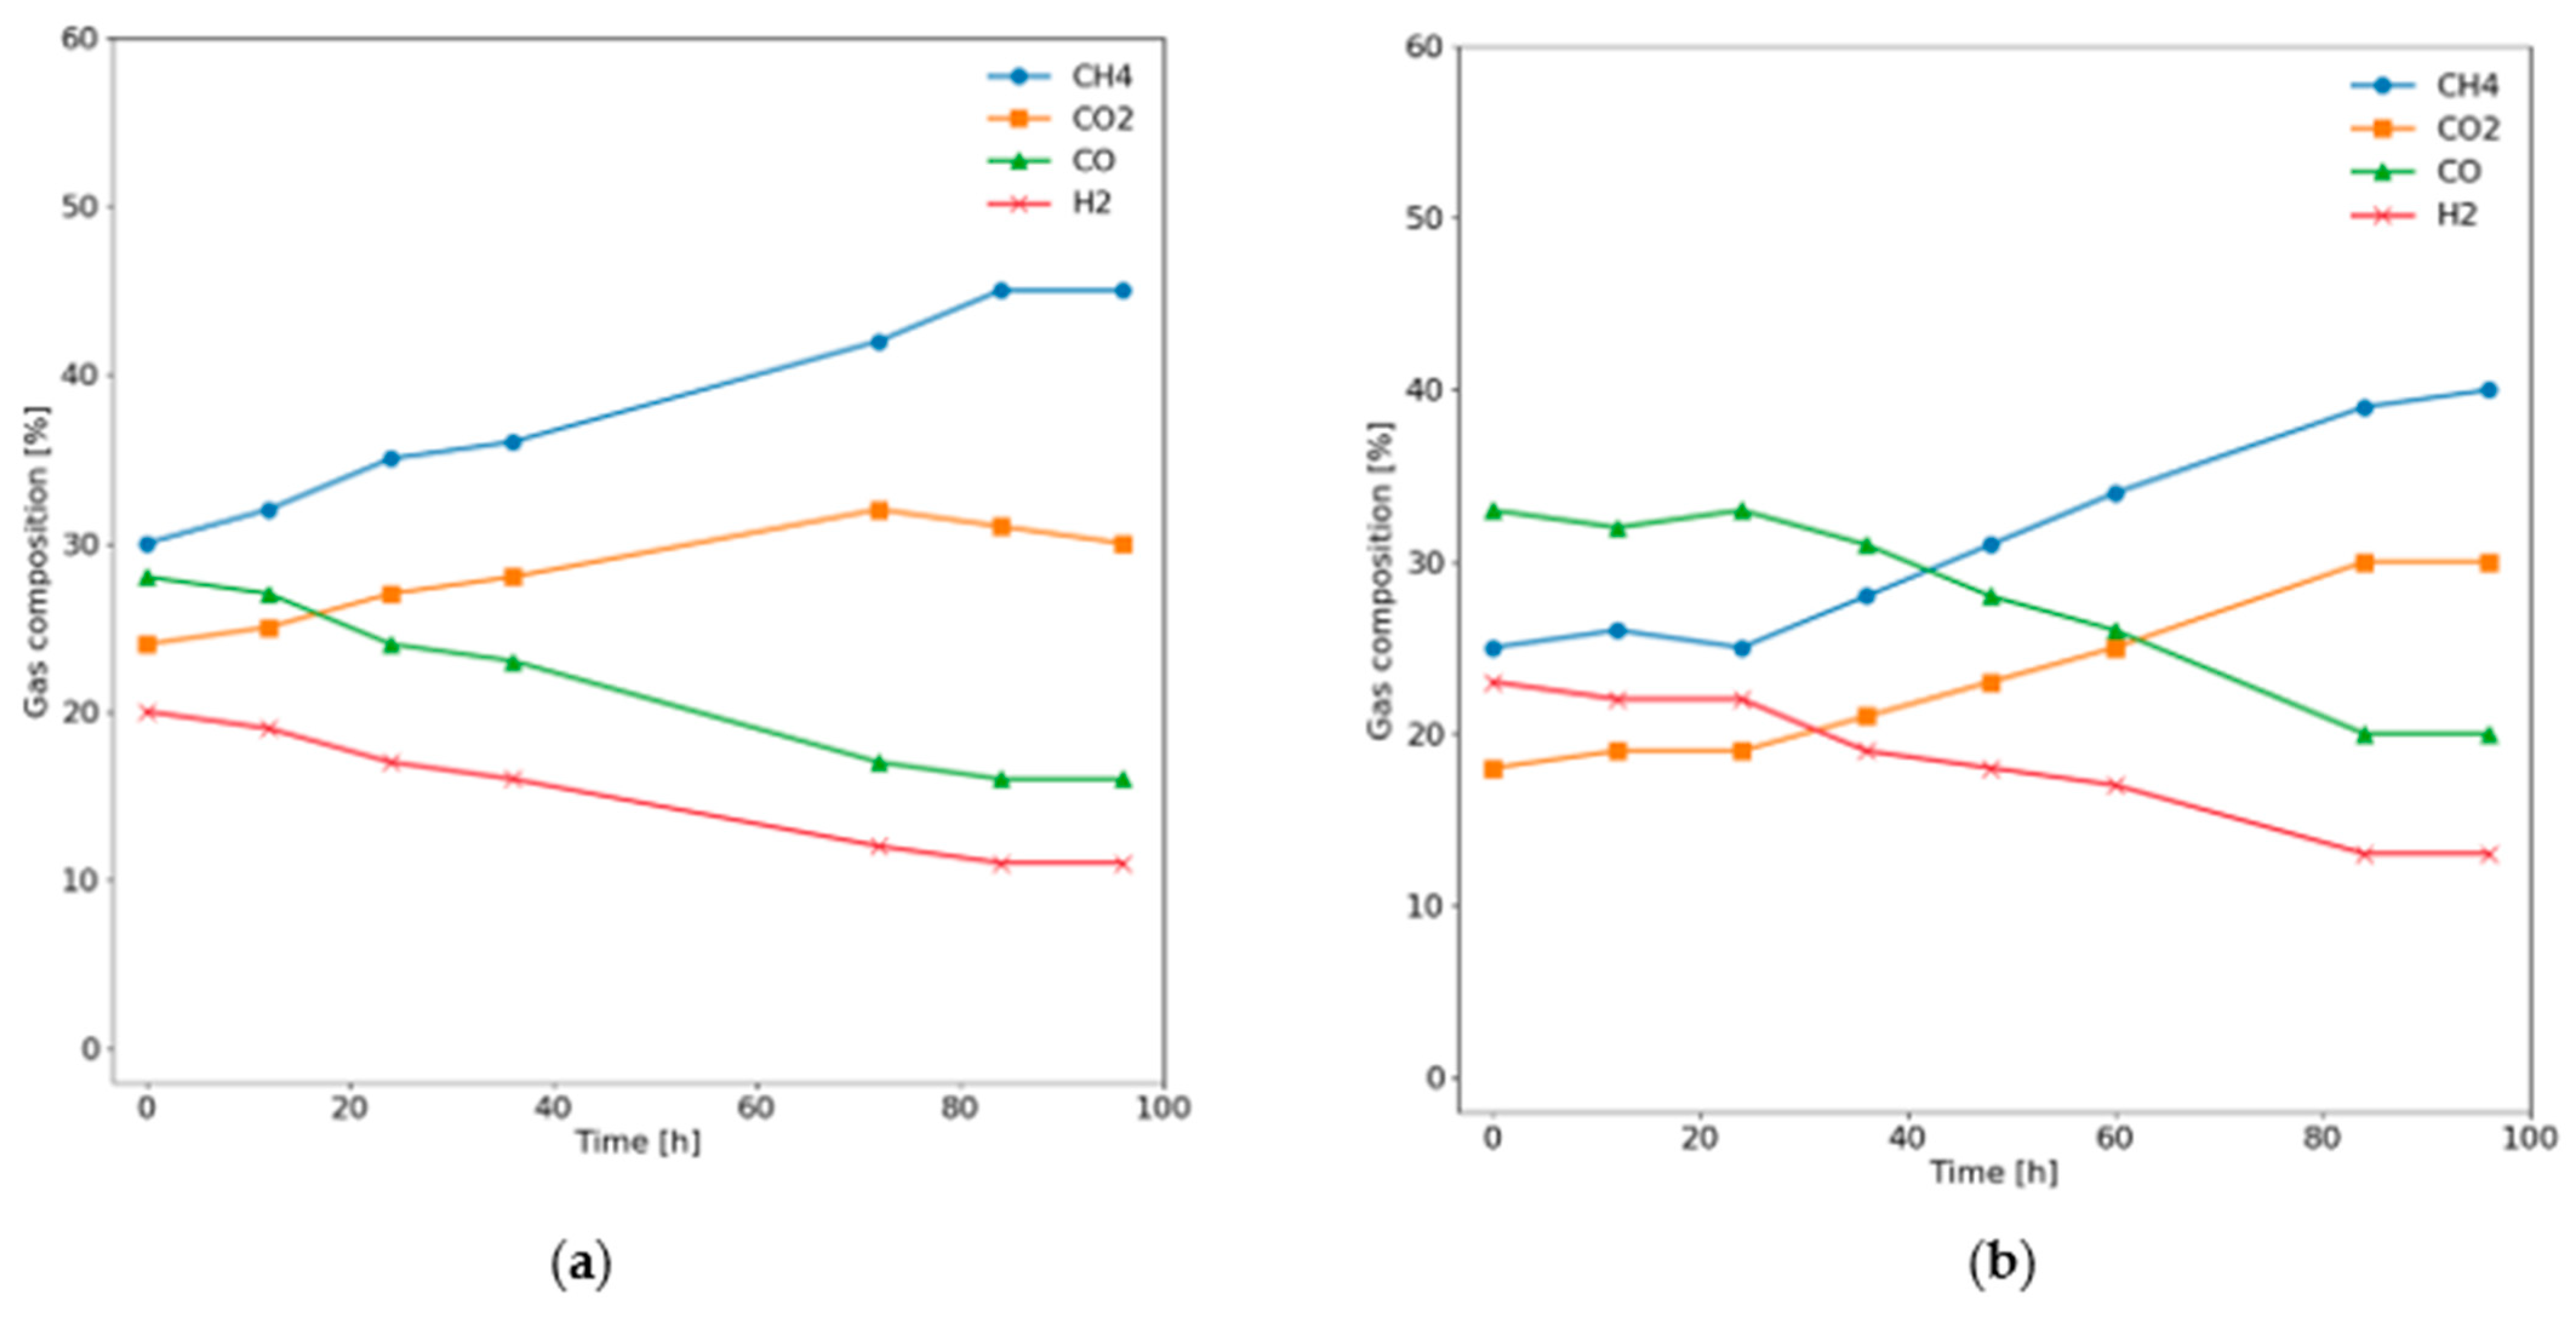
The outlet gas compositions for both experiments presented in
Figure 12 are compared in the following sections, with key parameters such as fuel conversion and utilization factors also presented. The application of the catalytic layer clearly promotes direct internal reforming reactions, leading to an increase in hydrogen (H
2) content by 15% and carbon monoxide (CO) content by 17% during the initial hours of operation. In both systems, biogas is partially converted to syngas; however, the modified cell exhibits significantly superior performance due to more effective reforming processes. Notably, the modified cell maintains a relatively stable gas composition for approximately the first 20 h of operation, a phenomenon that is not observed in the reference cell. This stability indicates enhanced operational reliability and reaction consistency in the modified system. Furthermore, the higher CO concentration detected after 100 h of operation suggests that the applied catalytic layer facilitates carbon removal through the reverse Boudouard reaction. This process not only helps maintain an optimal gas composition but also enhances the overall durability of the cell. The improved carbon management is likely a critical factor in the elevated power densities observed in the electrochemical measurements.
These results underscore the effectiveness of the catalytic layer in advancing the performance of the modified cell, highlighting its potential for optimizing biogas utilization in fuel cell applications. The findings suggest that enhanced reforming capabilities and effective carbon management are key factors in improving the efficiency and longevity of the modified system, paving the way for more sustainable energy solutions in the future.
3. Materials and Methods
3.1. Synthesis and Preparation
The (La0.3Sr0.6Ce0.1)0.9Co0.1Ti0.9O3−δ (LSCCoT) perovskite oxide was synthesized via a conventional solid-state reaction method. Stoichiometric amounts of precursor powders, TiO2 (Chemat, Gdańsk, Poland >99.5%), SrCO3 (Chempur, Piekary Śląskie, Poland cz.d.a.), Co3O4 (Thermo Scientific, Waltham, MA, USA, >99.7%), CeO2 (Alfa Aesar, Heysham, Great Britain 99.5%), La2O3 (Thermo Scientific, Waltham, MA, USA, 99.90%) were used in appropriate ratios according to the nominal composition. The powders were mixed and homogenized using a planetary ball mill for 12 h at 450 rpm, using ethanol as the milling medium. After drying, the obtained powder mixture was uniaxially pressed into pellets at room temperature using a hydraulic press. The pellets were then calcined in air at 1200 °C for 4 h to promote solid-state diffusion and initial phase formation. After cooling, the calcined pellets were manually ground in a mortar for 1 h to enhance homogeneity and reduce particle agglomeration. The resulting powder was re-pressed into pellets and subjected to a second sintering step at 1400 °C for 12 h in air to improve crystallinity and phase development. After cooling to room temperature, the sintered pellets were crushed and finely ground in a mortar to obtain a homogeneous, phase-pure LSCCoT powder for further analysis.
A portion of the synthesized powder was reduced in a tube furnace under a constant flow of dry hydrogen at 900 °C for 10 h. This treatment was intended to induce the exsolution of metallic cobalt nanoparticles, creating oxygen vacancies in the perovskite lattice.
3.2. Sample Characterization
Both as-prepared and reduced powders were examined using a Scanning Electron Microscope (SEM, FEI Quanta FEG 250, Eindhoven, The Netherlands) to investigate microstructural evolution and nanoparticle exsolution, as well as the X-ray diffraction method using D2 PHASER XE-T equipment (Bruker, Billerica, MA, USA) with a Cu-Kα radiation source to monitor structural changes and phase purity. The lattice parameters were estimated by performing Rietveld analysis via HighScore 5.2 software.
The electrical conductivity of the LSCCoT sample was measured using a DC four-point wire method. Platinum electrodes were used as both current and voltage contacts due to their thermal and chemical stability in oxidizing and reducing atmospheres. The sample was mounted in a high-temperature measurement holder with Pt leads.
The first electrical test was carried out in synthetic air. The sample was heated to 800 °C and then cooled stepwise to 300 °C, decreasing the temperature by 50 °C at each step. At each temperature, the resistance was recorded for 1 h under isothermal conditions until a stable value was obtained.
Afterwards, the same specimen was tested under dry hydrogen flow under identical temperature steps. However, before measurement, the sample was kept at 800 °C in H2 for 10 h to ensure sufficient reduction and exsolution of metallic species. The resistance was subsequently measured in the same temperature sequence. Based on the measured resistance and sample geometry, resistivity and electrical conductivity were calculated. Finally, the activation energies for conduction in oxidizing and reducing atmospheres were determined using the Arrhenius equation.
3.3. Cell Modification and Tests
Button cells with an active area of 1.13 cm
2 (LSFM/YSZ/Ni-YSZ) were manufactured at the National Taipei University of Technology (NTUT). The cells were modified on the anode side using a brush-coating method. For this purpose, the (La
0.3Sr
0.6Ce
0.1)
0.9Co
0.1Ti
0.9O
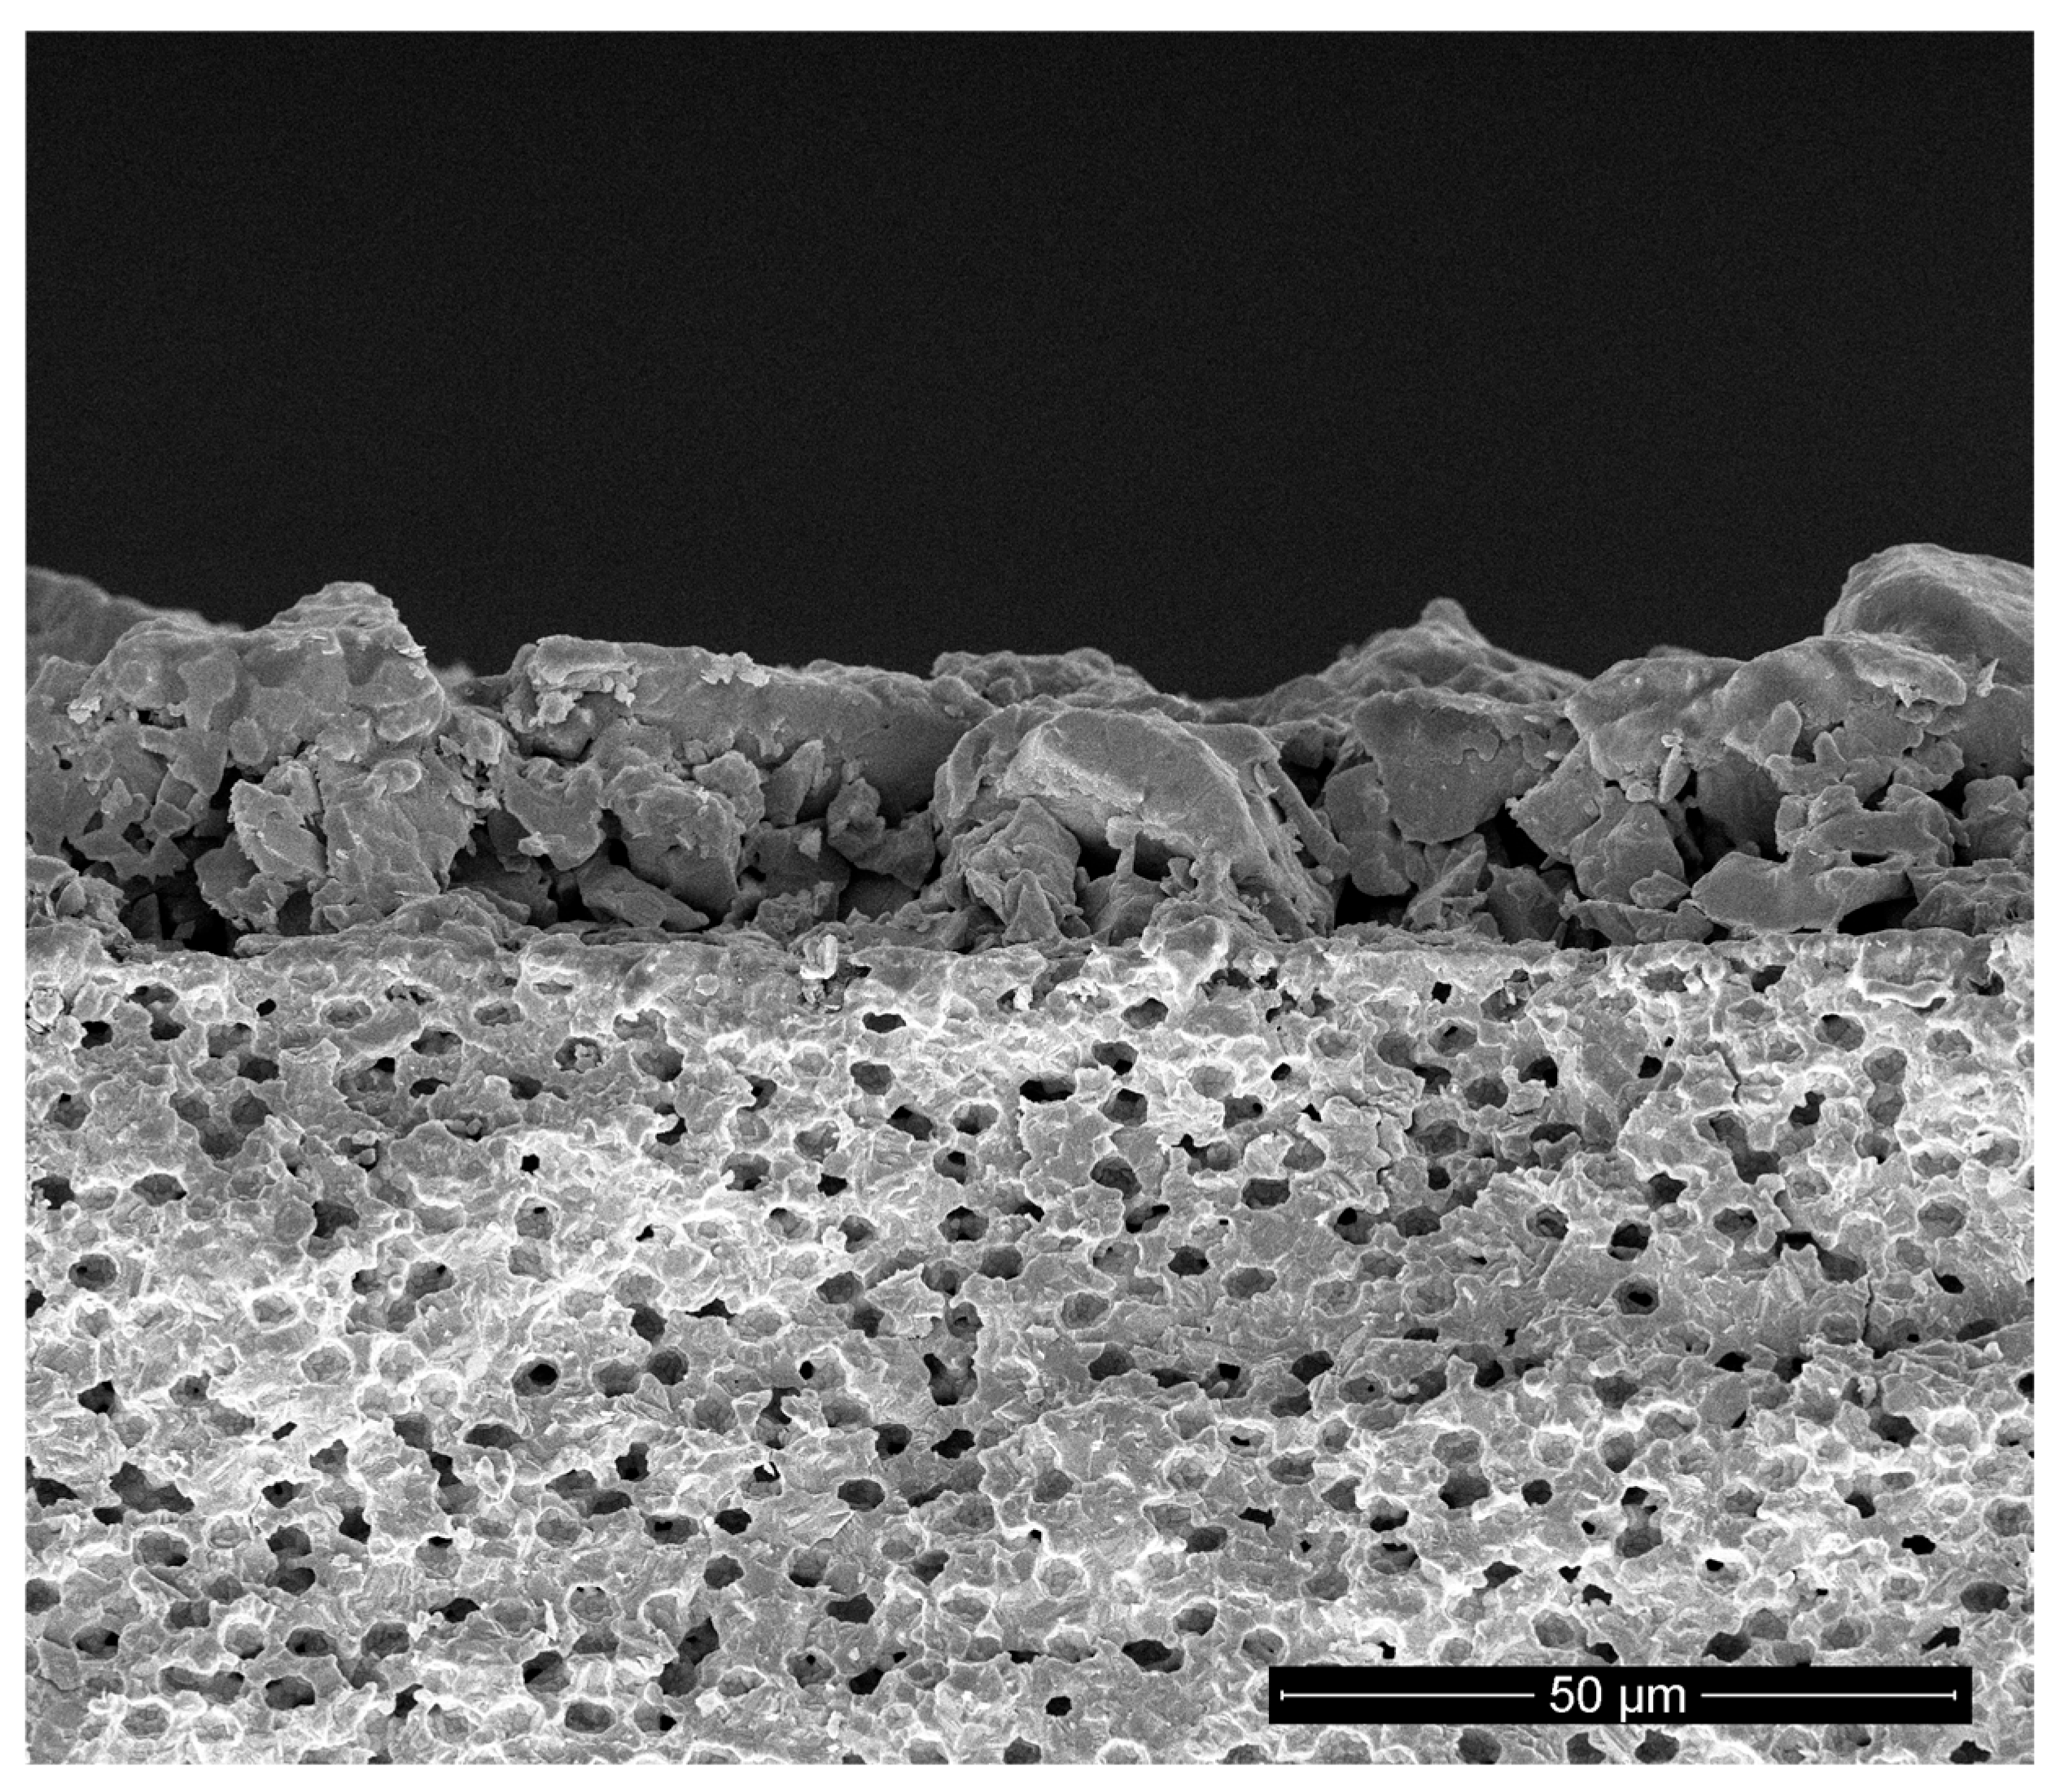
3−δ (LSCCoT) powder was mixed with the ESL403 organic binder to obtain a homogeneous paste, which was then applied to the anode. After coating, the cells were sintered in air at 900 °C for 5 h. The resulting layer, as depicted in
Figure 13, is approximately 25 µm thick and exhibits a high porosity. It is composed of sintered LSCCoT grains with sizes on the order of several micrometers.
Figure 13 also shows that the LSCCoT coating changes the Ni–YSZ anode morphology and partly alters its pores. However, electrochemical results show that, despite these changes, the coating does not hinder mass transport. In porous SOFC anodes, performance depends on porosity, catalytic activity, and the distribution of reforming reactions. The LSCCoT layer, less porous than pristine Ni–YSZ, introduces active Co nanoparticles and controlled point defects. These features enhance methane reforming and fuel conversion, enabling more efficient, uniform reactions across the electrode surface and reducing local concentration gradients. In consequence, the layer features a well-developed surface morphology that not only enhances the electrochemical reactions at the anode but also facilitates the unobstructed gas flow to the anode.
Both reference and modified cells were characterized under identical conditions, with the reference cell taken from the same production batch as the modified one. The cells were mounted in a tubular furnace, sealed using silver paste (DuPont), and heated in an argon atmosphere (80 Nml/min) to 800 °C. After reaching the desired temperature, the cells were flash-reduced in pure hydrogen (80 Nml/min). Once stable operation was achieved, the fuel was switched to a synthetic biogas mixture (60 vol% of CH4, 40 vol% of CO2). The oxidant was supplied by free flow of atmospheric air.
The temperature dependence of cell performance was then evaluated. After switching to biogas, the cells were cooled down to 700 °C. Current–voltage (IV) curves and electrochemical impedance spectroscopy (EIS) spectra were recorded using BioLogic equipment. The procedure was repeated at 750 °C and 800 °C. Time-resolved tests were also carried out to assess durability under biogas operation. Both modified and reference cells were tested for 100 h, with continuous monitoring of the outlet gas composition using a NANOSENS IR/electrochemical gas analyzer. After testing, the cells were characterized by scanning electron microscopy (SEM).
Distribution of relaxation times (DRT) analysis was performed using the DRT tools [
31] package. Analysis parameters were tuned for each sample separately.




 ,
,