Article

Photocatalytic Degradation of Methylene Blue Dye with g-C3N4/ZnO Nanocomposite Materials Using Visible Light

by
Juan C. Pantoja-Espinoza
1,
Gema A. DelaCruz-Alderete
2 and
Francisco Paraguay-Delgado
1,*
1
Centro de Investigación en Materiales Avanzados SC (CIMAV), Av. Miguel de Cervantes 120, Chihuahua C. P. 31136, Chihuahua, Mexico
2
Facultad de Ingeniería, Campus II, Universidad Autónoma de Chihuahua, Circuito Universitario s/n, Chihuahua C. P. 31125, Chihuahua, Mexico
*
Author to whom correspondence should be addressed.
Catalysts 2025, 15(9), 851; https://doi.org/10.3390/catal15090851
Submission received: 20 June 2025 / Revised: 11 August 2025 / Accepted: 13 August 2025 / Published: 4 September 2025
(This article belongs to the Special Issue Recent Advances in Photocatalysis for Environmental Applications)

Abstract

The g-C3N4/ZnO nanocomposite materials were applied to degrade methylene blue (MB). The samples were characterized and evaluated to study the adsorption and photocatalytic degradation under visible light. The g-C3N4 was incorporated at percentages of 5%, 10%, 20%, and 40% relative to the ZnO weight. These composite materials were prepared using a solvothermal microwave technique. The structural, textural, morphological, and optical properties were investigated using XRD, FTIR, SEM, EDS, STEM, BET, UV-Vis, and XPS techniques. The XRD patterns of the samples showed the coexistence of crystalline phases of g-C3N4 and ZnO, while images and elemental composition analysis confirmed the formation of nanocomposite samples. The UV-Vis spectrum revealed a redshift in the absorption edge of the nanocomposites, indicating improved light-harvesting capability. The synthesized material g-C3N4/ZnO (20/80), with a surface area of 25 m2/g, exhibited higher photocatalytic performance, achieving 85% degradation of MB after 100 min under visible light, which corresponds to nearly three times the degradation efficiency of commercial P25-TiO2 (31%) under the same conditions. The reusability and stability tests were conducted up to the fifth cycle, and this material showed 77% degradation, indicating good stability. This nanocomposite material has good potential as a photocatalyst for solar-driven MB.

Graphical Abstract

1. Introduction

Population growth and industrial development have intensified water pollution, compromising the environment and human health [1]. Among the pollutants of concern are dyes, such as methylene blue (MB), mainly generated by the textile industry [2]. This dye can cause harm to both aquatic ecosystems and human health, resulting in respiratory problems, skin irritations, and damage to the cardiovascular and nervous systems [3].
Several methods have been developed to treat water contaminated with MB, including coagulation–flocculation [4], membrane filtration [5], adsorption [6], and advanced oxidation processes (AOP) [7]. Adsorption is a commonly used method due to its simplicity and efficiency, especially when materials have a high adsorption capacity [8]. However, AOP can degrade persistent organic pollutants into less harmful substances [9]. A type of AOP is photocatalysis, which is environmentally friendly since the reaction system uses semiconductors and ultraviolet (UV), visible (Vis), or solar radiation [10].
Photocatalysis requires studying semiconductors beyond environmental applications for dye degradation. The TiO2 photocatalyst is the most extensively studied semiconductor, but it requires activation with UV light. Moreover, due to its band gap value comparable to TiO2, ZnO is expected to follow similar primary photocatalytic mechanisms. However, it has been reported that ZnO presents superior photocatalytic performance than TiO2 due to their significant differences in electron mobility, with values of 200 to 300 cm2/Vs for ZnO and 0.1 to 4.0 cm2/Vs for TiO2, respectively. Due to this, mobility values show better quantum efficiency [11,12,13].
On the other hand, ZnO has been highlighted as an effective photocatalyst for the degradation of MB. Murali and Amirthavalli [14] reported that ZnO, under UV irradiation, can efficiently degrade MB due to its ability to generate reactive oxygen species that can break the bonds of the dye. Additionally, g-C3N4 is a promising photocatalyst due to its facile synthesis method, abundant precursors, and ability to absorb visible light [15]. Beyond photocatalysis, recent studies have demonstrated that g-C3N4-based materials also exhibit great potential in energy storage applications, such as lithium–sulfur batteries, underscoring their multifunctionality and relevance in advanced material design [16].
Furthermore, the structural design of g-C3N4 plays a key role in enhancing its photocatalytic performance. Gu et al. [17] reported that introducing nitrogen vacancies into the g-C3N4 structure can optimize optical absorption and electron–hole pair separation, thereby improving the efficiency of photocatalysis. Additionally, Li et al. [18] demonstrated that incorporating metal oxides can enhance the absorption and degradation of organic pollutants under visible irradiation. The integration of g-C3N4 with CuO via thermal decomposition and hydrothermal methods led to enhanced charge separation and lower recombination rates, achieving up to 98% degradation of MB under visible light within 40 min, significantly outperforming the individual components [19]. Similarly, heterostructures formed with (001)-faceted TiO2 nanoparticles demonstrated superior performance, with a degradation rate constant (k) for MB that was seven times higher than that of pure TiO2 and four times that of g-C3N4, primarily due to an improved surface area and suppressed recombination [20]. Moreover, ternary composites such as g-C3N4/GO/CuFe2O4 (CGC) have shown exceptional photocatalytic efficiencies (up to 99% degradation in 60 min) and reusability, attributed to synergistic interactions that promote efficient electron–hole separation and visible light absorption [21].
Different synthesis methods exist for g-C3N4 and ZnO for various applications. The g-C3N4 is obtained by thermal polymerization using nitrogen-rich precursors such as cyanamide, urea, and melamine [22,23,24]. In the case of ZnO, nanoparticles could be synthesized using chemical vapor deposition (CVD) [25], sol–gel [26], chemical precipitation [27], hydrothermal [28], and solvothermal [29] techniques. Among these synthesis methods, the solvothermal method has gained significant attention due to its ability to obtain materials with high purity and controlled morphology [30]. On the other hand, nanocomposites of two or more semiconductors have proven to be more effective than single materials in photocatalysis due to the synergy between them [31]. These heterostructures enable better separation of electron–hole pairs, thereby reducing recombination and enhancing photocatalytic efficiency [32]. In addition, composites can broaden the light absorption range, allowing the catalysts to utilize UV and visible light [33,34].
Among the studied nanocomposites, g-C3N4/ZnO has shown great potential. Chaharlangi et al. [35] demonstrated the use of this material for MB degradation under visible light, showing a significant improvement over pure ZnO. Another work reported by Naseri et al. [36] enhanced the photocatalytic activity of g-C3N4/ZnO under simulated sunlight for the degradation of MB dye. Garg et al. [37] reported g-C3N4/ZnO as an effective catalyst for the degradation of endocrine disruptors such as bisphenol A. Paul et al. [38] prepared g-C3N4/ZnO by a one-step thermal polymerization of urea and basic zinc carbonate dihydrate [ZnCO3]2·[Zn(OH)2]3. They reported 74% degradation of MB dye after 80 min of reaction under visible light. Shi et al. [39] designed and synthesized g-C3N4/ZnO photocatalytic membranes that showed efficient removal of MB dye under continuous operating conditions. Meena et al. [40] synthesized g-C3N4/ZnO using urea and zinc acetate as precursors by grinding and subsequent calcination, and researched the photocatalytic effect toward the degradation of brilliant cresyl blue dye (BCB) under visible light irradiation.
This study employed the solvothermal microwave method to synthesize ZnO and exfoliated g-C3N4, resulting in g-C3N4/ZnO nanocomposites with varying g-C3N4 contents. This approach enhanced the photocatalytic efficiency of the materials under visible light. Therefore, the objectives of this research were threefold as follows: (1) to synthesize g-C3N4/ZnO nanocomposites using melamine thermal polymerization and the microwave solvothermal method; (2) to investigate their structural, morphological, textural, surface, and optoelectronic properties; and (3) to evaluate their adsorption capacity and photocatalytic degradation of MB dye under visible light.

2. Results and Discussion

2.1. XRD

Figure 1 shows the XRD patterns between 10 and 80 degrees for all study samples. The Z100 sample showed XRD patterns at 2θ = 31.8°, 34.45°, 36.28°, 47.58°, 56.65°, 62.92°, 66.44°, 68.03°, 69.17°, 72.63, and 77.03° that belonged to (1 0 0), (0 0 2), (1 0 1), (1 0 2) (1 1 0), (1 0 3), (2 0 0), (1 1 2), (2 0 1), (0 0 4), and (2 0 2) d-spaces, respectively. The diffraction peaks in the patterns were accurately assigned based on the JCPDS card No. 00-036-1451 crystallographic reference, confirming the hexagonal wurtzite-type structure of ZnO [41]. Regarding the CN100 sample, the XRD pattern showed an intensity at 27.5° corresponding to the (0 0 2) plane of the g-C3N4 sample, which matched with the JCPDS card No. 87-1526 [41]. The distinctive (100) peak associated with the tri-s-triazine unit plane of g-C3N4, typically located at 2θ = 13.2°, was absent, likely due to the low crystallinity [42].
The XRD patterns for the CNZ-x samples, related to bare ZnO and g-C3N4, did not show any additional significant changes in position, confirming the formation of g-C3N4/ZnO nanocomposites. Furthermore, the intensity of the (0 0 2) plane of g-C3N4 decreased in proportion to the amount of g-C3N4 used in the CNZ-x nanocomposite. The highest intensity decreased from CNZ-40 to CNZ-5 nanocomposite, being consistent with the mass of g-C3N4 on the nanocomposites. Also, the reduced peak signal may have been attributed to interfacial interactions between the semiconductors, which disrupted the interlayer stacking of g-C3N4 and diminished its crystallinity. This observation aligns with the report by Roškarič et al. [43], who studied the g-C3N4/TiO2 photocatalyst and reported similar structural modifications. It can be hypothesized that this trend arises from the electronic properties of both semiconductors, which facilitate their interaction upon forming a nanocomposite. Another notable observation was the shift in the peak positions of Z100 (Inset Figure 1) at 31.8°, 34.45°, and 36.28° 2θ in bare ZnO and CNZ-x composites, with a maximum shift to 31.94°, 34.59°, and 36.42° 2θ observed for the CNZ-10 sample (Table 1). A similar peak shift was reported with g-C3N4-TiO2 material studied by others [31], where it was suggested that such shifts are attributed to the phases interacting strongly with each other. These results confirmed the presence of both semiconductors, as reported in other reports [38].
The crystallite size was calculated through the Scherrer equation (Table 1), based on the diffraction peaks at approximately 27.35° for g-C3N4 and the values at ~31.83°, ~34.48°, and ~36.32° for ZnO. During the synthesis of the nanocomposites, the ZnO crystallite size increased as the proportion of g-C3N4 increased; however, it is also worth noting that the estimation error increased accordingly.
For pure g-C3N4, a crystallite size of 4 nm was determined, consistent with the reported value in other studies [43]. In the nanocomposites, the crystallite size increased to 6, 10, and 14 nm as the g-C3N4 content decreased in the CNZ-x series (x = 40, 20, and 10, respectively). However, given that g-C3N4 is a 2D material and the Scherrer equation is designed for spherical particles, the observed increase in crystallite size may also be influenced by the inherent limitations of this estimation method, leading to a higher degree of uncertainty.

2.2. FTIR

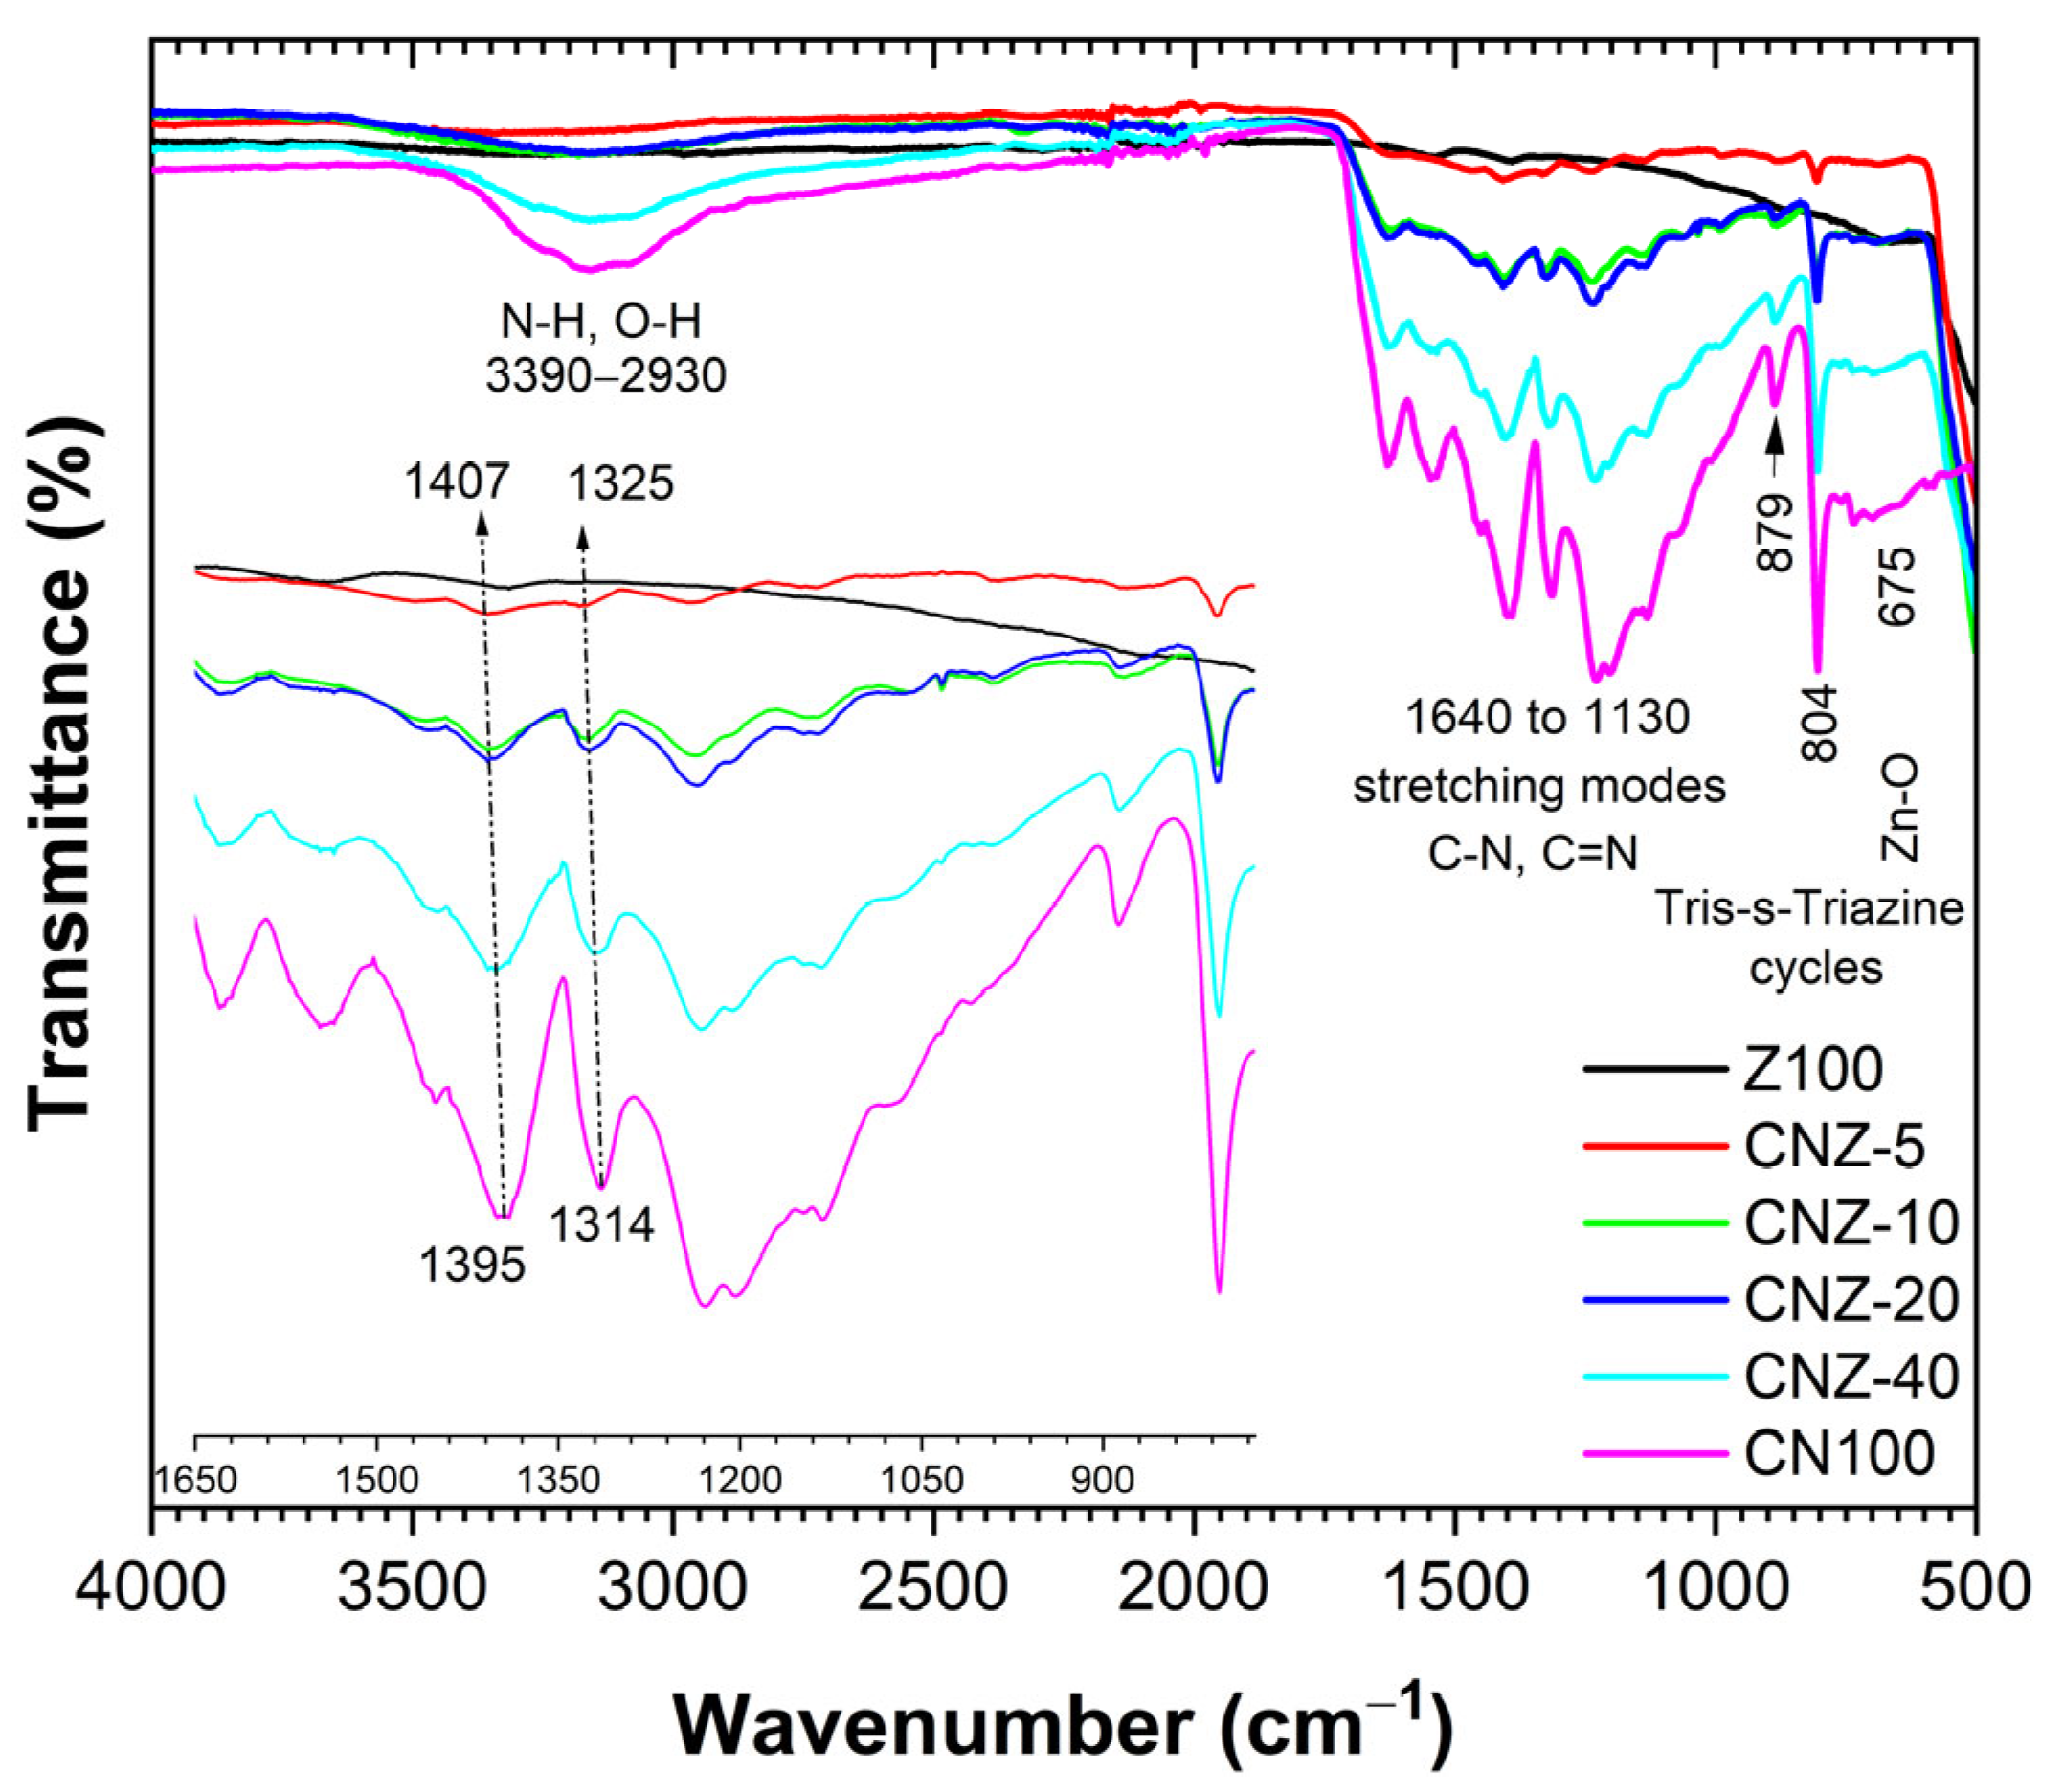
The FTIR spectra for all samples are shown in Figure 2. For the Z100 sample, the characteristic band at 675 cm−1 related to Zn-O was observed [44]. The FTIR for CN100 showed several bands between 4000 and 400 cm−1. The bands at 879 cm−1 and 804 cm−1 were vibrational modes characteristic of the deformation of cross-linked heptazine and triazine units, respectively [45]. The bands between 1130 and 1540 cm−1 were attributed to the C-N ring [46]. The band at 1640 cm−1 indicated the vibrational mode of the C=N group [47]. The broadband from 2930 to 3390 cm−1 was assigned to the vibrational mode of the N-H and O-H groups [46].
The FTIR spectra of CNZ-x nanocomposites displayed all bands corresponding to C and N in g-C3N4, as well as Zn and O in ZnO, which agrees with previously published data. The asymmetric N-H stretching vibrations appeared broadened, probably due to adsorbed water molecules or hydroxyl groups on the oxide surface. In addition, the bands observed near 675 cm−1 demonstrated the existence of Zn-O bonds [44]. All vibrational modes associated with C-N groups related to heptazine and triazine exhibited shifts attributed to interactions between ZnO and g-C3N4, as observed in other nanocomposites [40,41,48]. A significant correlation was evident between the mass ratio g-C3N4/ZnO and the spectral shifts recorded, being the most pronounced in sample CN100.
In the inset FTIR spectra (Figure 2), remarkable shifts in the C-N stretching vibrations were observed, indicating a significant interaction between g-C3N4 and ZnO in the g-C3N4/ZnO nanocomposite. In particular, the band found at 1395 cm−1 in bare g-C3N4 shifted to 1407 cm−1, while the one corresponding to 1314 cm−1 moved to 1325 cm−1 after incorporating ZnO. These shifts suggest an interaction between the unshared electrons of nitrogen in g-C3N4 and Zn2+ ions in ZnO, which favors charge transfer and reduces electron–hole pair recombination. Furthermore, the possible formation of Zn-N or Zn-O-C bonds contributes to better charge separation, which can considerably enhance the protocatalytic performance of the g-C3N4/ZnO nanocomposites.

2.3. SEM and TEM

SEM images were acquired to study the morphology of the samples. Figure 3 shows micrographs at 20 kX magnification for each sample. The micrograph from CN100 revealed stacked sheets due to the formation of g-C3N4 bulk during melamine decomposition at 550 °C. The micrographs of Z100 and CNZ-x composites showed similar irregular morphologies. In addition, clear evidence of particle agglomerates was observed, similar to the report by Malik et al. [49]. The g-C3N4 dispersion across the ZnO surface was reasonably uniform, exhibiting minor semi-spherical clusters of ZnO particles, likely due to the solution-based synthesis approach.
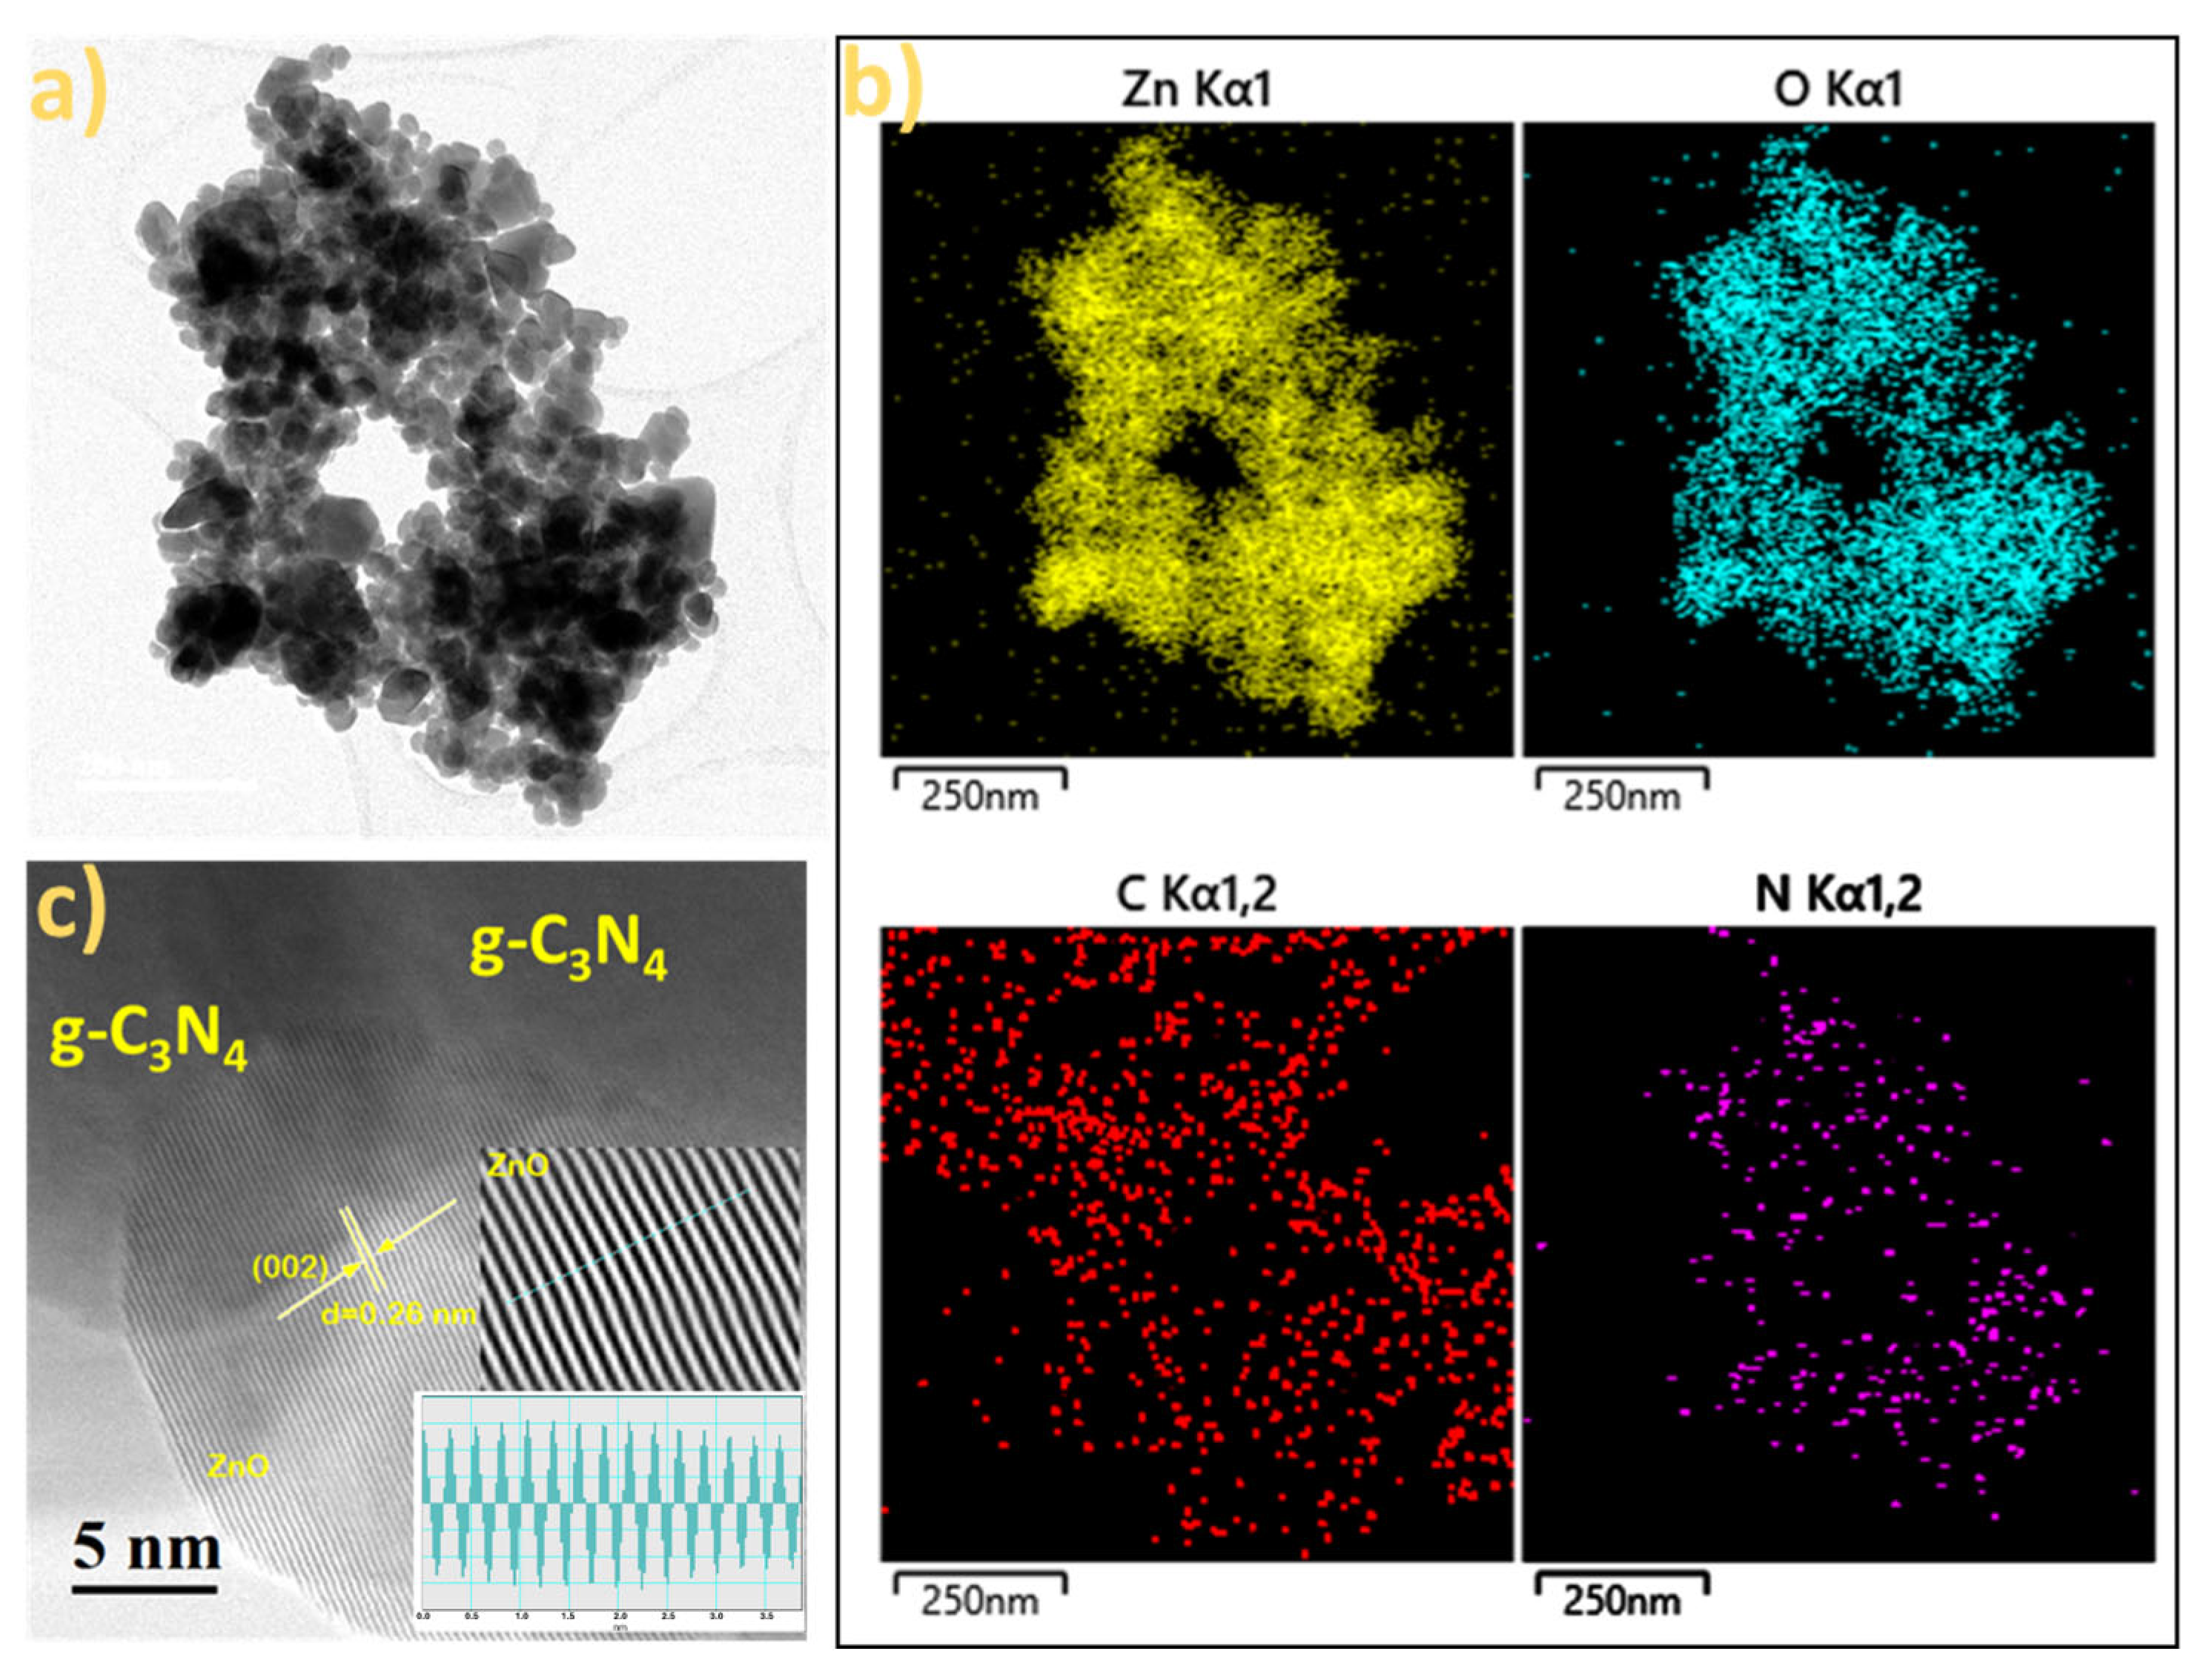
In contrast with conventional microwave-assisted solvothermal approaches, Cappelluti et al. [50] reported that maintaining a constant microwave power results in a rapid rise in autogenous pressure, triggering the burst nucleation of small primary crystallites, followed by their rapid agglomeration into secondary particles, which significantly reduces reaction times to the scale of minutes. Also, selecting non-aqueous polar solvents, such as ethanol, plays a crucial role in forming uniform spherical structures with a narrow size distribution of nanocrystalline domains [50]. Furthermore, Pellegrino et al. [51] reported that particle aggregation and agglomeration impact the optical properties of materials, altering their capacity to absorb and scatter incident radiation, which in turn influences their photocatalytic performance. To clarify the morphology and elemental distribution of g-C3N4 and ZnO, STEM images are shown in Figure 4.
Figure 4a shows a STEM bright field (BF) image of g-C3N4/ZnO powders (CNZ-20 sample). This sample presents particles with a semi-spherical morphology, with an average size of 37 ± 14 nm. This micrograph provides information about porosity, as the particles appear more dispersed than in the SEM images (Figure 3). This increased dispersion suggests the presence of nanovoids or porous structures within the material, which may contribute to enhanced surface area and improved photocatalytic performance. Figure 4b shows EDS element mapping images revealing the g-C3N4 distributed on the surface of ZnO. In addition, it also exhibits a homogeneous dispersion of C, N, O, and Zn atoms, indicated in red, purple, yellow, and blue, respectively.
By mapping the distribution of C, N, O, and Zn atoms in the CNZ-20 sample, the achieved preparation of g-C3N4/ZnO nanocomposites was confirmed. In the EDS spectrum of Figure S3, in Supplementary Information, the characteristic elements of the two semiconductors in the CNZ-20 nanocomposite were identified. Since EDS analysis is a semi-quantitative technique, the values obtained must be interpreted with some margin of variability. In this analysis, g-C3N4 showed a composition of 7.04 ± 1.47 wt% C and 9.3 ± 3.71% N, while ZnO presented 18.99 ± 4.08% O and 64.67 ± 0.38% Zn. These results are consistent with the theoretical values expected for the CNZ-20 nanocomposite (20% by weight g-C3N4 and 80% by weight ZnO), which correspond to 7% C, 11.2% N, 16% O, and 65.38% Zn, suggesting an adequate addition of the precursors in the synthesis of the material. On the other hand, the high-resolution image in Figure 4c shows lattice fringes marked with white lines, and a measured d-spacing of 0.26 nm corresponds to the (0 0 2) plane of the wurtzite ZnO phase [52]. In this figure, it is possible to observe some particles of g-C3N4 that lack crystallinity.

2.4. BET Analyses

The BET technique was employed to determine the surface area of the samples. Figure 5 presents the nitrogen adsorption–desorption isotherms for the samples.
According to the IUPAC, the isotherm obtained for Z100 was classified as type III. In contrast, CN100, CNZ-5, CNZ-10, CNZ-20, and CNZ-40 samples were classified as type IV. All samples exhibited an H3 hysteresis loop, generally associated with mesopores and some micropores, consistent with the findings reported by [53]. As shown in Table 2, it was observed that the CN100 and Z100 powders had the lowest BET area, following the order CNZ-20 > CNZ-10 > CNZ-5 > CNZ-40 > Z100 > CN100, being 25, 21, 20, 19, 18, and 12 m2/g, respectively, being consistent with others [54,55]. The pore size decreased considerably in the nanocomposites, revealing an average size of 3 nm, while in the bare Z100 and CN100 samples, it was 15 and 11 nm, respectively. The composite samples presented a slightly better surface area.
This decrease in pore size is consistent with that reported by [56], who attributed it to the deposition of ZnO between g-C3N4 layers, forming the nanocomposite. On the other hand, the BET area of the CNZ-x nanocomposites is expected to decrease; however, the increase may be due to the microwave treatment causing better dispersion between the two simple materials.
The results obtained are consistent with the STEM images acquired for the sample CNZ-20 [38], where it was observed that the increase in the BET area was a straightforward consequence of the morphological evolution induced by the interaction between ZnO and g-C3N4 bare. This association could have altered the graphitic arrangement of the g-C3N4 bare structure due to the loss of nitrogen, which facilitated the expansion of surface area. This increase in BET area was directly related to enhanced photocatalytic performance. A higher surface area (25 m2/g) presents more sites for the adsorption of pollutants and generates electron–hole pairs under irradiation, increasing the photocatalytic degradation efficiency. Previous studies have reported this behavior in hybrid materials, such as ZnO/GCN, where surface structural modification significantly enhances photocatalytic performance [38].

2.5. UV-Vis

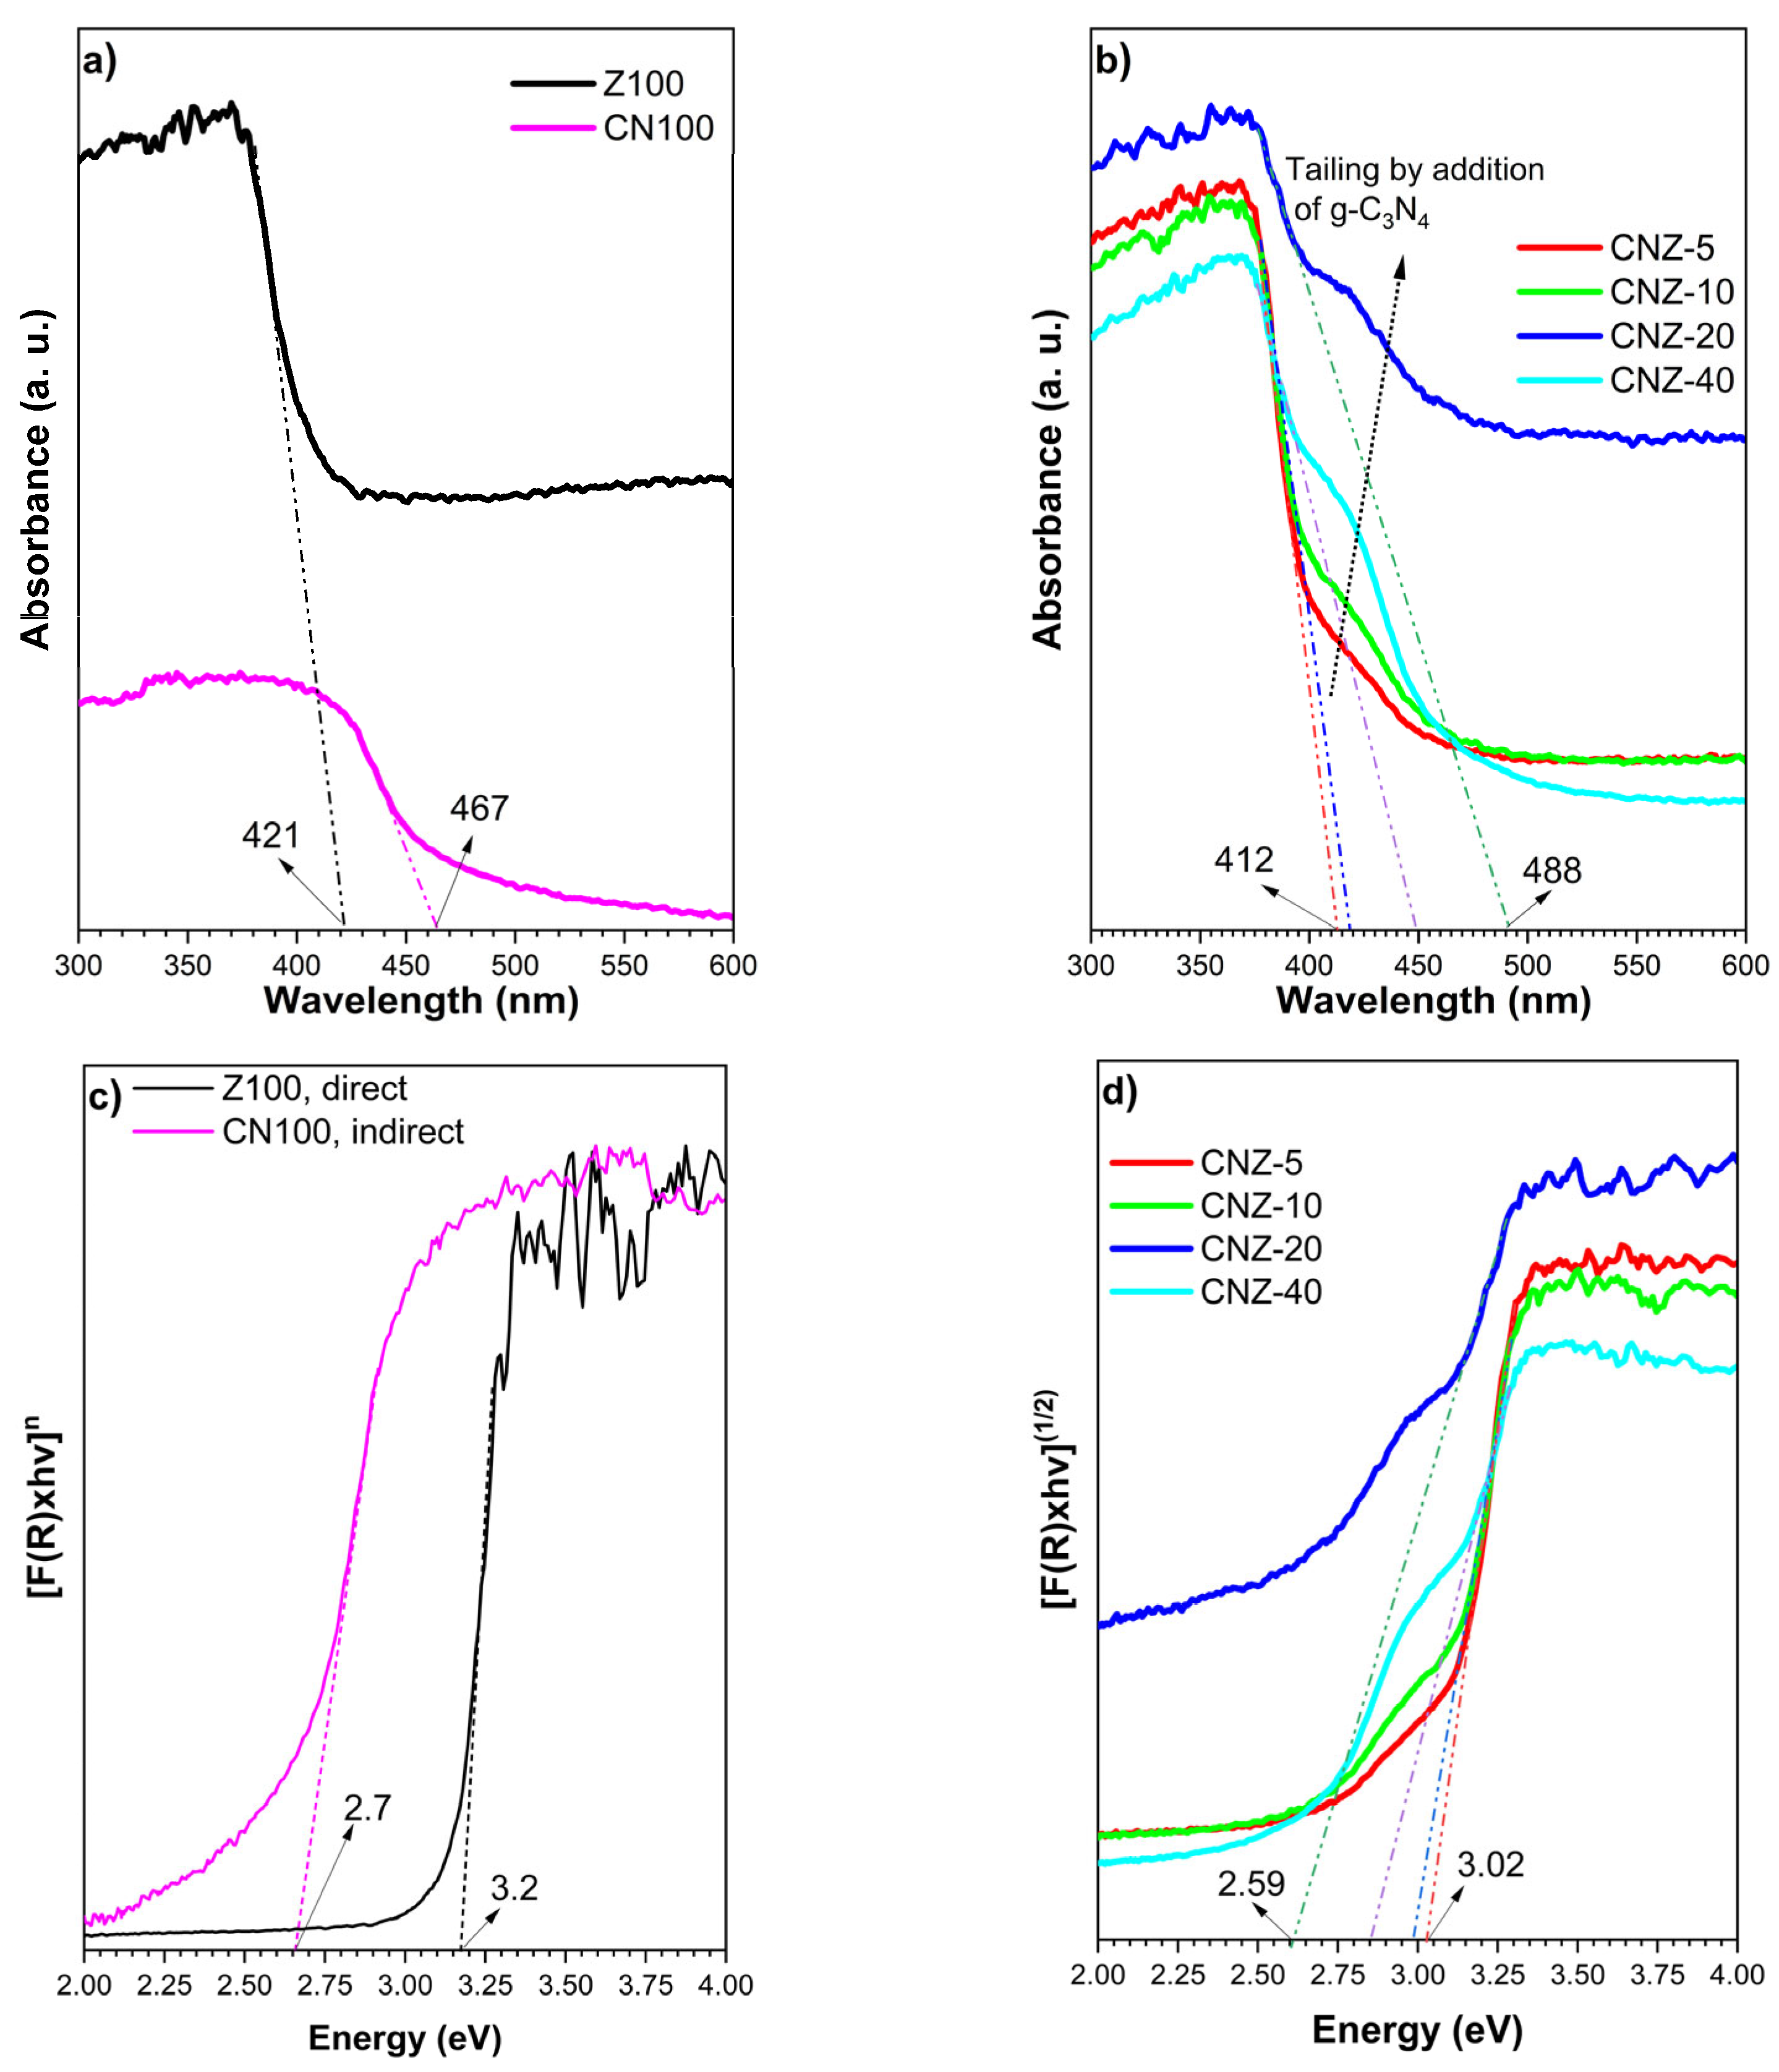
Figure 6a,b display the absorption spectra of the bare samples (Z100 and CN100) and the nanocomposites (CNZ-x). The maximum absorption wavelengths for the pure samples were 421 nm for Z100 and 467 nm for CN100. In contrast, the nanocomposites exhibited maximum absorption wavelengths of 412 nm, 418 nm, 488 nm, and 449 nm for CNZ-5, CNZ-10, CNZ-20, and CNZ-40, respectively. The incorporation of g-C3N4 into ZnO induced a notable change in the maximum absorption energy of the ZCN-x nanocomposites, resulting in a band tailing effect between 415 and 475 nm.
The Kubelka–Munk method, F(R), was used to estimate Eg from diffuse reflectance spectra (DRS) of samples Z100, CN100, and CNZ-x nanocomposites. First, Tauc plots (Figure 6c,d) were made by plotting the photon energy (E) against (F(R) × E)n, and then a line was extended over the part of the curve with the steepest slope up to the intercept with the x-axis (energy) [57].
A direct transition was considered for the ZnO-based sample (Z100), resulting in a band gap of 3.2 eV, while an indirect transition model was applied to the g-C3N4 sample (CN100), yielding a band gap of 2.7 eV. These assignments are consistent with numerous reports in the literature, which widely recognize ZnO as a direct band gap semiconductor and g-C3N4 as exhibiting indirect electronic transitions (Table 3).
For the CNZ-x nanocomposites, the bandgap values were calculated as 3.02 eV, 2.99 eV, 2.59 eV, and 2.55 eV for CNZ-5, CNZ-10, CNZ-20, and CNZ-40, respectively. These values were estimated assuming an indirect electronic transition, primarily due to the presence of g-C3N4, which dominates the visible light response in the composites. As g-C3N4 is the main component responsible for the generation and separation of photogenerated electron–hole pairs under visible light, the indirect nature of its band structure governs the overall optical transition behavior of the CNZ-x series. These band gap estimates agree with those reported by [38] (2.62, 2.56, and 2.52 eV), who synthesized g-C3N4/ZnO using different urea and zinc carbonate as precursors. The bandgap values obtained in this study are consistent with those reported by others for g-C3N4, bare ZnO, and the ZnO/melamine nanocomposite [48]. Decreasing the bandgap in the nanocomposite can significantly enhance visible light absorption, improving the generation of electron–hole pairs [49]. This increased efficiency in electronic excitation favors better charge separation and reduces recombination, potentially resulting in enhanced photocatalytic activity [58].

2.6. XPS

Figure 7 shows the elemental surface composition studied by XPS spectroscopy. The survey spectrum shown in Figure 7a of the Z100 and CN100 samples revealed separated peaks associated with Zn, O, C, and N, which were confirmed by EDS mapping results indicating the formation of ZnO and g-C3N4. The survey spectrum of the CNZ-x nanocomposites revealed the presence of the four elements Zn, C, O, and N in each sample, confirming the formation of the g-C3N4/ZnO nanocomposite, with no impurities observed (Figure 7a). Figure 7b shows the XPS spectra of Zn 2p, the peaks at 1045.3 and 1022.3 eV for sample Z100 (bare ZnO) associated with Zn 2p1/2 and Zn 2p3/2 [59]. As expected, in sample CN100, no peaks characteristic of Zn were observed, confirming the purity of g-C3N4. The XPS spectra of the CNZ-x samples exhibited a shift in the energies of the Zn 2p peaks at Zn 2p1/2 = 1044.4 eV and Zn 2p3/2 =1021.4 eV, possibly due to electronic redistribution, indicating a strong interphase interaction of ZnO and g-C3N4 [52]. This interaction facilitates the charge carrier transfer, thus improving the photocatalytic performance [60], as further corroborated by the subsequent photocatalytic performance results.
The C 1s spectra (Figure 7c) showed peaks at 288 and 284.7 eV attributed to C-N bonds and C atoms in the s-triazine [38] present in g-C3N4; this peak was observed with higher intensity for sample CN100 and decreased in CNZ-x from x = 40 to x = 5, until not observed in sample Z100 (ZnO). Some authors have attributed these binding energies to the C-adventitious and C-N bonds. A chemical shift of the C 1s peak of 0.2 eV towards a high binding energy suggests a change of the chemical surroundings due to the reallocation of the excess electrons from the missing C-atoms. This work observed chemical shifts of 0.5, 0.3, and 0.6 eV for the CN100, CNZ-40, and CNZ-20 samples, respectively. In terms of binding energy, it indicates possible carbon vacancies capable of trapping photoactivated electrons to react with molecular oxygen on the surface, generating species such as O2 and OH [61]. The peak at 286 eV, observed in sample Z100, is attributed to the C-OH bond, which may be present due to traces of ethyl alcohol used during the synthesis of ZnO by the solvothermal method. Finally, in the N 1s spectrum shown in Figure 7d, the peak at 398.7 eV corresponds to the C=N-C structure, evidencing the existence of triazine rings [38]. The peak shift to 398.5 eV in the CNZ-x nanocomposites is attributed to nitrogen vacancies, which induce a peak shift in the valence and conduction bands, thereby introducing mid-gap defect states. This phenomenon may also account for the observed bandgap modulation and the nitrogen vacancy-induced alterations in optical properties [62]. Consequently, the electronic structure of CNZ-x samples is modified by nitrogen vacancies, which is expected to improve the photocatalytic activity, particularly in the CNZ-20 sample.
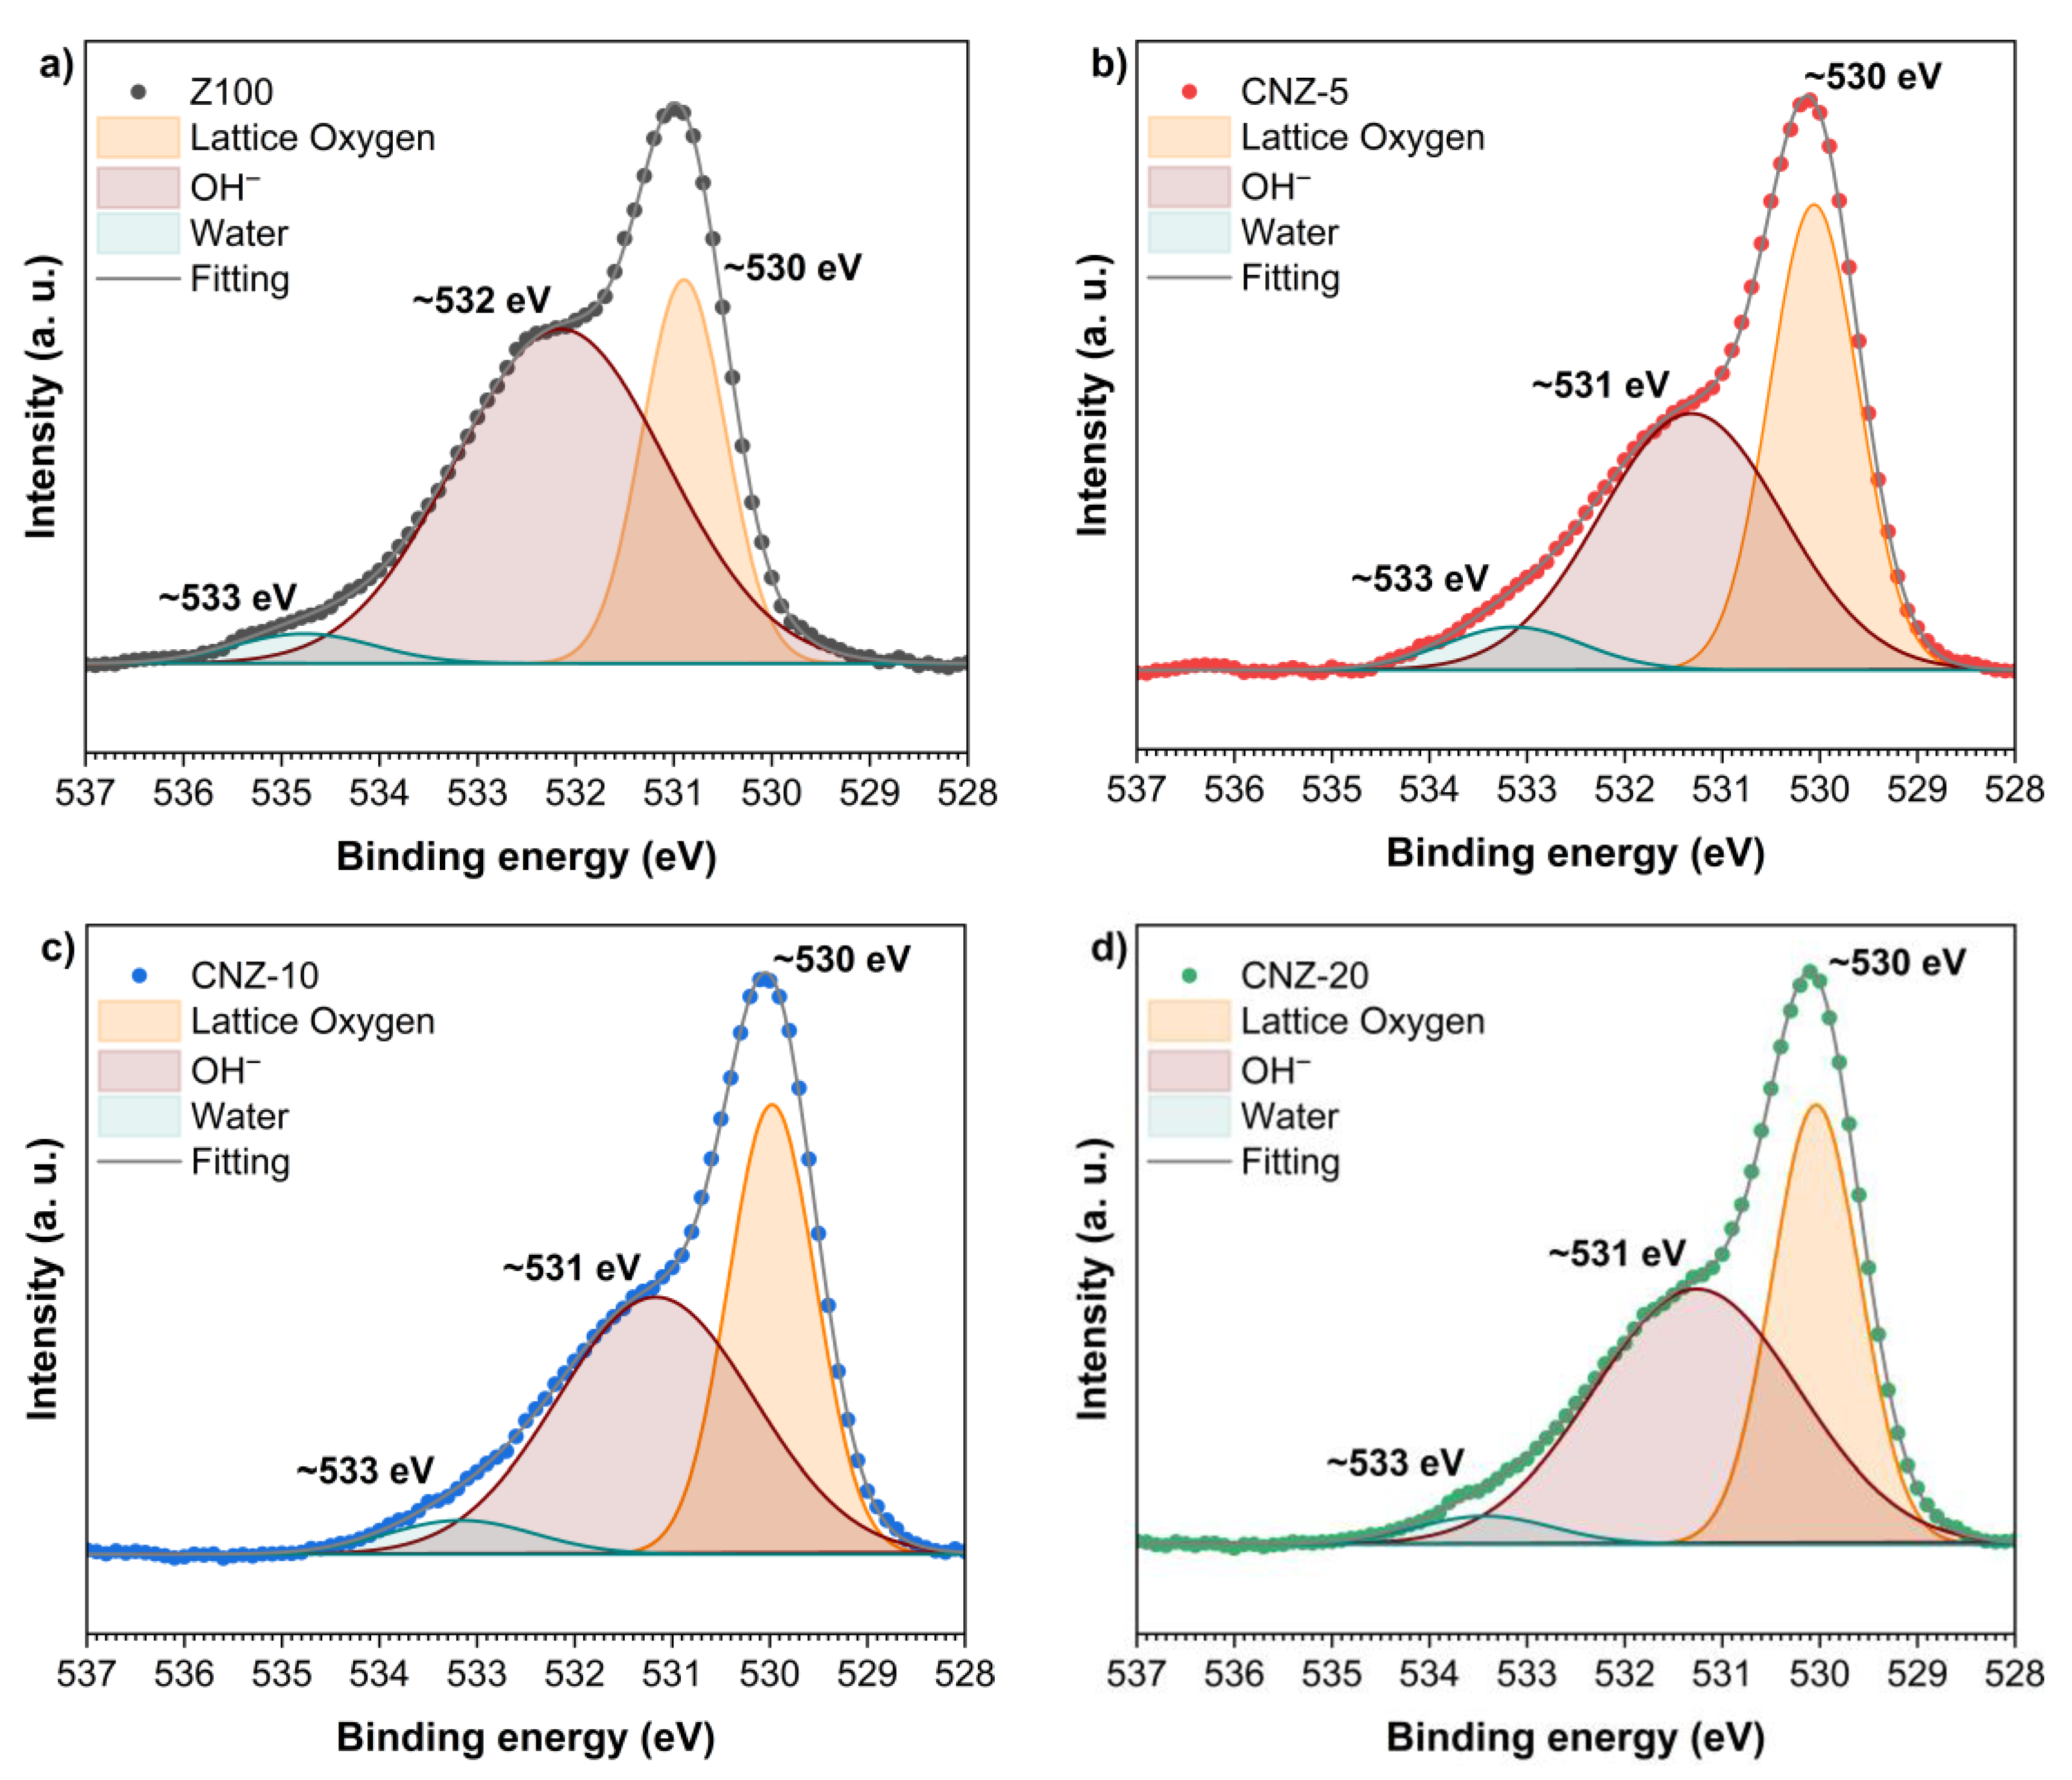
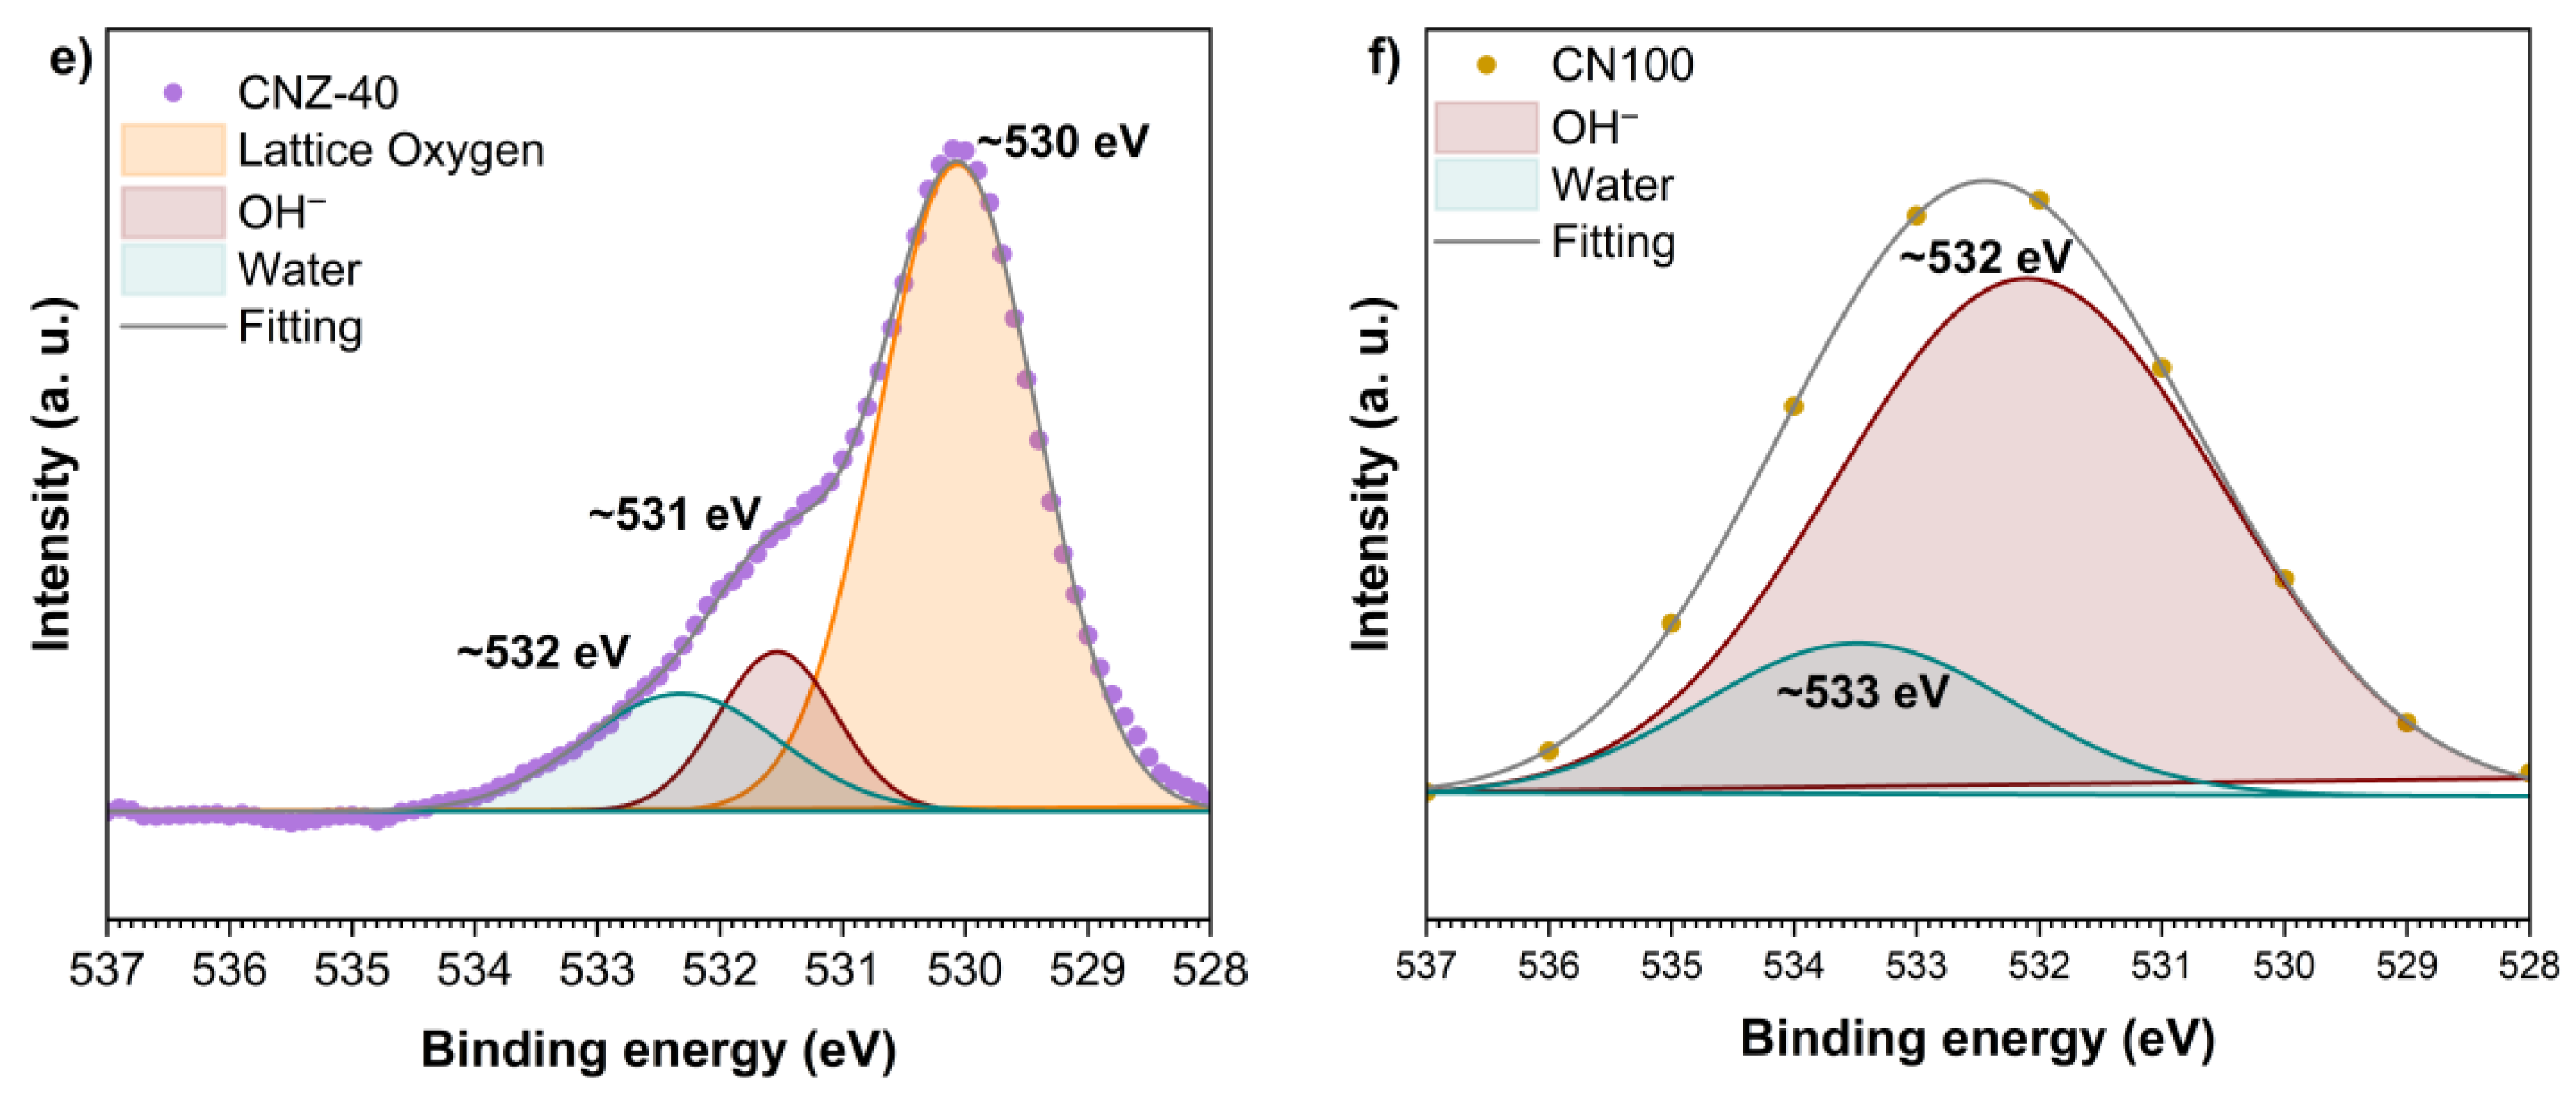
Figure 8 shows the O1s spectra of samples Z100, CN100, and CNZ-x. Deconvolution of the O 1s spectra was performed (Figure 8a–f), and four peaks were identified at 530, 531, 532, and 533 eV. These peaks correspond to the binding energies of Zn-O in the lattice (530 eV), OH ions (between 531 and 532 eV), and water molecules (533 eV) adsorbed on the surface of the samples, respectively [63]. These oxygen species are believed to be associated with surface defects, indicating that the CNZ-20 nanocomposite possesses a high density of such defects [64]. Numerous studies have suggested that variations in photocatalytic activity among different semiconductors are primarily attributed to differences in the concentration and nature of oxygen-related defects [48]. The O 1s spectra of the pure sample Z100 (Figure 8a) and CNZ-x nanocomposites (Figure 8b–e) showed evidence of ZnO bonds, confirming their presence in bare ZnO and ZnO/g-C3N4 nanocomposites, while, in the CN100 sample (Figure 8f), only the characteristic peaks of OH and molecule bonds were identified evidencing the purity of g-C3N4.

2.7. Adsorption and Photocatalytic Degradation

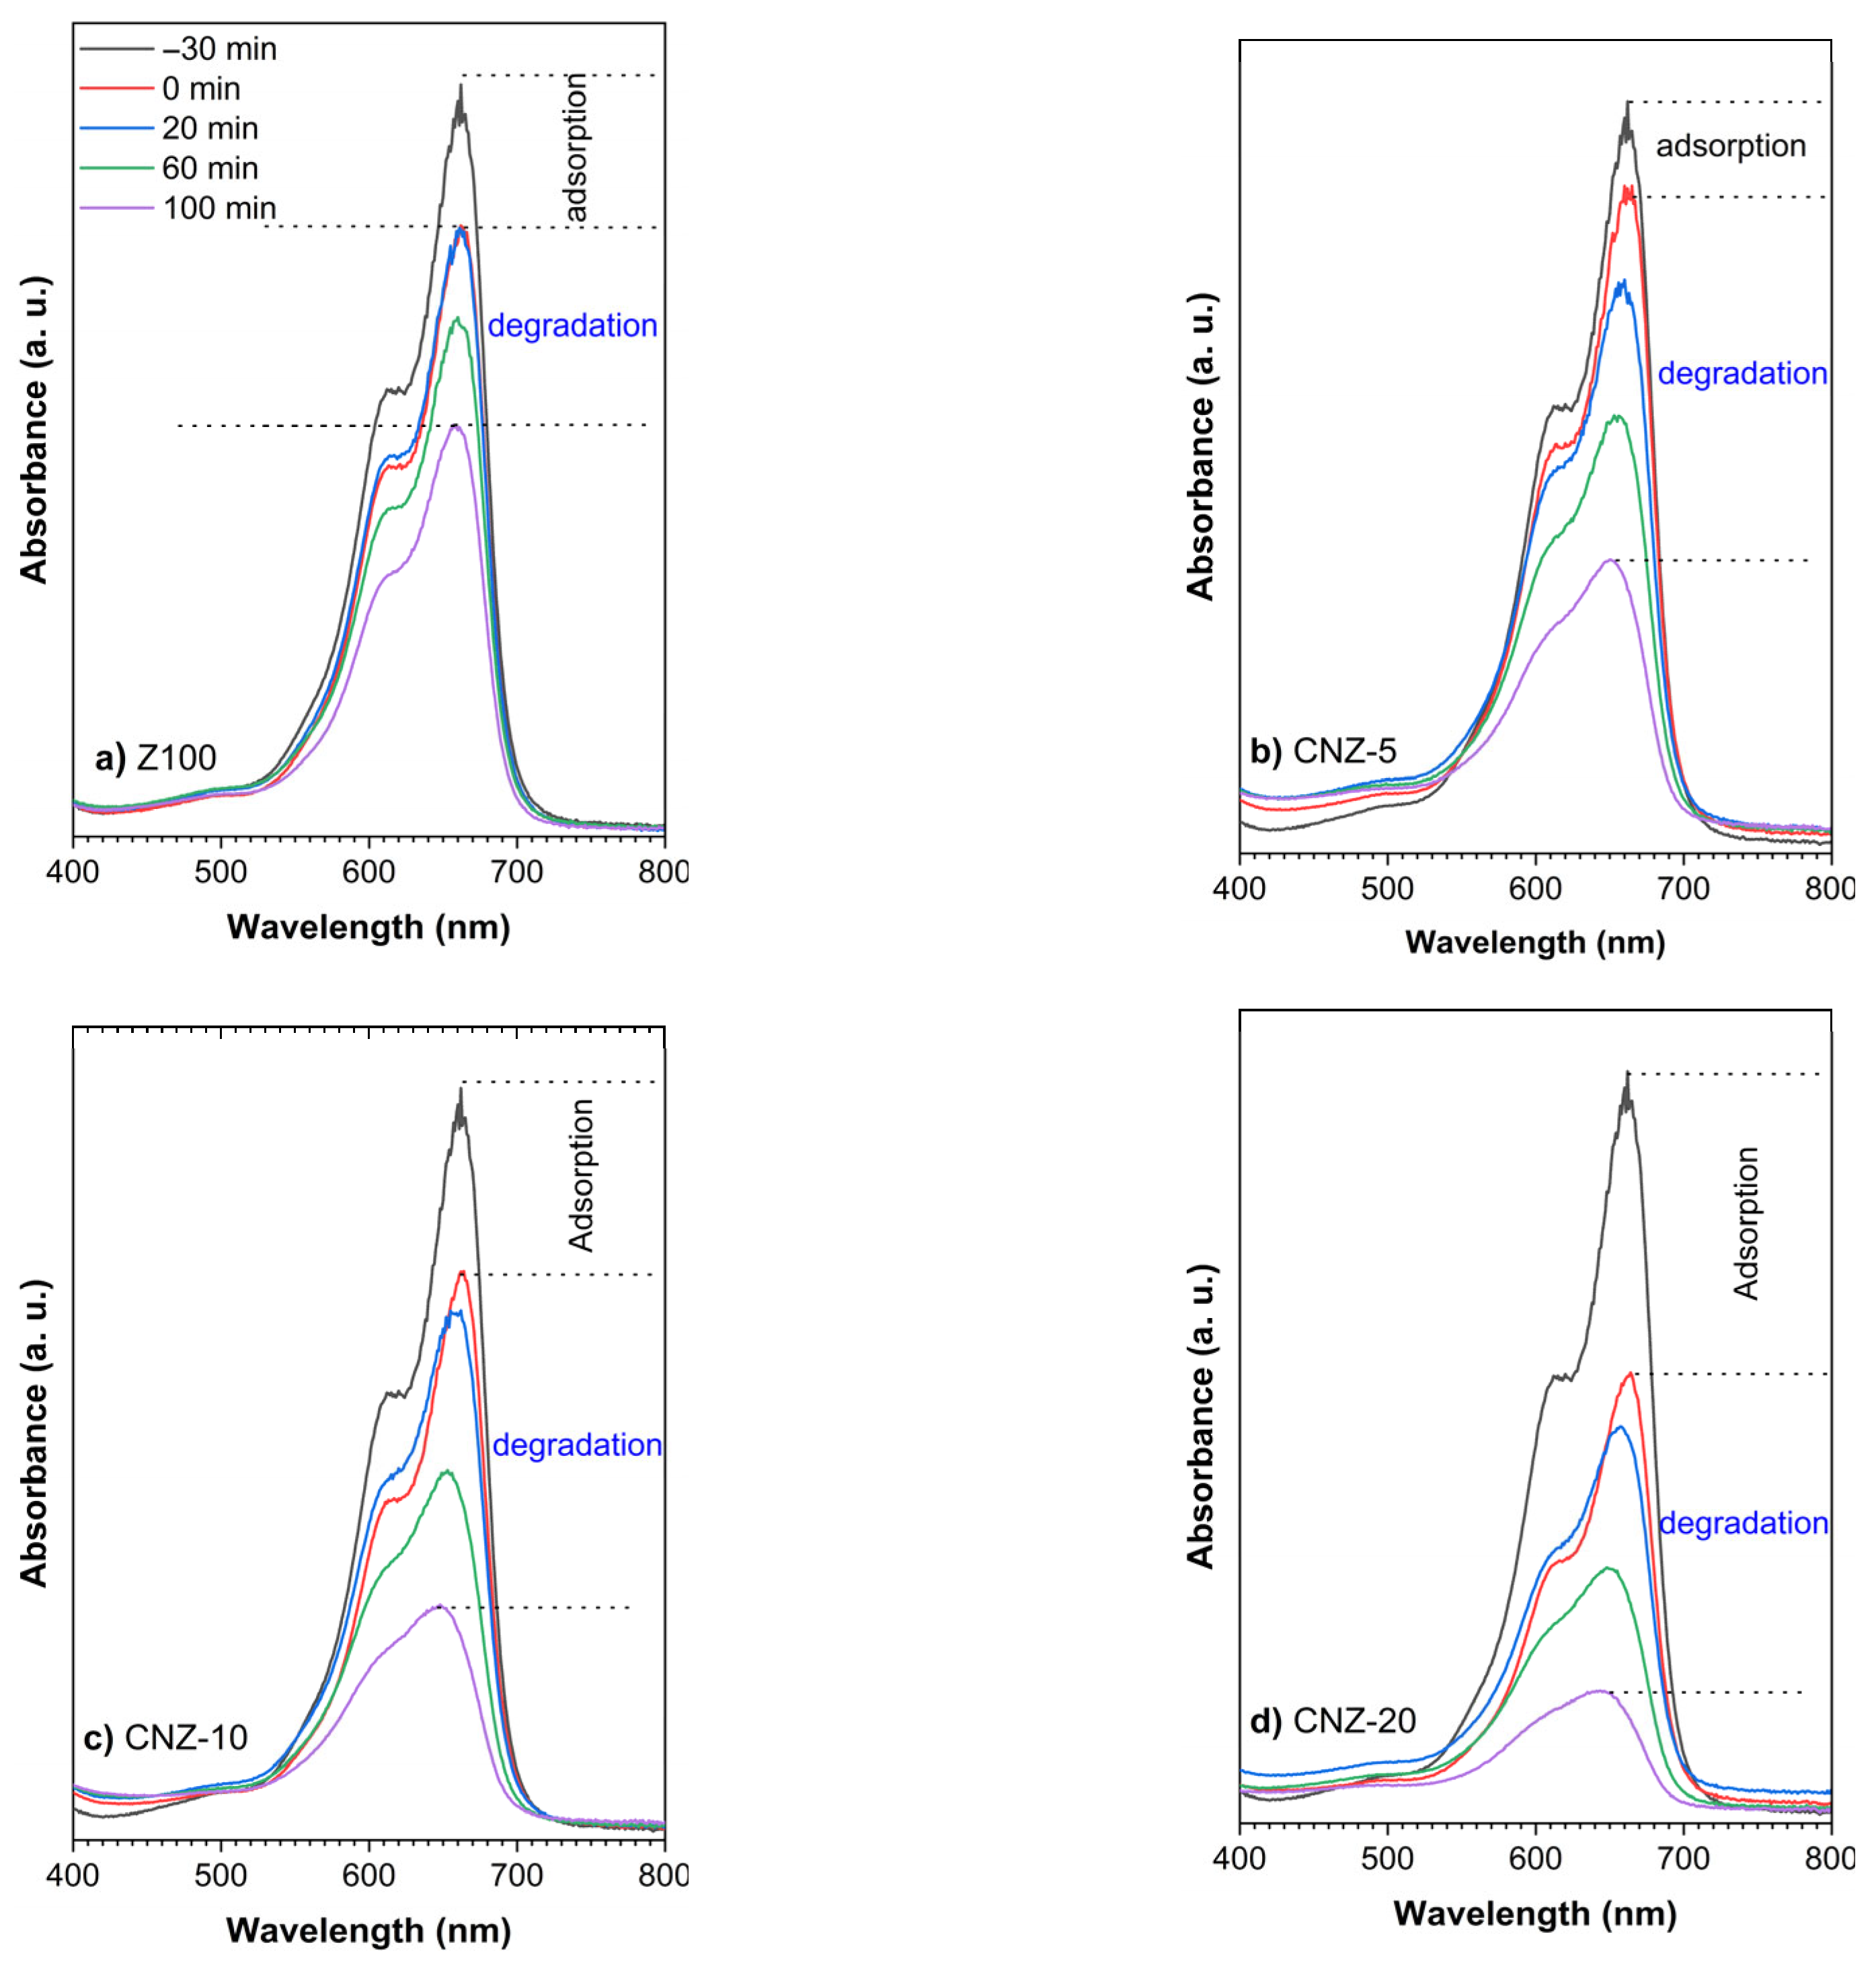
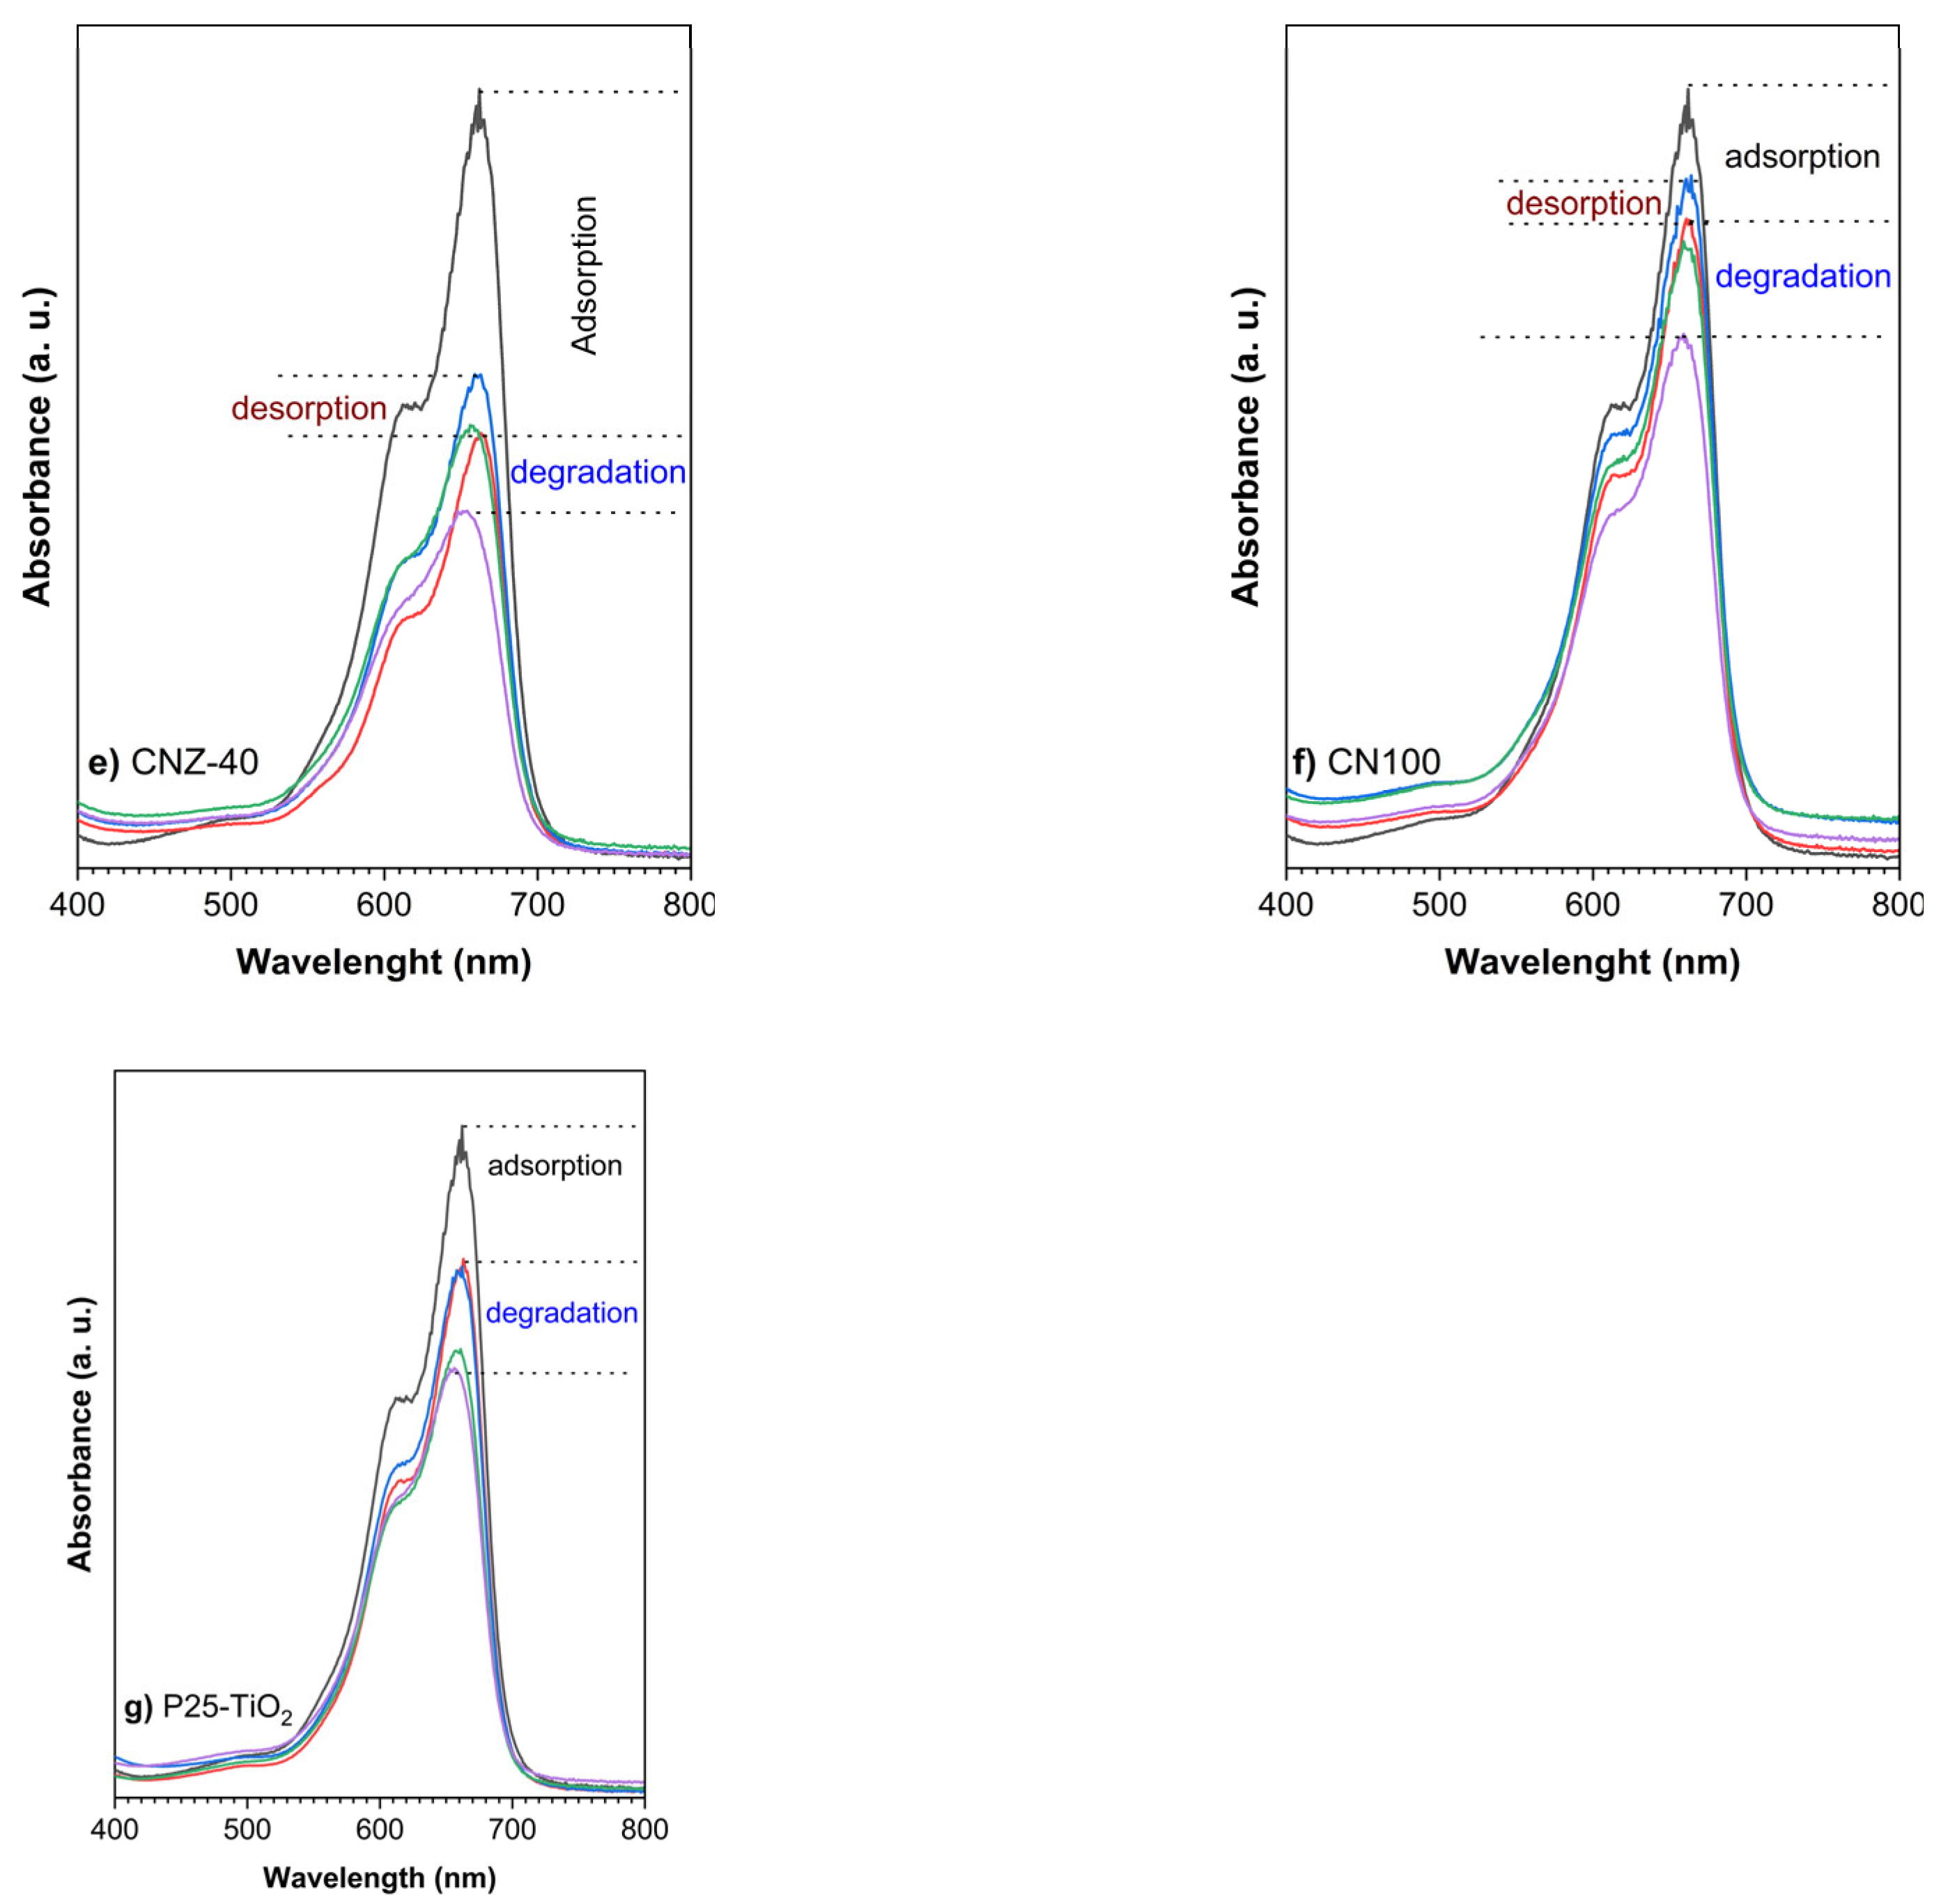
The adsorption and photocatalytic performance of the samples were examined using a 50 mg/L model solution of MB dye. Figure 9 shows the absorption spectra of the MB dye after 30 min of adsorption in the dark and at different visible light exposure times (0, 20, 60, and 100 min) from the Z100, CN100, and CNZ-x samples, and the commercial reference P25-TiO2.
Processing the spectra qualitatively revealed a progressive reduction in the intensity of the MB absorption bands (λmax = 664 nm). These spectra indicated the removal of the contaminant through adsorption and photocatalytic degradation when the experiment was carried out under photon illumination with visible light. Figure 9a shows the absorption spectra of sample Z100, indicating that pure ZnO exhibited adsorption of MB for 30 min and minimal degradation during the first 20 min of visible light irradiation. (Figure 9b–e show the absorption spectra for the CNZ-x nanocomposites, where the increase in dye adsorption was evident as the proportion of g-C3N4 increased, with the CNZ-20 sample exhibiting the highest adsorption and photocatalytic effect. The CNZ-40 nanocomposite (Figure 9e) exhibited similar adsorption to CNZ-20 (Figure 9d); however, a desorption effect occurred during 60 min of irradiation with visible light, indicating a less pronounced photocatalytic effect. Figure 9f shows the absorption spectra of sample CN100, indicating that pure g-C3N4 exhibited adsorption and desorption, but displayed the lowest photocatalytic performance. Finally, Figure 9g corresponds to the commercial P25-TiO2 sample, which exhibited no significant adsorption or desorption of MB, and only minimal degradation under visible light irradiation. This behavior is attributed to the limited absorption of P25-TiO2 in the visible region, since the lamp used in this study emitted primarily in the 400–1050 nm range.
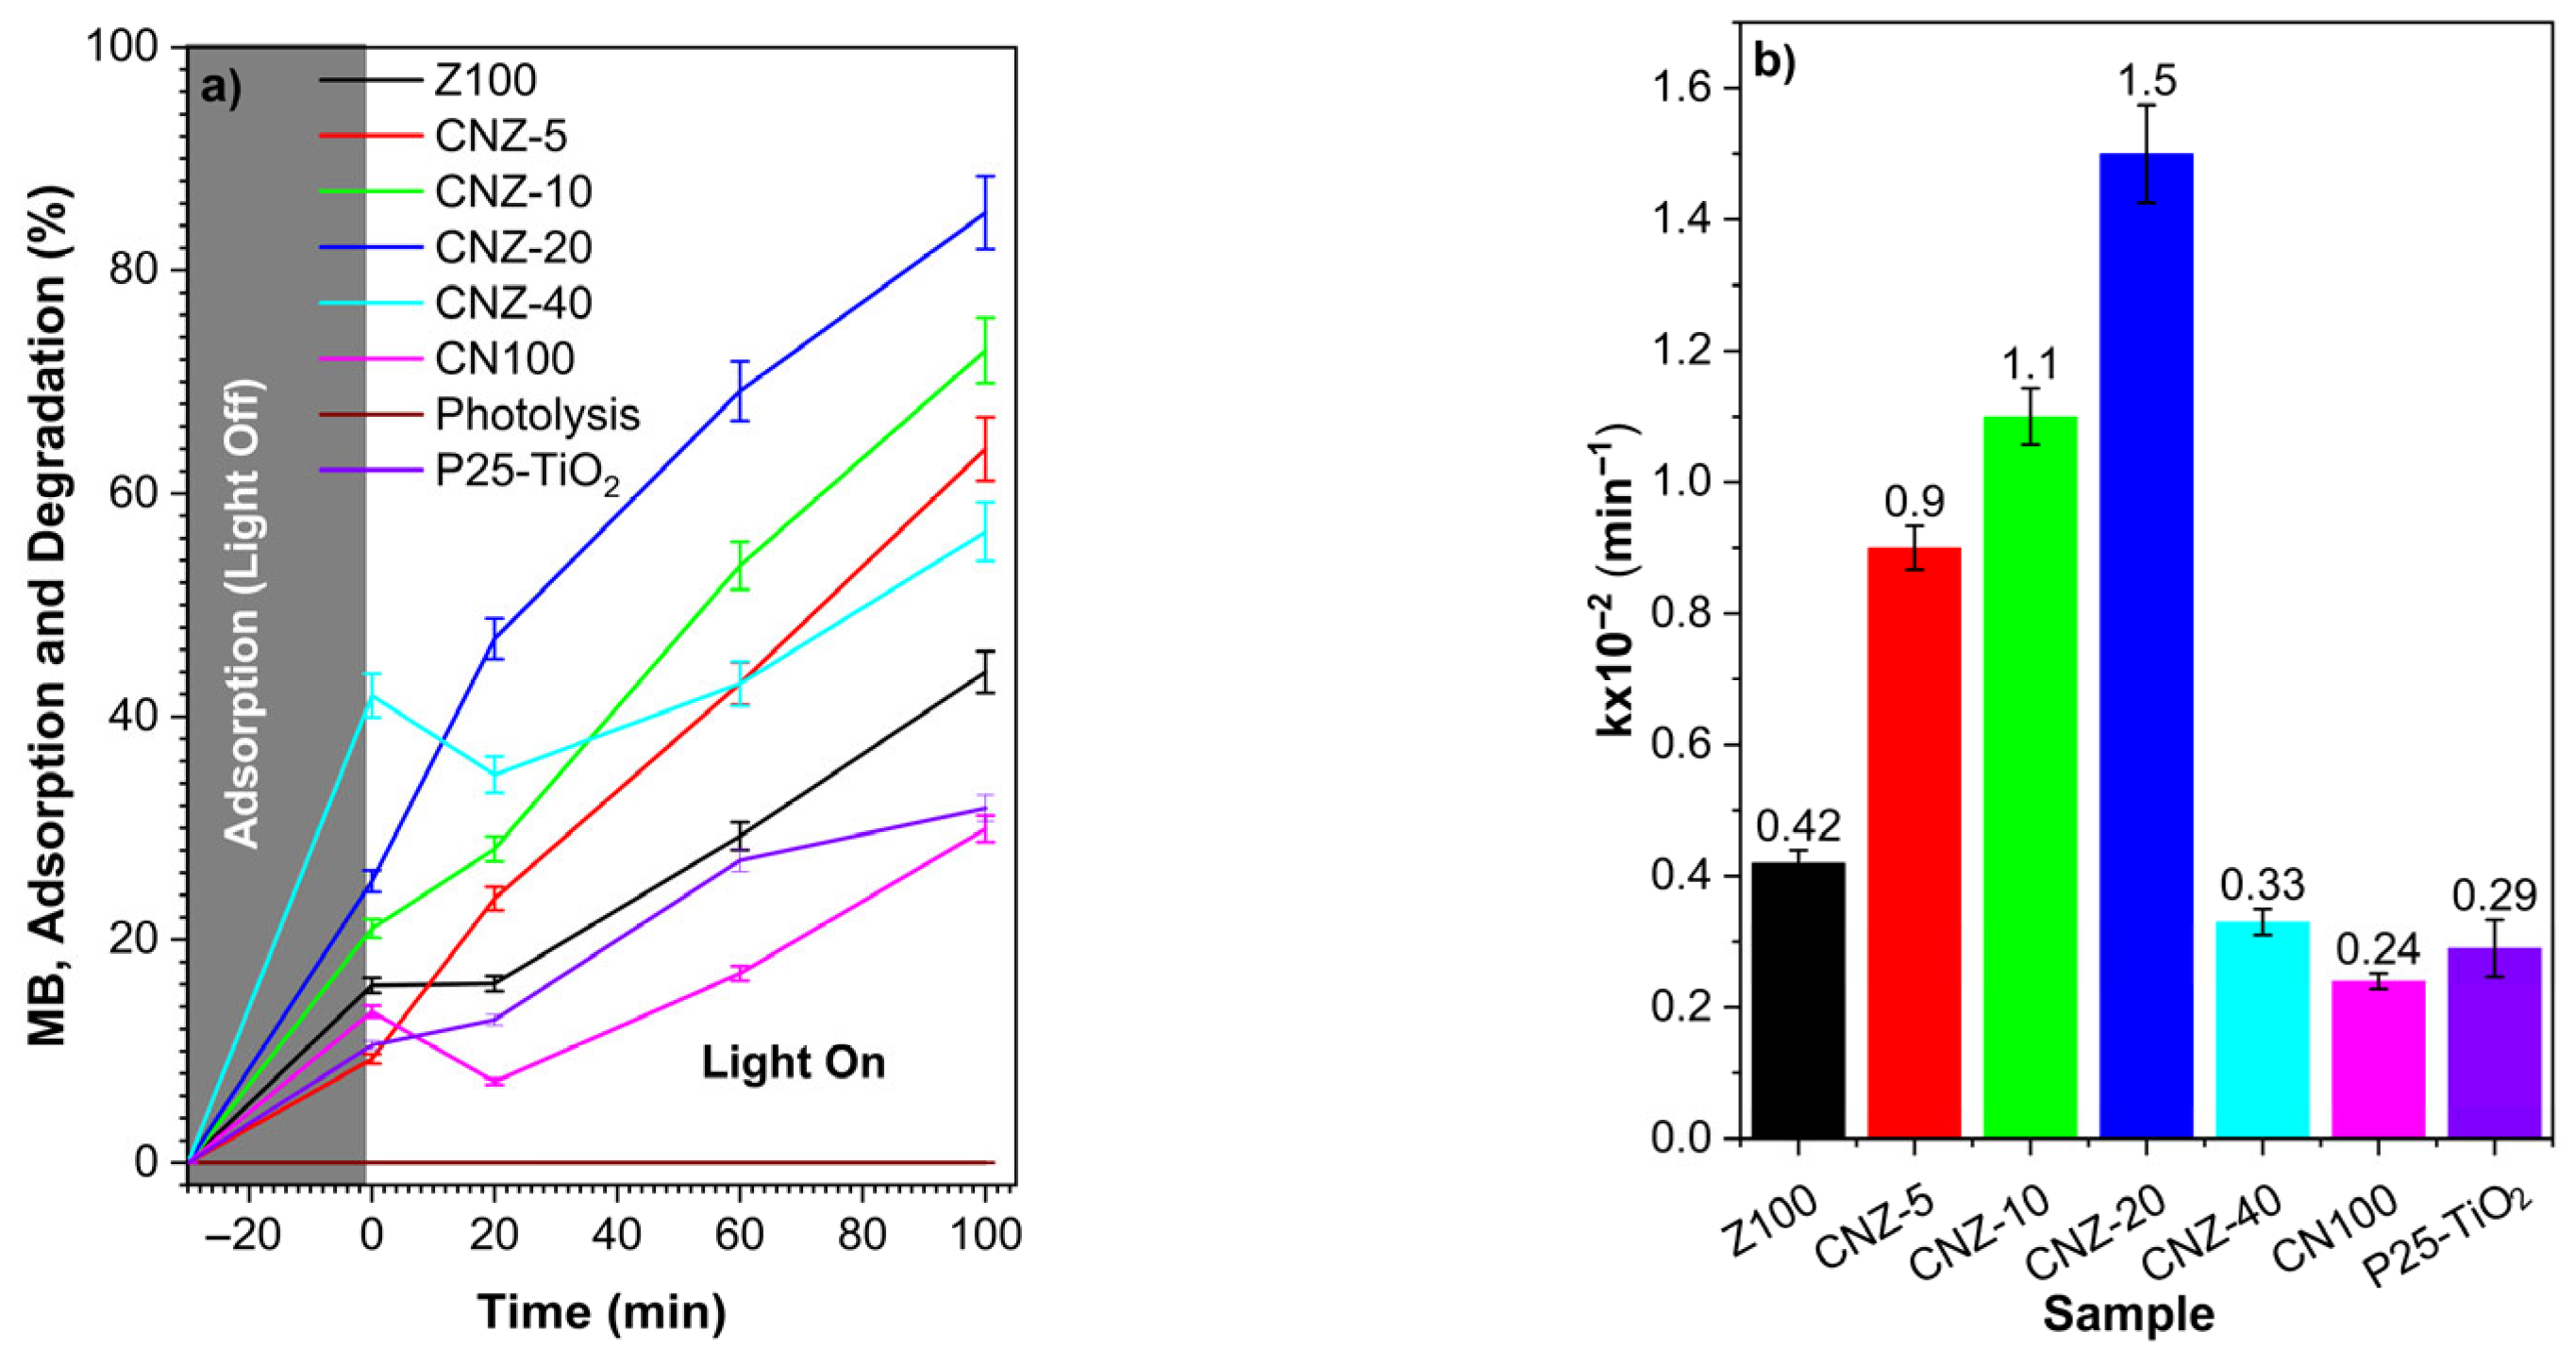
The quantitative evaluation of the samples’ performances in terms of removal and degradation efficiencies by the photocatalyst was calculated. Figure 10a shows the adsorption after 30 min in the dark, with the reaction order being CNZ-40 > CNZ-20 > CNZ-10 > Z100 > CN100 > CNZ-5, resulting in 41.9% (CNZ-40) and 9.3% (CNZ-5) MB removal. However, as mentioned in the absorption spectra for qualitative analysis, the pure CN100 and the nanocomposite CNZ-40 exhibited 6.9% and 7.3% MB desorption, respectively, during the first 20 and 60 min. This behavior is attributed to the presence of nitrogen-containing surface groups (–NH2, C = N) and π–π stacking interactions between the aromatic rings of g-C3N4 and the dye molecules. However, upon switching on the irradiation source, a partial desorption of methylene blue was observed, particularly in the CN100 sample. This desorption can be explained by the disruption of weak physical interactions due to localized heating and the re-establishment of dynamic equilibrium at the solid–liquid interface. In contrast, CNZ-40 showed only slight desorption, which was rapidly followed by enhanced photocatalytic degradation. The highest photocatalytic degradation efficiency was observed for the CNZ-20 nanocomposite after 100 min of reaction under visible light irradiation (85%), while the lowest was for the pure g-C3N4 sample (CN100) at 30%. In comparison, the commercial P25-TiO2 photocatalyst showed an intermediate behavior, with 10% adsorption and 31% photocatalytic degradation under the same conditions. These results further highlight the superior performance of the CNZ-20 nanocomposite under visible light. Table S1 (Supplementary Material) summarizes the adsorption removal, desorption, and photocatalytic degradation behavior of MB during the reaction time.
Zhang and Jaroniec [65] reported a study on adsorption for photocatalysis, highlighting that the reactant species must first be adsorbed onto the photocatalyst surface. Indeed, it is very common to find in research reported in the literature that photocatalytic evaluations were carried out by keeping the solution with the pollutant and the photocatalyst in agitation to achieve the adsorption–desorption equilibrium [37,38,66]. However, it is generalized by stating that the adsorption–desorption equilibrium is reached by maintaining the solution and the photocatalyst in agitation in the dark. Table S1 shows that higher adsorption of the material does not necessarily result in higher dye degradation. Considering that adsorption is a surface process involving the interaction between adsorbates and adsorbents occurring by physisorption, it should be noted that this is a reversible process, since physisorption is governed by weak intermolecular forces, such as van der Waals force interactions and hydrogen bonds [67].
Furthermore, Zhu et al. [68] reported that the synthesized samples exhibited efficient adsorption of MB dye, primarily attributed to the surface charges of g-C3N4, which are modulated by the presence of functional groups. However, it is possible that samples CN100 and CNZ-40 experienced desorption, as observed in the photocatalytic degradation process, where a higher content of g-C3N4-100% in CN100 and 40% in CNZ-40 resulted in lower degradation efficiency. The CN100 sample presented the lowest degradation percentage; therefore, although MB molecules were initially adsorbed, parameters such as temperature, interaction time, adsorbate–adsorbent interaction forces, concentration, and other physicochemical parameters may have favored MB desorption [68]. Moreover, the photocatalytic reaction rate is slower than the adsorption rate [67]. In the case of sample CNZ-20, despite reaching 25.7% adsorption, the adsorbed MB molecules were rapidly degraded (85% after 100 min) once the photocatalytic process was initiated, preventing their desorption.
The kinetic parameters of the photocatalytic degradation of MB dye were evaluated for all samples using visible light. The k-constants were determined by fitting the experimental data to a first-order kinetic model using the linearized equation ln (Ct/C0) vs. t. Among the investigated samples, bare g-C3N4 (CN100) showed the lowest photocatalytic performance with a k = 0.24 × 10⁻² min−1, whereas the ZCN-20 nanocomposite demonstrated the highest degradation efficiency, achieving a k = 1.45 × 10⁻² min−1. The regression for CN100, Z100, CNZ-10, and CNZ-20 yielded high R2 values, indicating that the degradation reaction followed a first-order kinetic model. In contrast, variations in the composition of the nanocomposites influenced the MB degradation rate, highlighting the role of g-C3N4/ZnO ratios in determining the reaction kinetics. The estimated half-life values ranged from 47.8 (CNZ-20) to 288.81 min (CN100), demonstrating the influence of nanocomposite composition on the reaction kinetics. For comparison, the commercial P25-TiO2 photocatalyst exhibited a kinetic constant of k = 0.29 × 10⁻² min−1 and a half-life of 235 min, confirming its limited activity under light and further emphasizing the superior performance of CNZ-20. The complete details of the kinetic parameters (k, t1/2, and R2) are presented in Table 4.
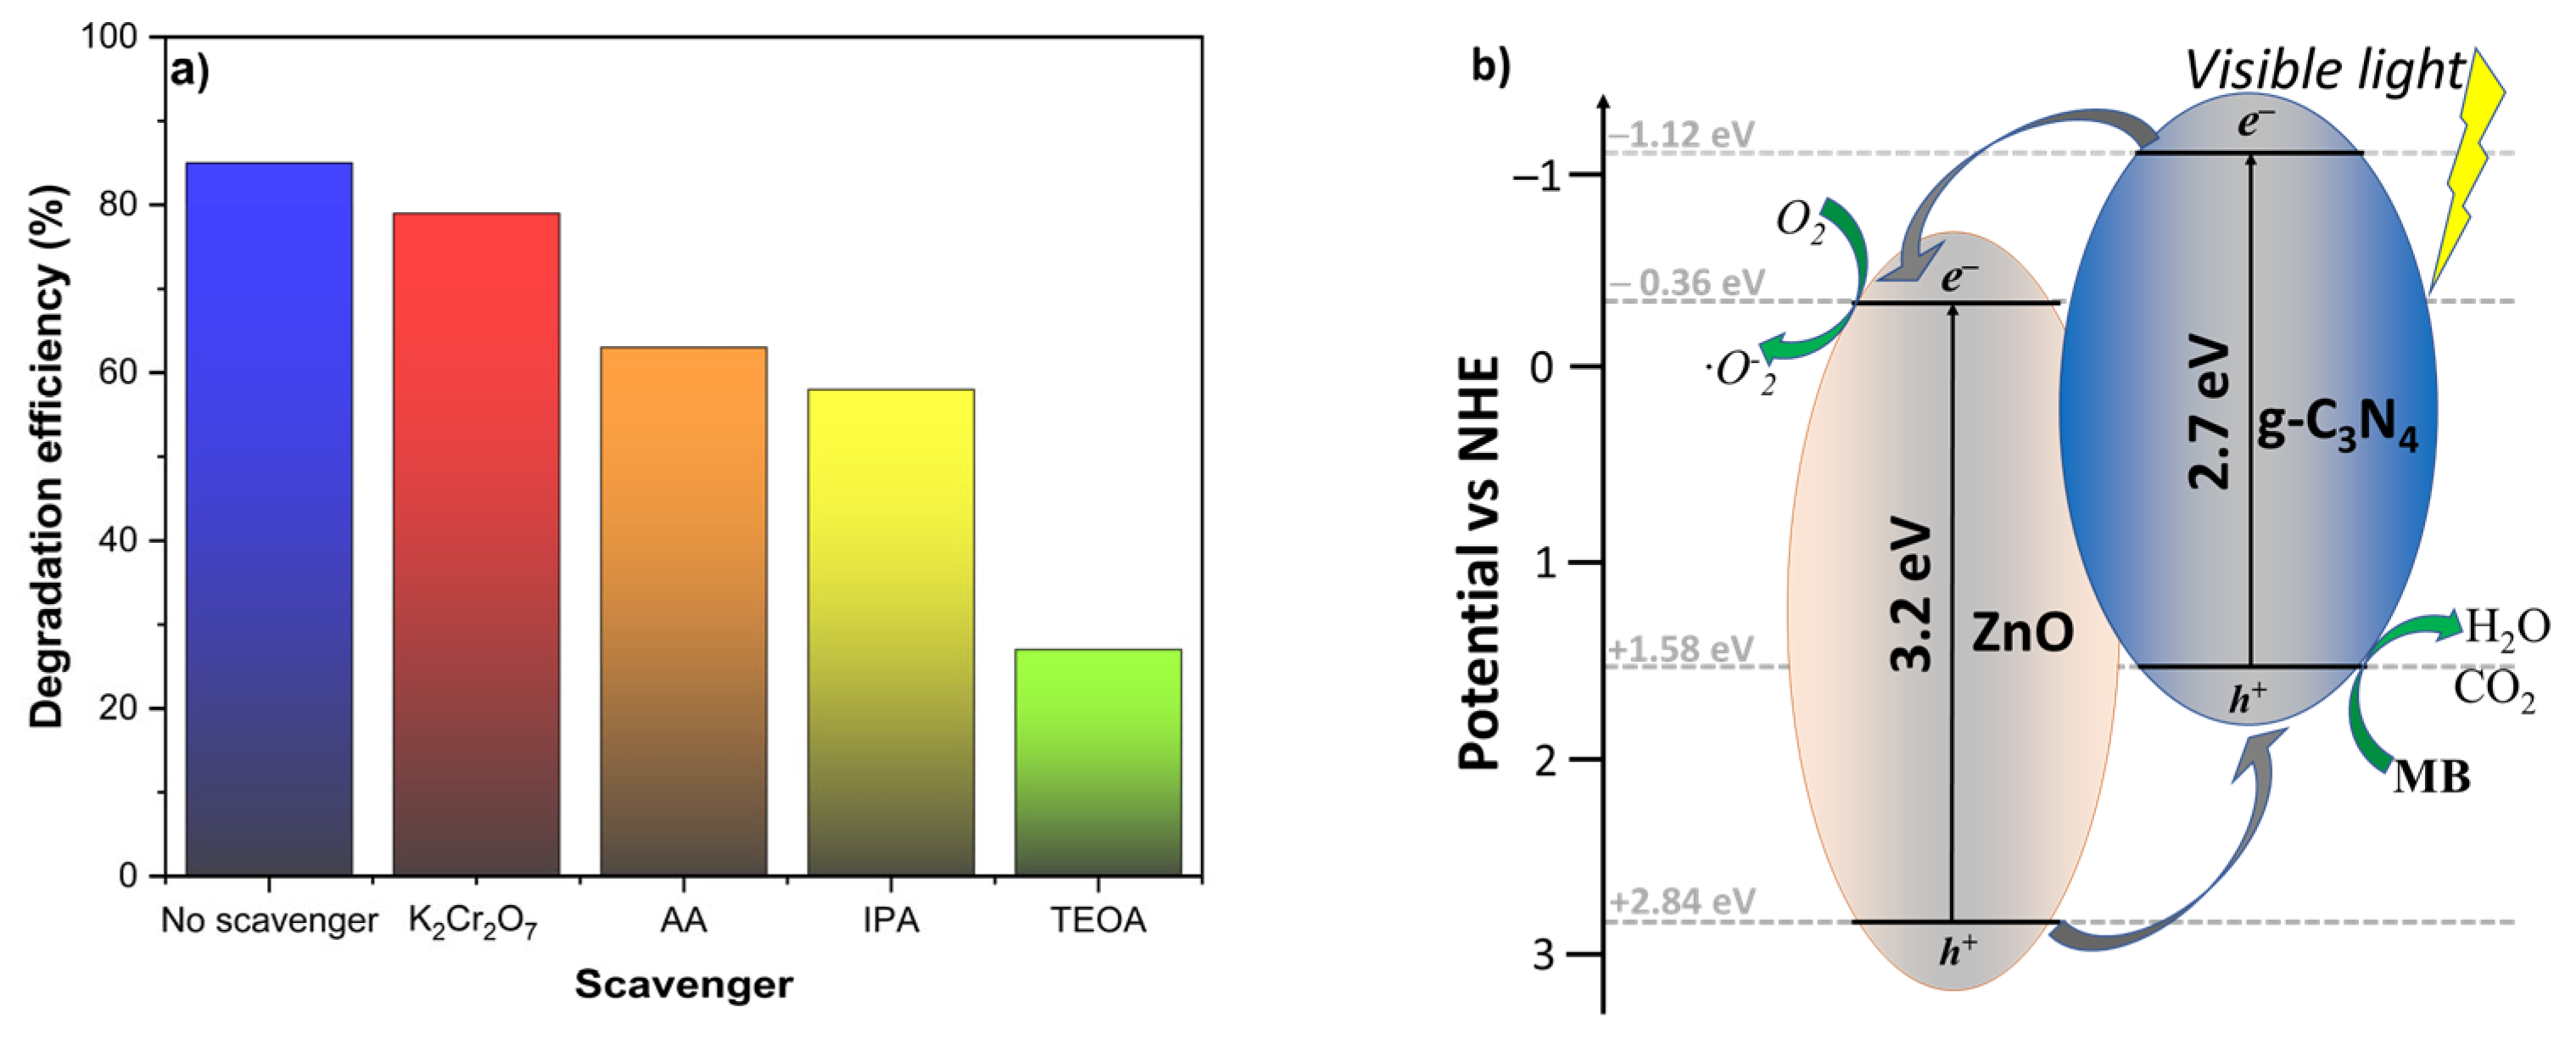
We could discuss the mechanism based on the characterization and photocatalytic evaluation results. The charge transfer process and photodegradation of MB on the surface of the g-C3N4/ZnO photocatalyst under visible light are illustrated in Figure 11b. Determining the flat bands and band gap of the involved semiconductors is crucial for understanding the separation dynamics of the photogenerated charge carriers. At the zero-charge point, the conduction band (CB) and valence band (VB) potentials of the ZnO and g-C3N4 components in the photocatalytic g-C3N4/ZnO system were estimated by the equations [69,70]:
ECB = EVB − Eg,
EVB = χ − Ee + 0.5Eg,
where χ represents the electronegativity of the semiconducting materials, with values of approximately 4.73 eV for g-C3N4 [71] and 5.76 eV for ZnO [72]. In addition, Ee denotes the free electron energy level on the standard hydrogen electrode (NHE) scale (4.5 eV). At the same time, Eg refers to the estimated band gap, which is approximately 2.7 eV for g-C3N4 and 3.2 eV for ZnO. The calculated CB and VB potentials for ZnO are ECB = −0.36 eV (ECB) and EVB = +2.84 eV (EVB), respectively. Similarly, for g-C3N4, these values are ECB = −1.12 eV and EVB = +1.58 eV [73].
To investigate the role of reactive oxygen species (ROS) in the photocatalytic degradation of MB, trapping experiments were conducted using the CNZ-20 composite under visible light irradiation. Selective scavengers were employed to quench specific species: triethanolamine (TEOA) for holes (h⁺), ascorbic acid (AA) for superoxide radicals (·O2), isopropyl alcohol (IPA) for hydroxyl radicals (·OH), and potassium dichromate (K2Cr2O7) for electrons (e). In the control test without scavengers, MB degradation reached 85%. Upon addition of TEOA, the degradation efficiency dropped drastically to 27%, highlighting the predominant role of h⁺ in the oxidation process (Figure 11a). AA and IPA led to moderate decreases (63% and 58%, respectively), indicating that ·O2 and ·OH contribute as secondary oxidative species. In contrast, the presence of K2Cr2O7 caused only a slight decrease (to 79%), suggesting minimal direct involvement of free electrons. The effects observed upon scavenger addition (Figure 11a) provide experimental evidence for the involvement of h⁺ as the primary active species, along with a synergistic contribution from ·O2 and ·OH radicals in the photocatalytic degradation pathway.
These results support a type-II heterojunction mechanism in which, under visible light, g-C3N4 efficiently generates the electron–hole pairs (e/h) under excitation with visible light in the g-C3N4/ZnO nanocomposite [21,38,60]. The electrons excited in the CB of g-C3N4 (−1.12 eV vs. NHE) are transferred to the CB of ZnO (−0.36 eV), enabling the reduction of molecular oxygen to O2 [20,40], enhancing charge carrier separation and reducing recombination [19], and acting as potent oxidizing agents, degrading MB dye molecules. Simultaneously, photogenerated holes accumulate in the VB of g-C3N4, where they oxidize MB dye [74]. This spatial separation of charge carriers reduces recombination and promotes efficient ROS generation [20,74].
Various experimental parameters influence the photocatalytic reaction efficiency in degrading organic contaminants in water. The primary factors are the initial conditions of dye concentration and the mass of the photocatalyst, as well as the type of irradiation source with varying power and emitting radiation wavelengths in the UV and visible spectra. Table 5 compares different reports for the degradation of MB dye using g-C3N4/ZnO nanocomposites. Table 5 shows that the degradation percentage and the reaction rate constant are similar to those reported in previous studies, highlighting the influence of the initial concentration of MB dye, the initial mass of the nanocomposite, the reaction time, and the irradiation source in the visible spectrum. Furthermore, based on the synthesis methods summarized in the table, the solvothermal microwave treatment likely enhanced the exfoliation of the nanocomposite, leading to an increased surface area and, consequently, improved photocatalytic performance.

2.8. Repeatability, Reuse, and Stability Tests

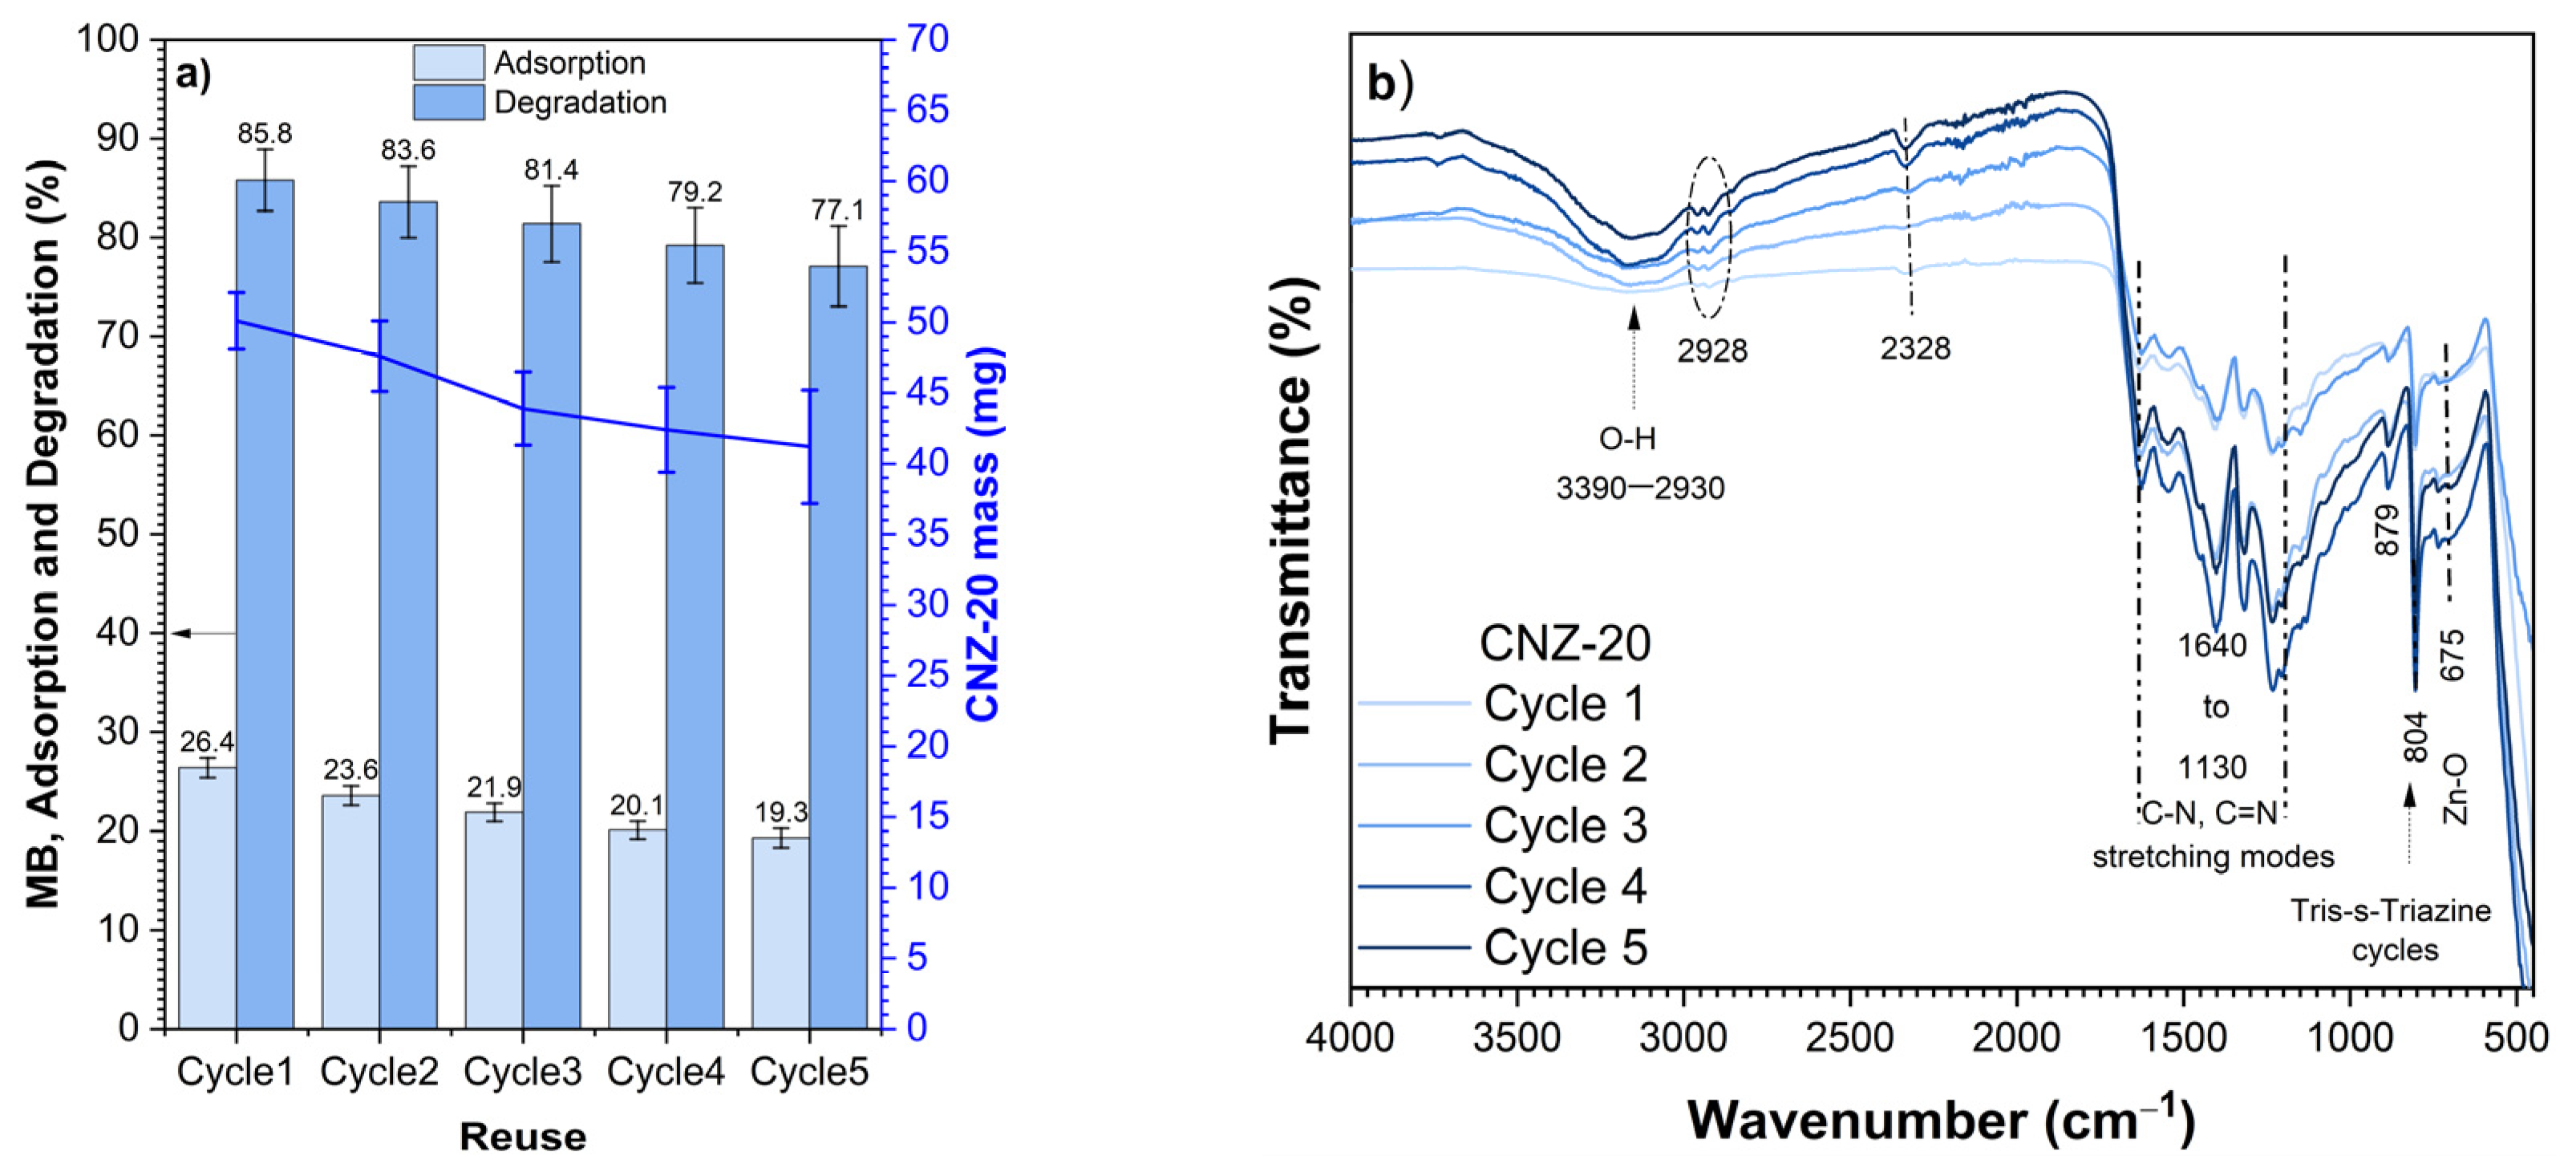
Reusability of a photocatalyst is a key factor for scale-up, as it directly impacts long-term operational stability and economic feasibility. To assess this, the CNZ-20 nanocomposite was resynthesized and tested over five reuse cycles under identical photocatalytic conditions. Figure 12a shows the degradation efficiency and adsorption capacity across the cycles, with error bars indicating standard deviations from triplicate measurements. The initial dark adsorption was 26.4 ± 1.01%, decreasing to 19.34 ± 0.98% by the fifth cycle. The photocatalytic degradation efficiency showed a gradual reduction from 85.75 ± 3.12% to 77.02 ± 4.06%.
To evaluate these variations statistically, a normality test using the Kolmogorov–Smirnov method confirmed that the data followed a normal distribution (p > 0.7 for both parameters; Table S2). One-way ANOVA then revealed statistically significant differences among the reuse cycles in both adsorption (p = 2.97 × 10⁻⁸; Table S3) and photocatalytic degradation (p = 2.08 × 10⁻⁴; Table S3). Further analysis using Tukey’s post hoc test (Table S4) indicated that Cycle 1 differs significantly from Cycles 4 and 5, confirming a progressive yet controlled decline in performance over time. This decline is likely related to physical losses during photocatalyst recovery, as supported by the mass reduction from 50 mg to 41.2 ± 4.1 mg after Cycle 5 [38].
Figure 12b presents FTIR spectra of the CNZ-20 nanocomposite after each photocatalytic reaction, allowing for the assessment of material stability throughout the reuse cycles. These spectra were compared with those in Figure 2 (blue line), showing two additional absorption bands that emerged as the g-C3N4/ZnO system underwent multiple degradation cycles. The new band at 2328 cm−1 was assigned to CO2 adsorption, corresponding to the coupling of the asymmetric stretching and bending modes of CO2. This experimental result suggests atmospheric CO2 uptake on the nanocomposite surface during FTIR analysis [76]. Furthermore, a band at 2928 cm−1 was observed, which is attributed to methyl (-CH3) and/or methylene (-CH2-) groups. These signals correspond to -CH3 functional groups in the MB dye structure [77]. Their presence suggests that residual MB molecules may have remained adsorbed on the material’s surface even after washing, indicating potential limitations in the complete removal of dye during photocatalytic reusability testing.
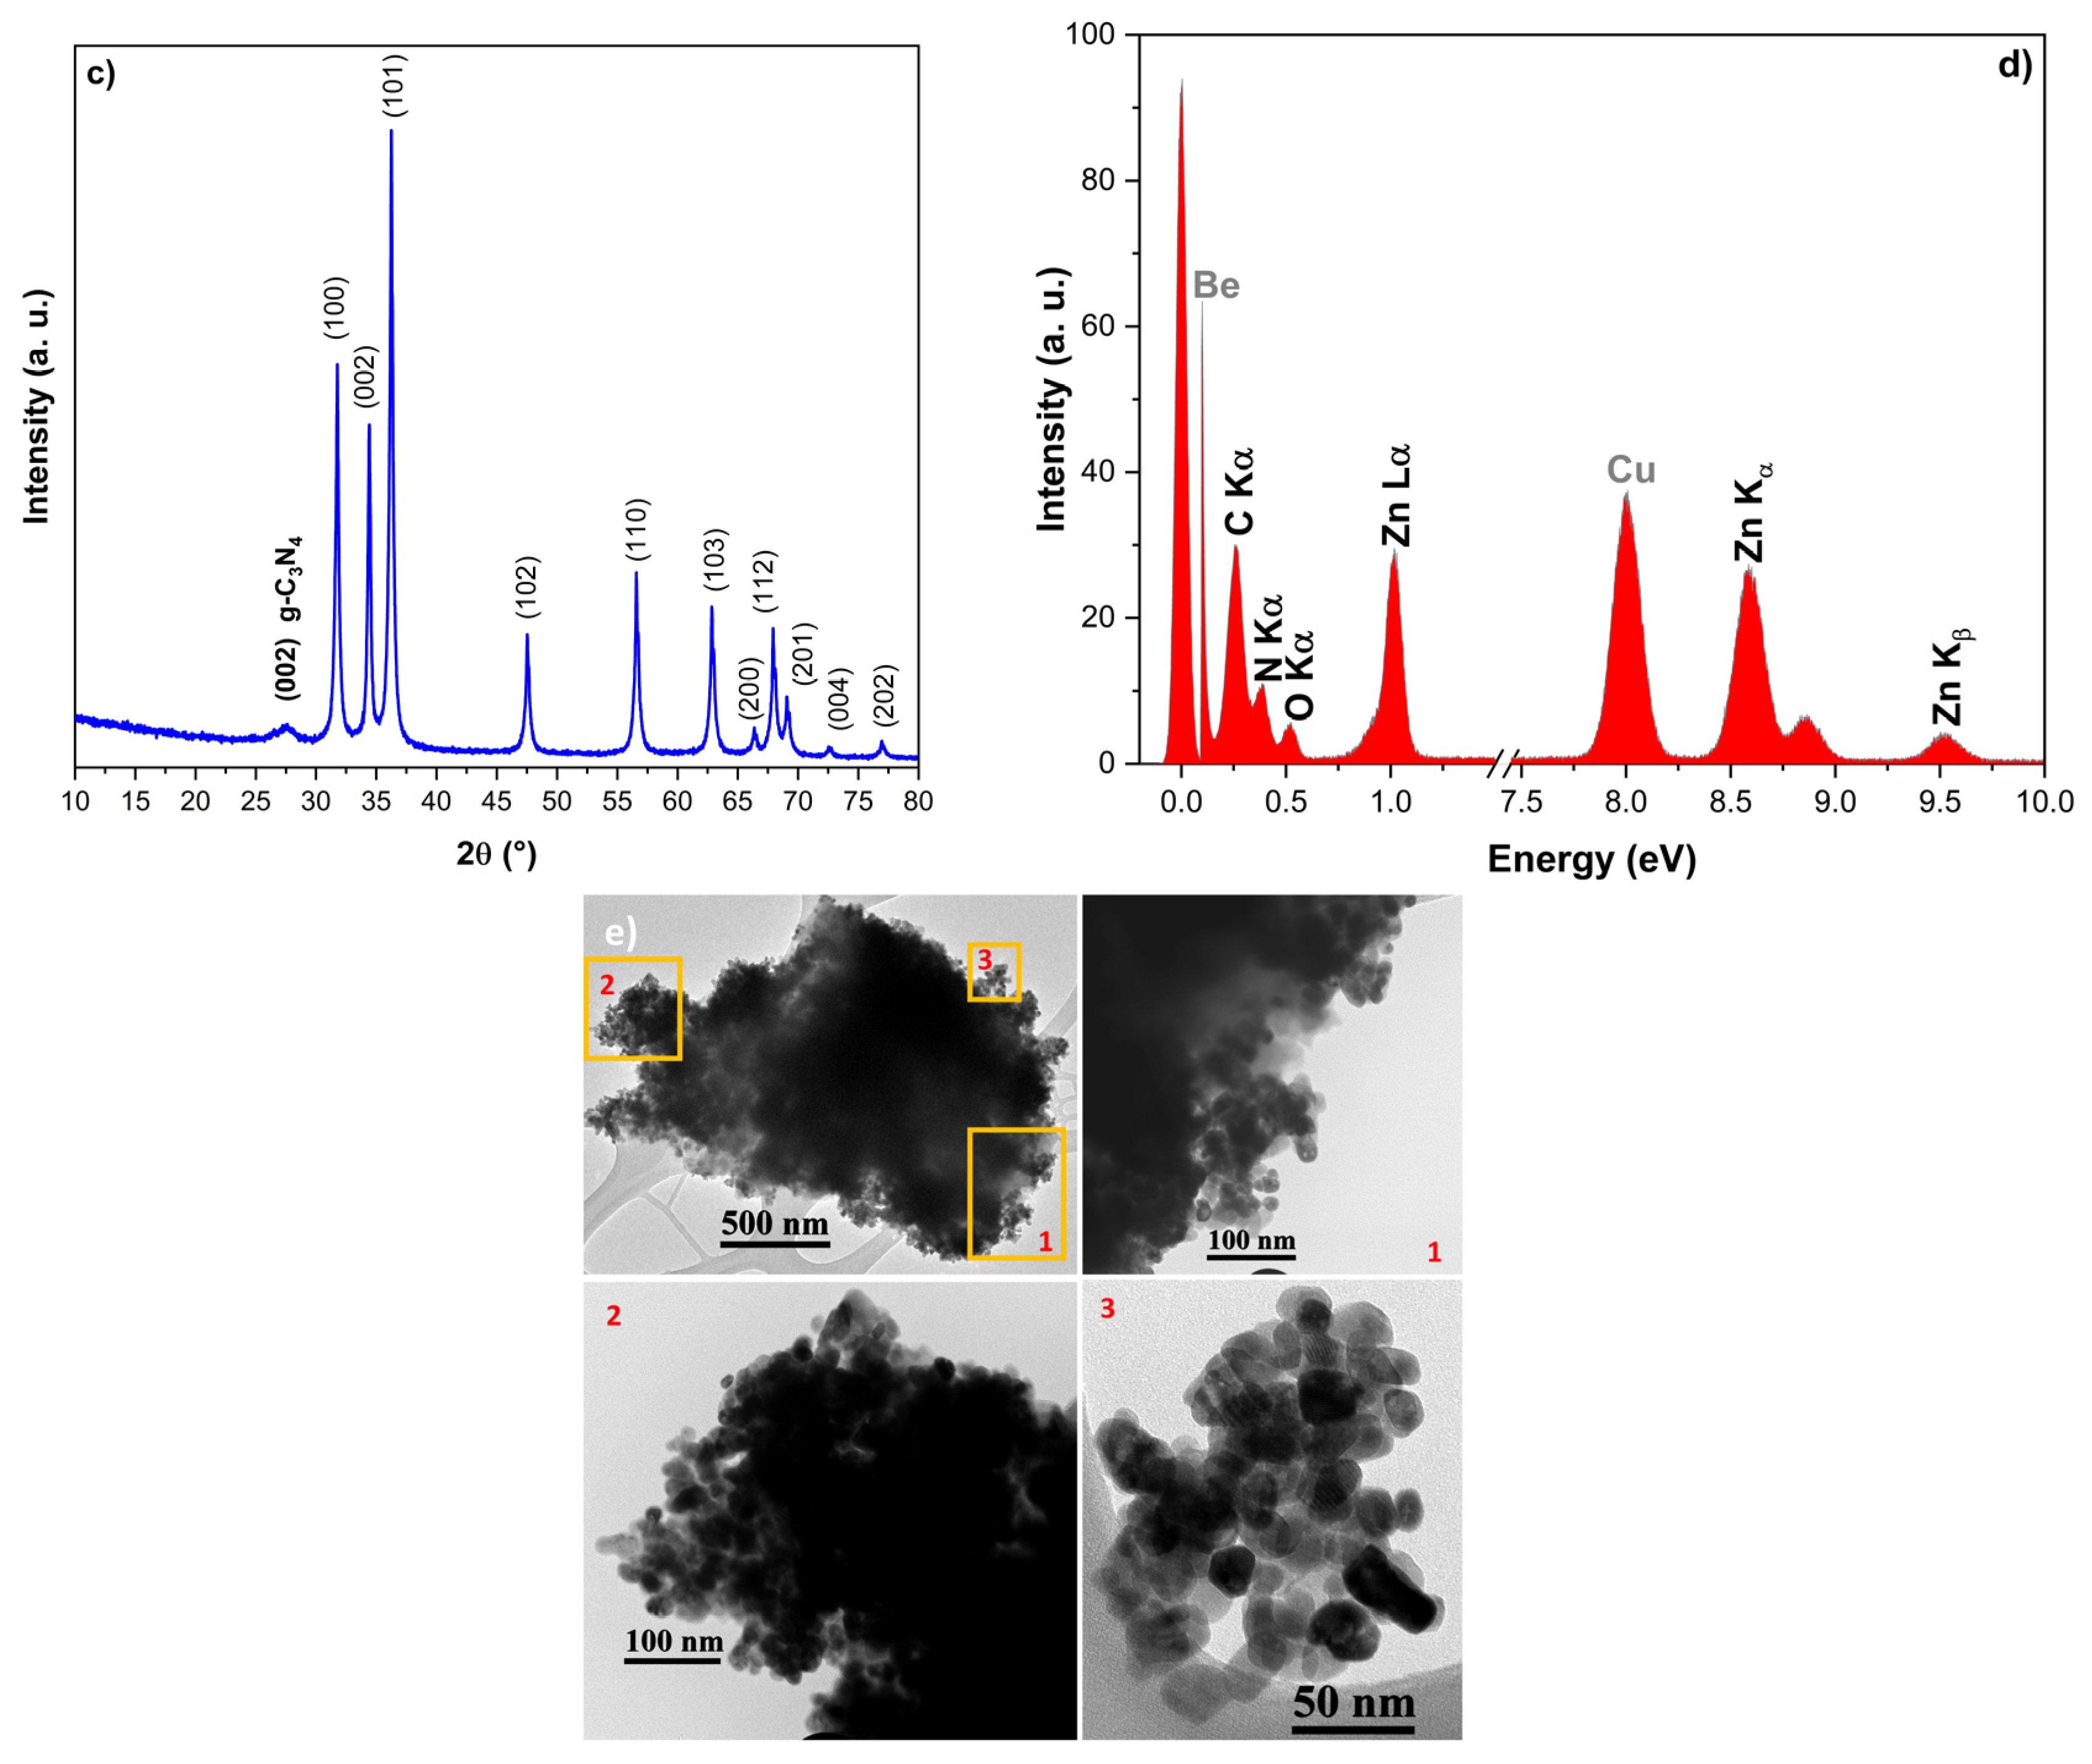
Figure 12c shows the X-ray diffractogram of the reused sample, in which the characteristic diffraction peaks of both g-C3N4 and ZnO were maintained, indicating that the crystal structure remains stable. EDS (Figure 12d) confirms the continuous presence of C, N, Zn, and O without significant compositional changes. It should be noted that the peaks corresponding to Cu and Be observed in the EDS spectrum did not belong to the sample but rather originated from the copper grid used as a support and the detector window, respectively. Moreover, the TEM micrograph (Figure 12e) reveals that the general morphology and distribution of the ZnO nanoparticles on the g-C3N4 matrix were preserved, with no evidence of severe agglomerations or structural degradation.
It has been reported that photocatalysts can lose stability after repeated evaluation cycles, thereby reducing their lifetime and limiting their scalability. In the case of ZnO, in addition to its activity under UV light, one of its main disadvantages is its susceptibility to photocorrosion [78]. However, in the CNZ-20 nanocomposite, composed of 20% g-C3N4 and 80% ZnO, no photocorrosion was observed after five cycles of photocatalytic evaluation. The decrease in adsorption and degradation during the different cycles (Figure 11a) can be attributed to the loss of material during the recovery process in each cycle, which explains the decrease in adsorption and photocatalytic degradation of the MB dye [38]. Additionally, FTIR analysis revealed only bands associated with the CO2 and methyl groups of MB, indicating its stability. Previous studies have reported that photocorrosion of ZnO occurs under UV irradiation (254 nm), whose energy (4–5 eV) significantly exceeds the band gap of the material, causing damage to its crystalline structure [79]. However, other studies have shown that employing irradiation in the 400–650 nm range maintains the catalytic activity of ZnO practically unchanged even after five consecutive cycles in MB degradation [80], in agreement with the findings of this research. On the other hand, photocorrosion inhibition can also be achieved by functionalizing the ZnO surface. In this sense, the g-C3N4 functional groups could improve the stability of the nanocomposite [81,82,83], as reported in previous studies employing various carbon-based nanocomposites consistent with this work.

3. Materials and Methods

3.1. Synthesis of g-C3N4/ZnO Nanocomposites

The steps for preparing g-C3N4/ZnO nanocomposites are reported in Figure S1 of Supplementary Material. It shows a schematic diagram of the nanocomposite synthesis sequence.
Firstly, the synthesis of g-C3N4 was carried out through a thermal polycondensation process, using melamine (C3H6N6, Sigma-Aldrich, St. Louis, MO, USA, CAS: 108–78-1) as the precursor. Specifically, 5 g of melamine was calcined at 550 °C for 2 h in an air atmosphere, with a heating rate of 10 °C/min [84]. This method enabled the bulk synthesis of g-C3N4, and the resulting sample was labeled CN100.
Then, ZnO was synthesized using the procedure previously reported by our research group, with modifications related to the solvothermal microwave method. As described by González-Suárez et al. [57], 1.09 g of zinc acetate dihydrate (C4H6O4Zn 2H2O, Sigma-Aldrich, CAS: 5970-45-6) and 0.8416 g of potassium hydroxide (KOH, Sigma-Aldrich, CAS: 1310-58-3) were used in a 1:3 ratio of precursor to precipitating agent. Then the solid was separated by decantation and dried for 12 H at 80 °C. These powders were redispersed in 30 mL of ethanol under stirring for 15 min and subjected to ultrasound for an additional 15 min to ensure homogeneous dispersion. The resultant homogeneous dispersion was transferred to microwave-safe Teflon vials and subjected to heat treatment at 150 °C for 30 min inside a microwave reaction system (Anton Paar Multiwave Pro, Microwave Reaction System SOLV, Anton Paar, Graz, Austria). The vials were cooled to 30 °C, and the obtained material was dried at 75 °C and labeled as Z100.
Finally, the different percentages of g-C3N4/ZnO nanocomposites were prepared by combining the percentages of CN100 related to Z100. In this process, first, the g-C3N4 was dispersed in 30 mL of ethanol under ultrasonic agitation for 15 min. Then, the corresponding amount of precursor to obtain ZnO powder was added, and the mixture was processed under the same microwave conditions used for the synthesis of ZnO. The final nanocomposites were labeled CNZ-5, CNZ-10, CNZ-20, and CNZ-40, corresponding to g-C3N4 contents of 5, 10, 20, and 40 wt.%, respectively.

3.2. Characterization

The samples were characterized to study their structural, morphological, surface area, and optical properties. The XRD patterns were obtained with a Panalytical Pro diffractometer (Cu Kα, λ = 0.15406 nm) to determine the crystalline phase. FTIR spectra were acquired with a Shimadzu IRAffinity-1S spectrometer (4000–400 cm−1). Images with SEM and TEM were acquired using JEM-7401CF and JEOL JEM 2200FS + CS (Akishima, Japan) to examine particle morphology and elemental distribution. The surface area and porosity were assessed with a Quantachrome NOVA 1000 (Graz, Austria). Diffuse reflectance spectra (DRS) were obtained using a Thermo Scientific Evolution 220 UV-VIS spectrometer (Waltham, MA, USA) for determining the bandgap. The XPS spectra were acquired on a Thermo Scientific Escalab 250Xi using Al Ka = 1486.6 eV to determine elemental composition and chemical binding states.

3.3. Removal by Adsorption and Photocatalytic Degradation of MB

The synthesized samples were evaluated based on the methodology reported by González-Suárez et al. [57]. A schematic representation of the removal of MB dye by adsorption and photocatalytic degradation is shown in Figure S2 (Supplementary Material). The MB initial concentration of 10 mg/L was prepared by diluting dye powder in tri-distilled water. A 50 mL dye volume solution and 50 mg of the catalyst were required for each test. The MB solution with the catalyst was kept under stirring for 30 min in the dark to study the effect of adsorption. After that, a fluorescent lamp (23 W) with an emission range between 400 and 1050 nm (10 W/m2) was turned on to study the effect of photocatalytic degradation. In each experiment, 3.5 mL of solutions were extracted at 0, 20, 60, and 100 min and centrifuged for catalyst separation. Also, a control experiment was conducted under identical conditions without photocatalysts to analyze the effect of photolysis. Additionally, a commercial P25-TiO2 photocatalyst was evaluated under the same experimental conditions (dosage, irradiation source, and sampling times) to establish a performance benchmark and enable direct comparison with the synthesized materials. After that, the solutions were analyzed using a UV-Vis spectrophotometer to obtain absorbance sweeps concerning wavelength and monitor the absorbance reading of MB at a wavelength of 664 nm to calculate the concentration by applying a calibration curve.
The analysis of the adsorption and photocatalytic process was carried out by calculating the MB removal (% ƞAdsorption,light Off) and degradation efficiencies (ƞDegradation,light On) using the following equation:
%   η A d s , l i g h t   O f f     o r     %   η   D e g r a d a t i o n , l i g h t   O n = C 0 C t C 0 100
where C0 and Ct represent the concentration of MB dye at the initial time and at time t, respectively.
In addition, the first order model was used to study the kinetics:
C t =   C 0 e k t
This equation can be rewritten in a linear form:
l n C t C 0 = k t
Regression analysis was performed to estimate the photocatalytic degradation constant rate (k). Also, the coefficient of determination (R2) was calculated to check the fit of the first-order kinetic model. Finally, the half-life (t1/2) was calculated using:
l n C t C 0 = k t

4. Conclusions

g-C3N4/ZnO nanocomposites were successfully prepared by anchoring ZnO and exfoliated g-C3N4 using the solvothermal microwave method. UV-Vis analysis revealed a redshift in the absorption edge of the nanocomposites, indicating improved light-harvesting capability. The BET surface area for CNZ-20 (g-C3N4/ZnO 80/20) was 25 m2/g, almost two times greater than that of pure CN100 (12 m2/g). HR-STEM, EDS-STEM, and XPS analyses confirmed g-C3N4/ZnO composites. Reusability and stability tests of the CNZ-20 nanocomposite demonstrated a degradation of 85.75 ± 3.12% in the first cycle to 77.02 ± 4.06% in the fifth cycle of MB under visible light, making it a strong candidate for solar-driven wastewater treatment. The microwave-assisted solvothermal method offers a scalable and efficient route for synthesizing and anchoring high-performance photocatalysts.

Supplementary Materials

The following supporting information can be downloaded at: https://www.mdpi.com/article/10.3390/catal15090851/s1, Figure S1: Schematic diagram of the g-C3N4, ZnO, and CNZ-x nanocomposites synthesis.; Figure S2: A schematic diagram of the adsorption, removal, and photocatalytic degradation of MB dye. Figure S3: EDS spectrum of the CNZ-20 nanocomposite. Table S1: Adsorption, desorption, and photocatalytic degradation of MB dye. Table S2: Kolmogorov-Smirnov test results for normality: adsorption and photocatalytic degradation. Table S3: One-way ANOVA results for adsorption and photocatalytic degradation efficiency. Table S4: Tukey´s HSD test results for multiple comparisons.

Author Contributions

Conceptualization, J.C.P.-E. and F.P.-D.; methodology, J.C.P.-E.; validation, J.C.P.-E., G.A.D.-A. and F.P.-D.; formal analysis, J.C.P.-E. and G.A.D.-A.; investigation, J.C.P.-E.; resources, F.P.-D.; data curation, G.A.D.-A.; writing—original draft preparation, J.C.P.-E.; writing—review and editing, F.P.-D.; visualization, G.A.D.-A.; supervision, J.C.P.-E.; project administration, F.P.-D.; funding acquisition, J.C.P.-E. and F.P.-D. All authors have read and agreed to the published version of the manuscript.

Funding

The APC was funded by the Instituto de Innovación y Competitividad (I2C) from Secretaría de Innovación y Desarrollo Económico del Estado de Chihuahua, México, through the PUBLISH 2025 program.

Data Availability Statement

The data presented in this study are available on request from the corresponding author.

Acknowledgments

Thanks to Andres Isaak González Jacquez, Manuel Román, Raul Ochoa, Cesar Leyva, Karla Campos, Marco Ruiz, and Luis Gerardo Silva from CIMAV. They helped with the XRD, FTIR, UV-Vis, BET, SEM, TEM, STEM, and XPS analyses.

Conflicts of Interest

The authors declare no conflicts of interest.

Abbreviations

ANOVAAnalysis of variance
DRSDiffuse reflectance spectra
BETBrunauer–Emmett–Teller
BFBright field
EDSEnergy dispersive X-ray spectroscopy
FTIRFourier transform infrared spectroscopy
HRHigh resolution
kPhotocatalytic degradation constant rate (min−1)
MBMethylene blue
p-valueProbability value
R2Coefficient of determination
SEMScanning electron microscope
STEMScanning transmission electron microscopy
tTime (min)
t(1/2)Half-life (min)
TEMTransmission electron microscopy
UV-VisUltraviolet–visible spectrophotometry
XPSX-ray photoelectron spectroscopy
XRDX-ray diffraction

References

  1. Lin, L.; Yang, H.; Xu, X. Effects of Water Pollution on Human Health and Disease Heterogeneity: A Review. Front. Environ. Sci. 2022, 10, 880246. [Google Scholar] [CrossRef]
  2. Deokar, G.K.; Ingale, A.G. Exploring Effective Catalytic Degradation of Organic Pollutant Dyes Using Environment Benign, Green Engineered Gold Nanoparticles. Inorg. Chem. Commun. 2023, 151, 110649. [Google Scholar] [CrossRef]
  3. Khan, I.; Saeed, K.; Zekker, I.; Zhang, B.; Hendi, A.H.; Ahmad, A.; Ahmad, S.; Zada, N.; Ahmad, H.; Shah, L.A.; et al. Review on Methylene Blue: Its Properties, Uses, Toxicity and Photodegradation. Water 2022, 14, 242. [Google Scholar] [CrossRef]
  4. Ihaddaden, S.; Aberkane, D.; Boukerroui, A.; Robert, D. Removal of Methylene Blue (Basic Dye) by Coagulation-Flocculation with Biomaterials (Bentonite and Opuntia Ficus Indica). J. Water Process Eng. 2022, 49, 102952. [Google Scholar] [CrossRef]
  5. Zhu, W.; Wu, Z.; Zhao, S.; Lv, F.; Zhang, Y.; Guo, S. Selective Adsorption and Separation of Methylene Blue from Wastewater by Self-Standing Polyvinylpyrrolidone and SiO2 Electrospun Membranes. Chem. Eng. Sci. 2023, 280, 119009. [Google Scholar] [CrossRef]
  6. Fito, J.; Abewaa, M.; Mengistu, A.; Angassa, K.; Ambaye, A.D.; Moyo, W.; Nkambule, T. Adsorption of Methylene Blue from Textile Industrial Wastewater Using Activated Carbon Developed from Rumex Abyssinicus Plant. Sci. Rep. 2023, 13, 5427. [Google Scholar] [CrossRef] [PubMed]
  7. Shapira, B.; Penki, T.R.; Cohen, I.; Elias, Y.; Dalpke, R.; Beyer, A.; Gölzhäuser, A.; Avraham, E.; Aurbach, D. Combined Nanofiltration and Advanced Oxidation Processes with Bifunctional Carbon Nanomembranes. RSC Adv. 2021, 11, 14777–14786. [Google Scholar] [CrossRef] [PubMed]
  8. El-Bery, H.M.; Saleh, M.; El-Gendy, R.A.; Saleh, M.R.; Thabet, S.M. High Adsorption Capacity of Phenol and Methylene Blue Using Activated Carbon Derived from Lignocellulosic Agriculture Wastes. Sci. Rep. 2022, 12, 5499. [Google Scholar] [CrossRef]
  9. Kumari, P.; Kumar, A. Advanced Oxidation Process: A Remediation Technique for Organic and Non-Biodegradable Pollutant. Results Surf. Interfaces 2023, 11, 100122. [Google Scholar] [CrossRef]
  10. Chakravorty, A.; Roy, S. A Review of Photocatalysis, Basic Principles, Processes, and Materials. Sustain. Chem. Environ. 2024, 8, 100155. [Google Scholar] [CrossRef]
  11. Di Mauro, A.; Fragalà, M.E.; Privitera, V.; Impellizzeri, G. ZnO for Application in Photocatalysis: From Thin Films to Nanostructures. Mater. Sci. Semicond. Process. 2017, 69, 44–51. [Google Scholar] [CrossRef]
  12. Qi, K.; Cheng, B.; Yu, J.; Ho, W. Review on the Improvement of the Photocatalytic and Antibacterial Activities of ZnO. J. Alloys Compd. 2017, 727, 792–820. [Google Scholar] [CrossRef]
  13. Turkten, N.; Bekbolet, M. Photocatalytic Performance of Titanium Dioxide and Zinc Oxide Binary System on Degradation of Humic Matter. J. Photochem. Photobiol. Chem. 2020, 401, 112748. [Google Scholar] [CrossRef]
  14. Murali, R.; Amirthavalli, C. Defect Assisted Reactive Oxygen Species Generation for Photocatalytic Degradation of Methylene Blue by Nano-Structured Zinc Oxide Synthesized in CTAB Medium. Mater. Chem. Phys. 2023, 294, 127014. [Google Scholar] [CrossRef]
  15. Yao, G.; Liu, Y.; Liu, J.; Xu, Y. Facile Synthesis of Porous G-C3N4 with Enhanced Visible-Light Photoactivity. Molecules 2022, 27, 1754. [Google Scholar] [CrossRef] [PubMed]
  16. Yin, H.; He, J.; Xiao, B.; Zhou, M.; Wang, W.; Cunha, J.; Chen, Z.; Hou, Z.; Zhang, T.; Yu, Z. Advances and Prospects of G-C3N4 in Lithium-Sulfur Batteries. Nano Res. Energy 2024, 3, e9120138. [Google Scholar] [CrossRef]
  17. Gu, W.; Lu, D.; Kondamareddy, K.K.; Li, J.; Cheng, P.; Ho, W.; Wang, Y.; Zhao, Z.; Wang, Z. Efficient Photocatalytic Decomposition of NO and Mechanism Insight Enabled by NaBH4-Reduced N(Ligancy-3)-Vacancy-Rich-Graphitic Carbon Nitride. Mater. Today Phys. 2024, 46, 101487. [Google Scholar] [CrossRef]
  18. Li, Y.; Chen, C.; Chen, X.; Zang, J. MoO3/g-C3N4 Heterostructure for Degradation of Organic Pollutants under Visible Light Irradiation: High Efficiency, General Degradation and Z-Scheme Degradation Mechanism. Ceram. Int. 2021, 47, 33697–33708. [Google Scholar] [CrossRef]
  19. Muthuganesh, A.; Rafi, S.M.; Jacob, I.D.; Soundranayagam, J.P.; Surender, S.; Elangovan, P.; Flora, X.H. Efficient Methylene Blue Dye Degradation via Visible Light-Activated g-C3N4/CuO Nanocomposites. Hybrid Adv. 2025, 9, 100420. [Google Scholar] [CrossRef]
  20. Gao, R.; Lin, W.; Lin, H.; He, Y.; Mai, X.; Zhang, Y. Construction of (001)-TiO2/g-C3N4 Heterojunction for Enhanced Photocatalytic Degradation of Methylene Blue. React. Kinet. Mech. Catal. 2025, 138, 455–469. [Google Scholar] [CrossRef]
  21. Tahir, S.; Zahid, M.; Hanif, M.A.; Bhatti, I.A.; Naqvi, S.A.R.; Bhatti, H.N.; Jilani, A.; Alshareef, S.A.; El-Sharnouby, M.; Shahid, I. The Synergistic Effect of G-C3N4/GO/CuFe2O4 for Efficient Sunlight-Driven Photocatalytic Degradation of Methylene Blue. Int. J. Environ. Sci. Technol. 2025, 22, 4829–4846. [Google Scholar] [CrossRef]
  22. Liang, L.; Cong, Y.; Wang, F.; Yao, L.; Shi, L. Hydrothermal Pre-Treatment Induced Cyanamide to Prepare Porous g-C3N4 with Boosted Photocatalytic Performance. Diam. Relat. Mater. 2019, 98, 107499. [Google Scholar] [CrossRef]
  23. Liu, X.; Xu, X.; Gan, H.; Yu, M.; Huang, Y. The Effect of Different G-C3N4 Precursor Nature on Its Structural Control and Photocatalytic Degradation Activity. Catalysts 2023, 13, 848. [Google Scholar] [CrossRef]
  24. Mengesha, D.N.; Shiferraw, B.T.; Kim, H. Modification of the Electronic Structure of G-C3N4 Using Urea to Enhance the Visible Light–Assisted Degradation of Organic Pollutants. Environ. Sci. Pollut. Res. 2023, 30, 102910–102926. [Google Scholar] [CrossRef]
  25. Müller, R.; Huber, F.; Gelme, O.; Madel, M.; Scholz, J.-P.; Minkow, A.; Herr, U.; Thonke, K. Chemical Vapor Deposition Growth of Zinc Oxide on Sapphire with Methane: Initial Crystal Formation Process. Cryst. Growth Des. 2019, 19, 4964–4969. [Google Scholar] [CrossRef]
  26. Davis, K.; Yarbrough, R.; Froeschle, M.; White, J.; Rathnayake, H. Band Gap Engineered Zinc Oxide Nanostructures via a Sol–Gel Synthesis of Solvent Driven Shape-Controlled Crystal Growth. RSC Adv. 2019, 9, 14638–14648. [Google Scholar] [CrossRef]
  27. Akpomie, K.G.; Ghosh, S.; Gryzenhout, M.; Conradie, J. One-Pot Synthesis of Zinc Oxide Nanoparticles via Chemical Precipitation for Bromophenol Blue Adsorption and the Antifungal Activity against Filamentous Fungi. Sci. Rep. 2021, 11, 8305. [Google Scholar] [CrossRef]
  28. Ejsmont, A.; Goscianska, J. Hydrothermal Synthesis of ZnO Superstructures with Controlled Morphology via Temperature and pH Optimization. Materials 2023, 16, 1641. [Google Scholar] [CrossRef]
  29. Luwang, N.C.; Rana, D.K.; Yadav, M.K.; Sharma, H.; Kumar, A.; Kumar, S. Surbhi Synthesis of ZnO Nanostructure via CBD and Solvothermal Method Using Seed Technique. J. Sol-Gel Sci. Technol. 2024, 112, 728–737. [Google Scholar] [CrossRef]
  30. De Conti, M.C.M.D.; Dey, S.; Pottker, W.E.; La Porta, F.A. An Overview into Advantages and Applications of Conventional and Unconventional Hydro(Solvo)Thermal Approaches for Novel Advanced Materials Design. Mater. Today Sustain. 2023, 23, 100458. [Google Scholar] [CrossRef]
  31. Li, J.; Zhang, M.; Li, Q.; Yang, J. Enhanced Visible Light Activity on Direct Contact Z-Scheme g-C3N4-TiO2 Photocatalyst. Appl. Surf. Sci. 2017, 391, 184–193. [Google Scholar] [CrossRef]
  32. Deng, H.; Qin, C.; Pei, K.; Wu, G.; Wang, M.; Ni, H.; Ye, P. TiO2/Reduced Hydroxylated Graphene Nanocomposite Photocatalysts: Improved Electron–Hole Separation and Migration. Mater. Chem. Phys. 2021, 270, 124796. [Google Scholar] [CrossRef]
  33. Ashiegbu, D.C.; Potgieter, H.J. ZnO-Based Heterojunction Catalysts for the Photocatalytic Degradation of Methyl Orange Dye. Heliyon 2023, 9, e20674. [Google Scholar] [CrossRef]
  34. Wang, W.; Lv, B.; Tao, F. NiO/g-C3N4 Composite for Enhanced Photocatalytic Properties in the Wastewater Treatment. Environ. Sci. Pollut. Res. 2022, 30, 25620–25634. [Google Scholar] [CrossRef]
  35. Chaharlangi, N.; Molaei, P.; Yousefi, R. One-Step Fabrication of S-Scheme ZnO/g-C3N4 Composites for Enhanced Environmental Photocatalysis. J. Alloys Compd. 2024, 1010, 177289. [Google Scholar] [CrossRef]
  36. Naseri, A.; Samadi, M.; Pourjavadi, A.; Ramakrishna, S.; Moshfegh, A.Z. Enhanced Photocatalytic Activity of ZnO/g-C3N4 Nanofibers Constituting Carbonaceous Species under Simulated Sunlight for Organic Dye Removal. Ceram. Int. 2021, 47, 26185–26196. [Google Scholar] [CrossRef]
  37. Garg, R.; Gupta, R.; Bansal, A. Synthesis of G-C3N4/ZnO Nanocomposite for Photocatalytic Degradation of a Refractory Organic Endocrine Disrupter. Mater. Today Proc. 2021, 44, 855–859. [Google Scholar] [CrossRef]
  38. Paul, D.R.; Gautam, S.; Panchal, P.; Nehra, S.P.; Choudhary, P.; Sharma, A. ZnO-Modified g-C3N4: A Potential Photocatalyst for Environmental Application. ACS Omega 2020, 5, 3828–3838. [Google Scholar] [CrossRef] [PubMed]
  39. Shi, S.; Jia, M.; Li, M.; Zhou, S.; Zhao, Y.; Zhong, J.; Dai, D.; Qiu, J. ZnO@g-C3N4 S-Scheme Photocatalytic Membrane with Visible-Light Response and Enhanced Water Treatment Performance. Colloids Surf. Physicochem. Eng. Asp. 2023, 667, 131259. [Google Scholar] [CrossRef]
  40. Meena, P.L.; Poswal, K.; Surela, A.K.; Saini, J.K. Synthesis of Graphitic Carbon Nitride/Zinc Oxide (g-C3N4/ZnO) Hybrid Nanostructures and Investigation of the Effect of ZnO on the Photodegradation Activity of g-C3N4 against the Brilliant Cresyl Blue (BCB) Dye under Visible Light Irradiation. Adv. Compos. Hybrid Mater. 2022, 6, 16. [Google Scholar] [CrossRef]
  41. Wang, F.; Liu, Z.; Shi, L. Boosting Photocatalytic Activity of G-C3N4/Nano-Sized ZnO Fabricated in CO2-Saturated Solutions. Mater. Lett. 2021, 296, 129894. [Google Scholar] [CrossRef]
  42. Sun, H.; Zou, C.; Liao, Y.; Tang, W.; Huang, Y.; Chen, M. Modulating Charge Transport Behavior across the Interface via G-C3N4 Surface Discrete Modified BiOI and Bi2MoO6 for Efficient Photodegradation of Glyphosate. J. Alloys Compd. 2023, 935, 168208. [Google Scholar] [CrossRef]
  43. Roškarič, M.; Žerjav, G.; Finšgar, M.; Zavašnik, J.; Pintar, A. Influence of the Calcination Duration of G-C3N4/TiO2 “Veggie-Toast-like” Photocatalyst on the Visible-Light Triggered Photocatalytic Oxidation of Bisphenol A. J. Alloys Compd. 2023, 947, 169585. [Google Scholar] [CrossRef]
  44. Hajiashrafi, S.; Motakef Kazemi, N. Preparation and Evaluation of ZnO Nanoparticles by Thermal Decomposition of MOF-5. Heliyon 2019, 5, e02152. [Google Scholar] [CrossRef] [PubMed]
  45. Wang, H.; Wang, Y.; Guo, Y.; Ren, X.-K.; Wu, L.; Liu, L.; Shi, Z.; Wang, Y. Pd Nanoparticles Confined within Triazine-Based Carbon Nitride NTs: An Efficient Catalyst for Knoevenagel Condensation-Reduction Cascade Reactions. Catal. Today 2019, 330, 124–134. [Google Scholar] [CrossRef]
  46. Narkbuakaew, T.; Sujaridworakun, P. Synthesis of Tri-S-Triazine Based g-C3N4 Photocatalyst for Cationic Rhodamine B Degradation under Visible Light. Top. Catal. 2020, 63, 1086–1096. [Google Scholar] [CrossRef]
  47. Aslam, I.; Hassan Farooq, M.; Ghani, U.; Rizwan, M.; Nabi, G.; Shahzad, W.; Boddula, R. Synthesis of Novel G-C3N4 Microrods: A Metal-Free Visible-Light-Driven Photocatalyst. Mater. Sci. Energy Technol. 2019, 2, 401–407. [Google Scholar] [CrossRef]
  48. Pourali, S.; Amrollahi, R.; Alamolhoda, S.; Masoudpanah, S.M. In Situ Synthesis of ZnO/g-C3N4 Based Composites for Photodegradation of Methylene Blue under Visible Light. Sci. Rep. 2025, 15, 462. [Google Scholar] [CrossRef]
  49. Malik, M.; Len, T.; Luque, R.; Osman, S.M.; Paone, E.; Khan, M.I.; Wattoo, M.A.; Jamshaid, M.; Anum, A.; Rehman, A.U. Investigation on Synthesis of Ternary G-C3N4/ZnO–W/M Nanocomposites Integrated Heterojunction II as Efficient Photocatalyst for Environmental Applications. Environ. Res. 2023, 217, 114621. [Google Scholar] [CrossRef]
  50. Cappelluti, M.D.; Hadzifejzovic, E.; Foord, J.S.; Gregory, D.H. Flash Microwave-Assisted Solvothermal (FMS) Synthesis of Photoactive Anatase Sub-Microspheres with Hierarchical Porosity. RSC Adv. 2020, 10, 37233–37245. [Google Scholar] [CrossRef]
  51. Pellegrino, F.; Pellutiè, L.; Sordello, F.; Minero, C.; Ortel, E.; Hodoroaba, V.-D.; Maurino, V. Influence of Agglomeration and Aggregation on the Photocatalytic Activity of TiO2 Nanoparticles. Appl. Catal. B Environ. 2017, 216, 80–87. [Google Scholar] [CrossRef]
  52. Girish, Y.R.; Udayabhanu; Byrappa, N.M.; Alnaggar, G.; Hezam, A.; Nagaraju, G.; Pramoda, K.; Byrappa, K. Rapid and Facile Synthesis of Z-Scheme ZnO/g-C3N4 Heterostructure as Efficient Visible Light-Driven Photocatalysts for Dye Degradation and Hydrogen Evolution Reaction. J. Hazard. Mater. Adv. 2023, 9, 100230. [Google Scholar] [CrossRef]
  53. Hutchings, G.J.; Davies, P.R.; Pattisson, S.; Davies, T.E.; Morgan, D.J.; Dlamini, M.W. Facile Synthesis of a Porous 3D G-C3N4 Photocatalyst for the Degradation of Organics in Shale Gas Brines. Catal. Commun. 2022, 169, 106480. [Google Scholar] [CrossRef]
  54. Hassan, F.; Backer, S.N.; Almanassra, I.W.; Ali Atieh, M.; Elbahri, M.; Shanableh, A. Solar-Matched S-Scheme ZnO/g-C3N4 for Visible Light-Driven Paracetamol Degradation. Sci. Rep. 2024, 14, 12220. [Google Scholar] [CrossRef] [PubMed]
  55. Pérez-Molina, Á.; Pastrana-Martínez, L.M.; Pérez-Poyatos, L.T.; Morales-Torres, S.; Maldonado-Hódar, F.J. One-Pot Thermal Synthesis of g-C3N4/ZnO Composites for the Degradation of 5-Fluoruracil Cytostatic Drug under UV-LED Irradiation. Nanomaterials 2022, 12, 340. [Google Scholar] [CrossRef]
  56. Hakimi-Tehrani, M.J.; Hasanzadeh-Tabrizi, S.A.; Koupaei, N.; Saffar, A.; Rafiei, M. Synthesis of G-C3N4/ZnO/WO3 Nanocomposite as a Highly Efficient Antibacterial Adsorbent for Water Treatment. Diam. Relat. Mater. 2022, 130, 109506. [Google Scholar] [CrossRef]
  57. González-Suárez, B.W.; Pantoja-Espinoza, J.C.; Lardizábal-Gutierrez, D.; Flores, M.U.; Paraguay-Delgado, F. Effect of [Zn Acetate]/[KOH] Ratio on ZnO Particles Synthesis and Photocatalytic Rhodamine B Degradation. J. Mater. Res. Technol. 2024, 30, 8092–8107. [Google Scholar] [CrossRef]
  58. Zhang, G.; Zhang, J.; Zhang, M.; Wang, X. Polycondensation of Thiourea into Carbon Nitride Semiconductors as Visible Light Photocatalysts. J. Mater. Chem. 2012, 22, 8083. [Google Scholar] [CrossRef]
  59. Ievtushenko, A.; Khyzhun, O.; Shtepliuk, I.; Bykov, O.; Jakieła, R.; Tkach, S.; Kuzmenko, E.; Baturin, V.; Karpenko, O.; Olifan, O.; et al. X-Ray Photoelectron Spectroscopy Study of Highly-Doped ZnO: Al,N Films Grown at O-Rich Conditions. J. Alloys Compd. 2017, 722, 683–689. [Google Scholar] [CrossRef]
  60. Zhang, S.; Su, C.; Ren, H.; Li, M.; Zhu, L.; Ge, S.; Wang, M.; Zhang, Z.; Li, L.; Cao, X. In-Situ Fabrication of g-C3N4/ZnO Nanocomposites for Photocatalytic Degradation of Methylene Blue: Synthesis Procedure Does Matter. Nanomaterials 2019, 9, 215. [Google Scholar] [CrossRef]
  61. Li, Y.; Gu, M.; Shi, T.; Cui, W.; Zhang, X.; Dong, F.; Cheng, J.; Fan, J.; Lv, K. Carbon Vacancy in C3N4 Nanotube: Electronic Structure, Photocatalysis Mechanism and Highly Enhanced Activity. Appl. Catal. B Environ. 2020, 262, 118281. [Google Scholar] [CrossRef]
  62. Liu, Y.; Yin, W.; Lin, Q.; Li, Z.; Zhong, W.; Fang, B. Nitrogen Vacancies-Engineered Graphitic Carbon Nitride Nanosheets for Boosting Photocatalytic H2 Production. Appl. Surf. Sci. 2023, 640, 158386. [Google Scholar] [CrossRef]
  63. Meng, L.-J.; Moreira De Sá, C.P.; Dos Santos, M.P. Study of the Structural Properties of ZnO Thin Films by X-Ray Photoelectron Spectroscopy. Appl. Surf. Sci. 1994, 78, 57–61. [Google Scholar] [CrossRef]
  64. Panthi, G.; Park, M. Graphitic Carbon Nitride/Zinc Oxide-Based Z-Scheme and S-Scheme Heterojunction Photocatalysts for the Photodegradation of Organic Pollutants. Int. J. Mol. Sci. 2023, 24, 15021. [Google Scholar] [CrossRef] [PubMed]
  65. Zhang, L.; Jaroniec, M. Fundamentals of Adsorption for Photocatalysis. In Interface Science and Technology; Elsevier: Amsterdam, The Netherlands, 2020; Volume 31, pp. 39–62. ISBN 978-0-08-102890-2. [Google Scholar]
  66. Sher, M.; Javed, M.; Shahid, S.; Hakami, O.; Qamar, M.A.; Iqbal, S.; AL-Anazy, M.M.; Baghdadi, H.B. Designing of Highly Active G-C3N4/Sn Doped ZnO Heterostructure as a Photocatalyst for the Disinfection and Degradation of the Organic Pollutants under Visible Light Irradiation. J. Photochem. Photobiol. Chem. 2021, 418, 113393. [Google Scholar] [CrossRef]
  67. Yu, Y.; Huang, H. Coupled Adsorption and Photocatalysis of G-C3N4 Based Composites: Material Synthesis, Mechanism, and Environmental Applications. Chem. Eng. J. 2023, 453, 139755. [Google Scholar] [CrossRef]
  68. Zhu, B.; Xia, P.; Ho, W.; Yu, J. Isoelectric Point and Adsorption Activity of Porous G-C3N4. Appl. Surf. Sci. 2015, 344, 188–195. [Google Scholar] [CrossRef]
  69. Malebadi, K.A.; Seheri, N.H.; Ojelere, O.; Onwudiwe, D.C. ZnO Nanoparticles Modified with G-C3N4: Optical and Structural Properties. Mater. Sci. Eng. B 2024, 310, 117676. [Google Scholar] [CrossRef]
  70. Mihai, S.; Cursaru, D.L.; Matei, D.; Manta, A.M.; Somoghi, R.; Branoiu, G. Rutile RuxTi1-xO2 Nanobelts to Enhance Visible Light Photocatalytic Activity. Sci. Rep. 2019, 9, 18798. [Google Scholar] [CrossRef]
  71. Hao, R.; Wang, G.; Jiang, C.; Tang, H.; Xu, Q. In Situ Hydrothermal Synthesis of G-C3N4/TiO2 Heterojunction Photocatalysts with High Specific Surface Area for Rhodamine B Degradation. Appl. Surf. Sci. 2017, 411, 400–410. [Google Scholar] [CrossRef]
  72. Wagh, S.S.; Chougale, A.S.; Survase, A.A.; Patil, R.S.; Naik, N.; Naushad, M.; Pathan, H.M. Rapid Photocatalytic Dye Degradation, Enhanced Antibacterial and Antifungal Activities of Silver Stacked Zinc Oxide Garnished on Carbon Nanotubes. Sci. Rep. 2024, 14, 14045. [Google Scholar] [CrossRef]
  73. Tamiru Mengistu, M.; Wondimu, T.H.; Andoshe, D.M.; Kim, J.Y.; Zelekew, O.A.; Hone, F.G.; Tegene, N.A.; Gultom, N.S.; Jang, H.W. G-C3N4–Co3O4 Z-Scheme Junction with Green-Synthesized ZnO Photocatalyst for Efficient Degradation of Methylene Blue in Aqueous Solution. Bioinorg. Chem. Appl. 2023, 2023, 1–14. [Google Scholar] [CrossRef] [PubMed]
  74. Kumar, S.G.; Kavitha, R.; Manjunatha, C. Review and Perspective on Rational Design and Interface Engineering of G-C3N4/ZnO: From Type-II to Step-Scheme Heterojunctions for Photocatalytic Applications. Energy Fuels 2023, 37, 14421–14472. [Google Scholar] [CrossRef]
  75. Valiyathur, M.D.F.; Sakvai, M.S.; Mithra, S.; Majeed, S.A.; Kottur, A.B.; Hameed, A.S.S.; Raza, A.A. Photocatalytic and Toxicity Assessment of Alginate Reinforced ZnO-g-C3N4 Photocatalyst for the Degradation of Methylene Blue—A Sustainable Strategy. Int. J. Biol. Macromol. 2025, 298, 139935. [Google Scholar] [CrossRef] [PubMed]
  76. Schott, J.A.; Do-Thanh, C.-L.; Shan, W.; Puskar, N.G.; Dai, S.; Mahurin, S.M. FTIR Investigation of the Interfacial Properties and Mechanisms of CO2 Sorption in Porous Ionic Liquids. Green Chem. Eng. 2021, 2, 392–401. [Google Scholar] [CrossRef]
  77. Manea, Y.K.; Khan, A.M. Enhanced Photocatalytic Degradation of Methylene Blue and Adsorption of Metal Ions by SDS-TiP Nanocomposite. SN Appl. Sci. 2019, 1, 821. [Google Scholar] [CrossRef]
  78. Dimitropoulos, M.; Aggelopoulos, C.A.; Sygellou, L.; Tsantis, S.T.; Koutsoukos, P.G.; Yannopoulos, S.N. Unveiling the Photocorrosion Mechanism of Zinc Oxide Photocatalyst: Interplay between Surface Corrosion and Regeneration. J. Environ. Chem. Eng. 2024, 12, 112102. [Google Scholar] [CrossRef]
  79. Ma, X.; Li, H.; Liu, T.; Du, S.; Qiang, Q.; Wang, Y.; Yin, S.; Sato, T. Comparison of Photocatalytic Reaction-Induced Selective Corrosion with Photocorrosion: Impact on Morphology and Stability of Ag-ZnO. Appl. Catal. B Environ. 2017, 201, 348–358. [Google Scholar] [CrossRef]
  80. Zhang, X.; Qin, J.; Xue, Y.; Yu, P.; Zhang, B.; Wang, L.; Liu, R. Effect of Aspect Ratio and Surface Defects on the Photocatalytic Activity of ZnO Nanorods. Sci. Rep. 2014, 4, 4596. [Google Scholar] [CrossRef]
  81. Chen, Z.; Zhang, N.; Xu, Y.-J. Synthesis of Graphene–ZnO Nanorod Nanocomposites with Improved Photoactivity and Anti-Photocorrosion. CrystEngComm 2013, 15, 3022. [Google Scholar] [CrossRef]
  82. Zhang, H.; Zong, R.; Zhu, Y. Photocorrosion Inhibition and Photoactivity Enhancement for Zinc Oxide via Hybridization with Monolayer Polyaniline. J. Phys. Chem. C 2009, 113, 4605–4611. [Google Scholar] [CrossRef]
  83. Han, C.; Yang, M.-Q.; Weng, B.; Xu, Y.-J. Improving the Photocatalytic Activity and Anti-Photocorrosion of Semiconductor ZnO by Coupling with Versatile Carbon. Phys. Chem. Chem. Phys. 2014, 16, 16891. [Google Scholar] [CrossRef] [PubMed]
  84. Bai, Z.; Bai, Z.; Gao, T.; Bai, Z.; Zhu, Y. Preparation Effects on the Morphology and Photocatalytic Properties of Carbon Nitride Nanotubes. Results Phys. 2019, 13, 102254. [Google Scholar] [CrossRef]
Figure 1. XRD patterns of Z100, ZCN-x nanocomposites, and CN100 sample.
Catalysts 15 00851 g001
Figure 2. FTIR spectra for all study samples.
Catalysts 15 00851 g002
Figure 3. The SEM images for (a) Z100, (b) CNZ-5, (c) CNZ-10, (d) CNZ-20, (e) CNZ-40, and (f) CN100.
Catalysts 15 00851 g003
Figure 4. STEM images of CNZ-20 nanocomposite. (a) BF-STEM image of g-C3N4/ZnO sample; (b) STEM-EDS element maps of C, N, O, and Zn; (c) HR BF-STEM image of g-C3N4/ZnO sample.
Catalysts 15 00851 g004
Figure 5. Nitrogen adsorption–desorption isotherms for all samples.
Catalysts 15 00851 g005
Figure 6. The absorption spectra (a,b) and Tauc plots (c,d) to estimate the indirect band gap values for each one.
Catalysts 15 00851 g006
Figure 7. XPS spectra from Z100, CNZ-5, CNZ-10, CNZ-20, CNZ-40, and CN100 samples: (a) survey, (b) Zn 2p, (c) C 1s, and (d) N 1s.
Catalysts 15 00851 g007
Figure 8. XPS spectra O 1s from (a) Z100, (b) CNZ-5, (c) CNZ-10, (d) CNZ-20, (e) CNZ-40, and (f) CN100 samples.
Catalysts 15 00851 g008aCatalysts 15 00851 g008b
Figure 9. Adsorption spectra at dark and photocatalytic degradation with visible light of the MB dye for the samples. (a) Z100, (b) CNZ-5, (c) CNZ-10, (d) CNZ-20, (e) CNZ-40, (f) CN100, and (g) P25-TiO2.
Catalysts 15 00851 g009aCatalysts 15 00851 g009b
Figure 10. The photocatalytic behavior. (a) Adsorption and degradation, (b) kinetic rate (k = min−1) of the photocatalytic degradation of MB with Z100, CN100, CNZ-x nanocomposites, and P25-TiO2.
Catalysts 15 00851 g010
Figure 11. (a) Effect of selective reactive species quenching on MB photodegradation using CNZ-20 under visible light. (b) Energy band diagram illustrating charge carrier migration and ROS generation in the g-C3N4/ZnO system.
Catalysts 15 00851 g011
Figure 12. Reusability of the CNZ-20 nanocomposite. (a) Reuse test adsorption and photocatalytic degradation, (b) FTIR spectra for the ZCN-20 sample after each photocatalytic reaction to study the stability of the nanocomposite, (c) XRD, (d) EDS, and (e) TEM micrographs after Cycle 5 test.
Catalysts 15 00851 g012aCatalysts 15 00851 g012b
Table 1. The crystallite sizes (nm) were estimated from the XRD patterns using the Scherrer equation for all samples.
SampleZnOg-C3N4
~31.83°~34.48°~36.32°27.35°
Z100151715-
CNZ-5222420Not identified
CNZ-1014212320
CNZ-2010212320
CNZ-406212320
CN100---4
Table 2. Surface area and pore size by BET for all samples.
SampleBET Area (m2/g)Pore Size (nm)
Z1001815
CNZ-5203
CNZ-10213
CNZ-20253
CNZ-40193
CN1001211
Table 3. Absorption and bandgap values for the CN100, Z100 pure, and CNZ-x nanocomposites.
SampleAbsorption (nm)Band Gap (eV)
Z1004163.20
CNZ-54133.02
CNZ-104182.99
CNZ-204882.59
CNZ-404492.55
CN1004672.66
Table 4. Kinetic parameters of the photocatalytic degradation of MB.
Samplek × 10−2 (min−1)t(1/2)R2
Z1000.431610.9501
CNZ-50.91760.9888
CNZ-101.08640.9821
CNZ-201.45480.9848
CNZ-400.332100.7003
CN1000.242890.7713
P25-TiO20.292350.9368
Table 5. Summary of reported degradation of MB dye using g-C3N4/ZnO nanocomposites.
Synthesis
Method
Experimental ConditionsPhotocatalytic Evaluation
Heatingg-C3N4/ZnO (mg)MB (mg/L)Time (min)Irradiation SourceDegradation (%)Kinetic Constant (k, min−1)Ref.
Precursors mixingConventional furnace
550 °C
2 h
1010120200 W tungsten lamp with 420 nm filter90Not reported[38]
Solid-stateElectric furnace
550 °C 2 h
5010120Direct sunlight92Not reported[35]
Electrospinning techniqueTubular furnace under N2 atmosphere, 460 °C, 15 min101 × 10−5 M120300 W ceramic Xe lamp91.8Not reported[36]
In situ growing crystals130 °C for 2 h10.75 cm2 membranes5150300 W Xe lamp with a 420 nm filter94.4Not reported[39]
Combustion thermal condensationConventional furnace
550 °C
2 h
1005180Two 100 W xenon lamps (UV-visible regions)950.022[48]
Co-precipitationConventional furnace
300 °C
2 h
3001 × 10−5 M60300 W tungsten halogen lamp78Not reported[75]
SolvothermalMicrowave,
160 °C,
30 min
501010023 W fluorescent visible lamp, 400–1050 nm, 10 W/m2850.0145This work
Disclaimer/Publisher’s Note: The statements, opinions and data contained in all publications are solely those of the individual author(s) and contributor(s) and not of MDPI and/or the editor(s). MDPI and/or the editor(s) disclaim responsibility for any injury to people or property resulting from any ideas, methods, instructions or products referred to in the content.