Abstract
Pyrolysis of oily sludge (OS) faces two significant challenges, dehydration in emulsion and coke formation, which cause extra energy consumption. Targeting energy saving, this paper first reported on solar photothermal dehydration and confined catalytic pyrolysis of OS using a single material. A wood sponge loaded with carbon dots (CM-CDs) can generate heat by absorbing solar energy and promote rapid phase separation and water transport via capillary action of oil–water emulsion in OS under sunlight. Almost all free water in OS with varied content can be removed after 3 h. Hydrocarbons entered the internal space of CM-CDs instead of contacting with soil minerals, contributed to the subsequent confined catalytic pyrolysis, led to a reduction in Ea (35.61 kJ/mol), inhibited coking and caking, and yielded higher oil recovery efficiency. In addition, CDs can form hotspots to enhance pyrolytic behaviors in local regions. When the ratio of OS to CM-CDs reached 10:0.6, the recovery rate of the oil fraction through combined pyrolysis was as high as 89%, which was 17% higher than that of OS pyrolysis alone. This discovery provides a new way to solve the bottleneck problems of OS pyrolysis in the industry.
1. Introduction
Oily sludge (OS) is a hazardous solid waste produced in the petroleum industry. According to enterprise statistics, China is expected to produce more than 6 million tons of OS per year [1]. The petroleum hydrocarbons in OS are toxic and non-biodegradable but are also valuable resources [2]. Pyrolysis technology with dual targets of oil removal and resource recovery has been widely applied in the industry. Previous studies on OS pyrolysis mostly focused on enhancing the quality of pyrolysis products by optimizing pyrolysis process parameters and catalysis [3,4,5,6]. However, energy consumption during pyrolysis is usually ignored. Generally, OS possesses high water content, and severe oil–water emulsion poses obstacles for water separation; therefore, the traditional method of physical dehydration is usually useless. Thermal dehydration occurs at the first stage of pyrolysis, which requires a large amount of energy due to the high latent heat of vaporization, ca. 2260 kJ/kg. This leads to increased operating costs and carbon emissions. Further, during the OS pyrolysis process, large molecular free radicals combine with each other to form asphaltenes and coking precursors (or semi-coke), which ultimately result in the formation of coke through reactions such as alkylation, dehydrogenation, and polycondensation [7]. Accumulation of coke causes caking and wall blocking, which increases the thermal resistance of the pyrolysis furnace wall and impedes heat and mass transfer. As a result, it is difficult to efficiently remove petroleum hydrocarbons from the inner space of OS, and energy consumption also increases. Above all, water dehydration and coking resistance are the main bottlenecks in the pyrolysis process that cause high energy consumption but have not yet been properly addressed.
Currently, engineering practice commonly uses thermal drying technology to achieve higher evaporation efficiency through additional energy input, such as hot air convection. However, this method comes with higher installation and operation costs. Thus, it is imperative to search for an energy-efficient and cost-effective OS dehydration method that can be implemented in engineering practice. Solar energy, as an inexhaustible form of clean energy, has the potential to provide heating energy for OS dehydration. However, the light absorption ability of OS is very poor; therefore, the required temperature is not easy to reach for fast evaporation. Photothermal conversion materials can effectively absorb solar light and convert it into heat. Carbon-based materials are widely utilized in oily wastewater treatment due to their excellent solar absorption capacity and abundant channels for transportation. Li et al. carbonized sugarcane to enhance the adsorption capacity of crude oil with temperatures rising under sunlight, ca. 55.02 g/g [8]. Su et al. loaded commercial sponges with carbon dots (CDs) to further promote the photothermal conversion efficiency and thus absorb more crude oil under sunlight, ca. 60.0 g/g [9]. However, in actual processing scenarios, the organic waste that requires dehydration is complex in composition, usually containing both solid and liquid phases. The mechanism by which photothermal materials affect the dehydration process of actual organic waste has not been well understood, and there is also a lack of integration with the catalytic pyrolysis process after the dehydration treatment.
In order to explore the dehydration process of photothermal materials in common organic waste OS and the subsequent catalytic pyrolysis process, this paper proposes using carbon-based photothermal materials for water–oil separation by demulsification and then dehydration by solar irradiation (Figure 1). After solar thermal dehydration, water evaporates, and oil enters the channels of the material. Subsequently, confined catalytic pyrolysis of dehydrated OS and carbon material occurs, which is speculated to improve the pyrolysis efficiency by enhanced cracking [10,11]. Therefore, OS after solar thermal dehydration can be directly treated by co-pyrolysis without recovery of carbon material. Accordingly, this paper reports on a wood sponge loaded with CDs to attain dual targets of solar thermal dehydration and confined catalytic pyrolysis. Solar absorption and water evaporation are evaluated under simulated sunlight. Next, confined catalytic pyrolysis is conducted using a fixed-bed and thermogravimetric (TG) reactor to attain the pyrolytic products and kinetics, respectively. Finally, effective dehydration by sunlight and anti-coking pyrolysis are reached, which provides a new approach for OS treatment with less energy consumption. This article provides a practical and applicable paradigm for the energy-saving and efficient dewatering of organic solid waste, as well as the subsequent reduction in residual residues.
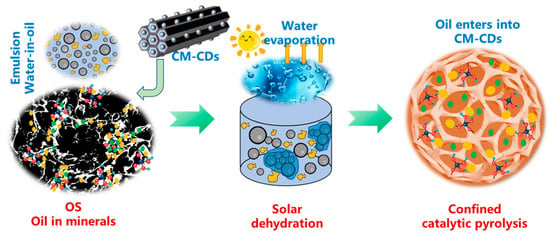
Figure 1.
Energy-saving-driven solar photothermal dehydration and confined catalytic pyrolysis of OS using CM-CDs.
2. Results and Discussion
2.1. Properties of CM-CDs
The method of synthesizing photothermal material from biomass is low-cost and accessible, making it a suitable option for large-scale production. In simple terms, CD powder prepared by microwave heating of citric acid and urea was loaded on a wood sponge by hydrothermal treatment. Figure 2 shows a physical image of the prepared sample. CM after delignification and removing hemicellulose had a white surface and a less dense surface structure compared with natural wood that could be observed by the naked eye. In contrast to CM, CM-HT had a light brown surface, which may be the result of partial carbonization after hydrothermal treatment. CM-CDs exhibited a deeper brown surface than CM-HT, indicating successful loading of CDs on the CM skeleton. Scanning electron microscope (SEM) and high-resolution transmission electron microscope (HRTEM) images directly validated the loading of CDs (Figure 3a). It is evident from the SEM image that some particles on the cellulose skeleton of CM-CDs were agglomerated. This phenomenon may be due to the self-agglomeration of CDs during the loading process [9]. The removal of lignin and hemicellulose also left a certain number of channels. HRTEM images revealed a uniform distribution of CDs at the nanoscale level; the CDs had a diameter as low as 1.42 nm and a lattice spacing of up to 3.95 nm. Therefore, the CDs were successfully loaded on CM-CDs.
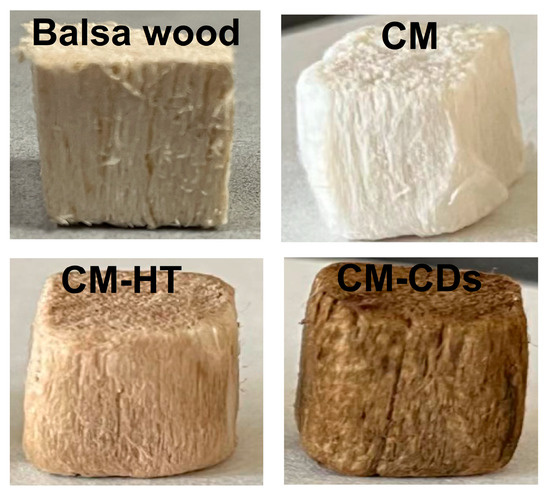
Figure 2.
Photographs of balsa wood and its modified derivatives.
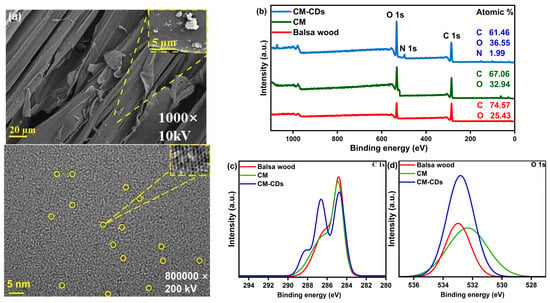
Figure 3.
(a) SEM and HRTEM images of CM-CDs; (b) full XPS spectra and high-resolution XPS spectra for (c) C 1s and (d) O 1s of balsa wood, CM, and CM-CDs.
The surface elemental composition of CM-CDs, CM, and balsa wood was analyzed by X-ray photoelectron spectroscopy (XPS). The full-scan XPS spectra are shown in Figure 3b and Table 1, indicating the presence of carbon (C 1s, 285.77 eV) [12], oxygen (O 1s, 532.80 eV) [13], and trace nitrogen (N 1s, 400.01 eV) [14]. N species in CM-CDs mainly originated from CD loading. In the high-resolution XPS spectra of C 1s and O 1s (Figure 3c,d), the peak and half-peak widths of the three materials are distinctly different. Compared to balsa wood, showing only C−C/C=C (284.8 eV) and C−O (286.3 eV) bonds [15], CM-CDs exhibit critical new functional groups: Carbonyl C=O/C=N (288.2 eV, ΔBE + 3.4 eV) [16], Amide C−N (286.5 eV) [17], and Ketonic C=O (531.6 eV) (Figure 4). These nitrogen/oxygen functionalities (a) narrow the bandgap by introducing mid-gap states and (b) enhance non-radiative decay via phonon-coupled vibrational modes. Consequently, the engineered surface chemistry significantly enhances solar absorptivity.

Table 1.
XPS quantitative analysis of C1s and O1s distribution in photothermal materials.
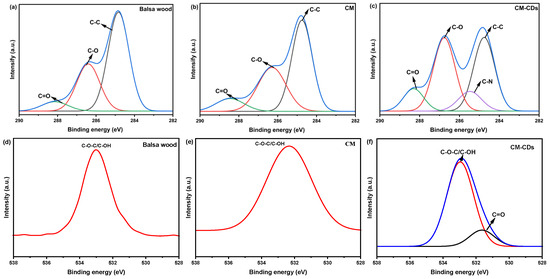
Figure 4.
High-resolution C 1s XPS spectra of (a) balsa wood, (b) CM, (c) CM-CDs; high-resolution O 1s XPS spectra of (d) balsa wood, (e) CM, (f) CM-CDs.
2.2. Solar Thermal Dehydration of OS
CM-CDs exhibit superior solar-driven dehydration of oily sludge (OS) via synergistic photothermal effects. UV-Vis spectra confirm broadband absorption enhancement (92% solar utilization, Figure 5a), where CD-induced redshift extends photon capture beyond 700 nm. Hierarchical wood pores (10–200 μm) enable multi-reflex light trapping, achieving 4.2× greater photon-to-heat conversion than CM-HT despite oil interference. Crucially, pore-confined water channels facilitate vaporization, bypassing viscous oil blockage, maintaining 89.2% dehydration efficiency (Figure 5b). Infrared imaging validates sustained 50 °C surface temperatures in emulsions (Figure 5c), attributable to hydroxyl-mediated interfacial evaporation reducing phase-change energy by 32%. This integrated design yields 8.3 °C/min heating rates—3.1× faster than carbonized controls—demonstrating robust, oil-resistant photothermal conversion. As mentioned in Figure 5d, CM-CDs possessed an adsorption capacity of up to 8 times their own weight for heavy oil and 6 times of that for crude oil and had excellent oil adsorption capacity; therefore, they could completely adsorb oil (or oil–water emulsion) and enhanced heat/mass transfer to increase water evaporation rate.
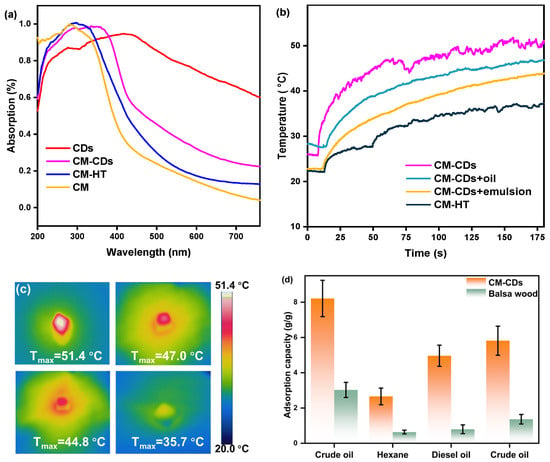
Figure 5.
(a) Light absorption curves from 250 to 760 nm of CDs, CM-CDs, CM-HT, and CM; (b) temperature curves of different media under sunlight radiation (1.0 sun); (c) infrared image of CM-CDs, CM-CDs with oil, CM-CDs with emulsion, and CM-HT with sunlight radiation for 3 min under 1.0 sun; (d) adsorption performance of organic solution by balsa wood and CM-CDs.
The practical evaporation experiments were conducted by recording the real-time mass change of 10.0 g OS (26.7%) with the addition of different materials under sunlight. Unfortunately, the weight loss of OS (26.7%) was only 1.5 g under 1.0 sun irradiation for 3 h, which was much lower than 2.67 g, as shown in Figure 6a. Even with a maximum surface temperature of 59.8 °C (resulting from soil light absorption), the OS surface exhibited persistent wetting (Figure 6(b1)). Fortunately, the weight loss of OS+CM and OS+CM-CDs significantly increased within 3 h, ca. 2.17 and 2.54 g, respectively. The OS surface finally showed an obvious caking and hardening effect, indicating that the free liquid–liquid phase was significantly eliminated (Figure 6(c1,d1)). Interestingly, their maximum surface temperature was 63.2 and 66.6 °C, respectively (Figure 6(c2,d2)), which seemed to create a gap that was not excessive. Rapid water evaporation adsorbed heat, resulting in a slow temperature rise prior to complete water removal. Solar thermal dehydration of OS not only depended on the photothermal effect but also the special structure characteristics, which separated the oil–water emulsion and enhanced water transportation. This can also be verified from OS+CM being just slightly behind OS+CM-CDs in terms of mass change presented in Figure 6a. Another obvious phenomenon that cannot be ignored is that the temperature distribution image was relatively uniform for OS+CM-CDs, corresponding to the excellent photothermal and uniform heat transfer effect.
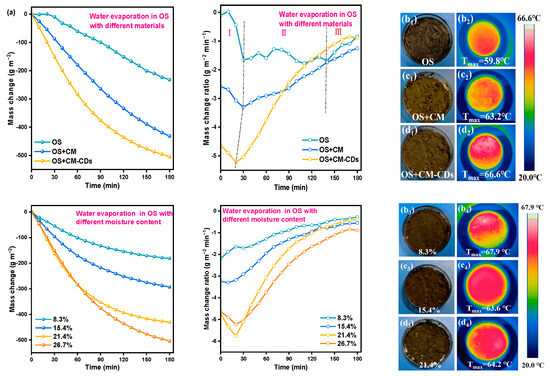
Figure 6.
(a) Mass change and weight loss rate curves during evaporation; (b1–d1) physical images; (b2–d2) infrared images of OS (26.7%), OS+CM, and OS+CM-CDs under 1.0 sun irradiation; (b3–d3) physical images; (b4–d4) infrared images of OS+CM-CDs with different moisture content under 1.0 sun irradiation.
Figure 6a presents the weight loss rate calculated by integration, which could be divided into three dehydration steps: (Ⅰ) rapid evaporation of surface water; (Ⅱ) complete evaporation of surface water and migration of emulsified water through internal diffusion until reaching balance; and (III) slow evaporation of the remaining water. Clearly, the pristine OS (26.7%) was initiated later compared with the other two samples and exhibited a lower weight loss rate over time. CM and CM-CD addition improved the initial and the maximum evaporation rate gradually. The weight loss rate of OS+CM-CDs after 3 h was close to 0, implying almost complete dehydration. Therefore, CM-CDs assisting OS dehydration under sunlight should contribute to the improved internal water migration and heat transfer efficiency from CM and the additional heat from solar by CDs.
Due to the high latent heat of water vaporization, high moisture content is not conducive to the natural dehydration of OS under sunlight and prolongs its drying time. Fortunately, Figure 6a proves that CM-CDs distinctly accelerate OS dehydration under sunlight. To verify this effect for OS with different water contents, four OS samples were selected for investigation, as presented in Figure 6a. Clearly, the mass change increased gradually with the increase in water content, while the variation between OS (21.4%) and OS (26.7%) became smaller than those of others, especially at the initial stage. The mass change rate also demonstrated that an increase in the water content from 21.4% to 26.7% brought obstacles for water evaporation. The caked, hardened surfaces (Figure 6(b3,c3,d3)) and uniform temperature distribution (Figure 6(b4,c4,d4)) of OS samples also demonstrated that CM-CDs have the potential to achieve effective OS dehydration under sunlight with a water content of less than 26.7% within a certain time.
2.3. Confined Catalytic Pyrolysis of OS and CM-CDs
Figure 7a presents the TG curves of OS (dry), CM-CDs, and OS (dry)+CM-CDs, in which the dotted line represents the calculated results from combination of OS (dry) and a proportion of CM-CDs. The practical TG curve of OS (dry)+CM-CDs was lower than the calculated curve at same temperature, indicating occurrence of promoted interaction between CM-CDs and OS (dry) [18]. The weight loss during the pyrolysis process of different components of OS and CM-CDs was compared with that of the OS alone (Table 2). To analyze the interaction process, the corresponding DTG (derivative thermogravimetry) curves were deconvoluted by Gaussian fitting as presented in Figure 7b,c. Clearly, OS (dry)+CM-CDs exhibited four weight loss stages. The contributions of each stage can be analyzed based on the individual DTG curves shown in Figure 7d,e. Stage I (SI) corresponded to the evaporation of adsorbed water and crystal water; stage II (SII) is mainly the devolatilization of petroleum hydrocarbons; stage III (SIII) is related to the reaction of the depolymerization, fracture, and recombination of the main components of cellulose in CM-CDs; and stage IV (SIV) should originate from thermal decomposition of heavy hydrocarbons [19,20]. The desorption of petroleum hydrocarbons in the OS obtained during the experimental process and simulation calculations mainly occurred in the temperature range of 280–300 °C, which mainly corresponded to the desorption of medium-molecular-weight components (200–350 °C) [21]. Moreover, the range of the corresponding peak was relatively wide, indicating that the OS contained considerable amounts of petroleum hydrocarbon components [22]. Both the experimental and simulation results demonstrate that depolymerization, fragmentation, and reorganization of cellulose-related components occur within the temperature range of 420–435 °C. The main processes involve the cleavage of glycosidic bonds to produce volatile products, the cleavage of C-C bonds to generate small molecular gases, and the reformation of the aromatization process [23]. Table 3 demonstrates a reduction in Ea due to this promoted interaction. As mentioned above, CM-CDs adsorbed oil components into their internal space, and confined catalytic pyrolysis occurred to promote decomposition of hydrocarbons at a lower temperature. Experimental measurements reveal a 3.17 kJ/mol reduction in activation energy for the co-pyrolysis process compared to computational predictions. This decrease not only demonstrates CM-CDs’ capability to modify the energy landscape of OS pyrolysis but also enables efficient thermal conversion at reduced temperatures, thereby suppressing undesirable cracking side-reactions and increasing light oil yield.
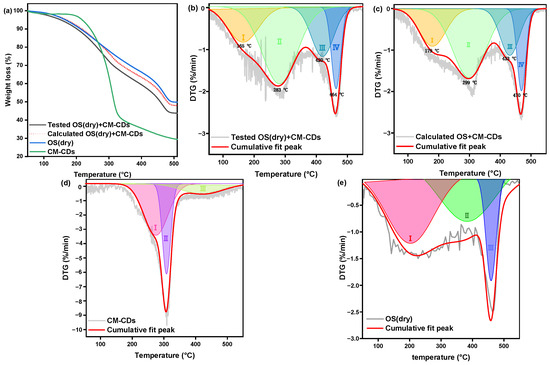
Figure 7.
(a) TG curves, (b) tested DTG curves, (c) calculated DTG curves, DTG curves of (d) CM-CDs, and (e) OS (dry). I: the evaporation of adsorbed water and crystal water, II: the devolatilization of petroleum hydrocarbons, III: the reaction of the depolymerization, fracture, and recombination of the main components of cellulose, IV: the thermal decomposition of heavy hydrocarbons.

Table 2.
Calculation of the weight loss during each pyrolysis process by normalizing with the original content of CM-CDs.

Table 3.
Activation energy (Ea) obtained from Coats–Redfern method.
To evaluate the effect of confined catalytic pyrolysis on oil recovery, the pyrolytic products were collected with different addition ratios of CM-CDs. The ratio of CM-CD content exhibited no significant effect (Figure 8a). After the addition of CM-CDs, the oil yield of OS increased from 0.30 to ~0.50 g/g, and the gas production decreased from 0.084 to ~0.038 g/g, implying an elevation in the total yields of oil and gas. Accordingly, the oil recovery efficiency dramatically increased from 76% to ~90%. Therefore, CM-CDs promoted elimination of petroleum hydrocarbons from OS to attain high oil recovery.
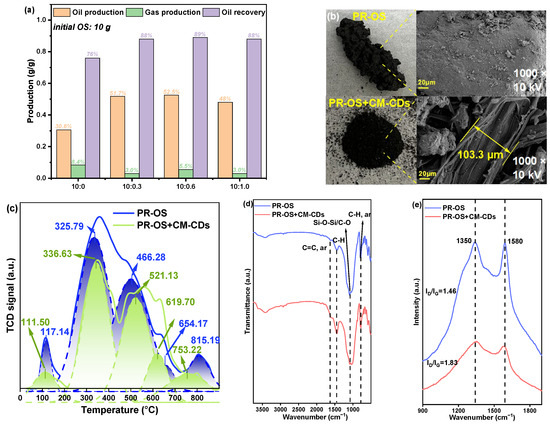
Figure 8.
(a) The oil and gas yield as well as oil recovery obtained by pyrolysis of OS (dry)+CM-CDs with different ratios of CM-CDs (initial OS: 10 g), (b) photos and SEM images, (c) TPO profiles, (d) FTIR spectra, and (e) Raman spectra of pyrolysis residues, i.e., PR-OS and PR-OS+CM-CDs. Note: the mass ratio of OS (dry) to CM-CDs was 10:1.
The unsaturated olefins and aromatics polymerize to form dense coke during OS pyrolysis, which will adhere to the inner wall of the furnace. The effect of CM-CDs on coke formation was evaluated by collection of pyrolysis residue (PR-OS and PR-OS+CM-CDs). Interestingly, PR-OS presents dense cross-linked caked coke, while PR-OS+CM-CDs are dispersed powder particles, as presented in Figure 8b. Moreover, scattered particles can be observed inside the filamentous carbon fibers with a width of 103.3 μm for PR-OS+CM-CDs, implying confined hypothesis. These phenomena presented less coke formation and more complete degradation of petroleum hydrocarbons for PR-OS+CM-CDs. The O2 consumption of PR-OS observed from temperature-programmed oxidation (TPO) profiles was significantly higher than that of PR-OS+CM-CDs (Figure 8c), implying less coke formation of PR-OS+CM-CDs. PR-OS possessed four O2 consumption peaks between 117.14 and 654.17 °C, corresponding to the decomposition of amorphous structure with poor thermal stability and filamentary carbon fiber with general thermal stability. The O2 consumption peak at 815.19 °C corresponded to the decomposition of crystalline graphitic carbon with good thermal stability [24]. The only O2 consumption peak of PR-OS+CM-CDs higher than PR-OS was observed at 619.70 °C and might originate from oxidation of carbon in CM-CDs. Additionally, the peak location of crystalline graphite carbon decreased from 815.19 °C in PR-OS to 753.2 °C in PR-OS+CM-CDs. Therefore, CM-CDs might promote the transformation of the stable crystalline graphite carbon in PR-OS into the unstable carbon that was more easily oxidized. The main functional groups of the pyrolysis residue were Si-O/C-O (980–1011 cm−1) [25], aromatic C-H (868 cm−1) [26] and aromatic C=C (1570 cm−1) [19] recorded by Fourier transform infrared (FTIR) spectra (Figure 8d). Among them, Si-O derives from soil particles, and PR-OS+CM-CDs has high aromatic C=C and C-H intensity, which may be the result of thermal aromatization of CM-CDs. Raman images can be used to analyze the ordered structure of coke (Figure 8e). Compared with PR-OS, PR-OS+CM-CDs had more amorphous carbon and a less graphitized carbon structure [27], which confirmed the experimental results of TPO.
3. Experimental Section
3.1. Preparation of Wood Sponge Loaded with Carbon Dots
Firstly, balsa wood (BW) was treated to remove lignin and hemiethanol, and the cellulose wood sponge was labeled CM. In detail, BW was initially lignified at 100 °C in a 2% NaClO2 aqueous solution buffered with acetic acid at pH 4.6 for 6 h. The hemicellulose portion was then removed with 8% NaOH solution at 80 °C for 8 h. After rinsing in an ethanol solution (99.5%) to remove the remaining chemicals, the sample was treated at −80 °C in a freeze-dryer. Secondly, CDs were prepared as follows. Citric acid (CA) and urea were dissolved in 10 mL deionized water with a fixed molar ratio of CA/urea, ca. 1/3. After being treated in a microwave oven at 800 W for 5 min, the dark brown cluster solids were obtained. Subsequently, deionized water (40 mL) was added to the solids and ultra-sounded for 30 min. The solution was centrifuged at 4000 rpm for 30 min to separate large particles and unreacted substances. Finally, CDs can be collected after freeze-drying of the ink.
A total of 50 mg of the prepared CD powder was further dispersed in 60 mL ethyl acetate (EA) solution and ultrasonic at room temperature for 10 min to obtain CD suspension. Appropriate CM and 30 mL CD suspension were transferred to a 50 mL Teflon-lined autoclave and heated at 150 °C for 2 h. After cooling down, the sample was freeze-dried to remove the solvent. The obtained sample was named CM-CDs (Figure S1). The sample without CDs in the hydrothermal reaction was prepared for comparison and labeled CM-HT.
3.2. OS Preparation
OS samples from the petroleum industry are generally complicated, with uncertain compositions. Therefore, we used the crude oil from Daqing oilfield and distilled water to simulate oil–water emulsion firstly by mixing 60.0 g of oil with 40.0 g of water on a homogenizer (FJ-200, Shanghai Huxi Industry Co., Ltd., Shanghai, China) at 11,000 rpm for 10 min. Subsequently, 50.0 g of saline–alkali soil from Daqing oilfield was added to the oil–water emulsion, and the simulated OS sample with a water content of 26.7% was prepared.
3.3. Adsorption of Organic Solvent Under Solar Heating Conditions
Oil adsorption capacity is the critical factor for application. A xenon light source (CEL X250, Beijing Perfectlight Technology Co., Ltd., power 250 W, spectral range 200~2500 nm, Beijing, China) was used to provide the simulated sunlight (100 mW/cm2, i.e., 1.0 sun) for the adsorption properties over CM and CM-CDs. Crude oil, hexane, and diesel oil were selected as organic solvents for adsorption. The sample was placed on the surface of organic solvents gently for 5 min. The mass difference after reaching saturation was calculated to evaluate the adsorption capacity.
3.4. Process of Solar Thermal Dehydration
A total of 10.0 g of OS samples was mixed with 1.0 g CM and CM-CDs, respectively, and placed in a Petri dish under the sunlight (1.0 sun) simulated by the xenon lamp for 3 h. The mass change of OS was recorded in real-time by an electronic balance. A thermal imaging camera (DT-9897, Shenzhen Huashengchang Technology Industrial Co., Ltd., Shenzhen, China) was used to capture the thermal images of the OS surface.
3.5. Process of Confined Catalytic Pyrolysis
After solar thermal dehydration, the mixed OS and CM-CDs were further treated using a TG (thermogravimetry) reactor and a horizontal fixed bed reactor. Before each TG operation, the OS sample without water was prepared to simulate the dehydrated OS with a fixed mass ratio of oil and soil, ca. 6/5, i.e., OS (dry). TG/DTG (derivative thermogravimetry) analysis of OS (dry), CM-CDs, and the OS (dry)/CM-CD mixture was performed, respectively. The TG furnace was heated from 50 to 500 °C with a ramp rate of 10 °C/min in an inert atmosphere. The pyrolytic products of OS (dry) and the CM-CD mixture were collected in a horizontal fixed bed reactor with a nitrogen flow rate of 100 mL/min. Before each operation, 10.0 g OS (dry) was mixed with CM-CDs at varying ratios of 10:0.3/0.6/1.0. The reactor was heated to 500 °C with a ramp rate of 10 °C/min and kept at this temperature for 60 min. The liquid product was collected after condensation of the heating flow from the reactor. The yields of liquid product and solid residue were obtained by weighing and then were used to calculate the gas yield by a mass balance. The oil recovery efficiency was calculated as follows:
where m1 is the mass of the recovered oil, mOS is the mass of OS participating in pyrolysis, and WOS is the oil content of OS.
Recovery (%) = m1/(mOS × WOS).
3.6. Characterizations
The morphologies of CM-CDs were analyzed by the scanning electron microscope (SEM) and high-resolution transmission electron microscope (HRTEM). The surface element composition of CM-CDs was analyzed by an X-ray photoelectron spectroscopy (XPS) device (Thermo Scientific, Waltham, MA, USA), which was calibrated with Au/Ag standards. Binding energies were charge-corrected to the C1s peak (284.8 eV) from surface hydrocarbon contamination. The surface functional group structure was analyzed by the Fourier transform infrared (FTIR) spectrum. The ordered structure of coke in the residue was analyzed by the Raman spectrum. Temperature-programmed oxidation (TPO) tests were performed on pyrolysis residue using chemisorption to characterize their carbon production and coke types, and oxygen consumption was recorded using a thermal conductivity cell detector (TCD). In simple terms, samples were heated from ambient temperature to 900 °C with a ramp rate of 10 °C/min at 30 mL/min with a 5% O2/Ar mixture for complete oxidation of carbon and organics. The specific measurement method is the same as that of previous measurements [11,16,28].
4. Conclusions
The CM-CD integrated system establishes a sequential dewatering–pyrolysis treatment for oily sludge: First, solar-driven evaporation achieves 69% enhanced dehydration efficiency by constructing rapid water-release channels, effectively suppressing steam explosion during subsequent pyrolysis. Second, confined pyrolysis within carbon nanoreactors promotes targeted cracking of hydrocarbons at catalytic sites while physically restricting coke agglomeration, collectively boosting oil yield by 17% to 89%. This synergistic process reduces overall energy consumption compared to conventional two-stage treatments, representing the first demonstration of photothermally enhanced dehydration coupled with spatially confined catalytic upgrading. This work establishes an integrated framework for combined solar-driven dehydration pretreatment and spatially confined catalytic pyrolysis of the remaining residue.
Supplementary Materials
The following supporting information can be downloaded at: https://www.mdpi.com/article/10.3390/catal15080764/s1, Figure S1: Schematic diagram of CM-CD preparation; Table S1: The composition of the Daqing oilfield crude oil used in the experiment.
Author Contributions
Conceptualization, C.L.; methodology, C.L.; software, C.L.; validation, C.L.; formal analysis, C.L.; investigation, C.L.; resources, F.L.; data curation, C.L., H.M. and H.Y.; writing—original draft preparation, C.L.; writing—review and editing, C.L. and F.L.; visualization, C.L.; supervision, F.L.; project administration, F.L.; funding acquisition, F.L. All authors have read and agreed to the published version of the manuscript.
Funding
This research was supported by the National Natural Science Foundation of China (52376205) and Young Scientific and Technological Talents (Level Two) in Tianjin (QN20230228).
Data Availability Statement
The original contributions presented in this study are included in the article. Further inquiries can be directed to the corresponding author.
Conflicts of Interest
The authors declare no conflicts of interest.
References
- Li, J.; Lin, F.; Li, K.; Zheng, F.; Yan, B.; Che, L.; Tian, W.; Chen, G.; Yoshikawa, K. A critical review on energy recovery and non-hazardous disposal of oily sludge from petroleum industry by pyrolysis. J. Hazard. Mater. 2021, 406, 124706. [Google Scholar] [CrossRef] [PubMed]
- Hu, G.; Li, J.; Zeng, G. Recent development in the treatment of oily sludge from petroleum industry: A review. J. Hazard. Mater. 2013, 261, 470–490. [Google Scholar] [CrossRef]
- Lin, B.; Huang, Q.; Chi, Y. Co-pyrolysis of oily sludge and rice husk for improving pyrolysis oil quality. Fuel Process Technol. 2018, 177, 275–282. [Google Scholar] [CrossRef]
- Liu, Y.; Yu, H.; Jiang, Z.; Song, Y.; Zhang, T.; Siyal, A.A.; Dai, J.; Bi, X.; Fu, J.; Ao, W. Microwave pyrolysis of oily sludge under different control modes. J. Hazard. Mater. 2021, 416, 125887. [Google Scholar] [CrossRef]
- Negrão, D.R.; Grandis, A.; Buckeridge, M.S.; Rocha, G.J.; Leal, M.R.L.; Driemeier, C. Inorganics in sugarcane bagasse and straw and their impacts for bioenergy and biorefining: A review. Renew. Sustain. Energy Rev. 2021, 148, 111268. [Google Scholar] [CrossRef]
- Udayanga, W.C.; Veksha, A.; Giannis, A.; Lisak, G.; Lim, T.-T. Effects of sewage sludge organic and inorganic constituents on the properties of pyrolysis products. Energ. Convers. Manag. 2019, 196, 1410–1419. [Google Scholar] [CrossRef]
- Kawai, H.; Kumata, F. Free radical behavior in thermal cracking reaction using petroleum heavy oil and model compounds. Catal. Today 1998, 43, 281–289. [Google Scholar] [CrossRef]
- Li, Z.; Lei, S.; Xi, J.; Ye, D.; Hu, W.; Song, L.; Hu, Y.; Cai, W.; Gui, Z. Bio-based multifunctional carbon aerogels from sugarcane residue for organic solvents adsorption and solar-thermal-driven oil removal. Chem. Eng. J. 2021, 426, 129580. [Google Scholar] [CrossRef]
- Su, Y.; Chang, Q.; Xue, C.; Yang, J.; Hu, S. Solar-irradiated carbon dots as high-density hot spots in sponge for high-efficiency cleanup of viscous crude oil spill. J. Mater. Chem. A 2022, 10, 585–592. [Google Scholar] [CrossRef]
- Kucora, I.; Paunjoric, P.; Tolmac, J.; Vulovic, M.; Speight, J.G.; Radovanovic, L. Coke formation in pyrolysis furnaces in the petrochemical industry. Pet. Sci. Technol. 2017, 35, 213–221. [Google Scholar] [CrossRef]
- Li, C.; Zhang, C.; Gholizadeh, M.; Hu, X. Different reaction behaviours of light or heavy density polyethylene during the pyrolysis with biochar as the catalyst. J. Hazard. Mater. 2020, 399, 123075. [Google Scholar] [CrossRef]
- Li, B.; Bian, Z.; Wang, Z.; Zhang, F.; Liu, Y.; Zhang, W.; Bao, M.; Li, Y. Advanced Janus Aerogels Evaporator Featuring with Multiscale Architectures and Dual-Layer Design for Efficient Oily Seawater Purification. Adv. Funct. Mater. 2025, 2504591. [Google Scholar] [CrossRef]
- Xiang, L.; Lin, F.; Cai, B.; Wang, K.; Wang, Z.; Yan, B.; Chen, G.; He, C. Evaluation of the Flexibility for Catalytic Ozonation of Dichloromethane over Urchin-Like CuMnO x in Flue Gas with Complicated Components. Environ. Sci. Technol. 2022, 56, 13379–13390. [Google Scholar] [CrossRef] [PubMed]
- Liu, X.; Chen, F.; Li, Y.; Jiang, H.; Mishra, D.D.; Yu, F.; Chen, Z.; Hu, C.; Chen, Y.; Qu, L. 3D hydrogel evaporator with vertical radiant vessels breaking the trade-off between thermal localization and salt resistance for solar desalination of high-salinity. Adv. Mater. 2022, 34, 2203137. [Google Scholar] [CrossRef] [PubMed]
- Lu, J.; Shi, Y.; Chen, Z.; Sun, X.; Yuan, H.; Guo, F.; Shi, W. Photothermal effect of carbon dots for boosted photothermal-assisted photocatalytic water/seawater splitting into hydrogen. Chem. Eng. J. 2023, 453, 139834. [Google Scholar] [CrossRef]
- Rahmawati, I.; Indriyati; Permatasari, F.A.; Irham, M.A.; Nugraha, M.I.; Anthopoulos, T.D.; Iskandar, F. Modulating photothermal properties of carbon dots through nitrogen incorporation enables efficient solar water evaporation. ACS Appl. Nano Mater. 2023, 6, 2517–2526. [Google Scholar] [CrossRef]
- Wang, X.; Cheng, J.; Yu, H.; Yu, J. A facile hydrothermal synthesis of carbon dots modified gC 3 N 4 for enhanced photocatalytic H 2-evolution performance. Dalton Trans. 2017, 46, 6417–6424. [Google Scholar] [CrossRef]
- Li, D.; Lei, S.; Lin, F.; Zhong, L.; Ma, W.; Chen, G. Study of scrap tires pyrolysis–Products distribution and mechanism. Energy 2020, 213, 119038. [Google Scholar] [CrossRef]
- Li, J.; Lin, F.; Yu, H.; Tong, X.; Cheng, Z.; Yan, B.; Song, Y.; Chen, G.; Hou, L.A.; Crittenden, J.C. Biochar-assisted catalytic pyrolysis of oily sludge to attain harmless disposal and residue utilization for soil reclamation. Environ. Sci. Technol. 2023, 57, 7063–7073. [Google Scholar] [CrossRef] [PubMed]
- TranVan, L.; Legrand, V.; Jacquemin, F. Thermal decomposition kinetics of balsa wood: Kinetics and degradation mechanisms comparison between dry and moisturized materials. Polym. Degrad. Stab. 2014, 110, 208–215. [Google Scholar] [CrossRef]
- Chen, W.; Fang, Y.; Li, K.; Chen, Z.; Xia, M.; Gong, M.; Chen, Y.; Yang, H.; Tu, X.; Chen, H. Bamboo wastes catalytic pyrolysis with N-doped biochar catalyst for phenols products. Appl. Energy 2020, 260, 114242. [Google Scholar] [CrossRef]
- Ren, S.; Lei, H.; Wang, L.; Bu, Q.; Chen, S.; Wu, J. Hydrocarbon and hydrogen-rich syngas production by biomass catalytic pyrolysis and bio-oil upgrading over biochar catalysts. RSC Adv. 2014, 4, 10731–10737. [Google Scholar] [CrossRef]
- Zhong, D.; Zeng, K.; Li, J.; Qiu, Y.; Flamant, G.; Nzihou, A.; Vladimirovich, V.S.; Yang, H.; Chen, H. Characteristics and evolution of heavy components in bio-oil from the pyrolysis of cellulose, hemicellulose and lignin. Renew. Sustain. Energy Rev. 2022, 157, 111989. [Google Scholar] [CrossRef]
- Li, J.; Zheng, F.; Li, Q.; Farooq, M.Z.; Lin, F.; Yuan, D.; Yan, B.; Song, Y.; Chen, G. Effects of inherent minerals on oily sludge pyrolysis: Kinetics, products, and secondary pollutants. Chem. Eng. J. 2022, 431, 133218. [Google Scholar] [CrossRef]
- Wang, L.; Xie, G.; Mi, X.; Zhang, B.; Du, Y.; Zhu, Q.; Yu, Z. Surface-modified TiO2@ SiO2 nanocomposites for enhanced dispersibility and optical performance to apply in the printing process as a pigment. ACS Omega 2023, 8, 20116–20124. [Google Scholar] [CrossRef]
- Zhao, B.; Liang, X.; Li, T.; Lv, X.; Zhang, S. Impact of fuel aromatic content on soot particle physicochemical properties of marine auxiliary diesel engine. Environ. Sci. Pollut. Res. 2022, 29, 84936–84945. [Google Scholar] [CrossRef]
- Zhang, K.; Sun, P.; Faye, M.C.A.; Zhang, Y. Characterization of biochar derived from rice husks and its potential in chlorobenzene degradation. Carbon 2018, 130, 730–740. [Google Scholar] [CrossRef]
- Lin, C.; Yan, C.; Zeng, X.; Shan, S.; Zhao, Y.; Duan, L. Simplification of temperature-programmed oxidation method to characterize petroleum cokes. Fuel 2023, 334, 126548. [Google Scholar] [CrossRef]
Disclaimer/Publisher’s Note: The statements, opinions and data contained in all publications are solely those of the individual author(s) and contributor(s) and not of MDPI and/or the editor(s). MDPI and/or the editor(s) disclaim responsibility for any injury to people or property resulting from any ideas, methods, instructions or products referred to in the content. |
© 2025 by the authors. Licensee MDPI, Basel, Switzerland. This article is an open access article distributed under the terms and conditions of the Creative Commons Attribution (CC BY) license (https://creativecommons.org/licenses/by/4.0/).